 Marina Barriocanal
 Elena Carnero
 Victor Segura
 Puri Fortes
- 1Department of Gene Therapy and Hepatology, Center for Applied Medical Research (CIMA), University of Navarra, Pamplona, Spain
- 2Bioinformatics Unit, Center for Applied Medical Research (CIMA), University of Navarra, Pamplona, Spain
Many long non-coding RNAs (lncRNAs) are expressed in cells but only a few have been well characterized. In these cases, lncRNAs have been shown to be key regulators of several cellular processes. Therefore, there is a great need to understand the function of more lncRNAs and their regulation in response to stimuli. Interferon (IFN) is a key molecule in the cellular antiviral response. IFN binding to its receptor activates transcription of several IFN-stimulated genes (ISGs) that function as potent antivirals. In addition, several ISGs are positive or negative regulators of the IFN pathway. This is essential to ensure a strong antiviral response and a later return of the cell to homeostasis. As the ISGs described to date are coding genes, we sought to determine whether IFN also regulates the expression of long non-coding ISGs. To this aim, we used RNA sequencing to analyze the transcriptome of control and HuH7 cells treated with IFNα2. The results show that IFN-treatment regulates the expression of several unknown non-coding transcripts. We have validated two lncRNAs upregulated after treatment with different doses of type I IFNα2 in different cells or with type III IFNλ. These lncRNAs were also induced by influenza and vesicular stomatitis virus mutants unable to block the IFN response, but not by several wild-type lytic viruses tested. These lncRNA genes were named lncISG15 and lncBST2 as they are located close to ISGs ISG15 and BST2, respectively. Interestingly, inhibition experiments showed that lncBST2 is a positive regulator of BST2. Therefore lncBST2 has been renamed BISPR, from BST2 IFN-stimulated positive regulator. Our results may have therapeutic implications as lncBST2/BISPR, but also lncISG15 and their coding neighbors, are increased in cells infected with hepatitis C virus and in the liver of infected patients. These results allow us to hypothesize that several lncRNAs could be activated by IFN to control the potency of the antiviral IFN response.
Introduction
The interferon (IFN)-mediated innate immune response provides a potent defense against pathogens (1). Upon invasion, pathogen-associated molecular patterns (PAMPs) are detected by specific receptors in the cells. These can be located on the surface of the cell, as in the case of Toll-like receptors (TLRs), or intracellularly, as in the case of the retinoic acid-inducible gene I (RIG-I). PAMP recognition triggers a series of signaling cascades that lead to the production and secretion of Type I IFN. Type I IFN (IFNα, IFNβ, and others) binds to IFN receptors present on the surface of all cell types and activates Janus-activated kinase/signal transducer and activator of transcription (JAK/STAT) signaling. This gives rise to the nuclear translocation of the STAT1/STAT2/IRF9 (IFN regulatory factor 9) complex that binds IFN-stimulated response elements (ISRE) in the promoters of IFN-stimulated genes (ISGs) and activates their transcription. A similar response is induced by Type III IFN (IFNλ) upon binding to its receptor (2, 3). In contrast, Type II IFN or IFNγ, produced by cells of the immune system, binds to the widely expressed IFNγ receptor (4, 5) leading to nuclear translocation of STAT1 homodimers, which bind to gamma-activated sequences (GAS) in the promoter of immunoregulatory genes.
IFN-stimulated genes are antiviral factors, positive regulators of the IFN pathway (STAT1 and 2 and IRF1) or negative regulators that help IFN-induced cells to return to cellular homeostasis (SOCS and UPS18) (6–11). Among antiviral genes, there are factors that function to increase cell sensitivity to PAMPs (OAS and PKR) or true antiviral effectors that block viral entry (Mx, IFITM, and TRIM), virus replication, translation and stability (IFIT, OAS, PKR, and ISG15), or viral release (viperin and tetherin/BST2) (8). While most IFN-induced factors known to date are proteins, IFN also activates the expression of several microRNAs that contribute to the antiviral state or to the control of IFN response (12). Few studies have been performed to address whether IFN could also regulate expression of long non-coding RNAs (lncRNAs) (13–15). In recent years, viral infection has been reported to be able to induce the expression of cellular lncRNAs. This has been shown for infection with enterovirus, influenza, HIV, hepatitis B and C viruses, and the SARS coronavirus (13, 16–23) (Carnero et al., in preparation). The lncRNA signature found after infection should be a mixture of transcripts induced by the virus and transcripts that respond to the cellular antiviral pathways activated by the infection. In fact, activation of TLRs by PAMPs induces the expression of several lncRNAs. TLR2 signaling leads to the activation of lncRNA-COX2, which regulates the expression of genes related to the immune system (24). Activation of TLR3 results in increased NEAT1, which increases the expression of genes such as IL8 (19). TLR4 controls IL1b-eRNA and IL1b-RBT46 lncRNAs whose downregulation diminishes IL1b and accumulation of LPS-induced RNAs (25). Likewise, the LPS-induced inflammatory response is controlled by lnc-IL7R (26). Innate activation also induces linc1992/THRIL, which controls TNFα and other genes involved in the immune response (27). In turn, TNFα induces Lethe, a pseudogene that responds to NFκB and reduces inflammation by inhibiting NFκB DNA binding activity (28). LncRNA responses are also critical for the functionality of dendritic cells, CD4+ and CD8+ T-cells (29–32). Thus, NEST lncRNA controls IFNγ locus in CD8+ T-cells leading to decreased Salmonella enterica pathogenesis (33, 34).
These studies illustrate the interest in identifying novel lncRNAs and elucidating their function and regulation. LncRNAs are thought to be at least as numerous as protein-coding genes, but only a few are well characterized (35–38). LncRNAs are transcripts similar to mRNAs but with poor coding potential. They are more cell type-specific, less expressed, and less well conserved than mRNAs (29, 39). Interestingly, lncRNAs are cell regulators that can function in cis, co-transcriptionally, or in trans. Some control the expression of coding genes located in the same genomic region. Therefore, the genomic location of lncRNAs can provide hints as to their functionality. They can be sense or antisense (when overlapping with one or more exons of another transcript in the same or in the opposite strand, respectively); intronic (when derived from an intron of another transcript); divergent or bidirectional (when they share a promoter with another transcript in the opposite strand and therefore are co-regulated); or intergenic (when they are independent, located in between two other genes). Several mechanisms are involved in the regulation of neighboring or antisense genes by lncRNAs. These include transcriptional activation or interference, recruitment of chromatin modifiers and remodelers, regulation of imprinting, editing, splicing or translation, and stability (40–44).
To address the issue of whether IFN could also regulate expression of lncRNAs, which may play key roles in the antiviral response, we analyzed the transcriptome of cells treated or not with IFNα2 by RNA sequencing (RNASeq). In this analysis, we identified two lncRNAs upregulated in response to IFN in different cell lines. Interestingly, these lncRNAs are expressed from positions in the genome divergent from the well-characterized ISGs ISG15 and BST2. Therefore, we have called them lncISG15 and lncBST2. These lncRNAs and their coding counterparts are also induced in cells infected with mutants of influenza or vesicular stomatitis viruses (VSV) that fail to block the IFN response. Surprisingly, they are also induced in culture cells infected with hepatitis C virus (HCV) and in the liver of patients with HCV infections. Finally, according to HUGO regulation, we have renamed lncBST2 BISPR, from BST2 IFN-stimulated positive regulator, as we show that inhibition of lncBST2 expression by RNAi leads to decreased levels of BST2 mRNA, providing a new layer of regulation of the IFN response.
Materials and Methods
Cells and Patient Samples
The HuH7 cell line, derived from a human hepatocarcinoma, was provided by Dr. Chisari’s lab (Scripps Research Institute, La Jolla, CA, USA). A549 cells, from human non-small cell lung carcinoma, were kindly provided by Estanislao Nistal (CIMA, University of Navarra, Spain). Human liver samples with or without HCV infection were obtained from the Biobank of the University of Navarra under approval from the Ethics and Scientific Committees. Liver tissue sections were snap frozen and stored at −80°C. The clinical data from HCV-infected subjects are shown in Table S1 in Supplementary Material.
Cell Culture
Cells were grown in Dulbecco’s Modified Eagle Medium (DMEM) supplemented with 10% fetal bovine serum (FBS) and 1% penicillin–streptavidin and maintained at 37°C in a 5% CO2 atmosphere. Twenty-four hours before treatment with IFN, HuH7 and A549 cells were seeded in six-well plates. Then, 0, 5, 50, 250, 1000, or 10000 units/ml of IFNα2 (Sicor Biotech, Lithuania) were used in a final volume of 2 ml. HuH7 cells were also treated with 250 ng/ml of IL28B/IFN-λ3 (R&D Systems) in a final volume of 2 ml. For treatment with ruxolitinib (Selleckchem), cells were seeded out 24 h before and treated with 0.8 μM ruxolitinib in a final volume of 2 ml. One hour after treatment media were discarded and replaced by media containing 100 units/ml IFNα. Cells were harvested for RNA extraction at the indicated times post-treatment.
Cell Transfections
siRNAs targeting lncBST2/BISPR were designed using iScore Designer and RNA Scales (45, 46) and purchased from Dharmacon. The lncBST2/BISPR siRNAs targeted the sequence GACUAGUGUGAGCAACAAA. For cell transfection with siRNAs, lipofectamine 2000 reagent (Invitrogen) was used according to manufacturer’s instructions. Cells were seeded 24 h before transfection. For each well of a six-well plate, 80 pmoles siRNA were used. The siRNA was mixed with 50 μl OPTIMEM. Furthermore, 6 μl lipofectamine were mixed with 250 μl OPTIMEM media and incubated for 5 min. Then, lipofectamine and siRNA solutions were mixed and incubated for 20–60 min at room temperature. After incubation, half of the volume of the cell media was discarded and 300, 150, or 75 μl of the lipofectamine mixture were added to each well of 6, 12, or 24-well plates, respectively. Six hours post-transfection the media from the cells was discarded and substituted with DMEM media enriched with 10% FBS and antibiotics.
Virus Infections
Hepatitis C virus JFH-1 was obtained from an initial viral stock from the genotype 2a JFH-1 plasmid (pJFH-1) previously described by Wakita et al. (47). The virus was amplified as described (15). Influenza virus strain A/PR8/34 WT (PR8), a mutant lacking NS1 (ΔNS1), VSV-GFP, and the mutant M51R were kindly provided by Estanislao Nistal (CIMA, University of Navarra, Spain) (48–50), Semliki Forest Virus (SFV) was a gift from Cristian Smerdou (CIMA, University of Navarra, Spain), and Adenovirus serotype 5 (Ad5) was amplified as previously described (48). VSV-eGFP titration was performed in quadruplicates on A549 cells. The supernatant from infected cells was collected and 1:10 serial dilutions were performed. Cells were seeded 24 h before infection in 96-well plates and infected with 50 μl of each dilution. Twenty-four hours after infection, GFP expression was visualized by microscopy and used to determine the titer. Cells were infected with HCV at a multiplicity of infection (moi) of 0.3, with VSV at a moi of 5 and with a moi of 10 of Influenza A, ΔNS1, Ad5, and SFV. In the case of the lytic viruses, we used a moi of 5 or 10 as this causes cytopathic effects at 24 h (for VSV, influenza and SFV) or 48 h (for Ad) in HuH7 or A549 cells. After infection, the virus was removed and fresh medium was added to the cells. Cells were harvested for RNA extraction at the indicated times post-infection.
Cellular Fractionation
Two million HuH7 cells were incubated in 100 μl of cytoplasmic buffer (50 mM Tris HCl pH7.4, 1 mM EDTA, and 1% NP40) for 5 min at 4°C. Then, cells were centrifuged for 5 min at 3000 g and the supernatant was used to isolate cytoplasmic RNA. The pellet was washed with cytoplasmic buffer and centrifuged as before. The supernatant was discarded and the pellet was used to isolate the nuclear RNA. RNA from nuclear and cytoplasmic fractions was isolated with MaxWell 16 research system (Promega).
RNA Extraction and Quantitative RT-PCR
Human tissue was homogenized using the ULTRA-TURRAX dispersing machine (t25 basic IKA-WERKE) (51). Total RNA from the tissue was extracted in 1 ml TRIZOL (Sigma-Aldrich) and recommendations of the supplier were followed (52). DNase (Fermentas) treatment was performed to eliminate DNA from the samples before RT-PCR reactions. RNA was extracted from cells with the MaxWell 16 research system from Promega following the manufacturer’s recommendations. RNA concentration was measured using NanoDrop 1000 Spectrophotometer. The quality of the RNA was analyzed by Bioanalyzer (Agilent Technologies). Reverse Transcription (RT) was performed as described (53). The reaction was performed in the C1000 Touch Thermal Cycler from Bio-Rad. The samples were incubated at 37°C for 60 min, then at 95°C for 60 s and then immediately cooled to 4°C. qPCR was performed in the CFX96 Real-Time system from Bio-Rad as described (54). The results were analyzed with Bio-Rad CFX-manager software. GAPDH levels were evaluated in all the cases as a reference. Only the samples with similar GAPDH amplification were analyzed further. The primers used are listed in Table S2 in Supplementary Material and were designed with the Primer3 program1.
High Throughput Sequencing
RNA of excellent quality, as determined by Bioanalyzer (Agilent Technologies) was treated with the Ribo-Zero rRNA removal kit (Epicenter) to deplete from ribosomal RNA. Library preparation with TruSeq RNA sample preparation kit (Illumina) and sequencing was performed at the EMBL genomics core facility (Genecore) in an Illumina HiSeq 2000. Sequences were paired-end, 150 bases long, and strand specific. RNASeq data are available at the NCBI Gene Expression Omnibus (GEO) data repository2.
Bioinformatic Analysis
RNA sequencing data analysis was performed using the following workflow: (1) the quality of the samples was verified using FastQC software; (2) the preprocessing of reads was performed by elimination of contaminant adapter substrings with Scythe and by quality-based trimming using Sickle; (3) the alignment of reads to the human genome (hg19) was performed using the Tophat2 mapper (55); (4) transcript assembly and quantification using FPKM of genes and transcripts was carried out with Cufflinks 2 (56); (5) the annotation of the gene locus obtained was performed using Cuffmerge with Gencode v16 as reference; and (6) differential expression analysis was performed using Cuffdiff 2 (56). Genes were selected as differentially expressed using a p-value threshold of 0.01. Further analysis and graphical representations were performed using an R/Bioconductor (57). Reads from all the differentially expressed sequences were visualized in the Integrative Genomics Viewer (IGV)3 (58, 59) and the sequences were compared to the ENSEMBL and ENCODE databases and searched for in the Genome Browser from UCSC4 for more information (60, 61). Candidates were divided into coding, non-coding (according to UCSC classification), or non-assigned, when the transcription of the sequence had not been annotated in the databases. Functional enrichment analysis of Gene Ontology (GO) categories was carried out using a standard hypergeometric test (62). Biological knowledge extraction was complemented through the use of Ingenuity Pathway Analysis (Ingenuity Systems)5, with a database that includes manually curated and fully traceable data derived from literature sources.
Open reading frame Finder (NCBI) was used to evaluate the length of all probable open reading frames (ORFs) in lncISG15 and lncBST2/BISPR. Coding potential was assayed with the coding potential assessment tool (CPAT) (63, 64) and by searching the LNCipedia database (65) for the presence of our candidates in the Pride archive (66) or in lists of transcripts associated with ribosomes (67, 68). Phylogenetic Codon Substitution Frequencies (PhyloCSF) were also used to predict the coding potential of lncISG15 and lncBST2/BISPR (69).
Statistical Analysis
Statistical analysis of the RNASeq data has been already described. Remaining analysis was performed using graph-path. Statistical significance of infected versus non-infected samples was calculated using a two-tailed non-parametric Mann–Whitney t-test or with a two-tailed Students t-test when the samples followed a normal distribution according to the Shapiro–Wilk test. Welch’s correction was applied for samples with heterogeneous variance. For correlation studies, a two-tailed non-parametric Spearman analysis was used. P values lower than 0.05 were deemed as significant.
Results
Identification of IFNα-Regulated LncRNAs by RNASeq
To identify lncRNAs that respond to IFN, we treated HuH7 cells with 10000 units/ml of IFNα2 for 3 days. These conditions serve to induce the expression of well-known ISGs such as GBP1, IRF1, BST2, OAS, or ISG15 (15). In addition, this treatment induces an antiviral effect, as HCV-infected HuH7 cells treated with 10000 units/ml of IFNα2, show decreased levels of viral proteins and viral genomes compared to untreated infected cells (data not shown). Finally, the RNA isolated from HuH7 cells treated with 10000 units/ml of IFNα2 for 3 days was used to hybridize an Agilent array. Analysis of the array showed that well-characterized ISGs such as Mx1, STAT1, IRF9, ISG15, BST2, and several members of the GBP, OAS, and IFI families were upregulated with a very high statistical significance (B > 7) (15). Ingenuity analysis of the data showed that IFN signaling was the pathway with the highest enrichment followed by other antiviral responses.
The microarrays were used to identify lncRNAs regulated by IFNα (15). However, an array will only evaluate the expression levels of the transcripts that hybridize to probes spotted in the array. In the case of the lncRNAs, the array used only addresses the expression of 7419 regions described as long intergenic non-coding RNAs (lincRNAs). However, it has been estimated that there could be as many lncRNA genes as coding genes, and some authors consider that the number of lncRNAs could be as high as ~200000 (37, 38). Therefore, to achieve a more complete identification of lncRNAs that respond to IFN, we analyzed the transcriptome by RNASeq. RNA isolated from control cells or HuH7 cells treated with IFN as described, was sequenced after ribodepletion. Around 130 million reads were obtained per sample. Analysis was performed using a bioinformatic workflow that includes Tophat2 and Cufflinks 2 as described in the methods section. The analysis showed that, among the genes upregulated in response to IFN, there were several ISGs such as Mx1, ISG15, BST2, or members of the IFI and OAS families (Figure 1A and Table S3 in Supplementary Material). Ingenuity analysis showed that IFN signaling is a top canonical pathway (p = 3.3 × 10⁻³), the top upstream regulator is IFNα2 (p = 1.9 × 10⁻⁸), and cell signaling and infectious and inflammatory diseases are among the main functions. The expression of ~1000 coding genes was altered by IFN (Table S3 in Supplementary Material).
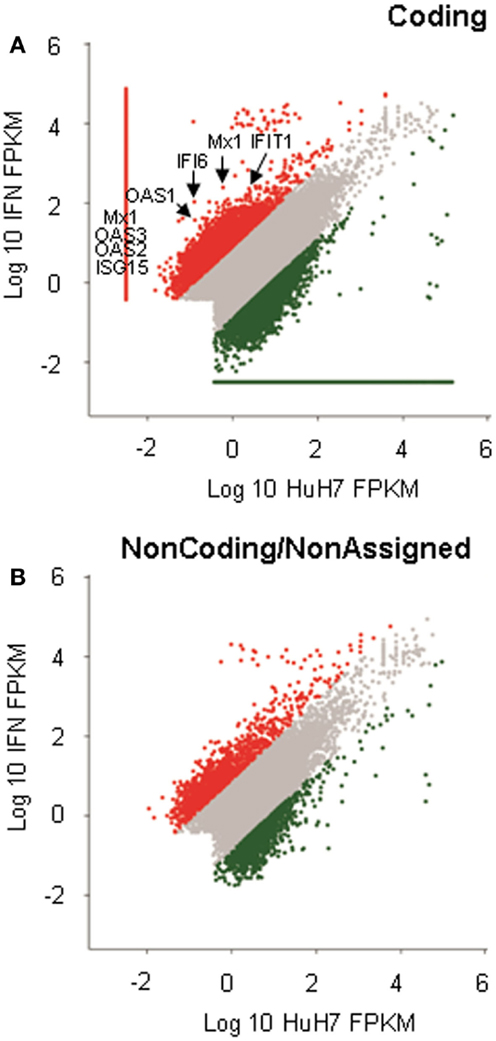
Figure 1. RNASeq analysis of IFN-induced genes. RNA isolated from HuH7 cells treated for 72 h with 0 or 10000 units/ml of IFNα2, was sequenced in an Illumina platform. More than 130 million reads per sample were obtained. Analysis of the sequences resulted in more than 200000 cufflink structures that were divided into coding (A) or non-coding/non-assigned (B) and positioned in dispersion graphs according to expression levels. Red dots show cufflink structures significantly upregulated in IFN-treated samples. Green dots are downregulated structures. The position of well-known ISGs is indicated (A).
The RNASeq analysis also showed that the expression levels of many regions that do not correspond to coding genes were also significantly modified in response to IFN (Figure 1B). Out of the 890 putative non-coding genes whose expression was significantly altered, half were upregulated (Table S3 in Supplementary Material). All candidates where visualized using IGV (Figure S1 in Supplementary Material) (58, 59). We also paid special attention to altered sequences located close to well-known ISGs and to genomic regions that were highly expressed and deregulated in response to IFN. Eight candidates that fulfill at least one of these two criteria were chosen for further validation (Table 1 and Figure S1 in Supplementary Material).
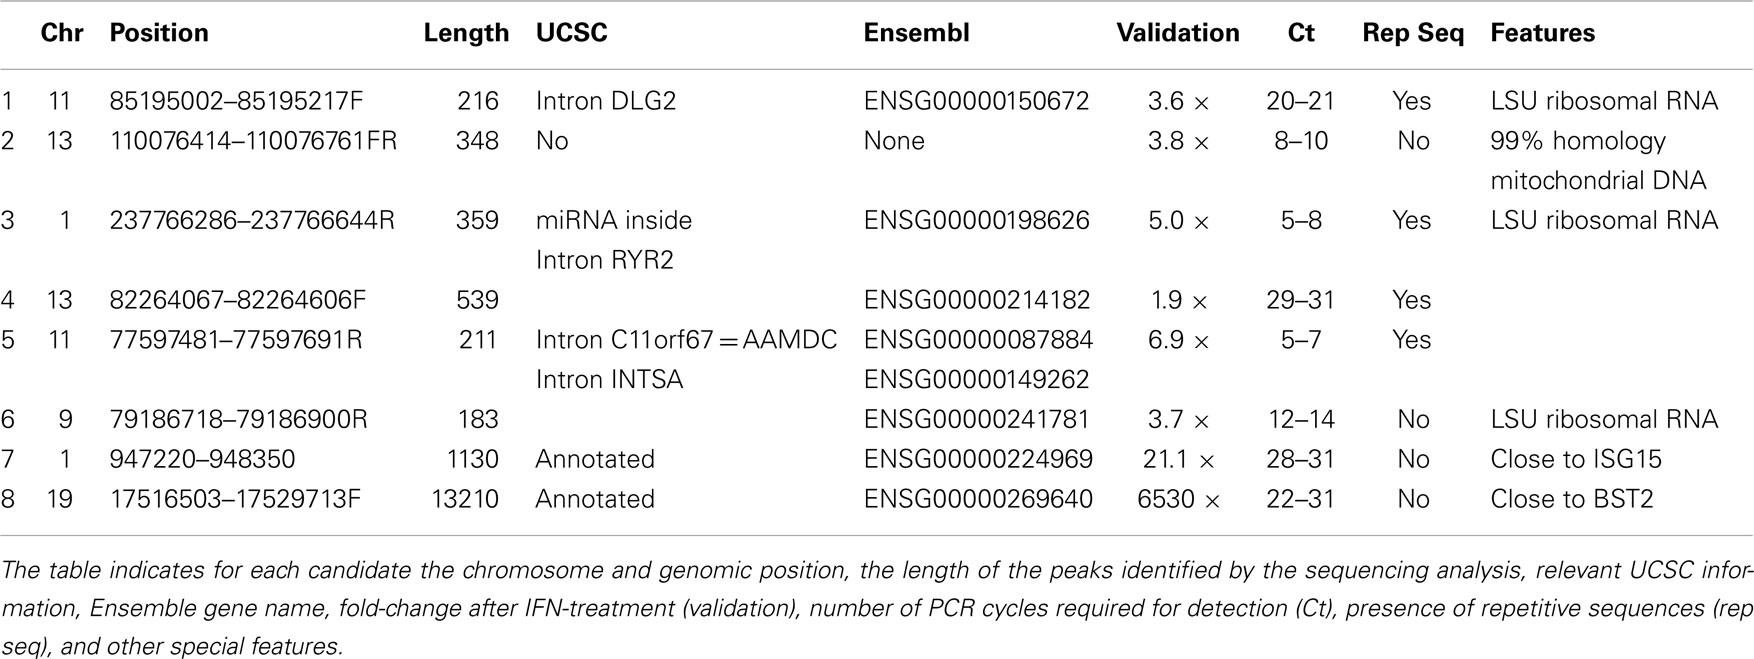
Table 1. Characteristics of the lncRNA candidates.
IFN Induces the Expression of Several LncRNAs
To validate the eight candidates chosen, we treated HuH7 cells with different doses of IFNα2. RNA was isolated from the cells at 6, 24, 48, or 72 h post-treatment and the expression levels of the candidates were evaluated by quantitative RT-PCR (qRT-PCR) (Table 1; Figure 2). All the candidates were induced after IFN-treatment from 2 to more than 1000-fold. However, many of the candidates were detected at very low cycles in the PCR amplification. A closer examination of their sequences indicated that they contained repetitive sequences or sequences similar to mitochondrial or ribosomal RNAs that could have led to an erroneous alignment of the RNASeq reads to the human genome. We believe that, even when the oligonucleotides used for amplification were specific, a partial homology to other sequences could allow cross-amplification and thus increased possibilities of misleading results. These candidates were not studied further.
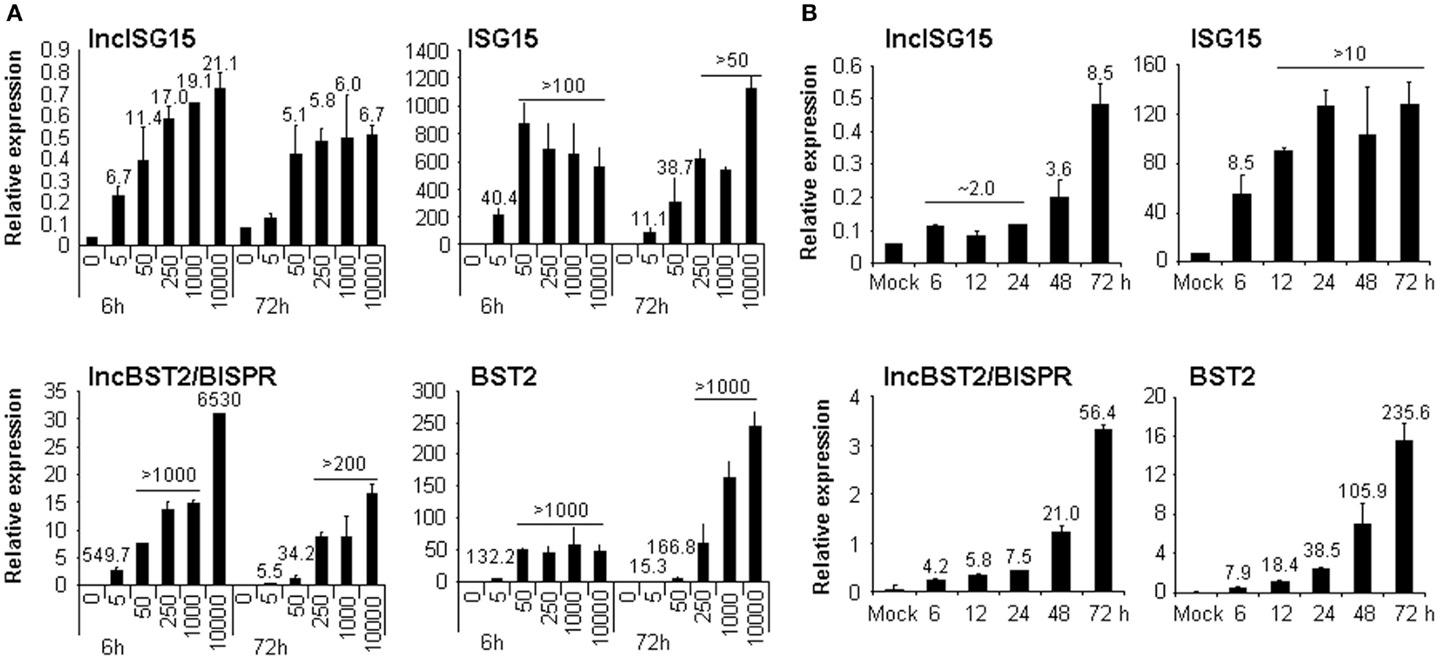
Figure 2. lncISG15 and lncBST2/BISPR are induced by IFN. HuH7 cells were treated with 0, 5, 50, 250, 1000, or 10000 units/ml IFNα2 (A) or with 250 ng/ml IFNλ for the indicated times (B). Then RNA was isolated from each condition and used to evaluate the expression of lncISG15, lncBST2/BISPR, ISG15, BST2, and GAPDH mRNAs by qRT-PCR. GAPDH was used as a reference. The experiments were performed three times and each value shows the average of three replicas from a representative experiment. Error bars indicate standard deviations. When significant, the fold-change of treated versus non-treated cells is indicated at the top of each bar.
We focused on two lncRNAs with no repetitive sequences whose expression was highly upregulated in response to IFN (Table 1; Figure 2). Interestingly, database analysis showed that they are expressed from positions in the genome located close to ISG15 and BST2, both of which are well-characterized ISGs. This may have functional relevance as some lncRNAs have been described to regulate the expression of neighboring genes. Therefore, we originally named these lncRNAs after their neighbor, lncISG15 and lncBST2. Later, lncBST2 was renamed BISPR to follow HUGO regulations. When we evaluated the expression of these lncRNAs and their neighboring transcripts, we observed that both were strongly upregulated at early times in response to IFN (Figure 2A). Furthermore, they responded to IFNα2 doses as low as 5 units/ml. These are similar levels to those found in the sera of some HCV patients (70). The induction was also observed at late times post-IFN-treatment. To evaluate further the robustness of the effect of IFN on these lncRNAs, we tested whether they also respond to IFNλ, a type III IFN. HuH7 cells treated with IFNλ for 6, 12, 24, 48, or 72 h also showed increased levels of lncISG15, lncBST2/BISPR, and their neighbors (Figure 2B). In this case, all the transcripts showed a higher upregulation at later times post-IFNλ treatment.
Viral Infections Induce the Expression of LncISG15 and LncBST2/BISPR
Viruses activate the IFN response by several mechanisms. Therefore, they have evolved to block IFN production and the activation of the IFN pathway. The molecular mechanisms involved in this IFN blockade have been characterized for many viruses. Thus, for instance, NS1 protein from influenza virus and matrix protein from VSV are key factors in controlling IFN in infected cells (48–50, 71). We sought to check whether lncISG15 and lncBST2/BISPR were induced by the physiological IFN induced by an influenza virus that lacks NS1. Therefore, we evaluated the expression of these lncRNAs in cells infected with an influenza wild-type virus or a NS1 mutant. We also included cells infected with other RNA viruses such as SFV and HCV or DNA viruses such as adenovirus. All these viruses have developed mechanisms to block the cellular antiviral response and, with the exception of HCV, lead to a lytic infection. Different times post-infection were evaluated. The last point was collected when the cytopathic effect was apparent. This occurred at 24 h post-infection in the case of influenza and SFV or 48 h post-infection, in the case of adenovirus. HCV-infected cells were collected at 48 and 72 h post-infection. The results showed that at later times post-infection with the influenza virus lacking NS1, there was increased expression of lncISG15, lncBST2/BISPR, and their neighboring coding transcripts (Figure 3A). This increase was not observed in cells infected with wild-type influenza virus, or with other wild-type lytic viruses, suggesting that the induction may be mediated by IFN.
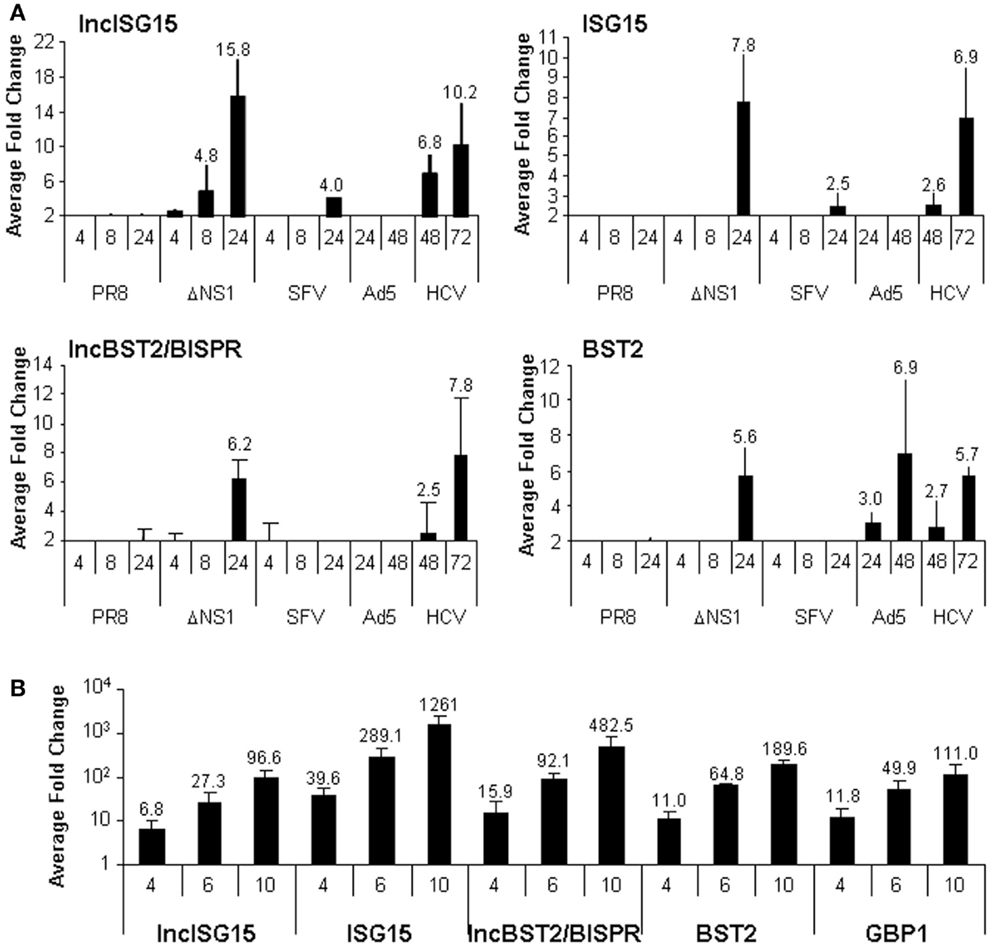
Figure 3. LncISG15 and lncBST2/BISPR respond to viral infections in cultured cells. (A) HuH7 cells were mock-treated or infected with wild-type influenza virus (PR8) or a mutant that lacks NS1 (ΔNS1), SFV, Ad5, or HCV for the indicated times. (B) A549 cells were mock-infected or infected with VSVM51R for 4, 6, or 10 h. Then, RNA was isolated and the expression levels of lncISG15, lncBST2/BISPR, ISG15, BST2 (A and B), GBP1 (B), and GAPDH mRNAs were evaluated by qRT-PCR. GAPDH expression was used as a reference. The experiment was performed three times. Each value shows the average of three replicas from a representative experiment. Fold-changes of infected versus non-infected cells higher than two are indicated. Error bars indicate standard deviations.
Most lncRNAs are tissue-specific. To determine whether lncISG15 and lncBST2/BISPR respond to infection only in HuH7 cells or whether this effect is specific for influenza viruses, we infected alveolar epithelial A549 cells with VSV-GFP wild-type virus or with a M51R matrix mutant that fails to control IFN. We chose A549, because lung cells serve as the primary site for productive infection of VSV and many respiratory viruses (72). Infection with the wild-type virus did not increase the expression of lncBST2/BISPR or BST2 (data not shown). However, A549 cells infected with the VSV mutant M51R for 4, 6, or 10 h did show increased levels of lncISG15, lncBST2/BISPR, ISG15, BST2, and other ISGs such as GBP1 (Figure 3B).
Surprisingly, infection with HCV also increased the expression of lncISG15, lncBST2/BISPR, and other ISGs, including ISG15, BST2, and IRF1 (Figure 3A and data not shown). To determine whether these genes were also upregulated in infected patients, we used liver samples from HCV-negative and HCV-positive donors. After quantification of the RNA levels, we observed a significant increase in lncISG15, lncBST2/BISPR, ISG15, and BST2 in HCV-infected patients compared to controls (Figure 4A). With the number of patients evaluated, a significant correlation was not found between expression levels and infection with a particular genotype of HCV, presence of HCV-induced hepatocellular carcinoma (HCC), liver cirrhosis, or with a particular cirrhosis stage. Therefore, there were no significantly different levels of these transcripts in HCV-infected livers without HCC compared with the peritumoral tissue of HCV-infected livers with HCC. Although most of the samples belong to patients that are still alive, no significant correlation was observed between the levels of the evaluated transcripts and survival post-diagnosis. Finally, we performed correlation studies to analyze whether in the patients, the expression level of lncISG15 or lncBST2/BISPR correlates significantly with the expression level of their neighboring coding genes. The results show a highly significant positive correlation between lncISG15 and ISG15 or lncBST2/BISPR and BST2 (Figure 4B).
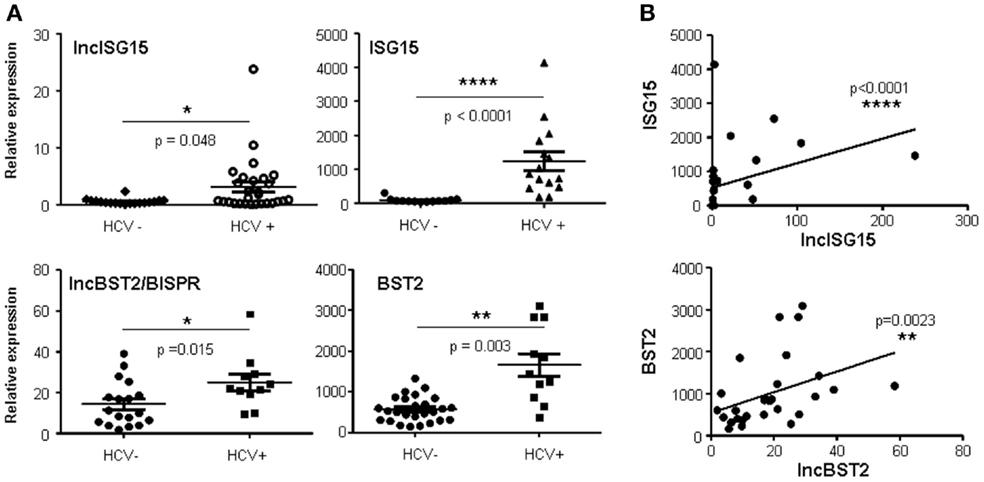
Figure 4. LncISG15 and lncBST2/BISPR are increased in the liver of HCV-infected patients. (A) Liver samples from HCV-negative and HCV-positive donors were used to quantify the levels of lncISG15, lncBST2/BISPR, ISG15, BST2, and GAPDH mRNAs. Statistical significance was calculated using a two-tailed non-parametric Mann–Whitney t-test for lncBST2/BISPR, ISG15, and lncISG15 and with a two-tailed Students t-test with Welch’s correction for BST2, which follows a normal distribution according to the Shapiro–Wilk test. (B) Expression levels observed for lncISG15, lncBST2/BISPR in patient samples were compared to the expression levels of their coding neighbors ISG15 and BST2, respectively. A correlation analysis was performed and statistical significance was calculated using a two-tailed non-parametric Spearman analysis.
Analysis of LncISG15 and LncBST2/BISPR Promoters
The experiments performed so far suggest that a general correlation could exist between the expression of lncISG15 and ISG15 or lncBST2/BISPR and BST2. Each lncRNA and its neighboring coding gene have similar induction patterns in response to IFN or to viral infection (compare their levels in Figures 2 and 3). Furthermore, the levels of each coding/non-coding pair correlate significantly in patient samples (Figure 4B). To analyze this in more detail, we performed correlation studies of the coding/non-coding pairs in all the samples evaluated in Figures 2 and 3. The results show that the correlation of each pair was highly significant (Figure S2 in Supplementary Material). This suggests that they could be co-regulated, and therefore, they could share similar functions. However, expression of lncISG15 and lncBST2/BISPR also correlated significantly with the expression of other ISGs such as OAS, GBP1, or IRF1 (data not shown).
To obtain more information on the relationship between the coding/non-coding pairs, we searched several databases. LncISG15 and lncBST2/BISPR genes are in head-to-head orientation with their coding neighbors (Figure S3 in Supplementary Material) and they could share the same promoter. This is based on the following facts: (i) the distance between the two genes is <1000 bp, a cut-off for bidirectional promoters (73, 74); (ii) there is a single DNase hypersensitivity region located between the genes, and (iii) Polymerase II (Pol II) ChipSeq analysis of K562 cells shows a single peak covering the H3K27Ac region between both genes. Interestingly, the peaks observed for Pol II ChipSeq are increased at 30 min or 6 h post-treatment with IFNα or IFNγ. Finally, the promoter regions contain conserved ISRE sites and binding sequences for IRF1, IRF2, and IRF7.
To discriminate whether lncISG15 and lncBST2/BISPR are induced directly by the JAK/STAT signaling pathway or by a secondary wave of the IFN response, we evaluated the expression of these lncRNAs and their coding neighboring genes in HuH7 or A549 cells incubated or not with the JAK/STAT inhibitor ruxolitinib. Expression of GBP1, a bona fide ISG, was also evaluated as a positive control (Figure 5). The results show that the levels of GBP1, BST2, and lncBST2/BISPR are significantly reduced in the presence of ruxolitinib, indicating that their expression is STAT-dependent. Levels of BST2 and lncBST2/BISPR were also reduced in cells treated with siRNAs targeting STAT1 or by inhibition of IRF1, a transcription factor that acts downstream of IFN (data not shown). This indicates that BST2 and lncBST2/BISPR respond to STATs but also to other transcription factors induced by IFN. These results agree with the possibility that BST2 and lncBST2/BISPR share a bidirectional promoter.
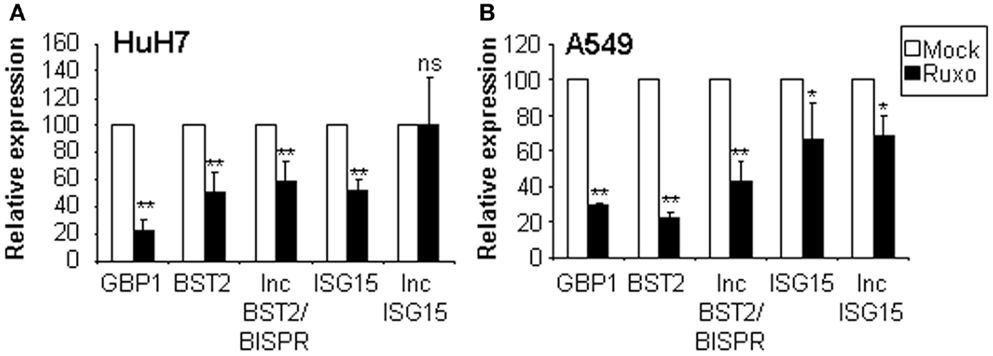
Figure 5. Analysis of the expression of lncISG15, lncBST2/BISPR, and their coding neighboring genes after inhibition of the JAK/STAT pathway. HuH7 (A) or A549 (B) cells were mock-treated or incubated with ruxolitinib for 1 h. Then IFNα was added for 8 h and RNA was isolated to quantify the expression levels of GBP1, BST2, lncBST2/BISPR, ISG15, lncISG15, and GAPDH, used as a reference. The experiment was performed twice in triplicates and the average value is indicated. Error bars indicate standard deviations. A star denotes statistical significance.
In contrast, the effect of the JAK/STAT pathway on ISG15 and lncISG15 expression was less robust. Treatment with ruxolitinib decreased the expression of ISG15 and lncISG15, but in the latter, this effect was only observed in A549 cells. No effect on ISG15 or lncISG15 expression was observed with a milder inhibition of STAT1 or inhibition of IRF1 using RNA interference (data not shown). Thus, although ISG15 is induced very rapidly after IFN-treatment, we do not observe a strong regulation of ISG15 or lncISG15 by the STAT pathway under the conditions used. In fact, it has been reported that a major regulator of ISG15 is IRF3, a transcription factor activated in response to PAMPs, but also a downstream effector of the IFN response (75).
Analysis of the Coding Potential of LncISG15 and LncBST2/BISPR
We evaluated the coding capacity of lncISG15 and lncBST2/BISPR bioinformatically. ORF Finder (NCBI) was used to determine all possible ORFs in these lncRNAs (Figure S4 in Supplementary Material). The analysis shows that all putative ORFs are shorter than 50 amino acids. Only two ORFs could be translated according to their poor susceptibility to nonsense mediated decay. However, these ORFs have non-consensus Kozak sequences at the initiation codon and therefore a poor coding capacity. Then, we evaluated the coding potential of lncISG15 and lncBST2/BISPR with the CPAT (63, 64) (Figure 6A). CPAT uses a model built with ORF size and coverage together with codon (Ficket score) and hexamer (hexamer score) usage bias. According to this program, lncISG15 and lncBST2/BISPR are non-coding as they have a coding probability of 0.001 and 0.064, respectively, much lower than 0.364, used as a threshold with the highest sensitivity and specificity to differentiate between coding and non-coding transcripts in humans (64). LncISG15 and lncBST2/BISPR were also described as non-coding in LNCipedia (65). This lncRNA database shows that these lncRNAs are not found in the Pride archive, a database for proteomic data, or in lists of transcripts associated with ribosomes in ribosome profiling experiments (66–68). Further, lncISG15 and lncBST2/BISPR were also described as non-coding by the analysis of PhyloCSF, which uses multiple alignments to calculate the phylogenetic conservation score and determines whether a multi-species nucleotide sequence alignment is likely to represent a protein-coding region (69).
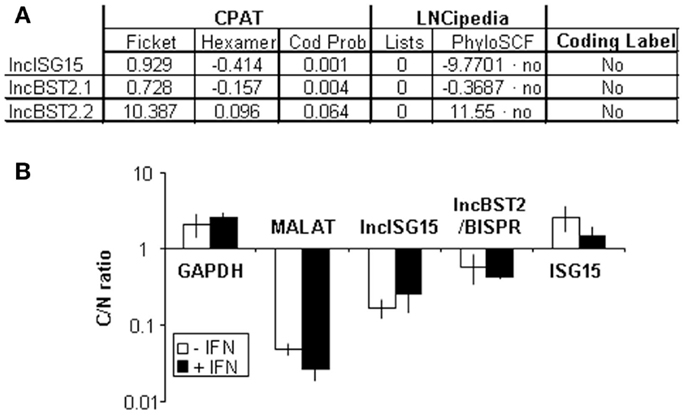
Figure 6. lncISG15, lncBST2/BISPR have poor coding potential and accumulate preferentially in the nucleus. (A) Bioinformatic analysis of the coding potential of lncISG15 and lncBST2/BISPR. Results obtained from CPAT and LNCipedia. Two transcripts have been evaluated for lncBST2/BISPR. lncISG15 and lncBST2/BISPR have a coding probability and a coding label of “non-coding RNAs” according to these analyses. “Lists” indicated the number of times that these transcripts have been found in the pride archive or in lists containing ribosome-associated RNAs published by Lee or Bazzini. See the text for other details. (B) Subcellular localization of lncISG15 and lncBST2/BISPR. HuH7 cells were mock-treated or treated with 10000 units/ml of IFNα2 and divided into nuclear and cytoplasmic fractions. RNA was isolated from each fraction and used to evaluate the expression levels of lncISG15 and lncBST2/BISPR by qRT-PCR. MALAT1, GAPDH, and ISG15 mRNA was also quantified and used as a reference to calculate the relative levels of each transcript and as a control to evaluate the subcellular fractionation. The ratio of cytoplasmic to nuclear levels is shown. The experiment was performed three times and each value shows the average of three replicas from a representative experiment. Error bars indicate standard deviations.
Finally, we evaluated the subcellular localization of lncISG15 and lncBST2/BISPR in HuH7 cells mock-treated or treated with 10000 units/ml of IFNα. RNA was isolated from nuclear or cytoplasmic fractions and quantified by qRT-PCR. We found that the coding GAPDH or ISG15 mRNAs accumulate preferentially in the cytoplasm while the nuclear RNAs MALAT1 or U6 are preferentially nuclear (Figure 6B data not shown). Similarly, lncISG15 and lncBST2/BISPR, compared to mRNAs, accumulate preferentially in the nucleus. This result, together with the bioinformatic analyses, strongly suggests that lncISG15 and lncBST2/BISPR are non-coding RNAs.
LncBST2/BISPR Regulates the Expression of BST2
To address the role of lncBST2/BISPR, we used RNA interference. HuH7 cells treated or not with IFN, were transfected with siRNAs targeting lncBST2/BISPR and RNA expression was evaluated by qRT-PCR. The results show that expression of lncBST2/BISPR was decreased compared to cells transfected with control siRNAs (Figure 7A). Surprisingly, inhibition of lncBST2/BISPR also led to decreased levels of BST2 mRNA. Expression of lncISG15, ISG15, GBP1 or expression of genes located in the genome close to BST2 or lncBST2/BISPR, such as GTPBP3 or MVB12A, was not affected (Figure 7A and data not shown). To determine whether this was a general phenomenon, we transfected the siRNAs targeting lncBST2/BISPR into A549 cells infected or not with the VSV M51R mutant or treated with IFN. Similarly to what has been observed in HuH7 cells, the siRNA that targets lncBST2/BISPR leads to decreased levels of lncBST2/BISPR and BST2 mRNA while the levels of ISG15 mRNA are not significantly affected (Figure 7B). Similar results were observed with a different siRNA targeting lncBST2/BISPR.
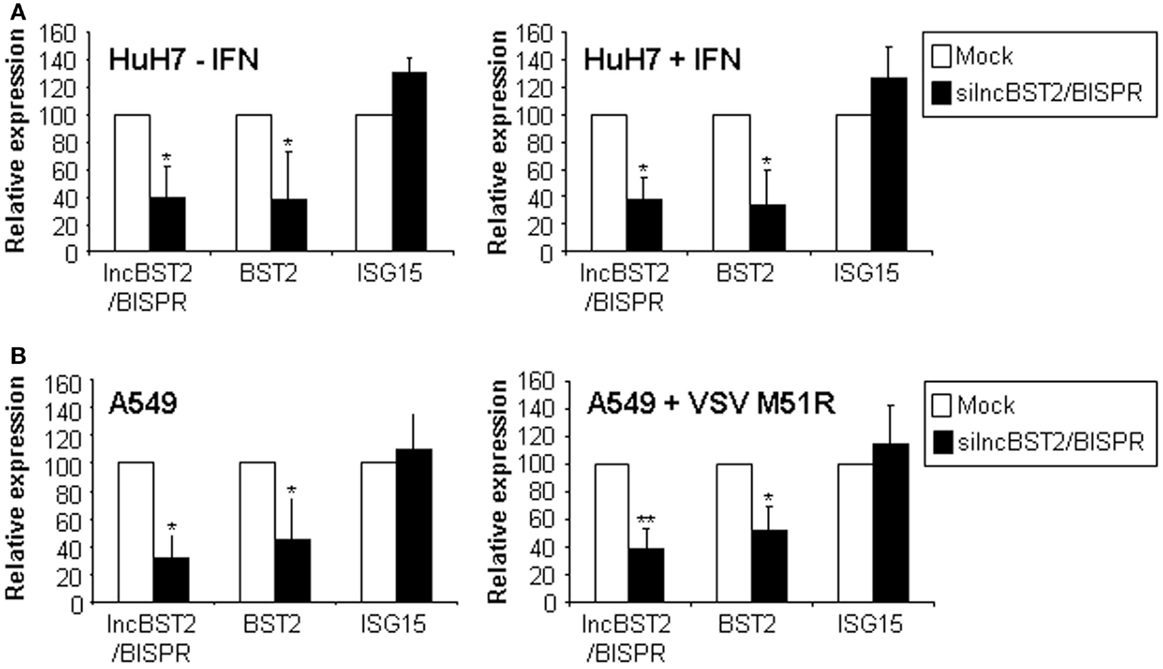
Figure 7. LncBST2 controls the expression of BST2 mRNA. HuH7 (A) or A549 (B) cells were transfected with control siRNAs (Mock) or siRNAs targeting lncBST2 for 48 h. HuH7, cells were treated or not with IFNα for 6 h before RNA isolation (A). A549 cells were infected or not with VSV M51R (B). Levels of lncBST2, BST2, ISG15, and GAPDH mRNAs were evaluated by qRT-PCR. The experiments were performed at least three times. Values are refereed to 100% of the control samples. Error bars indicate standard deviations from a minimum of three independent experiments.
Discussion
RNA sequencing analysis of human cells treated with IFNα2 and controls has allowed the identification of lncRNAs induced in response to IFN (Figure 1). Analysis of the RNASeq data shows that several of the upregulated genes are well-known coding ISGs such as ISG15 or OAS (Figure 1A, Table S3 in Supplementary Material). Ingenuity analysis confirms the enrichment of genes involved in the IFN response among the regulated factors. We have used RNAs from similar IFN-treated and control cells to hybridize expression arrays (15). Comparison of the datasets obtained in the analysis of the array and the RNASeq shows that only 13 coding genes were identified in both studies, including OAS, ISG15, Mx1, and some members of the IFI family. Generally, overlap between microarray and RNASeq analysis is not high (76). Furthermore, the overlapping decreases with sequencing depth and when low fold-changes or low abundance genes are analyzed. (77). This is because sequencing of low transcript abundances is characterized by high variance, which impedes their identification in RNASeq analysis. We believe that this may explain the poor correlation found between the array and the RNASeq datasets. In fact, we have determined by qRT-PCR that some IFN-related low abundance transcripts are detected only in the array analysis. These are early responders to IFN, which increased only marginally 3 days after IFN-treatment, when the analysis was performed. Therefore, we believe that some lncRNAs induced early post-IFN-treatment may have not been identified in our analysis. Interestingly, in the process of writing this manuscript, a paper was accepted describing the identification of IFN-induced lncRNAs by RNASeq in samples treated with IFN for short times (14). We believe that this study will be complementary to our work. Together, the datasets should contain lncRNAs regulated at early and later times post-IFN-treatment. Similarly, the lack of correlation between the microarray and RNAseq datasets also indicates that they can complement each other.
We have identified two lncRNAs whose expression is highly upregulated in response to different doses of IFNα (Table 1; Figure 2A) or IFNλ (Figure 2B). Our results show that induction of these lncRNAs by IFNα seems faster than that observed for IFNλ. We cannot rule out the possibility that a fast response to IFNλ may also be observed when higher doses are used. ENCODE analysis of polymerase II binding to the promoters of these lncRNAs also shows that they may be induced by treatment with IFNα and IFNγ (Figure S3 in Supplementary Material). These lncRNAs have been named lncISG15 and lncBST2/BISPR after their neighboring genes, which play a key role in the antiviral IFN response. Our molecular and bioinformatic analyses strongly suggest that lncISG15 and lncBST2/BISPR are indeed lncRNAs, as they accumulate preferentially in the nucleus of IFN-treated or untreated cells (Figure 6B) and they have poor coding potential (Figure 6A and Figure S4 in Supplementary Material).
In general, the upregulation of lncISG15 and lncBST2/BISPR mimics that of their coding counterparts (Figures 2–4). In fact, analysis performed with all the expression data obtained in our studies, shows a highly significant correlation between lncISG15 and ISG15 and between lncBST2/BISPR and BST2. Significant correlations also exist between these lncRNAs and other IFN-induced genes such as OAS, GBP1, or IRF1 (Figure S2 in Supplementary Material and data not shown). This may reflect the fact that all these genes are induced by IFN with a similar kinetics. In the case of the lncRNAs and their coding counterparts, correlation of the expression may result from their transcriptional co-regulation. Experimental and bioinformatic analyses indicate that BST2 and lncBST2/BISPR are bona fide ISGs strongly induced by the JAK/STAT pathway in response to IFN (Figure 5 and Figure S3 in Supplementary Material). Furthermore, expression of BST2, ISG15, and their neighboring non-coding genes is induced by downstream effectors of the IFN response. These studies allow us to suggest that lncISG15/ISG15 and lncBST2/BISPR/BST2 may share bidirectional promoters. Other IFN-induced gene pairs may also be co-regulated by bidirectional promoters as these are enriched in STAT1 binding (78).
Bidirectional promoters often couple genes involved in the same process, allowing for coordinated temporal and environmental responses (73, 78–82). Non-coding RNAs generated from bidirectional promoters may have functional roles that affect the bidirectional promoter, the neighboring protein-coding gene, or more distal genes (83). These effects could lead to activation or repression of the expression and could be mediated by either the transcription process itself or by the produced ncRNA transcript (84). In this study, we show that post-transcriptional inhibition of lncBST2/BISPR leads to reduced levels of BST2 mRNA (Figure 7). Therefore, lncBST2/BISPR should increase transcription or stability of its coding neighboring gene. Our results demonstrate that this regulation seems specific for BST2, as lncBST2/BISPR downregulation does not affect the expression of genes located nearby, which has been described for compact genomes (85). Moreover, inhibition of lncBST2/BISPR does not affect expression levels of other IFN-related genes such as ISG15 or GBP1 (Figure 7 and data not shown).
We anticipate that inhibition of lncBST2/BISPR, and therefore of BST2, could impact the antiviral effects of IFN. BST2 is also named tetherin, as it inhibits viral budding by using anchors that trap virions on the cell membrane (86–88). Several enveloped viruses have been shown to be susceptible to the action of BST2/tetherin and have evolved to develop evasion strategies (87). Interestingly, HIV, influenza, HCV, and VSV are among the susceptible viruses and could be used to test the antiviral role of lncBST2/BISPR (49, 89–95). In fact, we show that lncBST2/BISPR and BST2 are induced after infection with HCV or influenza and VSV mutant viruses that activate the IFN response (Figure 3).
Upregulation of lncBST2/BISPR, lncISG15, and their coding neighbors was also observed in patients infected with HCV compared to controls (Figure 4). Similarly, a significant upregulation of lncBST2/BISPR and ISG15 was also detected in human T-lymphocytes infected with HIV compared to controls (data not shown). A non-significant increase in BST2 and lncISG15 was also observed in these samples. This leads to the possibility that interference with these factors could have therapeutic relevance. It is unclear why cells infected by these viruses, which employ several viral proteins to block the IFN pathway, show activation of these IFN response genes (96). In the case of HCV, it has been previously shown that patients with chronic HCV infections express ISGs, including high levels of ISG15 (97–99). In fact, HCV has evolved to use some ISGs for viral replication (100, 101). This is the case for ISG15. ISG15 is an ubiquitin-like protein that attaches to its targets in a process called ISGylation (102, 103). Protein ISGylation may result in increased or decreased functionality depending on the target (104). ISG15 preferentially conjugates newly synthesized proteins affecting more strongly viral proteins or cellular proteins translated into IFN-induced cells (105). Viruses such as influenza, HIV, or VSV are susceptible to the action of ISG15 (103, 106). In the case of HCV, a pro-HCV role for ISG15 has been reported (105, 107). ISG15 has been shown to negatively regulate RIG-I and thus to inhibit the signaling process leading to IFN induction that affects HCV replication (108). Furthermore, ISG15 expression in the liver of chronically infected patients is considered a negative predictive biomarker of the ability of the patients to respond to IFN therapy (97–99) (Figure 4). In our study, we cannot address whether lncISG15, BST2, or lncBST2/BISPR are markers for the susceptibility of HCV patients to respond to IFN-treatment, as the HCV patients that we have studied are non-responders to IFN.
We believe that, similar to lncBST2/BISPR, lncISG15 could affect the expression of ISG15 or other genes. This lncRNA-mediated control has also been described for a lncRNA located close to the ISG viperin, which has been shown to regulate the levels of many IFN-inducible genes (14, 109). Further experiments will be required to address the role of lncISG15 and to decipher the molecular mechanisms that allow the control exerted by lncBST2/BISPR on BST2. We believe that these studies may be important to better understand the IFN response and its pro or antiviral functions on HCV and other viruses.
Author Contributions
Marina Barriocanal and Elena Carnero designed and performed the experiments and analyzed and interpreted the data; Marina Barriocanal contributed to the writing of the manuscript; Victor Segura was in charge of all the bioinformatic analyses; and Puri Fortes conceived the project and the required experiments, provided the budget, interpreted the data, and wrote the manuscript.
Conflict of Interest Statement
The authors declare that the research was conducted in the absence of any commercial or financial relationships that could be construed as a potential conflict of interest. The Review Editor Saba Valadkhan declares that, despite having collaborated on a publication in the last 2 years with authors Puri Fortes, Marina Barriocanal, and Elena Carnero, the review process was handled objectively.
Acknowledgments
We thank Nerea Razquin and Celia Prior for excellent technical assistance, Paul Miller for editorial work, Estanis Nistal, Cristian Smerdou, and Rafael Aldabe for influenza and VSV viruses, SFV, and HCV, respectively. We also thank Pablo Gastaminza for the HuH7 cells sensitive to HCV infection used in all the experiments, Esther Larrea for IFNα2 and primers for ISGs, Elizabeth Guruceaga for the initial studies on RNASeq data and Ruben Hernandez for helpful comments on the manuscript. We would like to thank patients for the generous donation of samples and Virginia Villar and the biobank of the University of Navarra for their mediation. This work was supported by grants from Ministerio de Ciencia e Innovacion BIO2009/09295, and SAF2012-40003, FEDER funding, funds from the “UTE project CIMA” and by the project RNAREG [CSD2009-00080], funded by the Ministry of Science and Innovation under the program CONSOLIDER INGENIO 2010.
Author Note
A manuscript from Dr. Valadkhan’s laboratory has been accepted for publication that describes similar results (110).
Supplementary Material
The Supplementary Material for this article can be found online at http://www.frontiersin.org/Journal/10.3389/fimmu.2014.00655/abstract
Footnotes
References
1. Ivashkiv LB, Donlin LT. Regulation of type I interferon responses. Nat Rev Immunol (2014) 14:36–49. doi:10.1038/nri3581
2. Bolen CR, Ding S, Robek MD, Kleinstein SH. Dynamic expression profiling of type I and type III interferon-stimulated hepatocytes reveals a stable hierarchy of gene expression. Hepatology (2014) 59:1262–72. doi:10.1002/hep.26657
Pubmed Abstract | Pubmed Full Text | CrossRef Full Text | Google Scholar
3. Marcello T, Grakoui A, Barba-Spaeth G, Machlin ES, Kotenko SV, MacDonald MR, et al. Interferons alpha and lambda inhibit hepatitis C virus replication with distinct signal transduction and gene regulation kinetics. Gastroenterology (2006) 131:1887–98. doi:10.1053/j.gastro.2006.09.052
Pubmed Abstract | Pubmed Full Text | CrossRef Full Text | Google Scholar
4. McLaren JE, Ramji DP. Interferon gamma: a master regulator of atherosclerosis. Cytokine Growth Factor Rev (2009) 20:125–35. doi:10.1016/j.cytogfr.2008.11.003
5. Zaidi MR, Merlino G. The two faces of interferon-gamma in cancer. Clin Cancer Res (2011) 17:6118–24. doi:10.1158/1078-0432.CCR-11-0482
Pubmed Abstract | Pubmed Full Text | CrossRef Full Text | Google Scholar
6. van Boxel-Dezaire AH, Rani MR, Stark GR. Complex modulation of cell type-specific signaling in response to type I interferons. Immunity (2006) 25:361–72. doi:10.1016/j.immuni.2006.08.014
7. Qiao Y, Giannopoulou EG, Chan CH, Park SH, Gong S, Chen J, et al. Synergistic activation of inflammatory cytokine genes by interferon-gamma-induced chromatin remodeling and toll-like receptor signaling. Immunity (2013) 39:454–69. doi:10.1016/j.immuni.2013.08.009
Pubmed Abstract | Pubmed Full Text | CrossRef Full Text | Google Scholar
8. Schneider WM, Chevillotte MD, Rice CM. Interferon-stimulated genes: a complex web of host defenses. Annu Rev Immunol (2014) 32:513–45. doi:10.1146/annurev-immunol-032713-120231
Pubmed Abstract | Pubmed Full Text | CrossRef Full Text | Google Scholar
9. Yoshimura A, Naka T, Kubo M. SOCS proteins, cytokine signalling and immune regulation. Nat Rev Immunol (2007) 7:454–65. doi:10.1038/nri2093
Pubmed Abstract | Pubmed Full Text | CrossRef Full Text | Google Scholar
10. Sarasin-Filipowicz M, Wang X, Yan M, Duong FH, Poli V, Hilton DJ, et al. Alpha interferon induces long-lasting refractoriness of JAK-STAT signaling in the mouse liver through induction of USP18/UBP43. Mol Cell Biol (2009) 29:4841–51. doi:10.1128/MCB.00224-09
Pubmed Abstract | Pubmed Full Text | CrossRef Full Text | Google Scholar
11. Hertzog PJ, Williams BR. Fine tuning type I interferon responses. Cytokine Growth Factor Rev (2013) 24:217–25. doi:10.1016/j.cytogfr.2013.04.002
Pubmed Abstract | Pubmed Full Text | CrossRef Full Text | Google Scholar
12. David M. Interferons and microRNAs. J Interferon Cytokine Res (2010) 30:825–8. doi:10.1089/jir.2010.0080
Pubmed Abstract | Pubmed Full Text | CrossRef Full Text | Google Scholar
13. Josset L, Tchitchek N, Gralinski LE, Ferris MT, Eisfeld AJ, Green RR, et al. Annotation of long non-coding RNAs expressed in collaborative cross founder mice in response to respiratory virus infection reveals a new class of interferon-stimulated transcripts. RNA Biol (2014) 11(7):875–90. doi:10.4161/rna.29442
Pubmed Abstract | Pubmed Full Text | CrossRef Full Text | Google Scholar
14. Kambara H, Niazi F, Kostadinova L, Moonka DK, Siegel CT, Post AB, et al. Negative regulation of the interferon response by an interferon-induced long non-coding RNA. Nucleic Acids Res (2014) 42:10668–80. doi:10.1093/nar/gku713
Pubmed Abstract | Pubmed Full Text | CrossRef Full Text | Google Scholar
15. Carnero E, Barriocanal M, Segura V, Guruceaga E, Prior C, Börner K, et al. Type interferon regulates the expression of long noncoding RNAs. Front Immunol (2014) 5:548. doi:10.3389/fimmu.2014.00548
Pubmed Abstract | Pubmed Full Text | CrossRef Full Text | Google Scholar
16. Yin Z, Guan D, Fan Q, Su J, Zheng W, Ma W, et al. lncRNA expression signatures in response to enterovirus 71 infection. Biochem Biophys Res Commun (2013) 430:629–33. doi:10.1016/j.bbrc.2012.11.101
Pubmed Abstract | Pubmed Full Text | CrossRef Full Text | Google Scholar
17. Winterling C, Koch M, Koeppel M, Garcia-Alcalde F, Karlas A, Meyer TF. Evidence for a crucial role of a host non-coding RNA in influenza A virus replication. RNA Biol (2014) 11:66–75. doi:10.4161/rna.27504
Pubmed Abstract | Pubmed Full Text | CrossRef Full Text | Google Scholar
18. Peng X, Gralinski L, Armour CD, Ferris MT, Thomas MJ, Proll S, et al. Unique signatures of long noncoding RNA expression in response to virus infection and altered innate immune signaling. MBio (2010) 1(5):e00206–10. doi:10.1128/mBio.00206-10
Pubmed Abstract | Pubmed Full Text | CrossRef Full Text | Google Scholar
19. Imamura K, Imamachi N, Akizuki G, Kumakura M, Kawaguchi A, Nagata K, et al. Long noncoding RNA NEAT1-dependent SFPQ relocation from promoter region to paraspeckle mediates IL8 expression upon immune stimuli. Mol Cell (2014) 53:393–406. doi:10.1016/j.molcel.2014.01.009
Pubmed Abstract | Pubmed Full Text | CrossRef Full Text | Google Scholar
20. Huang JF, Guo YJ, Zhao CX, Yuan SX, Wang Y, Tang GN, et al. Hepatitis B virus X protein (HBx)-related long noncoding RNA (lncRNA) down-regulated expression by HBx (Dreh) inhibits hepatocellular carcinoma metastasis by targeting the intermediate filament protein vimentin. Hepatology (2013) 57:1882–92. doi:10.1002/hep.26195
Pubmed Abstract | Pubmed Full Text | CrossRef Full Text | Google Scholar
21. Yang F, Zhang L, Huo XS, Yuan JH, Xu D, Yuan SX, et al. Long noncoding RNA high expression in hepatocellular carcinoma facilitates tumor growth through enhancer of zeste homolog 2 in humans. Hepatology (2011) 54:1679–89. doi:10.1002/hep.24563
Pubmed Abstract | Pubmed Full Text | CrossRef Full Text | Google Scholar
22. Du Y, Kong G, You X, Zhang S, Zhang T, Gao Y, et al. Elevation of highly up-regulated in liver cancer (HULC) by hepatitis B virus X protein promotes hepatoma cell proliferation via down-regulating p18. J Biol Chem (2012) 287:26302–11. doi:10.1074/jbc.M112.342113
Pubmed Abstract | Pubmed Full Text | CrossRef Full Text | Google Scholar
23. Zhang Q, Chen CY, Yedavalli VS, Jeang KT. NEAT1 long noncoding RNA and paraspeckle bodies modulate HIV-1 posttranscriptional expression. MBio (2013) 4:e596–512. doi:10.1128/mBio.00596-12
Pubmed Abstract | Pubmed Full Text | CrossRef Full Text | Google Scholar
24. Carpenter S, Aiello D, Atianand MK, Ricci EP, Gandhi P, Hall LL, et al. A long noncoding RNA mediates both activation and repression of immune response genes. Science (2013) 341:789–92. doi:10.1126/science.1240925
Pubmed Abstract | Pubmed Full Text | CrossRef Full Text | Google Scholar
25. IIott NE, Heward JA, Roux B, Tsitsiou E, Fenwick PS, Lenzi L, et al. Long non-coding RNAs and enhancer RNAs regulate the lipopolysaccharide-induced inflammatory response in human monocytes. Nat Commun (2014) 5:3979. doi:10.1038/ncomms4979
Pubmed Abstract | Pubmed Full Text | CrossRef Full Text | Google Scholar
26. Cui H, Xie N, Tan Z, Banerjee S, Thannickal VJ, Abraham E, et al. The human long noncoding RNA lnc-IL7R regulates the inflammatory response. Eur J Immunol (2014) 44:2085–95. doi:10.1002/eji.201344126
Pubmed Abstract | Pubmed Full Text | CrossRef Full Text | Google Scholar
27. Li Z, Chao TC, Chang KY, Lin N, Patil VS, Shimizu C, et al. The long noncoding RNA THRIL regulates TNFalpha expression through its interaction with hnRNPL. Proc Natl Acad Sci U S A (2014) 111:1002–7. doi:10.1073/pnas.1313768111
Pubmed Abstract | Pubmed Full Text | CrossRef Full Text | Google Scholar
28. Rapicavoli NA, Qu K, Zhang J, Mikhail M, Laberge RM, Chang HY. A mammalian pseudogene lncRNA at the interface of inflammation and anti-inflammatory therapeutics. Elife (2013) 2:e00762. doi:10.7554/eLife.00762
Pubmed Abstract | Pubmed Full Text | CrossRef Full Text | Google Scholar
29. Guttman M, Amit I, Garber M, French C, Lin MF, Feldser D, et al. Chromatin signature reveals over a thousand highly conserved large non-coding RNAs in mammals. Nature (2009) 458:223–7. doi:10.1038/nature07672
Pubmed Abstract | Pubmed Full Text | CrossRef Full Text | Google Scholar
30. Pang KC, Dinger ME, Mercer TR, Malquori L, Grimmond SM, Chen W, et al. Genome-wide identification of long noncoding RNAs in CD8+ T cells. J Immunol (2009) 182:7738–48. doi:10.4049/jimmunol.0900603
Pubmed Abstract | Pubmed Full Text | CrossRef Full Text | Google Scholar
31. Pagani M, Rossetti G, Panzeri I, de Candia P, Bonnal RJ, Rossi RL, et al. Role of microRNAs and long-non-coding RNAs in CD4(+) T-cell differentiation. Immunol Rev (2013) 253:82–96. doi:10.1111/imr.12055
Pubmed Abstract | Pubmed Full Text | CrossRef Full Text | Google Scholar
32. Wang P, Xue Y, Han Y, Lin L, Wu C, Xu S, et al. The STAT3-binding long noncoding RNA lnc-DC controls human dendritic cell differentiation. Science (2014) 344:310–3. doi:10.1126/science.1251456
Pubmed Abstract | Pubmed Full Text | CrossRef Full Text | Google Scholar
33. Gomez JA, Wapinski OL, Yang YW, Bureau JF, Gopinath S, Monack DM, et al. The NeST long ncRNA controls microbial susceptibility and epigenetic activation of the interferon-gamma locus. Cell (2013) 152:743–54. doi:10.1016/j.cell.2013.01.015
Pubmed Abstract | Pubmed Full Text | CrossRef Full Text | Google Scholar
34. Collier SP, Collins PL, Williams CL, Boothby MR, Aune TM. Cutting edge: influence of Tmevpg1, a long intergenic noncoding RNA, on the expression of Ifng by Th1 cells. J Immunol (2012) 189:2084–8. doi:10.4049/jimmunol.1200774
Pubmed Abstract | Pubmed Full Text | CrossRef Full Text | Google Scholar
35. ENCODE Project Consortium. An integrated encyclopedia of DNA elements in the human genome. Nature (2012) 489:57–74. doi:10.1038/nature11247
Pubmed Abstract | Pubmed Full Text | CrossRef Full Text | Google Scholar
36. Morris KV, Mattick JS. The rise of regulatory RNA. Nat Rev Genet (2014) 15:423–37. doi:10.1038/nrg3722
Pubmed Abstract | Pubmed Full Text | CrossRef Full Text | Google Scholar
37. Gibb EA, Vucic EA, Enfield KS, Stewart GL, Lonergan KM, Kennett JY, et al. Human cancer long non-coding RNA transcriptomes. PLoS One (2011) 6:e25915. doi:10.1371/journal.pone.0025915
Pubmed Abstract | Pubmed Full Text | CrossRef Full Text | Google Scholar
38. Mercer TR, Dinger ME, Sunkin SM, Mehler MF, Mattick JS. Specific expression of long noncoding RNAs in the mouse brain. Proc Natl Acad Sci U S A (2008) 105:716–21. doi:10.1073/pnas.0706729105
Pubmed Abstract | Pubmed Full Text | CrossRef Full Text | Google Scholar
39. Djebali S, Davis CA, Merkel A, Dobin A, Lassmann T, Mortazavi A, et al. Landscape of transcription in human cells. Nature (2012) 489:101–8. doi:10.1038/nature11233
40. Yap KL, Li S, Munoz-Cabello AM, Raguz S, Zeng L, Mujtaba S, et al. Molecular interplay of the noncoding RNA ANRIL and methylated histone H3 lysine 27 by polycomb CBX7 in transcriptional silencing of INK4a. Mol Cell (2010) 38:662–74. doi:10.1016/j.molcel.2010.03.021
Pubmed Abstract | Pubmed Full Text | CrossRef Full Text | Google Scholar
41. Allo M, Buggiano V, Fededa JP, Petrillo E, Schor I, de la Mata M, et al. Control of alternative splicing through siRNA-mediated transcriptional gene silencing. Nat Struct Mol Biol (2009) 16:717–24. doi:10.1038/nsmb.1620
Pubmed Abstract | Pubmed Full Text | CrossRef Full Text | Google Scholar
42. Faghihi MA, Modarresi F, Khalil AM, Wood DE, Sahagan BG, Morgan TE, et al. Expression of a noncoding RNA is elevated in Alzheimer’s disease and drives rapid feed-forward regulation of beta-secretase. Nat Med (2008) 14:723–30. doi:10.1038/nm1784
Pubmed Abstract | Pubmed Full Text | CrossRef Full Text | Google Scholar
43. Yu W, Gius D, Onyango P, Muldoon-Jacobs K, Karp J, Feinberg AP, et al. Epigenetic silencing of tumour suppressor gene p15 by its antisense RNA. Nature (2008) 451:202–6. doi:10.1038/nature06468
Pubmed Abstract | Pubmed Full Text | CrossRef Full Text | Google Scholar
44. Yang L, Froberg JE, Lee JT. Long noncoding RNAs: fresh perspectives into the RNA world. Trends Biochem Sci (2014) 39:35–43. doi:10.1016/j.tibs.2013.10.002
Pubmed Abstract | Pubmed Full Text | CrossRef Full Text | Google Scholar
45. Ichihara M, Murakumo Y, Masuda A, Matsuura T, Asai N, Jijiwa M, et al. Thermodynamic instability of siRNA duplex is a prerequisite for dependable prediction of siRNA activities. Nucleic Acids Res (2007) 35:e123. doi:10.1093/nar/gkm699
Pubmed Abstract | Pubmed Full Text | CrossRef Full Text | Google Scholar
46. Matveeva O, Nechipurenko Y, Rossi L, Moore B, Saetrom P, Ogurtsov AY, et al. Comparison of approaches for rational siRNA design leading to a new efficient and transparent method. Nucleic Acids Res (2007) 35:e63. doi:10.1093/nar/gkm088
Pubmed Abstract | Pubmed Full Text | CrossRef Full Text | Google Scholar
47. Wakita T, Pietschmann T, Kato T, Date T, Miyamoto M, Zhao Z, et al. Production of infectious hepatitis C virus in tissue culture from a cloned viral genome. Nat Med (2005) 11:791–6. doi:10.1038/nm0805-905b
Pubmed Abstract | Pubmed Full Text | CrossRef Full Text | Google Scholar
48. Aparicio O, Carnero E, Abad X, Razquin N, Guruceaga E, Segura V, et al. Adenovirus VA RNA-derived miRNAs target cellular genes involved in cell growth, gene expression and DNA repair. Nucleic Acids Res (2010) 38:750–63. doi:10.1093/nar/gkp1028
Pubmed Abstract | Pubmed Full Text | CrossRef Full Text | Google Scholar
49. Garcia-Sastre A. Induction and evasion of type I interferon responses by influenza viruses. Virus Res (2011) 162:12–8. doi:10.1016/j.virusres.2011.10.017
Pubmed Abstract | Pubmed Full Text | CrossRef Full Text | Google Scholar
50. Ferran MC, Lucas-Lenard JM. The vesicular stomatitis virus matrix protein inhibits transcription from the human beta interferon promoter. J Virol (1997) 71:371–7.
51. Narvaiza I, Aparicio O, Vera M, Razquin N, Bortolanza S, Prieto J, et al. Effect of adenovirus-mediated RNA interference on endogenous microRNAs in a mouse model of multidrug resistance protein 2 gene silencing. J Virol (2006) 80:12236–47. doi:10.1128/JVI.01205-06
Pubmed Abstract | Pubmed Full Text | CrossRef Full Text | Google Scholar
52. Abad X, Razquin N, Abad A, Fortes P. Combination of RNA interference and U1 inhibition leads to increased inhibition of gene expression. Nucleic Acids Res (2010) 38:e136. doi:10.1093/nar/gkq299
Pubmed Abstract | Pubmed Full Text | CrossRef Full Text | Google Scholar
53. Blazquez L, Gonzalez-Rojas SJ, Abad A, Razquin N, Abad X, Fortes P. Increased in vivo inhibition of gene expression by combining RNA interference and U1 inhibition. Nucleic Acids Res (2012) 40:e8. doi:10.1093/nar/gkr956
Pubmed Abstract | Pubmed Full Text | CrossRef Full Text | Google Scholar
54. Sobrevals L, Enguita M, Rodriguez C, Gonzalez-Rojas J, Alzaguren P, Razquin N, et al. AAV vectors transduce hepatocytes in vivo as efficiently in cirrhotic as in healthy rat livers. Gene Ther (2012) 19:411–7. doi:10.1038/gt.2011.119
Pubmed Abstract | Pubmed Full Text | CrossRef Full Text | Google Scholar
55. Kim D, Pertea G, Trapnell C, Pimentel H, Kelley R, Salzberg SL. TopHat2: accurate alignment of transcriptomes in the presence of insertions, deletions and gene fusions. Genome Biol (2013) 14:R36. doi:10.1186/gb-2013-14-4-r36
Pubmed Abstract | Pubmed Full Text | CrossRef Full Text | Google Scholar
56. Trapnell C, Williams BA, Pertea G, Mortazavi A, Kwan G, van Baren MJ, et al. Transcript assembly and quantification by RNA-Seq reveals unannotated transcripts and isoform switching during cell differentiation. Nat Biotechnol (2010) 28:511–5. doi:10.1038/nbt.1621
Pubmed Abstract | Pubmed Full Text | CrossRef Full Text | Google Scholar
57. Gentleman R, Carey V, Huber W, Irizarry R, Dudoit S. Bioinformatics and Computational Biology Solutions Using R and Bioconductor. New York, NY: Springer (2005).
58. Thorvaldsdottir H, Robinson JT, Mesirov JP. Integrative genomics viewer (IGV): high-performance genomics data visualization and exploration. Brief Bioinform (2013) 14:178–92. doi:10.1093/bib/bbs017
Pubmed Abstract | Pubmed Full Text | CrossRef Full Text | Google Scholar
59. Robinson JT, Thorvaldsdottir H, Winckler W, Guttman M, Lander ES, Getz G, et al. Integrative genomics viewer. Nat Biotechnol (2011) 29:24–6. doi:10.1038/nbt.1754
60. Karolchik D, Barber GP, Casper J, Clawson H, Cline MS, Diekhans M, et al. The UCSC genome browser database: 2014 update. Nucleic Acids Res (2014) 42:D764–70. doi:10.1093/nar/gkt1168
Pubmed Abstract | Pubmed Full Text | CrossRef Full Text | Google Scholar
61. Harrow J, Frankish A, Gonzalez JM, Tapanari E, Diekhans M, Kokocinski F, et al. GENCODE: the reference human genome annotation for the ENCODE project. Genome Res (2012) 22:1760–74. doi:10.1101/gr.135350.111
Pubmed Abstract | Pubmed Full Text | CrossRef Full Text | Google Scholar
63. Kong L, Zhang Y, Ye ZQ, Liu XQ, Zhao SQ, Wei L, et al. CPC: assess the protein-coding potential of transcripts using sequence features and support vector machine. Nucleic Acids Res (2007) 35:W345–9. doi:10.1093/nar/gkm391
Pubmed Abstract | Pubmed Full Text | CrossRef Full Text | Google Scholar
64. Wang L, Park HJ, Dasari S, Wang S, Kocher JP, Li W. CPAT: coding-potential assessment tool using an alignment-free logistic regression model. Nucleic Acids Res (2013) 41:e74. doi:10.1093/nar/gkt006
Pubmed Abstract | Pubmed Full Text | CrossRef Full Text | Google Scholar
65. Volders PJ, Helsens K, Wang X, Menten B, Martens L, Gevaert K, et al. LNCipedia: a database for annotated human lncRNA transcript sequences and structures. Nucleic Acids Res (2013) 41:D246–51. doi:10.1093/nar/gks915
Pubmed Abstract | Pubmed Full Text | CrossRef Full Text | Google Scholar
66. Vizcaino JA, Cote RG, Csordas A, Dianes JA, Fabregat A, Foster JM, et al. The proteomics identifications (PRIDE) database and associated tools: status in 2013. Nucleic Acids Res (2013) 41:D1063–9. doi:10.1093/nar/gks1262
Pubmed Abstract | Pubmed Full Text | CrossRef Full Text | Google Scholar
67. Lee S, Liu B, Lee S, Huang SX, Shen B, Qian SB. Global mapping of translation initiation sites in mammalian cells at single-nucleotide resolution. Proc Natl Acad Sci U S A (2012) 109:E2424–32. doi:10.1073/pnas.1207846109
Pubmed Abstract | Pubmed Full Text | CrossRef Full Text | Google Scholar
68. Bazzini AA, Johnstone TG, Christiano R, Mackowiak SD, Obermayer B, Fleming ES, et al. Identification of small ORFs in vertebrates using ribosome footprinting and evolutionary conservation. EMBO J (2014) 33:981–93. doi:10.1002/embj.201488411
Pubmed Abstract | Pubmed Full Text | CrossRef Full Text | Google Scholar
69. Lin MF, Carlson JW, Crosby MA, Matthews BB, Yu C, Park S, et al. Revisiting the protein-coding gene catalog of Drosophila melanogaster using 12 fly genomes. Genome Res (2007) 17:1823–36. doi:10.1101/gr.6679507
Pubmed Abstract | Pubmed Full Text | CrossRef Full Text | Google Scholar
70. Francois C, Bernard I, Castelain S, Charleston B, Fray MD, Capiod JC, et al. Quantification of different human alpha interferon subtypes and pegylated interferon activities by measuring MxA promoter activation. Antimicrob Agents Chemother (2005) 49:3770–5. doi:10.1128/AAC.49.9.3770-3775.2005
Pubmed Abstract | Pubmed Full Text | CrossRef Full Text | Google Scholar
71. Garcia-Sastre A, Egorov A, Matassov D, Brandt S, Levy DE, Durbin JE, et al. Influenza A virus lacking the NS1 gene replicates in interferon-deficient systems. Virology (1998) 252:324–30. doi:10.1006/viro.1998.9508
Pubmed Abstract | Pubmed Full Text | CrossRef Full Text | Google Scholar
72. Basu M, Maitra RK, Xiang Y, Meng X, Banerjee AK, Bose S. Inhibition of vesicular stomatitis virus infection in epithelial cells by alpha interferon-induced soluble secreted proteins. J Gen Virol (2006) 87:2653–62. doi:10.1099/vir.0.82039-0
Pubmed Abstract | Pubmed Full Text | CrossRef Full Text | Google Scholar
73. Trinklein ND, Aldred SF, Hartman SJ, Schroeder DI, Otillar RP, Myers RM. An abundance of bidirectional promoters in the human genome. Genome Res (2004) 14:62–6. doi:10.1101/gr.1982804
Pubmed Abstract | Pubmed Full Text | CrossRef Full Text | Google Scholar
74. Engstrom PG, Suzuki H, Ninomiya N, Akalin A, Sessa L, Lavorgna G, et al. Complex Loci in human and mouse genomes. PLoS Genet (2006) 2:e47. doi:10.1371/journal.pgen.0020047
Pubmed Abstract | Pubmed Full Text | CrossRef Full Text | Google Scholar
75. Au WC, Moore PA, Lowther W, Juang YT, Pitha PM. Identification of a member of the interferon regulatory factor family that binds to the interferon-stimulated response element and activates expression of interferon-induced genes. Proc Natl Acad Sci U S A (1995) 92:11657–61. doi:10.1073/pnas.92.25.11657
Pubmed Abstract | Pubmed Full Text | CrossRef Full Text | Google Scholar
76. Black MB, Parks BB, Pluta L, Chu TM, Allen BC, Wolfinger RD, et al. Comparison of microarrays and RNA-seq for gene expression analyses of dose-response experiments. Toxicol Sci (2014) 137:385–403. doi:10.1093/toxsci/kft249
Pubmed Abstract | Pubmed Full Text | CrossRef Full Text | Google Scholar
77. Guo Y, Sheng Q, Li J, Ye F, Samuels DC, Shyr Y. Large scale comparison of gene expression levels by microarrays and RNAseq using TCGA data. PLoS One (2013) 8:e71462. doi:10.1371/journal.pone.0071462
Pubmed Abstract | Pubmed Full Text | CrossRef Full Text | Google Scholar
78. Lin JM, Collins PJ, Trinklein ND, Fu Y, Xi H, Myers RM, et al. Transcription factor binding and modified histones in human bidirectional promoters. Genome Res (2007) 17:818–27. doi:10.1101/gr.5623407
79. Li YY, Yu H, Guo ZM, Guo TQ, Tu K, Li YX. Systematic analysis of head-to-head gene organization: evolutionary conservation and potential biological relevance. PLoS Comput Biol (2006) 2:e74. doi:10.1371/journal.pcbi.0020074
Pubmed Abstract | Pubmed Full Text | CrossRef Full Text | Google Scholar
80. Adachi N, Lieber MR. Bidirectional gene organization: a common architectural feature of the human genome. Cell (2002) 109:807–9. doi:10.1016/S0092-8674(02)00758-4
81. Guarguaglini G, Battistoni A, Pittoggi C, Di Matteo G, Di Fiore B, Lavia P. Expression of the murine RanBP1 and Htf9-c genes is regulated from a shared bidirectional promoter during cell cycle progression. Biochem J (1997) 325(Pt 1):277–86.
82. Lepoivre C, Belhocine M, Bergon A, Griffon A, Yammine M, Vanhille L, et al. Divergent transcription is associated with promoters of transcriptional regulators. BMC Genomics (2013) 14:914. doi:10.1186/1471-2164-14-914
Pubmed Abstract | Pubmed Full Text | CrossRef Full Text | Google Scholar
83. Wei W, Pelechano V, Jarvelin AI, Steinmetz LM. Functional consequences of bidirectional promoters. Trends Genet (2011) 27:267–76. doi:10.1016/j.tig.2011.04.002
84. Wang X, Arai S, Song X, Reichart D, Du K, Pascual G, et al. Induced ncRNAs allosterically modify RNA-binding proteins in cis to inhibit transcription. Nature (2008) 454:126–30. doi:10.1038/nature06992
Pubmed Abstract | Pubmed Full Text | CrossRef Full Text | Google Scholar
85. Xu Z, Wei W, Gagneur J, Clauder-Munster S, Smolik M, Huber W, et al. Antisense expression increases gene expression variability and locus interdependency. Mol Syst Biol (2011) 7:468. doi:10.1038/msb.2011.1
Pubmed Abstract | Pubmed Full Text | CrossRef Full Text | Google Scholar
86. Perez-Caballero D, Zang T, Ebrahimi A, McNatt MW, Gregory DA, Johnson MC, et al. Tetherin inhibits HIV-1 release by directly tethering virions to cells. Cell (2009) 139:499–511. doi:10.1016/j.cell.2009.08.039
Pubmed Abstract | Pubmed Full Text | CrossRef Full Text | Google Scholar
87. Swiecki M, Omattage NS, Brett TJ. BST-2/tetherin: structural biology, viral antagonism, and immunobiology of a potent host antiviral factor. Mol Immunol (2013) 54:132–9. doi:10.1016/j.molimm.2012.11.008
Pubmed Abstract | Pubmed Full Text | CrossRef Full Text | Google Scholar
88. Blanco-Melo D, Venkatesh S, Bieniasz PD. Intrinsic cellular defenses against human immunodeficiency viruses. Immunity (2012) 37:399–411. doi:10.1016/j.immuni.2012.08.013
Pubmed Abstract | Pubmed Full Text | CrossRef Full Text | Google Scholar
89. Amet T, Byrd D, Hu N, Sun Q, Li F, Zhao Y, et al. BST-2 expression in human hepatocytes is inducible by all three types of interferons and restricts production of hepatitis C virus. Curr Mol Med (2014) 14:349–60. doi:10.2174/1566524013666131118111719
Pubmed Abstract | Pubmed Full Text | CrossRef Full Text | Google Scholar
90. Venkatesh S, Bieniasz PD. Mechanism of HIV-1 virion entrapment by tetherin. PLoS Pathog (2013) 9:e1003483. doi:10.1371/journal.ppat.1003483
Pubmed Abstract | Pubmed Full Text | CrossRef Full Text | Google Scholar
91. Pan XB, Qu XW, Jiang D, Zhao XL, Han JC, Wei L. BST2/Tetherin inhibits hepatitis C virus production in human hepatoma cells. Antiviral Res (2013) 98:54–60. doi:10.1016/j.antiviral.2013.01.009
Pubmed Abstract | Pubmed Full Text | CrossRef Full Text | Google Scholar
92. McNatt MW, Zang T, Bieniasz PD. Vpu binds directly to tetherin and displaces it from nascent virions. PLoS Pathog (2013) 9:e1003299. doi:10.1371/journal.ppat.1003299
Pubmed Abstract | Pubmed Full Text | CrossRef Full Text | Google Scholar
93. Mangeat B, Cavagliotti L, Lehmann M, Gers-Huber G, Kaur I, Thomas Y, et al. Influenza virus partially counteracts restriction imposed by tetherin/BST-2. J Biol Chem (2012) 287:22015–29. doi:10.1074/jbc.M111.319996
Pubmed Abstract | Pubmed Full Text | CrossRef Full Text | Google Scholar
94. Neil SJ, Zang T, Bieniasz PD. Tetherin inhibits retrovirus release and is antagonized by HIV-1 Vpu. Nature (2008) 451:425–30. doi:10.1038/nature06553
Pubmed Abstract | Pubmed Full Text | CrossRef Full Text | Google Scholar
95. Weidner JM, Jiang D, Pan XB, Chang J, Block TM, Guo JT. Interferon-induced cell membrane proteins, IFITM3 and tetherin, inhibit vesicular stomatitis virus infection via distinct mechanisms. J Virol (2010) 84:12646–57. doi:10.1128/JVI.01328-10
Pubmed Abstract | Pubmed Full Text | CrossRef Full Text | Google Scholar
96. Horner SM, Gale M Jr. Regulation of hepatic innate immunity by hepatitis C virus. Nat Med (2013) 19:879–88. doi:10.1038/nm.3253
Pubmed Abstract | Pubmed Full Text | CrossRef Full Text | Google Scholar
97. Mihm S, Frese M, Meier V, Wietzke-Braun P, Scharf JG, Bartenschlager R, et al. Interferon type I gene expression in chronic hepatitis C. Lab Invest (2004) 84:1148–59. doi:10.1038/labinvest.3700135
Pubmed Abstract | Pubmed Full Text | CrossRef Full Text | Google Scholar
98. Sarasin-Filipowicz M, Oakeley EJ, Duong FH, Christen V, Terracciano L, Filipowicz W, et al. Interferon signaling and treatment outcome in chronic hepatitis C. Proc Natl Acad Sci U S A (2008) 105:7034–9. doi:10.1073/pnas.0707882105
Pubmed Abstract | Pubmed Full Text | CrossRef Full Text | Google Scholar
99. Bigger CB, Guerra B, Brasky KM, Hubbard G, Beard MR, Luxon BA, et al. Intrahepatic gene expression during chronic hepatitis C virus infection in chimpanzees. J Virol (2004) 78:13779–92. doi:10.1128/JVI.78.24.13779-13792.2004
100. Arnaud N, Dabo S, Maillard P, Budkowska A, Kalliampakou KI, Mavromara P, et al. Hepatitis C virus controls interferon production through PKR activation. PLoS One (2010) 5:e10575. doi:10.1371/journal.pone.0010575
Pubmed Abstract | Pubmed Full Text | CrossRef Full Text | Google Scholar
101. Garaigorta U, Chisari FV. Hepatitis C virus blocks interferon effector function by inducing protein kinase R phosphorylation. Cell Host Microbe (2009) 6:513–22. doi:10.1016/j.chom.2009.11.004
Pubmed Abstract | Pubmed Full Text | CrossRef Full Text | Google Scholar
102. Zhao C, Collins MN, Hsiang TY, Krug RM. Interferon-induced ISG15 pathway: an ongoing virus-host battle. Trends Microbiol (2013) 21:181–6. doi:10.1016/j.tim.2013.01.005
Pubmed Abstract | Pubmed Full Text | CrossRef Full Text | Google Scholar
103. Morales DJ, Lenschow DJ. The antiviral activities of ISG15. J Mol Biol (2013) 425:4995–5008. doi:10.1016/j.jmb.2013.09.041
Pubmed Abstract | Pubmed Full Text | CrossRef Full Text | Google Scholar
104. Shi HX, Yang K, Liu X, Liu XY, Wei B, Shan YF, et al. Positive regulation of interferon regulatory factor 3 activation by Herc5 via ISG15 modification. Mol Cell Biol (2010) 30:2424–36. doi:10.1128/MCB.01466-09
Pubmed Abstract | Pubmed Full Text | CrossRef Full Text | Google Scholar
105. Broering R, Zhang X, Kottilil S, Trippler M, Jiang M, Lu M, et al. The interferon stimulated gene 15 functions as a proviral factor for the hepatitis C virus and as a regulator of the IFN response. Gut (2010) 59:1111–9. doi:10.1136/gut.2009.195545
Pubmed Abstract | Pubmed Full Text | CrossRef Full Text | Google Scholar
106. Lenschow DJ, Lai C, Frias-Staheli N, Giannakopoulos NV, Lutz A, Wolff T, et al. IFN-stimulated gene 15 functions as a critical antiviral molecule against influenza, herpes, and Sindbis viruses. Proc Natl Acad Sci U S A (2007) 104:1371–6. doi:10.1073/pnas.0607038104
Pubmed Abstract | Pubmed Full Text | CrossRef Full Text | Google Scholar
107. Chen L, Sun J, Meng L, Heathcote J, Edwards AM, McGilvray ID. ISG15, a ubiquitin-like interferon-stimulated gene, promotes hepatitis C virus production in vitro: implications for chronic infection and response to treatment. J Gen Virol (2010) 91:382–8. doi:10.1099/vir.0.015388-0
Pubmed Abstract | Pubmed Full Text | CrossRef Full Text | Google Scholar
108. Kim MJ, Hwang SY, Imaizumi T, Yoo JY. Negative feedback regulation of RIG-I-mediated antiviral signaling by interferon-induced ISG15 conjugation. J Virol (2008) 82:1474–83. doi:10.1128/JVI.01650-07
Pubmed Abstract | Pubmed Full Text | CrossRef Full Text | Google Scholar
109. Helbig KJ, Eyre NS, Yip E, Narayana S, Li K, Fiches G, et al. The antiviral protein viperin inhibits hepatitis C virus replication via interaction with nonstructural protein 5A. Hepatology (2011) 54:1506–17. doi:10.1002/hep.24542
Pubmed Abstract | Pubmed Full Text | CrossRef Full Text | Google Scholar
Keywords: IFN, lncRNAs, BST2, ISG15, HCV, tetherin
Citation: Barriocanal M, Carnero E, Segura V and Fortes P (2015) Long non-coding RNA BST2/BISPR is induced by IFN and regulates the expression of the antiviral factor tetherin. Front. Immunol. 5:655. doi: 10.3389/fimmu.2014.00655
Received: 31 July 2014; Accepted: 08 December 2014;
Published online: 09 January 2015.
Edited by:
Susan Carpenter, University of California San Francisco, USAReviewed by:
Min Wu, University of North Dakota, USASaba Valadkhan, Case Western Reserve University, USA
Sergio Covarrubias, University of California San Francisco, USA
Copyright: © 2015 Barriocanal, Carnero, Segura and Fortes. This is an open-access article distributed under the terms of the Creative Commons Attribution License (CC BY). The use, distribution or reproduction in other forums is permitted, provided the original author(s) or licensor are credited and that the original publication in this journal is cited, in accordance with accepted academic practice. No use, distribution or reproduction is permitted which does not comply with these terms.
*Correspondence: Puri Fortes, Center for Applied Medical Research (CIMA), Pio XII 55, Pamplona 31008, Spain e-mail:cGZvcnRlc0B1bmF2LmVz
†Marina Barriocanal and Elena Carnero have contributed equally to this work.