 Hamed Khalili1,2*
 Sakshi Malik3
 Ashwin N. Ananthakrishnan1,2John J. Garber1Leslie M. Higuchi4
 Amit Joshi1,2Joanna Peloquin5James M. Richter1Kathleen O. Stewart1Gary C. Curhan6
 Amit Awasthi3*Vijay Yajnik1*Andrew T. Chan1,2,6*
- 1Division of Gastroenterology, Massachusetts General Hospital, Harvard Medical School, Boston, MA, USA
- 2Clinical and Translational Epidemiology Unit, Massachusetts General Hospital, Boston, MA, USA
- 3Translational Health Science and Technology Institute, NCR Biotech Science Cluster, Faridabad, India
- 4Division of Gastroenterology and Nutrition, Boston Children’s Hospital, Harvard Medical School, Boston, MA, USA
- 5Division of Gastroenterology and Hepatology, Johns Hopkins School of Medicine, Baltimore, MD, USA
- 6Channing Division of Network Medicine, Brigham and Women’s Hospital, Harvard Medical School, Boston, MA, USA
Background: Recent animal studies have identified that dietary salt intake may modify the risk and progression of autoimmune disorders through modulation of the IL-23/TH17 pathway, which is critical in the pathogenesis of ulcerative colitis (UC) and Crohn’s disease (CD).
Methods: We conducted a prospective study of U.S. women enrolled in the Nurses’ Health Study (NHS) and NHSII who provided detailed and validated information on diet and lifestyle beginning in 1984 in NHS and 1991 in NHSII. We confirmed incident cases of UC and CD reported through 2010 in NHS and 2011 in NHSII. We used Cox proportional hazards models to calculate hazard ratios and 95% confidence intervals. In a case–control study nested within these cohorts, we evaluated the interaction between single nucleotide polymorphisms (SNPs) in genes involved in TH17 pathway and dietary potassium on risk of CD and UC. In a cohort of healthy volunteers, we also assessed the effect of supplemental potassium on development of naïve and memory T cells, differentiated with TGFβ1 or TH17 conditions.
Results: Among a total of 194,711 women over a follow-up of 3,220,247 person-years, we documented 273 cases of CD and 335 cases of UC. Dietary intake of potassium (Ptrend = 0.005) but not sodium (Ptrend = 0.44) was inversely associated with risk of CD. Although, both dietary potassium and sodium were not significantly associated with risk of UC, there was a suggestion of an inverse association with dietary potassium (Ptrend = 0.08). The association of potassium with risk of CD and UC appeared to be modified by loci involved in the TH17 pathway that have previously been associated with susceptibility to CD, particularly SNP rs7657746 (IL21) (Pinteraction = 0.004 and 0.01, respectively). In vitro, potassium enhanced the expression of Foxp3 in both naïve and memory CD4+ T cells via activating Smad2/3 and inhibiting Smad7 in TH17 cells.
Conclusion: Dietary potassium is inversely associated with risk of CD with both in vitro and gene–environment interaction data suggesting a potential role for potassium in regulating immune tolerance through its effect on Tregs and TH17 pathway.
Introduction
Inflammation bowel disease (IBD), comprised of Crohn’s disease (CD) and ulcerative colitis (UC), is a chronic inflammatory disorder of the gastrointestinal tract. Through identification of over 160 risk loci (1–3), genome-wide association (GWA) studies have identified a number of key pathways involved in the development of CD and UC, including the IL-23/TH17 axis, autophagy, and mucosal barrier function. However, it is estimated that the risk attributable to genetic predisposition alone is less than 25% (4), highlighting the importance of identifying environmental factors associated with IBD susceptibility. In addition, understanding the interrelationship between genetic markers and environmental factors, also known as gene–environment interaction, can provide insight into the etiopathogenesis of IBD.
Recently, animal studies have shown a role for dietary sodium in the development and progression of autoimmune disorders through inducing IL-23-IL-23R-mediated induction of pathogenic TH17 cells, which plays a critical role in development of IBD (5–7). In addition, sodium appears to not only enhance the induction of TH17 cells but also inhibit the suppressive functions of Foxp3+ Treg cells (8). Sodium may also lead to macrophage activation creating a more inflammatory environment (9). High salt levels inhibit alternative activation of macrophages (M2) resulting in attenuation of tissue inflammation (10). Similarly, sodium impairs Treg function by inducing IFNγ production in these cells. Taken together, these data point to a high sodium diet leading to an enhanced proinflammatory response through interference with both innate and adaptive regulatory mechanisms.
To date, there are limited data on the direct effect of potassium on effector and regulatory T cells. Nevertheless, human and animal data have also supported a link between potassium channels expressed in the intestinal epithelial cells and risk of development of CD or intestinal inflammation in animal models of colitis (11, 12). We therefore sought to prospectively examine the association between dietary intake of sodium and potassium and risk of incident CD and UC within the large, well-characterized Nurses’ Health Study (NHS) and NHSII cohorts. In addition, we aimed to better characterize these associations by examining gene–environment interactions using susceptibility loci previously identified through GWA studies with risk of CD and UC. Finally, we confirmed the functional significance of our findings through in vitro studies examining the effect of these minerals on regulatory and effector T cells.
Materials and Methods
Cohort Study: Dietary Sodium and Potassium and Risk of UC and CD
Study Population
The NHS is a prospective cohort study comprised of nearly 121,700 U.S. women, ages 30–55 years, who completed a mailed health questionnaire starting in 1976. Information on health information has since been updated every 2 years through follow-up questionnaires. NHSII is a similar cohort of 116,686 U.S. women between the ages of 25–42 years that was started in 1989. These women have been followed with similar biennial questionnaires. The Human Research Committee at Partners Healthcare approved this study.
Assessment of Diet
Dietary assessment was performed using a 161-item semi-quantitative food frequency questionnaire (SFFQ) starting in 1984 in NHS and updated in 1986 and every 4 years since. Similarly in NHSII, dietary intake was assessed using SFFQ staring in 1991 and updated every 4 years. We calculated nutrient intake from the number of servings of food items and U.S. Department of Agriculture data on the content of nutrients in specified portions. The reproducibility and validity (against dietary records) of the FFQs have been extensively documented (13, 14). All nutrient values were adjusted for total caloric intake by the residual method to estimate intakes independent of the amount of total intake. The correlation between energy-adjusted potassium obtained from FFQ and diet records was 0.53 (15). In addition, the correlation between dietary potassium obtained from FFQ and urinary secretion of potassium was 0.56 in men and 0.39 in women and that of sodium was 0.66 in men and 0.56 in women (16). For questionnaire cycles with no assessment of dietary intake, we carried forward data from the prior questionnaire cycle when this detailed assessment was done. However, we did not carry forward dietary information. Specifically, women with missing dietary data in a 2-year cycle when dietary data was specifically queried did not contribute person-year to the analyses.
Assessment of Other Covariates
Detailed information on lifestyle factors, including body weight, smoking status, use of non-steroidal anti-inflammatory drugs (NSAIDs), menopausal hormone therapy, and oral contraceptives were collected and updated in each questionnaire cycle. Information on physical activity was also estimated using an instrument administered every 2–4 years that has been described in detail (17). Participants’ self-report of body weight, height, physical activity, and use of oral contraceptives have been previously validated (18–20). In 1992, in NHS and 1991 in NHSII, women were also asked about their latitude of residence at age 30, which we have previously shown to be associated with risk of UC and CD (21). Information about history of appendectomy was collected in 1992 in NHS and 1995 in NHSII.
Information on ancestry was collected in the 1992 questionnaire in NHS and baseline questionnaire in NHSII. Specifically, women were asked whether they had the following ancestries: African, Asian, Hispanic, Scandinavian, southern European/Mediterranean, other white, or other ancestry. Most of women (93% in the NHS I, 91% in the NHSII) reported white ancestries, consistent with underrepresentation of minorities in healthcare at the inception of both cohorts. More than 90% of the women reported a single ancestry. Ancestry data were available in more than 95% of women in NHS and 99% of women in NHSII.
Outcome Ascertainment
Detailed information on confirmation of self-reported cases of CD and UC has been previously reported (17, 21, 22). Briefly, since 1976, participants have reported diagnoses of UC or CD through an open-ended response on biennial surveys. Diagnoses of UC and CD have also been specifically queried since 1982 and 1992, respectively. Similarly in NHSII, both diagnoses were specifically queried starting in 1993. Participants who reported diagnosis of CD or UC on any biennial questionnaire received a supplementary questionnaire. In addition, medical records from these participants were requested and reviewed by two gastroenterologists blinded to exposure information. We used standardized criteria to confirm cases of CD and UC (23–26).
Statistical Analysis
For analysis of dietary sodium, potassium, and food items, person-time for each participant was calculated from the date of return of their baseline questionnaires to the date of the diagnosis of UC or CD, date of last returned questionnaire, or June 1, 2010 for NHS and June 1, 2011 for NHSII, whichever came first. At baseline, we excluded participants with missing dietary data and history of IBD or cancer (with the exception of non-melanoma skin). We calculated adjusted hazard ratios (HRs) and 95% confidence intervals (CIs) using Cox proportional hazards modeling incorporating time-varying covariates. Consistent with prior analyses, information on BMI was derived from baseline questionnaire to avoid potential bias from changes in weight by preclinical disease (27, 28). Dietary sodium and potassium were modeled as quintiles while food items were modeled based on number of servings consistent with prior dietary analysis (28, 29). We observed no heterogeneity in the association of dietary sodium, potassium, and food items with CD or UC in separate analyses of NHS and NHSII (P for heterogeneity > 0.50 for both UC and CD). Thus, we pooled individual-level data from NHS and NHSII and adjusted for cohort in all analyses. We used the first quintile as the reference category and calculated the risk of CD and UC for each quintile of dietary sodium and potassium by comparing higher quintiles to the first quintile. Using previously described methods, we performed mediation analysis to determine whether the reported association of fiber intake on risk of CD was explained by intake of potassium (30). We used SAS version 9.3 (Cary, NC, USA) for all analyses.
Nested Case–Control Study: Dietary Potassium, TH17 Pathway and Risk of CD and UC
Study Population
In 1989–1990, 32,826 NHS participants (aged 43–69 years) returned a blood sample on ice packs by overnight courier and completed a short questionnaire (31). Between 1996 and 1999, 29,611 NHSII participants (aged 32–54 years) provided blood samples and completed a short questionnaire in a similar protocol (32). Similarly in 2001–2004, 29,684 participants in NHS and 29,859 participants in NHSII mailed in a sample of buccal cells collected using a “swish-and-spit” method. Participants who provided the buccal cells had not previously provided a blood specimen. Among participants who provided a blood or saliva specimen, we matched 169 CD cases to 740 controls and 202 UC cases to 740 controls based on age, menopausal status, month of blood collection, and fasting status. Genomic DNA was isolated from buccal cells or blood samples using conventional methods (33).
Genotyping and Computation of Risk Score
We used the most recent meta-analysis of GWA studies to identify six single nucleotide polymorphisms (SNPs) in genes involved in TH17 pathway that have previously been associated with risk of CD and UC: rs10758669 (JAK2), rs12942547 (STAT3), rs1819333 (CCR6), rs7657746 (IL21), rs3024505 (IL10), and rs11209026 (IL23R) (3). We directly genotyped these SNPs by 5′ nuclease assay (TaqMan®), using the ABI PRISM 7900HT Sequence Detection System (Applied Biosystems, Foster City, CA, USA). TaqMan® primers and probes were designed using the Primer Express® Oligo Design software v2.0 (ABI PRISM). The status of individual case–control status was not known to laboratory personnel. Genotyping procedures were validated using duplicates from nearly 10% of the samples; concordance was 100% for these samples. Primers, probes, and conditions for the genotyping assay are available upon request. We confirmed that all SNPs were in Hardy–Weinberg equilibrium among the controls using the Chi-square test (all P > 0.30).
We examined associations according to each of the TH17 pathway SNPs except rs11209026 (IL23R) due to low minor allele frequency (~7%). However, we also constructed two summary risk scores (one for each outcome) incorporating all six TH17 pathway SNPs associated with CD and UC risk using a previously described weighting method (34, 35). Briefly, each SNP was recoded as 0, 1, or 2 according to the number of alleles associated with increasing risk of CD or UC; each SNP was weighted by its relative effect size (β coefficient) derived from the previously reported meta-analysis data (separate β coefficient for UC and CD) (3). We constructed the genetic risk score using the equation: genetic risk score = (β1 × SNP1 + β2 × SNP2 + … + βn × SNPn)/(sum of the β coefficients).
Statistical Analysis
We used conditional logistic regression for risk of CD or UC with a multiplicative interaction term for dietary potassium and genotype in TH17 pathways defined according to the number of risk alleles while adjusting for other potential risk factors (see Assessment of Other Covariates). Since CD and UC are rare outcomes, we used odds ratios as estimates of relative risks. To minimize the potential influence of reverse causality, we analyzed prospectively collected data on diet from the questionnaires administered 4 years prior to diagnosis of CD or UC for cases and their matched controls. Although, there were no significant variations in allele frequency of genotyped risk variants according to European ancestry, we adjusted all models of gene–environment interaction for ancestry (see Assessment of Other Covariates). We used SAS version 9.3 (Cary, NC, USA) for these analyses. All P-values were two-sided and <0.05 was considered statistically significant. As the selection of the SNPs was done a priori and interaction with only five SNPs was tested, we did not adjust for multiple testing in our analyses.
Experimental In Vitro Studies: Effect of Potassium on TH17/Treg Cell Balance
In Vitro Human T Cell Differentiation and Intracellular Staining
After obtaining consent, we collected 10 cc of peripheral blood from 25 healthy volunteers, ages 18–35 years without history of HIV, tuberculosis, or any autoimmune diseases (e.g., rheumatoid arthritis, systemic lupus, etc.) and who were not taking steroids or other immunosuppressive medications. All experiments were performed in accordance to the approved guidelines of Human Ethics Committee of Translational Health Science and Technology Institute (THSTI), Faridabad, India.
Peripheral blood mononuclear cells (PBMCs) were isolated by Ficoll Paque density gradient centrifugation (GE Healthcare). Naïve CD4+ CD45RO−CD25− or memory CD4+CD45RO+ T cells were sorted as previously described (36). Sorted cells were cultured in 96-well U-bottom plates at a concentration of 0.1 × 10⁶ cells/ml in X-VIVO 15 medium (Lonza) supplemented with 100 units/ml Penicillin/Streptomycin, l-glutamine, NEAA, and Sodium Pyruvate. Cells were stimulated with plate bound anti-CD3 (UCHT1; 10 μg/ml), soluble anti-CD28 (28.2; 3.0 μg/ml), and were differentiated either with TGFβ1 (1 ng/ml) or with TH17 condition with addition of following cocktails: TGFβ1 (5.0 ng/ml; R&D), IL-6 (25 ng/ml; Peprotech), IL-1β (12.5 ng/ml; Peprotech), IL-21 (20 ng/ml; Peprotech), and IL-23 (20 ng/ml; Peprotech) for 6 days. Cells were supplemented with or without potassium chloride (Sigma Aldrich). On day 6, cells were stained with LIVE/DEAD Fixable Dead Cell Stain Kit (Invitrogen) according to manufacturer’s protocol. Cells were then fixed and permeabilized with BD Cytofix/Cytoperm and stained with anti-human Foxp3-PE antibody (BD Bioscience; 560082). Labeled cells were acquired on BD FACS Verse and analyzed by FlowJo (Treestar, USA). All FACS plots were gated on live cells.
CFSE T Cell Proliferation Assay
For proliferation assay, sorted naïve human CD4+ T cells (1 × 10⁶/ml) were labeled with 5.0 μM of CFSE in PBS at 37°C for 5 min. Cells were shaken intermittently in order to get homogenously labeled cell population. Cells were thoroughly washed with glutamine rich media (RPMI-1640) to wash off unlabeled dye. Cells were stimulated with plate bound anti-CD3 and soluble anti-CD28 in round bottom 96-well plate at a concentration of 0.1 × 10⁶/ml with and without KCl (40mM). On day 5, cells were washed extensively with 1× PBS and fixed and permeabilized with Foxp3 staining kit (eBiosciences; 00-5523-00) and were labeled with fluorescent-conjugated Foxp3 antibody (Biolegend, 320014) for 30–40 min on ice. Cells were also stained with live/dead marker to exclude dead population during analysis. Prism 5.0 was used for statistical analysis and differences were considered statistically significant with a P value of less than 0.05.
Taqman PCR and Gene Expression
RNA was isolated using RNAeasy mini kit [Qiagen (#74134)], and converted to cDNA using iScript cDNA synthesis kit [BioRad (#1708891)]. The Taqman primers used for this study were purchased from Applied Biosystems (Smad3 Hs00969210_m1, Smad2 Hs00183425_m1, Smad7 Hs00998193_m1, and SGK1 Hs00985033_g1 Taqman primers). The values are represented as the difference in Ct values normalized to GAPDH for each sample.
Detection of Phosphorylated Smad Proteins
Peripheral blood mononuclear cells were isolated from healthy volunteers and naïve and memory CD4+ T cells were sorted as described previously. Cells were stimulated for 1 h with plate bound anti-CD3 and soluble anti-CD28. Thereafter, cells were washed extensively with ice cold 1× PBS and stained with live dead stain (Thermo fisher) for exclusion of any dead cell population during analysis. Cells were fixed with 2% paraformaldehyde at 37°C for 20 min in order to cross link the phospho proteins. Cells were again washed twice with ice cold 1× PBS and permeabilized with 90% ice cold methanol at 4°C for 60 min. Cells were washed again and incubated with FACS buffer (PBS + 2% FCS) to prevent non-specific binding. Cells were stained with phospho Smad specific antibodies at 4°C for 40′ according to the manufacture’s recommendations. Finally, cells were stained with appropriate fluorescent-conjugated secondary antibodies, data were acquired by BD FACSVerse and analyzed by FlowJo. Following antibodies (phosphorylation sites included in parentheses) from Abcam were used: ab53100 (pSMAD2, pS467) and ab52903 (pSMAD3, pS423 + S425) for these experiments.
Results
Dietary Sodium and Potassium and Risk of UC and CD
Through 2011, we documented 273 cases of CD and 335 cases of UC among 194,711 women who contributed 3,220,247 person-years of follow-up. Compared to women in the lower quintiles of dietary potassium intake, women in the highest quintile were slightly older, more likely to live in a southern latitude, had a higher intake of daily fiber, and less likely to have never smoked (Table 1). There were no significant differences according to BMI, history of appendectomy, use of NSAIDs, oral contraceptives, or menopausal hormone therapy, and dietary sodium intake according to quintiles of potassium intake.
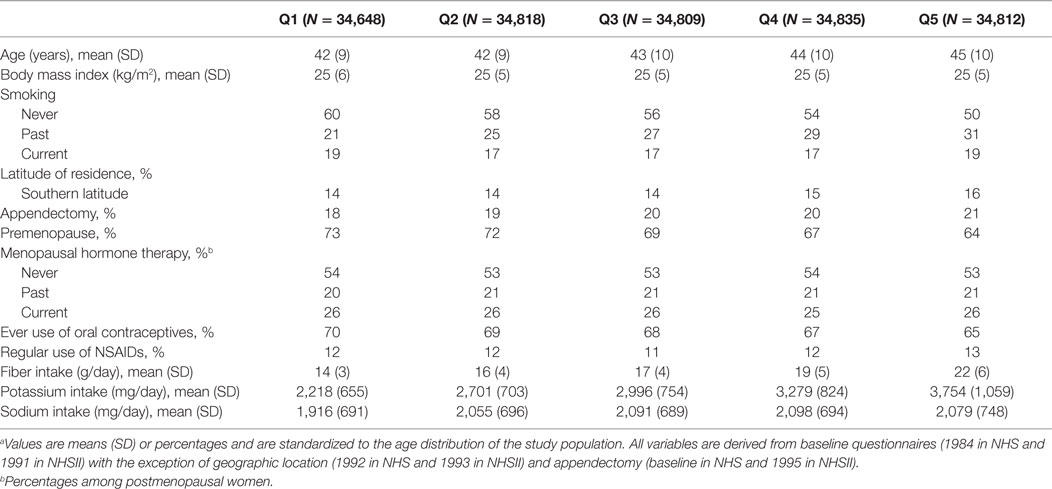
Table 1. Baseline characteristics of participants according to quintiles of total dietary potassium intake.a
Compared to women in the lowest quintile of dietary potassium intake, the multivariable-adjusted HRs for CD were 0.91 (95% CI, 0.64–1.29) for women in the second quintile, 0.77 (95% CI, 0.53–1.11) for the third quintile, 0.58 (95% CI, 0.38–0.88) for the fourth quintile, and 0.62 (95% CI, 0.40–0.95) for the highest quintile (Ptrend = 0.005) (Table 2). Similarly, dietary potassium was inversely associated with risk of UC, although the association did not reach statistical significance (Ptrend = 0.08). We did not find an association between dietary sodium and risk of CD (Ptrend = 0.44) or UC (Ptrend = 0.77) (Table 2).
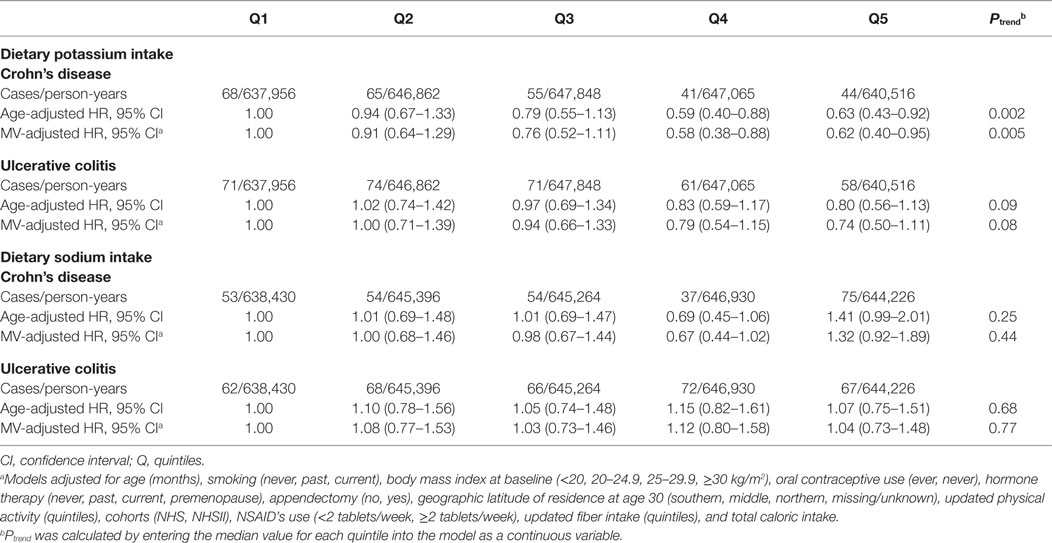
Table 2. Dietary sodium and potassium intake and risk of Crohn’s disease and ulcerative colitis.
We explored the possibility that pre-diagnosis symptoms may have altered dietary intake and therefore could account for our observed inverse association between dietary potassium and risk of CD. Thus, we performed sensitivity analysis using dietary data derived at least 4 years prior to each 2-year follow-up cycle and observed similar associations. Compared to women in the lowest quintile of dietary potassium, the multivariable-adjusted HR of CD among women in the highest quintile of dietary potassium was 0.60 (95% CI, 0.37–0.95) (Ptrend = 0.002). Similarly, we did not find an association between dietary potassium and risk of UC (Ptrend = 0.54). Compared to women in the lowest quintile of dietary potassium, the MV-adjusted HR of UC among women in the highest quintile was 1.00 (95% CI, 0.65–1.53).
We examined the possibility that specific food items with the highest contribution to dietary potassium and not cumulative daily potassium intake may explain our observed association and therefore examined the independent effect of skim milk (~9% of daily potassium), potato (~6% of daily potassium), and orange juice (~3% daily potassium) on risk of CD and UC. We did not observe any inverse association between orange juice, skim milk, and potato and risk of CD (all Ptrend > 0.20). Similarly, we did not observe an association between food items with the highest contribution to dietary potassium and risk of UC (all Ptrend > 0.50). In addition, we assessed the independent effect of supplements containing potassium such as multivitamins on risk of CD and UC and observed no associations (all Ptrend > 0.30).
As food items with high fiber content, particularly cruciferous vegetables, also contain large amounts of potassium, we hypothesized that previous inverse associations reported between dietary fiber intake and risk of CD may be mediated by potassium (29). In a mediation analysis, we estimate that, dietary potassium intake appeared to contribute to nearly 90% (95% CI, −32 to 210%) of the association of fiber intake on CD. Specifically, the risk of CD with each one-category increase in quintile category of fiber intake was 0.92 (95% CI, 0.85–1.00) before adjustment for potassium (hypothesized intermediate) and 0.99 (95% CI, 0.89–1.10) after adjustment. However, a formal test of mediation did not reach statistical significance (P = 0.15).
Interaction between Dietary Potassium and SNPs in TH17 Pathway
We explored the possibility of gene–environment interaction between dietary potassium and the TH17 pathway on risk of CD and UC in our nested case–control study (Table 3). Similar to our primary analyses, dietary potassium appears to to be inversely associated with risk of CD but not UC. Specifically, each 200 mg increase in dietary of potassium was associated with a 7% reduction in risk of CD (OR = 0.93, 95% CI, 0.86–1.00). Although we did not observe a significant interaction between dietary potassium and specific SNPs in STAT3, JAK2, CCR6, and IL10 (all Pinteraction > 0.15), the association of dietary potassium with risk of CD appeared to be modified by rs7657746 (IL21) (Pinteraction = 0.004). Among participants with GG genotype, each 200 mg increase in dietary potassium was associated with an increased risk of CD (OR = 1.58, 95% CI, 1.15–2.16). In contrast, each 200 mg increase in dietary potassium was associated with an OR for CD of 0.96 (95% CI, 0.86–1.07) among individuals with GA genotypes and 0.90 (95% CI, 0.82–0.98) among individuals with AA genotypes. We also constructed a genetic risk score comprised of the number of CD or UC susceptibility alleles associated with the TH17 pathway on risk of CD. An interaction between dietary potassium and this genetic risk score approached statistical significance (Pinteraction = 0.06). In addition, we observed a similar interaction between dietary potassium and rs7657746 (IL21) on risk of UC (Pinteraction = 0.01). Particularly, similar to CD, among participants with CC genotype, each 200 mg increase in dietary potassium was associated with an OR for UC of 0.90 (0.83–0.98).
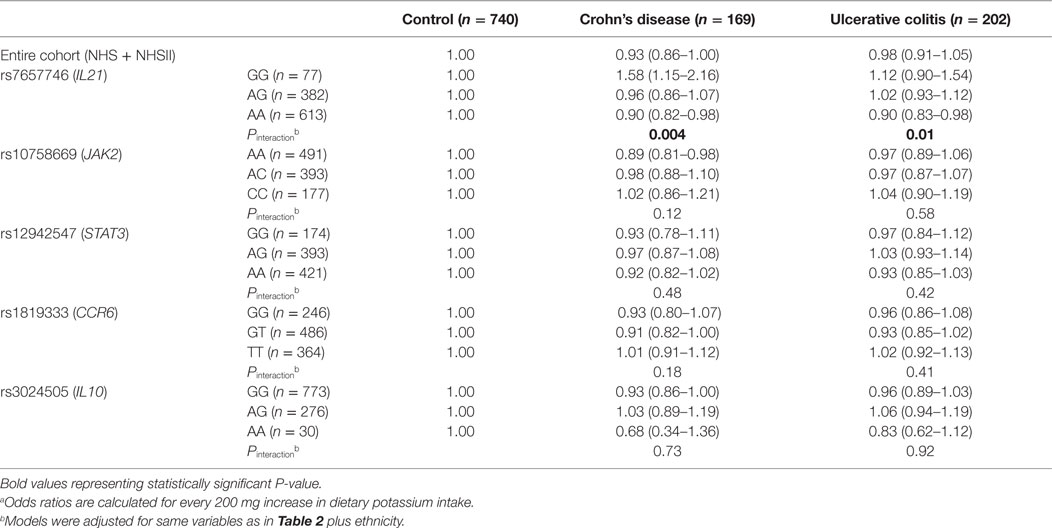
Table 3. Risk of Crohn’s disease and ulcerative colitis according to dietary potassium intake in strata of SNPs in TH17 Pathways.a
Effect of Extracellular Potassium on Generation of Foxp3+ Treg Cells
Immune activation and tolerance in autoimmune diseases are mediated by the interactions between genes and environment. Experimental data suggest that higher physiologic salt concentration enhances the induction of proinflammatory TH17 cells in mice and humans (5–7). More recently, it has also been demonstrated that high salt diet inhibits the suppressive functions of Treg cells (8). Based on our findings in the NHS cohorts and in light of animal and human studies that have supported a role for sodium on regulation of immune tolerance and development of autoimmunity, we hypothesized that potassium, in contrast to sodium, may have an opposing effect on regulatory and effector T cells. To test our hypothesis, we activated the naïve CD4+ T cells in the presence of potassium and tested their proliferation. Potassium concentrations were selected based on its known physiologic concentrations in the gut lumen, mucosal cells, and extracellular fluids (37). As expected, potassium suppressed the T cells proliferation and induced Foxp3 expression (Figures 1A,B). Since TGF-β1 induces the generation of Foxp3+ Tregs cells, next we tested whether potassium can further enhance the induction of TGF-β-induced Foxp3+ Tregs cells. To do this, we activated the sorted naïve human T cells with TGF-β1 in the presence and absence of potassium. As previously suggested, TGF-β1 treatment induced the expression of Foxp3 (~11%). Moreover, the addition of potassium further enhanced the generation of TGF-β-induced Foxp3+ Treg cells (from ~11% to ~31%) (Figure 1C). We further tested whether the enhancing effect of potassium on induction of Foxp3 expression is restricted to naïve CD4+ T cells. Addition of potassium also enhanced the generation of TGF-β1-induced Foxp3+ Treg cells (~ 21% to ~ 46%) (Figure 1C). Potassium at various concentrations also enhanced Foxp3 expression in sorted naïve and memory cells derived from healthy individuals cultured with TGF-β1 (Figures 1D,E). With 10mM of KCl, the expression of Foxp3 was nearly doubled (~7% to ~12%), and further enhanced to nearly threefold with 40 mM KCl (from ~7% to ~20%) (Figure 1E). We observed a similar effect on TGF-β1-induced Foxp3 expression on sorted memory CD4+ T cells.
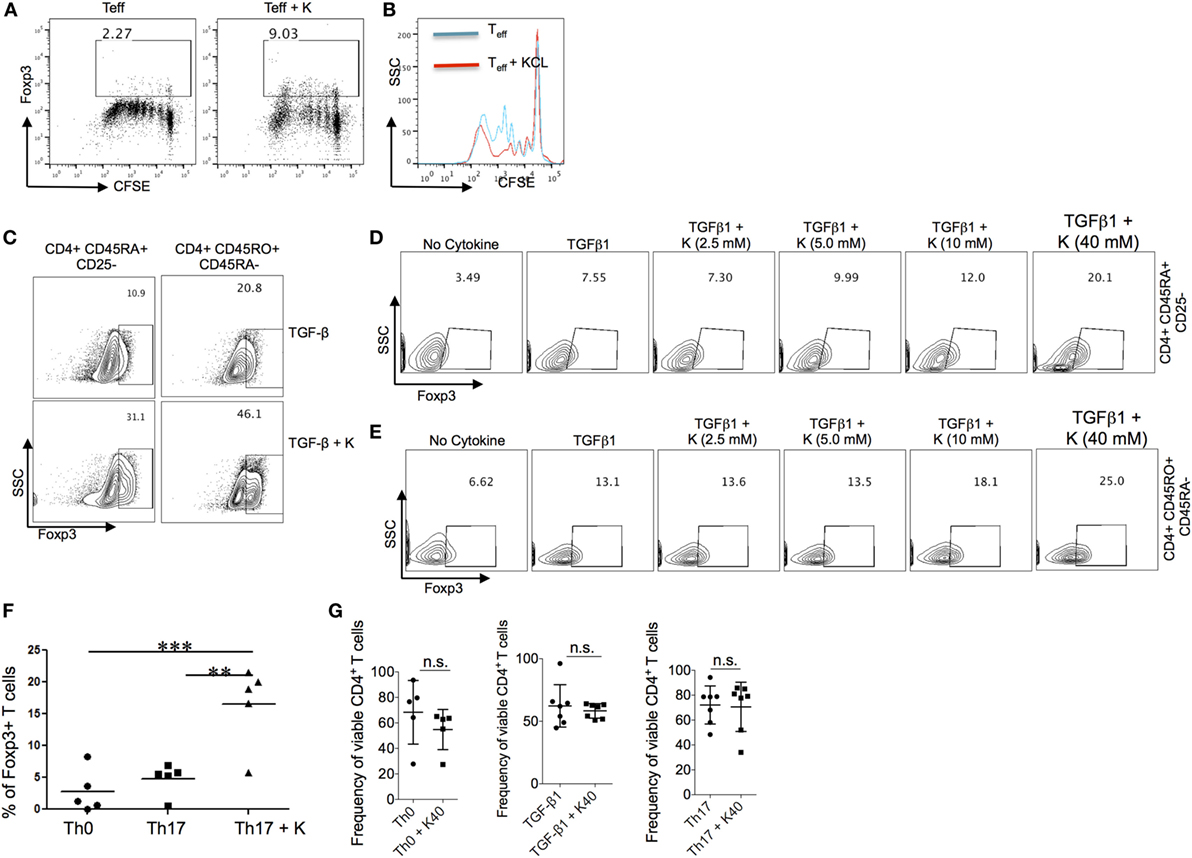
Figure 1. Effect of extracellular potassium on generation of Foxp3+ Treg cells. (A,B) Naïve (CD4+ CD45RO−CD25−) and memory (CD4+CD45RO+) CD4+ T cells were sorted and stimulated in vitro with anti-CD3 and anti-CD28 in presence of KCl (40mM) and CFSE, and Foxp3 expression was determined by intracellular staining and analyzed by flow cytometry after 6 days in vitro. (C) Naïve (CD4+ CD45RO−CD25−) and memory (CD4+CD45RO+) CD4+ T cells were sorted and stimulated in vitro with anti-CD3 and anti-CD28 in presence of TGF-β (2 ng/ml) with and without KCl (40mM), Foxp3 expression was determined by intracellular staining and analyzed by flow cytometry after 6 days in vitro. (D,E) Naïve (CD4+ CD45RO−CD25−) and memory (CD4+CD45RO+) CD4+ T cells were sorted and were stimulated in vitro with anti-CD3 and anti-CD28 in presence of TGF-β (2 ng/ml) and indicated doses of KCl, after 5–6 days, culture cells were analyzed for the intracellular levels of Foxp3 protein by flow cytometry. (F) Sorted naïve human CD4+ T cells were activated with anti-CD3 and anti-CD28, cells were polarized into TH17 conditions (TGF-β1 + IL-6 + IL-21 + IL-23 + IL-1β) in vitro either in normal media or media containing potassium (40mM), polarized TH17 cells were analyzed by flow cytometry after 6 days for percentage of Foxp3-expressing CD4+ T cells. Data are a cumulative plot of five individuals, each dot represents one individual (n = 5). Error bars SD **P < 0.01, ***P < 0.001 (Student’s t-test). (G) Naïve CD4+ T cells were activated with anti-CD3 and anti-CD28, cells were either polarized into TH17 culture condition (TGF-β1 + IL-6 + IL-21 + IL-23 + IL-1β) or TGF-β1 alone or without any cytokines (TH0) either in normal media or media containing potassium (40mM), cells were analyzed by flow cytometry for live/dead stain (Life technologies) by cell viability assay and represented as frequency of viable CD4+ T cells. Data are a cumulative plot of six to seven individuals. Each dot represents one individual. n.s., non-significant.
TGF-β1 is a common differentiation factor for the generation of TH17 and Foxp3+-induced regulatory T cells (iTregs) cells. Proinflammatory cytokines, IL-6, IL-1β, IL-21, and IL-23 suppress the generation of TGF-β1-induced Treg cells by inhibiting the expression of Foxp3, which in turn favor development of TH17 cells. Since potassium enhanced the generation of Foxp3+ Tregs induced by TGF-β1, we tested whether potassium can suppress the inhibitory effect of TH17 cells inducing cytokines such as IL-6 and IL-1β, and therefore reinforce the expression of Foxp3 in TH17 cells. The addition of potassium in TH17 culture condition overcame the inhibitory effect of IL-6/IL-1β on Foxp3+ Tregs and reinforced the expression of Foxp3 in TH17 cells (Figure 1F). We also evaluated whether high doses of potassium in these assays may induce T cells death. Sorted T cells were cultured in the presence or absence of 40 mM potassium and tested their viability. We did not find any difference in the viability of T cells cultured with or without potassium (Figure 1G). Taken together these results demonstrate that potassium, in contrast to sodium, enhances the generation of Foxp3+ Treg cells without affecting the cell viability.
Mechanism of Potassium-Mediated Generation of Foxp3+ Tregs
We explored the potential mechanisms by which potassium enhanced expression of Foxp3 by evaluating its effect on Smad pathway. It is known that Smad2/3 pathway is critically essential for TGF-β1-mediated induction of Foxp3 while inhibition of Smad7 is crucial for generating and maintaining Treg phenotype (38–40). Smad2/Smad3 double deficient mice develop fatal inflammatory diseases with reduction in Foxp3 expression in CD4+ T cells while Smad2 deficiency make mice susceptible to DSS induced colitis (39). In addition, Smad7 appears to be over-expressed in purified mucosal T cells from CD patients and its inhibition restores TGF-β1 signaling by enhancing the functions of Smad3 (40). Interestingly, oral SMAD7 antisense oligonucleotide was recently successfully used for treatment of CD in randomized clinical trial (41).
Since potassium enhanced the function of TGF-β1 in inducing the expression of Foxp3, we tested the effect of potassium on Smad2, Smad3, and Smad7 in human T cells by measuring its phosphorylation in TH17 cells. We found that potassium increased phosphorylation of Smad2 in TH17 cells (Figure 2A) and enhanced expression of total Smad2 in TH17 cells (Figure 2B). To further confirm this observation, we also tested the mRNA expression of Smad2 in TH17 cells. Potassium significantly increased the expression of Smad2 in TH17 cells (Figure 2C) and phosphorylation and expression of Smad3 (Figures 2D–F). Since the absence of Smad7 is required for the positive auto-regulatory loop of TGF-β1 on regulatory T cells, we explored whether potassium also suppresses the expression of Smad7 in TH17 cells. Potassium significantly suppressed the expression of Smad7 in TH17 cells (Figure 2G), which may in turn reinforce the expression of Foxp3 and Treg cells phenotypes. Taken together, these observations imply that exposure of potassium to T cells increased the generation of Foxp3 by activating Smad2/3 and inhibiting Smad7 expression.
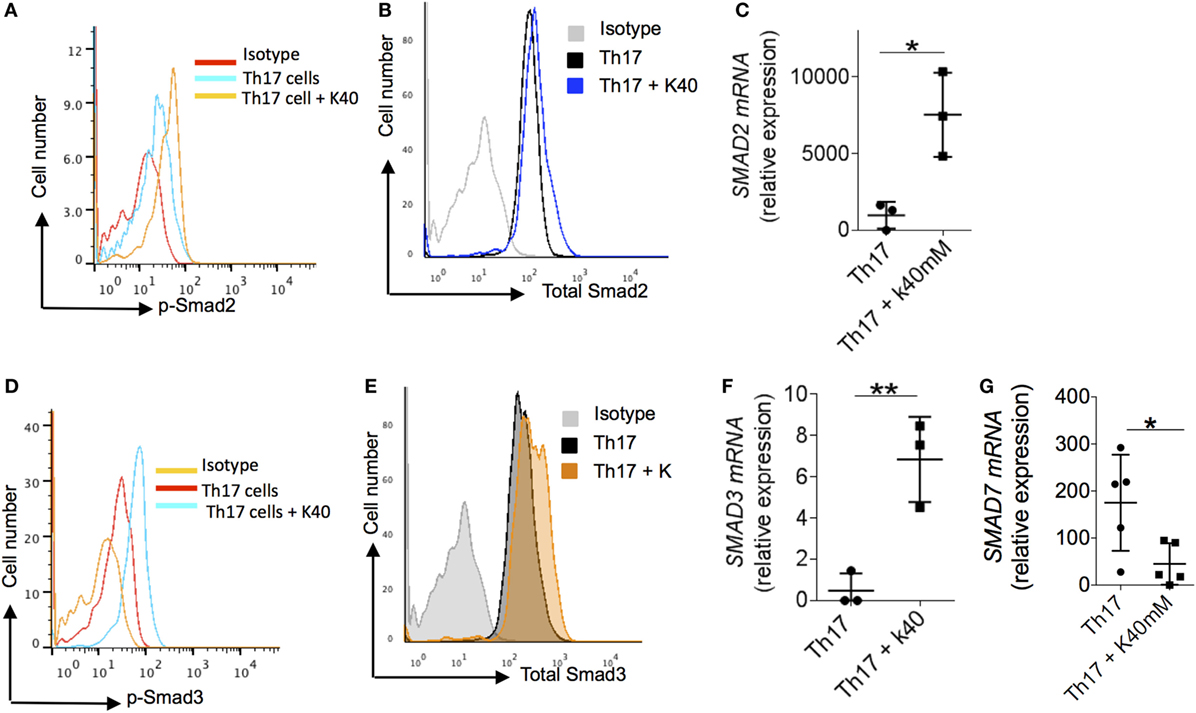
Figure 2. Mechanism of extracellular potassium-mediated generation of Treg. (A–C) Naïve (CD4+ CD45RO−CD25−) CD4+ T cells were sorted from total PBMCs, cells were stimulated in vitro with anti-CD3 and anti-CD28 and polarized into TH17 cells with and without potassium (40mM). After 24 h of in vitro polarization, cells were analyzed by flow cytometry for the phosphorylated levels of Smad2 (B) and total levels of Smad2 protein (C). Cells were analyzed at 48 h for the expression of Smad2 mRNA by q-RT PCR (D), data are a cumulative representative plot of three individuals (n = 3), each dot represents one individual. *P < 0.05 (Student’s t-test). (E,F) Naïve (CD4+ CD45RO−CD25−) CD4+ T cells were sorted from total PBMCs. Cells were stimulated in vitro with anti-CD3 and anti-CD28 and polarized into TH17 cells with or without potassium (40mM). After 24 h of in vitro polarization, cells were analyzed by flow cytometry for the phosphorylation of Smad3 (E) and total levels of Smad2 protein (F) and mRNA expression was analyzed at 48 h for the Smad3 by q-RT PCR, data are a cumulative representative plot of three individuals (n = 3), each dot represents one individual, **P < 0.01 (Student’s t-test). (G) Naïve (CD4+ CD45RO−CD25−) CD4+ T cells were sorted from total PBMCs and in vitro stimulated with anti-CD3 and anti-CD28 with TH17 culture condition with or without potassium (40mM). After 48 h of activation, cells were analyzed by q-RT PCR of Smad7 mRNA. Representative plot of five individuals (n = 5), each dot represents one individual, *P < 0.05 (Student’s t-test).
Discussion
In two large prospective cohorts of U.S. women, we show that dietary potassium, but not sodium, is inversely associated with risk of CD. Notably, we observed a significant interaction between dietary potassium and rs7657746 (IL21) in the TH17 pathway, supporting a biological mechanism that may mediate the effect of potassium on development of CD. IL-21 plays a key role in development of TH17 cells through STAT3, a transcription factor required for the differentiation of TH17 cells in vivo (42). IL-21 and IL-23 induce the orphan nuclear receptor RORγ, which in synergy with STAT3 promotes IL-17 expression in CD4+ T cells, leading to induction of TH17 cells (42). In addition, IL-21 inhibits the generation of FoxP3+ Treg induced by TGF-β to induce TH17 cells. We corroborated our findings by showing in vitro that potassium regulates Treg/TH17 balance through induction of Foxp3 expression in naïve and memory T cells as well as TH17 cells even in the presence of proinflammatory cytokines. This effect appeared to be mediated through increase in both phosphorylation and expression of Smad2 and Smad3 and suppression of Smad7 expression.
In contrast to potassium, recent data have shown a proinflammatory role for sodium mediated by the induction and generation of pathogenic TH17 cells in human and mice (5, 6). Moreover, a high sodium diet enhances the susceptibility of tissue inflammation in experimental autoimmune encephalomyelitis in animal models with augmented TH17 cell response (5). Interestingly, the proinflammatory effect of sodium appears to be further enhanced through marked reduction in Foxp3+ Tregs functions (8). TH17 cells and Tregs can be induced reciprocally, as TGF-β alone generates Tregs by inducing the expression of Foxp3 while addition of IL-6 together with TGF-β suppresses the expression of Foxp3 and generates IL-17-producing TH17 cells (43). In contrast to the effect of sodium on TH17 cells and Tregs, our findings show that potassium not only enhances the induction of Foxp3 induced by TGF-β1 but also reinforces Foxp3 expression in TH17 cells suggesting a possible anti-inflammatory function of potassium via induction of Foxp3-mediated T cells tolerance.
Consistent with our observation that potassium may have anti-inflammatory effects on activated TH17 cells, Wen and colleagues recently demonstrated that potassium supplementation in healthy volunteers blocks IL-17 production by T cells previously treated with sodium. Interestingly, the effect appears to be mediated through the direct suppression of p38/MAPK-SGK1 pathway (44). As SGK1 has a critical role in the induction of pathogenic TH17 cells in response to modest increase in sodium concentration (6), it appears that the balance between TH17 and Treg cells may in part be regulated by concentration of sodium and potassium. In support of this hypothesis, we also demonstrate that potassium supplementation, in contrast to sodium, inhibits the expression of SGK1 (Figure S1 in Supplementary Material). Similar to our findings, a recent study by Eil and colleagues also demonstrated the profound suppressive effect of potassium, released into the extracellular fluid as a result of necrosis in human tumors, on T cell effector function (45).
The plasticity of TH17 and Treg cells is well established as human Tregs, in a given proinflammatory environment can adopt TH17 phenotype and express IL-17 (46–48). Similarly, Foxp3-expressing human TH17 cells retain suppressive functions (47). Our data therefore suggest that potassium induces the TH17-Tregs plasticity by inducing Foxp3 in TH17 cells. Whether potassium-mediated induction of Foxp3 into TH17 cells leads these cells to develop a suppressive phenotype is the topic of future work. Lastly, IL-21 appears to play a key role in development of TH17 cells through STAT3, a transcription factor required for the differentiation of TH17 cells in vivo (42). However, it is not clear whether our gene–environment interaction data suggest a specific role for IL-21 in potassium-mediated induction of Foxp3.
Our study has several notable strengths, including prospectively collected and updated information on diet and other important life style factors, corroborative findings from gene–environment interactions, and compelling correlative in vitro functional studies. Taken together, these provide complementary lines of evidence that enhance the likelihood that the association between dietary potassium and IBD is causal. We acknowledge limitations of our study, including measurement errors arising from use of FFQs to estimate dietary potassium and sodium and a limited sample size in our analyses of gene–environment interaction. Lastly, we acknowledge that potassium concentration is tightly regulated in the extracellular fluids (~5 mEq/L). However, its concentration in the gut lumen and the mucosal cells vary significantly (16–130 mEg/L), therefore, concentrations (2.5–40 mM) used in our in vitro experiments appear to be in physiologic range. In addition, similar concentrations were used in recent study evaluating the inhibitory effect of potassium on antitumor T cell response (45).
In conclusion, we show that dietary potassium is inversely associated with risk of CD with both in vitro and gene–environment interaction data suggesting a potential role for potassium in regulating immune tolerance through its effect on Tregs and TH17 pathway. To our knowledge this is the first study demonstrating a potential interaction between dietary intake, genetic risk, and immune function on risk of developing CD. Further research to better elucidate the precise mechanisms by which dietary potassium may modulate immune tolerance through regulating the TH17/Tregs balance is warranted. Finally, investigating a role for dietary potassium in modulating disease activity among patients with established CD and specific genotype should be a high priority.
Ethics Statement
This study was carried out in accordance with the recommendations of “Human Research Committee at Partners Healthcare” with written informed consent from all subjects. All subjects gave written informed consent in accordance with the Declaration of Helsinki. The protocol was approved by the “Human Research Committee at Partners Healthcare.”
Data Sharing
Requests for access to data, statistical code, questionnaires, and technical processes may be made by contacting the corresponding author ataGtoYWxpbGlAbWdoLmhhcnZhcmQuZWR1.
Author Contributions
HK – study concept and design; statistical analysis; interpretation of data; and drafting of the manuscript. SM – experimental design and interpretation of data. ANA – acquisition of data and critical revision of the manuscript. JG – acquisition of data and critical revision of the manuscript. LH – acquisition of data and critical revision of the manuscript. AJ – statistical analysis; interpretation of data; and critical revision of the manuscript. JP – acquisition of data and critical revision of the manuscript. JR – acquisition of data and critical revision of the manuscript. KS – statistical analysis; interpretation of data; and critical revision of the manuscript. GC – acquisition of data; interpretation of data; and critical revision of the manuscript. AA – study concept and design; acquisition of data; drafting of the manuscript; and critical revision of the manuscript. VY – study concept and design and critical revision of the manuscript. AC – study concept and design and critical revision of the manuscript.
Conflict of Interest Statement
Dr. AA is a member of the scientific advisory board for Exact Sciences, Abbvie, and Cubist Pharmaceuticals. Dr. JR is a consultant for Policy Analysis, Inc. Dr. AC has served as a consultant for Bayer Healthcare, Pfizer Inc., and Aralez Pharmaceuticals. Other authors have no financial disclosures. Dr. GC is a consultant for Allena Pharmaceuticals and Astra Zeneca. The other authors declare no conflict of interest.
Funding
This study was funded by R01 CA050385, P01 CA87969, CA49449, CA67262, P30 DK043351, K23 DK099681, K08 DK064256, K24 DK098311, K24 DK91417, K23 DK091742, UM1 CA176726, UM1 CA186107, and India Alliance DBT-Wellcome Trust fellowship (IA/I/12/1/500524). Dr. AC is supported by a senior investigator grant from the Crohn’s and Colitis Foundation of America (CCFA). Dr. HK is supported by a career development award from the American Gastroenterological Association (AGA) and by National Institute of Diabetes and Digestive and Kidney Diseases (K23 DK099681). Dr. LH is supported by National Institute of Diabetes and Digestive and Kidney Diseases (K08 DK064256). Dr. AA is supported by DBT-Wellcome Trust Intermediate fellowship and Sakshi Malik is supported by a fellowship from Council of Scientific and Industrial Research (CSIR), Govt. of India.
Supplementary Material
The Supplementary Material for this article can be found online at http://journal.frontiersin.org/article/10.3389/fimmu.2016.00554/full#supplementary-material.
Figure S1. Naïve (CD4+CD45RA+CD45RO−) CD4+ T cells were sorted from total PBMCs, cells were stimulated in vitro with anti-CD3 and anti-CD28 and polarized into TH17 cells with and without potassium as indicated, cells were analyzed at 48 h for the expression of SGK1 mRNA by q-RT PCR, data are a cumulative representative plot of three individuals (n = 3). Each dot represents one individual. *P < 0.05 (Student’s t-test).
References
1. Anderson CA, Boucher G, Lees CW, Franke A, D’Amato M, Taylor KD, et al. Meta-analysis identifies 29 additional ulcerative colitis risk loci, increasing the number of confirmed associations to 47. Nat Genet (2011) 43:246–52. doi: 10.1038/ng.764
2. Franke A, McGovern DP, Barrett JC, Wang K, Radford-Smith GL, Ahmad T, et al. Genome-wide meta-analysis increases to 71 the number of confirmed Crohn’s disease susceptibility loci. Nat Genet (2010) 42:1118–25. doi:10.1038/ng.717
3. Jostins L, Ripke S, Weersma RK, Duerr RH, McGovern DP, Hui KY, et al. Host-microbe interactions have shaped the genetic architecture of inflammatory bowel disease. Nature (2012) 491:119–24. doi:10.1038/nature11582
4. Abraham C, Cho JH. Inflammatory bowel disease. N Engl J Med (2009) 361:2066–78. doi:10.1056/NEJMra0804647
5. Kleinewietfeld M, Manzel A, Titze J, Kvakan H, Yosef N, Linker RA, et al. Sodium chloride drives autoimmune disease by the induction of pathogenic TH17 cells. Nature (2013) 496:518–22. doi:10.1038/nature11868
6. Wu C, Yosef N, Thalhamer T, Zhu C, Xiao S, Kishi Y, et al. Induction of pathogenic TH17 cells by inducible salt-sensing kinase SGK1. Nature (2013) 496:513–7. doi:10.1038/nature11984
7. Yosef N, Shalek AK, Gaublomme JT, Jin H, Lee Y, Awasthi A, et al. Dynamic regulatory network controlling TH17 cell differentiation. Nature (2013) 496:461–8. doi:10.1038/nature11981
8. Hernandez AL, Kitz A, Wu C, Lowther DE, Rodriguez DM, Vudattu N, et al. Sodium chloride inhibits the suppressive function of FOXP3+ regulatory T cells. J Clin Invest (2015) 125:4212–22. doi:10.1172/JCI81151
9. Zhang WC, Zheng XJ, Du LJ, Sun JY, Shen ZX, Shi C, et al. High salt primes a specific activation state of macrophages, M(Na). Cell Res (2015) 25:893–910. doi:10.1038/cr.2015.87
10. Binger KJ, Gebhardt M, Heinig M, Rintisch C, Schroeder A, Neuhofer W, et al. High salt reduces the activation of IL-4- and IL-13-stimulated macrophages. J Clin Invest (2015) 125:4223–38. doi:10.1172/JCI80919
11. Simms LA, Doecke JD, Roberts RL, Fowler EV, Zhao ZZ, McGuckin MA, et al. KCNN4 gene variant is associated with ileal Crohn’s disease in the Australian and New Zealand population. Am J Gastroenterol (2010) 105:2209–17. doi:10.1038/ajg.2010.161
12. Strøbæk D, Brown DT, Jenkins DP, Chen YJ, Coleman N, Ando Y, et al. NS6180, a new K(Ca) 3.1 channel inhibitor prevents T-cell activation and inflammation in a rat model of inflammatory bowel disease. Br J Pharmacol (2013) 168:432–44. doi:10.1111/j.1476-5381.2012.02143.x
13. Rimm EB, Giovannucci EL, Stampfer MJ, Colditz GA, Litin LB, Willett WC. Reproducibility and validity of an expanded self-administered semiquantitative food frequency questionnaire among male health professionals. Am J Epidemiol (1992) 135:1114–26; discussion 27–36.
14. Willett WC, Sampson L, Stampfer MJ, Rosner B, Bain C, Witschi J, et al. Reproducibility and validity of a semiquantitative food frequency questionnaire. Am J Epidemiol (1985) 122:51–65.
15. Willett WC, Sampson L, Browne ML, Stampfer MJ, Rosner B, Hennekens CH, et al. The use of a self-administered questionnaire to assess diet four years in the past. Am J Epidemiol (1988) 127:188–99.
17. Khalili H, Ananthakrishnan AN, Konijeti GG, Liao X, Higuchi LM, Fuchs CS, et al. Physical activity and risk of inflammatory bowel disease: prospective study from the Nurses’ Health Study cohorts. BMJ (2013) 347:f6633. doi:10.1136/bmj.f6633
18. Hunter DJ, Manson JE, Colditz GA, Chasan-Taber L, Troy L, Stampfer MJ, et al. Reproducibility of oral contraceptive histories and validity of hormone composition reported in a cohort of US women. Contraception (1997) 56:373–8. doi:10.1016/S0010-7824(97)00172-8
19. Troy LM, Hunter DJ, Manson JE, Colditz GA, Stampfer MJ, Willett WC. The validity of recalled weight among younger women. Int J Obes Relat Metab Disord (1995) 19:570–2.
20. Wolf AM, Hunter DJ, Colditz GA, Manson JE, Stampfer MJ, Corsano KA, et al. Reproducibility and validity of a self-administered physical activity questionnaire. Int J Epidemiol (1994) 23:991–9. doi:10.1093/ije/23.5.991
21. Khalili H, Huang ES, Ananthakrishnan AN, Higuchi L, Richter JM, Fuchs CS, et al. Geographical variation and incidence of inflammatory bowel disease among US women. Gut (2012) 61:1686–92. doi:10.1136/gutjnl-2011-301574
22. Khalili H, Higuchi LM, Ananthakrishnan AN, Richter JM, Feskanich D, Fuchs CS, et al. Oral contraceptives, reproductive factors and risk of inflammatory bowel disease. Gut (2013) 62(8):1153–9. doi:10.1136/gutjnl-2012-302362
23. Loftus EV Jr, Silverstein MD, Sandborn WJ, Tremaine WJ, Harmsen WS, Zinsmeister AR. Crohn’s disease in Olmsted County, Minnesota, 1940-1993: incidence, prevalence, and survival. Gastroenterology (1998) 114:1161–8.
24. Loftus EV Jr, Silverstein MD, Sandborn WJ, Tremaine WJ, Harmsen WS, Zinsmeister AR. Ulcerative colitis in Olmsted County, Minnesota, 1940-1993: incidence, prevalence, and survival. Gut (2000) 46:336–43.
25. Fonager K, Sorensen HT, Rasmussen SN, Moller-Petersen J, Vyberg M. Assessment of the diagnoses of Crohn’s disease and ulcerative colitis in a Danish hospital information system. Scand J Gastroenterol (1996) 31:154–9. doi:10.3109/00365529609031980
26. Moum B, Vatn MH, Ekbom A, Fausa O, Aadland E, Lygren I, et al. Incidence of inflammatory bowel disease in southeastern Norway: evaluation of methods after 1 year of registration. Southeastern Norway IBD Study Group of Gastroenterologists. Digestion (1995) 56:377–81.
27. Hu FB, Willett WC, Li T, Stampfer MJ, Colditz GA, Manson JE. Adiposity as compared with physical activity in predicting mortality among women. N Engl J Med (2004) 351:2694–703. doi:10.1056/NEJMoa042135
28. Cho E, Chen WY, Hunter DJ, Stampfer MJ, Colditz GA, Hankinson SE, et al. Red meat intake and risk of breast cancer among premenopausal women. Arch Intern Med (2006) 166:2253–9. doi:10.1001/archinte.166.20.2253
29. Ananthakrishnan AN, Khalili H, Konijeti GG, Higuchi LM, de Silva P, Korzenik JR, et al. A prospective study of long-term intake of dietary fiber and risk of Crohn’s disease and ulcerative colitis. Gastroenterology (2013) 145:970–7. doi:10.1053/j.gastro.2013.07.050
30. Lin DY, Fleming TR, De Gruttola V. Estimating the proportion of treatment effect explained by a surrogate marker. Stat Med (1997) 16:1515–27. doi:10.1002/(SICI)1097-0258(19970715)16:13<1515::AID-SIM572>3.3.CO;2-T
31. Hankinson SE. Circulating levels of sex steroids and prolactin in premenopausal women and risk of breast cancer. Adv Exp Med Biol (2008) 617:161–9. doi:10.1007/978-0-387-69080-3_15
32. Tworoger SS, Sluss P, Hankinson SE. Association between plasma prolactin concentrations and risk of breast cancer among predominately premenopausal women. Cancer Res (2006) 66:2476–82. doi:10.1158/0008-5472.CAN-05-3369
33. Garcia-Albeniz X, Nan H, Valeri L, Morikawa T, Kuchiba A, Phipps AI, et al. Phenotypic and tumor molecular characterization of colorectal cancer in relation to a susceptibility SMAD7 variant associated with survival. Carcinogenesis (2013) 34:292–8. doi:10.1093/carcin/bgs335
34. Li S, Zhao JH, Luan J, Ekelund U, Luben RN, Khaw KT, et al. Physical activity attenuates the genetic predisposition to obesity in 20,000 men and women from EPIC-Norfolk prospective population study. PLoS Med (2010) 7(8)::e1000332. doi:10.1371/journal.pmed.1000332
35. Qi Q, Chu AY, Kang JH, Jensen MK, Curhan GC, Pasquale LR, et al. Sugar-sweetened beverages and genetic risk of obesity. N Engl J Med (2012) 367:1387–96. doi:10.1056/NEJMoa1203039
36. Beriou G, Bradshaw EM, Lozano E, Costantino CM, Hastings WD, Orban T, et al. TGF-beta induces IL-9 production from human Th17 cells. J Immunol (2010) 185:46–54. doi:10.4049/jimmunol.1000356
37. Spencer RP. Potassium metabolism and gastrointestinal function; a review; a semiquantitative approach. Am J Dig Dis (1959) 4:145–58. doi:10.1007/BF02231235
38. Fantini MC, Becker C, Monteleone G, Pallone F, Galle PR, Neurath MF. Cutting edge: TGF-beta induces a regulatory phenotype in CD4+CD25- T cells through Foxp3 induction and down-regulation of Smad7. J Immunol (2004) 172:5149–53. doi:10.4049/jimmunol.172.9.5149
39. Takimoto T, Wakabayashi Y, Sekiya T, Inoue N, Morita R, Ichiyama K, et al. Smad2 and Smad3 are redundantly essential for the TGF-beta-mediated regulation of regulatory T plasticity and Th1 development. J Immunol (2010) 185:842–55. doi:10.4049/jimmunol.0904100
40. Monteleone G, Kumberova A, Croft NM, McKenzie C, Steer HW, MacDonald TT. Blocking Smad7 restores TGF-beta1 signaling in chronic inflammatory bowel disease. J Clin Invest (2001) 108:601–9. doi:10.1172/JCI12821
41. Monteleone G, Neurath MF, Ardizzone S, Di Sabatino A, Fantini MC, Castiglione F, et al. Mongersen, an oral SMAD7 antisense oligonucleotide, and Crohn’s disease. N Engl J Med (2015) 372:1104–13. doi:10.1056/NEJMoa1407250
42. Zhou L, Ivanov II, Spolski R, Min R, Shenderov K, Egawa T, et al. IL-6 programs T(H)-17 cell differentiation by promoting sequential engagement of the IL-21 and IL-23 pathways. Nat Immunol (2007) 8:967–74. doi:10.1038/ni1488
43. Bettelli E, Carrier Y, Gao W, Korn T, Strom TB, Oukka M, et al. Reciprocal developmental pathways for the generation of pathogenic effector TH17 and regulatory T cells. Nature (2006) 441:235–8. doi:10.1038/nature04753
44. Wen W, Wan Z, Ren K, Zhou D, Gao Q, Wu Y, et al. Potassium supplementation inhibits IL-17A production induced by salt loading in human T lymphocytes via p38/MAPK-SGK1 pathway. Exp Mol Pathol (2016) 100:370–7. doi:10.1016/j.yexmp.2016.03.009
45. Eil R, Vodnala SK, Clever D, Klebanoff CA, Sukumar M, Pan JH, et al. Ionic immune suppression within the tumour microenvironment limits T cell effector function. Nature (2016) 537:539–43. doi:10.1038/nature19364
46. Kleinewietfeld M, Hafler DA. The plasticity of human Treg and Th17 cells and its role in autoimmunity. Semin Immunol (2013) 25:305–12. doi:10.1016/j.smim.2013.10.009
47. Beriou G, Costantino CM, Ashley CW, Yang L, Kuchroo VK, Baecher-Allan C, et al. IL-17-producing human peripheral regulatory T cells retain suppressive function. Blood (2009) 113:4240–9. doi:10.1182/blood-2008-10-183251
Keywords: inflammatory bowel disease, Crohn’s disease, ulcerative colitis, dietary potassium, immune tolerance, TH17 pathway, Nurses’ Health Study
Citation: Khalili H, Malik S, Ananthakrishnan AN, Garber JJ, Higuchi LM, Joshi A, Peloquin J, Richter JM, Stewart KO, Curhan GC, Awasthi A, Yajnik V and Chan AT (2016) Identification and Characterization of a Novel Association between Dietary Potassium and Risk of Crohn’s Disease and Ulcerative Colitis. Front. Immunol. 7:554. doi: 10.3389/fimmu.2016.00554
Received: 07 October 2016; Accepted: 18 November 2016;
Published: 07 December 2016
Edited by:
Emilio Jirillo, University of Bari, ItalyReviewed by:
Alberto Finamore, CREA, the Council for Agricultural Research and Analysis of Agricultural Economics, ItalyNicolò Merendino, Tuscia University, Italy
Copyright: © 2016 Khalili, Malik, Ananthakrishnan, Garber, Higuchi, Joshi, Peloquin, Richter, Stewart, Curhan, Awasthi, Yajnik and Chan. This is an open-access article distributed under the terms of the Creative Commons Attribution License (CC BY). The use, distribution or reproduction in other forums is permitted, provided the original author(s) or licensor are credited and that the original publication in this journal is cited, in accordance with accepted academic practice. No use, distribution or reproduction is permitted which does not comply with these terms.
*Correspondence: Hamed Khalili, aGtoYWxpbGlAbWdoLmhhcnZhcmQuZWR1;
Amit Awasthi, YWF3YXN0aGlAdGhzdGkucmVzLmlu;
Vijay Yajnik, dnlham5pa0BtZ2guaGFydmFyZC5lZHU=;
Andrew T. Chan, YWNoYW5AbWdoLmhhcnZhcmQuZWR1