 Grainne Manning
 Aleš Tichý
 Igor Sirák
 Christophe Badie
- 1Cancer Mechanisms and Biomarkers Group, Centre for Radiation, Chemical and Environmental Hazards, Radiation Effects Department, Public Health England, Oxfordshire, UK
- 2Department of Radiobiology, Faculty of Military Health Sciences in Hradec Králové, University of Defence, Brno, Czechia
- 3Biomedical Research Centre, University Hospital Hradec Králové, Hradec Králové, Czechia
- 4Clinic of Oncology and Radiotherapy, University Hospital Hradec Králové, Hradec Králové, Czechia
Ionizing radiation (IR) exposure of cells in vitro and in vivo triggers a complex cellular response among which modifications of gene expression have been consistently reported. Nevertheless, little is currently known about the transcriptionally responsive genes which play a role in the inflammation response. In order to improve our understanding of such transcriptional response to radiation in vivo, we simultaneously monitored the expression of 249 genes associated with the inflammation response over the course of the radiotherapy treatment in blood of patients treated for endometrial or head and neck cancer. We have identified genes whose transcriptional expression is either upregulated (ARG1, BCL2L1) or downregulated (MYC) several fold in vivo. These modifications were consistently detected across patients and further confirmed by quantitative real-time polymerase chain reaction (QRT-PCR); they were specifically significant toward the end of the radiotherapy treatment, 5 weeks following the first radiation fraction and more pronounced in endometrial patients (respectively, 2.9, 4.1, and 1.8 times). Importantly, in an attempt to correlate expression levels with normal tissue reaction to IR, we also identified three other genes CD40, OAS2, and CXCR1 whose expression level fluctuations during radiotherapy were more pronounced in patients developing late normal tissue responses to curative radiotherapy after the end of the radiotherapy treatment. Overall, we identified inflammation-associated genes which are promising biomarkers of IR exposure and susceptibility to radiation-induced toxicity.
Introduction
Humans are exposed to ionizing radiation (IR) from both environmental and medical sources. At the cellular level, IR has cytotoxic effects and is a physiologically important stress inducing a large range of DNA lesions (1) to which cells respond by the activation of multiple signaling pathways. DNA damage triggers the DNA-damage response, a complex network that regulates cell cycle, proliferation, and cell death. DNA repair is activated to ensure that the lesions are repaired efficiently and accurately with minimal impact on genome stability (2). Cellular exposure to IR also results in complex alterations in gene expression (3, 4), a fundamental mechanism of great importance for cells in order to execute their functions. Many investigations on global gene expression profiling of IR-exposed whole blood samples have identified genes associated with the DNA-damage response. Among others, we found many genes activated by the transcription factor p53 (encoded by the gene TP53) via the nuclear ataxia-telangiectasia mutated gene, the sensor of double-strand breaks (5–7), and some are promising biomarkers of radiation exposure for biological dosimetry purposes, e.g., PCNA, DDB2, FDXR, CCNG1, and MDM2 (8–10).
Over recent years, a greater understanding has been obtained of the transcriptional response in cells and expression of specific genes can depend on radiation dose (11–13), dose rate (14, 15), radiation quality (16), and lapse between stress and analysis (17, 18). The level of dose also plays an important role. Low doses of IR induce genes in a linear dose-dependent manner (7) but specific immune responses were detected after low doses in whole blood, showing the involvement of both innate and adaptive immunity (19). Interestingly, the first mammalian radiation-induced protein-coding gene, i.e., tumor necrosis factor (TNF) was reported in the late 1980s (20). An increase in TNF-alpha (TNF-α) mRNA is accompanied by the increased production of TNF-α protein which is a mediator of the cellular immune response. For example, TNF-α acts directly on vascular endothelium to increase the adhesion of leukocytes during the inflammatory process (21). In mammalian cells, IR elicits a multi-layered signaling response by activating many pro-survival pathways and key transcription factors (22). Among them, IR transiently activates the nuclear factor kappa B (NF-κB), a ubiquitous transcription factor that regulates gene expression profile of multiple genes. Importantly, NF-κB has a central role in immune and inflammatory responses because it regulates the expression of pro-inflammatory cytokines and chemokines such as TNF-α (23). Although the aforementioned gene is directly involved in the inflammation process and was one of the first genes to be reported as being transcriptionally activated by radiation, only a few publications specifically studied inflammation-associated transcription modifications in vitro (19, 24, 25).
Inflammation also plays a key role in the response to radiation in vivo (26). As transcription factors regulate a wide spectrum of genes involved in inflammation, for example, NF-κB and p53 coregulate the induction of pro-inflammatory genes in primary human monocytes and macrophages (27), we decided to investigate IR exposure-associated transcriptional changes in an attempt to unravel the inflammation responses in vivo in human peripheral blood leukocyte (PBL) and platelets samples of patients undergoing radiotherapy treatment. Blood samples collected from endometrial and head and neck cancer patients treated by radiotherapy were analyzed at baseline and after the first, second, and last delivered dose (1.8 and 2 Gy, respectively). We investigated early and long-term chronic exposure effects on gene expression. Acute toxicity grading was evaluated as the worst grade of toxicity recorded during the treatment or up to 3 months after the end of treatment and late toxicity grading was evaluated as the worst grade of symptoms, persisting more than 3 months after the end of the treatment (see Materials and Methods for details). Moreover, we assessed interindividual variability in response among patients as some of them experienced toxic side effects of the radiotherapy treatment. Quantitative real-time polymerase chain reaction (QRT-PCR) was used to validate results obtained with the digital technology nCounter Analysis System, successfully used in the past to identify radiation-responsive genes in PBLs (28). Results for both techniques showed good correlation for all genes with R2 values ranging from 0.82 and 0.98.
Materials and Methods
Patient Radiotherapy Fractions and Radiation Toxicity Grading
Only cancer patients with no previous chemo- or radiotherapy were enrolled in the study. Patient ages ranged from 52 to 81 of which 7 head and neck patients were male, 1 head and neck patient was female, and with the 10 endometrial patients being female. The areas of radiation exposure for each cancer treatment and the prescribed dose for each patient listed in Table 1. Blood samples from 10 endometrial cancer patients and 8 head and neck cancer patients were collected into PAXGene tubes before radiotherapy treatment and at different times post-exposure as shown in Table 2. Both patient subgroups were treated for the same tumor localization in order to prevent the variability usually observed among patients treated with radiotherapy and to allow the corresponding roles of the size of irradiation field and of the dose rate to be studied. Blood from endometrial and head and neck cancer patients was taken pre-exposure, 24 h after the 1st fraction, 24 h after the 2nd fraction, and 24 h after the 25th fraction.
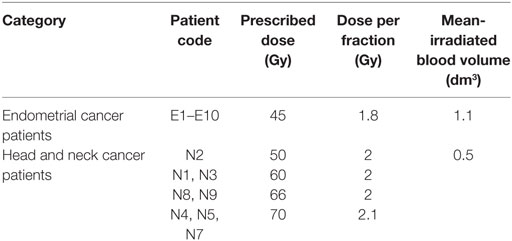
Table 1. List of endometrial and head and neck cancer patients and their prescribed dose, dose per fraction, and calculated volume of blood irradiated.
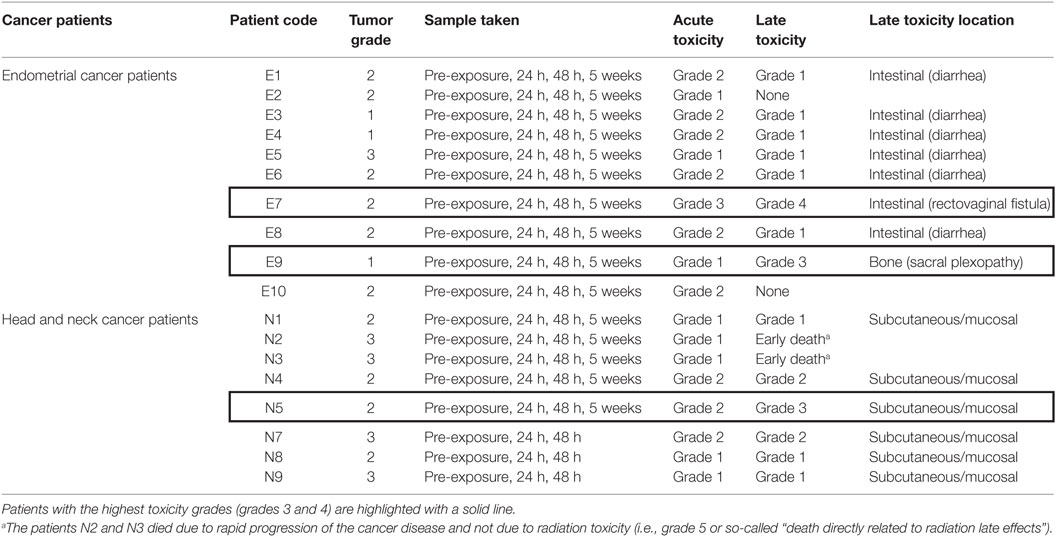
Table 2. List of cancer patients and their recorded acute and late toxicity grades according to RTOG/EORTC late radiation morbidity criteria.
Side effects of treatment such as toxicity were also recorded for each patient (Table 2). Acute toxicity grading was evaluated as the worst grade of toxicity recorded during the treatment or up to 3 months after the end of the treatment—CTCAE v. 4.0 grading system was used as described in Table 3. The full definition of the grading system can be found at the RTOG website.1 Late toxicity grading was evaluated as the worst grade of symptoms, persisting more than 3 months after the end of the treatment—RTOG/EORTC late radiation toxicity scheme (29) was used.
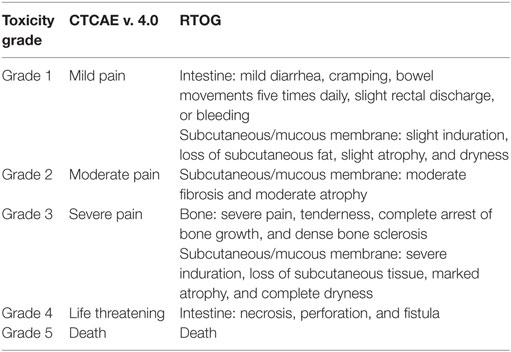
Table 3. List of CTCAE v. 4.0 grading system used for acute toxicity grading and RTOG grading system used for late toxicity grading, including description of the grades in relevant locations.
Patient Blood Sampling
Blood samples were collected from the radiotherapy-treated cancer patients in PAXGene tubes according to the manufacturers’ protocol (Qiagen, PreAnalytiX GmbH, Hilden, Germany). The tubes were kept at RT for 2 h before being frozen at −20°C. RNA was extracted from the samples using the PAXGene Blood miRNA Kit (Qiagen, PreAnalytiX GmbH, Hilden, Germany) according to the manufacturers’ protocol. RNA quantity was assessed by Nanodrop ND2000 (Nanodrop, Wilmington, DE, USA), and RNA quality was assessed by Tapestation 2200 (Agilent Technologies, CA, USA).
nCounter Analysis
Samples were analyzed by the nCounter Analysis System (NanoString Technologies®, Inc., Seattle, WA, USA) according to the manufacturers’ guidelines. The nCounter Analysis System utilizes a novel digital color-coded barcode technology that is based on direct multiplexed measurement of gene expression. The technology uses molecular “barcodes” and single-molecule imaging to detect and count hundreds of unique transcripts in a single reaction. The RNA sample was hybridized overnight in solution with the set of target-specific biotinylated capture probes and barcode containing reporter probes. The tubes were then covered and incubated at 65°C for 12–18 h in a thermocycler. The PrepStation collected hybridized probe/target complexes while washing away unhybridized probes. The washed complexes were then added to a cartridge containing a streptavidin-derivatized surface, which anchored the biotinylated capture probe end. The complexes were stretched and aligned by applying an electrical field to the immobilized complexes; the reporter (barcode)-containing end was anchored during this process with a second biotin-containing oligonucleotide. To count the molecules, the cartridges containing the immobilized, aligned barcodes were placed in the Digital Analyzer. The nCounter Digital Analyzer counted individual fluorescent barcodes which are composed of seven spots made up of four colors specific for the gene of interest. It imaged each cartridge and using proprietary image analysis software, counted the individual barcodes across the surface. Data were collected in the form of a text file, containing a list of gene names and number of times the barcode for that gene is detected, providing a direct count of the number of transcripts. The raw code count data from the nCounter Analysis System were first normalized and background corrected using a standard curve constructed from spike-in controls. The molecular counts were normalized to internal controls and reference genes according to Geiss et al. (30). The samples were run using 90 ng RNA per sample on the Human Inflammation V2 panel, which consists of 249 genes and scanned at 555 field of view (FOV). FOV is the area of the cartridge surface which is imaged by the Digital Analyzer with 555 FOV providing the most detailed scan. The raw code count data were first normalized and background corrected using a standard curve constructed from spike-in controls. The molecular counts were normalized to internal controls and references genes according to Geiss et al. (30). Candidate genes that were selected were those that showed a significant upregulation in comparison to the control (t-test, p < 0.05).
Quantitative Real-time Polymerase Chain Reaction
Reverse transcriptase reactions were performed using High Capacity cDNA Reverse transcription kit (Applied Biosystems, FosterCity, CA, USA) according to the manufacturer’s protocol with 350 ng of total RNA. QRT-PCR was performed using Rotor-Gene Q (Qiagen, Hilden, Germany). All reactions were run in triplicate using PerfeCTa® MultiPlex qPCR SuperMix (Quanta Biosciences, Inc., Gaithersburg, MD, USA) with primer and probe sets for target genes at 300 nM concentration each. 3′6-Carboxyfluorescein (FAM) and CY5 (Eurogentec Ltd., Fawley, Hampshire, UK) were used as fluorochrome reporters for the double dye probes analyzed in multiplexed reactions with between two genes per run including the control. When validating primer and probes sets, the efficiencies were analyzed when the primer and probe sets were run separately and when ran together in a multiplex reaction to check for interference as per QMRT-PCR guidelines (31). The primer sequences for QRT-PCR analysis were HPRT F: 5′ TCAGGCAGTATAATCCAAAGATGGT 3′, R: 5′ AGTCTGGCTTATATCCAACACTTCG 3′, probe: 5′ CGCAAGCTTGCTGGTGAAAAGGACCC 3′; MYC F: 5′ CTTGTACCTGCAGGATCTGA 3′, R: 5′ GTCGAGGAGAGCAGAGAATC 3′, probe 5′ CGCCCAAGTCCTGCGCCTCG 3′. Cycling parameters were 2 min at 95°C, then 45 cycles of 10 s at 95°C and 60 s at 60°C. Data were collected and analyzed by Rotor-Gene Q Series Software. Gene target Ct (cycle threshold) values were normalized to a hypoxanthine-guanine phosphoribosyltransferase 1 (HPRT1) internal control. Ct values were converted to transcript quantity using standard curves obtained by serial dilution of PCR-amplified DNA fragments of each gene. The linear dynamic range of the standard curves covering six orders of magnitude (serial dilution from 3.2 × 10⁻⁴ to 8.2 × 10⁻¹⁰) gave PCR efficiencies between 93 and 103% for each gene with R2 > 0.998. Relative gene expression levels after irradiation were determined.
SYBRGreen PCR was performed using Rotor-Gene Q (Qiagen, Hilden, Germany). All reactions were run in triplicate using PerfeCTa SYBR® Green SuperMix (Quanta Biosciences, Inc., Gaithersburg, MD, USA) with primer sets for target genes at 500 nM concentration each. Cycling parameters were 2 min at 95°C, then 40 cycles of 10 s at 95°C and 60 s at 60°C. Data were collected and analyzed by Rotor-Gene Q Series Software. Fold of change values were calculated using the delta–delta Ct method. The primer sequences for SYBRGreen analysis were HPRT F: 5′ TCAGGCAGTATAATCCAAAGATGGT 3′, R: 5′ AGTCTGGCTTATATCCAACACTTCG 3′; ARG1 F: 5′ CCACCTAAGTAAATGTGGAAAC 3′, R: 5′ ACCAAGAGGGAATTTGTAGAG 3′; BCL2L1 F: 5′ GGCTCTCTGCTGTACATATT 3′, R: 5′ GCAGCTCCTCACACATAA 3′; CD40 F: 5′ GCAGGAGACTGGCTAAATAA 3′, R: 5′ CTGTGTACCCTTCCAGAAC 3′; OAS2 F: 5′ CTGGGTTCACAGATCTTTCT 3′, R: 5′ GTTCTTGACCTTTGGGTATCT 3′; CXCR1 F: 5′ GTCTGCTGGAGACATTGAG 3′, R: 5′ GGGTTCTTGTGGCATAGAT 3′.
A primer-probe design and a SYBR green design were used in order to produce results quickly. A primer-probe design was used for the gene MYC as it was already available in our lab. SYBR green was used for the other new genes identified by nCounter to provide confirmation of the results.
Statistical Analysis
Statistical analysis of the biological data was performed using Minitab and Stata. Data points represent the mean ± SEM. p Values ≤ 0.05 were considered statistically significant. The data were tested for normal distribution. Parametric (t-test) and non-parametric (Mann–Whitney, Kruskal–Wallis) tests were used to test nCounter results for significance of candidate genes. Kruskal–Wallis tests were performed to test for significance of SYBR green QPCR results. p-Trend tests were performed using the software Stata to test for significance of dose-to-gene associations of BCL2L1 and OAS2.
Results
nCounter Analysis
Blood from endometrial and head and neck cancer patients was taken pre-exposure, 24 h after the 1st fraction, 24 h after the 2nd fraction, and 24 h after the 25th fraction. Using the nCounter, we analyzed the transcriptional expression level of 249 genes associated with the inflammation process. Candidate genes were selected that showed a significant upregulation in comparison to the control (p < 0.05). From the inflammation panel, comparing blood samples obtained before and after the first or second fraction, we did not identify genes whose expression was consistently and significantly modified by radiation exposure (data not shown). To the contrary, a significant modification of expression after radiation exposure was detected at the last time point. Importantly, three genes were identified from the nCounter analysis that showed a modification in expression at day 35 (5 weeks following the first fraction, 24 h following the last fraction) as shown in Figures 1A,C,E (endometrial cancer patients) and Figures 2A,C,E (head and neck cancer patients). Two genes, ARG1 and BCL2L1 were upregulated while MYC was downregulated. These results were then confirmed by QRT-PCR analysis.
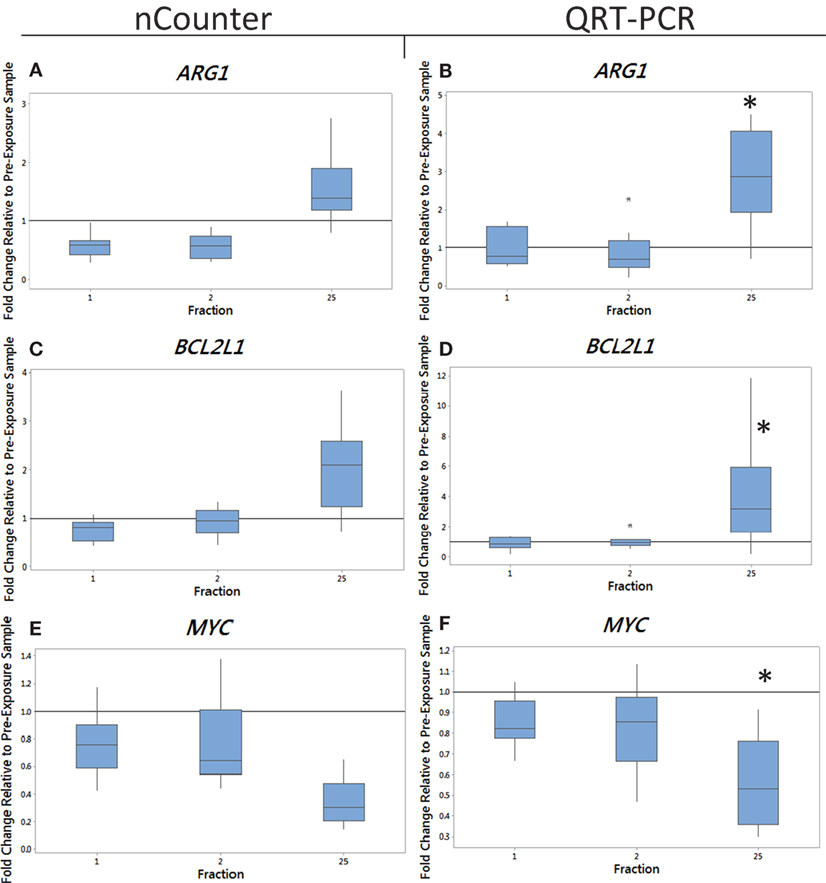
Figure 1. The box plot shows the fold change in expression of the genes ARG1 (A,B), BCL2L1 (C,D), and MYC (E,F) in endometrial cancer patients 24 h after the 1st fraction, 24 h after the 2nd fraction, and 24 h after the 25th fraction. The box plot is composed of a rectangular box representing the middle 50% of the data, the median value indicated by the horizontal line inside the box, lines representing the upper and lower 25% of the distribution, and outliers indicated by asterisks. Expression was measured using the nCounter (left) and QRT-PCR (right) analysis. Fold changes in expression compared to non-irradiated blood (and relative to HPRT gene). Significance was calculated using the Kruskal–Wallis test where *p < 0.05.
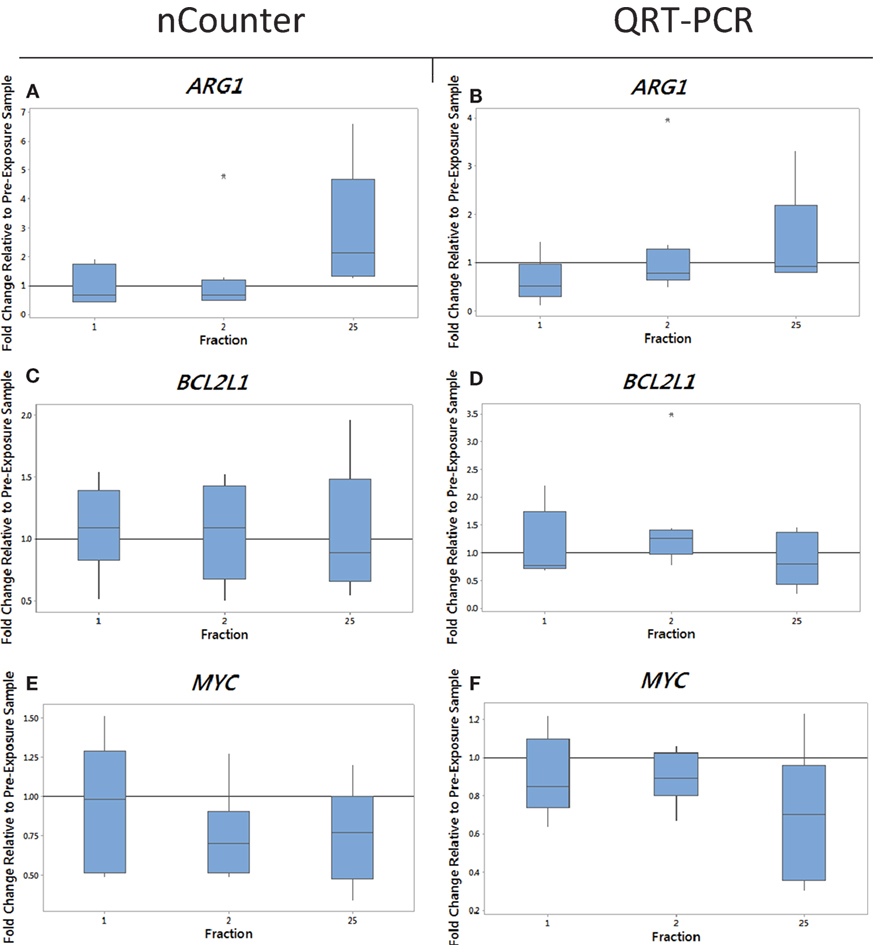
Figure 2. The box plot shows the fold change in expression of the genes ARG1 (A,B), BCL2L1 (C,D), and MYC (E,F) in head and neck cancer patients 24 h after the 1st fraction, 24 h after the 2nd fraction, and 24 h after the 25th fraction. The box plot is composed of a rectangular box representing the middle 50% of the data, the median value indicated by the horizontal line inside the box, lines representing the upper and lower 25% of the distribution, and outliers indicated by asterisks. Expression was measured using the nCounter (left) and RT-PCR (right) analysis. Fold changes in expression compared to non-irradiated blood (and relative to HPRT gene).
Quantitative PCR Analysis
We monitored previously validated radiation-responsive genes to confirm that IR exposure could be detected in PBL. The majority of genes investigated responded rapidly to radiation exposure, reaching a peak of expression between 24 h after the first fraction (day 1) and 24 h after the second fraction (day 2) (data not shown). Mean gene expression values of nCounter plotted against QRT-PCR data showed good agreement between both methods with R2 values ranging from 0.90 to 0.99 for endometrial samples and ranging from 0.5 to 0.97 for head and neck samples for genes showing a change in expression (data not shown). The gene ARG1 was upregulated at 5 weeks after fractionated therapy in 9 out of the 10 endometrial cancer patients (fold of change ranging from 0.7 for patient E4 up to 4.5-fold increase in expression for patient E6) (Figure 1B). This increase was also evident in head and neck cancer patients, but to a lower extent with fold changes of 3.3 and 1.8 in patients N1 and N2 with the rest showing no increase in expression at 5 weeks (Figure 2B). The gene BCL2L1 showed a large variation in expression among endometrial cancer patients at 5 weeks with an 11.8-fold increase for patient E2 while other patients showed no modification of expression (Figure 1D). The expression of BCL2L1 in head and neck cancer patients was low reaching 1.5-fold increase at week 5 for patient N4 but the remaining patients showing no increase in expression (Figure 2D). To the contrary, the gene MYC was consistently and gradually downregulated in both endometrial (Figure 1F) and head and neck cancer patients (Figure 2F) from the first time point (1 day post-first fraction) to the last one (5 weeks) where the downregulation became significant for the endometrial patients. At this late time point, MYC was downregulated 1.8-fold on average in endometrial cancer patient samples and showed a 1.5-fold downregulation in head and neck cancer patients. As with the other genes, this response was stronger in the endometrial cancer patients.
Toxicity Analysis
Out of the 10 endometrial cancer patients, 1 of them, patient E7, recorded the highest level of acute (grade 3) and late toxicity of grade 4 (Table 2) diagnosed as a rectovaginal fistula. Late stage toxicity was also identified in patient E9 who had painful sacral plexopathy. In the head and neck cancer patients, the highest toxicity level of grade 3 was recorded in patient N5 who experienced severe induration. We retrospectively searched for inflammation-associated genes whose expression would have been modified specifically in these three patients. Although we could not single out any gene with a specific up- or downregulation for patient E7, who had the highest late toxicity grade, the nCounter analysis identified two genes, CD40 and OAS2, following the same pattern of expression with a slight increased expression of 1.3- and 1.4-fold in the endometrial cancer patient E9 at 48 h (Figures 3A,C). By the end of the radiotherapy treatment, the expression levels were inverted and a clear downregulation of sixfold and eightfold could be seen. This was confirmed by QRT-PCR analysis (Figures 3B,D). We then analyzed the data for patient N5. Of importance, the pattern of expression was different from patient E9, the nCounter analysis also identified OAS2 as well as another gene CXCR1, showing an increased expression in the head and neck cancer patient N5 at 5 weeks (Figures 4A,C). This was confirmed by QRT-PCR analysis which showed an increase of 3- and 4.8-fold in expression at 5 weeks for OAS2 and CXCR1, respectively (Figures 4B,D).
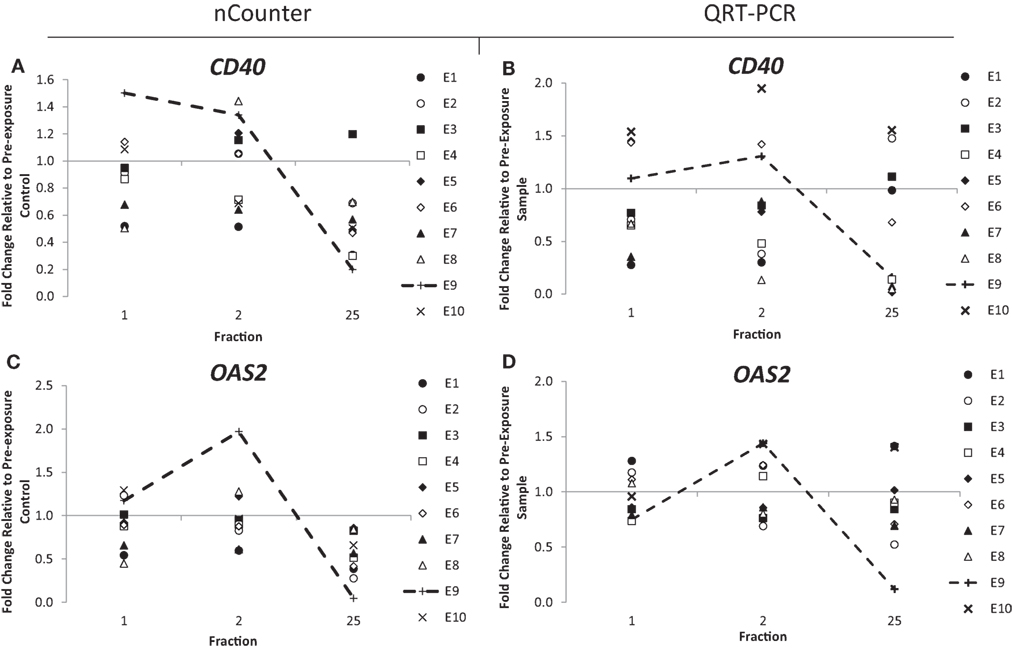
Figure 3. Fold change in expression of the genes CD40 (A,B) and OAS2 (C,D) in endometrial cancer patients 24 h after the 1st fraction, 24 h after the 2nd fraction, and 24 h after the 25th fraction. Expression was measured using the nCounter (left) and RT-PCR (right) analysis. Fold changes in expression compared to non-irradiated blood (and relative to HPRT gene).
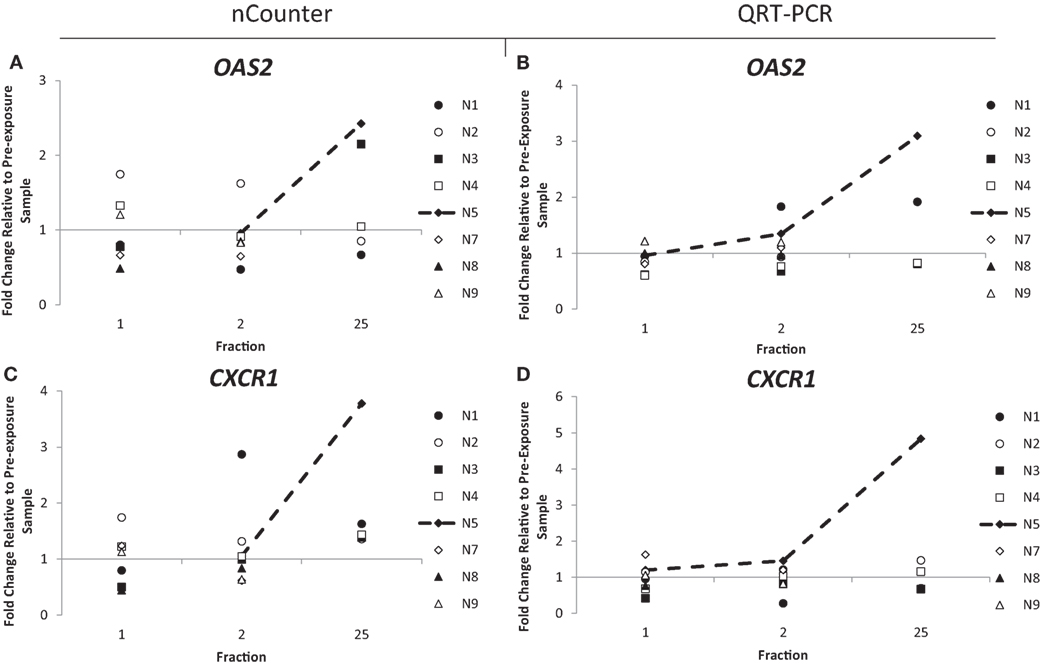
Figure 4. Fold change in expression of the genes OAS2 (A,B) and CXCR1 (C,D) in head and neck patients 24 h after the 1st fraction, 24 h after the 2nd fraction, and 24 h after the 25th fraction. Expression was measured using the nCounter (left) and RT-PCR (right) analysis. Fold changes in expression compared to non-irradiated blood (and relative to HPRT gene).
Head and neck cancer patients received treatments with 50–70 Gy. Dose versus fold change in gene expression per day was examined for patients receiving the different treatments. A slight dose–response with large variability was seen in only two of the genes (BCL2L1, OAS2) at 5 weeks (data not shown). A p-trend test was performed for these genes and although a trend was viable from the graphs, it was not statistically significant with a p value of 0.398 for OAS2 and a p value of 0.257 for BCL2L1. The toxicity grading was analyzed by categorizing the gene expression response at the 25th fraction into two categories (grades 1 + 2 and grades 3 + 4). The grading of all patients could only be combined for the gene OAS2 due to the fact that different genes were identified for the two sets of cancer patients. For the gene OAS2 at the 25th fraction, a Mann–Whitney test was performed giving a p value of 0.475. Such analysis combining all types of late toxicities does not incorporate information on the localization of the toxicity which for patient E9 was in the bone while it was intestinal in E7 and mucosal in N5. Therefore, it may be more relevant to look at patients on a case by case basis where further details, such as location of toxicity, provide important information for transcriptional analysis. When the data were combined into two categories at the 25th fraction for the gene CD40 for endometrial cancer patients, this only resulted in six samples for the grade 1 category and two samples for the grade 3 and grade 4 categories. A Mann–Whitney test was performed giving a p value of 0.867. When the data were combined into two categories at the 25th fraction for the gene CXCR1 for head and neck patients, this again only resulted in two samples for the grade 1 and grade 2 categories and one sample for the grade 3 category. Unfortunately such analyses have limited significance with the small samples size (i.e., only one sample in the grade 3 category), and a p value could not be obtained. Due to the small samples sizes and lack of statistical analysis, these graphs were not included in the manuscript.
Discussion
Radiation-Induced Inflammatory Biomarkers
Biological research has been providing characterization and understanding of the complex actions of IR on biological processes. IR causes multiple types of damage to DNA but also the formation of reactive oxygen species which induce stress responses, inflammation, and release of cytokines, growth factors, and chemokines (32, 33). Immunological biomarkers of radiation-induced fibrosis and pneumonitis in cancer radiotherapy patients were reviewed by Sprung et al. (34). Nonetheless, radiation-induced inflammation-associated transcripts expressed in circulating PBL in vivo have not yet been explored. In particular, long-term effects have rarely been investigated and only the effects of acute long-term exposure on global gene expression patterns in irradiated human lymphocytes were reported (35). In this study, we looked specifically at transcripts of genes associated with inflammation and induced by IR and their correlation with long-term effects (i.e., after 3 months after the end of RT) such as radiation toxicity.
The use of the recently developed nCounter technology enabled us to screen 249 genes associated with inflammation simultaneously (Human Inflammatory V2 panel). We previously scan the expression of hundreds of genes following IR exposure using this technique successfully (28). Three genes were identified as radiation-induced inflammatory biomarkers in PBL in vivo. ARG1 and BCL2L1 show increased expression mainly toward the end (35 days) of the radiotherapy treatment while MYC shows a gradual increased downregulation with cumulative doses of radiotherapy treatment. For all three genes, this response was more pronounced in endometrial cancer patients where it becomes significant. Although we cannot provide an explanation, it is possible that this is a dose effect as the irradiated volume of body mass as well as circulating blood is higher in endometrial cancer patients in comparison to head and neck patients (see Table 1). The first gene, ARG1, catalyzes the hydrolysis of arginine to ornithine and urea and is expressed in macrophages. Interestingly its expression has been found upregulated in vitro, in primary monocytes-derived macrophages obtained from blood samples collected from patients before and after the first delivered 2 Gy radiotherapy dose in breast cancer patients (36). The authors found that the level of ARG1 mRNA significantly correlated with higher grades of radiation-induced acute skin toxicities in early breast cancer patients. As discussed later, we also looked at acute and late radiation toxicity but could not find any correlation as the increase in ARG1 expression was found in three patients on day 1 and in nine patients at 5 weeks where the level of expression becomes significantly different from basal expression. In our in vivo study, ARG1 can be rather considered as a late biomarker of radiation exposure than a biomarker of radiation toxicity. The second gene we found to be significantly upregulated at 35 days, BCL2L1, is a member of the BCL-2 protein family, which are involved in a number of cellular functions such as apoptosis and regulation of the outer mitochondrial membrane channel (VDAC) opening. BCL2L1 expression after radiotherapy has previously been investigated in prostate cancer patients undergoing external beam radiotherapy and found to be upregulated with increasing fatigue (37). Here, the expression of BCL2L1 increases with time and at week 5 the gene is upregulated in nine patients; however, fatigue was not measured and so no comparisons to this factor can be made. BCL2L1 has also been investigated as a predictive marker of radioresistance, however, there are conflicting reports. BCL2L expression in head and neck patients has shown to be associated with a favorable outcome in a study involving 400 patients (38) while another study associates BCL2L1 expression with tumor recurrence (39). Finally, MYC is a well-known transcription factor that plays a central role in cancer development processes including cell proliferation, growth, and apoptosis. MYC has been previously upregulated in cases of radiation-induced angiosarcoma (40, 41) and glioblastoma, with its expression associated with longer overall survival (42) but here we see a strong and consistent downregulation in all endometrial cancer patients after radiotherapy.
We chose to analyze whole blood transcriptional responses as it was a simple and reliable protocol to collect and preserve RNA using specifically designed PAXgene tubes. PBL represents a complex combination of different cell types (neutrophils, lymphocytes, eosinophils, and basophils), allowing the study of a collective tissue response with neutrophils the most abundant (~60%) and short lived; therefore, a late change in transcription (i.e., 5 weeks) is unlikely to be from this specific subpopulation. On the other hand, it is not possible in this study to confirm that these radiation-induced modulations of expression are global or potentially cell-type specific. It is probable that results could be refined by sorting PBL subpopulations which may have a stronger transcriptional response to radiation. For instance, it has been shown that several biological responses in cluster of differentiation CD4+ cells could be more sensitive to low doses of radiation than CD56+ and CD8+ (43). When blood volumes are sufficient, further studies should be designed to isolate blood subpopulations before performing cell-type specific transcription analyses.
We and others have shown that gene expression analysis could be a powerful tool to predict radiation exposure for biological dosimetry purposes and such inflammatory gene expression signature (i.e., ARG1, BCL2L1, and MYC) may be useful not only for biodosimetric triage, as well as to monitor the progress of treatment and recovery.
Radiation-Induced Toxicity Biomarkers
Normal tissue reactions to radiotherapy vary in severity among patients and cannot be accurately predicted, limiting treatment doses (44). The existence of heritable radiosensitivity syndromes [e.g., Ref. (45, 46)] suggests that normal tissue reaction severity is determined, at least in part, by genetic factors and these may be revealed by differences in gene expression. Transcriptional responses in lymphoblastoid cells can be used to understand the genetic basis for variation in human radiosensitivity (47), to assess interindividual susceptibility to DNA damaging agents for the prediction of therapeutic response to drugs (48), and to predict clinical outcome in human cancers (49). For example, we have previously shown that cyclin-dependent kinase inhibitor 1A (CDKN1A) transcriptional response associates with abnormal acute sensitivity to radiation treatment (50). Transcriptional responses to radiation (51, 52) also reported that changes of expression in a specific set of genes after in vitro irradiation of stimulated peripheral lymphocytes can, to some extent, successfully predict severe late reaction status.
Inflammation has a protective role and is a response mechanism involving multiple immune cells. Nevertheless, chronic inflammation is also associated with the development of chronic diseases such as radiation toxicity. In this study, we also searched for differences in gene expression discriminating individuals with marked responses with the aim to identify potential biomarkers of radiation toxicity that would facilitate normal tissue response prediction.
Three genes, CD40, OAS2, and CXCR1, were identified as potential biomarkers of normal tissue toxicity in cancer patients after radiotherapy. In endometrial cancer patients, we observed by simple visual screening that the expression of CD40 and OAS2 was particularly variable in patient E9 at the different time points studied although the number of patients studied here didn’t allow us to conclude in terms of statistical significance. CD40 is a member of the TNF-receptor superfamily, which is involved in mediating a number of inflammatory processes with interference of the CD40–CD40 ligand. Interestingly, earlier work also reported a reduction of expression in radiation-induced lung toxicity in mice (53). The second gene, OAS2, is a member of the 2–5A synthetase family which is involved in the immune response to viral infections. Expression of OAS2 has been suggested as a biomarker for disease and it has been reportedly upregulated in psoriasis and squamous cell carcinoma patients (54) and in mice in response to cigarette smoke and influenza virus (55).
Expression of OAS2 was particularly inconstant in endometrial patient E9 and head and neck patient N5, both with reported toxicity side effects. In the endometrial cancer patients, expression of OAS2 was upregulated at 48 h in patient E9, who was recorded as having the second highest late toxicity score of grade 3. This increase was followed by a drop of expression of a factor of 12 at 5 weeks, possibly indicating the beginning of an inflammation response and the painful sacral plexopathy the patient experienced. This upregulation was not seen in patient E7 who recorded the highest toxicity level of grade 4. Although we do not have an explanation for this, it might be due to the specificity of the response to the type of toxicity (patient E7 was diagnosed with rectovaginal fistula).
The expression of OAS2 was also upregulated in the head and neck cancer patient N5, which reported the highest level of toxicity, grade 3. This upregulation was weak at day 2 but amplified after 5 weeks. We speculate that the later upregulation compared to patient E9 is possibly due to the smaller area treated for head and neck cancer patients and thus a threshold level of radiation exposure possibly needs to be achieved in order to upregulate this gene. More likely, the difference at 35 days, i.e., upregulation (N5) and downregulation (E9) might be linked to the nature of the tissue irradiated. Nevertheless, a shift in expression might be an indication of radiation toxicity occurring later.
Possibly, the clearest difference in expression between patients was for the gene CXCR1. It is a member of the G-protein-coupled receptor family, binding with high affinity to IL8 and mediating chemotaxis. With such a central role in the inflammatory response, CXCR1 has been targeted for the development of pain-relieving drugs (56, 57). Similar to the gene OAS2, CXCR1 was clearly upregulated in patient N5 at the 5-week time point with an increase in expression of nearly fivefold, again indicating that the inflammatory response in this patient can be detected by these genes.
As a general comment, we acknowledge that the tumors for which the patients were treated by radiotherapy may affect the basal level of expression of many inflammation genes analyzed in PBL in this study (58). Despite the fact that it might have affected the sensitivity of detection, it should not have affected the specificity, as the patient blood samples obtained 24 h before the beginning of the treatment were used to set-up the background level of expression of these genes. Potential confounding factors such as age at treatment and gender (for head and neck cancer patients) could not be investigated in this study due to the small sample size but would be of importance in future studies.
Summary and Conclusion
To summarize, this study allowed the identification of three inflammatory-associated genes (ARG1, BCL2L1, and MYC) whose expression is consistently modified in cancer patients by the radiotherapy treatment more than a month after the beginning of the treatment and, although these results require confirmation and extension, it suggests the possibility of predicting the severity of radiation toxicity by monitoring the leukocyte mRNA levels of specific genes (for example, CD40, OAS2, and CXCR1). Identification of such biomarkers could improve treatment, comfort for the patient, and reduce side effects. These genes may possibly be used to identify patients who are at risk of developing severe toxicity and appropriate measures could be taken to reduce radiation toxicity in these patients. We have identified potential biomarkers of late toxicity in which expression was upregulated only after completion of radiotherapy, but before clinical signs could be detected. The changes in gene expression 24 h after the last radiotherapy fraction (25th) precede the late tissue reaction developed in patients E7 and N5. Upregulation of these biomarkers would not influence the indication or dose of radiation since it can be detected after the end of the treatment. However, more intensive surveillance and supportive care may be needed in patients with detected activity of these biomarkers after the treatment. Our findings are important for future radiation late morbidity understanding and may be a potential aim for targeting in late morbidity prevention.
In conclusion, this study demonstrates the importance of further exploration of the modifications of transcription in response to IR exposure in genes associated with an inflammation response and the immune system. In general, it has the potential to be a source of biomarkers allowing to complete the portfolio of identified mRNA transcripts for monitoring radiation exposure during radiotherapy on one hand and, perhaps more importantly, of radiation toxicity on the other one.
Ethics Statement
This study was carried out in accordance with the recommendations The Code of Ethics of the World Medical Association—Declaration of Helsinki (approval no: 201401-S15P) with written informed consent from all subjects. All subjects gave written informed consent in accordance with the Declaration of Helsinki. The protocol was approved by the Ethical Committee of University Hospital in Hradec Kralove (Czechia).
Author Contributions
All persons who meet authorship criteria are listed as authors, and all authors certify that they have participated sufficiently in the work to take public responsibility for the content, including participation in the concept, design, analysis, writing, or revision of the manuscript.
Disclaimer
The authors alone are responsible for the content and writing of the paper. This report is work commissioned by the National Institute for Health Research. The views expressed in this publication are those of the authors and not necessary those of the NHS, the National Institute for Health Research, or the Department of Health.
Conflict of Interest Statement
The authors declare that the research was conducted in the absence of any commercial or financial relationships that could be construed as a potential conflict of interest.
Acknowledgments
The authors thank Francois Paillier for oligonucleotide PCR design.
Funding
The financial support was provided by the Radiation Theme of the Newcastle University and PHE Health Protection Research Unit (HPRU) and by Ministry of Defence, Czech Republic (project: long-term organization development plan 1011).
Footnote
References
1. Ward JF. The complexity of DNA damage: relevance to biological consequences. Int J Radiat Biol (1994) 66:427–32. doi: 10.1080/09553009414551401
2. Jackson S, Bartek J. The DNA-damage response in human biology and disease. Nature (2009) 461:1071–8. doi:10.1038/nature08467
3. Amundson S, Bittner M, Chen Y, Trent J, Meltzer P, Fornace A. Fluorescent cDNA microarray hybridization reveals complexity and heterogeneity of cellular genotoxic stress responses. Oncogene (1999) 18:3666–72. doi:10.1038/sj.onc.1202676
4. Fan F, Jin S, Amundson SA, Tong T, Fan W, Zhao H, et al. ATF3 induction following DNA damage is regulated by distinct signaling pathways and over-expression of ATF3 protein suppresses cells growth. Oncogene (2001) 21:7488–96. doi:10.1038/sj.onc.1205896
5. Kabacik S, Mackay A, Tamber N, Manning G, Finnon P, Paillier F, et al. Gene expression following ionising radiation: identification of biomarkers for dose estimation and prediction of individual response. Int J Radiat Biol (2011) 87(2):115–29. doi:10.3109/09553002.2010.519424
6. Kabacik S, Ortega-Molina A, Efeyan A, Finnon P, Bouffler S, Serrano M, et al. A minimally invasive assay for individual assessment of the ATM/CHEK2/p53 pathway activity. Cell Cycle (2011) 10(7):1152–61. doi:10.4161/cc.10.7.15231
7. Manning G, Kabacik S, Finnon P, Bouffler S, Badie C. High and low dose responses of transcriptional biomarkers in ex vivo x-irradiated human blood. Int J Radiat Biol (2013) 89(7):512–22. doi:10.3109/09553002.2013.769694
8. Badie C, Kabacik S, Balagurunathan Y, Bernard N, Brengues M, Faggioni G, et al. Laboratory intercomparison of gene expression assays. Radiat Res (2013) 180(2):138–48. doi:10.1667/RR3236.1
9. Abend M, Badie C, Quintens R, Kriehuber R, Manning G, Macaeva E, et al. Examining radiation-induced in vivo and in vitro gene expression changes of the peripheral blood in different laboratories for biodosimetry purposes: first RENEB gene expression study. Radiat Res (2016) 185(2):109–23. doi:10.1667/RR14221.1
10. Manning G, Macaeva E, Majewski M, Kriehuber R, Brzóska K, Abend M, et al. Comparable dose estimates of blinded whole blood samples are obtained independently of culture conditions and analytical approaches. Second RENEB gene expression study. Int J Radiat Biol (2016) 93(1):87–98. doi:10.1080/09553002.2016.1227105
11. Grace M, McLeland C, Blakely W. Real-time quantitative RT-PCR assay of GADD45 gene expression changes as a biomarker for radiation biodosimetry. Int J Radiat Biol (2002) 78(11):1011–21. doi:10.1080/09553000210158056
12. Amundson S, Fornace A. Monitoring human radiation exposure by gene expression profiling: possibilities and pitfalls. Health Phys (2003) 85(1):36–42. doi:10.1097/00004032-200307000-00009
13. Stassen T, Port M, Nuyken I, Abend M. Radiation-induced gene expression in MCF-7 cells. Int J Radiat Biol (2003) 79(5):319–31. doi:10.1080/0955300032000093146
14. Amundson S, Lee R, Koch-Paiz C, Bittner M, Meltzer P, Trent J, et al. Differential responses of stress genes to low dose-rate gamma irradiation. Mol Cancer Res (2003) 1(6):445–52.
15. Ghandhi S, Smilenov L, Elliston C, Chowdhury M, Amundson S. Radiation dose-rate effects on gene expression for human biodosimetry. BMC Med Genomics (2015) 8:22. doi:10.1186/s12920-015-0097-x
16. Woloschak G, Chang-Liu C. Modulation of expression of genes encoding nuclear proteins following exposure to JANUS neutrons or gamma-rays. Cancer Lett (1995) 97(2):169–75. doi:10.1016/0304-3835(95)03973-Z
17. Franco N, Lamartine J, Frouin V, Le Minter P, Petat C, Leplat J, et al. Low-dose exposure to gamma rays induces specific gene regulations in normal human keratinocytes. Radiat Res (2005) 163(6):623–35. doi:10.1667/RR3391
18. Kabacik S, Manning G, Raffy C, Bouffler S, Badie C. Time, dose and ataxia telangiectasia mutated (ATM) status dependency of coding and noncoding RNA expression after ionizing radiation exposure. Radiat Res (2015) 183:325–37. doi:10.1667/RR13876.1
19. El-Saghire H, Thierens H, Monsieurs P, Michaux A, Vandevoorde C, Baatout S. Gene set enrichment analysis highlights different gene expression profiles in whole blood samples X-irradiated with low and high doses. Int J Radiat Biol (2013) 89:628–38. doi:10.3109/09553002.2013.782448
20. Hallahan D, Spriggs D, Beckett M, Kufe D, Weichselbaum R. Increased tumor necrosis factor alpha mRNA after cellular exposure to ionizing radiation. Proc Natl Acad Sci U S A (1989) 86:10104–7. doi:10.1073/pnas.86.24.10104
21. Bevelaequa M, Stengelin S, Gimbrone M, Seed B. Endothelial leukocyte adhesion molecule 1: an inducible receptor for neutrophils related to complement regulatory proteins and lectins. Science (1989) 243:1160–5. doi:10.1126/science.2466335
22. Di Maggio F, Minafra L, Forte G, Cammarata F, Lio D, Messa C, et al. Portrait of inflammatory response to ionizing radiation treatment. J Inflamm (2015) 12:14. doi:10.1186/s12950-015-0058-3
23. Lin Y, Bai L, Chen W, Xu S. The NF-kappaB activation pathways, emerging molecular targets for cancer prevention and therapy. Expert Opin Ther Targets (2010) 14:45–55. doi:10.1517/14728220903431069
24. El-Saghire H, Michaux A, Thierens H, Baatout S. Low doses of ionizing radiation induce immune-stimulatory responses in isolated human primary monocytes. Int J Mol Med (2013) 32(6):1407–14. doi:10.3892/ijmm.2013.1514
25. Paul S, Smilenov L, Amundson S. Widespread decreased expression of immune function genes in human peripheral blood following radiation exposure. Radiat Res (2013) 180(6):575–83. doi:10.1667/RR13343.1
26. Prise K, O’Sullivan J. Radiation-induced bystander signalling in cancer therapy. Nat Rev Cancer (2009) 9(5):351–60. doi:10.1038/nrc2603
27. Lowe J, Menendez D, Bushel P, Shatz M, Kirk E, Troester M, et al. p53 and NF-κB coregulate proinflammatory gene responses in human macrophages. Cancer Res (2014) 74(8):2182–92. doi:10.1158/0008-5472.CAN-13-1070
28. Manning G, Kabacik S, Finnon P, Paillier F, Bouffler S, Badie C. Assessing a new gene expression analysis technique for radiation biodosimetry applications. Radiat Meas (2011) 46:1014–8. doi:10.1016/j.radmeas.2011.05.019
29. Cox J, Stetz J, Pajak T. Toxicity criteria of the Radiation Therapy Oncology Group (RTOG) and the European Organization for Research and Treatment of Cancer (EORTC). Int J Radiat Oncol Biol Phys (1995) 31(5):1341–6. doi:10.1016/0360-3016(95)00060-C
30. Geiss G, Bumgarner R, Birditt B, Dahl T, Dowidar N, Dunaway D, et al. Direct multiplexed measurement of gene expression with color-coded probe pairs. Nat Biotechnol (2008) 26(3):317–25. doi:10.1038/nbt1385
31. Bustin S, Benes V, Garson J, Hellemans J, Huggett J, Kubista M, et al. The MIQE guidelines: minimum information for publication of quantitative real-time PCR experiments. Clin Chem (2009) 55(4):611–22. doi:10.1373/clinchem.2008.112797
32. Bentzen S. Preventing or reducing late side effects of radiation therapy: radiobiology meets molecular pathology. Nat Rev Cancer (2006) 6:702–13. doi:10.1038/nrc1950
33. Zhao W, Diz D, Robbins M. Oxidative damage pathways in relation to normal tissue injury. Br J Radiol (2007) 80(Spec No. 1):S23–31. doi:10.1259/bjr/18237646
34. Sprung C, Forrester H, Siva S, Martin O. Immunological markers that predict radiation toxicity. Cancer Lett (2015) 368(2):191–7. doi:10.1016/j.canlet.2015.01.045
35. Fält S, Holmberg K, Lambert B, Wennborg A. Long-term global gene expression patterns in irradiated human lymphocytes. Carcinogenesis (2003) 24(11):1837–45. doi:10.1093/carcin/bgg134
36. Jung K, Sabri S, Hanson J, Xu Y, Wang YW, Lai R, et al. Elevated ARG1 expression in primary monocytes-derived macrophages as a predictor of radiation-induced acute skin toxicities in early breast cancer patients. Cancer Biol Ther (2015) 16(9):1281–8. doi:10.1080/15384047.2015.1056945
37. Hsiao C, Wang D, Kaushal A, Saligan L. Mitochondria-related gene expression changes are associated with fatigue in patients with nonmetastatic prostate cancer receiving external beam radiation therapy. Cancer Nurs (2013) 36(3):189–97. doi:10.1097/NCC.0b013e318263f514
38. Wilson G, Saunders M, Dische S, Richman P, Daley F, Bentzen S. Bcl-2 expression in head and neck cancer: an enigmatic prognostic marker. Int J Radiat Oncol Biol Phys (2001) 49(2):435–41. doi:10.1016/S0360-3016(00)01498-X
39. Nix P, Cawkwell L, Patmore H, Greenman J, Stafford N. Bcl-2 expression predicts radiotherapy failure in laryngeal cancer. Br J Cancer (2005) 92(12):2185–9. doi:10.1038/sj.bjc.6602647
40. Fraga-Guedes C, André S, Mastropasqua M, Botteri E, Toesca A, Rocha R, et al. Angiosarcoma and atypical vascular lesions of the breast: diagnostic and prognostic role of MYC gene amplification and protein expression. Breast Cancer Res Treat (2015) 151(1):131–40. doi:10.1007/s10549-015-3379-2
41. Guo T, Zhang L, Chang NE, Singer S, Maki RG, Antonescu CR. Consistent MYC and FLT4 gene amplification in radiation-induced angiosarcoma but not in other radiation-associated atypical vascular lesions. Genes Chromosomes Cancer (2011) 50(1):25–33. doi:10.1002/gcc.20827
42. Cenci T, Martini M, Montano N, D’Alessandris Q, Falchetti M, Annibali D, et al. Prognostic relevance of c-Myc and BMI1 expression in patients with glioblastoma. Am J Clin Pathol (2012) 138:390–6. doi:10.1309/AJCPRXHNJQLO09QA
43. Gruel G, Voisin P, Vaurijoux A, Roch-Lefevre S, Grégoire E, Maltere P, et al. Broad modulation of gene expression in CD4+ lymphocyte subpopulations in response to low doses of ionizing radiation. Radiat Res (2008) 170(3):335–44. doi:10.1667/RR1147.1
44. West C, Barnett G. Genetics and genomics of radiotherapy toxicity: towards prediction. Genome Med (2011) 3(8):52. doi:10.1186/gm268
45. Badie C, Iliakis G, Foray N, Alsbeih G, Pantellias GE, Okayasu R, et al. Defective repair of DNA double-strand breaks and chromosome damage in fibroblasts from a radiosensitive leukemia patient. Cancer Res (1995) 55(6):1232–4.
46. Badie C, Goodhardt M, Waugh A, Doyen N, Foray N, Calsou P, et al. A DNA double-strand break defective fibroblast cell line (180BR) derived from a radiosensitive patient represents a new mutant phenotype. Cancer Res (1997) 57(20):4600–7.
47. Correa C, Cheung V. Genetic variation in radiation-induced expression phenotypes. Am J Hum Genet (2004) 75(5):885–90. doi:10.1086/425221
48. Fry R, Svensson J, Valiathan C, Wang E, Hogan BJ, Bhattacharya S, et al. Genomic predictors of interindividual differences in response to DNA damaging agents. Genes Dev (2008) 22(19):2621–6. doi:10.1101/gad.1688508
49. Carter S, Eklund A, Kohane I, Harris L, Szallasi Z. A signature of chromosomal instability inferred from gene expression profiles predicts clinical outcome in multiple human cancers. Nat Genet (2006) 38(9):1043–8. doi:10.1038/ng1861
50. Badie C, Dziwura S, Raffy C, Tsigani T, Alsbeih G, Moody J, et al. Aberrant CDKN1A transcriptional response associates with abnormal sensitivity to radiation treatment. Br J Cancer (2008) 98(11):1845–51. doi:10.1038/sj.bjc.6604381
51. Rieger K, Hong W, Tusher V, Tang J, Tibshirani R, Chu G. Toxicity from radiation therapy associated with abnormal transcriptional responses to DNA damage. Proc Natl Acad Sci U S A (2004) 101(17):6635–40. doi:10.1073/pnas.0307761101
52. Svensson J, Stalpers L, Esveldt-van Lange R, Franken N, Haveman J, Klein B, et al. Analysis of gene expression using gene sets discriminates cancer patients with and without late radiation toxicity. PLoS Med (2006) 3(10):e422. doi:10.1371/journal.pmed.0030422
53. Adawi A, Zhang Y, Baggs R, Rubin P, Williams J, Finkelstein J, et al. Blockade of CD40-CD40 ligand interactions protects against radiation-induced pulmonary inflammation and fibrosis. Clin Immunol Immunopathol (1998) 89(3):222–30. doi:10.1006/clin.1998.4606
54. Gu X, Boldrup L, Coates P, Fahraeus R, Nylander E, Loizou C, et al. Epigenetic regulation of OAS2 shows disease-specific DNA methylation profiles at individual CpG sites. Sci Rep (2016) 6:32579. doi:10.1038/srep32579
55. Zhou Y, Kang M, Jha B, Silverman R, Lee C, Elias J. Role of ribonuclease L in viral pathogen-associated molecular pattern/influenza virus and cigarette smoke-induced inflammation and remodelling. J Immunol (2013) 191:2637–46. doi:10.4049/jimmunol.1300082
56. Bertini R, Allegretti M, Bizzarri C, Moriconi A, Locati M, Zampella G, et al. Noncompetitive allosteric inhibitors of the inflammatory chemokine receptors CXCR1 and CXCR2: prevention of reperfusion injury. Proc Natl Acad Sci U S A (2004) 101(32):11791–6. doi:10.1073/pnas.0402090101
57. Lopes A, Brandolini L, Aramini A, Bianchini G, Silva R, Zaperlon A, et al. DF2755A, a novel non-competitive allosteric inhibitor of CXCR1/2, reduces inflammatory and post-operative pain. Pharmacol Res (2016) 103:69–79. doi:10.1016/j.phrs.2015.11.005
Keywords: radiation, inflammation, toxicity, biomarker, transcription
Citation: Manning G, Tichý A, Sirák I and Badie C (2017) Radiotherapy-Associated Long-term Modification of Expression of the Inflammatory Biomarker Genes ARG1, BCL2L1, and MYC. Front. Immunol. 8:412. doi: 10.3389/fimmu.2017.00412
Received: 13 December 2016; Accepted: 23 March 2017;
Published: 10 April 2017
Edited by:
Benjamin Frey, University of Erlangen-Nuremberg, GermanyReviewed by:
Ulrike Kulka, Federal Office for Radiation Protection, GermanyMichael Abend, Bundeswehr Institute of Radiobiology, Germany
Copyright: © 2017 Manning, Tichý, Sirák and Badie. This is an open-access article distributed under the terms of the Creative Commons Attribution License (CC BY). The use, distribution or reproduction in other forums is permitted, provided the original author(s) or licensor are credited and that the original publication in this journal is cited, in accordance with accepted academic practice. No use, distribution or reproduction is permitted which does not comply with these terms.
*Correspondence: Christophe Badie, Y2hyaXN0b3BoZS5iYWRpZUBwaGUuZ292LnVr