 Léanie Kleynhans1
 Sheena Ruzive1
 Lizaan Ehlers1Lani Thiart1
 Novel N. Chegou1
 Magda Conradie2Magdalena Kriel1
 Kim Stanley1
 Gian D. van der Spuy1
 Martin Kidd3Paul D. van Helden1
 Gerhard Walzl1
 Katharina Ronacher1,4*
- 1SA MRC Centre for TB Research, DST/NRF Centre of Excellence for Biomedical Tuberculosis Research, Division of Molecular Biology and Human Genetics, Faculty of Medicine and Health Sciences, Department of Biomedical Sciences, Stellenbosch University, Cape Town, South Africa
- 2Division of Endocrinology and Metabolism, Faculty of Medicine and Health Sciences, Department of Medicine, Stellenbosch University, Cape Town, South Africa
- 3Centre for Statistical Consultation, Stellenbosch University, Stellenbosch, South Africa
- 4Translational Research Institute, Mater Research Institute, The University of Queensland, Brisbane, QLD, Australia
A bidirectional communication between the immune and endocrine systems exists and facilitates optimum responses in the host during infections. This is in part achieved through changes in secretion patterns of hypothalamic hormones induced by inflammatory cytokines. The aim of this study was to elucidate the immune–endocrine alterations during tuberculosis (TB) treatment in patients with cured and failed TB treatment outcomes. Blood samples were collected from 27 cured and 10 failed patients and hormone as well as cytokine concentrations quantified at baseline, week 4, and month 6 of TB treatment. Hormone profiles of the two treatment outcome groups were different from each other prior to as well as during TB treatment. Treatment response effects were observed for cortisol, estradiol, T3, T4 ghrelin, leptin, amylin, adiponectin, and dehydroepiandrosterone (DHEA). Trends suggest that T4, amylin, and DHEA concentrations were different between treatment outcomes, although these did not reach statistical significance. Relationships between endocrine and inflammatory markers and the biological pathways involved differed between cured and failed treatment patients. These results highlight the complex interaction between the endocrine and immune system during active TB disease and throughout treatment and suggest that endocrine markers in conjunction with inflammatory markers may be useful in predicting unfavorable treatment outcomes.
Introduction
Tuberculosis (TB), caused by Mycobacterium tuberculosis (M.tb), is a major global health threat, particularly in developing countries and continues to claim approximately two million lives every year (1). According to the World Health Organization, South Africa is estimated to have the highest TB incidence at 860 per 100,000 population (1). The estimated detection rate for TB increased from 58 to 69% between 2000 and 2013 (1). However, approaches to control TB have failed to contain the epidemic. In addition, rapidly increasing rates of recurrent TB episodes and increasing rates of multi-drug resistant (MDR) TB present a startling public health emergency (2).
In response to an infection, cytokines like interleukin (IL)-1, IL-6, and tumor necrosis factor (TNF)α, produced by immune cells, can activate the hypothalamus–pituitary–adrenal (HPA) axis, which results in the secretion of cortisol (3). These cytokines furthermore affect the functioning of the hypothalamus–pituitary–thyroid (HPT) axis (4) as well as the hypothalamus–pituitary–gonadal (HPG) axis (resulting in decreased secretion of androgenic hormones) (5, 6). Cortisol, in turn, inhibits the mycobacterial antigen-induced cytokine response of peripheral blood mononuclear cells (7, 8). This communication pattern exists due to the fact that cytokine-producing cells as well as hormone-producing cells share common receptors and ligands (9). This bidirectional communication between the immune and endocrine system facilitates optimal responses and maintains homeostasis in the host.
Immune and endocrine alterations were observed in TB patients, characterized by increased cortisol, estradiol, prolactin, growth hormone, thyroid hormone, and dopamine concentrations, which were accompanied by increased interferon (IFN)γ, TNFα, C-reactive protein (CRP), IL-1α, IL-6, and IL-10 concentrations when compared to healthy controls (4, 10–12). TB patients furthermore had decreased dehydroepiandrosterone (DHEA) and testosterone concentrations, alterations that were more evident in individuals diagnosed with advanced TB disease. Leptin concentrations were decreased and ghrelin concentrations increased with increasing disease severity (11, 13, 14). Epinephrine concentrations were also lower in TB patients (12). Differences in hormone concentrations in the context of TB were mostly evaluated at baseline with limited reference being made to endocrine profile changes during TB treatment. In one such study, Bongiovanni et al. showed that cortisol plasma concentrations decreased during TB treatment together with IL-6, CRP, and IL-1β (15). Additionally, DHEA plasma concentrations increased during TB treatment.
The aim of this study was to elucidate the immune–endocrine alterations during TB treatment in a cohort of HIV negative TB patients with different treatment outcomes. The study collectively investigated the concentrations of 12 hormones, ranging from peptide to steroid hormones, during the course of TB treatment in cured patients and in patients with treatment failure. These included cortisol, DHEA, T3, T4, adiponectin, leptin, ghrelin, active amylin, total amylin, growth hormone, estradiol, and progesterone. Furthermore, the association of the hormone concentrations with 30 immune markers including cytokines, chemokines, growth factors, soluble receptors, acute phase proteins, and matrix metalloproteinases (MMPs) was determined. This study is unique in that it is the first treatment response study that investigates alterations in hormone concentrations in patients with two different treatment outcomes, namely cured and treatment failure. We show that the hormone profiles change during TB treatment and that the concentrations of different hormones correlate with the concentrations of cytokines. These results emphasize the complex interaction between the endocrine and the immune systems during TB treatment and suggest that hormone concentrations in conjunction with inflammatory marker concentrations may be useful as biomarkers for TB treatment response.
Materials and Methods
Ethics Statement
Ethical approval was obtained from the Health Research Ethics Committee of the University of Stellenbosch and the City of Cape Town City Health. The study was conducted according to the Helsinki Declaration and International Conference of Harmonization guidelines. Written informed consent was obtained from all study participants.
Study Subjects
Study participants, 27 cured and 10 failed TB patients, were enrolled and treated at 5 TB clinics surrounding Tygerberg Hospital in Cape Town, South Africa, between May 1999 and July 2002, as part of the Action TB study (16). The HIV uninfected pulmonary TB patients were all from the South African Colored ethnic group and were untreated at the time of enrollment with a first episode of TB. All TB patients received directly observed treatment, which consisted of an intensive phase (2 months) of rifampicin (RIF), isoniazid (INH), pyrazinamide, and ethambutol (EMB) followed by a continuation phase (4 months) of RIF and INH. The 2-month intensive phase was prolonged to 3 months if smear conversion did not occur at 2 months. The percentage of individuals requiring extended intensive phase was 15 and 45% for the cured and failed group, respectively. Patients were between the ages of 20 and 65 years. Patients were matched based on their gender and sample storage time. Individuals who had two consecutive negative culture results at the end of treatment were regarded as successfully cured whereas those who had a positive culture result at month 6 had failed treatment. All individuals adhered to treatment (>80% of drugs taken) and were infected with drug sensitive M.tb strains. No distinct differences in strain types were observed between failed and cured patients. Patients were excluded if they previously had TB; MDR TB, were HIV positive, presented with diabetes, malignancy, lung cancer, chronic bronchitis, or sarcoidosis, were on steroid treatment or were pregnant. Chest X-rays (CXRs) were only obtained at baseline and were read independently in a blinded fashion by a pulmonologist or clinician as previously described (17).
Sample Collection and Processing
Samples were collected between 09h00 and 12h00 every day. Clinical information on age, sex, weight, and height (BMI) was recorded. Sputum samples were obtained at baseline and at week 4 and month 6 of treatment. Sputum smear microscopy was done using the Ziehl–Neelsen method and quantitative smear grading done according to the International Union Against Tuberculosis and Lung Disease guidelines (18). The same sample that was used for sputum smear microscopy was used to determine time-to-positivity in liquid culture using the BACTEC 12B liquid radiometric method (BD, NJ, USA) as previously described (16). At each of the indicated time points, blood was drawn, and the serum and plasma aliquoted and stored at −80°C.
Quantification of Serum Cytokine and Plasma Hormone Concentrations by Multiplex Bead Array
Thirty cytokines, chemokines, growth factors, soluble receptors, and acute phase proteins were measured in serum using different Linco-plex kits (Millipore, Billerica, MA, USA). These were regular sensitivity kits for Eotaxin, G-CSF, GM-CSF, GRO, IFNα2, IFNγ, IL-1α, IL-1β, IL-9, IL-12(p40), IP-10, MIP-1α, MIP-1β, TNFα, TNFβ, and VEGF; high sensitivity kits for IL-5, IL-8, IL-10, IL-12(p70), and IL-13; soluble receptor kits for sIL-2Rα, sIL-4R, sIL-6R, and sVEGFRI; acute phase protein kits for CRP, SAP A, and SAP P; and MMP kits for MMP-2 and MMP-9. Metabolic hormone kits (Merck-Millipore, MI, USA) were used to quantify plasma concentrations of amylin (active), leptin, and ghrelin. T3, T4, cortisol, estradiol, and progesterone concentrations were quantified using steroid/thyroid hormone kits (Merck-Millipore). Assays were done according to the manufacturer’s instructions. Concentrations of the markers were measured on a Bio Plex platform (Bio-Plex™, Bio-Rad Laboratories, Hercules, CA, USA). All samples, quality controls (QCs), and inter-plate control were run in duplicate. Concentrations of all the analytes in the QCs were within the expected ranges and the inter-plate variation below 20%. The data generated were managed using Bio-Plex Manager Software, version 4.1.1.
Quantification of Plasma Hormone Concentrations by ELISA
Plasma concentrations of DHEA (DRG Instruments GmbH, Marburg, Germany), growth hormone (Abnova, Taipei City, Taiwan), adiponectin (Merck-Millipore), and total amylin (Merck-Millipore) were measured by ELISA according to the manufacturer’s instructions. Hormone concentrations were detected by a Bio-Rad Microplate reader with Microplate Manager Software, version 5.2 build 103 (Bio Rad Laboratories).
Data and Statistical Analysis
For multiplex assays, data were analyzed using the R programming statistical package (The R Foundation for Statistical Computing, Vienna, Austria). Missing values were imputed using random-forest imputation from the mice package. Data for two participants could not be imputed and were excluded from the analysis on hormone data. Fifty imputed data sets were generated for analysis. Values that were too low to be extrapolated by the Bio-Plex Manager Software were randomly imputed in each of the 50 data sets according to maximum likelihood log-normal distributions created for each analyte using the bbmle and fitdistrplus packages. Hormone concentrations were analyzed with a linear mixed-effects model using lmer from the lme4 package and a glht post hoc test from the multcomp package. Treatment outcome and time point were fixed effects and patient identification a random effect. The assumption of the mixed-effect model was that the residuals after fitting the model were normally distributed. qqplots indicated outliers were present in estradiol, ghrelin, leptin, and DHEA with extreme outliers present in progesterone. To test the sensitivity of the models, outliers were removed using Cook’s distance metric until the Shapiro–Francia test, from the nortest package, did not detect deviation from the normal distribution at p ≤ 0.05. Results remained unchanged, i.e., statistical differences remained, after excluding the outliers. This was, however, not true for progesterone and we excluded the hormone from the analysis. Data are presented as means and SDs of the log-transformed data. To determine the linear relationship between different hormones and between hormones and cytokines, a Pearson correlation on quantile normalized data was used. Average Pearson correlation coefficients and p-values of 50 imputed data sets are reported. A principal component analysis (PCA) was used to evaluate the strengths of the relations between variables in cured and failed patients using the prcomp function and the bi-plots reported. Prediction models were developed using Elastic-Net regression analysis (with a parameter setting of alpha = 0.5) from the glmnet package. Variables that predicted hormone or cytokine concentrations in more than 60% of the 50 imputed datasets were included in the model.
Qlucore Omics Explorer (Lund, Sweden) was used to generate heat maps of the log-transformed means of the hormones and Ingenuity Pathway Analysis (IPA) (Qiagen, Redwood City, CA, USA) used to determine the canonical pathways in which inflammatory markers were involved.
Results
Baseline Characteristics
The aim of this study was to investigate immune and endocrine responses during the course of TB chemotherapy in patients with successful and unsuccessful treatment outcomes. BMI (kg/m2) was determined at each clinic visit and was previously shown to be a good predictor of poor treatment outcome (19). We found that the BMI increased, in both groups, during TB treatment, and were not different between the two groups at any of the three time points (Table 1). Corrections for BMI in subsequent analysis were therefore omitted. In addition, there were no differences with respect to age, sex distribution, and CXR score (Table 1).
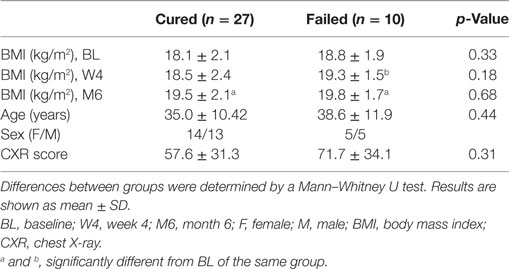
Table 1. Characteristics of study groups.
Hormone Profiles in TB Patients Changed during the Course of Treatment
Cortisol, DHEA, and leptin concentrations in particular were characterized in the context of TB, by comparing the hormone concentrations of TB patients to those of healthy controls (4, 10). Limited information is available on other endogenous hormones, especially on how their concentrations are affected by TB treatment. We thus investigated hormonal changes in individuals diagnosed with TB, during TB treatment. The hormone profiles of the two different treatment outcome groups were different from each other and different treatment responses were observed for cortisol, T4, amylin (total), and DHEA (Figure 1).
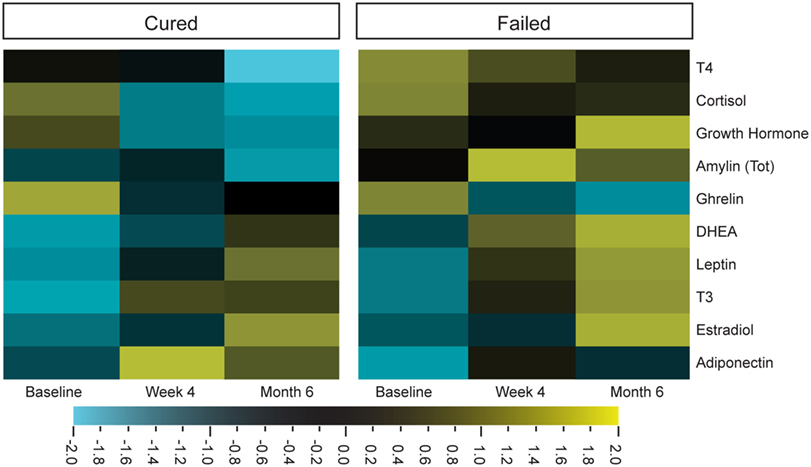
Figure 1. Differential expression of plasma hormone concentrations before (baseline), during (week 4), and after tuberculosis treatment (month 6). Hormone concentrations, measured by Luminex (cortisol, T3, T4, ghrelin, leptin, and estradiol) and ELISA [dehydroepiandrosterone (DHEA), amylin (Tot), adiponectin, and growth hormone], were clustered according to group and time point (cured group n = 25 and failed group n = 10). Qlucore Omics explorer software was used to generate the heat maps around the mean hormone concentrations of the log-transformed data. Bright yellow indicates +2 (fourfold) upregulation from the mean (black) and bright blue indicates a −2 downregulation from the mean.
Univariate analysis showed that cortisol concentrations significantly decreased in cured patients from baseline (before TB treatment) to week 4 and remained low until the end of treatment, while cortisol concentrations remained unchanged in the failed group (Figure 2A). The concentrations of the sex hormone estradiol, increased during TB treatment in both groups (Figure 2B). Since we observed the same treatment response in both genders, we reported the pooled data. No differences were detected in growth hormone concentrations (Figure 2C). T3 concentrations significantly increased in the failed group from baseline to week 4. The increase in the same groups from week 4 to month 6 did not reach statistical significance (Figure 2D). In the cured group, on the other hand, there was a significant increase only from baseline to week 4. TB treatment did not alter T4 concentrations in patients who failed treatment; however, in cured patients, there was a trend that T4 concentrations decreased resulting in month 6 concentrations being lower than in patients who failed treatment (p = 0.050; Figure 2E).
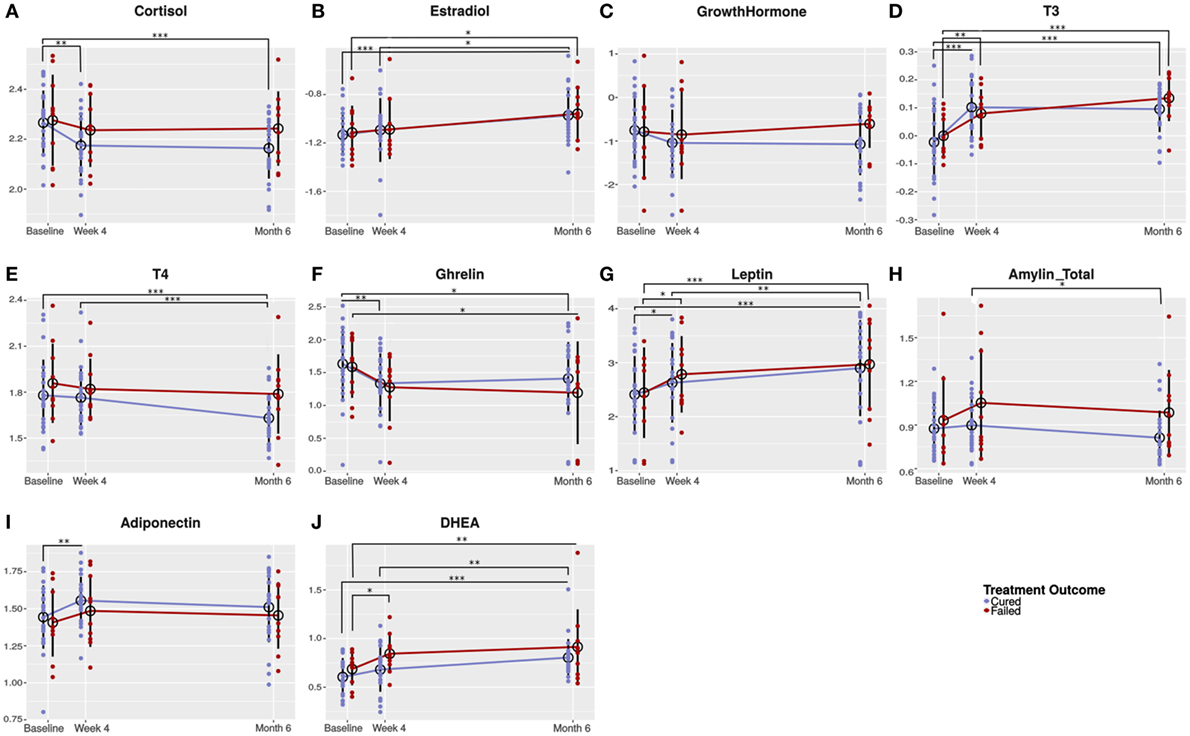
Figure 2. Changes in circulating hormone concentrations during the course of tuberculosis (TB) treatment. Plasma from TB patients (males and females) who were cured (n = 25) and who failed (n = 10) TB treatment were collected before (baseline) and during TB treatment (week 4 and month 6). Plasma collected was subjected to hormone measurement by Luminex analysis [cortisol (A), T3 (D), T4 (E), ghrelin (F), leptin (G), and estradiol (B)] and ELISA [dehydroepiandrosterone (DHEA) (J), amylin (Tot) (H), adiponectin (I), and growth hormone (C)]. Data were analyzed by a linear mixed-effects model of hormone concentrations by treatment outcome and time point as fixed effects and patient ID as random effect. Results are presented as means of the log-transformed data with SD. A p-value of < 0.05 was regarded as significantly different. *p-value < 0.05; **p-value < 0.01; ***p-value < 0.001.
Ghrelin concentrations showed an early treatment response with a significant decrease from baseline to week 4 in the cured groups and a trend toward a decrease in the failed group. Thereafter, in both treatment groups, ghrelin concentrations remained unchanged (Figure 2F). In the cured group, leptin concentrations significantly increased from baseline to week 4 and again from week 4 to month 6 (Figure 2G). In the failed group, leptin concentrations significantly increased from baseline to week 4, but no difference was observed between week 4 and month 6. The increase in leptin observed during treatment is possibly due to the weight gain associated with TB treatment. There was a trend that amylin (total) concentrations increased from baseline to week 4 in the failed group and remained the same until the end of treatment (Figure 2H). In the cured group, amylin (total) concentrations remained unchanged from baseline to week 4 and then significantly decreased from week 4 to month 6. At 4 weeks (p = 0.083) and 6 months (p = 0.050), there were trends that amylin (total) concentrations were lower in cured patients when compared to the failed patient group.
Statistical significant changes in adiponectin concentrations were only observed in the cured patient group (Figure 2I). DHEA concentrations steadily increased during treatment in the cured group, whereas, in the failed group, there was a significant increase from baseline to week 4 (Figure 2J). At week 4, there was a trend that the failed group had higher DHEA concentrations than the cured group (p = 0.056).
Further differences were observed between the two treatment outcome groups when the correlation matrices of the hormones were compared at the three time points (Figure 3). The matrices were used to present the Pearson correlation coefficients and p-values. Changes in the intensity of the colors, representing the direction and significance of the correlations, indicated that there were differences in the hormone–hormone interactions between the two patient groups. As expected, differences were observed at baseline and week 4, but surprisingly there were still differences in the hormone interactions between the two groups at the end of treatment. With the major differences being the significant correlations in the failed group at baseline between ghrelin and adiponectin (r = −0.85, p = 0.00), leptin and DHEA (r = −0.68, p = 0.03), T3 and estradiol (r = −0.86, p = 0.00), and T3 and leptin (r = 0.67, p = 0.04). At month 6, the significant correlations in the failed group were DHEA and cortisol (r = 0.66, p = 0.04), growth hormone and DHEA (r = −0.63, p = 0.05), T3 with leptin (r = 0.70, p = 0.02), and T4 with T3 (r = 0.72, p = 0.02).
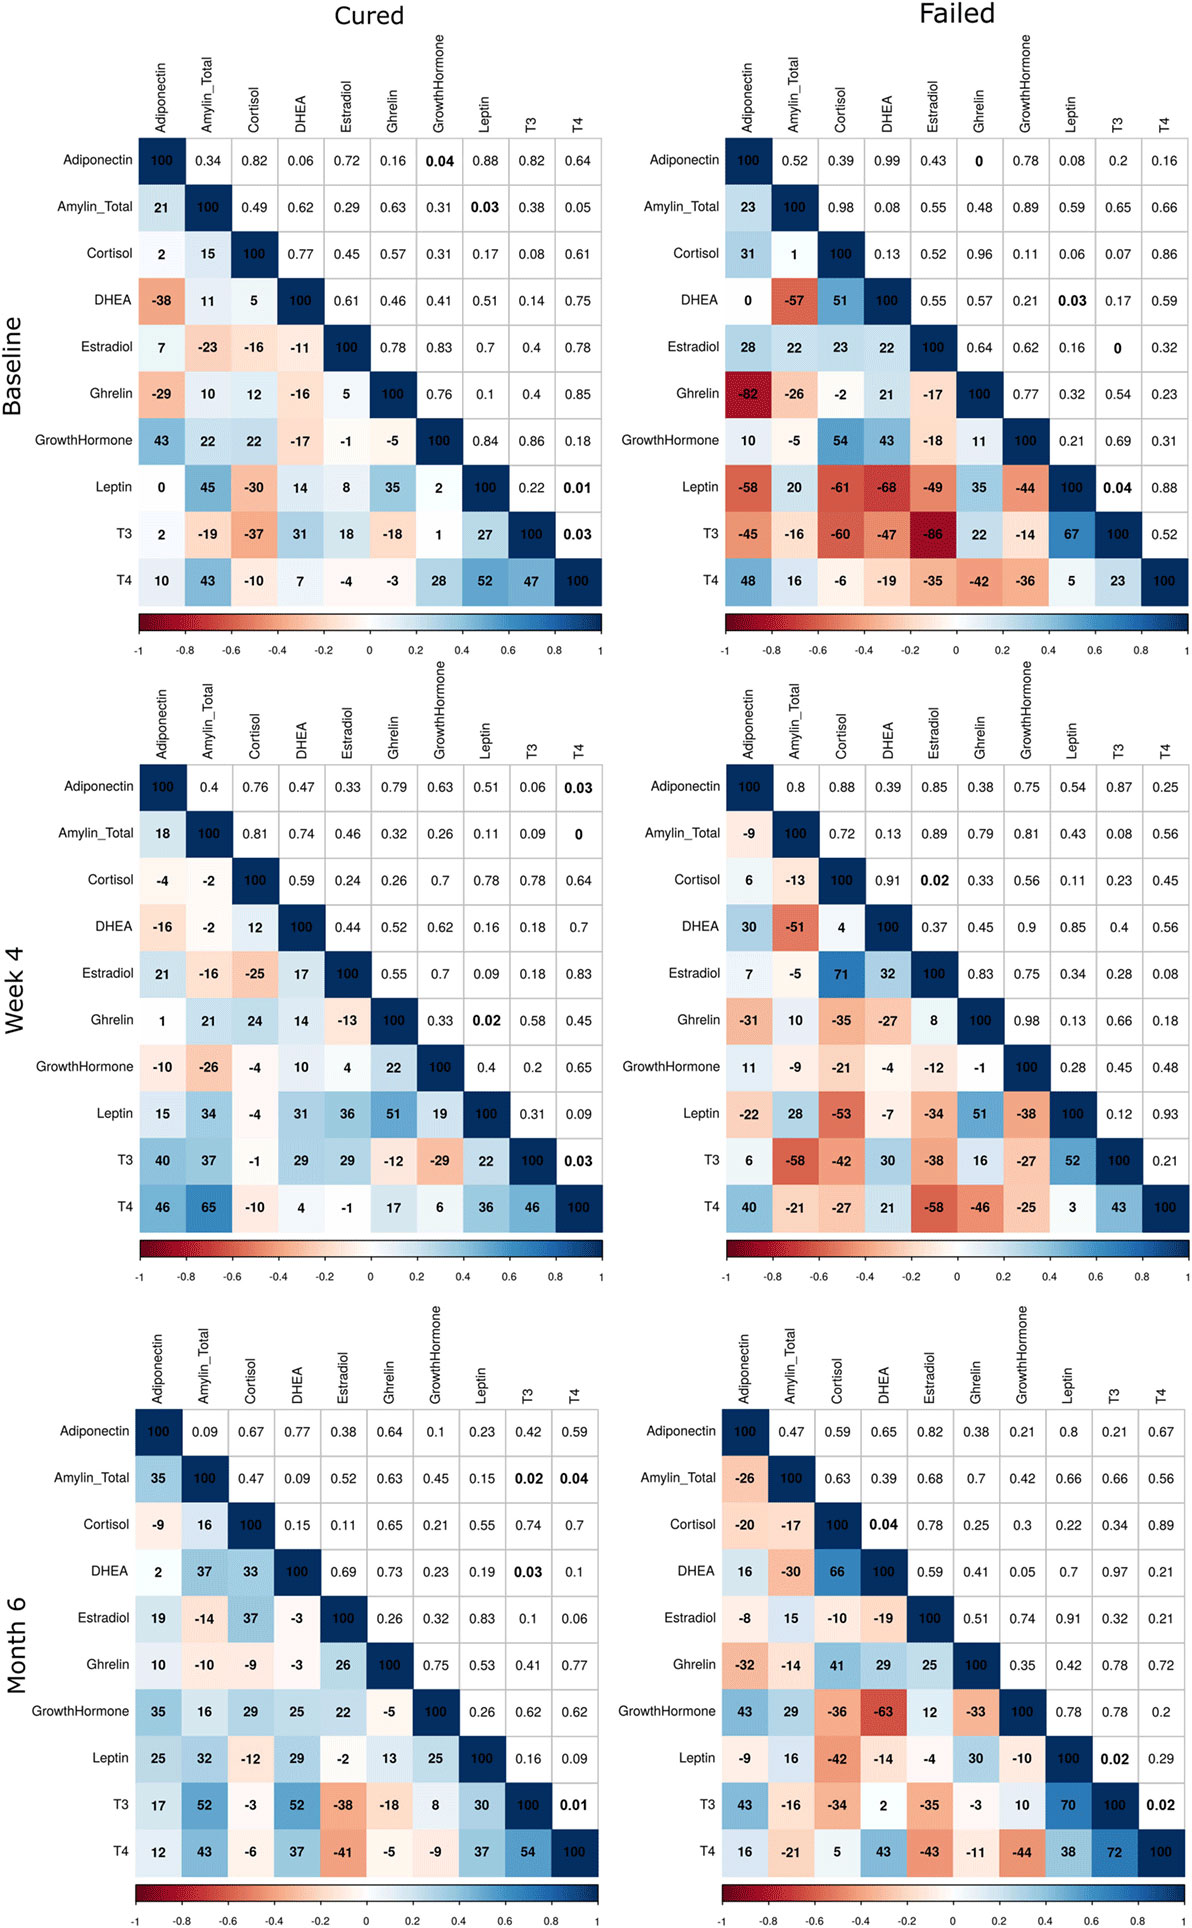
Figure 3. Correlations between plasma hormone concentrations of tuberculosis patients who were cured and who failed treatment at baseline, week 4, and month 6. Hormone concentrations were measured by Luminex analysis (cortisol, T3, T4, ghrelin, leptin, and estradiol) and ELISA [dehydroepiandrosterone (DHEA), amylin (Tot), adiponectin, and growth hormone] (cured: n = 25; failed: n = 10). Average Pearson correlation coefficients and p-values of 50 imputed datasets are presented. Correlation coefficients are expressed as percentages in the colored squares (bottom-left section) and the p-values in the white squares (top-right section). The colorimetric scale represents the correlation coefficient where dark blue squares indicate strong positive correlations (+1) and dark red strong negative correlations (−1).
During TB Treatment, Altered Hormone Concentrations Correlated with Immune Marker Concentrations
In an attempt to understand the immune–endocrine interaction during TB treatment, we investigated whether changes observed in hormone concentrations correlated with concentrations of different immune markers measured at each of the time points. We aimed to determine whether the interactions between immune markers and hormones were different in the two treatment outcome groups. Bi-plots from the PCA suggest that the relationships were different. For example, in the cured group, SAP A, IL-8, IFNγ, and CRP positively correlated with cortisol (Figure 4). It is possible that the increase in inflammatory markers during TB disease results in the increased production of cortisol by means of a feedback mechanism as increased cortisol concentrations subsequently prevent excessive immune responses and immunopathology. Cortisol furthermore negatively correlated with DHEA, T3, sIL-4R, and leptin. In the failed group, interactions between IFNγ, soluble receptors, DHEA, sex hormones, and cortisol varied from those observed in the cured group (Figure 4).
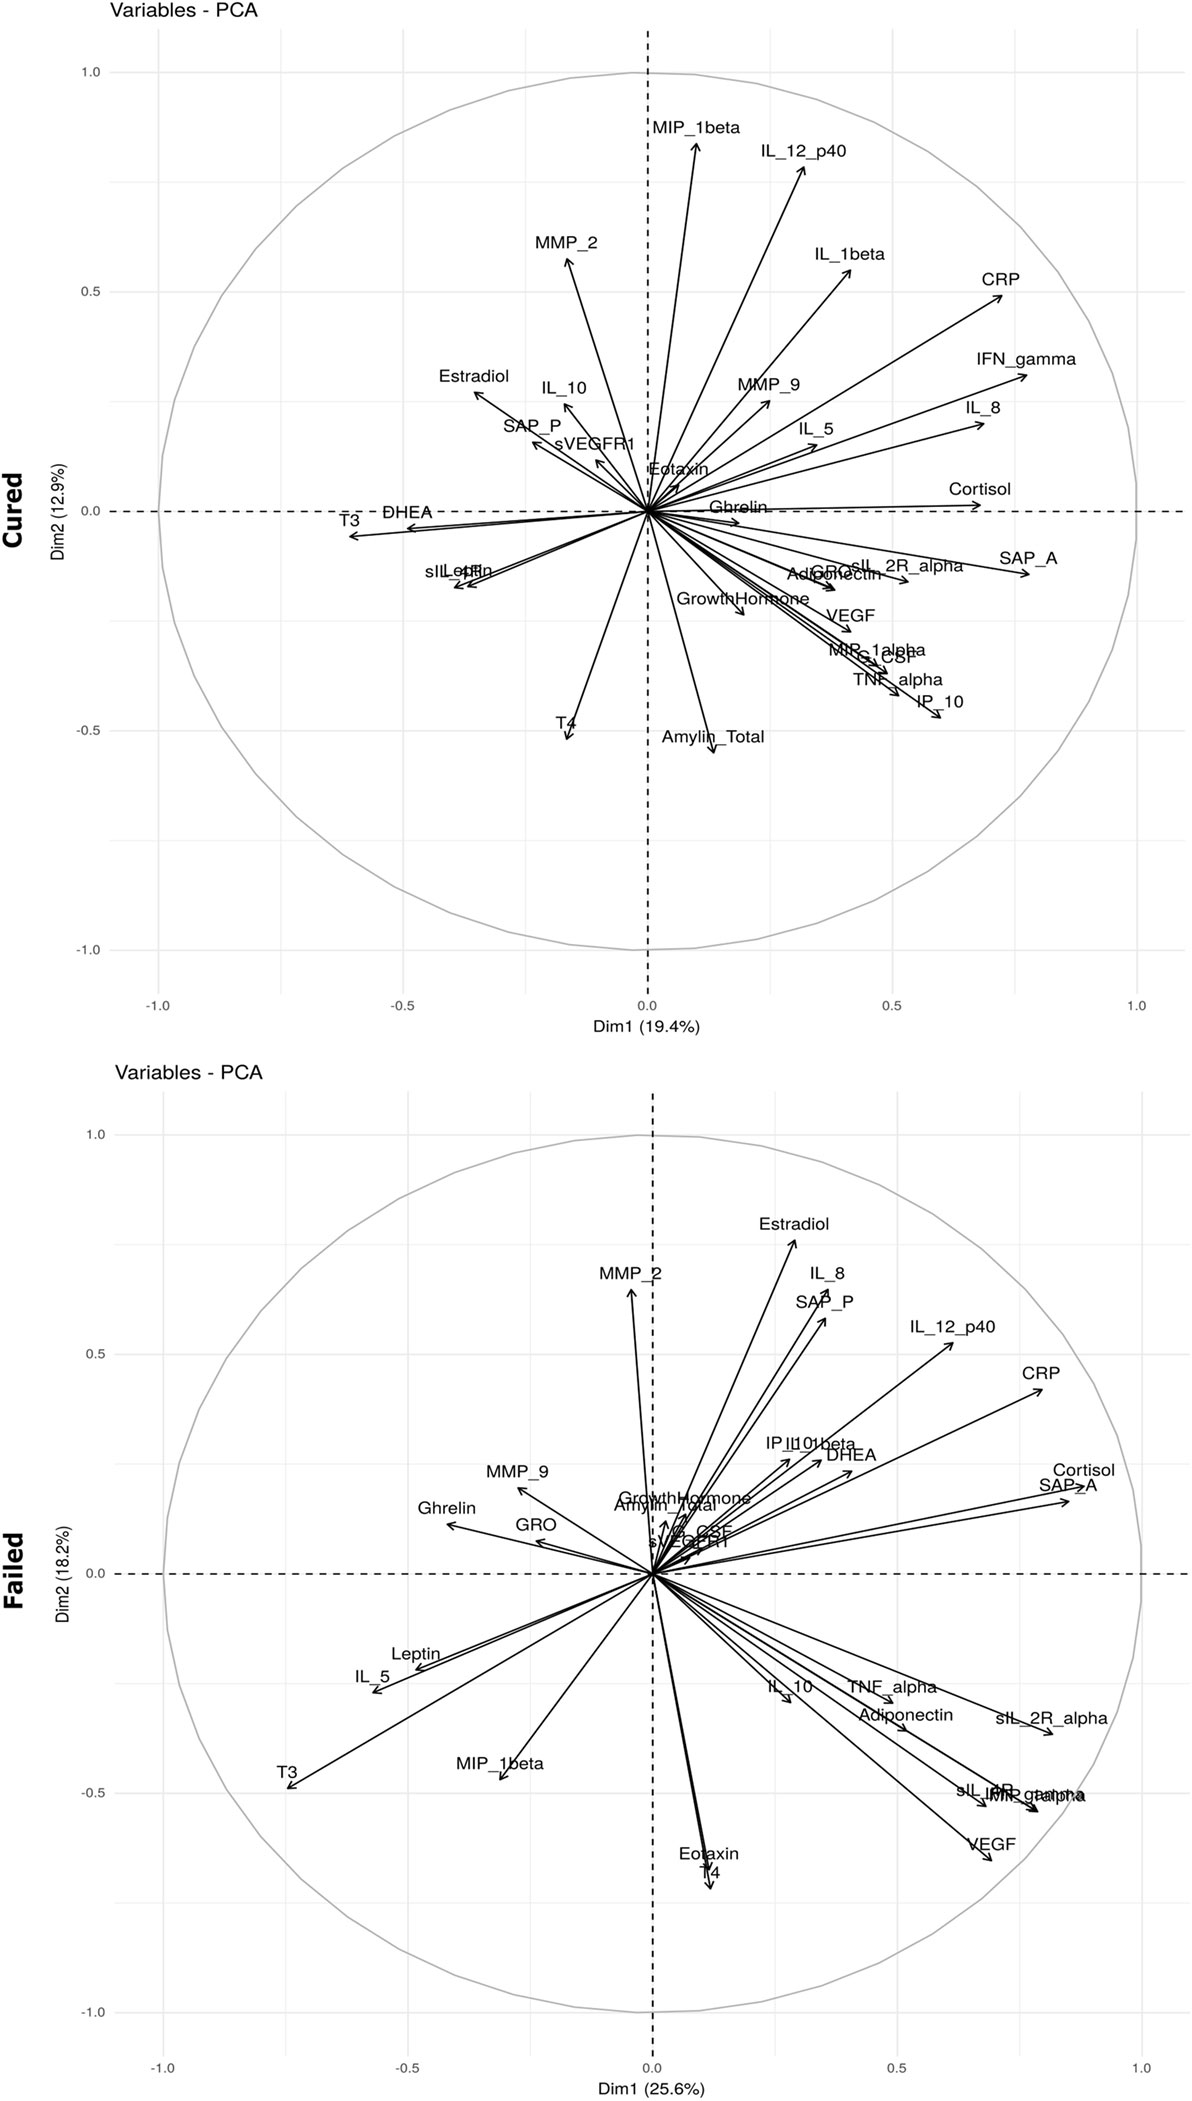
Figure 4. Bi-plots depicting plasma hormone and serum inflammatory marker interaction. Interactions between hormones and inflammatory markers were determined before tuberculosis treatment (baseline) in patients who were cured (n = 25) and those who failed (n = 10) treatment. The principal component analysis (PCA) was done using the prcomp function in R and the bi-plot generated using the factoextra package.
Unique combinations of inflammatory markers correlated with each of the hormones in the cured and failed treatment groups and again, differences between the groups were evident at all three time points (Tables 2–4). During TB treatment, the elevated cortisol concentrations in failed patients negatively correlated with MMP-9 at week 4, whereas in cured patients, a negative correlation was found at the end of treatment with IP-10. DHEA negatively correlated with inflammatory markers in the cured group at baseline and week 4. Interestingly, no correlations were found between DHEA and inflammatory markers in the failed group. Inflammatory markers negatively correlated with T3 in both the cured and failed groups at baseline. At week 4, inflammatory markers continued to negatively correlate with T3 in the cured group, but no correlations were found in the failed group. At the end of treatment, there were no correlations with T3 in cured group whereas, in the failed group, TNFα positively correlated with T3. T4 concentrations did not correlate with any inflammatory markers in the cured group, but positively correlated with markers at week 4 and month 6 in the failed group. High amylin (total) concentrations in the failed group positively correlated with sIL-2Rα at week 4, while concentrations of this hormone negatively correlated with MIP-1β at baseline in the cured group. These data point toward a dynamic interplay between the immune and endocrine system that is vastly different between the two treatment outcomes.
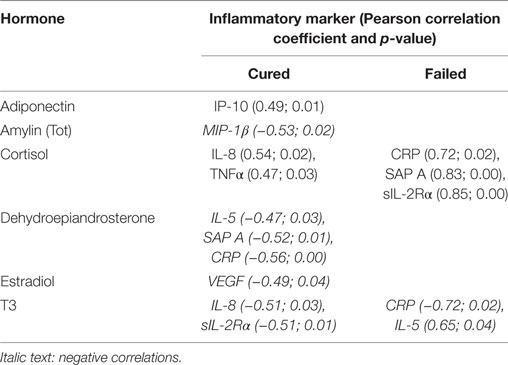
Table 2. Baseline correlations between hormones and inflammatory markers.
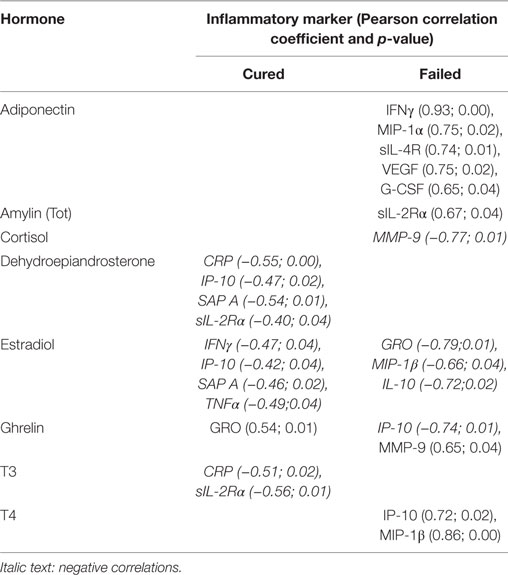
Table 3. Week 4 correlations between hormones and inflammatory markers.
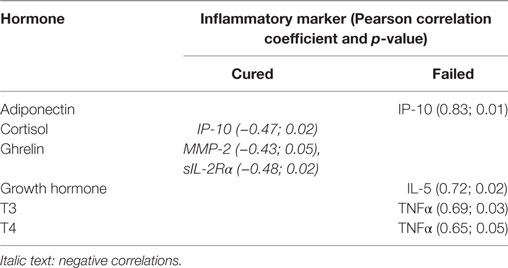
Table 4. Month 6 correlations between hormones and inflammatory markers.
The IPA software was used to identify the biological functions and immunological pathways in which the group of markers which correlated with a particular hormone, in a particular response group, at a particular time point were involved, regardless of whether there was a positive or negative correlation. Canonical pathways associated with the hormones in a group over all time points were pooled and the unique pathways, which distinguished the two patient groups, reported in Table 5. Pathways associated with hormones in the cured group were the inflammasome pathway, cytokine-mediated communication between immune cells, VEGF ligand–receptor interactions, and signaling of the myeloid cell receptor, triggering receptor expressed on myeloid cells 1 (TREM1). Pathways associated with hormones in the failed group were the adhesion and diapedesis of agranulocytes and granulocytes, hepatic fibrosis/stellate cell activation, and liver X receptor (LXR) and farnesoid X receptor (FXR) activation (Table 5). The inflammasome pathway in the cured group was associated with T3 concentrations at baseline that correlated with IL-8 and sIL-2Rα (Table 2). The role of cytokines in mediating communication between immune cells and the TREM1 signaling pathway were both associated with cortisol concentrations at baseline that correlated with IL-8 and TNFα. The VEGF family ligand–receptor interaction pathway was associated with estradiol concentrations that correlated with VEGF at baseline. In the failed group, agranulocyte adhesion and diapedesis were associated with ghrelin concentrations (week 4) correlating with IP-10 and MMP-9 (Table 3). Granulocyte adhesion and diapedesis was associated with adiponectin (week 4) that correlated with IFNγ, MIP-1α, sIL-4R, VEGF, and G-CSF, estradiol (week 4) that correlated with GRO, MIP-1β, and IL-10, and ghrelin (week 4) that correlated with IP-10 and MMP-9. Hepatic fibrosis/hepatic stellate cell activation was also associated with adiponectin concentrations at week 4, whereas the LXR/retinoid-X-receptor (RXR) and FXR/RXR activation pathway were associated with cortisol at baseline correlating with CRP, SAP A, and sIL-2Rα. This indicates that markers associated with cortisol, T3, and estradiol at baseline drive the unique pathways, identified in the cured group whereas markers correlating with ghrelin, adiponectin, and estradiol at week 4 and cortisol at baseline primarily drive the pathways unique to the failed group.
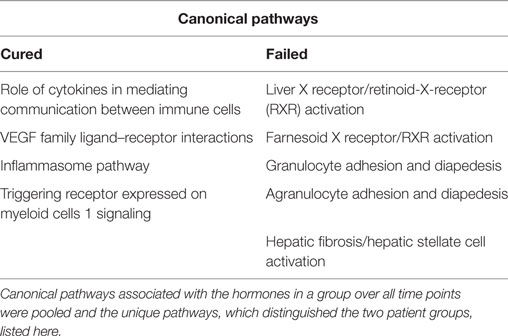
Table 5. Unique canonical pathways associated with inflammatory markers which correlate with the hormones in patients who were cured and patients who were not successfully cured after tuberculosis treatment.
Hormones Predicted Cytokine Concentrations
In a further attempt to understand the interplay between the immune and endocrine system, we determined whether hormone concentrations could predict cytokine concentrations and vice versa. An Elastic-Net regression was used to determine which markers predicted which in 50 imputed datasets and predictions which occurred in at least 60% of the imputed datasets were reported. Not only did inflammatory markers predict hormone concentrations (Table 6) but some hormones also predicted inflammatory marker concentrations (Table 7). GRO and SAP A predicted ghrelin concentrations in 98% of the datasets, SAP P predicted ghrelin concentrations in 96%, and IL-12p40 in 92% of the datasets. SAP P predicted estradiol concentrations along with MMP-2 in 94 and 82% of the datasets, respectively. MMP-2 furthermore predicted adiponectin concentrations in 90% of the datasets. G-CSF predicted T4 and leptin concentrations in 94% of the datasets. As expected, TNFα and IFNγ predicted cortisol concentrations, and this was true in 80% of the imputed datasets. VEGF (60%) and its receptor, sVEGFR1 (88%), predicted IFNγ and amylin (total) concentrations.
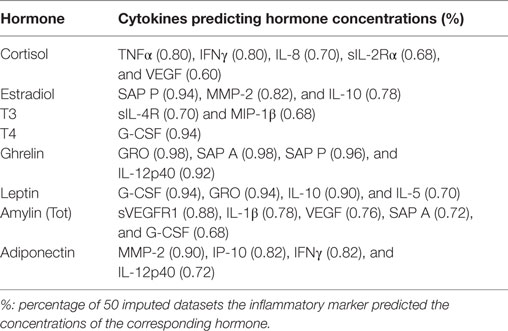
Table 6. Cytokine predictors of hormone concentrations.
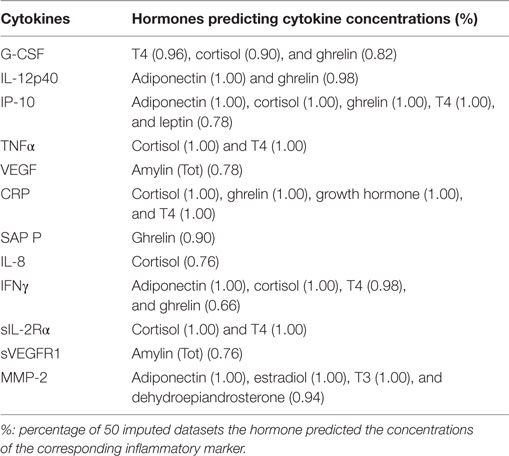
Table 7. Hormone predictors of cytokine concentrations.
Hormones were also good predictors of inflammatory marker concentrations. Adiponectin predicted IL-12p40 concentrations in all the datasets. Adiponectin, cortisol, ghrelin, and T4 predicted IP-10 concentrations; cortisol and T4 predicted TNFα concentrations, cortisol, ghrelin, growth hormone, and T4 predicted CRP concentrations; adiponectin and cortisol predicted IFNγ concentrations; cortisol and T4 sIL-2Rα concentrations and adiponectin, estradiol, and T3 predicted MMP-2 concentrations, all with the same frequency.
Discussion
By exploring a wide range of biological markers, including hormones and inflammatory molecules, a better understanding of pathogen-induced immunopathology during TB can be attained. In an attempt to understand these interactions during M.tb infection, Santucci et al. investigated the multifaceted immune–endocrine–metabolic alterations in patients with different severities of pulmonary TB (11). Bongiovanni et al. reported the immune–endocrine responses during TB treatment (15). However, both these studies investigated a limited number of hormones and immunological markers.
In this report, we included a range of hormones, immunological markers, and comprehensive correlations to investigate the immune–endocrine interaction. We found that the hormone profile of individuals who are successfully cured after completing the 6-month TB treatment regimen differed from those who failed TB treatment. We showed that estradiol, T3, leptin, and DHEA concentrations increased and that cortisol, T4, ghrelin, and amylin (total) concentrations decreased during TB treatment. Cortisol, T4, amylin (total), and DHEA concentrations remained lower in the cured patients. We furthermore showed that hormone concentrations correlated with different groups of immunological markers. We were able to identify immunological pathways for the groups of markers that correlated with hormones in the different patient groups. This study, however, has several limitations such as the small sample sizes and the fact that dietary intake and blood collection time was not standardized. Not only hormone but also cytokine concentrations, for instance, IL-1β are known to change post-prandially (20), yet this is almost never considered in TB biomarker studies available in the literature and should be taken into account in any future studies. Despite the limitations, typical treatment responses were observed when looking at the changes in hormone concentrations during TB treatment and it would appear that cortisol, DHEA, T4, and amylin (total) are the major role players in the host response to M.tb and are potential marker candidates to differentiate treatment outcome.
Cortisol concentrations are higher in TB cases than in healthy controls at baseline and increase as disease severity increases (4, 11). DHEA concentrations on the other hand are lower in TB cases than controls and further decrease as disease severity increases (4). In keeping with and extending these results, we found that cortisol concentrations decreased during TB treatment in cured patients, but remain unchanged in patients with a failed treatment outcome, whereas DHEA concentrations suddenly increased in the failed treatment outcome group from baseline to week 4 and gradually increase in the cured group during treatment. We showed that cortisol concentrations positively correlated with acute phase proteins and soluble cytokine receptors before TB treatment. Cytokines produced during the course of the immune response induce alterations in the concentrations of hormones produced by the HPA, HPT, and HPG axis (21). The positive correlation observed between cortisol and inflammatory markers at baseline forms part of a feedback mechanism to limit the inflammatory response associated with active disease.
T3 and its precursor, T4, are primarily involved in metabolism and T3 promotes the production of pro-inflammatory markers (22). T3 and T4 also promote the catabolic state in TB patients (4). In some studies, T3 and T4 concentrations were found to be higher in TB patients (4, 23), while in others they were lower in TB patients and increased during TB treatment (24, 25). Extremely low T3 concentrations have been further associated with mortality in TB patients (25). We found that T3 concentrations increased during TB and that T4 concentrations remained unchanged in the failed group. T4 concentrations were lower in the cured group, compared to the failed group, at month 6.
Leptin concentrations are lower in TB patients (11) and low leptin concentrations and increased IL-6 concentrations are associated with wasting and weight loss in TB patients (26). Santucci et al. found a positive correlation between leptin concentrations and BMI (11), while another study found no correlation between these two parameters (27). Animal experiments suggest that leptin contributes to protection against M.tb by inducing Th1 cytokine responses (28). Such a role has not yet been conclusively shown in humans (11, 26, 29, 30). Some have suggested that leptin does not form part of the pro-inflammatory response (30) and in agreement with this, leptin did not correlate with any of the inflammatory markers investigated in this study. Ghrelin, which is produced by the stomach and acts as an orexigenic factor (31), is present at higher concentrations in TB patients and the increase in ghrelin concentrations could act as a compensatory mechanism to weight loss (27). Ghrelin can furthermore downregulate pro-inflammatory cytokine responses (32, 33). Our results suggest that ghrelin is involved in cytokine responses during TB treatment as some markers correlated with ghrelin.
Amylin, which is secreted in conjunction with insulin to maintain blood glucose concentrations, has been found to be higher in obese individuals than in their normal-weight counterparts and was positively associated with BMI and inflammatory markers like CRP and IL-6 (34). Our study, the first to measure amylin in TB patients, showed that amylin concentrations were higher in the failed group, during treatment, than in the cured group. Amylin concentrations were not only associated with inflammatory markers but have been found to induce the production of acute phase proteins (35) and to activate the NLRP3 inflammasome (36). We found amylin to be positively and negatively correlated with inflammatory markers in the failed and cured group, respectively, indicating that this hormone plays an important role in immunity to TB.
Distinct biological pathways were associated with the two treatment outcome groups. Cytokines in the cured group were associated with components of the innate immune system like the inflammasome pathway and TREM1 receptor. Gain-of-function gene variants in components of the inflammasome like the NLRP3 gene and CARD8 gene enhance inflammasome activity and limit M.tb growth in human macrophages (37). In addition, the adaptor protein PYCARD (ASC) plays an important role in granuloma formation (38), while M.tb prevents inflammasome activation and IL-1β production to survive in macrophages (39). There was furthermore an association with VEGF signaling in cured patients. It has been shown that the expression of genes involved in angiogenesis is upregulated and the expression of VEGF-A, a key regulator of angiogenesis, has been found to be higher in M.tb-infected macrophages which promoted the formation of blood vessels (40). Inhibition of VEGF reduces dissemination of M.tb, and it is believed that mycobacteria exploit macrophages to disseminate by inducing the formation of blood vessels. VEGF has also been observed to be higher in patients with pulmonary TB, and it has been classified as a biomarker to distinguish latent infection and active disease (40, 41). It is therefore possible that the favorable treatment outcome in cured patients is due to early inflammasome involvement and the inhibition of the angiogenesis pathway.
Liver X receptors activation, associated with failed group, is known to regulate lipid metabolism and antimicrobial responses. DNA sequencing of the LXRA and LXRB receptors revealed common variants of which some were potential risk haplotypes while others were protective for TB (42). LXRs therefore play in important role in the genetic susceptibility to TB and possibly treatment outcome.
Changes observed in the cured group, such as the decrease in cortisol level and the gradual increase in DHEA, together with the markers associated with these hormones in this group, were possibly indicative of the restoration of the immunological responses during TB treatment and translated to the improvement of the clinical conditions of the patients. These results, furthermore, suggested that the inflammatory markers and the hormones were differentially regulating each other.
This study showed that hormone concentrations changed as a result of active TB and continued to change during TB treatment and that hormone profiles of individuals who were successfully cured differ from those who failed treatment. This study highlights the intricate relationships between the endocrine and immune systems during TB and support the suggestion that hormones in conjunction with cytokines may be valuable as biomarkers for treatment response.
Ethics Statement
Ethical approval was obtained from the Health Research Ethics Committee of the University of Stellenbosch and the City of Cape Town City Health. The study was conducted according to the Helsinki Declaration and International Conference of Harmonization guidelines. Written informed consent was obtained from all study participants.
Author Contributions
Conceived and designed the experiments: KR, LK, and GW. Performed the experiments: SR, LK, LE, LT, NC, and MKL. Analyzed the data: GS and MKD. Contributed reagents/tools: PH, KR, LK, GS, and MKD. Wrote the paper: LK. Critical review of manuscript and intellectual contributions: KR, PH, GW, GS, and MC.
Conflict of Interest Statement
The authors declare that the research was conducted in the absence of any commercial or financial relationships that could be construed as a potential conflict of interest.
The reviewer, VC, and handling editor declared their shared affiliation, and the handling editor states that the process nevertheless met the standards of a fair and objective review.
Acknowledgments
The authors would like to thank Ms. A. Menezes for technical assistance and Prof. Gerard Tromp for his guidance with the statistical analysis. We would further like to thank the members of SU-IRG who helped with the enrollment of participants and the participants themselves.
Funding
This work was supported by a grant from the Bill and Melinda Gates Foundation and the GSK TB Action Program awarded to GW; and the Harry Crossley Foundation and South African National Research Foundation awarded to KR. Research reported in this publication was also supported by the South African Medical Research Council. The content is solely the responsibility of the authors and does not necessarily represent the official views of the South African Medical Research Council.
Abbreviations
BMI, body mass index; CRP, C-reactive protein; CXR, chest X-ray; DHEA, dehydroepiandrosterone; FXR, farnesoid X receptor; IL, interleukin; LXR, liver X receptor; MMP, matrix metalloproteinase; M.tb, Mycobacterium tuberculosis; PCA, principal component analysis; RXR, retinoid-X-receptor; TB, tuberculosis; TNF, tumor necrosis factor; TREM1, triggering receptor expressed on myeloid cells 1.
References
1. World Health Organization. Global Tuberculosis Report 2014. WHO (2014). Available from: http://www.who.int/tb/publications/global_report/gtbr14_main_text.pdf?ua=1
2. Fielding KL, Grant AD, Hayes RJ, Chaisson RE, Corbett EL, Churchyard GJ. Thibela TB: design and methods of a cluster randomised trial of the effect of community-wide isoniazid preventive therapy on tuberculosis amongst gold miners in South Africa. Contemp Clin Trials (2011) 32(3):382–92. doi: 10.1016/j.cct.2010.12.008
3. Besedovsky HO, del Rey A, Klusman I, Furukawa H, Monge Arditi G, Kabiersch A. Cytokines as modulators of the hypothalamus-pituitary-adrenal axis. J Steroid Biochem Mol Biol (1991) 40(4–6):613–8. doi:10.1016/0960-0760(91)90284-C
4. Rey AD, Mahuad CV, Bozza VV, Bogue C, Farroni MA, Bay ML, et al. Endocrine and cytokine responses in humans with pulmonary tuberculosis. Brain Behav Immun (2007) 21(2):171–9. doi:10.1016/j.bbi.2006.06.005
5. Mateo L, Nolla JM, Bonnin MR, Navarro MA, Roig-Escofet D. Sex hormone status and bone mineral density in men with rheumatoid arthritis. J Rheumatol (1995) 22(8):1455–60.
6. Valentino R, Savastano S, Tommaselli AP, Riccio A, Mariniello P, Pronesti G, et al. Hormonal pattern in women affected by rheumatoid arthritis. J Endocrinol Invest (1993) 16(8):619–24. doi:10.1007/BF03347683
7. Kleynhans L, Du Plessis N, Black GF, Loxton AG, Kidd M, van Helden PD, et al. Medroxyprogesterone acetate alters Mycobacterium bovis BCG-induced cytokine production in peripheral blood mononuclear cells of contraceptive users. PLoS One (2011) 6(9):e24639. doi:10.1371/journal.pone.0024639
8. Mahuad C, Bay ML, Farroni MA, Bozza V, Del Rey A, Besedovsky H, et al. Cortisol and dehydroepiandrosterone affect the response of peripheral blood mononuclear cells to mycobacterial antigens during tuberculosis. Scand J Immunol (2004) 60(6):639–46. doi:10.1111/j.0300-9475.2004.01514.x
9. Haddad JJ, Saade NE, Safieh-Garabedian B. Cytokines and neuro-immune-endocrine interactions: a role for the hypothalamic-pituitary-adrenal revolving axis. J Neuroimmunol (2002) 133(1–2):1–19. doi:10.1016/S0165-5728(02)00357-0
10. Kim JH, Lee CT, Yoon HI, Song J, Shin WG, Lee JH. Relation of ghrelin, leptin and inflammatory markers to nutritional status in active pulmonary tuberculosis. Clin Nutr (2010) 29(4):512–8. doi:10.1016/j.clnu.2010.01.008
11. Santucci N, D’Attilio L, Kovalevski L, Bozza V, Besedovsky H, del Rey A, et al. A multifaceted analysis of immune-endocrine-metabolic alterations in patients with pulmonary tuberculosis. PLoS One (2011) 6(10):e26363. doi:10.1371/journal.pone.0026363
12. Opolot JO, Theron AJ, Anderson R, Feldman C. Acute phase proteins and stress hormone responses in patients with newly diagnosed active pulmonary tuberculosis. Lung (2015) 193(1):13–8. doi:10.1007/s00408-014-9680-8
13. Buyukoglan H, Gulmez I, Kelestimur F, Kart L, Oymak FS, Demir R, et al. Leptin levels in various manifestations of pulmonary tuberculosis. Mediators Inflamm (2007) 2007:64859. doi:10.1155/2007/64859
14. Herlina M, Nataprawira HM, Garna H. Association of serum C-reactive protein and leptin levels with wasting in childhood tuberculosis. Singapore Med J (2011) 52(6):446–50.
15. Bongiovanni B, Diaz A, D’Attilio L, Santucci N, Didoli G, Lioi S, et al. Changes in the immune and endocrine responses of patients with pulmonary tuberculosis undergoing specific treatment. Ann N Y Acad Sci (2012) 1262(1):10–5. doi:10.1111/j.1749-6632.2012.06643.x
16. Hesseling AC, Walzl G, Enarson DA, Carroll NM, Duncan K, Lukey PT, et al. Baseline sputum time to detection predicts month two culture conversion and relapse in non-HIV-infected patients. Int J Tuberc Lung Dis (2010) 14(5):560–70.
17. Ralph AP, Ardian M, Wiguna A, Maguire GP, Becker NG, Drogumuller G, et al. A simple, valid, numerical score for grading chest X-ray severity in adult smear-positive pulmonary tuberculosis. Thorax (2010) 65(10):863–9. doi:10.1136/thx.2010.136242
18. Enarson DA, Rieder HL, Arnadottir T, Trébucq A. Tuberculosis Guide for Low Income Countries. 5th ed. Paris, France: International Union Against Tuberculosis and Lung Disease (2000).
19. Leimane V, Riekstina V, Holtz TH, Zarovska E, Skripconoka V, Thorpe LE, et al. Clinical outcome of individualised treatment of multidrug-resistant tuberculosis in Latvia: a retrospective cohort study. Lancet (2005) 365(9456):318–26. doi:10.1016/S0140-6736(05)17786-1
20. Dror E, Dalmas E, Meier DT, Wueest S, Thevenet J, Thienel C, et al. Postprandial macrophage-derived IL-1beta stimulates insulin, and both synergistically promote glucose disposal and inflammation. Nat Immunol (2017) 18(3):283–92. doi:10.1038/ni.3659
21. Bottasso O, Bay ML, Besedovsky H, del RA. The immuno-endocrine component in the pathogenesis of tuberculosis. Scand J Immunol (2007) 66(2–3):166–75. doi:10.1111/j.1365-3083.2007.01962.x
22. Rozing MP, Westendorp RG, Maier AB, Wijsman CA, Frolich M, de Craen AJ, et al. Serum triiodothyronine levels and inflammatory cytokine production capacity. Age (Dordr) (2012) 34(1):195–201. doi:10.1007/s11357-011-9220-x
23. Mahuad C, Bozza V, Pezzotto SM, Bay ML, Besedovsky H, del RA, et al. Impaired immune responses in tuberculosis patients are related to weight loss that coexists with an immunoendocrine imbalance. Neuroimmunomodulation (2007) 14(3–4):193–9. doi:10.1159/000110646
24. Sajid KM, Parveen R, Sabih DE, Mahmood R. Thyroid function in pulmonary tuberculosis. J Coll Physicians Surg Pak (2006) 16(10):633–6. doi:10.2006/JCPSP.633636
25. Chow CC, Mak TW, Chan CH, Cockram CS. Euthyroid sick syndrome in pulmonary tuberculosis before and after treatment. Ann Clin Biochem (1995) 32(Pt 4):385–91. doi:10.1177/000456329503200406
26. van Lettow M, van der Meer JW, West CE, van Crevel R, Semba RD. Interleukin-6 and human immunodeficiency virus load, but not plasma leptin concentration, predict anorexia and wasting in adults with pulmonary tuberculosis in Malawi. J Clin Endocrinol Metab (2005) 90(8):4771–6. doi:10.1210/jc.2004-2539
27. Yurt S, Erman H, Korkmaz GG, Kosar AF, Uysal P, Gelisgen R, et al. The role of feed regulating peptides on weight loss in patients with pulmonary tuberculosis. Clin Biochem (2013) 46(1–2):40–4. doi:10.1016/j.clinbiochem.2012.09.008
28. Wieland CW, Florquin S, Chan ED, Leemans JC, Weijer S, Verbon A, et al. Pulmonary Mycobacterium tuberculosis infection in leptin-deficient ob/ob mice. Int Immunol (2005) 17(11):1399–408. doi:10.1093/intimm/dxh317
29. Prabha C, Supriya P, Das SD, Sukumar B, Balaji S. Leptin response in patients with tuberculous pleuritis. Indian J Med Res (2008) 128(6):721–7.
30. Schwenk A, Hodgson L, Rayner CF, Griffin GE, Macallan DC. Leptin and energy metabolism in pulmonary tuberculosis. Am J Clin Nutr (2003) 77(2):392–8.
31. Leite-Moreira AF, Soares JB. Physiological, pathological and potential therapeutic roles of ghrelin. Drug Discov Today (2007) 12(7–8):276–88. doi:10.1016/j.drudis.2007.02.009
32. Li WG, Gavrila D, Liu X, Wang L, Gunnlaugsson S, Stoll LL, et al. Ghrelin inhibits proinflammatory responses and nuclear factor-kappaB activation in human endothelial cells. Circulation (2004) 109(18):2221–6. doi:10.1161/01.CIR.0000127956.43874.F2
33. Wu R, Dong W, Zhou M, Zhang F, Marini CP, Ravikumar TS, et al. Ghrelin attenuates sepsis-induced acute lung injury and mortality in rats. Am J Respir Crit Care Med (2007) 176(8):805–13. doi:10.1164/rccm.200604-511OC
34. Hou X, Sun L, Li Z, Mou H, Yu Z, Li H, et al. Associations of amylin with inflammatory markers and metabolic syndrome in apparently healthy Chinese. PLoS One (2011) 6(9):e24815. doi:10.1371/journal.pone.0024815
35. Gitter BD, Cox LM, Carlson CD, May PC. Human amylin stimulates inflammatory cytokine secretion from human glioma cells. Neuroimmunomodulation (2000) 7(3):147–52. doi:10.1159/000026432
36. Masters SL, Dunne A, Subramanian SL, Hull RL, Tannahill GM, Sharp FA, et al. Activation of the NLRP3 inflammasome by islet amyloid polypeptide provides a mechanism for enhanced IL-1beta in type 2 diabetes. Nat Immunol (2010) 11(10):897–904. doi:10.1038/ni.1935
37. Eklund D, Welin A, Andersson H, Verma D, Soderkvist P, Stendahl O, et al. Human gene variants linked to enhanced NLRP3 activity limit intramacrophage growth of Mycobacterium tuberculosis. J Infect Dis (2014) 209(5):749–53. doi:10.1093/infdis/jit572
38. McElvania Tekippe E, Allen IC, Hulseberg PD, Sullivan JT, McCann JR, Sandor M, et al. Granuloma formation and host defense in chronic Mycobacterium tuberculosis infection requires PYCARD/ASC but not NLRP3 or caspase-1. PLoS One (2010) 5(8):e12320. doi:10.1371/journal.pone.0012320
39. Master SS, Rampini SK, Davis AS, Keller C, Ehlers S, Springer B, et al. Mycobacterium tuberculosis prevents inflammasome activation. Cell Host Microbe (2008) 3(4):224–32. doi:10.1016/j.chom.2008.03.003
40. Polena H, Boudou F, Tilleul S, Dubois-Colas N, Lecointe C, Rakotosamimanana N, et al. Mycobacterium tuberculosis exploits the formation of new blood vessels for its dissemination. Sci Rep (2016) 6:33162. doi:10.1038/srep33162
41. Kumar NP, Banurekha VV, Nair D, Babu S. Circulating angiogenic factors as biomarkers of disease severity and bacterial burden in pulmonary tuberculosis. PLoS One (2016) 11(1):e0146318. doi:10.1371/journal.pone.0146318
Keywords: tuberculosis, biomarkers, immune, endocrine, cytokines, metabolic hormones, steroid hormones
Citation: Kleynhans L, Ruzive S, Ehlers L, Thiart L, Chegou NN, Conradie M, Kriel M, Stanley K, van der Spuy GD, Kidd M, van Helden PD, Walzl G and Ronacher K (2017) Changes in Host Immune–Endocrine Relationships during Tuberculosis Treatment in Patients with Cured and Failed Treatment Outcomes. Front. Immunol. 8:690. doi: 10.3389/fimmu.2017.00690
Received: 16 January 2017; Accepted: 29 May 2017;
Published: 15 June 2017
Edited by:
Massimo Triggiani, University of Salerno, ItalyReviewed by:
Vincenzo Casolaro, University of Salerno, ItalyAntónio Gil Castro, University of Minho, Portugal
Copyright: © 2017 Kleynhans, Ruzive, Ehlers, Thiart, Chegou, Conradie, Kriel, Stanley, van der Spuy, Kidd, van Helden, Walzl and Ronacher. This is an open-access article distributed under the terms of the Creative Commons Attribution License (CC BY). The use, distribution or reproduction in other forums is permitted, provided the original author(s) or licensor are credited and that the original publication in this journal is cited, in accordance with accepted academic practice. No use, distribution or reproduction is permitted which does not comply with these terms.
*Correspondence: Katharina Ronacher, a2F0aGFyaW5hLnJvbmFjaGVyQG1hdGVyLnVxLmVkdS5hdQ==