 Lu Gan
 Chao Sun
- College of Animal Science and Technology, Northwest A&F University, Yangling, China
Leptin is an adipocyte-derived hormone and maintains adipose function under challenged conditions. Autophagy is also essential to maintain cellular homeostasis and regulate characteristics of adipose tissue. However, the effects of leptin on autophagy of adipocyte remain elusive. Here, we demonstrated endoplasmic reticulum (ER) stress and leptin were correlated with autophagy and inflammation by transcriptome sequencing of adipose tissue. Leptin-mediated inhibition of autophagy was involved in upstream reduction of ER stress proteins such as Chop, GRP78, and Atf4, since blockage of autophagy using pharmacological approach had no effect on tunicamycin-induced ER stress. Moreover, we determined KLF4, the potential transcriptional factor of Atf4, was required for the leptin-mediated autophagy in the regulation of adipocyte inflammation. Importantly, ATF4 physically interacted with ATG5 and subsequently formed a complex to promote adipocyte autophagy. Further analysis revealed that Atg5, a core component of autophagosome, was the target for leptin-mediate autophagy. In addition, leptin alleviated ER stress-induced inflammation by reducing autophagy-mediated degradation of IκB in adipocytes. Exogenous leptin treatment also ameliorated autophagy and inflammation of white adipose tissue in ob/ob mice. Taken together, our results indicated that leptin inhibited ER stress-mediated autophagy and inflammation through the negatively regulation of Atf4/Atg5 complex in adipocytes. These findings identify a new potential means for intervention of autophagy to prevent or treat obese caused metabolic syndrome of mammals.
Introduction
Metabolic disorders, especially obesity and diabetes, become the most important public health concern in worldwide. The pathophysiology seems to be largely attributable to endoplasmic reticulum (ER) stress, inflammation and cytokines resistance (e.g., leptin resistance and insulin resistance) in adipose tissue. Therefore, dynamic improvement of these disorders in adipose tissue provides an effective therapeutic strategy to alleviate severe systemic metabolic disorders.
Leptin is a hormone produced by peripheral adipose tissue. The ectopic serum leptin level is usually considered as a symbol of metabolic disorders (1–3). In particular, leptin signal is essential to mediate protective function in adipocytes under challenged conditions (1, 4, 5). Meanwhile, obesity is usually associated with mild chronic inflammation in adipose tissue. Notably, inflammatory stimulation by tumor necrosis factor-alpha (Tnfα) and other cytokines initiate adipose inflammation through elevating unfolded protein response in the ER (6, 7). ER plays a critical role in protein synthesis, folding and transportation. Certain conditions, such as accumulation of misfolded proteins and uncontrolled energy homeostasis perturb ER homeostasis and lead to a condition defined as ER stress (8–10). Recent studies show that ER stress serves as a key etiologic component causing chronic inflammation in adipose tissue of obese human and mice (11, 12). Current evidence suggests that ER stress promotes inflammation through positive transcription regulation of inflammatory genes and coordinating the activities of critical inflammatory kinases such as nuclear factor-κB (NF-κB), c-Jun N-terminal kinase, and protein kinase R (13–15). Our previous study has shown that tunicamycin (TM) induces ER stress and reduces adiponectin by increasing the activating transcription factor 2 (Atf2) transcription in mice adipose tissue (12). Since leptin is an adipocyte-derived hormone involved in obesity and inflammation (5, 16), the specific role of leptin in the progress of ER stress-induced adipose inflammation remains to be determined.
Autophagy is a highly regulated process that functioned in the maintenance of cellular homeostasis (17, 18). Recently, studies indicate activation of ER stress could initiate autophagy and inflammation in astrocytes (19, 20). Many studies also determine that ER stress triggers autophagy and subsequent lysosomal lipolysis in hepatocytes (21, 22). Furthermore, autophagy can directly degrade lipid droplets through hydrolysis of triglycerides into free fatty acids in adipose tissue (23, 24). But the relationship between ER stress and autophagy in adipocytes remains elusive. Generally, the autophagy-related genes (Atg) recruit damaged organelles to form autophagosomes and recycle the cargo by lysosomal degradation (23, 25, 26). Deletion of autophagy-related gene 7 (Atg7) blocks autophagy and promotes hepatic lipid accumulation (27). Adipocyte-specific deletion of Atg genes exhibit markedly decreased plasma concentration of leptin (28, 29). These findings suggest leptin may be correlated with autophagy by regulating ER stress in adipocytes.
In this study, we investigated the effects of leptin on autophagy and inflammation of adipose tissue. We show that leptin alleviates ER stress-induced inflammation through the activating transcription factor 4 (Atf4)/Atg5-mediated autophagy in mice adipocytes. Thus, our study has revealed the mechanistic link between leptin, autophagy and ER stress, providing novel insights into the pharmacologically therapeutic target for obesity and inflammation.
Materials and Methods
Animal Experiment
Eight-week-old C57BL/6J male mice and ob/ob mice were purchased from the Laboratory Animal Center of the Fourth Military Medical University (Xi’an, China). Mice handling protocols were conducted following the guidelines and regulations approved by the Animal Ethics Committee of Northwest A&F University (Yangling, China). Mice were provided ad libitum water and a standard laboratory chow diet purchased from Animal Center of the Fourth Military Medical University. Body weight was recorded weekly. The animal room was maintained at 25 ± 1°C, humidity at 55 ± 5%, and 12 h light/dark cycles.
Mice (n = 24) were randomly divided into four groups (n = 6 each). Half of the mice were intraperitoneally injected with saline (control), and the other half injected with TM (1 mg/kg, Sigma-Aldrich, MO, USA, T7765) or thapsigargin (Tg, 0.5 mg/kg, Sigma-Aldrich, MO, USA, T9033) for 3 and 2 days separately before the dark onset (12, 30–32). The TM injection was used to create ER stress in the mice adipose tissue. To address the effect of leptin on ER stress of adipose tissue, half of the mice that received saline or TM or Tg injection were further injected with 1 mg/kg recombinant murine leptin (Peprotech, NJ, USA, 450-31) into the tail vein two times a day for 7 days (15, 33, 34), and the other half still received saline injection. For the experiment of 4-phenylbutyric acid (4-PBA, 0.5 g/kg, Sigma-Aldrich, MO, USA, P21005) injection (35), mice (n = 24) were all injected with TM (1 mg/kg) and randomly divided into four groups (n = 6 each). Half of these mice received saline injection (control), and the other half received 4-PBA injection (0.5 g/kg) for 7 days. And then half of the mice that received 4-PBA or saline injection were injected with recombinant murine leptin (1 mg/kg) two times a day for 7 days. For the rapamycin (5 mg/kg, Sigma-Aldrich, MO, USA, V900930) injection experiment (36), we performed the same procedures as in the 4-PBA injection experiment. 4-PBA injection was used to block ER stress and rapamycin injection was used to activate autophagy. In the ob/ob mice experiment (n = 18), mice were randomly divided into three groups (n = 6 each group), one group of mice was the C57BL/6J mice [wild type (WT)], the other two groups were ob/ob mice. Half of the ob/ob mice were injected with saline (control) and the other half injected with 1 mg/kg recombinant murine leptin (1 mg/kg) two times a day for 7 days. Mice were then euthanized by ethyl ether. The epididymal white adipose tissue (eWAT) was dissected and was used for the following studies. Serum leptin level was measured by the commercial enzyme-linked immunosorbent assay (ELISA) kit from Sigma (Sigma-Aldrich, MO, USA, RAB0334,), and the measurement kits of interleukin (IL)-18 and IL-1β were from Abcam (UK, ab216165, ab100704) following the manufacturer’s instructions and our previously study (37).
Primary Adipocyte Culture and Virus Vectors Infection
The connective fiber and blood vessels of eWAT tissues were removed, and washed three times with PBS buffer containing penicillin and streptomycin (Sigma-Aldrich, MO, USA, P3032, S6501). The adipocyte culture was carried out according to our previous publication (38). Briefly, adipocytes were seeded onto 35-mm culture dishes at 30% (v/v) confluence, and incubated at 37°C under a humidified atmosphere of 5% CO2 and 95% air for subsequent experiments. After reaching 95% confluence, preadipocytes were induced to differentiate using DMEM/F12 (Gibco, CA, USA, 12500062) with 15% FBS and 100 nM insulin for 5–6 days until exhibiting a massive accumulation of fat droplets. Leptin (Peprotech, NJ, USA, 450-31) was added into culture medium at a final concentration of 100 ng/mL and incubated for up to 24 h. Adipocytes were preincubated with 3-methyladenine (3-MA, 5 mM for 2 h, Selleck, China, S2767) or 4-phenylbutyrate (4-PBA; 50 mM for 1 h, Sigma-Aldrich, MO, USA, SM0309). Then followed treated with leptin for 12 h or 16 h separately, then TM (2 µg/mL, Sigma-Aldrich, MO, USA) or rapamycin (100 nM, Selleck, China, S1039) were further added into the culture medium for 12 or 8 h, respectively. For autophgic flux detection, adipocytes were exposed to leptin or TM followed by treatment of cells with an inhibitor of autophagosome-lysosome fusion, bafilomycin A1 (BafA1) (400 nM in the last 4 h of the 24 h treatment period), and assessed for accumulation of LC3II. For vectors infection study, adipocytes were infected with overexpression adenovirus or interference lentiviral recombinant vectors of leptin (pAd-Leptin or si-Leptin), Atg5 (pAd-Atg5 or si-Atg5), or Krüppel-like factor 4 (KLF4, pAd-KLF4 or si-KLF4) for 48 h at the titer of 1 × 10⁹ IFU/mL, and then treated with leptin. The control vectors were pAd-GFP or pGLVU6-GFP. All the vectors were constructed by Gene Pharma (China).
Detection of Autophagy Incidence by Flow Cytometry (FACS)
After treatment with different conditions, the adipocytes were incubated with 0.05 mM monodansylcadaverine (MDC, Sigma-Aldrich, MO, USA, 30432) at 37°C for 30 min and then washed three times with PBS. Intracellular MDC was measured by flow cytometry (FACS) within 30 min after incubation. Fluorescence intensity of cells was determined by BD FACScan (BD Biosciences, NJ, USA) and data were analyzed using Cell Quest software (BD Biosciences).
GFP-LC3 Analysis and Subcellular Localization
Cells were transfected with GFP-LC3 plasmid by using X-treme GENE HP Reagent (Roche, Switzerland) according to the manufacturer’s instructions. After 48 h transfection, cells were washed with OptiMEM I (Invitrogen, CA, USA, 51985042) and subjected to staining. The cells were stained with LysoTracker® Green DND probe (Thermo Scientific, CA, USA, L7526) as recommended by the manufacturer. The formation of GFP-LC3 punctate and Tracker fluorescence were visualized and analyzed using Cytation3 Cell Imaging Multi-Mode Reader (BioTek, VT, USA).
Transmission Electron Microscopy (TEM)
At room temperature eWAT or adipocytes were fixed in 2.5% glutaraldehyde in PBS (pH = 7.2) for 24 h, postfixed in 1% osmium tetroxide in water for 2 h. After dehydrated in an ascending series of ethanol (30, 50, 70, 80, 90, and 100%) for 10 min each, the samples were then embedded in Durcopan ACM (Fluka Chemie AG, Switzerland, 44611). Sections were cut with a diamond knife at a thickness of 50–60 nm. These sections were stained with uranyl acetate and lead citrate, and examined with a TEM (HT7700, 80 kV, Hitachi, Japan). Images were recorded on film at 30,000× magnification. The percentage of mitochondrial integrity was determined by dividing the number of normal mitochondria by the total number of mitochondria per image.
RNA-Seq Analysis
Total RNA from the eWAT was prepared with RNAiso Reagent (Takara, China, D312) and the RNA-seq analysis was performed as previous described (39). Briefly, quantification and quality control of the sample libraries were assessed by Agilent 2100 Bioanalyzer and ABI StepOnePlus real-time PCR system. RNA sequencing was performed using Hiseq 4000 instrument (Illumina). Real-time analysis was used for base calling. Fastq files were mapped to the mouse genome (NCBI37/mm9) using TopHat (version 2.0.4). Mapped reads were then assembled via Cufflinks (version 2.0.2) with the default settings. Assembled transcripts were then merged using the Cuffmerge program with the reference genome. Analysis of mRNA levels was carried out using the Cuffdiff program, with samples being grouped by treatment condition, three replicates per group. Volcano plots comparing log10 (statistical relevance) to log2 (fold change) were generated using R (version 3.1.1), using the base plotting system and calibrate library. Gene Ontology (GO) and pathway enrichment analysis were performed to categorize the considerably enriched functional classification or metabolic pathways in which DEGs operated.
Plasmids Construction and Dual-Luciferase Reporter Assay
A 1,267 bp mouse Atf4 promoter was cloned by PCR amplification of C57BL/6J mouse genomic DNA and inserted in the pGL-3 basic vector. The resulting reporter was named Atf41267-Luc. Further deletion of the Atf41267-Luc generated Atf4720-Luc, Atf4560-Luc and Atf4130-Luc reporters contained of 720, 560, and 130 bp of Atf4 promoter, respectively. HEK293 cells were cotransfected with luciferase reporter plasmid, pRL-TK reporter plasmid (control reporter), and KLF4 plasmid (pc-KLF4) using X-tremeGENE™ transfection reagent (Roche, Switzerland, 06366236001). After transfection for 24 h, cells were harvested and measured using the dual-luciferase reporter assay system (Promega, WI, USA, E1910), and luciferase activity was divided by the Renilla luciferase activity to normalize for transfection efficiency.
Chromatin Immunoprecipitation (ChIP) Assay
Chromatin immunoprecipitation assay was performed as previous described using a ChIP assay kit (Abcam, UK, ab500) according to the manufacturer’s protocol (12). Primary antibodies of Atf4 and IgG (Abcam, UK, ab172730) were used. DNA–protein crosslinking complexes were collected, and purified DNA was subjected to qPCR with SYBR green fluorescent dye (Invitrogen, CA, USA).
Coimmunoprecipitation (Co-IP) Analysis
HEK293 cells were transfected with plasmids using X-tremeGEN™ transfection reagent (Roche, Switzerland, 06366236001) as previous described (32). After 24 h transfection, cells were then snap-frozen in lipid nitrogen. Whole cell lysate was harvested in lysis buffer with a protease inhibitor. Cells were then sonicated for 10 s and the whole cell lysate was precleared with Protein A for 2 h and incubated with 2 µg primary antibody overnight at 4°C. Immune complexes were pulled down with Protein A agarose for 2 h at 4°C with shaking. Beads were washed once with lysis buffer and three times with wash buffer, and then eluted by boiling in SDS sample buffer followed by detection of Western blot.
Nuclear Protein Extraction
Nuclear and cytoplasmic fractions were prepared using the protocols from Liu et al (40). In brief, cells were lysed with 400 µL of cytoplasmic lysis buffer. The lysates were incubated for 5 min on ice and vortexed 2 times for 10 s. The lysates were centrifuged for 30 s at 16,000g, and supernatants were collected as cytoplasmic fractions. The pellets were re-suspended in 50 µL of nuclear extraction buffer and sonicated 3 times on ice. The nuclear fractions were centrifuged for 5 min at 16,000g, and the supernatant was collected to obtain nuclear proteins. The proteins were denatured by boiling at 100°C and kept for further studies.
Real-time Quantitative PCR Analysis
Total RNA of eWAT or adipocytes were extracted with TRIpure Reagent kit (Takara, China) according to previous study (41). 500 ng of total RNA was reverse transcribed using M-MLV reverse transcriptase kit (Invitrogen, USA, 28025013). Primers were synthesized by Invitrogen (China). Quantitative PCR was performed in 25 µL reaction system containing specific primers and AceQ qPCR SYBR Green Master Mix (Vazyme, China, Q111-02). Amplification was performed in the ABI StepOne Plus™ RT-PCR System (CA, USA). The levels of mRNA were normalized in relevance to GAPDH. The expression of genes was analyzed by method of 2−ΔΔCt.
Protein Extraction and Western Blot Analysis
Western blot was performed as previously described (31). Adipocytes were solubilized in lysing buffer. Protein samples (30 µg) were separated by electrophoresis on 12 and 5% SDS-PAGE gels using slab gel apparatus, and transferred to PVDF nitrocellulose membranes (Millipore, USA). Antibodies including LC3II (ab48394), Atg5 (ab108327), Beclin1 (ab62557), SQSTM1 (ab51416), signal transducer and activator of transcription 3 (STAT3, ab68153), p-STAT3 (ab76315), JAK2 (ab108596), p-JAK2 (ab32101), Atf4 (ab184909), glucose-regulated protein 78 (GRP78, ab21685), C/EBP homologous protein (Chop, ab11419), p65 (ab16502), IκB (ab32518), p-IκB (ab92700), NLRP3 (ab214185), IL-18 (ab71495), PCNA (ab29), GAPDH (ab8245), anti-HA tag (ab18181), and anti-His tag (ab18184) were purchased form Abcam (UK) and IL-1β (12426) from cell signaling technology (USA), the appropriate HRP-conjugated secondary antibody (Boaoshen, China) were used. Proteins were visualized using chemiluminescent peroxidase substrate (Millipore, USA), and then the blots were quantified using ChemiDoc XRS system (Bio-Rad, USA).
Statistical Analysis
Statistical analyses were conducted using SAS v8.0 (SAS Institute, NC, USA). Data were analyzed using one-way or two-way ANOVA. Comparisons among individual means were made by Fisher’s least significant difference. In consideration of multiple testing, the significance level was corrected using the Bonferroni method. Data were presented as mean ± SEM. p < 0.05 was considered to be significant.
Results
Leptin Produces a Transcriptional Signature Distinct from TM and Reduces Genes Associated With Autophagy and ER Stress in Mice Adipose
We used RNA-seq and functional enrichment analysis to compared white adipose transcriptomes from leptin and TM-injected mice. Notably, a total of 12,732 genes were found to be significantly altered, and 68% (8,650 out of 12,732) of the genes were increased in leptin-injected mice, whereas 32% (4,081 out of 12,732) were decreased (Figure S1A in Supplementary Material). Similarly, TM injection altered 12,588 genes expression, and 62% (7,767 out of 12,588) of the genes were increased, whereas 38% (4,821 out of 12,588) were decreased (Figure S1A in Supplementary Material). GO analysis showed 22% of these genes were mainly functioned in signal transduction, 18% functioned in protein digestion, and 14% functioned in inflammation response (Figure S1B in Supplementary Material). Subsequent analysis showed leptin downregulation of 4,081 genes and TM upregulation of 7,767 genes contemporarily, and the genes were enriched in those encoding factors involved in autophagy (Figure S1C in Supplementary Material), suggesting leptin and TM treatment resulted in a regulation of autophagy. Further pathway analysis of the TM and leptin coregulated genes revealed that autophagy, ER stress and inflammation pathways were all highly enriched (Figure 1A), demonstrating that genes regulated by TM and leptin were correlated with autophagy and inflammation processes in adipose tissue. The data also showed the transcription factor cluster of multiply genes were altered, suggesting the existence of transcription regulation between these genes (Figures 1B,C). mRNA expression measurement established that autophagy marker genes autophagy-related gene 5 (Atg5), autophagy-related gene 12 (Atg12), and Beclin1 were decreased in leptin group but increased in TM group; while the cotreatment of leptin and TM reduced these genes expression compared with that in TM alone group (Figure 1D). Inflammation indicators IL-18, IL-1β, and NLR family, pyrin domain containing 3 (NLRP3) were also decreased after leptin treatment, but increased with TM injection; cotreatment of TM and leptin further decreased the levels of these genes (Figure 1D). These results were also confirmed with another ER stress inducer, the Tg treatment (Figures S2B,C in Supplementary Material). These findings indicated ER stress accelerated autophagy, but leptin played the opposite role in the regulation of both ER stress and autophagy in adipose tissue.
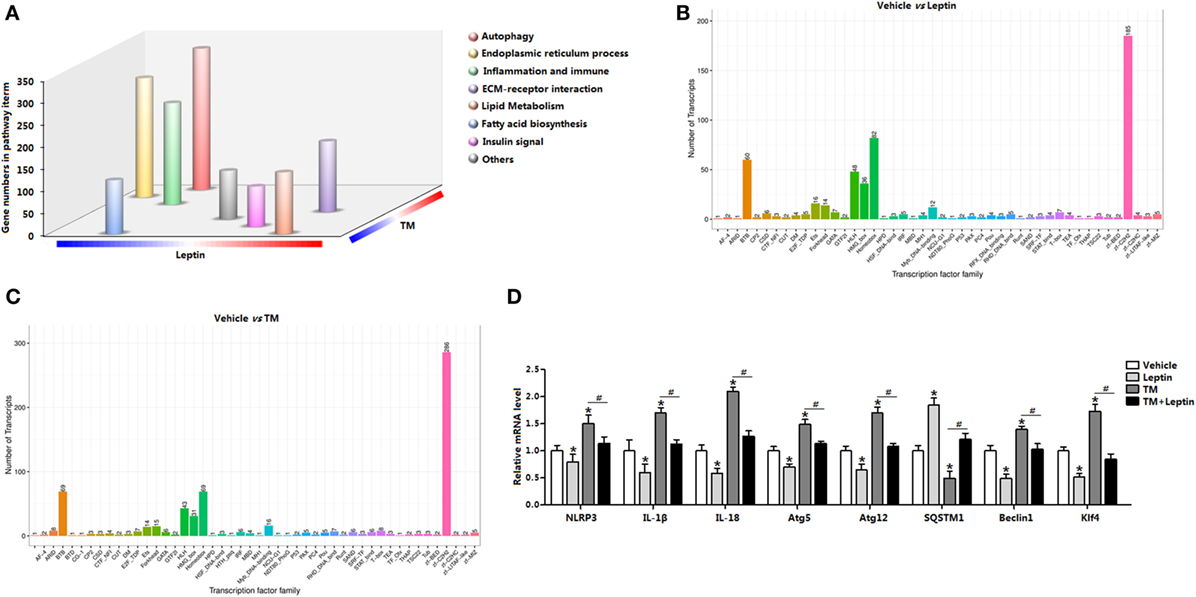
Figure 1. Leptin treatment produces a transcriptional signature distinct from tunicamycin treatment and is defined by the induction genes associated with autophagy and endoplasmic reticulum (ER) stress in mice adipose. (A) Gene Ontology (GO) analysis of the genes set from RNA-seq data (n = 3). (B) Transcription factor family in genome after leptin treatment (n = 3). (C) Transcription factor family in genome after TM treatment (n = 3). (D) Changes in the expression level of genes associated with autophagy and inflammation, which were significantly altered from RNA-seq analysis (n = 3). Values are means ± SEM. *p < 0.05 compared with the vehicle group, #p < 0.05 compared with the tunicamycin (TM) group, &p < 0.05 compared with the leptin group.
Leptin Reduces ER Stress-Induced Autophagy and Alleviates Inflammation Cytokines Secretion in Mice Adipose Tissue
The distinct responses of leptin and ER stress to autophagy were further demonstrated with the cotreatment of leptin and TM in vivo. Leptin markedly enhanced the phosphorylation levels of STAT3 and kinase 2 (JAK2) which were blunted by TM injection, indicating leptin signal was sensitive to leptin and TM treatments (Figure 2A). As expected, TM treatment triggered adipose ER stress and the addition of leptin attenuated the elevation of Chop, GRP78, Atf4, and inositol-requiring enzyme 1 (IRE1) (Figure 2B). And Tg treatment also showed the consistent results (Figure S2A in Supplementary Material). As shown in Figure 2C, protein levels of classic autophagic markers LC3II, Beclin1, and Atg5 were significant induced by TM incubation whereas the level of SQSTM1 protein, a marker for autophagic flux, showed a decrease with TM treatment, suggesting the induction of autophagy by TM-induced ER stress. However, the addition of leptin showed the opposite results, indicating the reduction of autophagy (Figure 2D). Analyzing of autophagosomal structures of adipose tissue by TEM demonstrated autophagosome formation was increased in TM injected mice and decreased with leptin treatment, and changed in the cotreatment group, implying leptin reduced the autophagosome formation (Figure 2C). We also examine inflammation status with the cotreatment of leptin and TM. TM-induced ER stress promoted serum secretion of IL-18 and IL-1β, while the addition of leptin had the opposite effect (Figures 2E,F). Taken together, these observations indicated leptin treatment reduced ER stress-induced autophagy and alleviated inflammatory cytokines secretion of mice adipose tissue.
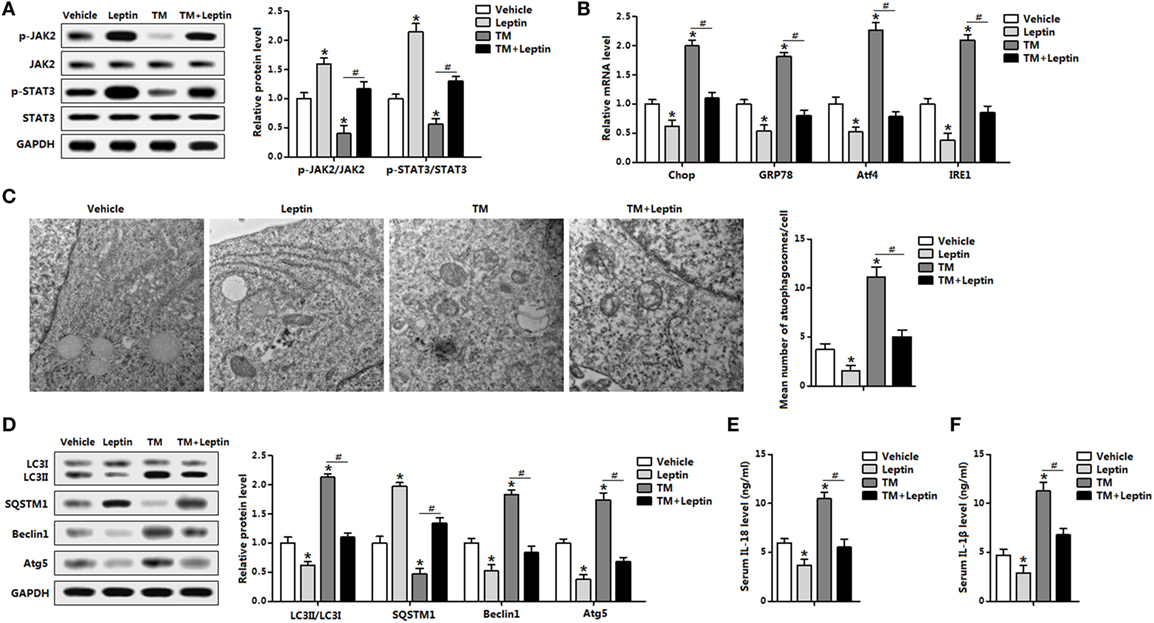
Figure 2. Leptin treatment reduces endoplasmic reticulum (ER) stress-induced autophagy and alleviates inflammation cytokines secretion in mice adipose tissue. Mice were injected with tunicamycin (TM) or leptin, the white epididymal adipose tissue (eWAT) or serum was used for this study (n = 6). (A) Leptin sensitivity markers [phosphorylation of Janus kinase 2 (JAK2) and signal transducer and activator of transcription 3 (STAT3)] were examined by Western blot analysis. (B) Gene expression levels of ER stress markers: C/EBP homologous protein (Chop), glucose-regulated protein 78 (GRP78), activating transcription factor 4 (Atf4), and inositol-requiring enzyme 1 (IRE1). (C) Representative electron micrographs (30,000×) of eWAT treated with TM or leptin. The graph showed on the right was the quantification of mean number of autophagosomes in the EM images. (D) Autophagy was evaluated by the conversion of LC3I to LC3II, the protein levels of Beclin1, Atg5, and SQSTM1 were detected by Western blot analysis. (E) Serum interleukin (IL)-18 level measured by enzyme-linked immunosorbent assay (ELISA) test. (F) Serum IL-1β level measured by ELISA test. Full scans of uncropped blots are included in Figure S3. Values are means ± SEM. *p < 0.05, #p < 0.05 compared with the TM group.
Leptin Decreases ER Stress-Induced Autophagy Flux by Reducing LC3II Turnover and SQSTM1 Degradation in Mice Adipocytes
Having shown leptin was capable of reducing ER stress-induced autophagy in mice adipose tissue, we next sought to confirm this by measuring the autophagosome formation in adipocytes in vitro. We first transfected adipocytes with overexpression GFP-LC3 plasmid followed incubated cells with TM or leptin, and subsequently detected the green fluorescent LC3II puncta. TM exposure prominently triggered the formation of characteristic punctate GFP-LC3, suggesting the recruitment of GFP-LC3 during autophagosome formation (Figure 3A). Cotreatment of TM and leptin resulted in the decrease in the percentage of cells with punctate GFP-LC3 compared with the cells treated with TM alone (Figure 3A), confirmed the reduction of autophagosome formation by leptin. We then analyzed the TEM pictures of adipocytes pretreated with TM or leptin. Notably, autophagosome formed in the TM and leptin cotreated cells were smaller than that in the TM exposure cells, and much more than that in leptin group (Figure 3B). These findings were further validated by the MDC staining and FACS measurement that leptin reduced the autophagosome formation of adipocytes (Figure 3C).
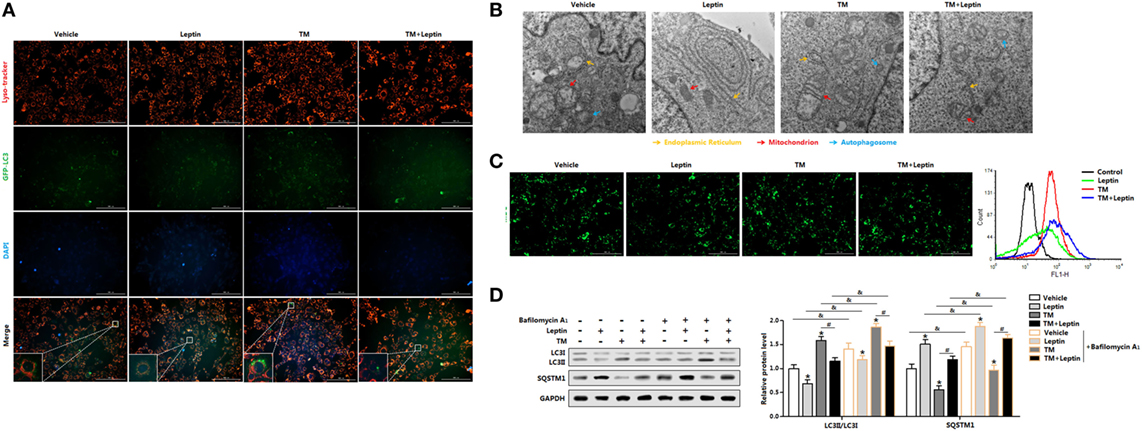
Figure 3. Leptin decreases endoplasmic reticulum (ER) stress-induced autophagy flux by reducing LC3II turnover and SQSTM1 degradation in mice adipocytes. (A) Representative fluorescent photomicrographs showing the GFP-LC3 puncta formation in adipocytes transfected with GFP-LC3 plasmid and stained with Lyso-tracker Red. Cells were treated with tunicamycin (TM) or leptin. The nuclei were stained with DAPI shown in blue (n = 3). (B) Representative electron micrographs (30,000×) of adipocytes. Yellow arrowhead: endoplasmic reticulum, red arrowhead: mitochondria, blue arrowhead: autophagosome (n = 3). (C) Representative pictures of autophagosome formation monitored by MDC staining. Cell autophagy was analyzed by flow cytometry (n = 3). (D) Representative Western blots showing the protein levels of LC3II and SQSTM1 in adipocytes treated with leptin or TM followed by treatment with 400 nM bafilomycin A1 (BafA1), which was added in the last 4 h of the treatment period (n = 3). Full scans of uncropped blots are included in Figure S3. Values are means ± SEM. *p < 0.05 compared with the control group, #p < 0.05 compared with the TM group, &p < 0.05 compared with the BafA1 group.
Since leptin decreased the number of autophagosome in adipocytes, it is needed to distinguish whether the reduction of autophagosome is due to the de-activation of autophagy or rather due to an enhanced of autophagosome-lysosomal fusion at later stages (21). To determine this, we exposed the cells to the lysosomal V-ATPase inhibitor BafA1, which blocks LC3II/autophagosome degradation and reveals changes in autophagosome synthesis (21). Autophagic flux was measured through LC3II turnover assay, by measuring LC3II degradation in adipocytes treated with TM or leptin, and followed exposed with or without BafA1. As shown in Figure 3D, exposure of adipocytes with TM followed by treatment with BafA1 resulted in significant increase of LC3II levels compared with BafA1 alone group; but the addition of leptin showed the opposite result. The decreased accumulation of LC3II protein indicated the reduced autophagic flux in cells exposed to leptin. We next assessed the degradation of SQSTM1 by autophagy to monitor the autophagic flux. It was evident that SQSTM1 level was decreased in TM-treated adipocytes, but increased in the TM and leptin cotreatment cells (Figure 3D). Further measurements demonstrated SQSTM1 protein level was significantly increased in TM and leptin cotreated adipocytes followed treated by BafA1, compared with cells without BafA1 (Figure 3D). These findings underpin the potential of leptin to downregulated autophgic flux. Therefore, reduced autophagic flux is responsible for SQSTM1 degradation in leptin-treated adipocytes.
Leptin-Mediated Autophagy and Inflammation Involved Upstream Activation of ER Stress in Mice Adipocytes
We next determined the effect of ER stress inhibitor, 4-PBA, on leptin-mediated autophagy and adipocyte inflammation. As shown in Figure 4A, TM-induced ER stress was inhibited in cells with 4-PBA preincubation through the downregulation of Chop, GRP78, and Atf4. Compared with TM group, cotreatment of leptin and TM further strengthen the inhibition of ER stress by 4-PBA (Figure 4A) The protein levels of autophagy markers, LC3II and Atg5 were significantly decreased in TM and leptin cotreatment group compared with those in the control group without 4-PBA, but the level of SQSTM1 was increased (Figure 4B). Moreover, 4-PBA exposure led to the alleviation of adipocytes inflammation. As shown in Figure 4C, the mRNA levels of IL-18, Tnfα, and IL-1β were reduced significantly in leptin and TM cotreated cells which were pretreated with 4-PBA than that of alone cotreated cells.
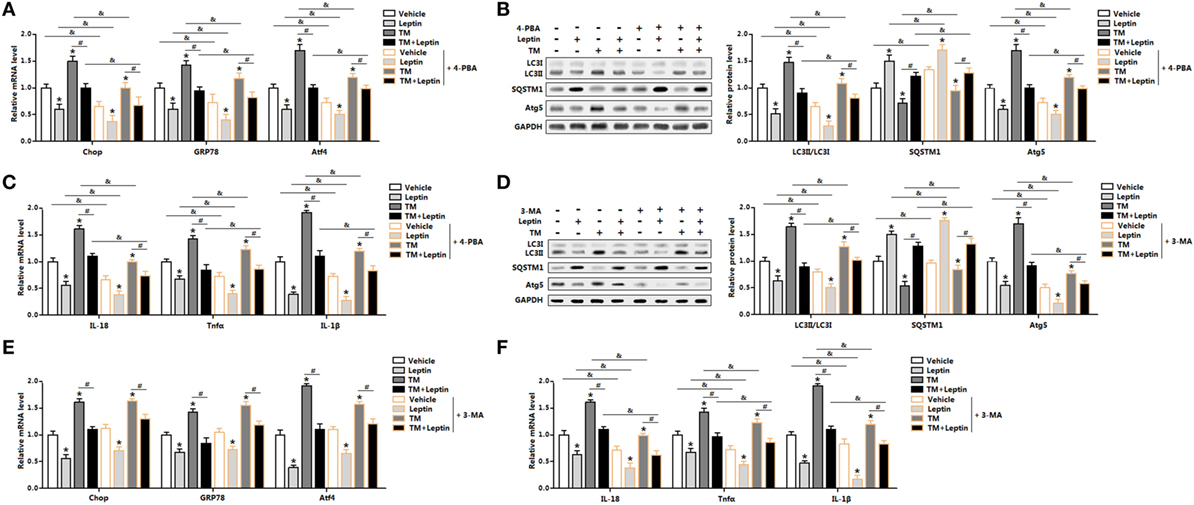
Figure 4. Leptin-mediated autophagy and inflammation involved upstream activation of endoplasmic reticulum (ER) stress in mice adipocytes. Adipocytes were pretreated with 4-phenylbutyric acid (4-PBA, 5 mM for 2 h) or 3-methyladenine (3-MA, 50 mM for 1 h), followed incubated with recombinant leptin for 24 h or tunicamycin (TM) for 12 h (n = 3). (A) Gene expression profile of C/EBP homologous protein (Chop), glucose-regulated protein 78 (GRP78), and activating transcription factor 4 (Atf4) in adipocytes treated with or without 4-PBA. (B) Representative Western blots showing the protein levels of LC3II, SQSTM1, and Atg5 in adipocytes treated with or without 4-PBA. (C) Gene expression profile of proinflammatory cytokines, such as IL-18, Tnfα, and IL-1β in adipocytes treated with or without 4-PBA. (D) Representative Western blots showing the protein levels of LC3II, SQSTM1, and Atg5 in adipocytes treated with or without 3-MA. (E) Gene expression profile of Chop, GRP78, and Atf4 in adipocytes treated with or without 3-MA. (F) Gene expression profile of IL-18, Tnfα, and IL-1β in adipocytes treated with or without 3-MA. Full scans of uncropped blots are included in Figure S3. Values are means ± SEM. *p < 0.05 compared with the control group, #p < 0.05 compared with the TM group, &p < 0.05 compared with the 4-PBA group or 3-MA group.
Next, we explore the effect of 3-MA, a pharmacological autophagy inhibitor, on leptin-mediated autophagy and adipocytes inflammation. As presented in Figure 4D, protein levels of LC3II and Atg5 were inhibited in adipocytes incubated with 3-MA. Leptin-mediated the blockage of autophagy was further strengthened with the 3-MA treatment (Figure 4D). However, the mRNA expression profiles of ER stress markers, such as Chop, GRP78, and Atf4 did not change significantly in leptin and TM cotreated cells preincubated with 3-MA than that of no 3-MA-treated cells (Figure 4E). Additionally, inflammatory markers were decreased in cells preincubated with 3-MA and followed treated with leptin and TM (Figure 4F). These findings confirmed that ER stress is the upstream for leptin-mediated autophagy and inflammation in mice adipocytes.
Leptin Inhibited ER Stress-Induced Autophagy and Inflammation in Mice Adipocytes
We had demonstrated that signature genes regulated by leptin were associated with autophagy and inflammation from the volcano plot (Figure 5A). To confirm that leptin inhibited ER stress-induced autophagy and alleviated adipose inflammation, we forced expression or silenced of leptin (Figure 5B). Leptin signal sensitivity was significantly altered after leptin vectors infection as represented by the change of phosphorylation of JAK2 and STAT3 (Figure 5C). Consistently with the exogenous leptin treatment data, overexpression of leptin decreased the protein levels of Chop, GRP78, and Atf4 (Figure 5C). By contrast, interference of leptin observed the opposite results (Figure 5C). Next, we monitor autophagosome formation in adipocytes infected with pAd-leptin or si-leptin, the GFP-LC3 fusion protein was utilized. As expected, overexpression of leptin reduced the formation of exogenous GFP-LC3 puncta, and we found the consistent results in BafA1-treated group, indicating there was a decrease accumulation of autophagosome (Figure 5D). We next measured the autophgic flux via LC3II turnover assay and detected the degradation of SQSTM1. Cells infected with pAd-leptin followed by BafA1 resulted in a significant decrease of LC3II level. In addition, the evident upregulation of SQSTM1 in the present of pAd-leptin and BafA1 confirmed the decreased autophgic flux by leptin treatment in adipocytes (Figure 5E).
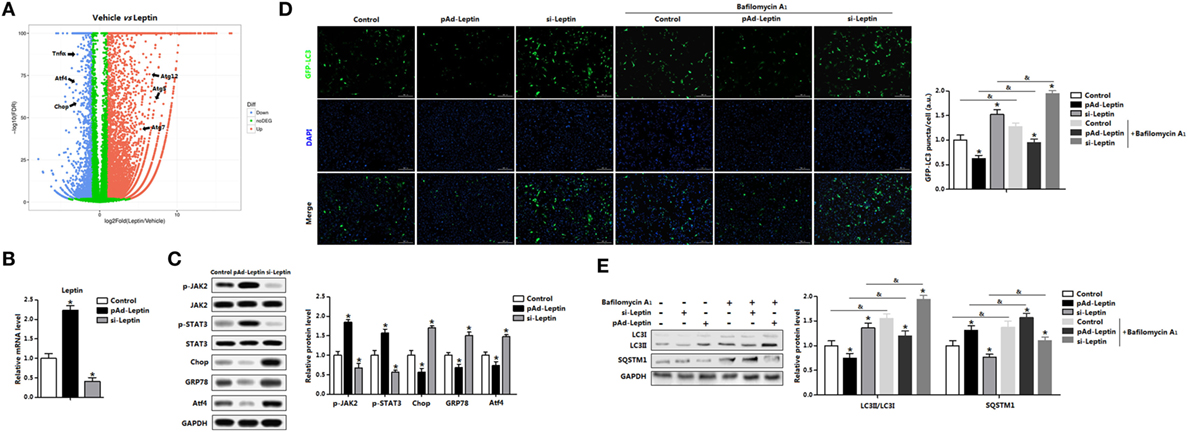
Figure 5. Overexpression of leptin inhibited autophagy in mice adipocytes. (A) Volcano plot of transcriptome in the white epididymal adipose tissue (eWAT) of mice injected with or without leptin (n = 3 each). Individual endoplasmic reticulum (ER) stress, autophagy, and inflammation signature genes were highlighted. Red: upregulated, blue: downregulated. (B) Gene expression level of leptin in adipocytes infected with pAd-Leptin or si-Leptin (n = 3). (C) Protein levels of phosphorylation of Janus kinase 2 (JAK2), signal transducer and activator of transcription 3 (STAT3), C/EBP homologous protein (Chop), glucose-regulated protein 78 (GRP78), and activating transcription factor 4 (Atf4) in adipocytes infected with pAd-Leptin or si-Leptin (n = 3). (D) Representative pictures of GFP-LC3 punctate structures in adipocytes expressing GFP-LC3, in the presence of pAd-Leptin or si-Leptin and pretreated with TM then incubated with or without bafilomycin A1 (BafA1). The nuclei were stained with DAPI shown in blue in adipocytes (n = 3). (E) Representative Western blots showing the protein levels of LC3II and SQSTM1 in adipocytes infected with pAd-Leptin or si-Leptin that pretreated with TM and followed treated with BafA1 or not (n = 3). Full scans of uncropped blots are included in Figure S3. Values are means ± SEM. *p < 0.05 compared with the control group, &p < 0.05 compared with the BafA1 group.
We next determined the effect of 3-MA on leptin mediated autophagy. Monodansylcadervarine (MDC) staining indicated overexpression of leptin significantly reduced autophagy incidence in the cells preincubated with 3-MA (Figure 6A). The autophagy indicators LC3II and Atg5 were decreased with overexpression of leptin followed by 3-MA, while protein of SQSTM1 showed the opposite result (Figure 6B). Furthermore, leptin attenuated proinflammatory cytokines expression in cells pretreatment with 3-MA, similarly to the results showed in control group (Figure 6C). Overall, these findings implicated that leptin blocked ER stress-induced autophagy and alleviated inflammation in mice adipocytes.
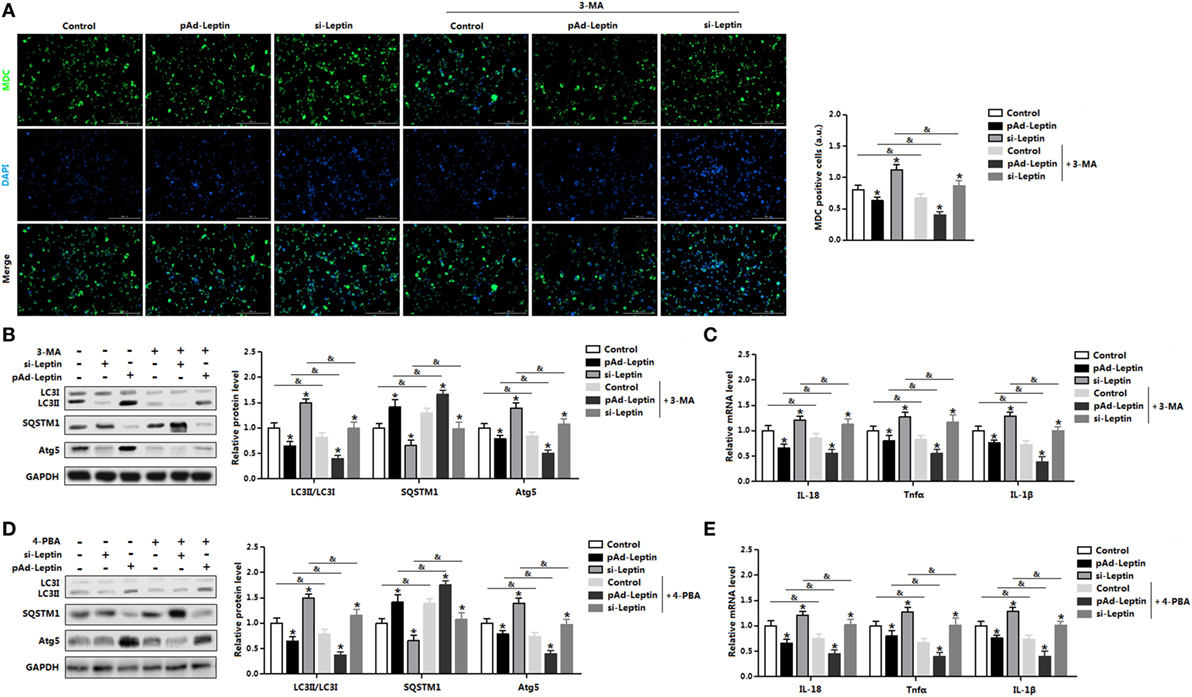
Figure 6. Leptin signal is essential for endoplasmic reticulum (ER) stress-induced autophagy and inflammation in mice adipocytes. Adipocytes were preinfected with pAd-leptin or si-leptin and incubated with tunicamycin (TM), then followed treated with 4-phenylbutyric acid (4-PBA, 5 mM for 2 h) or 3-methyladenine (3-MA, 50 mM for 1 h) (n = 3). (A) Representative pictures of autophagosome formation monitored by monodansylcadervarine (MDC) staining in adipocytes with or without 3-MA treatment. The nuclei were stained with DAPI shown in blue. (B) Representative Western blots showing the protein levels of LC3II, SQSTM1, and Atg5 in adipocytes treated with or without 3-MA. (C) Gene expressions of inflammation markers in adipocytes treated with or without 3-MA. (D) Representative Western blots showing the protein levels of LC3II, SQSTM1 and Atg5 in adipocytes treated with or without 4-PBA. (E) Gene expressions of inflammation markers in adipocytes treated with or without 4-PBA. Full scans of uncropped blots are included in Figure S3. Values are means ± SEM. *p < 0.05 compared with the control group, &p < 0.05 compared with the 3-MA group or 4-PBA group.
Leptin Reduces ER Stress via the Blockade of Atf4 Transcription in Mice Adipocytes
Having confirmed that leptin inhibited ER stress-induced autophagy in adipocytes, we next sought to explore the regulation of leptin on ER stress. As shown in Figures 6D,E, overexpression of leptin downregulated autophagy and inflammation both in the control group and in the 4-PBA group. And as indicated cluster of transcription factors of multiply genes were altered with leptin treatment (Figure 1B). In order to analyze the underlying mechanisms of leptin on ER stress, we firstly considered transcriptional-level control. Our results showed leptin increased the expression of KLF4, but TM treatment had the opposite effect (Figure 7A). Further analysis demonstrated the Atf4 promoter region contained three potential binding domains of KLF4 (Figure 7B). And measurements revealed that the binding site, 560–130 bp upstream of the initiation site of Atf4 functioned (Figures 7B,C). We next treated adipocytes with the overexpression recombinant adenovirus vector of KLF4 (pAd-KLF4) or interference recombinant lentiviral vector of KLF4 (si-KLF4), in the presence of leptin or not. Figure 7D showed cotreatment of leptin and pAd-KLF4 reduced the mRNA levels of Atf4 and Chop significantly (Figure 7D). The data also indicated autophagy indicators Beclin1 and Atg5 were decreased with the overexpression of KLF4, and leptin addition further strengthened this trend (Figure 7D). Thus, these findings suggested KLF4 inhibited the transcription of Atf4, and leptin enhanced the inhibition effect of KLF4 and reduced ER stress of adipocytes.
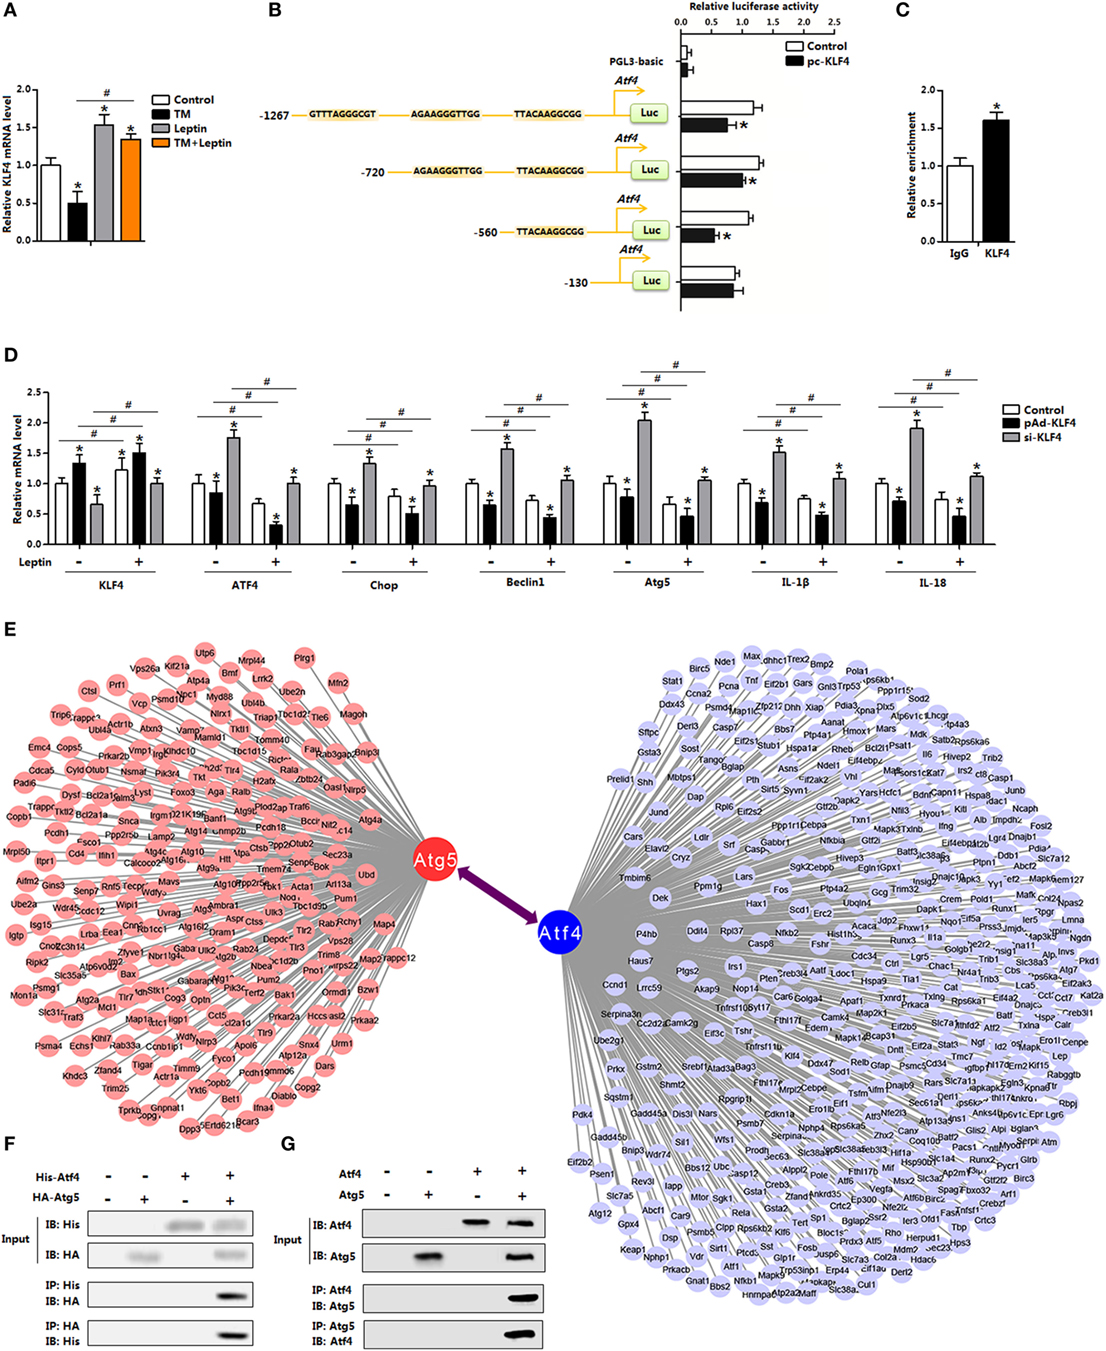
Figure 7. Leptin reduces endoplasmic reticulum (ER) stress via the blockade of activating transcription factor 4 (Atf4) transcription in mice adipocytes. (A) Gene expression of Krüppel-like factor 4 (KLF4) in adipocytes incubated with tunicamycin (TM) or leptin (n = 3). (B) Dual luciferase reporter assay of KLF4 and Atf4. Cells were transfected with PGL3-basic or PGL3-Atf4 plasmids, and pc-KLF4 plasmid (n = 3). (C) Chromatin immunoprecipitation (ChIP) analysis between Atf4 and KLF4 (n = 3). (D) Gene expression levels of KLF4, Atf4, Chop, Beclin1, Atg5, IL-18, and IL-1β in adipocytes infected with pAd-KLF4 or si-KLF4 and incubated with leptin or not (n = 3). (E) Graphic representation of a network of the target genes. Bioinformatics analysis of the protein–protein interaction. (F) Atg5 interacted with Atf4. Coimmunoprecipitation (Co-IP) analysis was done in HA-Atg5 and His-Atf4 transfected HEK293 cells. (G) Co-IP analysis was done in pAd-Atg5 and pAd-Atf4 transfected adipocytes with no infection were used as control. Values are means ± SEM. *p < 0.05 compared with the TM group, #p < 0.05 compared with the leptin treatment group.
Atf4-Atg5 Complex Regulates Leptin-Mediated Autophagy in Mice Adipocytes
The transcriptional regulation of Atf4 by KLF4 led us to hypothesize whether ER stress affected adipocytes autophagy through a transcription regulation either. However, we failed to show this regulation network (data were not shown). The increased protein levels of autophagy-related proteins caused by TM treatment prompted us to further hypothesize that ER stress regulated autophagy by direct modification, through a physical interaction. Firstly based on the bioinformatics analysis and previous data sheet, we showed Atf4 interacted with Atg5 (Figure 7E). Then by protein–protein measurement, Atf4 protein interacted strongly with transfected Atg5 in both HEK293 cells and in adipocytes (Figures 7F,G). Thus, these data suggest that Atf4 and Atg5 directly bind, and then regulated autophagy progress in adipocytes.
To determine whether Atg5 is responsible for leptin-mediated autophagy, we next employed a genetic approach, overexpression recombinant adenovirus vector of Atg5 (pAd-Atg5) or interference recombinant lentiviral vector of Atg5 (si-Atg5), to explore the underline mechanisms. As expected, interference of Atg5 inhibited autophagy of adipocytes and the addition of leptin further reduced the punctate GFP-LC3 formation (Figure 8A). Consistently, LC3II protein level was downregulated in adipocytes cotreated with leptin and si-Atg5 compared with that in the si-Atg5 alone group (Figure 8B). Similar to the 3-MA blockage, gene-silencing of Atg5 combine with leptin treatment also significantly inhibited the increasing of proinflammatory cytokines in adipocytes (Figure 8C). Overall, these findings implicated Atf4-Atg5 complex played key role in the process of leptin-mediated autophagy and inflammation in mice adipocytes.
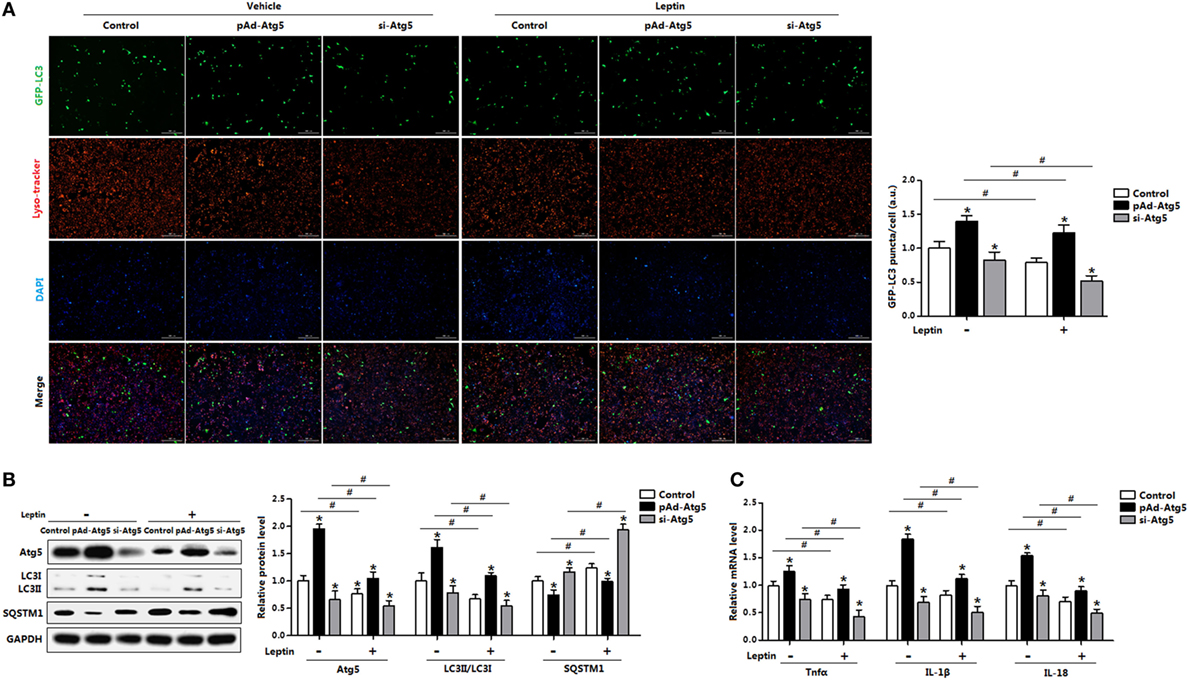
Figure 8. Activating transcription factor 4 (Atf4) forms a complex with Atg5 and drives leptin-mediates autophagy in mice adipocytes. Adipocytes were preinfected with pAd-Atg5 or si-Atg5 and incubated with tunicamycin (TM), followed treated with or without leptin (n = 3). (A) Representative fluorescent photomicrographs showing the GFP-LC3 puncta formation in adipocytes transfected with GFP-LC3 plasmid and stained with Lyso-tracker Red. The nuclei were stained with DAPI shown in blue. (B) Representative Western blots showing the protein levels of Atg5, LC3II, and SQSTM1. (C) Gene expression of Tnfα, IL-1β, and IL-18 in adipocytes. Values are means ± SEM. *p < 0.05 compared with the TM group, #p < 0.05 compared with the leptin group.
Atg5 Activates IκB Signaling Pathway in Autophagy-Mediated Adipocyte Inflammation
Having confirmed that Atg5 functioned in leptin-mediated autophagy and inflammation, we then sought to examine the underlying regulation mechanism of Atg5 in adipocytes inflammation. Overexpression of Atg5 significantly increased autophagy of adipocytes that preincubated with 3-MA (Figure 9A); it also enhanced inflammation by elevating the expression of Tnfα, IL-1β, and IL-18 which were inhibited with 3-MA incubation (Figure 9B). We then measured the protein levels of phosphorylation IκB, NLR family, pyrin domain containing 3 (NLRP3), IL-18, and IL-1β. Results showed the inflammatory indicators such as p-IκB, NLRP3, and IL-1β were all increased with pAd-Atg5 alone treatment, and still increased when cells were cotreated with Atg5 and 3-MA (Figure 9C). We then investigated whether the effect of Atg5 on inflammation was correlated with the degradation of IκB protein. Forced expression of Atg5 greatly increased the protein level of IκB in the cytoplasm and the protein level of p65 in the nuclear extracts (Figure 9D). And this also happened when cells were pretreated with 3-MA (Figure 9D). These findings thus initiated underscore that Atg5-mediated autophagy attenuated inflammation via IκB signaling pathway.
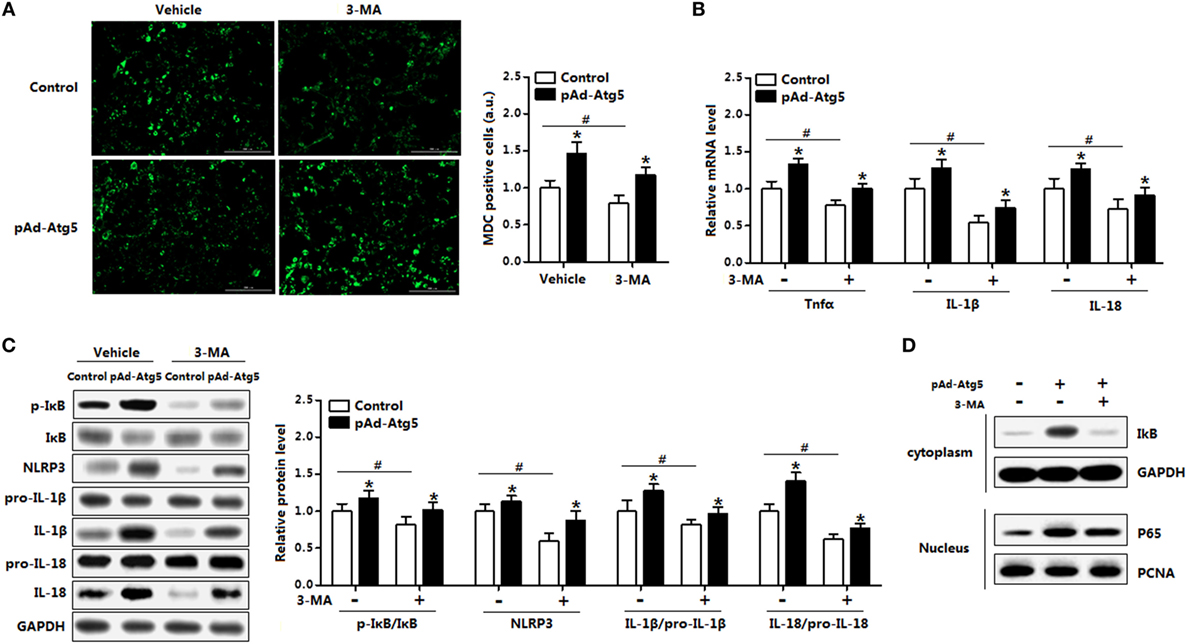
Figure 9. Autophagy-related gene 5 (Atg5) activates IκB signaling pathway in autophagy-mediated adipocyte inflammation. Adipocytes were infected with pAd-Atg5 and incubated with tunicamycin (TM), followed with or without 3-methyladenine (3-MA) treatment (n = 3). (A) Representative pictures of autophagosome formation monitored by MDC staining. (B) Gene expression of Tnfα, IL-18, and IL-1β. (C) Protein level of phosphorylation IκB, NLRP3, IL-1β, and IL-18. (D) IκB and GAPDH protein levels in cytoplasm and P65 and PCNA protein levels in nuclear extracts of the adipocytes. Full scans of uncropped blots are included in Figure S3. Values are means ± SEM. *p < 0.05 compared with the TM group, #p < 0.05 compared with the 3-MA treatment group.
Leptin Administration Reduces Autophagy and Inflammation of Adipose Tissue In Vivo
To further explore the in vivo relevance of our findings, we next determined the induction of ER stress and autophagy in mice treated with leptin. As shown in Figure 10A, leptin injection significantly reduced body weight in leptin genetic deficiency mice (ob/ob mice). The replenish of leptin induced a markedly decrease in the levels of ER stress markers, while increased the level of KLF4 (Figure 10B). Consistently, autophagic marker proteins LC3II, Beclin1, and Atg5 were all reduced with leptin injection compared with those in the ob/ob mice (Figure 10C). As expected, the gene expressions of pro-inflammatory cytokines were also reduced with leptin injection (Figure 10D).
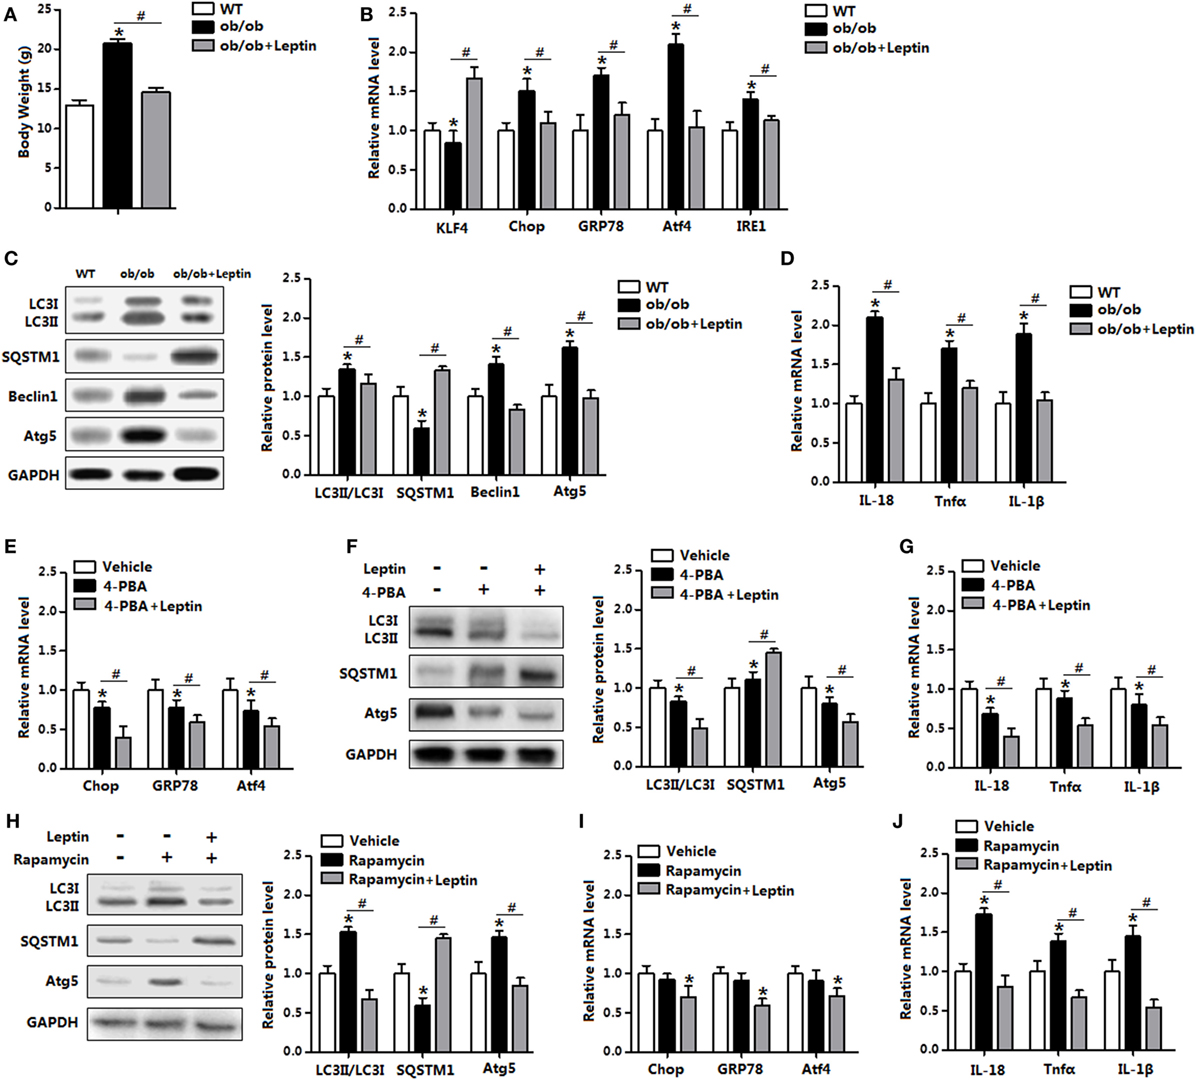
Figure 10. Leptin administration reduced autophagy and inflammation of adipose tissue in vivo. From (A–D) wild-type (WT) mice and ob/ob mice were injected with tunicamycin ™, and followed treated with recombinant leptin protein or not (n = 6). (A) Body weight of the mice. (B) Gene expression level of Krüppel-like factor 4 (KLF4), C/EBP homologous protein (Chop), glucose-regulated protein 78 (GRP78), activating transcription factor 4 (Atf4), and inositol-requiring enzyme 1 (IRE1) in the mice white epididymal adipose tissue (eWAT). (C) The conversion of LC3I to LC3II and protein levels of Atg5, Beclin1, and SQSTM1 were examined by Western blot in the eWAT of mice. (D) Gene expression level of IL-18, Tnfα, and IL-1β in mice eWAT. From (E–G) WT mice were pretreated with TM and 4-phenylbutyric acid (4-PBA), and followed treated with recombinant leptin protein or not (n = 6). (E) Gene expression of ER stress markers in the eWAT of mice. (F) Representative Western blots showing the protein levels of Atg5, LC3II, and SQSTM1 in the eWAT of mice. (G) Gene expression of Tnfα, IL-18, and IL-1β in the eWAT of mice. From (H–J) WT mice were pretreated with TM and rapamyclin, and followed treated with recombinant leptin protein or not (n = 6). (H) Representative Western blots showing the protein levels of Atg5, LC3II, and SQSTM1 in the eWAT of mice. (I) Gene expression of ER stress markers in the eWAT of mice. (J) Gene expression of Tnfα, IL-18, and IL-1β in the eWAT of mice. Full scans of uncropped blots are included in Figure S3. Values are means ± SEM. *p < 0.05 compared with the control group, #p < 0.05 compared with the leptin group.
Next, we used leptin administration in the WT mice which had been trigged ER stress by TM injection. Leptin treatment further reduced ER stress in 4-PBA pretreated mice (Figure 10E). In addition, 4-PBA administration decreased the protein levels of LC3II and Atg5, but increased SQSTM1 level. The addition of leptin further strengthened the autophagy blockage and similarly reduced adipose inflammation (Figures 10F,G). As shown in Figures 10H,I, leptin treatment significantly reduced rapamycin-induced autophagy, along with the downregulation of ER stress. Additionally, the addition of leptin inhibited adipose inflammation in rapamycin injected mice (Figure 10J). Thus, these data verify the role of leptin in the administration of ER stress and autophagy in vivo.
Discussion
Autophagy is an essential lysosome-mediated bulk degradation pathway for cellular survival, development and homeostasis (17, 42). Particularly, autophagy is essential for by endolysosomal degradation and elimination of misfolded proteins and damaged organelles during ER stress (43, 44). Although recent investigations have revealed that ER stress can either stimulate or inhibit autophagy in different cell types, it still does not determine crosstalk between ER stress and autophagy in adipocytes (43, 45–48). Meanwhile, the ER stress-associated molecular cues that control the switch of autophagy are also obscure. In this study, we demonstrated that exogenous TM and Tg stimulated ER stress and autophagy in adipose tissue. These findings are consistent with our previous and other studies that ER stress is sufficient to trigger autophagy and reduce adiponectin expression in adipocytes (12, 49, 50). Moreover, ER stress also initiated inflammation but decreased leptin level in adipocytes. Interestingly, autophagy-deficient adipose tissue has drastically reduced leptin secretion (51). We then investigated the expression profile of core autophagy and inflammation genes in leptin-treated or TM-treated adipose tissue. Our data showed TM elevated but leptin reduced the autophagy-related genes such as Beclin1, Atg5, and Atg12. Consistently, kinds of biological process and pathways correlated with cellular inflammation response were enriched in the GO analysis. Furthermore, we uncovered an unexpected result that leptin inhibited ER stress-induced autophagy and inflammation of adipocyte, though the status of inflammation and autophagy were both elevated in TM-induced ER stress. Previous studies show that ER stress induces adipocyte inflammation and insulin resistance by activating NF-κB pathways (52, 53). Although several previous studies investigate the link between ER stress and autophagy, it remains unclear how leptin affects the crosstalk between ER stress and autophagy (54, 55). It is interesting to note that leptin might be an upstream regulator and be essential for inhibiting ER stress-induced autophagy and alleviating adipocyte inflammation in downstream.
Based on these findings, we first explored the regulatory role of leptin on adipocyte autophagy. Leptin is a well-known adipocyte-derived hormone involved in food intake and energy metabolism (1, 56). Several reports have implicated increased accumulation of autophagosomes possibly functions as a pathogenic signal contributing to induction of ER stress-mediated inflammation (57, 58). In this study, we preliminarily determined that leptin inhibited ER stress-induced autophagy in adipocytes and adipose tissue with downregulating the autophagic flux by LC3II turnover, SQSTM1 degradation and reduced autophagosome clearance. These findings are consistent with other studies that leptin inhibits canonical autophagy in peripheral tissues including skeletal muscle, heart and liver by reducing LC3II, Beclin1, and Atg5 (59, 60). Accordingly, we also employed the approaches of pharmacological inhibition which impeded either early autophagosome formation (by 3-MA) or late autolysosome formation (by BafA1) phases of autophagy signaling, or the ER stress inhibitor (4-PBA) to specifically determine the roles of ER stress and autophagy in mediating the effects of leptin on adipocyte inflammation. Our findings demonstrated that autophagy inhibitor, 3-MA further accelerated leptin-reduced autophagy in adipocytes, while still maintaining leptin-mediated downregulation of ER stress. These findings thus suggested that leptin-mediated inhibition of ER stress was the upstream of autophagy response, which ultimately resulted in the reduction of inflammation as evidenced by decreasing the proinflammatory cytokines expression. Moreover, Saroj et al. find that leptin induces autophagy and promotes apoptosis in cancer cells (61). Indeed, we speculate that cellular events, i.e., autophagy, ER stress and apoptosis, respond to leptin very differently in normal and cancer cells (62, 63). Similar to these findings, it is thought that ER stress initiates autophagy only when aggregated proteins become excessive enough to overwhelm the canonical ubiquitin-proteasome-dependent ER-associated degradation (64, 65). Moreover, studies indicate the transcriptional upregulation of LC3 and Atg5 depends on Atf4 and Chop induction during ER stress-induced autophagy (66, 67). Intriguingly, our present study found that Atf4 directly interacted with Atg5 and the complex was formed to mediate autophagy and inflammatory response in adipocytes. Furthermore, we showed that KLF4 bound to the Atf4 promoter region then inhibited the transcription of Atf4, suggesting that leptin inhibited ER stress of adipocytes through activating JAK2/STAT3 pathway and promoting KLF4 transcriptional inhibition of Atf4. Recent studies also confirm that KLF4 mediates leptin’s effects in hypothalamic arcuate nucleus (68, 69). Another intriguing observation from the present study was that Atf4 had a protein–protein interaction with Atg5 and subsequently initiated adipocyte autophagy. The main events of autophagy, such as phagophore formation and maturation, are substantially maintained by the ATG12-ATG5 conjugate (70–72). This observation was further confirmed by the results that inhibition of Atg5 abolished leptin signaling-mediated autophagy induction in adipocytes. Collectively, our findings provide the first evidence that leptin signal regulates autophagy of adipocytes through the Atf4-Atg5 signal, although how leptin regulate protein activity of Atf4-Atg5 complex still requires further investigation.
One question remains to be answered is that how leptin inhibited ER stress-induced inflammation by activating autophagy. Increasing evidence demonstrates the importance of NLRP3 inflammasome in the regulation of adipocyte inflammation (73, 74). IκB kinase is one of the most important kinases that mediates the effects of general inflammatory stimuli inside adipocyte and is a major upstream regulator of NLRP3 inflammasome (8, 75, 76). In the current study, we demonstrated that leptin reduced NLRP3 protein level and inflammatory factors expression by inhibiting Atg5-mediated autophagy. These findings are consistent with the studies proposed the essential relationship between autophagosomes formation and NLRP3 inflammasome activation (77, 78). Unexpectedly, our result also showed that reduction of autophagy by 3-MA ameliorated inflammation as leptin functioned in adipocyte. Though TM-induced ER stress can directly activate NLRP3 inflammasome and mediate p65 translocation in nucleus which has been confirmed by our data and other studies, further investigations are needed to resolve the detail molecular mechanisms (79, 80).
In summary, our present study demonstrates that leptin inhibits ER stress-induced inflammation through reducing Atf4-Atg5-mediated autophagy in adipocytes. Moreover, leptin is essential for transcriptional regulation of Atf4/Atg5 signal during the NLRP3 inflammasome degradation in adipocytes (Figure 11). Thus, our results provide a novel therapeutic option for exploring the proteasome or autophagy activator to reverse obesity-related metabolic disorders.
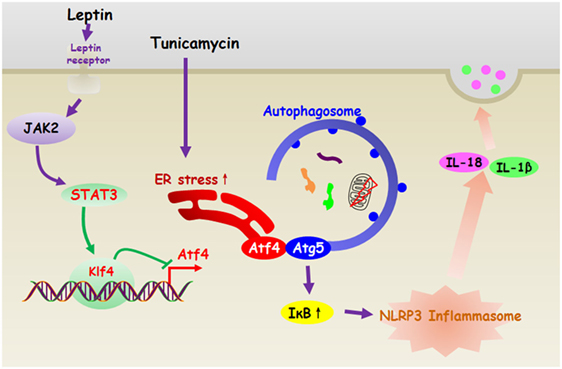
Figure 11. Leptin inhibited endoplasmic reticulum (ER) stress-mediated autophagy and inflammation through the negatively regulation of activating transcription factor 4 (Atf4)/Atg5 complex in adipocytes. And leptin is essential for transcriptional regulation of Atf4/Atg5 signal during the NLRP3 inflammasome degradation in adipocytes.
Data Accession
The raw data have been deposited to NCBI Sequence Read Archive (SRA). The NCBI SRA accession: SRP119756.
Ethics Statement
Mice handling protocols were conducted following the guidelines and regulations approved by the Animal Ethics Committee of Northwest A&F University.
Author Contributions
LG and CS designed research. All authors performed research. ZL and DL analyzed data. QR, HW, and CL contributed reagents/analytic tools. LG and ZL wrote the article.
Conflict of Interest Statement
The authors declare that the research was conducted in the absence of any commercial or financial relationships that could be construed as a potential conflict of interest.
Acknowledgments
We appreciated Prof. Shimin Liu from School of Animal Biology, The University of Western Australia help us improve the English writing.
Funding
This work was supported by the Major National Scientific Research Projects under Grant 2015CB943102; and the National Nature Science Foundation of China under Grant 31572365; and the Key Sci-tech innovation team of Shaanxi province under Grant 2017KCT-24.
Supplementary Material
The Supplementary Material for this article can be found online at http://www.frontiersin.org/article/10.3389/fimmu.2017.01507/full#supplementary-material.
References
1. Stern JH, Rutkowski JM, Scherer PE. Adiponectin, leptin, and fatty acids in the maintenance of metabolic homeostasis through adipose tissue crosstalk. Cell Metab (2016) 23:770–84. doi:10.1016/j.cmet.2016.04.011
2. Zeng W, Pirzgalska RM, Pereira MM, Kubasova N, Barateiro A, Seixas E, et al. Sympathetic neuro-adipose connections mediate leptin-driven lipolysis. Cell (2015) 163:84–94. doi:10.1016/j.cell.2015.08.055
3. Arteaga-Solis E, Zee T, Emala CW, Vinson C, Wess J, Karsenty G. Inhibition of leptin regulation of parasympathetic signaling as a cause of extreme body weight-associated asthma. Cell Metab (2013) 17:35–48. doi:10.1016/j.cmet.2012.12.004
4. Huby AC, Antonova G, Groenendyk J, Gomez-Sanchez CE, Bollag WB, Filosa JA, et al. Adipocyte-derived hormone leptin is a direct regulator of aldosterone secretion, which promotes endothelial dysfunction and cardiac fibrosis. Circulation (2015) 132:2134–45. doi:10.1161/CIRCULATIONAHA.115.018226
5. Wernstedt Asterholm I, Tao C, Morley TS, Wang QA, Delgado-Lopez F, Wang ZV, et al. Adipocyte inflammation is essential for healthy adipose tissue expansion and remodeling. Cell Metab (2014) 20:103–18. doi:10.1016/j.cmet.2014.05.005
6. Gregor MF, Hotamisligil GS. Inflammatory mechanisms in obesity. Annu Rev Immunol (2011) 29:415–45. doi:10.1146/annurev-immunol-031210-101322
7. Olefsky JM, Glass CK. Macrophages, inflammation, and insulin resistance. Annu Rev Physiol (2010) 72:219–46. doi:10.1146/annurev-physiol-021909-135846
8. Liu J, Ibi D, Taniguchi K, Lee J, Herrema H, Akosman B, et al. Inflammation improves glucose homeostasis through ikkbeta-xbp1s interaction. Cell (2016) 167:1052–66.e18. doi:10.1016/j.cell.2016.10.015
9. Lee J, Ozcan U. Unfolded protein response signaling and metabolic diseases. J Biol Chem (2014) 289:1203–11. doi:10.1074/jbc.R113.534743
10. Walter P, Ron D. The unfolded protein response: from stress pathway to homeostatic regulation. Science (2011) 334:1081–6. doi:10.1126/science.1209038
11. Wang M, Kaufman RJ. Protein misfolding in the endoplasmic reticulum as a conduit to human disease. Nature (2016) 529:326–35. doi:10.1038/nature17041
12. Liu Z, Gan L, Wu T, Feng F, Luo D, Gu H, et al. Adiponectin reduces ER stress-induced apoptosis through PPARalpha transcriptional regulation of ATF2 in mouse adipose. Cell Death Dis (2016) 7:e2487. doi:10.1038/cddis.2016.388
13. Zhang X, Zhang G, Zhang H, Karin M, Bai H, Cai D. Hypothalamic IKKbeta/NF-kappaB and ER stress link overnutrition to energy imbalance and obesity. Cell (2008) 135:61–73. doi:10.1016/j.cell.2008.07.043
14. Nakamura T, Furuhashi M, Li P, Cao H, Tuncman G, Sonenberg N, et al. Double-stranded RNA-dependent protein kinase links pathogen sensing with stress and metabolic homeostasis. Cell (2010) 140:338–48. doi:10.1016/j.cell.2010.01.001
15. Ozcan L, Ergin AS, Lu A, Chung J, Sarkar S, Nie D, et al. Endoplasmic reticulum stress plays a central role in development of leptin resistance. Cell Metab (2009) 9:35–51. doi:10.1016/j.cmet.2008.12.004
16. Luan B, Goodarzi MO, Phillips NG, Guo X, Chen YD, Yao J, et al. Leptin-mediated increases in catecholamine signaling reduce adipose tissue inflammation via activation of macrophage HDAC4. Cell Metab (2014) 19:1058–65. doi:10.1016/j.cmet.2014.03.024
17. Mizushima N, Komatsu M. Autophagy: renovation of cells and tissues. Cell (2011) 147:728–41. doi:10.1016/j.cell.2011.10.026
18. Mizushima N, Levine B. Autophagy in mammalian development and differentiation. Nat Cell Biol (2010) 12:823–30. doi:10.1038/ncb0910-823
19. Periyasamy P, Guo ML, Buch S. Cocaine induces astrocytosis through ER stress-mediated activation of autophagy. Autophagy (2016) 12:1310–29. doi:10.1080/15548627.2016.1183844
20. Yoshizaki T, Kusunoki C, Kondo M, Yasuda M, Kume S, Morino K, et al. Autophagy regulates inflammation in adipocytes. Biochem Biophys Res Commun (2012) 417:352–7. doi:10.1016/j.bbrc.2011.11.114
21. Ma XH, Piao SF, Dey S, McAfee Q, Karakousis G, Villanueva J, et al. Targeting ER stress-induced autophagy overcomes BRAF inhibitor resistance in melanoma. J Clin Invest (2014) 124:1406–17. doi:10.1172/JCI70454
22. Hernández-Gea V, Hilscher M, Rozenfeld R, Lim MP, Nieto N, Werner S, et al. Endoplasmic reticulum stress induces fibrogenic activity in hepatic stellate cells through autophagy. J Hepatol (2013) 59:98–104. doi:10.1016/j.jhep.2013.02.016
23. Martinez-Lopez N, Garcia-Macia M, Sahu S, Athonvarangkul D, Liebling E, Merlo P, et al. Autophagy in the CNS and periphery coordinate lipophagy and lipolysis in the brown adipose tissue and liver. Cell Metab (2016) 23:113–27. doi:10.1016/j.cmet.2015.10.008
24. Kaushik S, Cuervo AM. Degradation of lipid droplet-associated proteins by chaperone-mediated autophagy facilitates lipolysis. Nat Cell Biol (2015) 17:759–70. doi:10.1038/ncb3166
25. He C, Klionsky DJ. Regulation mechanisms and signaling pathways of autophagy. Annu Rev Genet (2009) 43:67–93. doi:10.1146/annurev-genet-102808-114910
26. Klionsky DJ, Abdelmohsen K, Abe A, Abedin MJ, Abeliovich H, Acevedo Arozena A, et al. Guidelines for the use and interpretation of assays for monitoring autophagy (3rd edition). Autophagy (2016) 12:1–222. doi:10.1080/15548627.2015.1100356
27. Singh R, Kaushik S, Wang Y, Xiang Y, Novak I, Komatsu M, et al. Autophagy regulates lipid metabolism. Nature (2009) 458:1131–5. doi:10.1038/nature07976
28. Zhang Y, Goldman S, Baerga R, Zhao Y, Komatsu M, Jin S. Adipose-specific deletion of autophagy-related gene 7 (atg7) in mice reveals a role in adipogenesis. Proc Natl Acad Sci U S A (2009) 106:19860–5. doi:10.1073/pnas.0906048106
29. Liu Z, Xu J, He J, Liu H, Lin P, Wan X, et al. Mature adipocytes in bone marrow protect myeloma cells against chemotherapy through autophagy activation. Oncotarget (2015) 6:34329–41. doi:10.18632/oncotarget.6020
30. Dapito DH, Mencin A, Gwak GY, Pradere JP, Jang MK, Mederacke I, et al. Promotion of hepatocellular carcinoma by the intestinal microbiota and TLR4. Cancer Cell (2012) 21:504–16. doi:10.1016/j.ccr.2012.02.007
31. Hodeify R, Megyesi J, Tarcsafalvi A, Mustafa HI, Hti Lar Seng NS, Price PM. Gender differences control the susceptibility to ER stress-induced acute kidney injury. Am J Physiol Renal Physiol (2013) 304:F875–82. doi:10.1152/ajprenal.00590.2012
32. El Karoui K, Viau A, Dellis O, Bagattin A, Nguyen C, Baron W, et al. Endoplasmic reticulum stress drives proteinuria-induced kidney lesions via Lipocalin 2. Nature (2016) 7:10330. doi:10.1038/ncomms10330
33. Liu J, Lee J, Salazar Hernandez MA, Mazitschek R, Ozcan U. Treatment of obesity with celastrol. Cell (2015) 161:999–1011. doi:10.1016/j.cell.2015.05.011
34. Rodríguez A, Becerril S, Méndez-Giménez L, Ramírez B, Sáinz N, Catalán V, et al. Leptin administration activates irisin-induced myogenesis via nitric oxide-dependent mechanisms, but reduces its effect on subcutaneous fat browning in mice. Int J Obes (Lond) (2015) 39:397–407. doi:10.1038/ijo.2014.166
35. Shah D, Romero F, Guo Z, Sun J, Li J, Kallen CB, et al. Obesity-induced endoplasmic reticulum stress causes lung endothelial dysfunction and promotes acute lung injury. Am J Respir Cell Mol Biol (2017) 57:204–15. doi:10.1165/rcmb.2016-0310OC
36. Quy PN, Kuma A, Pierre P, Mizushima N. Proteasome-dependent activation of mammalian target of rapamycin complex 1 (mTORC1) is essential for autophagy suppression and muscle remodeling following denervation. J Biol Chem (2013) 288(2):1125–34. doi:10.1074/jbc.M112.399949
37. Liu Z, Gan L, Chen Y, Luo D, Zhang Z, Cao W, et al. Mark4 promotes oxidative stress and inflammation via binding to PPARgamma and activating NF-kappaB pathway in mice adipocytes. Sci Rep (2016) 6:21382. doi:10.1038/srep21382
38. Gan L, Liu Z, Cao W, Zhang Z, Sun C. FABP4 reversed the regulation of leptin on mitochondrial fatty acid oxidation in mice adipocytes. Sci Rep (2015) 5:13588. doi:10.1038/srep13588
39. Liu Z, Gan L, Luo D, Sun C. Melatonin promotes circadian rhythm-induced proliferation through interaction of Clock/HDAC3/c-Myc in mice adipose tissue. J Pineal Res (2016) 62:e12383. doi:10.1111/jpi.12383
40. Zhong Z, Umemura A, Sanchez-Lopez E, Liang S, Shalapour S, Wong J, et al. NF-kappaB restricts inflammasome activation via elimination of damaged mitochondria. Cell (2016) 164:896–910. doi:10.1016/j.cell.2015.12.057
41. Gan L, Liu Z, Chen Y, Dan L, Feng F, Liu G, et al. alpha-MSH and Foxc2 promote fatty acid oxidation through C/EBPbeta negative transcription in mice adipose tissue. Sci Rep (2016) 6:36661. doi:10.1038/srep36661
42. Levine B, Kroemer G. Autophagy in the pathogenesis of disease. Cell (2008) 132:27–42. doi:10.1016/j.cell.2007.12.018
43. Rashid HO, Yadav RK, Kim HR, Chae HJ. ER stress: autophagy induction, inhibition and selection. Autophagy (2015) 11:1956–77. doi:10.1080/15548627.2015.1091141
44. Houck SA, Ren HY, Madden VJ, Bonner JN, Conlin MP, Janovick JA, et al. Quality control autophagy degrades soluble ERAD-resistant conformers of the misfolded membrane protein GnRHR. Mol Cell (2014) 54:166–79. doi:10.1016/j.molcel.2014.02.025
45. McCullough KD, Martindale JL, Klotz LO, Aw TY, Holbrook NJ. Gadd153 sensitizes cells to endoplasmic reticulum stress by down-regulating Bcl2 and perturbing the cellular redox state. Mol Cell Biol (2001) 21:1249–59. doi:10.1128/MCB.21.4.1249-1259.2001
46. Appenzeller-Herzog C, Hall MN. Bidirectional crosstalk between endoplasmic reticulum stress and mTOR signaling. Trends Cell Biol (2012) 22:274–82. doi:10.1016/j.tcb.2012.02.006
47. Woehlbier U, Hetz C. Modulating stress responses by the UPRosome: a matter of life and death. Trends Biochem Sci (2011) 36:329–37. doi:10.1016/j.tibs.2011.03.001
48. Brüning A, Rahmeh M, Friese K. Nelfinavir and bortezomib inhibit mTOR activity via ATF4-mediated sestrin-2 regulation. Mol Oncol (2013) 7:1012–8. doi:10.1016/j.molonc.2013.07.010
49. Zhou L, Liu F. Autophagy: roles in obesity-induced ER stress and adiponectin downregulation in adipocytes. Autophagy (2010) 6:1196–7. doi:10.4161/auto.6.8.13478
50. Deegan S, Saveljeva S, Gorman AM, Samali A. Stress-induced self-cannibalism: on the regulation of autophagy by endoplasmic reticulum stress. Cell Mol Life Sci (2013) 70:2425–41. doi:10.1007/s00018-012-1173-4
51. Goldman S, Zhang Y, Jin S. Autophagy and adipogenesis: implications in obesity and type II diabetes. Autophagy (2010) 6:179–81. doi:10.4161/auto.6.1.10814
52. Fuchs CD, Claudel T, Kumari P, Haemmerle G, Pollheimer MJ, Stojakovic T, et al. Absence of adipose triglyceride lipase protects from hepatic endoplasmic reticulum stress in mice. Hepatology (2012) 56:270–80. doi:10.1002/hep.25601
53. Schenk S, Saberi M, Olefsky JM. Insulin sensitivity: modulation by nutrients and inflammation. J Clin Invest (2008) 118:2992–3002. doi:10.1172/JCI34260
54. Settembre C, Ballabio A. Lysosome: regulator of lipid degradation pathways. Trends Cell Biol (2014) 24:743–50. doi:10.1016/j.tcb.2014.06.006
55. Fouillet A, Levet C, Virgone A, Robin M, Dourlen P, Rieusset J, et al. ER stress inhibits neuronal death by promoting autophagy. Autophagy (2012) 8:915–26. doi:10.4161/auto.19716
56. Friedman JM, Halaas JL. Leptin and the regulation of body weight in mammals. Nature (1998) 395:763–70. doi:10.1038/27376
57. Kanayama M, Inoue M, Danzaki K, Hammer G, He YW, Shinohara ML. Autophagy enhances NFkappaB activity in specific tissue macrophages by sequestering A20 to boost antifungal immunity. Nat Commun (2015) 6:5779. doi:10.1038/ncomms6779
58. Park HW, Park H, Semple IA, Jang I, Ro SH, Kim M, et al. Pharmacological correction of obesity-induced autophagy arrest using calcium channel blockers. Nat Commun (2014) 5:4834. doi:10.1038/ncomms5834
59. Malik SA, Marino G, BenYounes A, Shen S, Harper F, Maiuri MC, et al. Neuroendocrine regulation of autophagy by leptin. Cell Cycle (2011) 10:2917–23. doi:10.4161/cc.10.17.17067
60. Kandadi MR, Roe ND, Ren J. Autophagy inhibition rescues against leptin-induced cardiac contractile dysfunction. Curr Pharm Des (2014) 20:675–83. doi:10.2174/13816128113199990019
61. Nepal S, Kim MJ, Hong JT, Kim SH, Sohn DH, Lee SH, et al. Autophagy induction by leptin contributes to suppression of apoptosis in cancer cells and xenograft model: involvement of p53/FoxO3A axis. Oncotarget (2015) 6:7166–81. doi:10.18632/oncotarget.3347
62. Hopkins BD, Goncalves MD, Cantley LC. Obesity and cancer mechanisms: cancer metabolism. J Clin Oncol (2016) 34:4277–83. doi:10.1200/JCO.2016.67.9712
63. Deng T, Lyon CJ, Bergin S, Caligiuri MA, Hsueh WA. Obesity, inflammation, and cancer. Annu Rev Pathol (2016) 11:421–49. doi:10.1146/annurev-pathol-012615-044359
64. Ogata M, Hino S, Saito A, Morikawa K, Kondo S, Kanemoto S, et al. Autophagy is activated for cell survival after endoplasmic reticulum stress. Mol Cell Biol (2006) 26:9220–31. doi:10.1128/MCB.01453-06
65. Khaminets A, Heinrich T, Mari M, Grumati P, Huebner AK, Akutsu M, et al. Regulation of endoplasmic reticulum turnover by selective autophagy. Nature (2015) 522:354–8. doi:10.1038/nature14498
66. Rouschop KM, van den Beucken T, Dubois L, Niessen H, Bussink J, Savelkouls K, et al. The unfolded protein response protects human tumor cells during hypoxia through regulation of the autophagy genes MAP1LC3B and ATG5. J Clin Invest (2010) 120:127–41. doi:10.1172/JCI40027
67. Hart LS, Cunningham JT, Datta T, Dey S, Tameire F, Lehman SL, et al. ER stress-mediated autophagy promotes Myc-dependent transformation and tumor growth. J Clin Invest (2012) 122:4621–34. doi:10.1172/JCI62973
68. Imbernon M, Sanchez-Rebordelo E, Gallego R, Gandara M, Lear P, Lopez M, et al. Hypothalamic KLF4 mediates leptin’s effects on food intake via AgRP. Mol Metab (2014) 3:441–51. doi:10.1016/j.molmet.2014.04.001
69. Ilnytska O, Stutz AM, Park-York M, York DA, Ribnicky DM, Zuberi A, et al. Molecular mechanisms for activation of the agouti-related protein and stimulation of appetite. Diabetes (2011) 60:97–106. doi:10.2337/db10-0172
70. Otomo C, Metlagel Z, Takaesu G, Otomo T. Structure of the human ATG12~ATG5 conjugate required for LC3 lipidation in autophagy. Nat Struct Mol Biol (2013) 20:59–66. doi:10.1038/nsmb.2431
71. Altshuler-Keylin S, Shinoda K, Hasegawa Y, Ikeda K, Hong H, Kang Q, et al. Beige adipocyte maintenance is regulated by autophagy-induced mitochondrial clearance. Cell Metab (2016) 24:402–19. doi:10.1016/j.cmet.2016.08.002
72. Ma T, Li J, Xu Y, Yu C, Xu T, Wang H, et al. Atg5-independent autophagy regulates mitochondrial clearance and is essential for iPSC reprogramming. Nat Cell Biol (2015) 17:1379–87. doi:10.1038/ncb3256
73. Stienstra R, Joosten LA, Koenen T, van Tits B, van Diepen JA, van den Berg SA, et al. The inflammasome-mediated caspase-1 activation controls adipocyte differentiation and insulin sensitivity. Cell Metab (2010) 12:593–605. doi:10.1016/j.cmet.2010.11.011
74. Stienstra R, van Diepen JA, Tack CJ, Zaki MH, van de Veerdonk FL, Perera D, et al. Inflammasome is a central player in the induction of obesity and insulin resistance. Proc Natl Acad Sci U S A (2011) 108:15324–9. doi:10.1073/pnas.1100255108
75. Hacker H, Karin M. Regulation and function of IKK and IKK-related kinases. Sci STKE (2006) 2006:re13. doi:10.1126/stke.3572006re13
76. Martin BN, Wang C, Willette-Brown J, Herjan T, Gulen MF, Zhou H, et al. IKKalpha negatively regulates ASC-dependent inflammasome activation. Nat Commun (2014) 5:4977. doi:10.1038/ncomms5977
77. Zhou R, Yazdi AS, Menu P, Tschopp J. A role for mitochondria in NLRP3 inflammasome activation. Nature (2011) 469:221–5. doi:10.1038/nature09663
78. Nakahira K, Haspel JA, Rathinam VA, Lee SJ, Dolinay T, Lam HC, et al. Autophagy proteins regulate innate immune responses by inhibiting the release of mitochondrial DNA mediated by the NALP3 inflammasome. Nat Immunol (2011) 12:222–30. doi:10.1038/ni.1980
79. Bronner DN, Abuaita BH, Chen X, Fitzgerald KA, Nunez G, He Y, et al. Endoplasmic reticulum stress activates the inflammasome via NLRP3- and Caspase-2-driven mitochondrial damage. Immunity (2015) 43:451–62. doi:10.1016/j.immuni.2015.08.008
Keywords: leptin, endoplasmic reticulum stress, autophagy, Atf4/Atg5, inflammation, adipocyte
Citation: Gan L, Liu Z, Luo D, Ren Q, Wu H, Li C and Sun C (2017) Reduced Endoplasmic Reticulum Stress-Mediated Autophagy Is Required for Leptin Alleviating Inflammation in Adipose Tissue. Front. Immunol. 8:1507. doi: 10.3389/fimmu.2017.01507
Received: 19 August 2017; Accepted: 25 October 2017;
Published: 08 November 2017
Edited by:
Willem Van Eden, Utrecht University, NetherlandsReviewed by:
David Dombrowicz, Institut national de la santé et de la recherche médicale, FranceBo-Zong Shao, Second Military Medical University, China
Copyright: © 2017 Gan, Liu, Luo, Ren, Wu, Li and Sun. This is an open-access article distributed under the terms of the Creative Commons Attribution License (CC BY). The use, distribution or reproduction in other forums is permitted, provided the original author(s) or licensor are credited and that the original publication in this journal is cited, in accordance with accepted academic practice. No use, distribution or reproduction is permitted which does not comply with these terms.
*Correspondence: Chao Sun, c3VuY2hhbzI3NzVAMTYzLmNvbQ==