 Ling Huang1
 Michiel G. H. Betjes1Mariska Klepper1
 Anton W. Langerak2
 Carla C. Baan1
 Nicolle H. R. Litjens1*
- 1Department of Internal Medicine, Erasmus MC, University Medical Center Rotterdam, Nephrology and Transplantation, Rotterdam, Netherlands
- 2Department of Immunology, Erasmus MC, University Medical Center Rotterdam, Rotterdam, Netherlands
A broad T cell receptor (TCR-) repertoire is required for an effective immune response. TCR-repertoire diversity declines with age. End-stage renal disease (ESRD) patients have a prematurely aged T cell system which is associated with defective T cell-mediated immunity. Recently, we showed that ESRD may significantly skew the TCR Vβ-repertoire. Here, we assessed the impact of ESRD on the TCR Vβ-repertoire within different T cell subsets using a multiparameter flow-cytometry-based assay, controlling for effects of aging and CMV latency. Percentages of 24 different TCR Vβ-families were tested in circulating naive and memory T cell subsets of 10 ESRD patients and 10 age- and CMV-serostatus-matched healthy individuals (HI). The Gini-index, a parameter used in economics to describe the distribution of income, was calculated to determine the extent of skewing at the subset level taking into account frequencies of all 24 TCR Vβ-families. In addition, using HI as reference population, the differential impact of ESRD was assessed on clonal expansion at the level of an individual TCR Vβ-family. CD8+, but not CD4+, T cell differentiation was associated with higher Gini-TCR indices. Gini-TCR indices were already significantly higher for different CD8+ memory T cell subsets of younger ESRD patients compared to their age-matched HI. ESRD induced expansions of not one TCR Vβ-family in particular and expansions were predominantly observed within the CD8+ T cell compartment. All ESRD patients had expanded TCR Vβ-families within total CD8+ T cells and the median (IQ range) number of expanded TCR Vβ-families/patient amounted to 2 (1–4). Interestingly, ESRD also induced clonal expansions of TCR Vβ-families within naive CD8+ T cells as 8 out of 10 patients had expanded TCR Vβ-families. The median (IQ range) number of expanded families/patient amounted to 1 (1–1) within naive CD8+ T cells. In conclusion, loss of renal function skews the TCR Vβ-repertoire already in younger patients by inducing expansions of different TCR Vβ-families within the various T cell subsets, primarily affecting the CD8+ T cell compartment. This skewed TCR Vβ-repertoire may be associated with a less broad and diverse T cell-mediated immunity.
Introduction
End-stage renal disease (ESRD) patients have a decreased vaccination efficacy (1–4), an increased susceptibility for infection (5–7) and a higher risk for the development of tumors (8–11). Loss of renal function is associated with a prematurely aged T cell system (12), most likely caused by the uremia-induced proinflammatory environment (13). These uremia-induced effects on T cells are expressed as a decline in thymic output, a severe depletion of naive T cell compartment, a shift to more highly differentiated memory T cell subsets, attrition of T cell telomeres (14) and a defective T cell receptor (TCR)-induced ERK phosphorylation (15).
A broad TCR-repertoire capable of recognizing a wide range of foreign antigens is crucial for adequate T cell-mediated immune responses (16). Most TCRs consist of an α and β chain and each chain is composed of a variable (V) and a constant (C) region (17). The TCR Vβ-repertoire can be assessed using several approaches such as gene scan spectratyping via a DNA-based PCR (18), Vβ-family phenotyping by flow-cytometry (19–21), and assessment of clonal diversity via next generation sequencing (NGS) (22, 23). Gene scan spectratyping of the TCR Vβ-repertoire is at best a semiquantitative measurement. Both flow-cytometry and NGS result in a more accurate quantitative assessment of the TCR Vβ-repertoire. As NGS is more labor-intensive and sorting of highly pure T cells or their subsets is required, many researchers prefer to use flow-cytometry. Flow-cytometry allows for measuring percentages of TCR Vβ-families at the T cell-subset level obviating the need for cell sorting.
We recently examined the TCR Vβ-repertoire in ESRD patients using multiplex DNA-based spectratyping. We showed ESRD to significantly and independently skew the TCR Vβ-repertoire in older individuals and this skewing was predominantly present within the CD8+ memory T cell compartment (24). However, details of this skewed TCR Vβ-repertoire in ESRD patients are still lacking and quantitative data related to the impact of ESRD on TCR Vβ-repertoire in the various T cell populations is rare.
During aging, the TCR Vβ-repertoire has been reported to contract (25). Aging is associated with a decline in the naive T cell compartment which possess the broadest TCR repertoire (26), and a shift toward memory T cells, developing upon encountering of an antigen and having a skewed repertoire toward particular specificities (27, 28). The prevalence of CMV-seropositivity is high amongst ESRD patients, varying from 30 to 100%, depending on socioeconomic and ethnic background (29). CMV latency profoundly affects circulating T cells resembling features of aging, including increased frequencies of more differentiated memory T cells (30, 31) and loss of telomere length (32). CMV latency may also induce contraction of the TCR Vβ-repertoire as it induces expansion of CMV-specific T cells immunocompetent donors (33) and these CMV-specific clones are stably maintained for 5 years (34). Thus, TCR Vβ-repertoire diversity may be affected by various factors.
In this study, we assessed the TCR Vβ-repertoire diversity within different T cell subsets in ESRD patients using a flow-cytometry-based taking into account the effects of aging and CMV latency.
Materials and Methods
Study Population
A cohort of 10 stable ESRD patients, either younger individuals (n = 5, age < 45 years) or older individuals (n = 5, age ≥ 65 years) with an oligoclonal TCR Vβ-repertoire, as determined by DNA-based spectratyping earlier (24) were studied in more detail at the T cell-subset level using a flow-cytometry based assay for TCR Vβ-repertoire analysis. Patients having a glomerular filtration rate below 15 mL/min and either or not receiving renal replacement therapy (RRT) were included. Patients were excluded from the study when having a bacterial or viral infection, malignancy, a previous transplantation or taking immunosuppressive medication (except for glucocorticoids). The patient data are compared to those generated from 10 age- and CMV-matched healthy individuals (HIs) with a polyclonal TCR Vβ-repertoire, as determined by DNA-based spectratyping (24). Lithium-heparinized blood was drawn from ESRD patients and HI. Written informed consent was obtained from all individuals included. The study was approved by the local medical ethical committee (METC number: 2012-022) and conducted according to the principles of Declaration of Helsinki and in compliance with International Conference on Harmonization/Good Clinical Practice regulations.
Sample Preparation
Peripheral blood mononuclear cells (PBMCs) were isolated from 35 mL of lithium-heparinized blood by density centrifugation as described previously (35) and then frozen at 10 × 106 PBMC per vial at −190°C until further use.
Cryopreserved PBMCs (1 vial of 10 × 106 PBMCs) were thawed, counted, washed and resuspended in Isoflow™ Sheath Fluid (Beckman Coulter B.V., Woerden, Netherlands). The PBMCs were stained with Brilliant Violet 510-labeled anti-CD3 (BioLegend, Uithoorn, Netherlands), Alexa Fluor (AF)700-labeled anti-CD4 (Beckman Coulter B.V.) and Allophycocyanin (APC)-Cy7-labeled anti-CD8 (BioLegend) to identify CD4+ and CD8+ within CD3+ T cells. ECD-labeled anti-CD45RO (Beckman Coulter B.V.), PE-Cy7-labeled anti-CCR7 (BD, Erembodegem, Belgium), V450-labeled anti-CD31 (BD; clone WM59), peridinin chlorophyll-A protein-Cy5.5-labeled anti-CD28 (BD) and APC-labeled anti-CD57 (BioLegend) as well as fluorescence minus one controls were used to appropriately identify the different T cell subsets (illustrated in Figures S1B–D in Supplementary Material). As shown in Figure S1B in Supplementary Material, CCR7 and CD45RO are used to distinguish the different naive and memory T cell subsets, i.e., naive (CD45RO−CCR7+), central memory (CM, CD45RO+CCR7+), effector memory (EM, CD45RO+CCR7−), and terminally differentiated effector memory CD45RA+ T cells subsets (EMRA, CD45RO−CCR7−). CD31-expression within naive T cells (Figure S1C in Supplementary Material) identifies T cells that recently have left the thymus, also referred to as recent thymic emigrants (RTEs) (36). Loss of CD28 (CD28− T cells) and gain of CD57 (CD57+ T cells) expression is observed in relation to increased replicative history (37, 38) and allows for identification of more differentiated T cells (Figure S1D in Supplementary Material).
Subsequently, the cell suspension was divided into eight tubes (100 μL/tube) labeled A-H, corresponding to the different antibody cocktails to stain for the 24 TCR Vβ-families (IOTest® Beta Mark TCR V beta repertoire kit, Beckman Coulter B.V.). Each cocktail contains antibodies directed to three different Vβ-families, i.e., one is fluorescein isothiocyanate (FITC-), one is PE-labeled and one is labeled with both FITC and PE. Table 1 shows the description of the antibodies directed to the different TCR Vβ-families in tube A to H. A typical example of the proportions of several TCR Vβ-families within CD3+ T cells from tube A, tube B and tube C is depicted in Figure S1A in Supplementary Material, the last three plots.
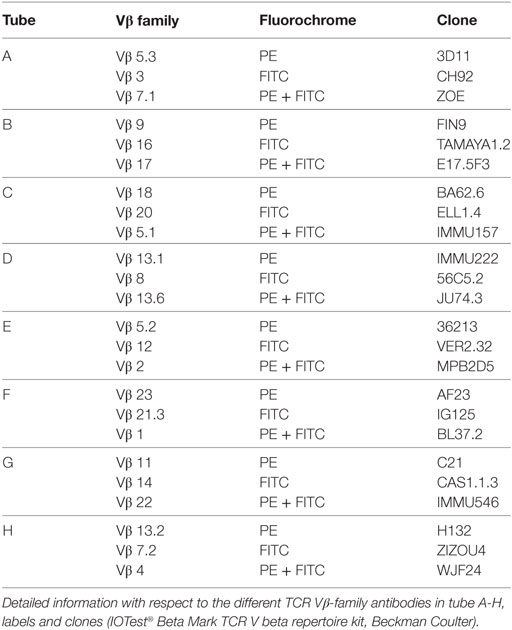
Table 1. TCR Vβ-families in tube A-H.
The samples were measured on a Navios flow cytometer (10-color configuration; Beckman Coulter B.V.) and at least 0.5 million CD3+ T cells were acquired for each tube. Data were analyzed by Kaluza™ software (Beckman Coulter B.V.). The number of events acquired for a specific T cell subset needed to be more than 100 to allow for reliable analysis of frequencies of TCR Vβ-families within this population. The only subset that did not meet this criterion was the EMRA population within the CD4+ T cells.
Gini-TCR Index and Calculation of Expanded TCR Vβ−Families
The Gini index is used to describe the distribution of income in economic statistics. As the distribution of TCR Vβ−families shows similarities to that of income, the Gini index can also be applied in TCR Vβ-repertoire analysis by flow-cytometry. It has already been used in TCR-sequencing studies (39, 40), and was recently also introduced as an accurate and reliable way for analyzing TCR Vβ-repertoire data obtained by flow-cytometry (41). The TCR (Vβ)-Gini index with scores ranging from low to high indicates TCR Vβ-families from equal distribution (broad repertoire; i.e., low score) to unequal distribution (skewed repertoire; i.e., high score). A Microsoft excel file allowing for automatic calculation of the Gini-TCR index using percentages of 24 TCR-Vβ families is provided in the supporting file (41).
An expansion in a TCR Vβ-family in ESRD patients is defined as a frequency above the mean percentage + 2 times the SD of a certain TCR Vβ-family obtained using the HI as reference population. By using this approach, finding an expansion by chance is lower than 2.5%.
Statistical Analyses
Gini-TCR indices or median number of expanded TCR Vβ-families/individual between two different T cell subsets within individuals were compared with Wilcoxon signed rank test and Friedman test followed by Dunn’s multiple comparison T-test was used for comparing more than two different T cell subsets. Trend analyses were performed using two-way ANOVA, comparing different subsets between individuals or CD4+ and CD8+ T cells. In addition, the effect of ESRD with respect to numbers of expanded TCR Vβ-families within different T cell subsets is done using Fisher’s exact test. Two-sided P–values <0.05 were considered statistically significant. All statistical analyses were performed with GraphPad Prism 5.
Results
Study Population
Detailed information of the study population is given in Table 2. Ten ESRD patients (5 younger individuals: age 20–29 years and 5 older individuals: age 65–73 years) and 10 age-matched HI (5 younger individuals age 26–42 years and 5 older individuals: age 65–73 years) were recruited into this study. Sixty percent of the ESRD and HI study population is CMV-seropositive. Seven out of 10 ESRD patients received RRT.
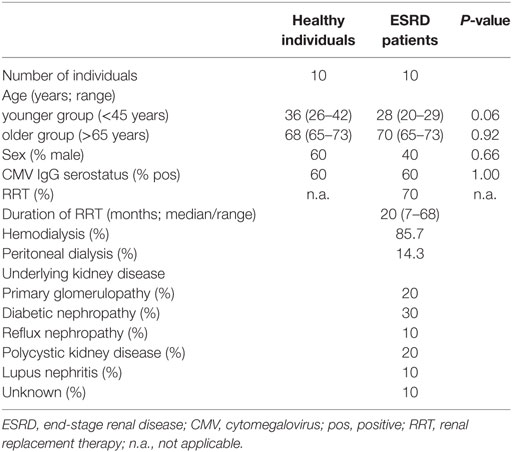
Table 2. Demographic and clinical characteristics of the study population.
Gini-TCR Indices Increase with T Cell Differentiation
Naive T cells expressing CD31 are considered to be RTEs and the least-differentiated T cell subset. In ESRD patients, CD31-expressing naive T cells tended to or have a lower Gini-TCR index when compared to their CD31− counterparts within CD4+ (Figure 1B) and CD8+ T cells (Figure 1D), respectively. For HI, a significant lower Gini-TCR index was only observed for CD31-expressing naive CD8+ (Figure 1C) but not CD4+ (Figure 1A) T cells when compared to CD31− naive T cells. Furthermore, a T cell differentiation-associated increase in Gini-TCR indices was noted for CD8+ (Figures 1G,H), but not CD4+ (Figures 1E,F), T cells. The median value (IQ range) increased significantly (P < 0.001) from 36.5 (33.7–37) and 35.5 (33.8–37.9) in naive T cells to 49 (43–64.6) and 52.4 (44.9–72.8) in the highly differentiated EMRA CD8+ T cells for HI and ESRD patients, respectively.
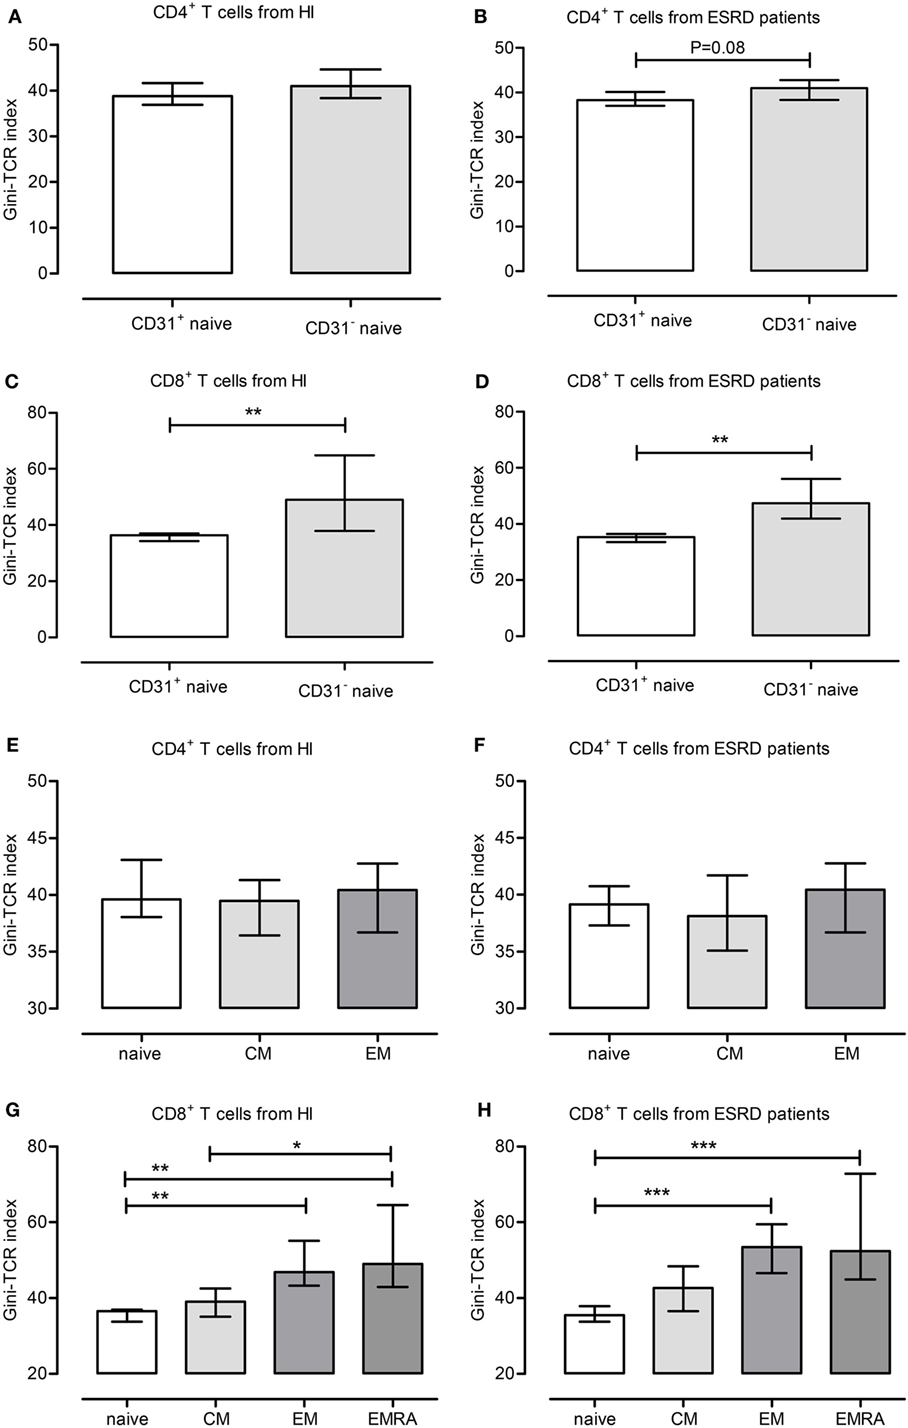
Figure 1. Gini-T cell receptor (TCR) indices for different T cell subsets. The different Gini-TCR indices are depicted for healthy individual (HI) (A,C,E,G) and end-stage renal disease (ESRD) patients (B,D,F,H). First, the Gini-TCR indices for recent thymic emigrant (CD31+ naive) and CD31− naive CD4+ (A,B) and CD8+ T (C,D) cells are given, respectively. Next, the differentiation-associated effects on Gini-TCR indices are depicted for CD4+ (E,F) and CD8+ (G,H) T cell subsets, including naive, central memory, effector memory, and terminally differentiated effector memory CD45RA+ (EMRA) T cells. *, **, and *** reflect P-values <0.05, 0.01, and 0.001, respectively. Data from 10 HI and 10 ESRD patients are given as median with interquartile range.
ESRD Patients Have Increased Gini-TCR Indices within Memory CD8+ T Cell Subsets
We next analyzed the influence of ESRD, aging, and CMV latency on skewing of the TCR Vβ-repertoire by comparing Gini-TCR indices for different T cell subsets including total CD3+ T cells, as well as naive, CD31+ naive, total memory (MEM), CM, EM, EMRA, CD28−, and CD57+ populations within both the CD4+ and CD8+ T cell subsets. ESRD effects with respect to Gini-TCR indices were limited to the CD8+ T cell compartment as it tended to induce higher Gini-TCR indices (P = 0.06) in CD8+ memory T cells when compared to HI (Figure 2A). The median (IQ range) value for Gini-TCR index in CD8+ memory T cells amounted to 48.4 (45.8–63.3) and 43.8 (41.1–51.2) for ESRD patients and HI, respectively. Younger (Figure 2B), but not older (Figure 2C), ESRD patients had significantly higher Gini-TCR indices within the CD8+ CM (P < 0.05), EM (P < 0.05) and CD57+ T cell compartment when compared to age-matched HI. The median (IQ range) for Gini-TCR in CD8+ CM, EM and CD57+ T cells amounted to 47.4 (40.8–54.2) versus 35.3 (34.0–39.2), 54.4 (49.6–68.5) versus 43.7 (42.4–50.8) and 77.6 (65.8–78.4) versus 59.2 (57.2–67.1) for younger ESRD patients versus younger HI.
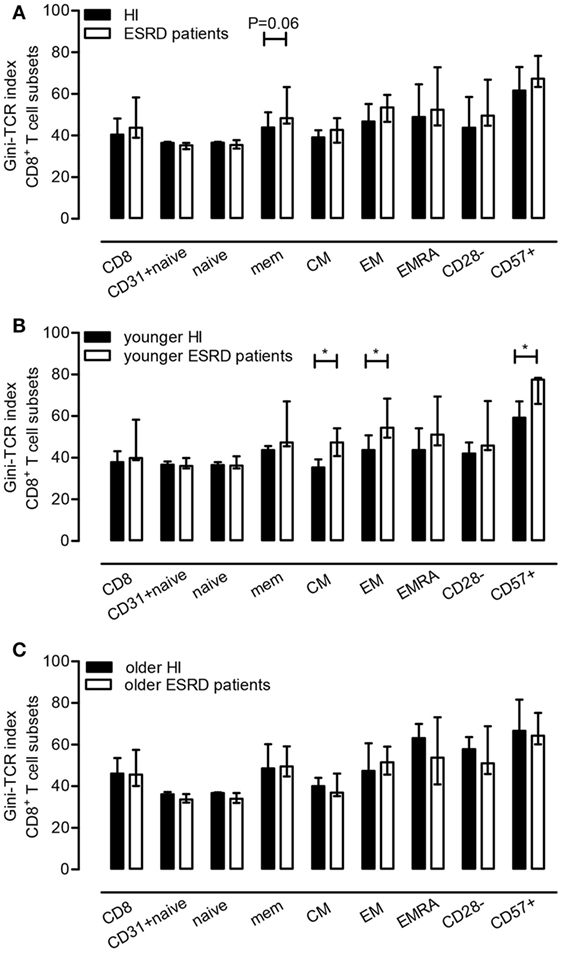
Figure 2. Effect of end-stage renal disease (ESRD) on Gini-T cell receptor (TCR) indices of CD8+ T cell subsets. In (A), the median and IQ range of the Gini-TCR indices for healthy individuals (N = 10) and ESRD patients (N = 10) for different CD8+ T cell subsets is depicted, whereas in (B,C) those for the younger and older group (N = 5) are given, respectively. P value: *<0.05.
The following results, describing Tables S1 and S2 in Supplementary Material need to be interpreted with caution as the P-values were not adjusted for the number of parameters compared.
Aging effects were not visible when comparing Gini-TCR indices for the different T cell subsets between younger and older ESRD patients (Table S1 in Supplementary Material). In HI, aging effects were confined to the CD8+ T cell compartment and an aging-related increasing trend in Gini-TCR index was observed for CD8+ CM T cells (P = 0.06), as the median (IQ range) for Gini-TCR amounted to 40.1 (39.1–44.1) in older HI versus 35.3 (34.0–39.2) in younger HI. An increased Gini-TCR index (P = 0.03) was observed for older HI, within CD8+CD28− T cells (Table S1 in Supplementary Material). The median (IQ range) value for Gini-TCR in CD8+CD28− T cells amounted to 42.0 (40.6–47.4) versus 57.8 (43.7–63.7) for younger and older HI, respectively.
CMV latency did not significantly affect Gini-TCR indices apart from a CMV-related increasing trend within CD4+CD57+ T cells (P = 0.07) of HI, but not ESRD patients, i.e., the median (IQ range) Gini-TCR index amounted to 67.0 (57.4–72.2) for CMV-seropositive HI versus 45.6 (35.5–58.0) for CMV-seronegative ones (Table S2 in Supplementary Material). No differences were observed when comparing CMV-seronegative and CMV-seropositive ESRD patients to their CMV-serostatus matched HI with respect to Gini-TCR indices for the different T cell subsets (data not shown).
Clonal Expansions of TCR Vβ-Families in Different T Cell Subsets
Apart from characterizing the impact of ESRD on Gini-TCR indices for the different T cell subsets, we also evaluated the impact of ESRD on clonal expansions of TCR Vβ-families by comparing frequencies to the average + 2SD obtained using HI as reference population. Figure 3 shows a typical example of expanded TCR Vβ-families within CD8+ memory T cells of ESRD patients.
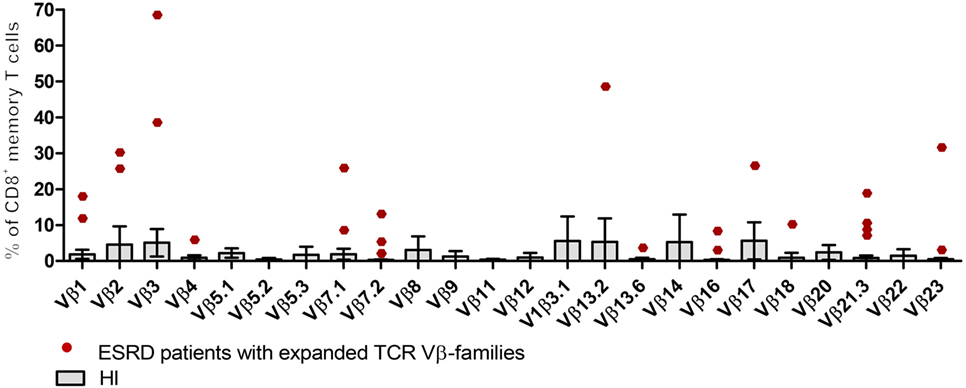
Figure 3. Expansions of T cell receptor (TCR) Vβ-families within CD8+ memory T cells from end-stage renal disease (ESRD) patients. Boxes and error bars represent the mean and 95% confidence interval (mean ± 2SD) of 24 TCR-Vβ families from 10 healthy individuals (HI). Red dots correspond to expanded TCR Vβ-families from ESRD patients (frequencies > mean + 2SD from HI).
Clonal expansions of TCR Vβ-families were observed within the CD3+ T cells in 7 out of 10 ESRD patients (Table 3). Half versus all of the ESRD patients showed expanded TCR Vβ-families within CD4+ and CD8+ T cells (P < 0.05), respectively. The median (IQ range) number of expanded TCR Vβ-families per patient amounted to 1 (0–2) and 2 (1–4) families for CD4+ and CD8+ T cells (P < 0.05), respectively (Figure 4A). Interestingly, expansions were also detected within the naive T cell compartment, as 3 out of 10 and 8 out of 10 patients had expansions of TCR Vβ-families within the naive CD4+ and CD8+ T cell compartment, respectively (Table 3). Most clonal expansions were observed within the (more differentiated) memory CD8+ T cell subsets (Figure 4A). The median (IQ range) number of expanded TCR Vβ-families amounted to 1 (1–1) versus 2 (2–4) for naive and memory CD8+ T cells, respectively (P < 0.05). Moreover, ESRD affected different TCR Vβ-families as illustrated in Figure 3 for CD8+ memory T cells. ESRD induced expansions within both younger (Figure 4B) and older (Figure 4C) ESRD patients when compared to their age-matched HI.
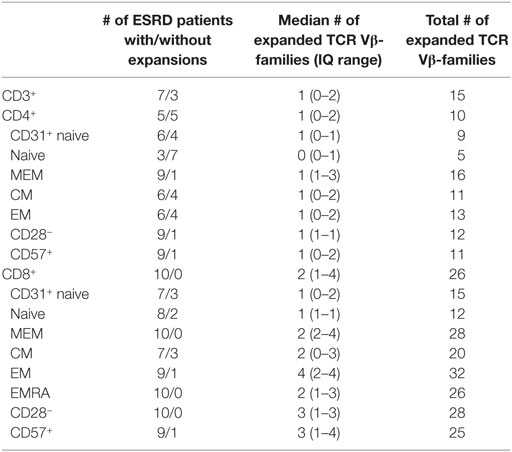
Table 3. Effect of ESRD on expansions of TCR Vβ-families.
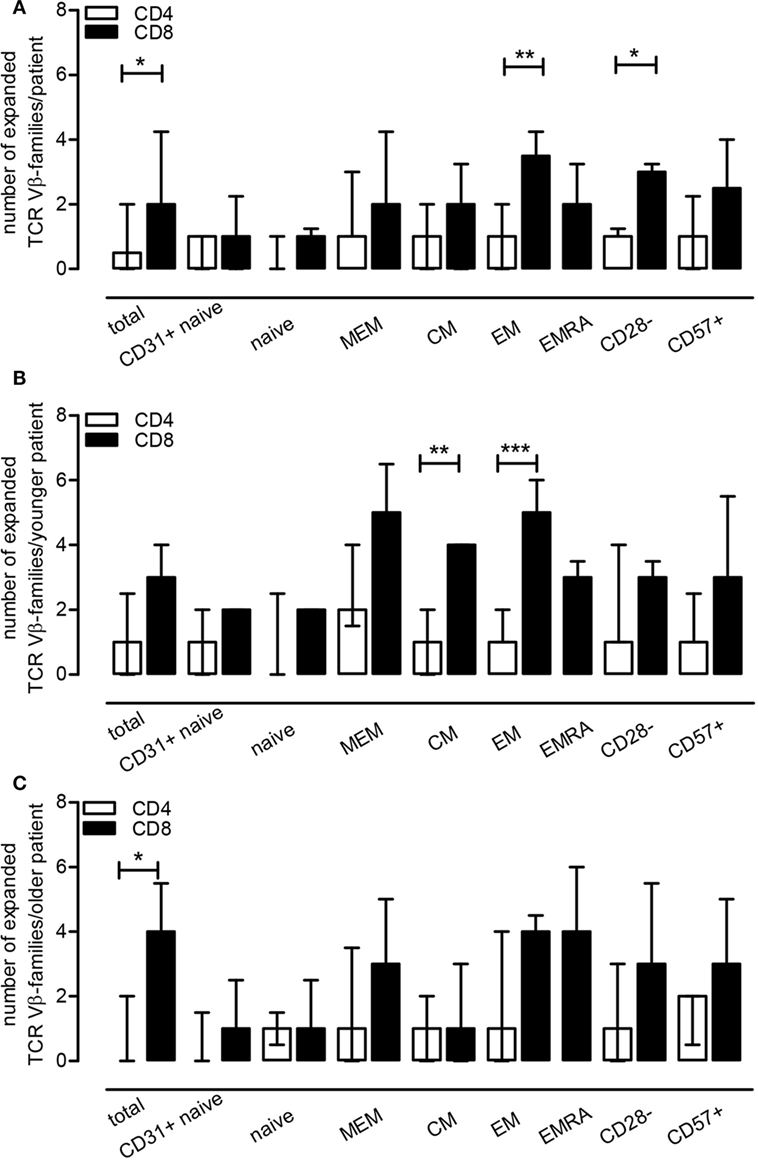
Figure 4. End-stage renal disease effect on T cell receptor (TCR) Vβ-families within T cell subsets. Using healthy individual (HI) (N = 10) as a reference population, we evaluated the number of TCR Vβ-families that were expanded per patient for a T cell subset (frequency of a TCR Vβ-family exceeding the mean + 2SD value obtained for HI) (A). In (B,C), the median (IQ range) of expansions per younger and older patient for a T cell subset is depicted using the younger (N = 5) and older HI (N = 5) as a reference, respectively. The open bars represent the median and IQ range for the different CD4+ T cell subsets, whereas the closed bars represent that for the different CD8+ T cell subsets.
Discussion
The main finding of this study is that the multiparameter flow-cytometry-based approach for evaluating the skewed TCR Vβ-repertoire diversity in ESRD patients showed that TCR skewing can be observed primarily in CD8+ T cell subsets, including naive T cells. However, higher Gini-TCR indices, indicative for an enhanced TCR Vβ-repertoire skewing, were specifically associated with more differentiated CD8+, but not CD4+, T cell subsets in both ESRD patients and HI.
Our previous data showed that ESRD may lead to a skewed TCR Vβ-repertoire as assessed by DNA spectratyping, providing at best semiquantitative information about TCR Vβ-clonality (24). The current study provided more quantitative details with respect to this skewed TCR Vβ-repertoire at the T cell-subset level using the Gini-TCR index as a tool for calculating skewness (41) and evaluating number/type of expanded TCR Vβ-families. Higher Gini-TCR indices are indicative of a more skewed TCR Vβ-repertoire. The current study confirmed several of our previous findings. Increased skewing of the TCR Vβ-repertoire was observed for more differentiated CD8+, but not CD4+, T cells, corresponding to our spectratyping data as well as findings described by others (27, 42). In addition to the Gini-TCR index, we calculated the number of TCR Vβ-families per patient that were expanded beyond the mean + 2SD values of HI. This approach yielded similar results as the Gini-index but gives detailed information at the individual patient level for the different T cell subsets. For instance some patients have a large number of expanded TCR Vβ-families while others show only a few. Moreover, ESRD did not seem to affect one TCR Vβ-family in particular, indicative of expansions of different clonal origin. Altogether, using both Gini-TCR indices as well as the number of expanded TCR Vβ-families, revealed skewing to mainly occur within the CD8+ and in particular within the CD8+ memory T cell subset similar to what was observed before using DNA-based spectratyping on sorted T cell subsets (24).
The commercially available flow-cytometry-based assay, used to characterize the TCR Vβ-repertoire, is composed of 24 different TCR Vβ-antibodies covering about 70% of the normal human TCR Vβ-repertoire (brochure Beckman Coulter). Evaluating other TCR Vβ-families as well as TCR Vα and TCR Vγ/Vδ families may contribute to a better understanding of the whole TCR-repertoire. In this respect, γδ+ T cells account for approximately 8% of CD3+ peripheral blood T cells and around 6% of γδ+ T cells were observed within CD3+CD8+, but not CD4+ T cells in HI (19). As frequencies of γδ+ T cells may also vary amongst individuals, it might be more accurate to evaluate the TCR Vβ-repertoire not within total CD3+, like performed in the current study, but within αβ+ CD3+ T cells.
Interestingly, using this multiparameter flow-cytometry-based approach, we were also able to detect expanded TCR Vβ-families within the naive T cell compartment. This characteristic has, to our knowledge never been described for ESRD patients. Uremia induces a proinflammatory environment significantly affecting T cell-mediated immunity characterized by increased risk for infections (5) and decreased vaccination efficacy (1, 43). We have observed that progressive loss of renal function is accompanied by a severe depletion of the naive T cell compartment and a relative shift toward more differentiated memory T cells (44). Naive T cells employ a mechanism referred to as homeostatic proliferation in order to maintain the naive T cell pool that is not replenished by newly developed naive T cells from the thymus due to thymic involution. Homeostatic proliferation occurs in response to homeostatic cytokines, e.g., IL-7, or low affinity self antigens presented by antigen-presenting cells (26). This mechanism has been described to be associated with a decline in TCR Vβ-repertoire diversity within naive T cells with increasing age (27, 45). ESRD enhanced homeostatic proliferation of naive T cells to a similar extent as observed in older HI (12) and as a consequence of this compensatory mechanism, loss of TCR Vβ-repertoire diversity may also be induced by ESRD within naive CD8+ and/or CD4+ T cells.
Naive T cells are required to mount adequate immune responses to newly encountered antigens (46, 47). ESRD patients, with a severely depleted naive T cell compartment (44), are hampered in inducing adequate protection to, for example, HBV vaccination as a result of defective generation of antigen-specific memory T cells (43). The ESRD-associated defects in T cell composition as well as function, reminiscent of aging-associated T cell defects, led to the concept of premature T cell aging introduced in 2011 (12). ESRD patients have a T cell compartment that is aged by 15–20 years compared to their chronologic age, using age-matched HI as a reference. Consistent with premature T cell aging (12), we observed ESRD-associated increases in Gini-TCR indices and TCR Vβ expansions to occur already at young age.
Aging is known to affect TCR Vβ-repertoire diversity toward a more skewed pattern, starting from roughly 600 × 103 clonotypes detected per 106 T cells in childhood, declining by 5 × 10³ clonotypes per year (25). Age-related effects were limited within our cohort of HI and this may be a consequence of the selection procedure applied. We did select HI with a polyclonal (i.e., non-skewed) TCR Vβ-repertoire using DNA-based spectratyping (24), to ensure a relatively standard healthy population to be used as reference for comparison to ESRD patients. The ESRD patient population however only consisted of individuals with an oligoclonal (skewed) TCR Vβ-repertoire. This might have resulted in an underestimation of the effect of aging on TCR Vβ-families. Likewise, our selection procedure may also explain the minimal effects of CMV in both cohorts.
CMV latency is known to introduce skewing of the TCR Vβ-repertoire induced by expanded CMV-specific T cell clones in both HI (33, 34, 48) and ESRD patients (24). CMV latency may result in a vast and long-lasting expansion of CMV-specific T cells (33, 34). Moreover, CMV latency has additional effects mainly on circulating CD8+ T cells of ESRD patients (49).
End-stage renal disease, aging, and CMV all influenced the TCR-Vβ repertoire diversity to a different extent (24), however, because of different factors present in the environment, they all have their specific effect on clonotype selection. Even though these findings need to be verified in a larger cohort without preselection using DNA-based spectratyping of TCR-Vβ-repertoire, our study already shed some light on this altered TCR-Vβ repertoire at the T cell-subset level in particular with respect to ESRD.
Relating TCR-repertoire data to functional capacities of T cells is warranted to increase knowledge on uremia-induced T cell defects in ESRD patients. Moreover, tracking TCR clones in whole blood or tissue infiltrates may provide additional information on antigen specificity important for diagnosis of infection and allograft rejection after transplantation (50–52).
In conclusion, ESRD is associated with a skewed TCR Vβ-repertoire as a result of variable TCR Vβ-family expansions, but not one TCR Vβ-family in particular. ESRD, aging and CMV latency exert their effects by influencing different TCR Vβ-families. This altered repertoire may be associated with a less broad and less diverse T cell-mediated immunity.
Ethics Statement
All individuals included gave informed consent and the Erasmus medical center medical ethical committee approved the study (METC number: 2012-022). It was conducted according to the principles of Declaration of Helsinki and in compliance with International Conference on Harmonization/Good Clinical Practice regulations.
Author Contributions
LH participated in the design of the study, analyzed the data, and wrote the manuscript. MB participated in the design of the study, interpreted the data, and revised the manuscript. MK established the experimental protocol, conducted the experiments, and analyzed the data. AL participated in the design of the study, interpreted the data, and revised the manuscript. CB participated in design of the study and revised the manuscript. NL designed the study, interpreted the data, and revised the manuscript. All authors have read and approved the final manuscript.
Conflict of Interest Statement
The authors declare that the research was conducted in the absence of any commercial or financial relationships that could be construed as a potential conflict of interest.
Funding
The research was supported by the China Scholarship Council for funding PhD fellowship to Ling Huang (File No. 201307720043).
Supplementary Material
The Supplementary Material for this article can be found online at http://www.frontiersin.org/articles/10.3389/fimmu.2017.01826/full#supplementary-material.
References
1. Janus N, Vacher LV, Karie S, Ledneva E, Deray G. Vaccination and chronic kidney disease. Nephrol Dial Transplant (2008) 23(3):800–7. doi:10.1093/ndt/gfm851
2. Fabrizi F, Martin P. Hepatitis B vaccine and dialysis: current issues. Int J Artif Organs (2001) 24(10):683–94.
3. Remschmidt C, Wichmann O, Harder T. Influenza vaccination in patients with end-stage renal disease: systematic review and assessment of quality of evidence related to vaccine efficacy, effectiveness, and safety. BMC Med (2014) 12:244. doi:10.1186/s12916-014-0244-9
4. Principi N, Esposito S, Group EVS. Influenza vaccination in patients with end-stage renal disease. Expert Opin Drug Saf (2015) 14(8):1249–58. doi:10.1517/14740338.2015.1053459
5. Dalrymple LS, Go AS. Epidemiology of acute infections among patients with chronic kidney disease. Clin J Am Soc Nephrol (2008) 3(5):1487–93. doi:10.2215/CJN.01290308
6. Betjes MG. Immune cell dysfunction and inflammation in end-stage renal disease. Nat Rev Nephrol (2013) 9(5):255–65. doi:10.1038/nrneph.2013.44
7. Sarnak MJ, Jaber BL. Mortality caused by sepsis in patients with end-stage renal disease compared with the general population. Kidney Int (2000) 58(4):1758–64. doi:10.1111/j.1523-1755.2000.00337.x
8. Maisonneuve P, Agodoa L, Gellert R, Stewart JH, Buccianti G, Lowenfels AB, et al. Cancer in patients on dialysis for end-stage renal disease: an international collaborative study. Lancet (1999) 354(9173):93–9. doi:10.1016/S0140-6736(99)06154-1
9. Vajdic CM, McDonald SP, McCredie MR, van Leeuwen MT, Stewart JH, Law M, et al. Cancer incidence before and after kidney transplantation. JAMA (2006) 296(23):2823–31. doi:10.1001/jama.296.23.2823
10. Wong G, Hayen A, Chapman JR, Webster AC, Wang JJ, Mitchell P, et al. Association of CKD and cancer risk in older people. J Am Soc Nephrol (2009) 20(6):1341–50. doi:10.1681/ASN.2008090998
11. Butler AM, Olshan AF, Kshirsagar AV, Edwards JK, Nielsen ME, Wheeler SB, et al. Cancer incidence among US Medicare ESRD patients receiving hemodialysis, 1996-2009. Am J Kidney Dis (2015) 65(5):763–72. doi:10.1053/j.ajkd.2014.12.013
12. Betjes MG, Langerak AW, van der Spek A, de Wit EA, Litjens NH. Premature aging of circulating T cells in patients with end-stage renal disease. Kidney Int (2011) 80(2):208–17. doi:10.1038/ki.2011.110
13. Betjes MG, Litjens NH. Chronic kidney disease and premature ageing of the adaptive immune response. Curr Urol Rep (2015) 16(1):471. doi:10.1007/s11934-014-0471-9
14. Meijers RW, Litjens NH, de Wit EA, Langerak AW, van der Spek A, Baan CC, et al. Uremia causes premature ageing of the T cell compartment in end-stage renal disease patients. Immun Ageing (2012) 9(1):19. doi:10.1186/1742-4933-9-19
15. Huang L, Litjens NHR, Kannegieter NM, Klepper M, Baan CC, Betjes MGH. pERK-dependent defective TCR-mediated activation of CD4+ T cells in end-stage renal disease patients. Immun Ageing (2017) 14:14. doi:10.1186/s12979-017-0096-196
16. Turner SJ, La Gruta NL, Kedzierska K, Thomas PG, Doherty PC. Functional implications of T cell receptor diversity. Curr Opin Immunol (2009) 21(3):286–90. doi:10.1016/j.coi.2009.05.004
17. Garcia KC, Teyton L, Wilson IA. Structural basis of T cell recognition. Annu Rev Immunol (1999) 17:369–97. doi:10.1146/annurev.immunol.17.1.369
18. van Dongen JJ, Langerak AW, Bruggemann M, Evans PA, Hummel M, Lavender FL, et al. Design and standardization of PCR primers and protocols for detection of clonal immunoglobulin and T-cell receptor gene recombinations in suspect lymphoproliferations: report of the BIOMED-2 concerted action BMH4-CT98-3936. Leukemia (2003) 17(12):2257–317. doi:10.1038/sj.leu.2403202
19. van den Beemd R, Boor PP, van Lochem EG, Hop WC, Langerak AW, Wolvers-Tettero IL, et al. Flow cytometric analysis of the Vbeta repertoire in healthy controls. Cytometry (2000) 40(4):336–45. doi:10.1002/1097-0320(20000801)40:4<336:AID-CYTO9>3.0.CO;2-0
20. Tzifi F, Kanariou M, Tzanoudaki M, Mihas C, Paschali E, Chrousos G, et al. Flow cytometric analysis of the CD4+ TCR Vbeta repertoire in the peripheral blood of children with type 1 diabetes mellitus, systemic lupus erythematosus and age-matched healthy controls. BMC Immunol (2013) 14:33. doi:10.1186/1471-2172-14-33
21. Langerak AW, van Den Beemd R, Wolvers-Tettero IL, Boor PP, van Lochem EG, Hooijkaas H, et al. Molecular and flow cytometric analysis of the Vbeta repertoire for clonality assessment in mature TCRalphabeta T-cell proliferations. Blood (2001) 98(1):165–73. doi:10.1182/blood.V98.1.165
22. Britanova OV, Shugay M, Merzlyak EM, Staroverov DB, Putintseva EV, Turchaninova MA, et al. Dynamics of individual T cell repertoires: from cord blood to centenarians. J Immunol (2016) 196(12):5005–13. doi:10.4049/jimmunol.1600005
23. Yoshida K, Cologne JB, Cordova K, Misumi M, Yamaoka M, Kyoizumi S, et al. Aging-related changes in human T-cell repertoire over 20years delineated by deep sequencing of peripheral T-cell receptors. Exp Gerontol (2017) 96:29–37. doi:10.1016/j.exger.2017.05.015
24. Huang L, Langerak AW, Wolvers-Tettero IL, Meijers RW, Baan CC, Litjens NH, et al. End stage renal disease patients have a skewed T cell receptor Vbeta repertoire. Immun Ageing (2015) 12:28. doi:10.1186/s12979-015-0055-7
25. Britanova OV, Putintseva EV, Shugay M, Merzlyak EM, Turchaninova MA, Staroverov DB, et al. Age-related decrease in TCR repertoire diversity measured with deep and normalized sequence profiling. J Immunol (2014) 192(6):2689–98. doi:10.4049/jimmunol.1302064
26. Kohler S, Wagner U, Pierer M, Kimmig S, Oppmann B, Mowes B, et al. Post-thymic in vivo proliferation of naive CD4(+) T cells constrains the TCR repertoire in healthy human adults. Eur J Immunol (2005) 35(6):1987–94. doi:10.1002/eji.200526181
27. Qi Q, Liu Y, Cheng Y, Glanville J, Zhang D, Lee JY, et al. Diversity and clonal selection in the human T-cell repertoire. Proc Natl Acad Sci U S A (2014) 111(36):13139–44. doi:10.1073/pnas.1409155111
28. Tu W, Rao S. Mechanisms underlying T cell immunosenescence: aging and cytomegalovirus infection. Front Microbiol (2016) 7:2111. doi:10.3389/fmicb.2016.02111
29. Litjens NH, de Wit EA, Betjes MG. Differential effects of age, cytomegalovirus-seropositivity and end-stage renal disease (ESRD) on circulating T lymphocyte subsets. Immun Ageing (2011) 8(1):2. doi:10.1186/1742-4933-8-2
30. Hooper M, Kallas EG, Coffin D, Campbell D, Evans TG, Looney RJ. Cytomegalovirus seropositivity is associated with the expansion of CD4+CD28- and CD8+CD28- T cells in rheumatoid arthritis. J Rheumatol (1999) 26(7):1452–7.
31. Wikby A, Johansson B, Olsson J, Lofgren S, Nilsson BO, Ferguson F. Expansions of peripheral blood CD8 T-lymphocyte subpopulations and an association with cytomegalovirus seropositivity in the elderly: the Swedish NONA immune study. Exp Gerontol (2002) 37(2–3):445–53. doi:10.1016/S0531-5565(01)00212-1
32. van de Berg PJ, Griffiths SJ, Yong SL, Macaulay R, Bemelman FJ, Jackson S, et al. Cytomegalovirus infection reduces telomere length of the circulating T cell pool. J Immunol (2010) 184(7):3417–23. doi:10.4049/jimmunol.0903442
33. Gillespie GM, Wills MR, Appay V, O’Callaghan C, Murphy M, Smith N, et al. Functional heterogeneity and high frequencies of cytomegalovirus-specific CD8(+) T lymphocytes in healthy seropositive donors. J Virol (2000) 74(17):8140–50. doi:10.1128/JVI.74.17.8140-8150.2000
34. Klarenbeek PL, Remmerswaal EB, ten Berge IJ, Doorenspleet ME, van Schaik BD, Esveldt RE, et al. Deep sequencing of antiviral T-cell responses to HCMV and EBV in humans reveals a stable repertoire that is maintained for many years. PLoS Pathog (2012) 8(9):e1002889. doi:10.1371/journal.ppat.1002889
35. Litjens NH, Huisman M, Baan CC, van Druningen CJ, Betjes MG. Hepatitis B vaccine-specific CD4(+) T cells can be detected and characterised at the single cell level: limited usefulness of dendritic cells as signal enhancers. J Immunol Methods (2008) 330(1–2):1–11. doi:10.1016/j.jim.2007.10.013
36. Kohler S, Thiel A. Life after the thymus: CD31+ and CD31- human naive CD4+ T-cell subsets. Blood (2009) 113(4):769–74. doi:10.1182/blood-2008-02-139154
37. Merino J, Martinez-Gonzalez MA, Rubio M, Inoges S, Sanchez-Ibarrola A, Subira ML. Progressive decrease of CD8high+ CD28+ CD57- cells with ageing. Clin Exp Immunol (1998) 112(1):48–51. doi:10.1046/j.1365-2249.1998.00551.x
38. Bandres E, Merino J, Vazquez B, Inoges S, Moreno C, Subira ML, et al. The increase of IFN-gamma production through aging correlates with the expanded CD8(+high)CD28(-)CD57(+) subpopulation. Clin Immunol (2000) 96(3):230–5. doi:10.1006/clim.2000.4894
39. Laydon DJ, Melamed A, Sim A, Gillet NA, Sim K, Darko S, et al. Quantification of HTLV-1 clonality and TCR diversity. PLoS Comput Biol (2014) 10(6):e1003646. doi:10.1371/journal.pcbi.1003646
40. Thomas PG, Handel A, Doherty PC, La Gruta NL. Ecological analysis of antigen-specific CTL repertoires defines the relationship between naive and immune T-cell populations. Proc Natl Acad Sci U S A (2013) 110(5):1839–44. doi:10.1073/pnas.1222149110
41. van der Geest KS, Abdulahad WH, Horst G, Lorencetti PG, Bijzet J, Arends S, et al. Quantifying distribution of flow cytometric TCR-Vbeta usage with economic statistics. PLoS One (2015) 10(4):e0125373. doi:10.1371/journal.pone.0125373
42. Robins HS, Campregher PV, Srivastava SK, Wacher A, Turtle CJ, Kahsai O, et al. Comprehensive assessment of T-cell receptor beta-chain diversity in alphabeta T cells. Blood (2009) 114(19):4099–107. doi:10.1182/blood-2009-04-217604
43. Litjens NH, Huisman M, van den Dorpel M, Betjes MG. Impaired immune responses and antigen-specific memory CD4+ T cells in hemodialysis patients. J Am Soc Nephrol (2008) 19(8):1483–90. doi:10.1681/ASN.2007090971
44. Litjens NH, van Druningen CJ, Betjes MG. Progressive loss of renal function is associated with activation and depletion of naive T lymphocytes. Clin Immunol (2006) 118(1):83–91. doi:10.1016/j.clim.2005.09.007
45. Ahmed M, Lanzer KG, Yager EJ, Adams PS, Johnson LL, Blackman MA. Clonal expansions and loss of receptor diversity in the naive CD8 T cell repertoire of aged mice. J Immunol (2009) 182(2):784–92. doi:10.4049/jimmunol.182.2.784
46. Ramirez LA, Daniel A, Frank I, Tebas P, Boyer JD. Seroprotection of HIV-infected subjects after influenza A(H1N1) vaccination is directly associated with baseline frequency of naive T cells. J Infect Dis (2014) 210(4):646–50. doi:10.1093/infdis/jiu132
47. Schulz AR, Malzer JN, Domingo C, Jurchott K, Grutzkau A, Babel N, et al. Low thymic activity and dendritic cell numbers are associated with the immune response to primary viral infection in elderly humans. J Immunol (2015) 195(10):4699–711. doi:10.4049/jimmunol.1500598
48. Wang EC, Moss PA, Frodsham P, Lehner PJ, Bell JI, Borysiewicz LK. CD8highCD57+ T lymphocytes in normal, healthy individuals are oligoclonal and respond to human cytomegalovirus. J Immunol (1995) 155(10):5046–56.
49. Meijers RW, Litjens NH, de Wit EA, Langerak AW, van der Spek A, Baan CC, et al. Cytomegalovirus contributes partly to uraemia-associated premature immunological ageing of the T cell compartment. Clin Exp Immunol (2013) 174(3):424–32. doi:10.1111/cei.12188
50. Dziubianau M, Hecht J, Kuchenbecker L, Sattler A, Stervbo U, Rodelsperger C, et al. TCR repertoire analysis by next generation sequencing allows complex differential diagnosis of T cell-related pathology. Am J Transplant (2013) 13(11):2842–54. doi:10.1111/ajt.12431
51. Alachkar H, Mutonga M, Kato T, Kalluri S, Kakuta Y, Uemura M, et al. Quantitative characterization of T-cell repertoire and biomarkers in kidney transplant rejection. BMC Nephrol (2016) 17(1):181. doi:10.1186/s12882-016-0395-3
Keywords: TCR-repertoire, T cell subsets, end-stage renal disease, ageing (aging), CMV-latency
Citation: Huang L, Betjes MGH, Klepper M, Langerak AW, Baan CC and Litjens NHR (2017) End-Stage Renal Disease Causes Skewing in the TCR Vβ-Repertoire Primarily within CD8+ T Cell Subsets. Front. Immunol. 8:1826. doi: 10.3389/fimmu.2017.01826
Received: 02 October 2017; Accepted: 04 December 2017;
Published: 15 December 2017
Edited by:
Valquiria Bueno, Federal University of São Paulo, BrazilReviewed by:
Stephen H. Benedict, University of Kansas, United StatesJennifer Ann Juno, University of Melbourne, Australia
Copyright: © 2017 Huang, Betjes, Klepper, Langerak, Baan and Litjens. This is an open-access article distributed under the terms of the Creative Commons Attribution License (CC BY). The use, distribution or reproduction in other forums is permitted, provided the original author(s) or licensor are credited and that the original publication in this journal is cited, in accordance with accepted academic practice. No use, distribution or reproduction is permitted which does not comply with these terms.
*Correspondence: Nicolle H. R. Litjens, bi5saXRqZW5zQGVyYXNtdXNtYy5ubA==