 Sonali Agrawal1
 Om Parkash1
 Alangudi Natarajan Palaniappan2
 Ashok Kumar Bhatia3
 Santosh Kumar4
 Devendra Singh Chauhan5
 M. Madhan Kumar1*
- 1Department of Immunology, National JALMA Institute for Leprosy and Other Mycobacterial Diseases, Agra, India
- 2Department of Clinic, National Institute for Research in Tuberculosis, Chennai, India
- 3Department of Biotechnology, GLA University, Mathura, India
- 4Department of Tuberculosis and Chest Diseases, Sarojini Naidu Medical College, Agra, India
- 5Department of Microbiology and Molecular Biology, National JALMA Institute for Leprosy and Other Mycobacterial Diseases, Agra, India
Treatment monitoring is an essential aspect for tuberculosis (TB) disease management. Sputum smear microscopy is the only available tool for monitoring, but it suffers from demerits. Therefore, we sought to evaluate markers and cellular subsets of T regulatory (Treg) cells and T helper (Th) 17 cells in pulmonary TB patients (PTB) for TB treatment monitoring. Peripheral blood mononuclear cells (PBMCs) were stimulated in vitro (with purified protein derivative (PPD)) overnight which was followed by a polychromatic flow cytometry approach to study Treg and Th17 markers and cellular subsets in PTB (n = 12) undergoing antituberculous treatment (ATT). The baseline levels of these markers and cellular subsets were evaluated in normal healthy subjects (NHS). We observed a significant decrease in the expression of CD25 (p<0.01) marker and percentage of T-cell subsets like CD4+CD25+ (p<0.001) and CD4+CD25+CD39+ (p<0.05) at the end of intensive phase (IP) as well as in the continuation phase (CP) of ATT. A decrease in CD25 marker expression and percentage of CD4+CD25+ T cell subset showed a positive correlation to sputum conversion both in high and low sputum positive PTB. In eight PTB with cavitary lesions, only CD4+CD25+FoxP3 Treg subset manifested a significant decrease at the end of CP. Thus, results of this study show that CD25 marker and CD4+CD25+ T cells can serve as better markers for monitoring TB treatment efficacy. The Treg subset CD4+CD25+FoxP3 may be useful for prediction of favorable response in PTB with extensive lung lesions. However, these findings have to be evaluated in a larger patient cohort.
Introduction
Tuberculosis (TB) is an indomitable malady for the mankind since time immemorial. The World Health Organization (WHO) has reported 10.4 million new (incident) cases and 1.7 million TB deaths in 2016 (1). In human immunodeficiency virus (HIV) infected individuals, the figures for incidence of new TB cases were 1.04 million and deaths were 0.4 million. Thus, the morbidity and mortality due to TB are of great concern and thus it needs efficient management. Efficient TB management relies on prompt diagnosis and early treatment. During antituberculous treatment (ATT), the sputum microscopy is the yardstick for determining treatment efficacy. It is the only tool available for assessing TB treatment efficacy, but has many demerits (2, 3): (1) Its low sensitivity, i.e., the requirement of 10,000 bacilli/mL of sputum, (2) inability to diagnose smear negative TB, extra pulmonary TB and not of use in those who are unable to produce sputum, and (3) diagnosis is made after a period of 2 months (after completion of intensive phase (IP)) and by that time, the patient would have transmitted the infection, if the person is not responding to ATT. Due to the lack of satisfactory tools for monitoring ATT efficacy, efforts have been undertaken by various research groups to evaluate various immunological markers from different body fluids of host (urine, blood, plasma and serum). Along these lines, this study attempted to investigate the dynamics of T regulatory markers (Treg), Th17 markers and their cellular subsets in pulmonary TB patients (PTB) during ATT for their use in detecting TB treatment efficacy. In TB, Treg are recruited to the site of infection to bring back homeostasis (3). There are many studies that have shown a association between elevated Treg levels and increase in Mycobacterium tuberculosis (MTB) load (4–6). In line with this observation, a study has demonstrated the bacterial burden to decrease in lungs upon using chimeric FoxP3 knock-out (KO) mice (7). Similar reduction in bacterial growth has been observed on inhibiting Treg differentiation by using a small molecule (8). Such an immunotherapy led to increase in Th1 responses that protect against MTB infection. This association of bacillary load and Treg prompted us to evaluate the usefulness of Treg markers in treatment monitoring. We also compared the expression of Treg and Th17 markers with bacterial load, sputum conversion and reduction in lung lesions.
Materials and Methods
Study Participants
Recruitment of study participants was carried out in National JALMA institute for leprosy and other mycobacterial diseases, (NJIL & OMD) Agra, from March 2015 to April 2017 after obtaining approval from Institutional Human Ethics Committee. All study participants provided written informed consent. The overall recruitment criteria and methodology followed are illustrated in Figure S1 in the Supplementary Material.
Pulmonary TB Patients (PTB)
Fifteen individuals ≥18 years of age with newly diagnosed, smear positive PTB (Category I), either naïve for ATT or had received <2 weeks of ATT, were enrolled (Table 1). Active PTB was diagnosed by clinical evaluation, chest X-ray, and positive acid-fast bacilli (AFB) sputum smears. The presence of other immune-suppressive conditions was ruled out by filling out a questionnaire after interrogating the patients about recent organ transplant, cancer treatment, or any type of steroidal treatment. The patients were excluded if they were pregnant or lactating, moribund or had significant liver or renal function abnormalities at baseline, or positive for HIV infection. All the patients had random blood glucose levels in the range of 80–120 mg/dL. HIV testing was done by ELISA, a comb-based assay (Microlisa—HIV, J. Mitra & Co. Pvt. Ltd, New Delhi, India).
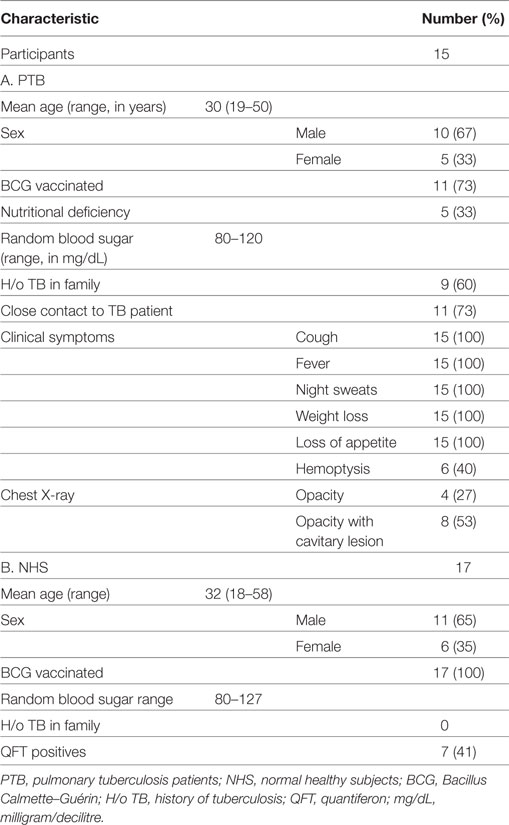
Table 1. Demographic and clinical details of study subjects.
The treatment regimen for this group was as per the WHO treatment guidelines (9). Out of 15 recruited PTB, only 12 were followed up for longitudinal studies at different time periods of ATT, i.e., before (zero month, i.e., at recruitment), during (second and fourth month), and at the end of ATT (sixth month). Clinical evaluation was done at every time point of sample collection. Chest X-ray was taken at all time points of follow-up except at fourth month. Peripheral venous blood and sputum were collected from the patients at all time points of follow-up.
Normal Healthy Subjects (NHS)
Seventeen age- and gender-matched NHS were recruited for the study (Table 1). These subjects were recruited for only one time point and were not followed up. Clinical TB was ruled out based on the absence of common symptoms of TB (like cough for >2 weeks, fever, fatigue, loss of appetite and weight loss) and by negative sputum smear microscopy. NHS were also tested for sputum smear and culture and were found to be negative. The latent infection in these individuals was ascertained using Quantiferon TB Gold In-Tube assay (QFT-IT; Qiagen, Germany). QFT-IT assay was done as per the manufacturer’s instructions. Irrespective of Quantiferon (QFT) positivity status, all the individuals were recruited for the study (Table 2). Immune-suppressive conditions were ruled out by interrogating the subjects for the above-mentioned conditions (as said for PTB) and filling out a questionnaire. The random blood glucose levels of the NHS were in the normal range (as said above in PTB section). All the NHS were negative for HIV by ELISA (comb-based assay) (Microlisa—HIV, J. Mitra & Co. Pvt. Ltd, New Delhi, India).
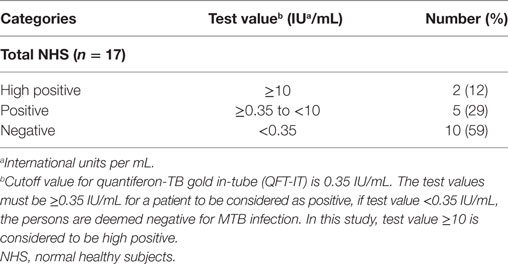
Table 2. Quantiferon status of NHS.
Evaluation of Radiological Parameters
The extent of disease was evaluated through chest X-ray scoring done by two independent clinicians who were unaware of the results of immunological assays (Table 3). The parameters which were considered for scoring chest X-rays were as follows: lung involvement (scored as 0—no involvement; 1—unilateral; 2—bilateral involvement), number of lesions (scored as 0—no lesion; 1—single lesion; 2—multiple lesions) and type of lesions (scored as 0—normal; 1—fibrosis; 2—opacity; 3—opacity with single cavity; 4—opacity with multiple cavities). For comparison between clinical and immunological parameters, combination of chest X-ray scores and sputum smear grading were also done. The marker and cellular subset response were studied for all the radiological parameters said above.
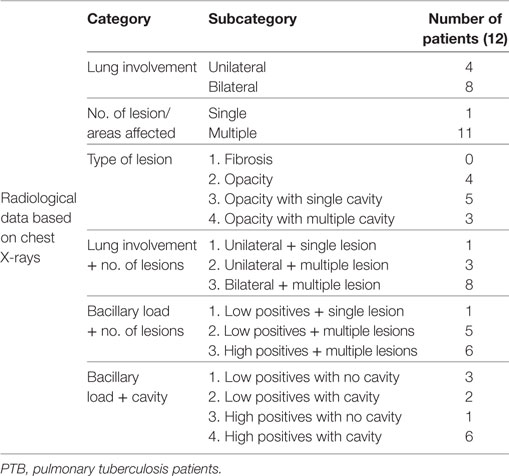
Table 3. Categorization of PTB based on chest X-ray findings and bacillary load.
Sputum Preparation for Acid-Fast Bacilli Staining and Culture
Two sputum (spot and early morning) samples were collected from each study participant as per the RNTCP guidelines (10). Modified Petroff’s method (11) was used for sample decontamination and further diagnosis was made based on sputum microscopy by Zeihl–Neelsen staining and MTB culture on Lowenstein–Jensen media.
Cell Culture and Flow Cytometry
Whole blood was collected from PTB (at all time points of follow-up) and NHS (only once at the time of their recruitment) by venipuncture in heparinized tubes. The blood was layered over ficoll-hypaque (Sigma-Aldrich, St. Louis, MO, USA) and after centrifugation, the peripheral blood mononuclear cells (PBMCs) were collected, washed with Hank’s balanced salt solution (HBSS) (Sigma-Aldrich, St. Louis, MO, USA) and suspended in complete Roswell Park Memorial Institute (RPMI-1640) medium (Sigma-Aldrich, St. Louis, MO, USA) [with 10% Human AB serum (MP Biomedicals, CA, USA)] supplemented with antibiotic antimycotic solution (Sigma-Aldrich, St. Louis, MO, USA). PBMCs were counted and were incubated with or without purified protein derivative (PPD) (10 µg/mL) (Statens Serum Institut, Denmark) overnight in a 5% CO2 atmosphere. Brefeldin A (1 µg/mL) (BD Biosciences, CA, USA) was added 16 h before the termination of culture. After culture termination, cells were washed with cold RPMI to remove adherent cells and the fluorochrome-tagged surface labels, such as CD4 PerCP, CD25 FITC, CD39PE, and CD127PE (BD Biosciences, CA, USA) were added and incubated for 30 min at 4°C. This was followed by washing and FoxP3 buffer treatment (BD Biosciences, CA, USA) for fixing and permeabilizing the cells, after which internal labels [i.e., IL-10 PE, TGF-β PE, FoxP3 Alexa fluor@647, IL-17A Alexa fluor@647 (BD Biosciences, CA, USA)] were added and incubated for 30 min at room temperature. Finally, the cells were fixed using 2% paraformaldehyde and acquired by flow cytometer (FACSAria, BD Biosciences, CA, USA). The cells were analyzed using FlowJo v10 software (FlowJo LLC, OR, USA).
Statistical Analysis
Differences in expression of individual markers [in terms of absolute number, percentage and mean fluorescence intensity (MFI)] and cellular subsets (Treg and Th17 subsets) in blood samples from NHS and PTB were evaluated using Mann–Whitney U test. Individual marker expression and cellular subset profiles during the course of TB treatment were analyzed by Kruskal–Wallis test, whereas the paired comparisons between different time points were made by Mann–Whitney U test. Association between the bacillary load and expression of markers or cellular subsets were studied using Mann–Whitney U test. Marker expression, cellular subset responses, and different radiological parameters were analyzed using Mann–Whitney U test. This test was also employed for predicting correlation between marker expression and sputum conversion in the second month. P-values <0.05 were considered significant. The data were analyzed using Graphpad Prism software (Graphpad Software Inc., version 5, CA, USA).
Results
Patient Follow-up and Outcome
Of 15 enrolled PTB, only 12 were followed up at different time points of ATT (0, 2, 4, and 6 months) for longitudinal studies (two were lost to follow-up and one was excluded due to patient’s pregnancy at fourth month of ATT) (Figure 1). All the follow-up PTB who were initially positive for sputum smear microscopy and culture turned out negative at second month except two (Table 4). Except one PTB who turned out to be multidrug resistant (MDR) all others were sputum smear negative at sixth month of follow-up. Most of the PTB recruited either had history of TB in family or lived in close contact of PTB.
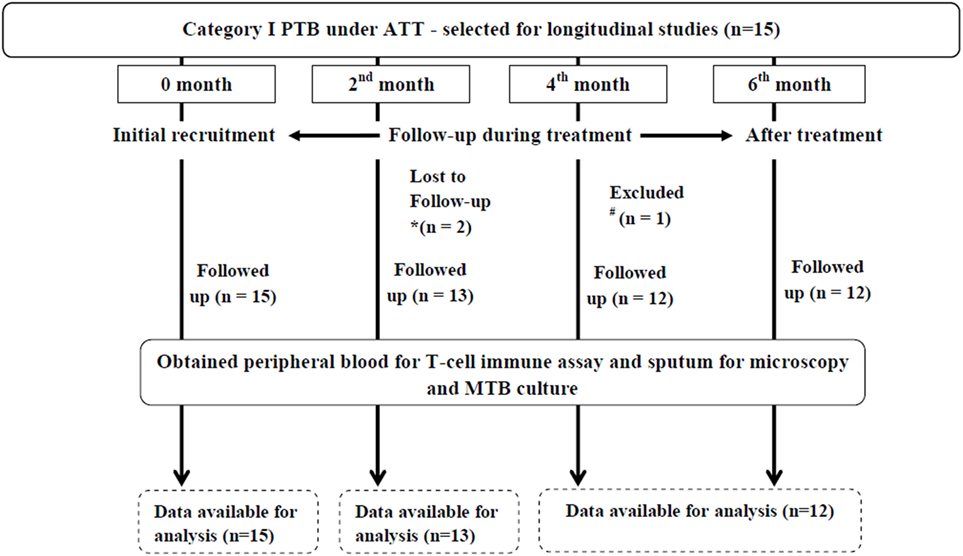
Figure 1. Flowchart depicting longitudinal studies in PTB. Initially, 15 PTB were recruited for longitudinal studies of which two were lost to follow-up due to *non-compliance of patients (at second month of ATT) and one was #excluded due to pregnancy (at fourth month of ATT). Therefore, the longitudinal studies were carried out in 12 PTB. PTB, pulmonary TB patients; ATT, antituberculous treatment; MTB, Mycobacterium tuberculosis.
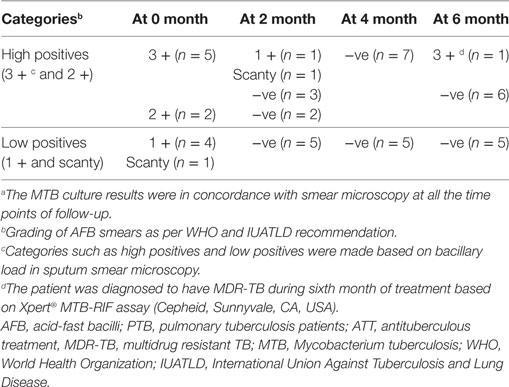
Table 4. Conversion of sputum AFB smeara in PTB during ATT.
Evaluation of Markers and Cellular Subsets in Peripheral Blood of NHS and Treatment Naïve PTB
We evaluated the expression (in terms of absolute number, percentage, and MFI) (both with and without PPD stimulation) of various Treg and Th17-associated markers (CD4, CD25, CD127, CD39, FoxP3, IL-10, TGF-β and IL-17A) and frequencies/percentages of different cellular subsets (Table 5) in PBMCs isolated from the peripheral blood of PTB (n = 15) and NHS (n = 17). In NHS, QFT-IT status (i.e., QFT +ve or QFT −ve) had no impact on the expression of these markers.
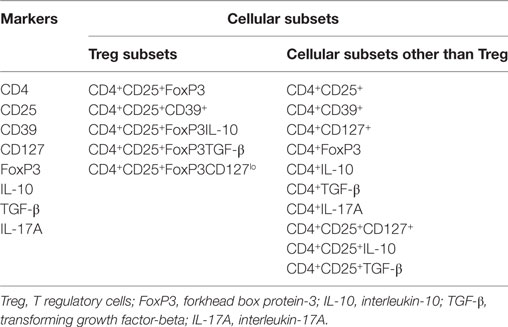
Table 5. Markers and cellular subsets evaluated in the study.
A significantly higher expression of CD25 (p<0.0001) (Figure 2), as an individual marker, as well as on CD4+ (CD4+CD25+) (p<0.0001) T cells was observed in PTB, when compared with NHS. PPD stimulation had no effect on the expression of CD25 as well as on the frequency of CD4+CD25+ cells (Figure 2). Markedly higher expression was estimated for CD4 (p<0.018), CD39 (p<0.028) and CD127 (p<0.001) markers (in terms of MFI) as well as CD4+CD39+ (p<0.045) and CD4+CD127+ (p<0.027) cells in PTB when compared with NHS (Figures 3A–C). Interestingly, PPD stimulation further significantly enhanced the expression of the above-mentioned markers and subsets (data not shown). However, the expression of IL-17A (p<0.0012) markers and frequencies of CD4+IL-17A (p<0.0008) T cells were significantly low in PTB than that in NHS (Figure 3Di,ii). The expression of IL-17A was further enhanced significantly on PPD stimulation (data not shown). Rest of the markers and cellular subsets included in the study (as described in Table 5) were also analyzed, but no significant difference was observed between PTB and NHS.
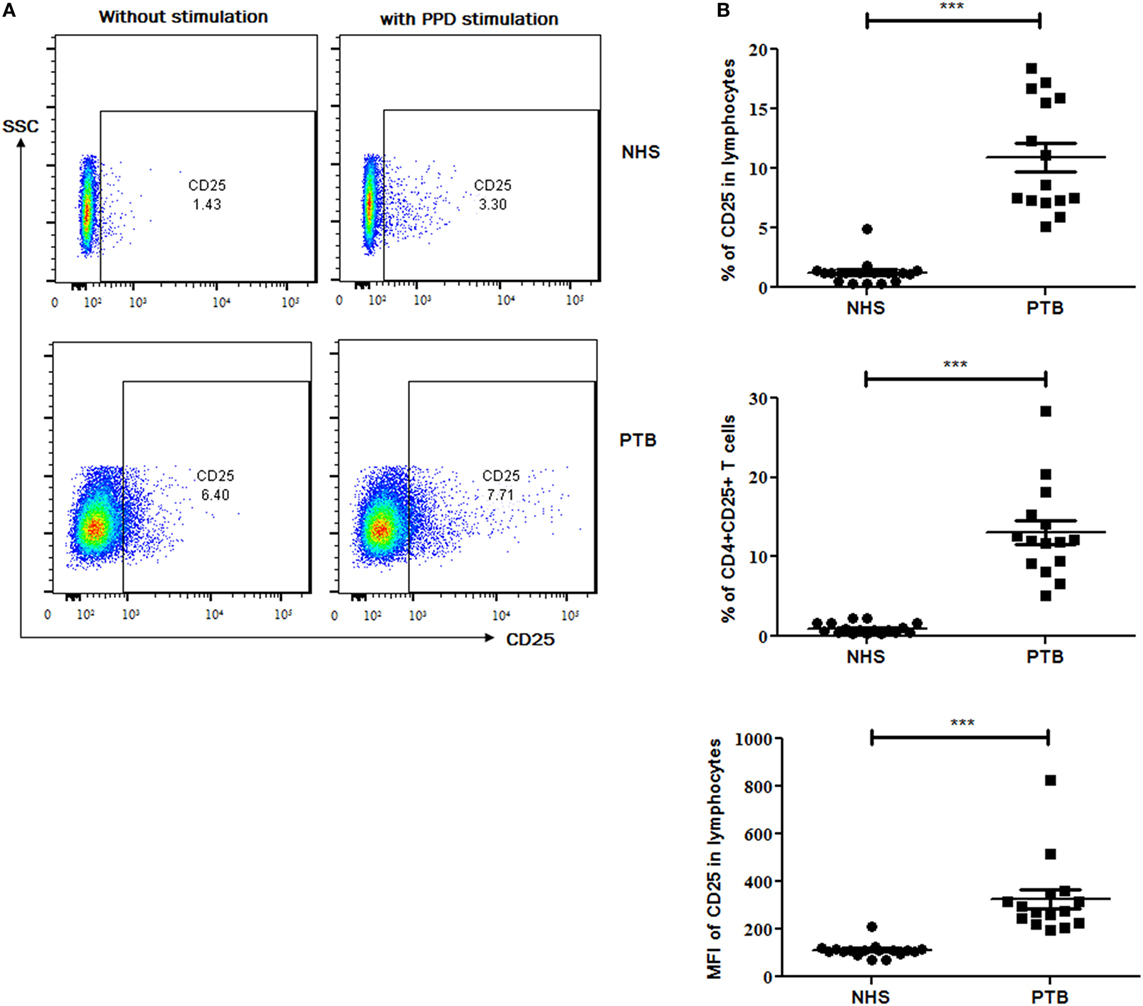
Figure 2. Expression of CD25 marker and cellular subset in peripheral blood of NHS and treatment naïve PTB. (A) Flow-cytometry plots (on left) showing the expression of CD25 with and without PPD stimulation and (B) scattergrams (on right) between NHS and PTB for CD25 and CD4+CD25+ T cells. Statistical analysis was performed using Mann–Whitney U test. *p ≤ 0.05, **p ≤ 0.01, and ***p ≤ 0.001. NHS, normal healthy subjects; PTB, pulmonary tuberculosis patients; MFI, Mean fluorescence intensity.
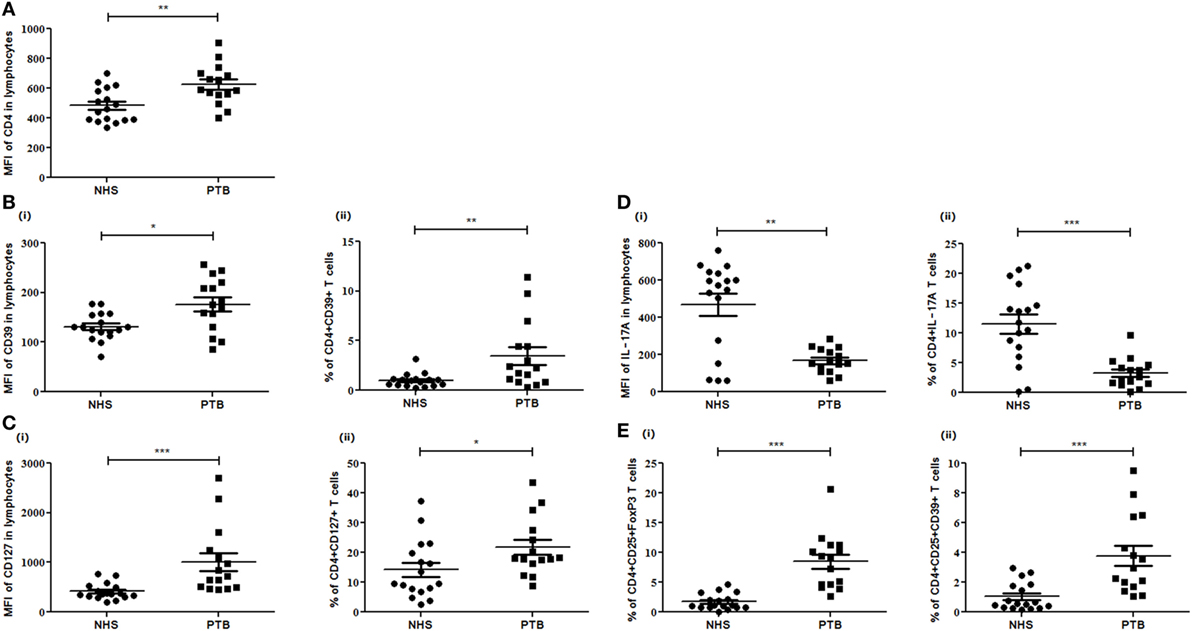
Figure 3. Expression of different markers and subsets in peripheral blood of NHS and PTB. Mean fluorescent intensity (MFI) and percentages of (A) CD4, (B) CD39 and CD4+CD39+, (C) CD127 and CD4+CD127+, (D) IL-17A and CD4+IL-17A, and (E) CD4+CD25+FoxP3 and CD4+CD25+CD39+ between NHS and PTB. Statistical analysis was performed using Mann–Whitney U test. *p ≤ 0.05, **p ≤ 0.01, and ***p ≤ 0.001. NHS, normal healthy subjects; PTB, pulmonary tuberculosis patients.
We also enumerated the frequencies of different Treg subsets in PBMCs of PTB and NHS. Peripheral frequencies of CD4+CD25+FoxP3 (p<0.0001), CD4+CD25+CD39+ (p<0.0003) Treg subsets were observed to be significantly higher among PTB than that of NHS (Figure 3Ei,ii). No significant difference was observed for induced Treg (iTreg) subsets like CD4+CD25+FoxP3IL-10 and CD4+CD25+FoxP3TGF-β when compared between PTB and NHS. Although the frequencies of Treg were enhanced on PPD stimulation, the increase was not significant. Numeral data depicting the absolute count and percentages of various markers and cellular subsets are represented in Table 6.
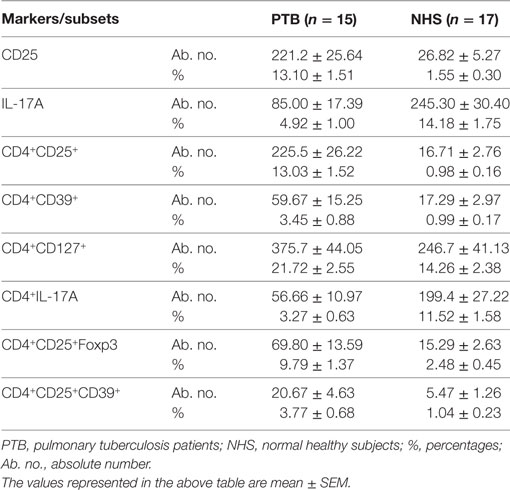
Table 6. Expression of various Treg, Th17 markers, and their cellular subsets (those showing significance) in terms of their absolute number and percentages during recruitment of study subjects.
Further, based on QFT status, NHSs were categorized into two sub groups: QFT positive (QFT +ve; LTBI, n = 7) and QFT negative (QFT –ve; n = 10), and the expression of various Treg and Th17 markers and cellular subsets were compared with that of PTB. Similar to the above-mentioned results comparing PTB with NHS, a significantly higher expression of CD4 (QFT +ve, p<0.024; QFT –ve, p<0.018), CD25 (QFT +ve, p<0.0002; QFT –ve, p<0.0001), and CD39 (QFT +ve, p<0.138; QFT –ve, p<0.043) markers and CD4+CD25+ (QFT +ve, p<0.0002; QFT –ve, p<0.0001), CD4+CD39+ (QFT +ve, p<0.077; QFT –ve, p<0.014), CD4+CD25+FoxP3 (QFT +ve, p<0.001; QFT –ve, p<0.0001) and CD4+CD25+CD39+ (QFT +ve, p<0.016; QFT –ve, p<0.0008) (Figure 4) Treg subsets were observed in PTB when compared with QFT +ve or QFT –ve individuals. However, other markers and cellular subsets also showed a similar trend but were not statistically significant when QFT positive or negative NHS groups were compared with PTB (data not shown).
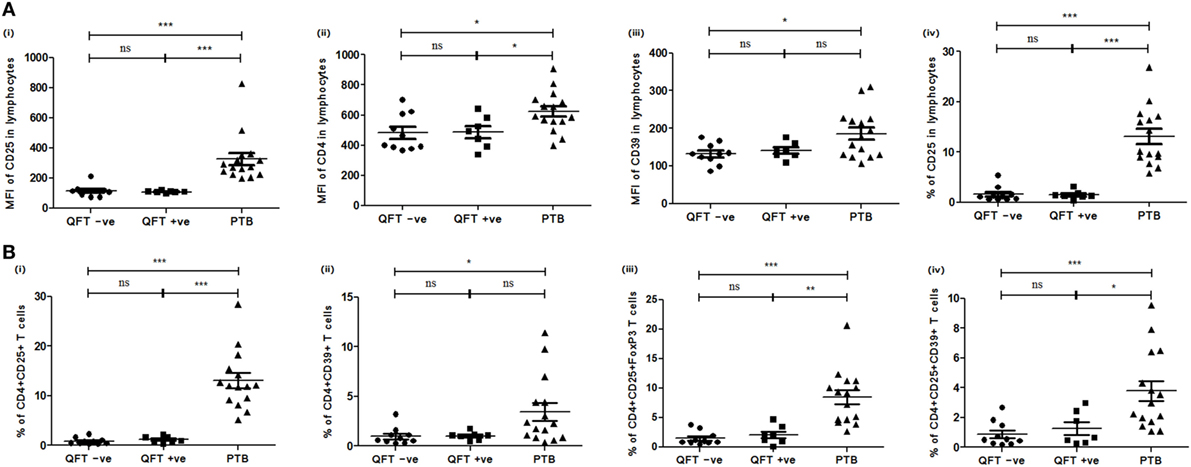
Figure 4. Expression of various markers and cellular subsets in PBMCs of QFT –ve (NHS), QFT +ve (NHS), and PTB. (A) Mean fluorescent intensity (MFI) of (i) CD25, (ii) CD4, (iii) CD39 markers in lymphocytes, and (iv) percentage of CD25 T cells in lymphocytes. (B) Frequencies of (i) CD4+CD25+, (ii) CD4+CD39+ T cells, (iii) CD4+CD25+FoxP3, and (iv) CD4+CD25+CD39+ Treg. Statistical analysis was performed using Mann–Whitney U test *p ≤ 0.05, **p ≤ 0.01, and ***p ≤ 0.001. PBMCs, peripheral blood mononuclear cells; QFT, quantiferon; PTB, pulmonary TB patients; ns, not significant.
When the marker expression studies were done in QFT positive and negative subjects (only NHS group), the following results were observed: the expression of various Treg and Th17 markers and percentages of their cellular subsets were compared among QFT +ve individuals, as well as between QFT +ve and QFT −ve individuals, but no significant difference was observed for any of the markers and cellular subsets studied.
Frequencies of Markers and Cellular Subsets during ATT
We evaluated the expression of various Treg and Th17 markers and frequencies of cellular subsets (Table 5) in PBMCs of PTB (at different time points of ATT) for determining the role of these markers in TB treatment efficacy. In this context, 12 PTB were followed up till ATT completion. The frequencies of CD25 (p<0.0001) and CD127 (p<0.025) marker decreased over the course of treatment (Figure 5Ai,ii). A decrease was also observed in frequencies of cellular subsets like CD4+CD25+ (p<0.0001), CD4+CD127+ (p<0.006) T cells (Figure 5Bi,ii) and Treg subsets like CD4+CD25+FoxP3 (p<0.038) and CD4+CD25+CD39+ (p<0.005) during ATT (Figure 5Ci,ii). However, no decrease in frequencies of iTreg—CD4+CD25+FoxP3IL-10 and CD4+CD25+FoxP3TGF-β was observed. PPD stimulation had no effect on expression of these markers and did not alter the overall significance (meaning that at least median of one time point is different from the median of at least any other time point). No significant variation was observed for other markers and subsets during ATT.
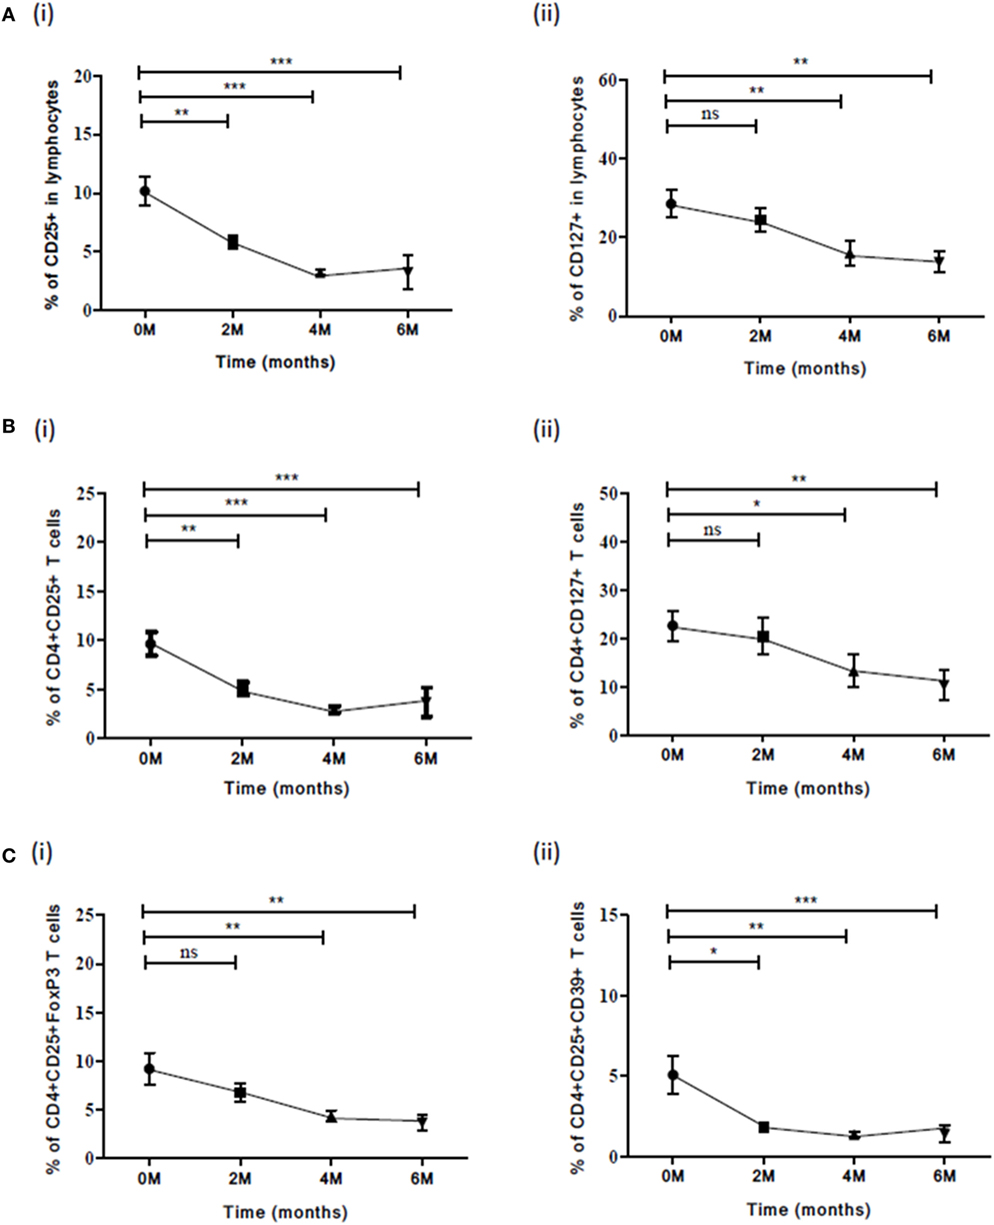
Figure 5. Frequency of various Treg subsets and associated markers at different time points (0, 2, 4, and 6) of TB treatment. (A) Expression of (i) CD25 and (ii) CD127 in lymphocytes along with ATT. (B) Frequencies of (i) CD4+CD25+ and (ii) CD4+CD127+ T cells (C) Frequencies of Treg subsets: (i) CD4+CD25+FoxP3 and (ii) CD4+CD25+CD39+ during ATT. Statistical analysis was performed using Kruskal–Wallis non-parametric test and comparison between the different time points (0–2, 0–4, and 0–6) was made using Mann–Whitney U test. *p ≤ 0.05, **p ≤ 0.01, and ***p ≤ 0.001. M, months; ns, not significant; ATT, antituberculous treatment.
In the case of one PTB who turned out to be MDR during the sixth month, a drastic increase was observed only in CD25 expression and CD4+CD25+ subset frequency when compared with other PTB (Table 7).
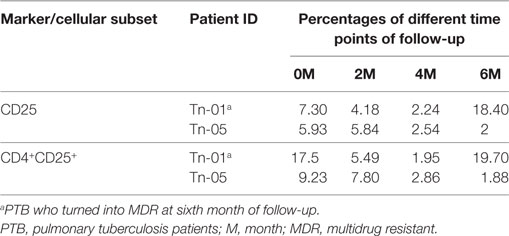
Table 7. Comparison between the expression of CD25 marker and its CD4+ subset in a PTB with that of a PTB who turned into MDR.
Role of the Markers and Cellular Subsets in Early Treatment Monitoring
The role of these markers as well as cellular subsets was studied at zero and second months of ATT for early treatment monitoring. The frequencies of CD25 (p<0.01) marker decreased significantly at the end of IP (Figure 6A). The cellular subsets like CD4+CD25+ (p<0.001) and CD4+CD25+CD39+ (p<0.05) (Figures 6B,C) also decreased significantly at second month of ATT. However, for rest of the markers no significant difference in expression from zero to second month was noticed. Also, stimulation with PPD did not change the expression of markers and cellular subsets at early time point of treatment.
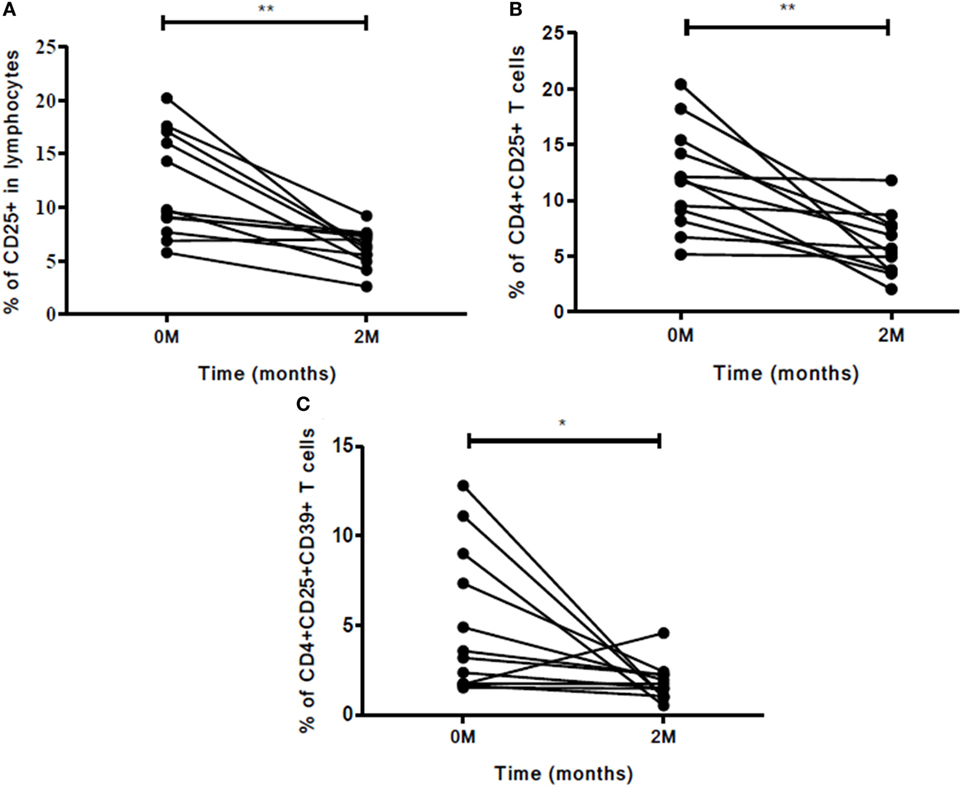
Figure 6. Frequencies of Treg and associated markers for early (at second month) treatment monitoring. (A) Percentage of CD25 marker, (B) percentage of CD4+CD25+ T cells, and (C) frequency of CD4+CD25+CD39+ Treg. The change in expression of markers and cellular subsets was studied between zero and second months of ATT. Statistical analysis was made using Mann–Whitney U test. *p ≤ 0.05, **p ≤ 0.01, and ***p ≤ 0.001. Other markers and cellular subsets were also studied but were not found to be significant. M, months; ATT, antituberculous treatment; Treg, T regulatory cells.
Role of Markers and Subsets in Determining Treatment Efficacy during Continuation Phase (CP) of Treatment
The expression of Treg and Th17 markers and cellular subsets were evaluated in CP of ATT. The expression of these markers was compared between second and fourth months; second and sixth months; fourth and sixth month. A significant decrease was observed in the expression of CD25 marker, CD4+CD25+, and CD4+CD25+CD39+ T cells at all treatment time point comparisons mentioned above (Figures 7A–C). Stimulation with PPD did not change the expression of markers and cellular subsets in CP of ATT.
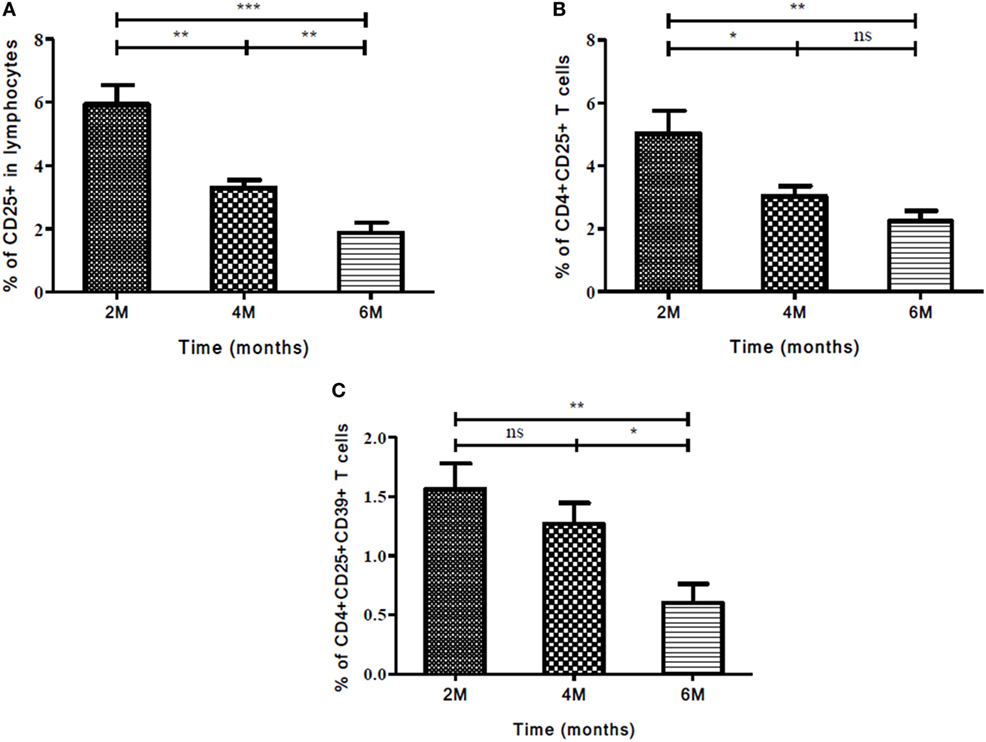
Figure 7. Frequency of Treg and associated markers during continuation phase (CP) of TB treatment. (A) Expression of CD25 as an individual marker, (B) frequency of CD4+CD25+, and (C) CD4+CD25+CD39+ T cells at different time points (2, 4, and 6 months) of treatment. Mann–Whitney U test was used to measure statistical significance between various time points like 2 and 4 months, 2 and 6 months, and 4 and 6 months. *p ≤ 0.05, **p ≤ 0.01, and ***p ≤ 0.001. M, months; ns, not significant; Treg, T regulatory cells.
Association of Markers and Cellular Subsets with Sputum Conversion at the End of Intensive Phase (IP)
It was observed that higher the bacillary load, higher the expression of evaluated markers and vice versa but this was not statistically significant (data not shown). The bacillary load reduction assessed by second month (IP) sputum smear conversion was investigated along with different marker levels for deducing an asssociation, if any. In sputum high positives (sputum smear grades: 3 + or 2 + during recruitment), the frequencies of CD25 (p<0.017) marker and CD4+CD25+ (p<0.02) T cells decreased significantly along with the conversion of sputum bacillary load at the end of IP (Figures 8A,B). On the other hand, an inverse association was found between change in bacillary load from zero to second months and CD4+CD25+FoxP3CD127lo (p<0.011) Treg frequency (Figure 8C). PPD stimulation enhanced the expression of above-said markers and subsets significantly in high smear positive sputum converters at second month (Figures 8A–C).
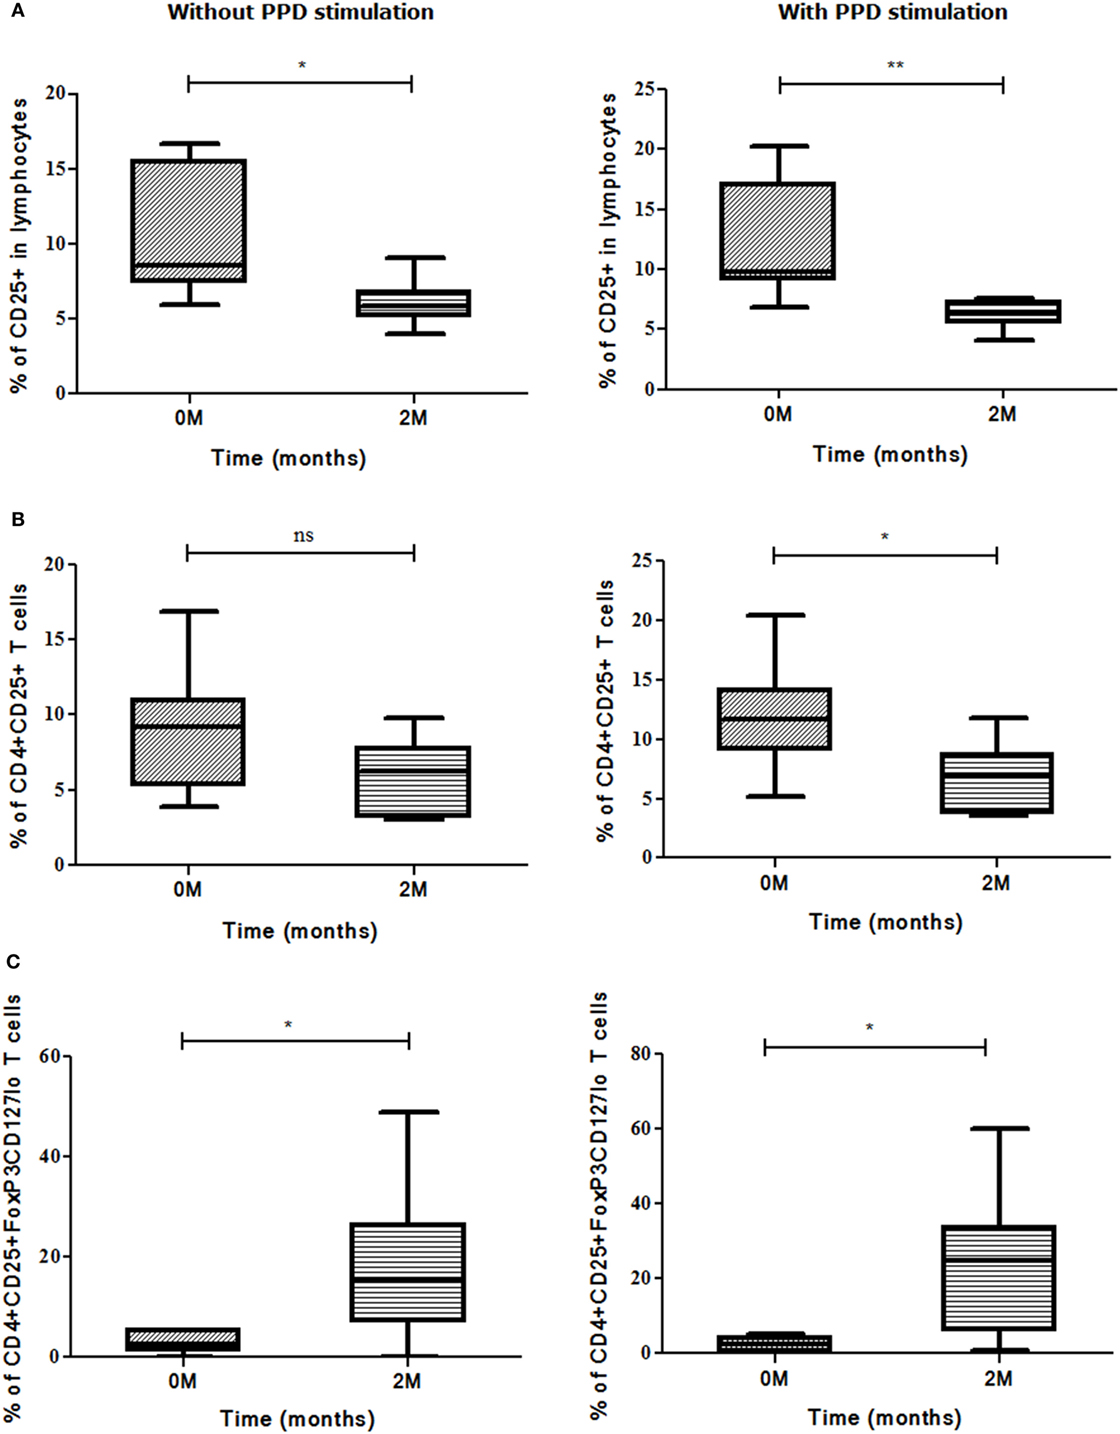
Figure 8. Sputum conversion in high positives at the end of intensive phase (IP). Frequencies of (A) CD25, (B) CD4+CD25+ T cells, and (C) CD4+CD25+FoxP3CD127lo Treg (with and without stimulation) along with sputum conversion in high positives (3 + and 2 +) at zero and second months. Sputum conversion and frequencies of markers were statistically correlated by employing Mann–Whitney U test. *p ≤ 0.05, **p ≤ 0.01, and ***p ≤ 0.001. M, months; Treg, T regulatory cells; ns, not significant; PPD, purified protein derivative.
A positive association was found between second month smear conversion of sputum low positives (sputum smear grades: 1 + or scanty during recruitment) and frequencies of CD4+CD25+ (p<0.008) T cells, whereas the frequencies of CD4+IL-17A (p<0.008) T cells and CD4+CD25+FoxP3CD127lo (p<0.011) Treg showed an inverse association (Figures 9A–C). PPD stimulation enhanced the expression of the above markers and subsets but was not significant.
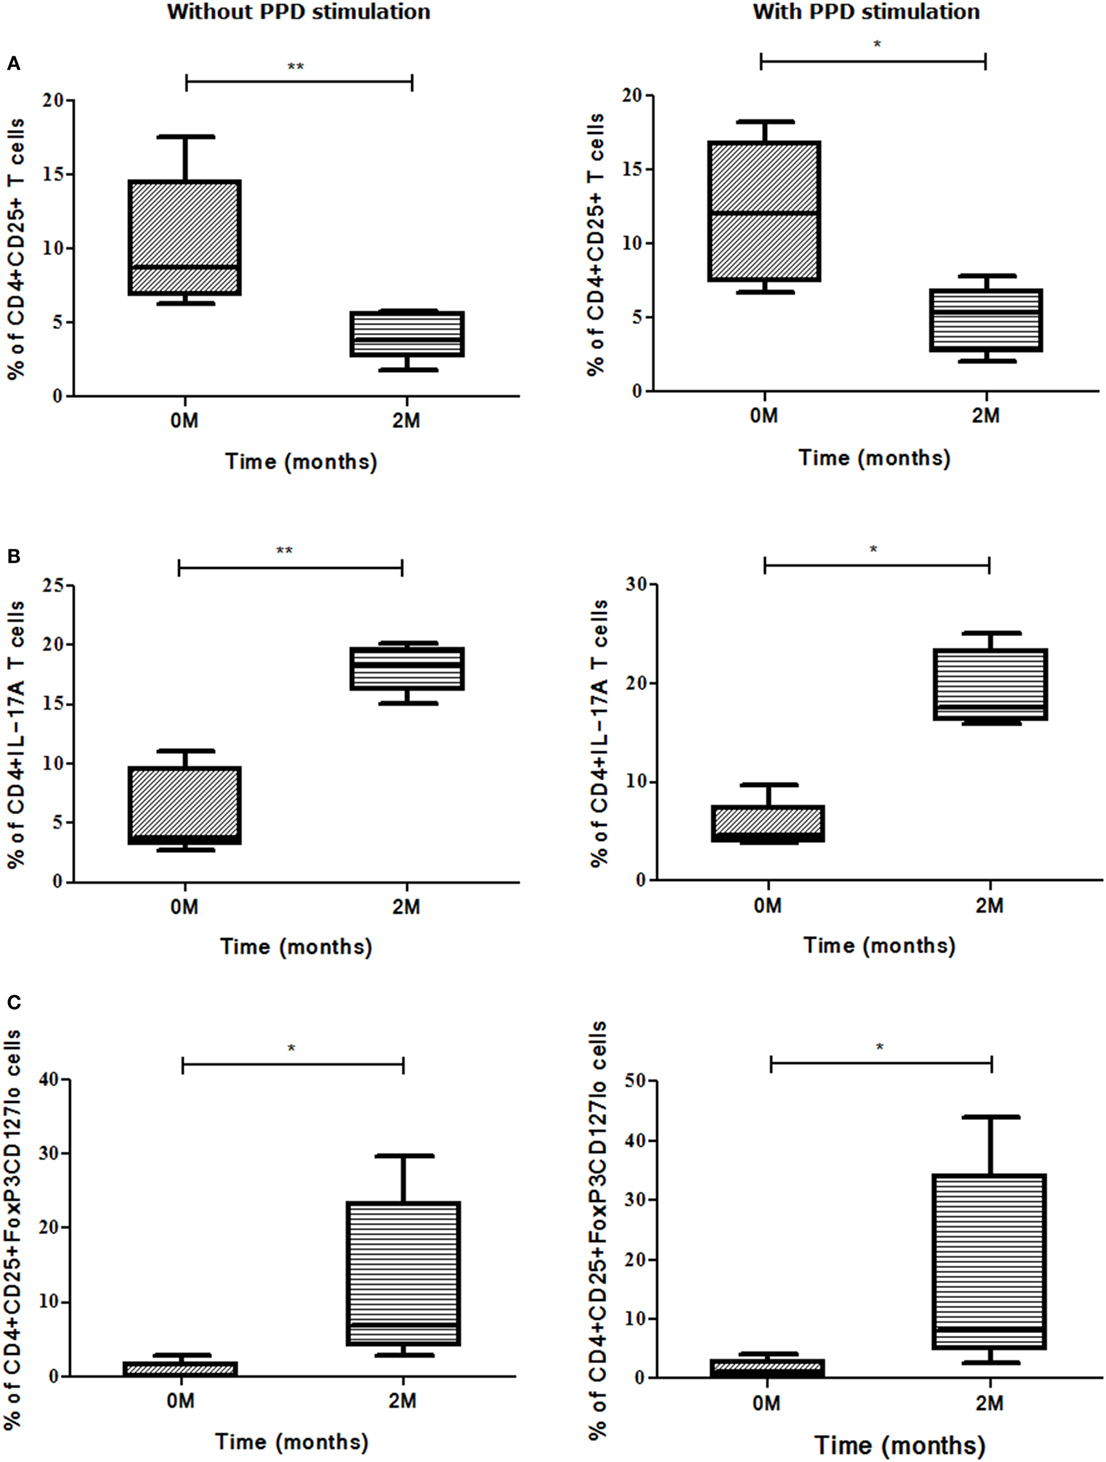
Figure 9. Sputum conversion in low positives (1 + and scanty) at the end of intensive phase (IP). Association was deduced between frequencies of (A) CD4+CD25+, (B) CD4+IL-17A, and (C) CD4+CD25+FoxP3CD127lo Treg and sputum conversion among low positives from zero and second months using Mann–Whitney U test. *p ≤ 0.05, **p ≤ 0.01, and ***p ≤ 0.001. M, months; ns, not significant; Treg, T regulatory cells; PPD, purified protein derivative.
Radiological Parameters, Bacillary Load and Marker Studies
Of all the markers and cellular subsets studied, the percentage of CD4+CD25+FoxP3 Treg subsets showed a significant increase in those who manifested high bacillary load and multiple lesions by radiology when compared with those who had low bacillary load and single/multiple lesions (Figure 10A). The same subset also showed a significant increase in patients with opacities and single or multiple cavities (scores 3 and 4; n = 5, 3) compared with those who had opacities alone (score 2; n = 4) in chest X-rays (Figure 10B). A decrease of CD4+CD25+FoxP3 Treg subset along with reduction in chest X-ray lesion was observed in the second month but was not statistically significant (Figures 10C,D). When this Treg subset was studied in follow-up (second and sixth month compared with zero month), it manifested a significant decrease in the sixth month (p<0.018) with a concomitant reduction in chest X-ray lesions (Figures 10E,F). The radiological parameters were studied for all the other markers and cellular subsets wherein a change was observed for the scores compared but was not statistically significant.
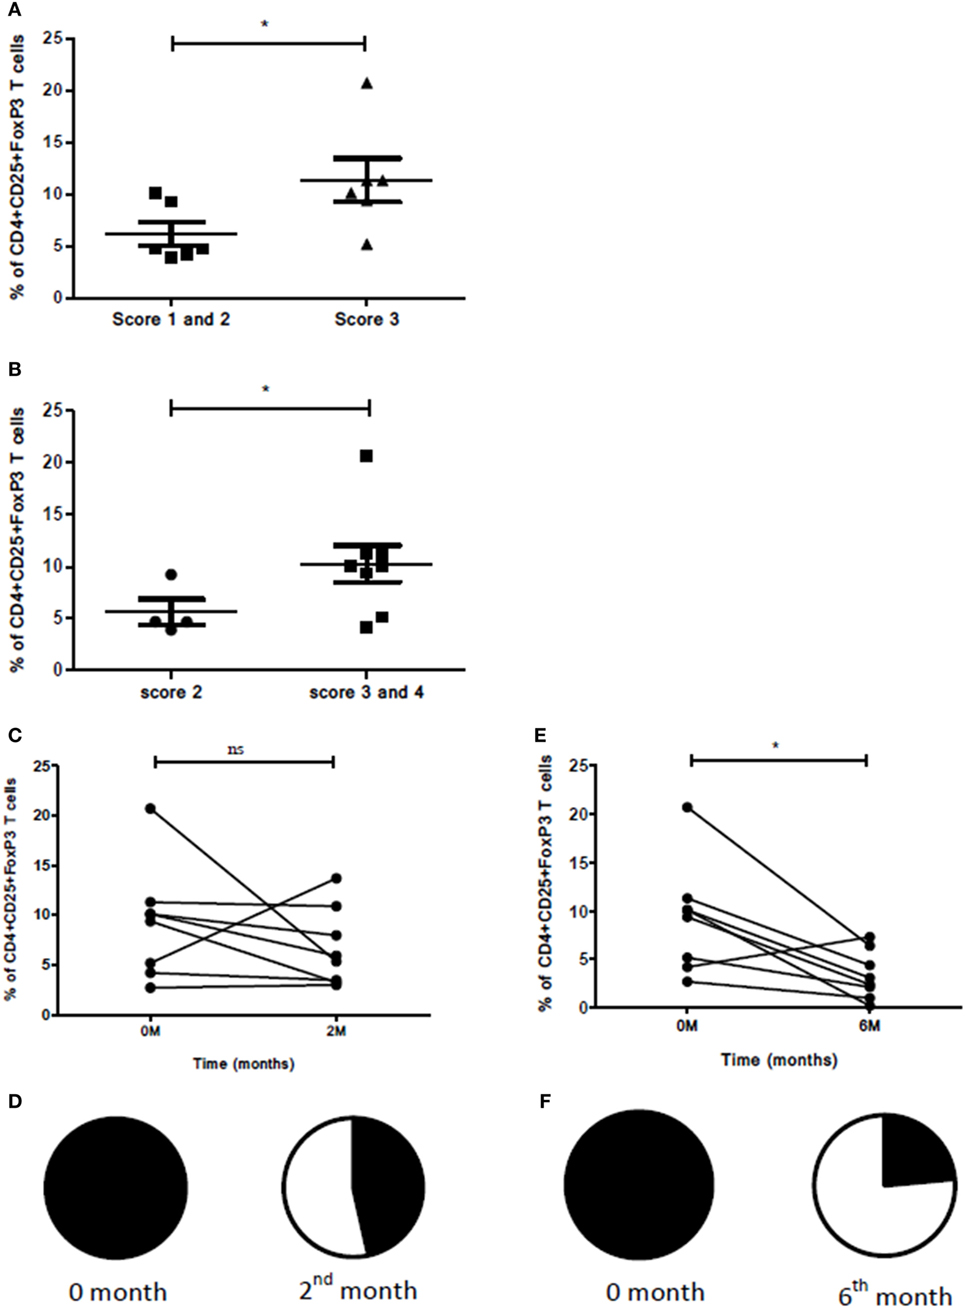
Figure 10. Association between radiological scores, sputum smear grades, and Treg levels. (A) Bacillary load, number of lesions, and percentage of T cells expressing CD4+CD25+FoxP3. Here, score 1––patients having sputum smear grade scanty/1 + with single lesion (n = 1); score 2––patients having sputum smear grade scanty/1 + with multiple chest X-ray lesions (n = 5); score 3–patients having sputum smear grade 2 + /3 + with multiple chest X-ray lesions (n = 6). (B) Association between type of lesions and percentage of T cells expressing CD4+CD25+FoxP3. Here, score 2––patients having opacity (n = 4); score 3––patients with opacity and single cavity (n = 5); and score 4––patients with opacity and multiple cavities (n = 3). (C) Reduction in percentage of cells expressing CD4+CD25+FoxP3 before ATT and 2 months after ATT [in eight patients having opacity with single and multiple cavities (score 3 and 4)]. (D) Pie chart denoting reduction in chest X-ray lesions 2 months after ATT for eight patients shown in (C). Closed segment denotes no improvement and open segment denotes improvement in chest X-ray lesions. (E) Reduction in percentage of cells expressing CD4+CD25+FoxP3 before ATT and 6 months after ATT for eight patients shown in (C). (F) Pie chart denoting reduction in chest X-ray lesions 6 months after ATT for eight patients shown in (C). M, months; ATT, antituberculous treatment.
Discussion
Efficient treatment is crucial for TB disease control. Although the current regimens are for extended periods of time (from months to years), patient compliance and prompt monitoring will help in efficient management. Monitoring ATT is necessary as late detection of resistance (due to non-compliance) may lead to further complications (like poor prognosis) and extended therapy for the patient which is more burdensome for the patient’s health as well as for the country’s economy. Currently, monitoring ATT involves sputum microscopy, demerits of which have been described earlier (2, 3). An efficient monitoring tool is the need of the hour and earlier studies have focused on serum markers like IL-2 (12), neopterin (12), IL-1ra (13), C-reactive protein (13), sTNF-R1 (14), granzyme B (14), and cell-associated markers like CD4+CD38+ (15), CD4+HLA-DR (15, 16), CD4+Ki-67 (15), CD11b, CD33 (studied as part of granulocytic and monocytic MDSCs) (16), CD4+CD25+ (4, 17, 18), CD4+CD25+FoxP3 (5, 6, 19, 20), and CD4+IL-17A (21–23). Serum markers studied so far are not promising as they have low predictive values and are not above the baseline. Although cells are dynamic structures, producing markers (both on the surface and internally) which have a turnaround time, their expression follows a definite pattern during treatment which can be exploited for early treatment monitoring and studying treatment efficacy during ATT (4, 5, 14–18, 24).
The role of Treg in TB is contradictory, as it is unclear whether the peculiar expansion of Treg is a cause or consequence of disease. This expansion is probably in retort to the enhanced pro-inflammatory immune response (by Th1 and Th17 subsets) for bringing down the immune-mediated damage. There are reports pointing out the involvement of Treg and Th17 in TB disease progression (20–23), severity of TB (25–28), and even reports showing a regular gradation in frequencies of Treg in response to ATT (4, 5, 17–19, 24). But none of these studies have comprehensively evaluated the dynamics of various Treg and Th17 cellular subsets and their associated markers along with ATT (at various time points of TB treatment i.e., before, during, and after treatment). In this study, we have evaluated (i) dynamics of various Treg and Th17 subsets and associated markers at various time points of ATT (0, 2, 4, and 6) and their use in monitoring ATT; and (ii) their association with sputum conversion.
The initial part of this study has compared the expression of Treg and Th17 markers and cellular subsets between NHS and treatment naïve PTB. A higher expression of CD25 as an individual marker as well as on CD4+ (CD4+CD25+) T cells was observed in PTB than those from NHS, which is in agreement with the earlier studies (17, 18). It is known that CD25 (IL-2Rα) is indispensable for the maintenance of FoxP3 expression as well as for thymic and extrathymic differentiation of Treg subsets (29, 30). Thus, Treg cells express abundant amount of IL-2Rα. Despite their higher dependence on IL-2, Treg cells are unable to produce IL-2 and rely on IL-2 produced by activated T cells. The IL-2 consumption by Treg is suggested to play an essential role in Treg suppressor function by causing death of activated CD4+ T cells due to IL-2 deprivation (31, 32). This could be the reason for enhanced CD25+ (IL-2Rα) marker expression individually and also on CD4+ cells (CD25+ has weak affinity for IL-2).
Furthermore, the frequency of CD4+CD25+FoxP3 and CD4+CD25+CD39+Treg was higher in peripheral blood of PTB when compared with NHS, which is found to be in concordance with previous studies (4, 5, 33). FoxP3 is considered a key player for Treg development and function, whereas CD39 is an ectoenzyme that degrades adenosine triphosphate (ATP) to adenosine that inhibits effector T-cell activation, proliferation, and expansion. It has been shown to be associated specifically with Treg function. Therefore, a higher frequency of these Treg subsets is commonly observed in response to many infections including MTB infection.
On the contrary, PTB had a lower expression of Th17 cells (IL-17A and CD4+IL-17A T cells) which was reciprocal to CD4+CD25+FoxP3 expression when compared with NHS. Our results correspond with the results by Shu et al. (23), who found a reciprocal relation in frequencies of Th17 and CD4+CD25+FoxP3 Treg in TB patients when compared with controls. This imbalance in frequencies of Th17 and Treg may be because they have a mutually inhibitory relationship in terms of differentiation, development and function (34).
Our study results also suggest that cellular markers like CD25, CD4+CD25+, CD4+CD25+FoxP3 and CD4+CD25+CD39+ are able to discriminate between latent and active TB after using PPD as antigenic stimulus. This is of utmost importance as markers for differential diagnosis of latent infection and active TB disease are still sought for. In line with our findings, Chiappini et al. (35) have found that a combination of IL-2 and IFN-γ-based ELISPOT can distinguish LTBI and active TB disease in pediatric population.
Our study result adds on to the existing knowledge of Treg expansion during TB. The elevated Treg are associated with immune suppression and their frequencies are supposed to decrease subsequently along with treatment as shown by other studies (discussed below). Thus, these marker levels will be helpful in monitoring TB treatment response.
In this context, our data demonstrate a marked decrease in the expression of CD25, CD127 markers, CD4+CD25+, CD4+CD127+ T cells, and Treg subsets like CD4+CD25+FoxP3 and CD4+CD25+CD39+along with treatment. Such a decrease in expression of markers and cellular subsets was not confined only to the end of IP but was consistent throughout the treatment even after IP and during CP. Our data correspond with other existing reports on decrease of Treg subsets but none of those studies have examined both Treg and Th17 subsets comprehensively till the end of ATT. Ribeiro-Rodrigues et al. (17) observed a significant drop in frequencies of CD4+CD25+ T cells at week 24 of ATT. Similarly, Singh et al. (5) found a decrease in frequencies of CD4+CD25+FoxP3 Treg after successful ATT. He et al. (18) also observed a decrease of CD4+CD25+FoxP3 Treg just after one month of treatment, whereas no difference was observed for CD4+CD25+ T cells. Additionally, Jackson-Sillah et al. (19) have also found a progressive decrease in frequencies of CD4+CD25+FoxP3 Treg at the end of second month of ATT.
In our study, a reduction in frequencies of Treg and Th17 markers and cellular subsets mirroring sputum conversion has been observed at the end of second month of ATT. A significant decrease in the frequency of CD4+CD25+ T cells, both in sputum high and low positives, has been observed upon sputum conversion from zero to second month of follow-up of PTB. Thus, ATT induced a decrease in Treg frequencies suggestive of their MTB-driven expansion at initial time point which later decrease with successful clearance of bacilli. On the other hand, the Th17 subset showed a marked increase in frequency upon sputum conversion which supports the theory of reciprocal expression of Th17 and Treg (36).
In one of the PTB who turned out to be MDR at sixth month of follow-up, we observed an abrupt increase in frequencies of CD25 marker and CD4+CD25+ T cells which is in line with the previous reports of expansion of Treg in MDR TB (27, 37). Furthermore, Geffner et al. (37) found increased frequencies of CD4+CD25+ and CD4+CD25highFoxP3 Treg in MDR-TB compared with susceptible-TB and healthy controls. A similar increase in frequency of CD4+CD25+FoxP3 Treg has been observed in MDR-TB by another study (27).
Although many studies have been carried out relating to Treg, Th17 with TB disease, this study is unique in that a real-time association between Treg and Th17 markers and the course of disease during treatment has been done. In this study, a detailed analysis of all the markers and their association with sputum microscopy at all the time points of treatment (0, 2, 4, and 6 months) has been done to know their usefulness in treatment monitoring. The overall aim of this study was to investigate multiple markers and cell subsets related to Treg and Th17 subsets and find out markers whether single or as a cellular subset which can be useful in monitoring TB treatment. Thus, the strength of this study is the evaluation of multiple markers and cellular subsets during ATT but the validation needs to be performed in a large cohort of PTB using multiple antigens. Thus, from this study, it was observed that markers like CD25, CD4+CD25+, and CD4+CD25+CD39+ T cells are distinct in their elevated expression in PTB before treatment when compared with treatment completion. Moreover, they show a consistent decrease in IP as well as in CP showing their potential for monitoring TB treatment efficacy. When the efficiency of these markers in comparison to sputum microscopy was studied, only CD25 and CD4+CD25+ T cells were able to show a consistent performance in high-positive as well as low-positive sputum converters. When treatment success at sixth month was compared with the level of markers and cell subsets, only a decrease in CD4+CD25+FoxP3 T-cell subset showed a statistically significant association. The decrease in the level of CD4+CD25+FoxP3 cells during treatment also showed good association with resolution of extensive lung lesions. Thus, this Treg subset appears to be promising for predicting favorable treatment response in PTB with extensive lung lesions. All these characteristics point out that these markers deserve attention for use in TB treatment monitoring.
Ethics Statement
The study was carried out after obtaining approval from Institutional Human Ethics Committee (IHEC). All study participants provided written informed consent.
Author Contributions
SA performed the experiments, analyzed the data, and prepared the manuscript. MK prepared the manuscript and analyzed the data. OP and MK designed the study and participated in data interpretation. AP made critical review of the manuscript and helped in modifying the manuscript. AP also contributed toward analyzing the clinical data and in its interpretation. AB helped in manuscript preparation and data analysis. SK helped in interpreting the clinical data. DC helped in microbiological studies.
Conflict of Interest Statement
The authors declare that the research was conducted in the absence of any commercial or financial relationships that could be construed as a potential conflict of interest.
Acknowledgments
SA is a DST (Department of Science and Technology, Govt. of India) INSPIRE fellow and DST is acknowledged for providing research fellowship for pursuing research. The authors also would like to acknowledge NJIL & OMD, Agra, for routine facilities. The authors express their gratitude to Dr. Luke Elizabeth Hannah, Scientist, Department of HIV, National Institute for Research in Tuberculosis, Chennai for her help in Quantiferon TB Gold testing and Dr. Ponnuraja, Scientist, Department of Statistics, National Institute for Research in Tuberculosis, Chennai for his help in statistical analysis. The authors would like to acknowledge Mr. Vijay Dua (X-ray technician) and Mr. Ajay Kumar Jain (Hematology department) for their help in taking X-rays and hematological analysis of samples. The authors thank Dr. Rajkamal and Dr. Avi Kumar Bansal for extending their support for patient recruitment. The help provided by DOTS providers Mr. Ravi Kumar and Mr. Pushpendra Singh in patient recruitment is kindly acknowledged.
Funding
This work was supported by Defence Research & Development Establishment (grant number DRDE-P1-2015/Task-216).
Supplementary Material
The Supplementary Material for this article can be found online at http://www.frontiersin.org/articles/10.3389/fimmu.2018.00157/full#supplementary-material.
Figure S1. Recruitment of study groups and the experimental methodology. Sputum and blood samples were collected from both PTB. Sputum was subjected to smear microscopy and MTB culture, whereas blood was subjected to T-cell immune assay. TB, tuberculosis; PTB, pulmonary TB patients; ATT, antituberculous treatment; MTB, Mycobacterium tuberculosis; AFB, acid-fast bacilli.
References
1. World Health Organization. Global Tuberculosis Report. (2017). Available from: http://www.who.int/tb/publications/global_report/en/
2. Van Deun A, Portaels F. Limitations and requirements for quality control of sputum smear microscopy for acid-fast bacilli. Int J Tuberc Lung Dis (1998) 2(9):756–65.
3. Parkash O, Agrawal S, Madhan Kumar M. T regulatory cells: Achilles’ heel of Mycobacterium tuberculosis infection? Immunol Res (2015) 62(3):386–98. doi:10.1007/s12026-015-8654-0
4. Pang H, Yu Q, Guo B, Jiang Y, Wan L, Li J, et al. Frequency of regulatory T-cells in the peripheral blood of patients with pulmonary tuberculosis from Shanxi province, China. PLoS One (2013) 8(6):e65496. doi:10.1371/journal.pone.0065496
5. Singh A, Dey AB, Mohan A, Sharma PK, Mitra DK. Foxp3+ regulatory T cells among tuberculosis patients: impact on prognosis and restoration of antigen specific IFN-γ producing T cells. PLoS One (2012) 7(9):e44728. doi:10.1371/journal.pone.0044728
6. Guyot-Revol V, Innes JA, Hackforth S, Hinks T, Lalvani A. Regulatory T cells are expanded in blood and disease sites in patients with tuberculosis. Am J Respir Crit Care Med (2006) 173(7):803–10. doi:10.1164/rccm.200508-1294OC
7. Scott-Browne JP, Shafiani S, Tucker-Heard G, Ishida-Tsubota K, Fontenot JD, Rudensky AY, et al. Expansion and function of Foxp3-expressing T regulatory cells during tuberculosis. J Exp Med (2007) 204(9):2159–69. doi:10.1084/jem.20062105
8. Bhattacharya D, Dwivedi VP, Maiga M, Maiga M, Van Kaer L, Bishai WR, et al. Small molecule-directed immunotherapy against recurrent infection by Mycobacterium tuberculosis. J Biol Chem (2014) 289(23):16508–15. doi:10.1074/jbc.M114.558098
10. Revised National Tuberculosis Control Programme (RNTCP). Training Module for Medical Practitioners. Central TB Division, Directorate General of Health Services. New Delhi, India: Ministry of Health and Family Welfare (2010).
11. Allen BW, Baker FJ, editors. Modified Petroff Technique Treatment of specimens, chapter 3 in Mycobacteria Isolation, Identification and Sensitivity Testing. London: Butter Worth and Co (1968). p. 9–16.
12. Turgut T, Akbulut H, Deveci F, Kacar C, Muz MH. Serum interleukin-2 and neopterin levels as useful markers for treatment of active pulmonary tuberculosis. Tohoku J Exp Med (2006) 209(4):321–8. doi:10.1620/tjem.209.321
13. Lee JH, Chang JH. Changes of plasma interleukin-1 receptor antagonist, interleukin-8 and other serologic markers during chemotherapy in patients with active pulmonary tuberculosis. Korean J Intern Med (2003) 18(3):138–45. doi:10.3904/kjim.2003.18.3.138
14. Brahmbhatt S, Black GF, Carroll NM, Beyers N, Salker F, Kidd M, et al. Immune markers measured before treatment predict outcome of intensive phase tuberculosis therapy. Clin Exp Immunol (2006) 146(2):243–52. doi:10.1111/j.1365-2249.2006.03211.x
15. Adekambi T, Ibegbu CC, Cagle S, Kalokhe AS, Wang YF, Hu Y, et al. Biomarkers on patient T cells diagnose active tuberculosis and monitor treatment response. J Clin Invest (2015) 125(5):1827–38. doi:10.1172/JCI83279
16. El Daker S, Sacchi A, Tempestilli M, Carducci C, Goletti D, Vanini V, et al. Granulocytic myeloid derived suppressor cells expansion during active pulmonary tuberculosis is associated with high nitric oxide plasma level. PLoS One (2015) 10(4):e0123772. doi:10.1371/journal.pone.0123772
17. Ribeiro-Rodrigues R, Resende Co T, Rojas R, Toossi Z, Dietze R, Boom WH, et al. A role for CD4+CD25+ T cells in regulation of the immune response during human tuberculosis. Clin Exp Immunol (2006) 144(1):25–34. doi:10.1111/j.1365-2249.2006.03027.x
18. He XY, Xiao L, Chen HB, Hao J, Li J, Wang YJ, et al. T regulatory cells and Th1/Th2 cytokines in peripheral blood from tuberculosis patients. Eur J Clin Microbiol Infect Dis (2010) 29(6):643–50. doi:10.1007/s10096-010-0908-0
19. Jackson-Sillah D, Cliff JM, Mensah GI, Dickson E, Sowah S, Tetteh JK, et al. Recombinant ESAT-6-CFP10 fusion protein induction of Th1/Th2 cytokines and FoxP3 expressing Treg cells in pulmonary TB. PLoS One (2013) 8(6):e68121. doi:10.1371/journal.pone.0068121
20. Arram EO, Hassan R, Saleh M. Increased frequency of CD4+CD25+FoxP3+ circulating regulatory T cells (Treg) in tuberculous patients. Egypt J Chest Dis Tuberc (2014) 63:167–72. doi:10.1016/j.ejcdt.2013.10.013
21. Fan L, Xiao H, Mai G, Su B, Ernst J, Hu Z. Impaired M. tuberculosis antigen-specific IFN-γ response without IL-17 enhancement in patients severe cavitary pulmonary tuberculosis. PloS One (2015) 10(5):e0127087. doi:10.1371/journal.pone.0127087
22. Ye ZJ, Zhou Q, Du RH, Li X, Huang B, Shi HZ. Imbalance of Th17 cells and regulatory T cells in tuberculous pleural effusion. Clin Vaccine Immunol (2011) 18(10):1608–15. doi:10.1128/CVI.05214-11
23. Shu CC, Wu MF, Wang JY, Lai HC, Lee LN, Chiang BL, et al. Decreased T helper 17 cells in tuberculosis is associated with increased percentages of programmed death ligand 1, T helper 2 and regulatory T cells. Respir Res (2017) 18(1):128. doi:10.1186/s12931-017-0580-3
24. Feruglio SL, Tonby K, Kvale D, Dyrhol-Riise AM. Early dynamics of T helper cell cytokines and T regulatory cells in response to treatment of active Mycobacterium tuberculosis infection. Clin Exp Immunol (2014) 179(3):454–65. doi:10.1111/cei.12468
25. Churina EG, Urazova OI, Novitskiy VV. The role of Foxp3-expressing regulatory T cells and T helpers in immunopathogenesis of multidrug resistant pulmonary tuberculosis. Tuberc Res Treat (2012) 2012:931291. doi:10.1155/2012/931291
26. Lim HJ, Park JS, Cho YJ, Yoon HI, Park KU, Lee CT, et al. CD4+FoxP3+ T regulatory cells in drug-susceptible and multidrug-resistant tuberculosis. Tuberculosis (Edinb) (2013) 93(5):523–8. doi:10.1016/j.tube.2013.06.001
27. Li N, Xie WP, Kong H, Min R, Hu CM, Zhou XB, et al. Enrichment of regulatory T-cells in blood of patients with multidrug-resistant tuberculosis. Int J Tuberc Lung Dis (2015) 19(10):1230–8. doi:10.5588/ijtld.15.0148
28. Sharma PK, Saha PK, Singh A, Sharma SK, Ghosh B, Mitra DK. FoxP3+ regulatory T cells suppress effector T-cell function at pathologic site in miliary tuberculosis. Am J Respir Crit Care Med (2009) 179(11):1061–70. doi:10.1164/rccm.200804-529OC
29. Chinen T, Kannan AK, Levine AG, Fan X, Klein U, Zheng Y, et al. An essential role for IL-2 receptor in regulatory T cell function. Nat Immunol (2016) 17(11):1322–33. doi:10.1038/ni.3540
30. Setoguchi R, Hori S, Takahashi T, Sakaguchi S. Homeostatic maintenance of natural FoxP3+ CD25+ CD4+ regulatory T cells by interleukin (IL) 2 and induction of autoimmune disease by IL-2 neutralization. J Exp Med (2005) 201(5):723–35. doi:10.1084/jem.20041982
31. Barthlott T, Moncrieffe H, Veldhoen M, Atkins CJ, Christensen J, O’Garra A, et al. CD25+ CD4+ T cells compete with naive CD4+ T cells for IL-2 and exploit it for the induction of IL-10 production. Int Immunol (2005) 17(3):279–88. doi:10.1093/intimm/dxh207
32. Busse D, de la Rosa M, Hobiger K, Thurley K, Flossdorf M, Scheffold A, et al. Competing feedback loops shape IL-2 signaling between helper and regulatory T lymphocytes in cellular microenvironments. Proc Natl Acad Sci U S A (2010) 107(7):3058–63. doi:10.1073/pnas.0812851107
33. Chiacchio T, Casetti R, Butera O, Vanini V, Carrara S, Girardi E, et al. Characterization of regulatory T cells identified as CD4+CD25highCD39+ in patients with active tuberculosis. Clin Exp Immunol (2009) 156(3):463–70. doi:10.1111/j.1365-2249.2009.03908.x
34. Ivanov II, Zhou L, Littman DR. Transcriptional regulation of Th17 cell differentiation. Semin Immunol (2007) 19:409–17. doi:10.1016/j.smim.2007.10.011
35. Chiappini E, Della Bella C, Bonsignori F, Sollai S, Amedei A, Galli L, et al. Potential role of M. tuberculosis specific IFN-γ and IL-2 ELISPOT assays in discriminating children with active or latent tuberculosis. PLoS One (2012) 7(9):e46041. doi:10.1371/journal.pone.0046041
36. Bettelli E, Carrier Y, Gao W, Korn T, Strom TB, Oukka M, et al. Reciprocal developmental pathways for the generation of pathogenic effector TH17 and regulatory T cells. Nature (2006) 441(7090):235–8. doi:10.1038/nature04753
37. Geffner L, Yokobori N, Basile J, Schierloh P, Balboa L, Romero MM, et al. Patients with multidrug-resistant tuberculosis display impaired Th1 responses and enhanced regulatory T-cell levels in response to an outbreak of multidrug-resistant Mycobacterium tuberculosis M and Ra strains. Infect Immun (2009) 77(11):5025–34. doi:10.1128/IAI.00224-09
Keywords: tuberculosis, Treg, Th17, treatment, monitoring
Citation: Agrawal S, Parkash O, Palaniappan AN, Bhatia AK, Kumar S, Chauhan DS and Madhan Kumar M (2018) Efficacy of T Regulatory Cells, Th17 Cells and the Associated Markers in Monitoring Tuberculosis Treatment Response. Front. Immunol. 9:157. doi: 10.3389/fimmu.2018.00157
Received: 27 September 2017; Accepted: 17 January 2018;
Published: 05 February 2018
Edited by:
Juarez Antonio Simões Quaresma, Instituto Evandro Chagas, BrazilReviewed by:
Mario M. D’Elios, University of Florence, ItalySemih Esin, University of Pisa, Italy
Shashank Gupta, Brown University, United States
Kingston H. Mills, Trinity College, Dublin, Ireland
Copyright: © 2018 Agrawal, Parkash, Palaniappan, Bhatia, Kumar, Chauhan and Kumar. This is an open-access article distributed under the terms of the Creative Commons Attribution License (CC BY). The use, distribution or reproduction in other forums is permitted, provided the original author(s) and the copyright owner are credited and that the original publication in this journal is cited, in accordance with accepted academic practice. No use, distribution or reproduction is permitted which does not comply with these terms.
*Correspondence: M. Madhan Kumar, bWFkaGFuYmlvcGhpbGVAZ21haWwuY29t