Abstract
Background:
Maintenance of long-lasting immunity is thought to depend on stem cell memory T cells (TSCM), which have superior self-renewing capacity, longevity and proliferative potential compared with central memory (TCM) or effector (TEFF) T cells. Our knowledge of TSCM derives primarily from studies of virus-specific CD8+ TSCM. We aimed to determine if infection with Mycobacterium tuberculosis (M. tb), the etiological agent of tuberculosis, generates antigen-specific CD4+ TSCM and to characterize their functional ontology.
Methods:
We studied T cell responses to natural M. tb infection in a longitudinal adolescent cohort of recent QuantiFERON-TB Gold (QFT) converters and three cross-sectional QFT+ adult cohorts; and to bacillus Calmette–Guerin (BCG) vaccination in infants. M. tb and/or BCG-specific CD4 T cells were detected by flow cytometry using major histocompatibility complex class II tetramers bearing Ag85, CFP-10, or ESAT-6 peptides, or by intracellular cytokine staining. Transcriptomic analyses of M. tb-specific tetramer+ CD4+ TSCM (CD45RA+ CCR7+ CD27+) were performed by microfluidic qRT-PCR, and functional and phenotypic characteristics were confirmed by measuring expression of chemokine receptors, cytotoxic molecules and cytokines using flow cytometry.
Results:
M. tb-specific TSCM were not detected in QFT-negative persons. After QFT conversion frequencies of TSCM increased to measurable levels and remained detectable thereafter, suggesting that primary M. tb infection induces TSCM cells. Gene expression (GE) profiling of tetramer+ TSCM showed that these cells were distinct from bulk CD4+ naïve T cells (TN) and shared features of bulk TSCM and M. tb-specific tetramer+ TCM and TEFF cells. These TSCM were predominantly CD95+ and CXCR3+, markers typical of CD8+ TSCM. Tetramer+ TSCM expressed significantly higher protein levels of CCR5, CCR6, CXCR3, granzyme A, granzyme K, and granulysin than bulk TN and TSCM cells. M. tb-specific TSCM were also functional, producing IL-2, IFN-γ, and TNF-α upon antigen stimulation, and their frequencies correlated positively with long-term BCG-specific CD4+ T cell proliferative potential after infant vaccination.
Conclusion:
Human infection with M. tb induced distinct, antigen-specific CD4+ TSCM cells endowed with effector functions, including expression of cytotoxic molecules and Th1 cytokines, and displayed chemokine receptor profiles consistent with memory Th1/17 cells. Induction of CD4+ TSCM should be considered for vaccination approaches that aim to generate long-lived memory T cells against M. tb.
Introduction
Memory T cells have been classified into subsets, according to their phenotypes, functions and homing potential (1). Antigen-specific central memory T cells (TCM, CD45RA− CCR7+) have been considered the main mediators of maintenance and expansion of T cell immunity, following secondary antigen exposure, due to their ability to differentiate into effector T cells (TEFF, CD45RA− CCR7−), as well as their increased proliferative capacity and longevity compared with TEFF cells. This ontology of memory T cells has recently been revised to include a new subset termed stem cell memory T cells (TSCM). TSCM typically express CD45RA, CCR7, and CD27, and thus phenotypically resemble naïve T cells, but their co-expression of memory markers, such as CD95 and CXCR3, distinguish them from naïve T cells (2, 3). Functional characterization of antigen-specific TSCM has predominantly foc-used on viral, parasitic, and tumor-specific CD8 T cells, identified by major histocompatibility complex (MHC) class I tetramers, or by non-specific and/or antigen specific stimulation (2–6). These studies showed that TSCM characteristically possess excellent self-renewing capacity, longevity, proliferative capacity, relative to TCM and TEFF. Importantly, TSCM can also differentiate into TCM and/or TEFF cells (2). CD8+ TSCM are preferentially enriched in the absence of antigen (3), non-chronic states of infection (6) and among long-lived T cells induced by vaccination (7). CD8+ TSCM were also essential for the re-establishment of Ag-specific memory responses after T cell depletion in cancer patients (8, 9). As a result, TSCM T cells are considered as a potential target for vaccination against infectious diseases and T cell therapy for autoimmunity, that aim at inducing and maintaining long-lasting T cell immunity capable of replenishing all T cell memory subsets.
Animal models of tuberculosis (TB) and human studies show that CD4 T cells, and especially those that have differentiated into antigen-specific Th1 cells, are necessary for immunological control of the intracellular bacterium, Mycobacterium tuberculosis (M. tb) [reviewed in Ref. (10)]. Newborn vaccination against TB with the bacillus Calmette–Guerin (BCG) vaccine is efficacious against severe forms of TB, such as milliary and meningitic TB, in young children (11, 12). Efficacy of BCG against pulmonary disease after childhood is variable and mostly poor (13, 14). As a consequence, it has been proposed that waning of mycobacteria-specific T cell memory responses and insufficient maintenance of protective CD4+ T cells may underlie the limited durability of BCG-induced protection (15, 16).
Newborn BCG vaccination induces antigen-specific TCM and TEFF CD4+ T cell responses (17), but the role of CD4+ TSCM cells in immune responses induced by vaccination against TB, or by natural M. tb infection, in humans has not been explored. In fact, there is very limited knowledge about the functional capacity and persistence of CD4+ TSCM that are specific for bacterial antigens. We and others have reported that a considerable proportion of cytokine-expressing or tetramer+ mycobacteria-specific CD4+ T cells, in humans, displayed a memory phenotype characteristic of naïve T cells (CD45RA+ CCR7+), and termed them naïve-like CD4+ T cells (17–22). In a clinical trial that tested boosting of mycobacteria-specific responses with the TB vaccine candidate, MVA85A, low but detectable Ag85A-specific CD45RA+ CCR7+ CD27+ naive-like CD4+ T cell responses were observed before MVA85A vaccination and frequencies of these cells remained unchanged after vaccination (23). In addition, a murine study demonstrated that BCG-induced naïve-like (CD44lo CD62Lhi) memory cells played a role in the control of M. tb infection, where these cells were capable of replenishing effector (CD44hi CD62Llo) T cells with superior functional activity and protective potential against M. tb infection, compared with those originating from effector T cells (24). The characteristics of such mycobacteria-specific naïve-like CD4+ T cells are thus consistent with those of CD4+ TSCM cells.
We hypothesized that M. tb-specific CD4+ TSCM are induced by primary infection with M. tb in humans and aimed to determine the kinetics of their generation and to characterize gene expression (GE), homing potential and functional profiles of mycobacteria-specific CD4+ TSCM. Phenotypic and functional properties of M. tb-specific TSCM were compared with those of M. tb-specific TCM and TEFF, to determine their ontology. Our findings contribute to the current knowledge of the M. tb-specific T cell memory repertoire and highlight the need for a better understanding of CD4+ TSCM cells in natural M. tb infection, TB disease and vaccine-induced immune responses.
Materials and Methods
Study Participants
Consent forms and study protocols were approved by the Human Research Ethics Committee of the University of Cape Town (UCT HREC 126/2006, 045/2008, 179/2011, 013/2012, 753/2014). Healthy adults with a positive QuantiFERON Gold In-Tube (QFT) test (IFN-γ > 0.35 IU/mL) were recruited from the community living in the Worcester region of Western Cape, South Africa. All participants provided written informed consent. Inclusion criteria included age above 18 years, QFT-positive, HIV-seronegative, and no prior (self-reported) or current signs or symptoms suggestive of TB disease.
We also retrieved cryopreserved peripheral blood mononuclear cells (PBMC) from a subset of 12- to 18-year-old adolescent participants with evidence of newly acquired M. tb infection, from the longitudinal Adolescent Cohort Study (25). Parents or legal guardians of adolescents provided written informed con-sent and adolescents provided written informed assent. New M. tb infection was defined as a negative Tuberculin Skin Test (TST) (induration = 0 mm) and negative QFT test (IFN-γ < 0.35 IU/mL), followed by at least three positive QFT tests 6, 12, and 18 months later and a positive TST (induration > 10 mm) at 12 months.
We also performed new analyses of existing immune response data from healthy HIV-exposed but uninfected infant participants of a recently published clinical trial [see Ref. (26) for details; http://ClinicalTrials.gov NCT01650389]. Participants of this trial received either MVA85A vaccination or placebo (Candin®, AllerMed) at birth and, if confirmed HIV-PCR negative, BCG vaccination at 8 weeks of age, after which they were followed up for 44 weeks. Analyses reported here include only infants who received placebo at birth.
Blood Processing and Stimulation for Intracellular Cytokine Staining Assay
Peripheral blood mononuclear cells from adults were isolated by density gradient centrifugation (Ficoll histopaque, Lonza) from blood collected in sodium (Na)-heparin tubes (Greiner Bio-one) or heparinized blood bags. PBMC were analyzed fresh or cryopreserved in RPMI 1640 media (RPMI, Lonza) with 10% v/v dimethyl sulfoxide (DMSO, Sigma-Aldrich) and 45% v/v fetal bovine serum (Biochrom).
Whole blood intracellular cytokine staining (WB-ICS) assays were performed as described previously (26–28). Briefly, 1 mL whole blood was either left unstimulated (negative control) or stimulated with phytohemagglutinin (at 10 μg/mL, positive control), peptide pools of Ag85B, ESAT-6, or CFP-10 (all 15mer peptides, overlapping by 10 aa at 2 μg/mL, GenScript) or BCG (≈1.2 × 10⁶ CFU/mL, Statens Serum Institut) for 12 h or 7 days (BCG only, used at 1 × 10⁵ CFU/mL). Thereafter, red cells were lysed and white cells fixed using FACS-Lysing solution (BD Biosciences), before cryopreservation in 10% DMSO in fetal calf serum.
Flow Cytometry
Multiparameter flow cytometry panels were designed (Table S1 in Supplementary Material) to sort memory subsets as bulk or M. tb-tetramer+ CD4+ T cells (panel 1, Figure S1A in Supplemen-tary Material), measure M. tb-specific CD4+ T cell kinetics after M. tb infection (panel 2, Figure S1B in Supplementary Mater-ial), determine M. tb-specific CD4+ T cell chemokine receptor (panel 3, Figure S1C in Supplementary Material), cytotoxic molecule (panel 4, Figure S1D in Supplementary Material), and cytokine [panel 5, Figure S6A in Supplementary Material, see Ref. (28)] expression profiles. In addition, BCG vaccine-induced cytokine expression profiles [panel 6, see Ref. (26)] and proliferative capacity [panel 7, see Ref. (26)] of mycobacteria-specific CD4+ T cells were measured.
MHC Class II Tetramers
Major histocompatibility complex class II tetramers conjugated to PE and/or APC were kindly provided by the National Institutes of Health (NIH) tetramer core facility. To exclude detection of non-specific MHC class II tetramer binding to B cells, CD8 T cells, monocytes, and dead cells, we gated CD4+ T cells on CD8−, CD14−, CD19−, live cells by including antibodies conjugated to the same fluorochrome to these markers (collectively termed a dump channel) (Figure S1A–D in Supplementary Material). M. tb-tetramer+ CD4+ T cells were detected using MHC class II tetramers conjugated to the following mycobacterial peptides: Ag85 [DPB1*04:01-Ag85B128–144 (GKAGCQTYKWETFLTSE), DRB1*03:01-Ag85A56–75 (VPSPSMGRDIKVQFQSGGAN)], CFP-10 [DRB1*04:01-CFP-1071–85 (EISTNIRQAGVQYSR), DRB5*01:01-CFP-1051–65 (AQAAVVRFQEAANKQ)], and ESAT-6 [DQB1*06:02-ESAT631–45 (EGKQSLTKLAAAWGG)]. Non-specific tetramer staining was detected using MHC class II tetramers conjugated to human CLIP self-peptide, [DPB1*04:01-CLIP81–101 (PVSKMRMATPLLMQA), DQB1*06:02-CLIP81–101, DRB1*03:01-CLIP81–101, DRB1*04:01-CLIP81–101, and DRB5*01:01-CLIP81–101].
Flow Cytometry Staining Protocol for Sorting (Flow Cytometry Panel 1)
Cryopreserved PBMC were thawed into medium containing DNAse (50 IU/mL, Sigma-Aldrich), washed and stained with Violet or Aqua LIVE/DEAD Fixable Dead Cell Stain (Thermo-Fisher Scientific). Cells were then stained with anti-CCR7 anti-body at 37°C for 20 min, washed and then stained with 2 µg/mL MHC class II-CFP10 tetramers (DRB1*04:01-CFP-1071–85, DRB5*01:01-CFP-1051–65) at room temperature (RT) for 1 h. Cells were washed and stained with surface marker antibodies, according to Table S1 in Supplementary Material, for 40 min at RT in a total volume of 100 µL. Samples were acquired and sorted on a BD Bioscience FACS Aria I sorter using FACS DIVA software (Version 6).
Flow Cytometry Staining Protocol for PBMC (Panels 2–4)
Chemokine Receptor Staining
Cryopreserved or fresh PBMC were stained with antibodies to chemokine receptors (Table S1 in Supplementary Material) for 30 min at 37°C.
MHC Class II Tetramers Staining
During optimization experiments we noted that MHC class II tetramer staining of some samples yielded artifactual labeling which appeared to be fluorochrome-dependent. As a consequence, when necessary, PBMC were stained with two preparations of the identical tetramer, one conjugated to PE and the other to APC. This identified PE and APC double-positive cells, allowing rigorous identification of tetramer+ CD4+ T cells. Tetramer staining was performed using mycobacteria-specific tetramers at a concentration of 2 µg/mL per tetramer preparations for 1 h at RT.
Phenotypic Marker Staining
Peripheral blood mononuclear cells were stained with fluorescently labeled antibodies to phenotypic markers and viability dye, according to Table S1 in Supplementary Material, for 30 min at RT, before washing and fixation with 1% paraformaldehyde (Kimix).
Intracellular Cytotoxic Molecule Staining
To stain for cytotoxic molecules, PBMC were fixed and permeabilized using the BD CytoxFix/Perm (BD Biosciences) according to the manufacturer’s protocol. Permeabilized PBMC were then stained with fluorescently labeled antibodies to cytotoxic molecules, according to Table S1 in Supplementary Material, for 30 min at RT. This was followed by washing and fixation. Samples were acquired on a BD Bioscience LSRFortessa using FACS DIVA software (Version 8).
Flow Cytometry Staining Protocol for Whole Blood Intracellular Cytokine (WB-ICS) Assay (Panels 5–7)
Cryopreserved, fixed cells from the whole blood stimulation were thawed, permeabilized using Perm/Wash Solution (BD Biosciences), washed and stained with anti-CCR7 at 37°C for 20 min, followed by addition of the remaining antibodies, and staining on ice for 40 min.
High Throughput Microfluidic RT-qPCR on Sorted T Cells
Thirty cells (MHC class II tetramer+ or bulk CD4+ T cells from each memory subset) were sorted into PCR tubes containing 5 µL CellsDirect 2× reaction mix, 0.5 µL SuperScript™ III RT/Platinum® Taq mix, 2.5 µL of pooled TaqMan GE primer-probe assays (at a concentration of 0.2× per assay), and 1 µL TE buffer (10 mM Tris, pH 8.0, and 0.1 mM EDTA). Selection of TaqMan assays was based on published literature of transcriptional profiles of T cell memory subsets (Table S2 in Supplementary Material). The amplification efficiency of each TaqMan GE assay was assessed as previously described (29) and found to be close to 100% (±10%, data not shown). Specific transcript amplification (STA) was performed using the following thermal profile: 20 min at 50°C to lyse cells and perform cDNA synthesis, followed by 2 min at 95°C, then 18 cycles of 95°C for 15 s and 60°C for 4 min. STA-cDNA samples were diluted fivefold and loaded onto a 96.96 Dynamic Array chip (Fluidigm) with TaqMan GE assays for qPCR using a BioMark HD System (Fluidigm) according to the manufacturer’s protocol.
Data Analysis
Flow cytometry data was analyzed using FlowJo (Tree Star) versions v9.7 to v10.1r.1, Pestle version 1.8, and SPICE version 5.2–5.3 (30).
Threshold cycle (Ct) values were determined by the BioMark Real-time PCR Analysis software using linear derivative background correction and an amplification curve quality threshold of 0.65. We excluded data from sorted CD4+ T cells with undetectable levels (i.e., Ct = 40) of CD4 and/or B2M from our analyses. For ease of interpretation, Ct values were transformed to Et values (40 − Ct), because a higher Et value indicates higher mRNA levels. Relative mRNA transcript levels (delta Et) in tetramer+ CD4+ T cells were derived by subtracting the B2M Et value from the Et values of the genes of interest, and average delta Et values were calculated from duplicate STA-cDNA samples.
The lower detection limit for tetramer+ CD4 T cells measured by flow cytometry panels 2–4 (0.0021% of CD4+ T cells) was calculated as the median frequency of negative control tetramer+ CD4 T cells plus the 95% confidence interval of the median absolute deviation of negative control tetramer proportions. In addition, frequencies of tetramer+ CD4+ T cells had to be at least fivefold higher than frequencies of the corresponding control tetramer+ CD4+ T cells. Chemokine and cytotoxic molecule expression profiles were assessed for cell subsets comprising 20 or more cells (e.g., tetramer+ TCM or TEFF cells).
Antigen-specific cytokine+ cells expressing a TSCM (CD45RA+ CCR7+) phenotype detected in the WB-ICS assay (panel 5) were typically very infrequent, and in some donors less than 10 cells of this subset were detected per sample upon background subtraction. As a result, we did not perform in-depth cytokine co-expression or Boolean analyses, and we report frequencies of CD4+ TSCM cells that express IFN-γ, TNF-α, and IL-2 in unstimulated and antigen-stimulated samples.
Statistical analyses were performed using GraphPad Prism v6/7, R version 3.0.1 or SPICE version 5.2–5.3 (30). Specific statistical analyses are clearly defined where applicable. Differences in mRNA transcript expression between CD4+ T cell populations were computed using the Kruskal–Wallis or Mann–Whitney tests at a p-value threshold of 0.05 and a false discovery rate (FDR) threshold of 0.05 [Benjamini–Hochberg method (31)]. Principal component analysis (PCA) plots and heat maps were generated using the prcomp and heatmap.2 functions in R. Differences in protein expression were computed using Kruskal–Wallis or Mann–Whitney tests. The Bonferroni and Benjamini–Hochberg (FDR < 0.05) methods were used to correct for multiple comp-arisons for up to four comparisons or more than four comparisons, respectively. Differences in pie charts depicting chemokine receptor and cytotoxic molecule co-expression profiles were calculated using non-parametric permutation test comparing the overall distribution between subset proportions using SPICE (30).
Results
CD45RA+ CCR7+ CD27+M. tb-Tetramer+ CD4 T Cells Are Not Naïve CD4 T Cells
We previously observed mycobacteria-specific CD4+ T cells that expressed a CD45RA+ CCR7+ naïve phenotype but exhibited features not consistent with TN, which we termed “naïve-like” CD4+ T cells. In four studies, we showed that these “naïve-like” CD4+ T cells expressed Th1 cytokines (17–20), functions characteristic of antigen-experienced T cells. Also, in another study (23), we detected “naïve-like” CD4+ T cells by MHC class II tetramer staining at frequencies that exceeded those typical of TN, at 1–5 cells/million CD4 T cells (32–34). We hypothesized that such mycobacteria-specific naïve-like CD4+ T cells are TSCM cells and performed GE profiling of sorted CFP10-specific tetramer+ CD4 T cells that displayed such a naive memory phenotype (CD45RA+ CCR7+ CD27+, naïve-like memory cells, TNLM) from seven healthy, M. tb-infected donors with HLA alleles that corresponded to our tetramer reagents. Refer to Supplementary Information for the rationale for using MHC class II tetramers. We also sorted and profiled GE of tetramer+ TCM (CD45RA− CCR7+ CD27+) and TEFF (CD45RA− CCR7−) CD4 T cells as well as bulk naïve, TSCM, TCM and TEFF CD4 T cells (Figure S1A in Supplementary Material). Because less than 50% of the tetramer+ TNLM CD4 T cells expressed CD95, as also shown previously (23), we focused on CD95- tetramer+ TNLM cells. One participant did not have detectable tetramer+ TNLM CD4 T cells.
Twenty-two mRNA transcripts were differentially expressed between the bulk (not M. tb-specific) TN, TSCM, TCM, and TEFF CD4+ T cell subsets at a p-value of <0.05 and FDR of ≤0.05 (data not shown). These bulk memory subsets could readily be distinguished from each other by PCA (Figure 1A) of these 22 transcripts. When the component loadings from principal components 1 and 2 were applied to the M. tb-specific tetramer+ cell subset data, CFP10-tetramer+ TNLM cells clustered with bulk CD4+ TSCM cells and were distinct from bulk CD4+ TN cells (Figure 1A). Unsupervised hierarchical clustering based on expres-sion of these 22 transcripts also showed that CFP10-tetramer+ TNLM cells clustered with bulk CD4+ TSCM cells, and expressed transcripts associated with antigen-experienced cells, such as TNF-α, IFN-γ, perforin, granulysin, granzyme A and K, CCL5 (RANTES), CCR4, and CCR5. By contrast, bulk CD4+ TN cells did not express these transcripts and formed a discrete cluster (Figure 1B).
Figure 1
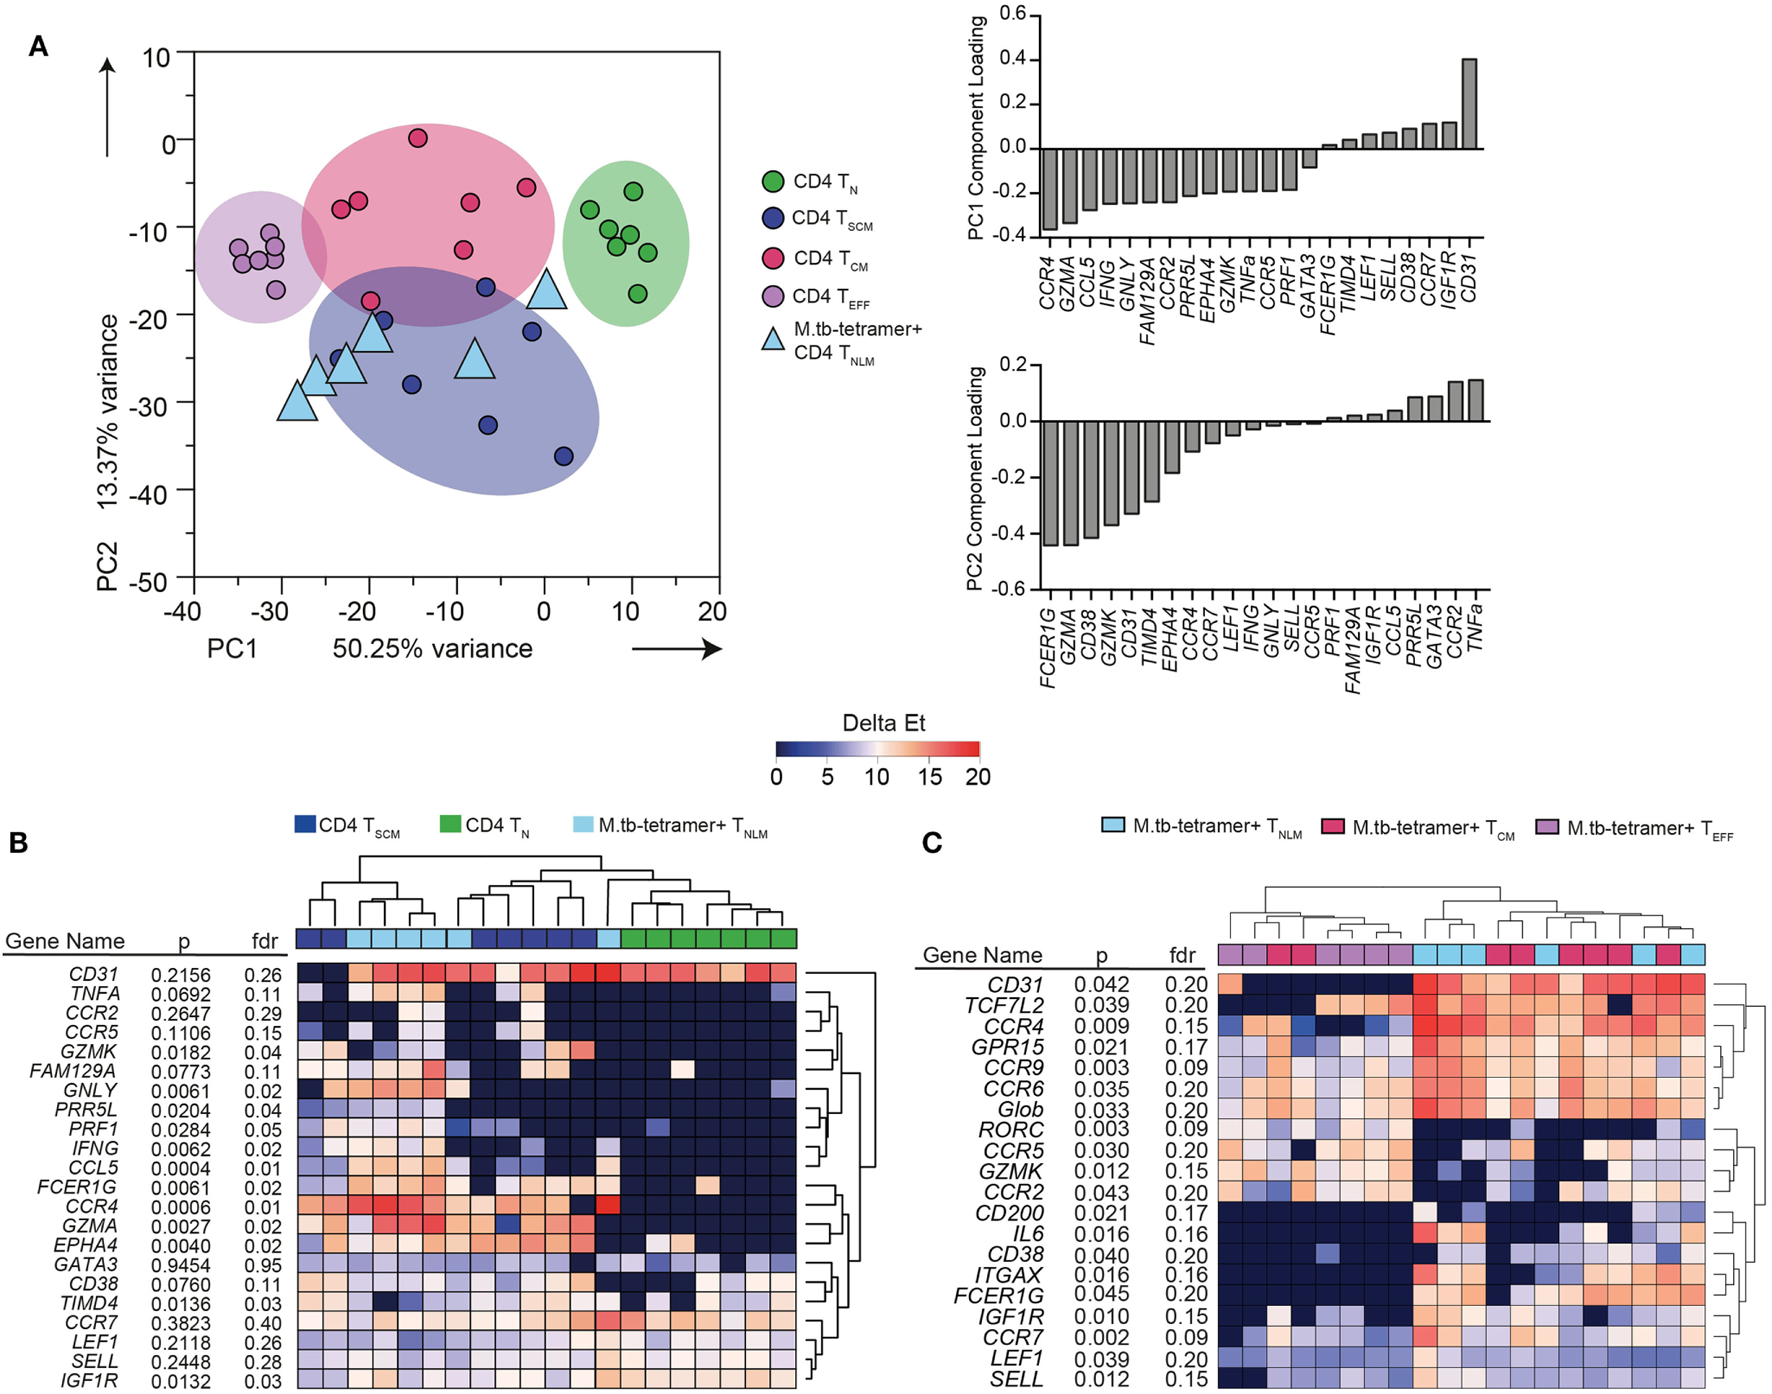
Transcriptional profile of Mycobacterium tuberculosis (M. tb)-specific TSCM. Expression of 96 genes was measured by microfluidic qRT-PCR on bulk or M. tb-tetramer+ CD4+ T cells expressing a naïve (TN, CD45RA+ CCR7+ CD27+ CD95−, labeled as naïve-like memory TNLM for M. tb-tetramer+), TSCM (CD45RA+ CCR7+ CD27+ CD95+, bulk CD4+ cells only), TCM (CD45RA− CCR7+ CD27+), or TEFF (CD45RA− CCR7−) phenotype, sorted from M. tb-infected adults (n = 7). Analyses shown in this figure were built on transcripts (22 mRNA) that were differentially expressed [Kruskal–Wallis H test p < 0.05 and false discovery rate (FDR) < 0.05] between bulk CD4+ TN, TSCM, TCM, and TEFF cells. (A) Principal component analysis (PCA) of sorted bulk TN (green), TSCM (indigo), TCM (magenta), and TEFF (purple). PCA loadings—PC1 and PC2—defined on bulk CD4+ subsets were applied to M. tb-tetramer+ TNLM (light blue triangles) CD4+ T cells. (B) Unsupervised heat map of 22 transcripts differentially expressed between bulk TN, TSCM, TCM, and TEFF subsets. Bulk TN, TSCM, and M. tb-tetramer+ TNLM represented as green, indigo, and light blue, respectively. Gene expression (GE) is reported as delta Et values [40 − threshold cycle (Ct) values]. (C) Supervised heat map of 20 transcripts differentially expressed (Kruskal–Wallis H test p < 0.05 and FDR < 0.2) between M. tb-tetramer+ TNLM (light blue), TCM (magenta), and TEFF (purple) CD4 T cell subsets. GE is reported as delta Et values (40 − Ct values).
Next, we determined whether CFP10-tetramer+ TNLM exhibited a transcriptional profile distinct from M. tb-specific tetramer+ CD4+ TCM and TEFF memory subsets. We compared the mRNA expression between the three M. tb-specific tetramer+ CD4+ T cell subsets and selected 20 mRNA transcripts (p < 0.05 and FDR ≤ 0.2) for cluster analysis (Figure 1C). Unsupervised hierarchical clustering (Figure 1C) and PCA analysis (Figure S2 in Supplementary Material) revealed substantial overlap in GE between the CFP10-tetramer+ cell subsets, although CFP10-tetramer+ TNLM appeared to cluster more closely with TCM cells than TEFF cells.
Since the GE profiles of M. tb-specific CD4+ cells with a naïve phenotype (CD45RA+ CCR7+ CD27+) were distinct from TN cells and consistent with antigen-experienced, bulk TSCM, we concluded that these cells are M. tb-specific CD4+ TSCM cells.
M. tb-Specific TSCM Cells Are Induced by Primary M. tb Infection
We next determined whether antigen-specific CD4+ TSCM cells are induced during primary M. tb infection. We retrieved stored PBMC collected from adolescents before and after M. tb infection, as determined by negative QFT and TST tests, with subsequent test conversion at 6- and 12-month intervals, respectively (Figure 2A). To track M. tb-specific CD4 T cells during acquisition of M. tb infection, we utilized MHC class II tetramers loaded with peptides of the M. tb complex-specific antigens, CFP-10 and ESAT-6. Dual staining with PE and APC-conjugated tetramers improved staining specificity (Figure 2B; Figure S3A in Supplementary Material). Frequencies of M. tb-tetramer+ CD4+ T cells were below the limit of reliable detection before M. tb infection in 11 out of 12 participants and increased significantly upon QFT conversion 6 months later, when this response also peaked. Thereafter, frequencies of M. tb-tetramer+ CD4+ T cells decreased but were maintained at detectable levels throughout established M. tb infection, at months 12 and 18 (Figure S3B in Supplementary Material).
Figure 2
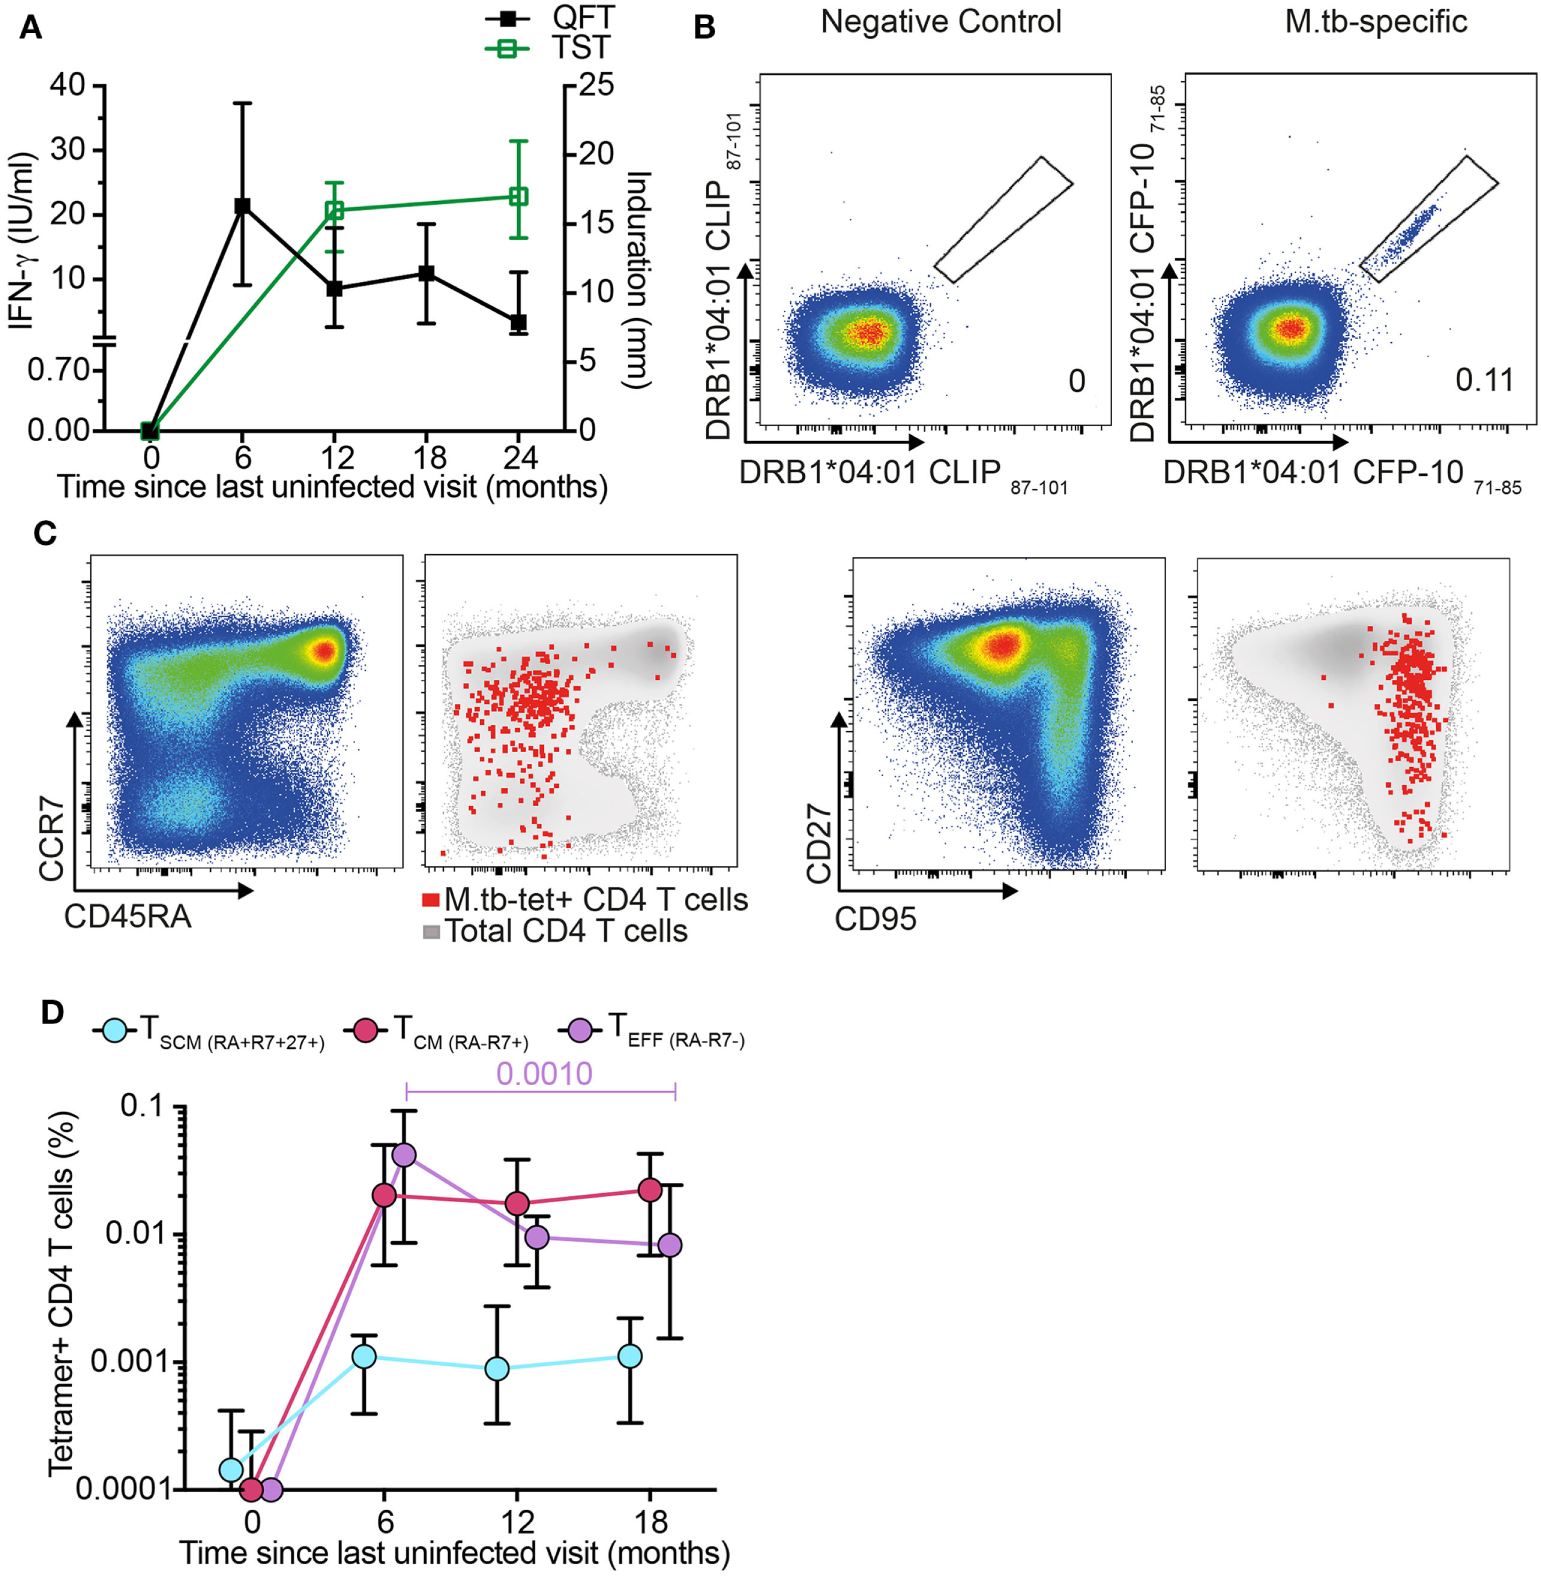
Mycobacterium tuberculosis (M. tb)-specific TSCM are detected in recently M. tb-infected adolescents. (A) Median (error bars denote IQR) of Tuberculin Skin Test (TST) and QuantiFERON-TB Gold In-Tube (QFT) performed at the indicated time points. A 5 mm and 0.35 IU/ml cutoff were used to define positive TST and QFT, respectively (n = 19 participants). (B) Representative flow cytometry plots showing peripheral blood mononuclear cells staining with two identical major histocompatibility complex (MHC) class II tetramers conjugated to PE and APC to detect CD4+ T cells specific for CFP-10. Tetramers matched by MHC allele but loaded with a self-peptide were used as negative control. Number indicates percentage of tetramer+ CD4 T cells. (C) Representative flow cytometry plots for memory markers CD45RA, CCR7, CD27, and CD95 gated on bulk (pseudo-color and gray) and M. tb-specific CD4+ T cells (red dots). (D) Median (error bars denote IQR) frequencies of M. tb-specific TSCM (CD45RA+ CCR7+ CD27+, light blue), TCM (CD45RA− CCR7+, magenta), and TEFF (CD45RA− CCR7−, purple) during primary M. tb infection (n = 12 participants).
Frequencies of M. tb-specific tetramer+ TSCM (CD45RA+ CCR7+ CD27+), TCM (CD45RA− CCR7+), and TEFF (CD45RA− CCR7−) were below the limit for reliable detection at enrollment (month 0), demonstrating that circulating M. tb-specific TN are too rare to detect by direct ex vivo tetramer staining (Figures 2C–D). After M. tb infection all three M. tb-specific memory subsets increased to detectable levels and remained detectable throughout established infection (Figure 2D). Interestingly, frequencies of M. tb-specific TSCM and TCM remained relatively consistent throughout primary and established M. tb infection, while M. tb-specific TEFF peaked during the primary M. tb infection phase (month 6) and thereafter steadily decreased (Figure 2D). These data suggest that M. tb-specific TSCM are induced by M. tb infection and maintained at low but consistent levels in the peripheral blood once M. tb infection has been established.
M. tb-Specific TSCM Express Chemokine Receptor and Cytotoxic Profiles Distinct from Bulk TN and TSCM CD4 T Cells
Our transcriptomic analysis showed that bulk CD4+ TSCM and M. tb-specific TSCM cells expressed chemokine receptor and cytotoxic molecule transcripts, which were mostly undetectable in bulk TN cells (Figure 1B). Chemokine receptors mediate tissue homing and allow classification of memory CD4 cells into Th1, Th2, and Th17 lineages (35–37). Expression of cytotoxic mediators by CD4+ T cells indicates highly differentiated cells typically associated with high antigen exposure and effector T cell properties (38). We sought to validate our transcriptomic findings by measuring protein expression in an independent cohort of M. tb-infected (QFT+) adults. Expression of CCR4, CCR5, CCR6, and CXCR3 and cytotoxic molecules granzyme A, B, and K, granulysin, and perforin by M. tb-specific TSCM (CD45RA+ CCR7+ CD27+) cells was compared with bulk TN (CD45RA+ CCR7+ CD27+ CD95−) and TSCM (CD45RA+ CCR7+ CD27+ CD95+) cells (Figure 3; Figures S1C,D in Supplementary Material).
Figure 3
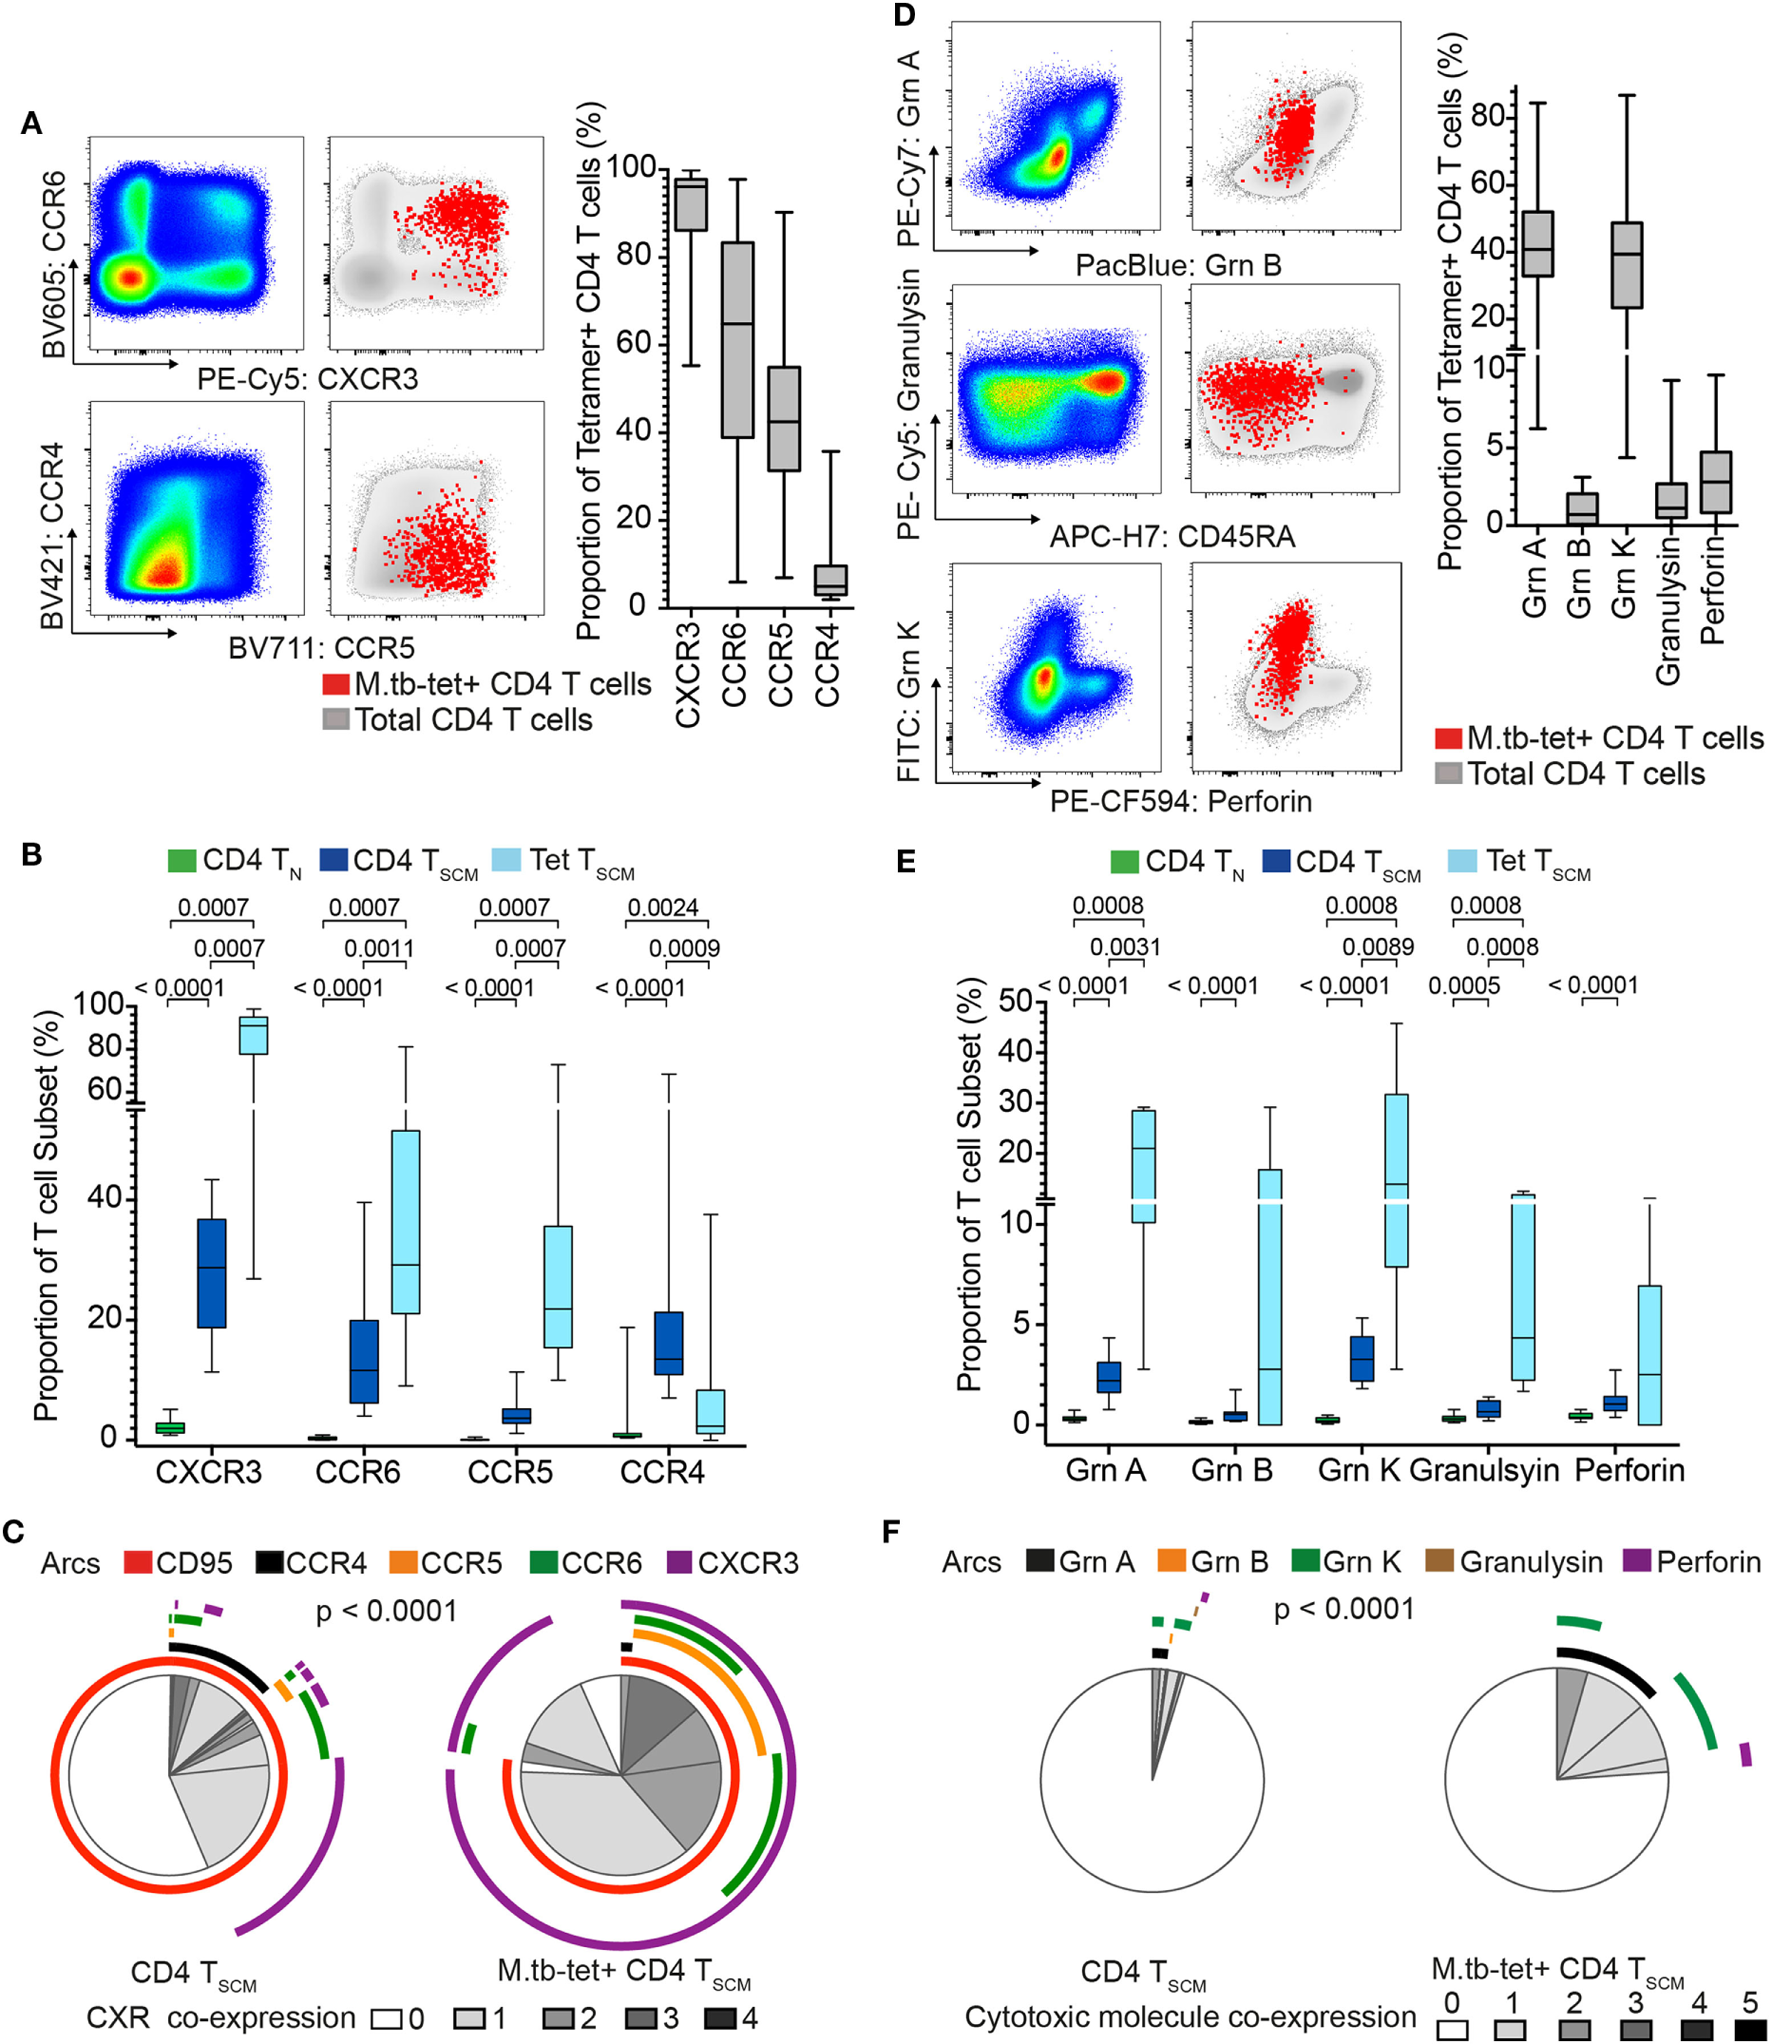
Mycobacterium tuberculosis (M. tb)-specific TSCM are not TN and express distinct homing and cytotoxic profiles from bulk TSCM. Expression of chemokine receptors and cytotoxic molecules was measured in remotely M. tb-infected (QFT+) adults (n = 28) when at least 20 events were detected in each tetramer+ memory subset. (A) Representative flow cytometry plots of chemokine receptor expression on bulk (pseudo-color and gray) and M. tb-specific (red dots) CD4+ T cells. Box and whisker plots represent the median proportion, IQR, and range of expression of chemokine receptor (n = 28). (B) Box and whisker plot depicting the proportion of chemokine receptor-expressing bulk TN (CD45RA+ CCR7+ CD27+ CD95−, n = 28, green), TSCM (CD45RA+ CCR7+ CD27+ CD95+, n = 28, blue), and M. tb-specific TSCM (CD45RA+ CCR7+ CD27+, n = 15, light blue) CD4+ T cells. p-Values were calculated using Wilcoxon signed-rank test and corrected for multiple comparison using the Benjamini–Hochberg method with an false discovery rate (FDR) of 0.05. Adjusted p-values <0.05 were considered significant. (C) Pie chart showing the median proportions (slices) of bulk TSCM (n = 28) and M. tb-specific TSCM (n = 15) CD4+ T cells co-expression of CD95, CCR4, CCR5, CCR6, and/or CXCR3, denoted by arcs. p-Value was calculated using non-parametric permutation test comparing the overall distribution between pies. (D) Representative flow cytometry plots of cytotoxic molecule expression on total (pseudo-color and gray) and M. tb-specific (red dots) CD4+ T cells. Box and whisker plots represent the median proportion, IQR, and range of expression of cytotoxic molecules (n = 20). (E) Proportion of granzyme (grn) A, grnB, grnK, granulysin, and perforin expression in bulk TN (n = 20, green), TSCM (n = 20, blue), and M. tb-specific TSCM (n = 5, light blue) CD4+ T cells. p-Values were calculated with the Mann–Whitney test, corrected for multiple comparisons with the Benjamini–Hochberg method with an FDR of 0.05. Adjusted p-values <0.05 were considered significant. (F) Pie chart showing the median proportions (slices) of bulk TSCM (n = 20) and M. tb-specific TSCM (n = 5) CD4+ T cells co-expression grnA, grnB, grnK, granulysin, and/or perforin, denoted by arcs. p-Value was calculated using non-parametric permutation test comparing the overall distribution between pies.
Virtually, all M. tb-tetramer+ CD4+ cells expressed CXCR3 (median and IQR: 96.2 and 86.2–97.8%), with relatively high proportions also expressing CCR5 and CCR6 (Figure 3A). A very small proportion of tetramer+ CD4 T cells expressed CCR4 (Figure 3A). By contrast, expression of these chemokine receptors was negligible or not detected on bulk TN as expected of naïve cells (Figure 3B), while CXCR3, CCR6, and CCR5 were expressed by a small proportion of bulk TSCM (Figure 3B). Co-expression of these chemokine receptors by bulk TSCM and M. tb-specific TSCM revealed interesting patterns. Bulk TSCM cells mostly expressed only a single chemokine receptor, whereas M. tb-specific TSCM displayed more diverse co-expression profiles with single (CXCR3+), double (CCR5+ CXCR3+ or CCR6+ CXCR3+) and a small proportion of triple (CCR5+ CCR6+ CXCR3+) positive cells (Figure 3C). Importantly, a small subset of M. tb-specific TSCM and >50% of bulk TSCM did not express any of the chemokine receptors (Figure 3C), a profile suggesting early T cell differentiation (36). Virtually, all M. tb-specific CD4 TSCM cells expressed CXCR3, while CD95, a typical marker of CD8 TSCM cells (4, 39), was expressed by approximately 75% of tetramer+ CD4+ TSCM cells (Figure 3C)—refer to Supplementary Material for factors that affected CD95 expression in our experiments (Figure S4 in Supplementary Material).
Approximately 40% (range: 4.38–86.9%) of M. tb-tetramer+ CD4 T cells expressed granzyme A and/or K. Very few M. tb-tetramer+ CD4 T cells expressed granzyme B, granulysin, or perforin (Figure 3D). Interestingly, about a quarter of M. tb-specific CD4+ TSCM expressed cytotoxic molecules, also dominated by granzyme A and K. These were generally not co-expressed by M. tb-specific CD4+ TSCM. By contrast, bulk TSCM expressed very low levels of cytotoxic molecules (Figures 3E,F).
Increased expression of some chemokine receptors and cytotoxic molecules by M. tb-specific TSCM compared with bulk TSCM suggested that M. tb-specific TSCM are more phenotypically differentiated than bulk TSCM. We thus also compared chemokine receptor and cytotoxic molecule expression patterns by M. tb-specific TSCM with bulk TCM (CD45RA− CCR7+ CD27+) and TEFF (CD45RA− CCR7−CD27−) cells (Figures S5A,B in Supplementary Material). M. tb-specific TSCM expressed higher levels of CXCR3 than both bulk TCM and TEFF cells, further supporting their TSCM identity. Surprisingly, M. tb-specific TSCM had similar expression levels of CCR5 and CCR6 to bulk TEFF cells, but significantly lower expression of CCR4 than bulk TCM or TEFF cells (Figure S5A in Supplementary Material). M. tb-specific TSCM also expressed significantly higher levels of granzyme A and K than bulk TCM (Figure S5B in Supplementary Material). However, TSCM expressed lower levels of all cytotoxic molecules except granzyme K than bulk TEFF cells. These data further support the finding that M. tb-specific TSCM cells are antigen-experienced memory cells with unique phenotypic and functional attributes that distinguish them from bulk TSCM cells, and are more similar to highly differentiated bulk TCM and TEFF cells.
M. tb-Specific CD4 TSCM Are Less Differentiated than M. tb-Specific TCM and TEFF CD4 T Cells
We then compared the expression of chemokine receptors and cytotoxic molecules between M. tb-specific tetramer+ CD4+ TSCM cells and the other tetramer+ CD4+ T cell memory subsets. Virtually all cells among the three M. tb-specific memory subsets expressed CXCR3, as has been previously reported for M. tb-specific CD4+ T cells, although TCM displayed the highest proportion of CXCR3+ cells, compared with M. tb-specific TSCM and TEFF cells (Figure 4A). A significantly lower proportion of M. tb-specific TSCM expressed CCR6 than either M. tb-specific TCM or TEFF cells, while a minority of M. tb-specific TSCM and TCM expressed CCR5 or CCR4. As expected, virtually all M. tb-specific TEFF cells were CCR5+ and CCR4−. An increase from single to triple chemokine receptor co-expression profiles was observed when M. tb memory cells were ordered according to their expected differentiation sequence, from TSCM to TCM to TEFF cells (Figure 4B; Figure S5A in Supplementary Material). This was also observed when expression of the cytotoxic molecules granzyme A and K was assessed. Proportions of M. tb-specific TSCM cells expressing granzyme A and/or K were lower than TCM expressing these cytotoxic molecules, which in turn were lower than M. tb-specific TEFF cells (Figure 4C). Proportions of M. tb-specific TEFF expressing both granzyme A and K were also higher than those observed in M. tb-specific TCM and TSCM CD4+ T cells (Figure 4D; Figure S5B in Supplementary Material).
Figure 4

Mycobacterium tuberculosis (M. tb)-specific TSCM display early memory tissue homing and cytotoxic profiles. Expression of chemokine receptors and cytotoxic molecules was measured in remotely M. tb-infected (QFT+) adults (n = 28) when at least 20 events were detected in each tetramer+ memory subset. (A) Box and whiskers plots depicting the proportion of chemokine receptors expression of M. tb-specific TSCM (n = 15, light blue), TCM (n = 27, magenta), and TEFF (n = 23, purple) CD4+ T cells. p-Values were calculated using Wilcoxon signed-rank test and corrected for multiple comparison using the Benjamini–Hochberg method with a false discovery rate (FDR) of 0.05. Adjusted p-values <0.05 were considered significant. (B) Pie chart showing the median proportions (slices) of M. tb-specific TSCM (n = 15), TCM (n = 27), and TEFF (n = 23) CD4+ T cells co-expression of CD95, CCR4, CCR5, CCR6, and/or CXCR3, denoted by arcs. p-Values were calculated using non-parametric permutation test comparing the overall distribution between pies. (C) Box and whiskers plots depicting the proportion of grnA, grnB, grnK, granulysin, and perforin expression in M. tb-specific TSCM (n = 5, light blue), TCM (n = 19, magenta), and TEFF (n = 17, purple) CD4+ T cells. p-Values were calculated using Mann–Whitney test and corrected for multiple comparison using the Benjamini–Hochberg method with an FDR of 0.05. Adjusted p-values <0.05 were considered significant. (D) Pie chart showing the median proportions (slices) of M. tb-specific TSCM (n = 5), TCM (n = 19), and TEFF (n = 17) CD4+ T cells co-expression of grnA, grnB, grnK, granulysin, and/or perforin, denoted by arcs. p-Values were calculated using non-parametric permutation test comparing the overall distribution between pies.
Taken together, these data show that M. tb-specific TSCM pos-sess the least differentiated M. tb-specific phenotypic and functional profile, and suggest that M. tb-specific TCM cells appear as an intermediate subset before cells differentiate into M. tb-specific TEFF CD4+ T cells.
M. tb-Specific TSCM CD4 T Cells Express Th1 Cytokines
Studies of CD8+ (and CD4+) TSCM have shown that TSCM have limited cytokine expression capacity that is dominated by IL-2 and TNF-α in responses to non-specific stimulation (2, 3, 5). To determine if this is also true for mycobacteria-specific TSCM, we re-analyzed available data from stimulated whole blood (WB-ICS, Figure S6A in Supplementary Material) from a previously published cohort of QFT+ adults (28). Significantly higher frequencies of IFN-γ, TNF-α, or IL-2 cytokine-expressing CD4 TSCM cells, defined as CD45RA+ CCR7+, were detected in blood stimulated with BCG, or peptide pools spanning either Ag85B or CFP-10, compared with unstimulated blood (Figure 5)—refer to Supplementary Information for the justification for using CD45RA+ CCR7+ as a marker for TSCM by cytokine-expressing CD4+ T cells (Figure S7 in Supplementary Material). This was, however, not observed in blood stimulated with ESAT-6.
Figure 5

Mycobacterium tuberculosis (M. tb)-specific TSCM express Th1 cytokines. Fresh whole blood from remotely M. tb-infected (QFT+) adults (n = 13) was left unstimulated (gray) or stimulated with peptide pools spanning M. tb antigens, Ag85B (green), ESAT-6 (orange), or CFP-10 (purple), or whole bacillus Calmette–Guerin (red) for 12 h. Box and whisker plots depict frequencies of CD4+ TSCM (RA+ R7+) T cells expressing IFN-γ (A), TNF-α (B), or IL-2+(C). p-Values were calculated using the Wilcoxon matched pairs test, and p-values <0.0125 were considered significant (corrected for multiple testing using the Bonferroni method).
In summary, cytokine production by mycobacteria-specific CD4+ TSCM cells is not restricted to IL-2 but includes TNF-α and IFN-γ.
BCG-Specific TSCM Cell Frequencies Are Associated with CD4+ T Cell Proliferative Capacity
A key feature of TSCM is long-term maintenance of proliferative capacity in the absence of antigenic stimulation (2). To determine whether vaccine-induced CD4+ TSCM contribute to T cell long-term proliferative potential, we analyzed available data from a recently completed clinical trial in infants, who received BCG vaccination (26). Frequencies of BCG-specific CD4+ TSCM and TCM cells, but not TEFF cells, positively correlated with proliferative potential of BCG-stimulated CD4+ T cells 10 months after BCG vaccination (Figure 6). These results suggest that vaccine-induced TSCM contribute to long-term memory and proliferative capacity of the vaccine-induced T cell response to mycobacteria.
Figure 6
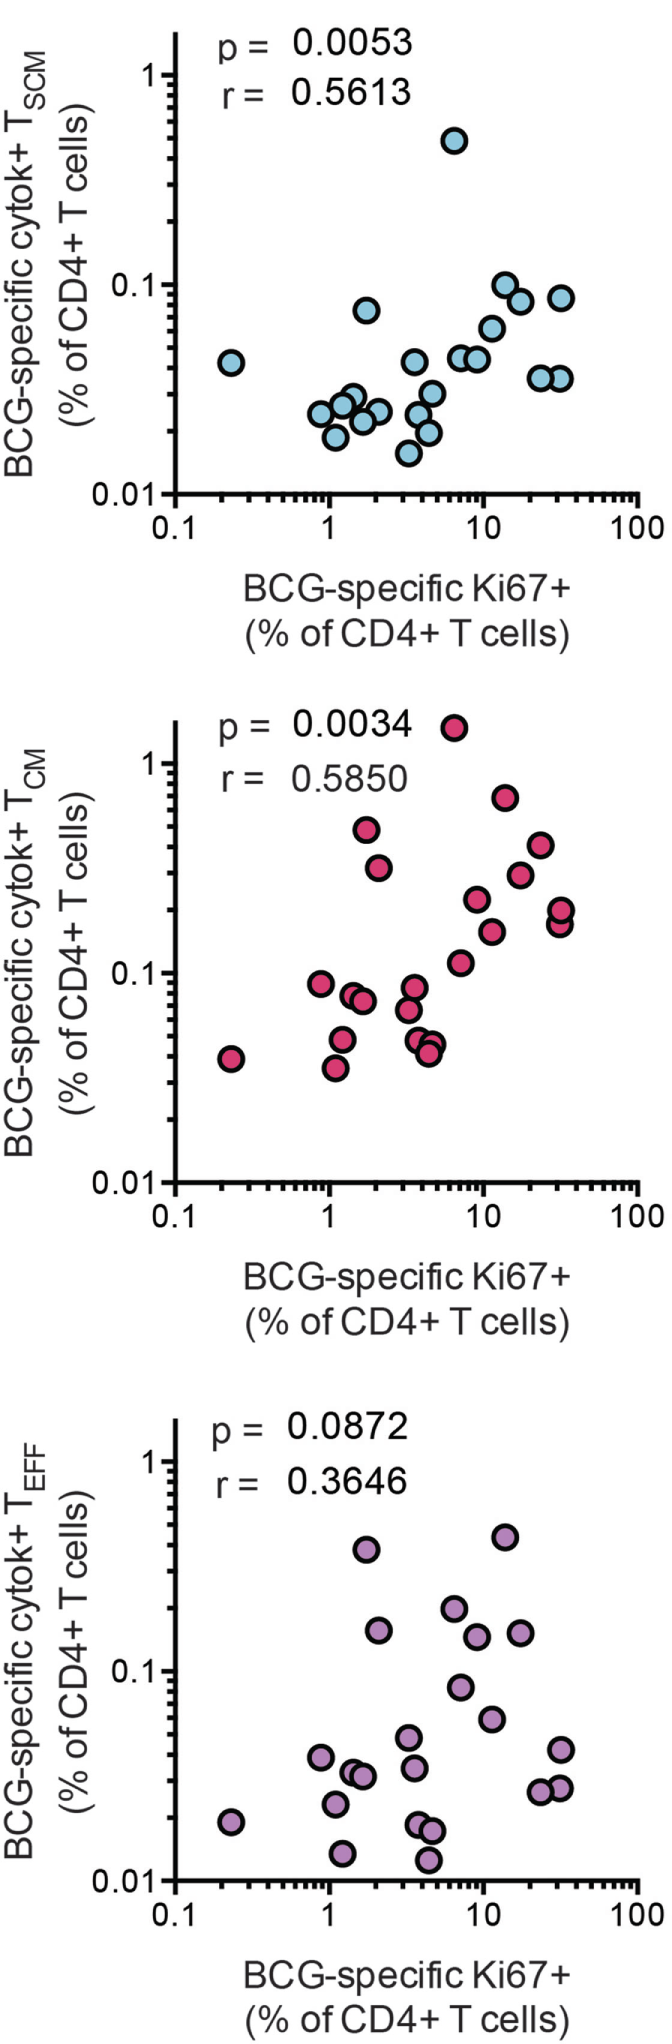
Bacillus Calmette–Guerin (BCG)-specific TSCM are associated with long-term CD4+ T cell proliferation after vaccination. Whole blood from 1-year-old infants (n = 23) was stimulated with BCG for 12 h to measure the frequencies of cytokine-producing TSCM (CD45RA+, CCR7+), TCM (CD45RA−, CCR7+), and TEFF (CD45RA−, CCR7−). In parallel, whole blood was stimulated with BCG for 7 days, and the frequency of proliferating CD4+ cells was assessed by upregulation of Ki-67. Correlations between the frequencies of BCG-specific CD4+ memory T cell subsets and those of proliferating CD4+ T cells were calculated by Spearman test 10 months postvaccination.
Discussion
We performed in-depth analyses of the kinetics, phenotype and functional characteristics of M. tb-specific CD4+ TSCM cells during natural M. tb infection. Our data show that CD4+ TSCM induced by M. tb infection in humans, predominantly express CD95 and CXCR3, are distinct from naïve T cells and possess phenotypic and functional profiles consistent with M. tb-specific CD4+ T cells at an early stage of differentiation (36). These data supplement our current knowledge of TSCM cells, which has primarily been derived from studies of virus-specific CD8 T cells (2–4, 7).
CD4+M. tb-specific TSCM were induced during primary M. tb infection and maintained throughout established M. tb infection at low frequencies. This phenomenon is highly characteristic of the stem cell nature of long-term memory cells such as TCM and potentially TSCM cells, where asymmetrical cell division maintains both the overall proportions of these memory cells and the pool of more differentiated effector memory subsets (40, 41).
The transcriptomic profile of M. tb-specific TSCM cells overlapped substantially with bulk CD4+ TSCM. However, protein expression of chemokine receptors and cytotoxic molecules distinguished bulk from M. tb-specific TSCM. Our data show that M. tb-specific TSCM cells possess unique phenotypic and functional profiles that share more similarities with bulk TCM and TEFF memory cells than bulk TSCM cells. This might suggest that M. tb-specific TSCM are exposed to chronic antigen stimulation, which is probably not the case for all TSCM specific for other pathogens, resulting in a more differentiated chemokine and cytotoxic molecules expression pattern. Whether this increased phenotypic differentiation profile is unique to M. tb-specific CD4 TSCM cells requires further investigation. Consistent with published findings (21), we found that M. tb-specific cells were predominantly CXCR3+, a Th1 associated chemokine receptor (42). This was accompanied with relatively high CCR5 and CCR6 expression, chemokine receptors associated with activation (43) and Th1/17 T cells (44), respectively, but low expression of the Th2 associated CCR4 (42). The predominant CXCR3 expression by M. tb-specific TSCM is suggestive of Th1 lineage, which we confirmed on a functional level by showing that mycobacteria-specific TSCM not only produced, IL-2 but also TNF-α and IFN-γ and, to a lower extent, cytotoxic molecules.
Our data suggested that M. tb-specific TSCM had different cytokine expression patterns depending on the M. tb antigen recognized. For example, Ag85B-specific TSCM produced only IL-2, while BCG- and CFP-10-specific TSCM produced TNF-α and IFN-γ in addition to IL-2. Despite the early stage of T cell memory differentiation of TSCM these findings may reflect different degrees of antigen exposure in vivo. A murine study showed that Ag85B mRNA expression peaks during early stages of M. tb infection and significantly reduces during established infection, whereas ESAT-6 mRNA was maintained at high levels throughout these infection stages (45). We also recently showed differential degrees of T cell differentiation of Ag85B and ESAT-6-specific CD4 T cells in M. tb-infected mice and humans (46). Expression of only IL-2, a cytokine associated with homeostatic proliferation and early T cell differentiation, by Ag85B-specific TSCM thus may reflect lower exposure of T cells to this antigen. By contrast, expression of TNF-α and IFN-γ, cytokines typically produced by more differentiated T cells, by CFP-10 and BCG-specific TSCM is consistent with higher in vivo recognition or exposure to these antigens (36). However, in light of the low frequencies of M. tb-specific TSCM these data on functional profiles should be interpreted conservatively. The nature of cytokine expression by M. tb-specific TSCM cells requires more attention in future studies. In addition, co-expression of CCR6, observed in about a third of M. tb-specific TSCM, might indicate early polarization toward Th1/Th17 lineage, which has been described as the major CD4+ T cell subset responding to M. tb (21). Finally, CCR5 expression, observed in about 20% of M. tb-specific TSCM, suggests that at least some M. tb-specific TSCM may have the potential to migrate to sites of infection (47, 48) and are not confined to the lymphoid compartment, despite CCR7 expression.
The ability of CD4+ T cells to produce cytotoxic molecules has been associated with high antigen exposure resulting in increased MHC-antigen-T cell receptor interaction and is mostly associated with late differentiated T cells with increased effector functions (38, 49, 50). Cytotoxic CD4+ T cells have been well characterized in contexts of viral infections, where cytotoxic CD4+ T cells either utilize granzyme B and perforin or Fas–FasL interactions to mediate killing of infected cells (49, 50). Surprisingly, we found that CD4+M. tb-specific T cells, including M. tb-specific TSCM cells, predominantly expressed granzyme A and/or K. Unlike granzyme B and perforin that mediate cytotoxic killing of infected cells, granzymes A and K, have been described as pro-inflammatory and cytokine-inducing cytotoxic molecules (51–54). In fact, expression of granzyme A by γδ T cells mediated increased M. tb killing by macrophages (55). Thus, expression of these cytotoxic molecules by M. tb-specific TSCM, TCM, and TEFF, in absence of granzyme B and perforin, may induce pro-inflammatory responses in macrophages at the site of infection, rather than mediate direct killing of M. tb-infected macrophages, which would require perforin to mediate entry of granzymes into infected cells.
We primarily employed MHC class II tetramers loaded with M. tb-epitopes to identify M. tb-specific CD4+ T cells directly ex vivo for transcriptional and phenotypic profiling (Figures S1A–D in Supplementary Material). MHC tetramers provide a method for detecting antigen-specific T cells directly ex vivo without the need for antigen stimulation, which can alter the function, phenotype and GE profiles of T cells. However, an important limitation to using MHC class II tetramers is that only T cells that bear the cognate TCR for a single peptide in the context of a single MHC allele can be studied. To address this, we employed several tetra-mers that allowed detection of CFP-10, ESAT-6, and Ag85-specific CD4+ T cells restricted by DRB1*0301, DRB1*0401, DRB5*0101, DPB1*0401, or DQB*0602, providing adequate coverage of the M. tb-specific CD4 T cell response and cohort. Another limita-tion of our study was our inability to characterize the proliferation and differentiation potential of purified M. tb-specific CD4+ TSCM cells, because very large number of cells (approximately 500 million PBMC per participant) would be required to sort at least 1,000 M. tb-specific tetramer+ CD4 TSCM cells. This is only achievable by leukapheresis, which was not available at our clinical site, where study visits were performed. We provided indirect evidence for this by showing that the precursor frequencies of BCG-specific TSCM and TCM CD4+ T cells correlated with proliferative potential of BCG-specific CD4+ T cells 10 months post infant BCG vaccination. Further studies measuring vaccine-induced TSCM and long-term persistence of memory T cells are required to define the role of antigen-specific CD4+ TSCM after vaccination.
In summary, we have shown that M. tb-specific CD4+ TSCM are induced by primary M. tb infection and exhibit transcriptional, phenotypic and functional features that are distinct from bulk CD4+ TN and TSCM and consistent with early differentiation of M. tb-specific CD4+ T cells, possibly shaped by antigen exposure. Our findings have important implications in the study of the M. tb-specific T cell memory repertoire and raise numerous unanswered questions. For example, determining the functional role of M. tb-specific TSCM in long-term immune responses, how their features differ between asymptomatic M. tb infection and TB disease, as well as during TB treatment. In addition, future work should determine whether long-lived CD4+ TSCM can be induced by vaccination, and whether they are associated with long-term memory responses and protection, as observed for CD8+ TSCM upon yellow fever vaccination (7) as well as in adoptive immune-therapy (4, 8, 9).
The SATVI Clinical Immunology Team
Cynthia Ontong, Elizabeth Filander, Fadia Alexander, Hadn Africa, Janelle Botes, Lebohang Makhethe, Lungisa Jaxa, Marcia Steyn, Noncedo Xoyana, Rachel Oelfose, Sindile Matiwane, South African Tuberculosis Vaccine Initiative, Institute of Infectious Disease and Molecular Medicine, Division of Immunology, Department of Pathology, University of Cape Town, Cape Town, South Africa.
Statements
Ethics statement
Consent forms and study protocols were approved by the Human Research Ethics Committee of the University of Cape Town (UCT HREC 126/2006, 045/2008, 179/2011, 013/2012, 753/2014). All adult participants provided written informed consent. Parents or legal guardians of adolescents provided written informed consent and adolescents provided written informed assent.
Author contributions
CAMM, OBD, MH, EN, and TJS contributed to conception and design of the study. CAMM and OBD performed experimental work. SM, NB, EN, and TJS contributed to execution and oversight of experimental work. CM and MM performed statistical analyses. CAMM, OBD, MM, EN, and TJS contributed to data interpretation and drafted the manuscript. All the authors read, revised, and approved the final version of the manuscript.
Funding
This study was funded by grants to TJS from the South African Medical Research Council and from the European Commis-sion funded TBVAC2020 Consortium (H2020-PHC-643381). CAMM was funded by the University of Cape Town and the South African National Research Foundation. OBD and MM were funded by the Carnegie Corporation PhD Schol-arship.
Acknowledgments
The authors thank the volunteers for participating in this study and acknowledge the contributions of clinical research workers at the South African Tuberculosis Vaccine Initiative. EN is an ISAC Marylou Ingram Scholar.
Conflict of interest
The authors declare that the research was conducted in the absence of any commercial or financial relationships that could be construed as a potential conflict of interest.
Supplementary material
The Supplementary Material for this article can be found online at http://www.frontiersin.org/articles/10.3389/fimmu.2018.00324/full#supplementary-material.
References
1
SallustoFLenigDFörsterRLippMLanzavecchiaA. Two subsets of memory T lymphocytes with distinct homing potentials and effector functions. Nature (1999) 401:708–12.10.1038/44385
2
GattinoniLLugliEJiYPosZPaulosCMQuigleyMFet alA human memory T cell subset with stem cell-like properties. Nat Med (2011) 17:1290–7.10.1038/nm.2446
3
LugliEDominguezMHGattinoniLChattopadhyayPKBoltonDLSongKet alSuperior T memory stem cell persistence supports long-lived T cell memory. J Clin Invest (2013) 123:594–9.10.1172/JCI66327
4
GattinoniLSpeiserDELichterfeldMBoniniC. T memory stem cells in health and disease. Nat Med (2017) 23:18–27.10.1038/nm.4241
5
HongHGuYShengSYLuCGZouJYWuCY. The distribution of human stem cell-like memory T cell in lung cancer. J Immunother (2016) 39:233–40.10.1097/CJI.0000000000000128
6
MateusJLassoPPaviaPRosasFRoaNValencia-HernándezCAet alLow frequency of circulating CD8+ T stem cell memory cells in chronic chagasic patients with severe forms of the disease. PLoS Negl Trop Dis (2015) 9:e3432. 10.1371/journal.pntd.0003432
7
Fuertes MarracoSASonesonCCagnonLGannonPOAllardMAbed MaillardSet alLong-lasting stem cell-like memory CD8+ T cells with a naïve-like profile upon yellow fever vaccination. Sci Transl Med (2015) 7:282ra48. 10.1126/scitranslmed.aaa3700
8
BiascoLScalaSBasso RicciLDionisioFBaricordiCCalabriaAet alIn vivo tracking of T cells in humans unveils decade-long survival and acti-vity of genetically modified T memory stem cells. Sci Transl Med (2015) 7:273ra13. 10.1126/scitranslmed.3010314
9
OliveiraGRuggieroEStanghelliniMTCieriND’AgostinoMFronzaRet alTracking genetically engineered lymphocytes long-term reveals the dynamics of T cell immunological memory. Sci Transl Med (2015) 7:317ra198. 10.1126/scitranslmed.aac8265
10
JasenoskyLDScribaTJHanekomWAGoldfeldAE. T cells and adaptive immunity to Mycobacterium tuberculosis in humans. Immunol Rev (2015) 264:74–87.10.1111/imr.12274
11
ColditzGABerkeyCSMostellerFBrewerTFWilsonMEBurdickEet alThe efficacy of bacillus Calmette-Guérin vaccination of newborns and infants in the prevention of tuberculosis: meta-analyses of the published literature. Pediatrics (1995) 96:29–35.
12
RoyAEisenhutMHarrisRJRodriguesLCSridharSHabermannSet alEffect of BCG vaccination against Mycobacterium tuberculosis infection in children: systematic review and meta-analysis. BMJ (2014) 349:g4643. 10.1136/bmj.g4643
13
ColditzGABrewerTFBerkeyCSWilsonMEBurdickEFinebergHVet alEfficacy of BCG vaccine in the prevention of tuberculosis: meta-analysis of the published literature. JAMA (1994) 271:698–702.10.1001/jama.1994.03510330076038
14
MangtaniPAbubakarIAritiCBeynonRPimpinLFinePEet alProtection by BCG vaccine against tuberculosis: a systematic review of randomized controlled trials. Clin Infect Dis (2014) 58:470–80.10.1093/cid/cit790
15
OrmeIM. The Achilles heel of BCG. Tuberculosis (2010) 90:329–32.10.1016/j.tube.2010.06.002
16
Henao-TamayoMOrdwayDJOrmeIM. Memory T cell subsets in tuberculosis: what should we be targeting?Tuberculosis (2014) 94:455–61.10.1016/j.tube.2014.05.001
17
SoaresAPScribaTJJosephSHarbacheuskiRMurrayRAGelderbloemSJet alBacillus Calmette-Guérin vaccination of human newborns induces T cells with complex cytokine and phenotypic profiles. J Immunol (2008) 180:3569–77.10.4049/jimmunol.180.5.3569
18
SoaresAPKwong ChungCKCChoiceTHughesEJJacobsGvan RensburgEJet alLongitudinal changes in CD4+ T-cell memory responses induced by BCG vaccination of newborns. J Infect Dis (2013) 207:1084–94.10.1093/infdis/jis941
19
KaginaBMAbelBBowmakerMScribaTJGelderbloemSSmitEet alDelaying BCG vaccination from birth to 10 weeks of age may result in an enhanced memory CD4 T cell response. Vaccine (2009) 27:5488–95.10.1016/j.vaccine.2009.06.103
20
Tena-CokiNScribaTJPeteniNEleyBWilkinsonRJAndersenPet alCD4 and CD8 T-cell responses to mycobacterial antigens in African children. Am J Respir Crit Care Med (2010) 182:120–9.10.1164/rccm.200912-1862OC
21
Lindestam ArlehamnCSGerasimovaAMeleFHendersonRSwannJGreenbaumJAet alMemory T cells in latent Mycobacterium tuberculosis infection are directed against three antigenic islands and largely contained in a CXCR3+CCR6+ Th1 subset. PLoS Pathog (2013) 9:e1003130. 10.1371/journal.ppat.1003130
22
StricklandNMüllerTLBerkowitzNGoliathRCarringtonMNWilkinsonRJet alCharacterization of mycobacterium tuberculosis-specific cells using MHC Class II tetramers reveals phenotypic differences related to HIV infection and tuberculosis disease. J Immunol (2017) 199:2440–50.10.4049/jimmunol.1700849
23
DintweOBDayCLSmitENemesEGrayCTamerisMet alHeterologous vaccination against human tuberculosis modulates antigen-specific CD4+ T-cell function. Eur J Immunol (2013) 43:2409–20.10.1002/eji.201343454
24
KipnisAIrwinSIzzoAABasarabaRJOrmeIM. Memory T lymphocytes generated by Mycobacterium bovis BCG vaccination reside within a CD4 CD44lo CD62 Ligandhi population. Infect Immun (2005) 73:7759–64.10.1128/IAI.73.11.7759-7764.2005
25
MahomedHHawkridgeTVerverSAbrahamsDGeiterLHatherillMet alThe tuberculin skin test versus QuantiFERON TB Gold® in predicting tuberculosis disease in an adolescent cohort study in South Africa. PLoS One (2011) 6:e17984. 10.1371/journal.pone.0017984
26
NemesEHesselingACTamerisMMauffKDowningKMulengaHet alSafety and immunogenicity of newborn MVA85A vaccination and selective, delayed Bacille Calmette-Guerin (BCG) for infants of HIV infected mothers: a phase 2 randomized controlled trial. Clin Infect Dis (2017) 66(4):554–63.10.1093/cid/cix834
27
KaginaBMMansoorNKpameganEPPenn-NicholsonANemesESmitEet alQualification of a whole blood intracellular cytokine staining assay to measure mycobacteria-specific CD4 and CD8 T cell immunity by flow cytometry. J Immunol Methods (2015) 417:22–33.10.1016/j.jim.2014.12.003
28
LuabeyaAKKaginaBMTamerisMDGeldenhuysHHoffSTShiZet alFirst-in-human trial of the post-exposure tuberculosis vaccine H56:IC31 in Mycobacterium tuberculosis infected and non-infected healthy adults. Vaccine (2015) 33:4130–40.10.1016/j.vaccine.2015.06.051
29
DominguezMHChattopadhyayPKMaSLamoreauxLMcDavidAFinakGet alHighly multiplexed quantitation of gene expression on single cells. J Immunol Methods (2013) 391:133–45.10.1016/j.jim.2013.03.002
30
RoedererMNozziJLNasonMC. SPICE: exploration and analysis of post-cytometric complex multivariate datasets. Cytometry A (2011) 79A(2):167–74.10.1002/cyto.a.21015
31
BenjaminiYYosefH. Controlling the false discovery rate: a practical and powerful approach to multiple testing. J R Stat Soc B Methodol (1995) 57:289–300.
32
MoonJJChuHHPepperMMcSorleySJJamesonSCKedlRMet alNaive CD4+ T cell frequency varies for different epitopes and predicts repertoire diversity and response magnitude. Immunity (2007) 27:203–13.10.1016/j.immuni.2007.07.007
33
KwokWWTanVGilletteLLittellCTSoltisMALaFondRBet alFre-quency of epitope-specific naive CD4(+) T cells correlates with immunodominance in the human memory repertoire. J Immunol (2012) 188:2537–44.10.4049/jimmunol.1102190
34
SuLFKiddBAHanAKotzinJJDavisMM. Virus-specific CD4+ memory-phenotype T cells are abundant in unexposed adults. Immunity (2013) 38:373–83.10.1016/j.immuni.2012.10.021
35
Acosta-RodriguezEVRivinoLGeginatJJarrossayDGattornoMLanzavecchiaAet alSurface phenotype and antigenic specificity of human interleukin 17-producing T helper memory cells. Nat Immunol (2007) 8:639–46.10.1038/ni1467
36
MahnkeYDBrodieTMSallustoFRoedererMLugliE. The who’s who of T-cell differentiation: human memory T-cell subsets. Eur J Immunol (2013) 43:2797–809.10.1002/eji.201343751
37
BecattiniSLatorreDMeleFFoglieriniMDe GregorioCCassottaAet alT cell immunity. Functional heterogeneity of human memory CD4+ T cell clones primed by pathogens or vaccines. Science (2015) 347:400–6.10.1126/science.1260668
38
CheroutreHHusainMM. CD4 CTL: living up to the challenge. Semin Immunol (2013) 25:273–81.10.1016/j.smim.2013.10.022
39
LugliEGattinoniLRobertoAMavilioDPriceDARestifoNPet alIdentification, isolation and in vitro expansion of human and nonhuman primate T stem cell memory cells. Nat Protoc (2013) 8:33–42.10.1038/nprot.2012.143
40
CioccaMLBarnettBEBurkhardtJKChangJTReinerSL. Cutting edge: asymmetric memory T cell division in response to rechallenge. J Immunol (2012) 188:4145–8.10.4049/jimmunol.1200176
41
GraefPBuchholzVRStembergerCFlossdorfMHenkelLSchiemannMet alSerial transfer of single-cell-derived immunocompetence reveals stemness of CD8(+) central memory T cells. Immunity (2014) 41:116–26.10.1016/j.immuni.2014.05.018
42
RivinoLMessiMJarrossayDLanzavecchiaASallustoFGeginatJ. Chemokine receptor expression identifies pre–T helper (Th)1, Pre–Th2, and nonpolarized cells among human CD4+ central memory T cells. J Exp Med (2004) 200:725–35.10.1084/jem.20040774
43
CastellinoFHuangAYAltan-BonnetGStollSScheineckerCGermainRN. Chemokines enhance immunity by guiding naive CD8+ T cells to sites of CD4+ T cell-dendritic cell interaction. Nature (2006) 440:890–5.10.1038/nature04651
44
SinghSPZhangHHFoleyJFHedrickMNFarberJM. Human T cells that are able to produce IL-17 express the chemokine receptor CCR6. J Immunol (2008) 180:214–21.10.4049/jimmunol.180.1.214
45
ShiLNorthRGennaroML. Effect of growth state on transcription levels of genes encoding major secreted antigens of Mycobacterium tuberculosis in the mouse lung. Infect Immun (2004) 72:2420–4.10.1128/IAI.72.4.2420-2424.2004
46
MogucheAOMusvosviMPenn-NicholsonAPlumleeCRMearnsHGeldenhuysHet alAntigen availability shapes T cell differentiation and function during tuberculosis. Cell Host Microbe (2017) 21:695–706.10.1016/j.chom.2017.05.012
47
QinSRottmanJBMyersPKassamNWeinblattMLoetscherMet alThe chemokine receptors CXCR3 and CCR5 mark subsets of T cells associated with certain inflammatory reactions. J Clin Invest (1998) 101:746–54.10.1172/JCI1422
48
KunkelEJBoisvertJMurphyKVierraMAGenoveseMCWardlawAJet alExpression of the chemokine receptors CCR4, CCR5, and CXCR3 by human tissue-infiltrating lymphocytes. Am J Pathol (2002) 160:347–55.10.1016/S0002-9440(10)64378-7
49
BrownDM. Cytolytic CD4 cells: Direct mediators in infectious disease and malignancy (2010). Cell Immunol (2010) 262:89–95.10.1016/j.cellimm.2010.02.008
50
JunoAJvan BockelDKentSJKelleherADZaundersJJMee Ling MunierC. Cytotoxic CD4 T cells – friend or foe during viral infection?Front Immunol (2017) 8:19. 10.3389/fimmu.2017.00019
51
IrmlerMHertigSMacDonaldHRSadoulRBechererJDProudfootAet alGranzyme A is an interleukin 1 beta-converting enzyme. J Exp Med (1995) 181:1917–22.10.1084/jem.181.5.1917
52
SowerLEFroelichCJAllegrettoNRosePMHannaWDKlimpelGR. Extracellular activities of human granzyme A: monocyte activation by granzyme A versus α-thrombin. J Immunol (1996) 156:2585–90.
53
MetkarSSMenaaCPardoJWangBWallichRFreudenbergMet alHuman and mouse granzyme A induce a proinflammatory cytokine response. Immunity (2008) 29:720–33.10.1016/j.immuni.2008.08.014
54
JoeckelLTWallichRMartinPSanchez-MartinezDWeberFCMartinSFet alMouse granzyme K has pro-inflammatory potential. Cell Death Differ (2011) 18:1112–9.10.1038/cdd.2011.5
55
SpencerCTAbateGSakalaIGXiaMTruscottSMEickhoffCSet alGranzyme A produced by γ9δ2 T cells induces human macrophages to inhibit growth of an intracellular pathogen. PLoS Pathog (2013) 9:e1003119. 10.1371/journal.ppat.1003119
Summary
Keywords
TSCM, Mycobacterium tuberculosis, memory T cells, QuantiFERON conversion, LTBI
Citation
Mpande CAM, Dintwe OB, Musvosvi M, Mabwe S, Bilek N, Hatherill M, Nemes E, Scriba TJ and The SATVI Clinical Immunology Team (2018) Functional, Antigen-Specific Stem Cell Memory (TSCM) CD4+ T Cells Are Induced by Human Mycobacterium tuberculosis Infection. Front. Immunol. 9:324. doi: 10.3389/fimmu.2018.00324
Received
21 December 2017
Accepted
06 February 2018
Published
01 March 2018
Volume
9 - 2018
Edited by
Jesús Gonzalo-Asensio, University of Zaragoza, Spain
Reviewed by
Enrico Lugli, National Institutes of Health (NIH), United States; Ian Orme, Colorado State University, United States
Updates
Copyright
© 2018 Mpande, Dintwe, Musvosvi, Mabwe, Bilek, Hatherill, Nemes, Scriba and The SATVI Clinical Immunology Team.
This is an open-access article distributed under the terms of the Creative Commons Attribution License (CC BY). The use, distribution or reproduction in other forums is permitted, provided the original author(s) and the copyright owner are credited and that the original publication in this journal is cited, in accordance with accepted academic practice. No use, distribution or reproduction is permitted which does not comply with these terms.
*Correspondence: Thomas J. Scriba, thomas.scriba@uct.ac.za
†These authors have contributed equally to this work.
Specialty section: This article was submitted to Microbial Immunology, a section of the journal Frontiers in Immunology
Disclaimer
All claims expressed in this article are solely those of the authors and do not necessarily represent those of their affiliated organizations, or those of the publisher, the editors and the reviewers. Any product that may be evaluated in this article or claim that may be made by its manufacturer is not guaranteed or endorsed by the publisher.