 Chia-Ing Jan1,2,3
 Wan-Chen Tsai4
 Horng-Jyh Harn5,6Woei-Cherng Shyu7,8Ming-Chao Liu4,9Hsin-Man Lu10
 Shao-Chih Chiu4,11*
 Der-Yang Cho11,12,13*
- 1Division of Molecular Pathology, Department of Pathology, China Medical University and Hospital, Taichung, Taiwan
- 2Department of Pathology, China Medical University and Beigang Hospital, Yunlin, Taiwan
- 3Department of Medicine, China Medical University, Taichung, Taiwan
- 4Center for Cell Therapy, China Medical University Hospital, Taichung, Taiwan
- 5The Buddhist Tzu Chi Bioinnovation Center, Buddhist Tzu Chi University, Haualien, Taiwan
- 6Department of Pathology, Buddhist Tzu Chi General Hospital and Buddhist Tzu Chi University Haualien, Haualien, Taiwan
- 7Translational Medicine Research Center, China Medical University Hospital, Taichung, Taiwan
- 8Center for Neuropsychiatry, Department of Neurology, China Medical University Hospital, Taichung, Taiwan
- 9Institute of Clinical Medical Science, China Medical University, Taichung, Taiwan
- 10Department of Psychology, Asia University, Taichung, Taiwan
- 11Graduate Institute of Biomedical Sciences, China Medical University, Taichung, Taiwan
- 12Graduate Institute of Immunology China Medical University, Taichung, Taiwan
- 13Department of Neurosurgery, Neuropsychiatric Center, China Medical University Hospital, Taichung, Taiwan
Background: Glioblastoma (GBM) is the most common and lethal primary malignant glioma in adults. Dendritic cell (DC) vaccines have demonstrated promising results in GBM clinical trials. However, some patients do not respond well to DC therapy, with survival rates similar to those of conventional therapy. We retrospectively analyzed clinical and laboratory data to evaluate the factors affecting vaccine treatment.
Methods: Forty-seven patients with de novo GBM were enrolled at China Medical University Hospital between 2005 and 2010 and divided into two subgroups. One subgroup of 27 patients received postsurgical adjuvant immunotherapy with autologous dendritic cell/tumor antigen vaccine (ADCTA) in conjunction with conventional treatment of concomitant chemoradiotherapy (CCRT) with temozolomide. The other 20 patients received only postsurgical conventional treatment without immunotherapy. Immunohistochemistry for CD45, CD4, CD8, programed death ligand 1 (PD-L1), and programed death 1 (PD-1) was performed on sections of surgical tumor specimens and peripheral blood mononuclear cells (PBMCs). Pearson’s correlation, Cox proportional hazard model, and Kaplan–Meier analyses were performed to examine the correlations between the prognostic factors and survival rates.
Results: Younger age (<57 years), gross total resection, and CCRT and PD-1+ lymphocyte counts were significant prognostic factors of overall survival (OS) and progression-free survival (PFS) in the ADCTA group. Sex, CD45+ lymphocyte count, CD4+ or CD8+ lymphocyte count, tumor PD-L1 expression, isocitrate dehydrogenase 1 mutation, and O6 methylguanine-DNA methyltransferase promoter methylation status were not significant factors in both groups. In the ADCTA group, patients with tumor-infiltrating lymphocytes (TILs) with a lower PD-1+/CD8+ ratio (≤0.21) had longer OS and PFS (median OS 60.97 months, P < 0.001 and PFS 11.2 months, P < 0.008) compared to those with higher PD-1+/CD8+ ratio (>0.21) (median OS 20.07 months, P < 0.001 and PFS 4.43 months, P < 0.008). Similar results were observed in patients’ PBMCs; lymphocyte counts with lower PD-1+/CD8+ ratio (≤0.197) had longer OS and PFS. There was a significant correlation of PD-1+/CD8+ ratio between TILs and PBMCs (Pearson’s correlation R2 = 0.6002, P < 0.001). By contrast, CD4−, CD8−, but PD-1+, CD45+ tumor-infiltrating lymphocytes have no impact on OS and PFS (P = 0.073 and P = 0.249, respectively).
Conclusion: For patients receiving DC vaccine adjuvant therapy, better outcomes are predicted in patients with younger age, with TILs or PBMCs with lower PD-1+/CD8+ ratio, with gross tumor resection, and receiving CCRT.
Introduction
Glioma is a commonly occurring form of brain tumor, and high-grade gliomas are the most common malignant tumors of the central nervous system (1, 2). Glioblastoma multiforme (GBM) is the most lethal, with a mortality rate of 88% within 3 years (3). With standard treatments, GBM prognosis remains poor, with a median overall survival (OS) of 14.6 months for newly diagnosed GBM treated with temozolomide (TMZ) and a median OS of 7.4 months for recurrent GBM (4, 5).
Even with advances in surgical procedures, radio-therapeutic technologies, and discovery of new chemotherapeutic agents such as bevacizumab (Avastin) (6, 7), patients with GBM still have a dismal prognosis, which is approximately 19 months for median OS (8), although some reports showed 2-year survival rates of 40–50% (9, 10) to date. Survival rates of patients with glioblastoma are relatively low, and the failure of treatments is mostly due to recurrence. GBM has a low survival rate attributed to unique treatment limitations such as a high cell proliferation, invasive infiltration, tumor location, and poor understanding of the tumor pathophysiology (11).
In recent years, cancer immunotherapy has been pursued by exploitation of dendritic cells (DCs), which are “professional” antigen processing and presenting cells utilized to induce specific antitumor responses (12). DCs are very potent antigen-presenting cells that play a key role in the initiation of the immune response, and are considered a promising tool for immunotherapy (13, 14). DC-based therapy may provide a way for cytotoxic T lymphocytes (CTLs), natural killer cells, and cytokines to directly or indirectly kill tumor cells. Active immunotherapy using DCs induces an antigen-specific T-cell response to tumor antigens, and recent reports have shown the feasibility, safety, and bioactivity of autologous DC vaccines for GBM, even with recurrent tumors (15, 16).
Clinical trials for GBM with DC vaccine treatment may increase OS time from control group of 13.1 months to DC vaccine group of 15.7 to 35.9 months, according to different trials (12). Since 2001, various research groups have attempted to use DC-based immunotherapy (also called DC vaccines in some studies) in treatment of malignant gliomas (14, 17–19), and have reported induction of glioma-specific antitumor immune responses and apparent survival benefits for some patients. The median OS in trials recruiting patients with newly diagnosed GBM varied between 16.0 and 38.4 months, whereas for recurrent GBM, it ranged between 9.6 and 35.9 months (20–22).
To evaluate the efficacy of DC treatment, two investigator-initiated trials have been conducted in Taiwan, and the results have been published as two peer-review journal articles (23, 24). In Cho’s series, the 2-year survival rate was 47.2%, and the 3-year survival rate was 26.6%.
Similar to other studies, the results of our early experience have revealed a significant benefit for patients with high-grade glioblastoma; however, survival in DC vaccine-treated GBM patients varied (25). Recently, studies of immune checkpoints have provided many dramatic breakthroughs in tumor immune therapy, and checkpoint blockade has shown effectiveness in lung and breast tumors or others (26–33). The tumor microenvironment is complex. Immune checkpoint inhibitors such as programed death 1 protein (PD-1) and programmed death ligand 1 (PD-L1) tremendously influence the immune therapeutic outcome in many types of tumor including GBM (34–37). Many clinical trials of checkpoint blockade are under way (35, 38, 39). Studies in various cancer models have suggested that immunological checkpoint mechanisms such as the PD-1/PD-L1 pathway may contribute to self-tolerance and induce CD8+ T-cell exhaustion in the tumor microenvironment (28, 40–43). Recently, the concept of PD-1/PD-L1 in regulating the response to glioma with DC vaccine treatment was also evaluated and proved by preclinical evidence in vitro and in vivo in animal studies (44, 45). Therefore, we retrospectively analyzed clinical data and paraffin blocks from our previous study for improving the effectiveness of autologous DC treatment of GBM.
Materials and Methods
Patients
This was a retrospective review of 47 samples from patients in a previous clinical study (24) between November 2005 and April 2010 following a new diagnosis of histologically confirmed glioblastoma multiforme (GBM, WHO grade 4 astrocytoma). Patients were between the ages of 14 and 70 years at diagnosis. Inclusion criteria included a Karnofsky performance score (KPS) of at least 70 before surgery and adequate hematologic, renal, and hepatic function [hemoglobin ≥8 g/dL, platelets, ≥100,000/μL, white blood cell count >2,000/μL, absolute neutrophil count ≥1,000/μL, serum blood urea nitrogen <25 mg/dL, serum creatinine <1.8 mg/dL, creatinine clearance >50 mL/min, both serum ALT and serum AST ≤ 3 × the upper limit of normal (ULN), alkaline phosphatase (AP) ≤ 3 × ULN, serum total bilirubin < mg/dL, and prothrombin time and partial thromboplastin time ≤ 1.5 × ULN]. This study was carried out in accordance with the recommendations of ethics guidelines of the institutional hospital with written informed consent from all subjects. All subjects gave written informed consent in accordance with the Declaration of Helsinki. The ethics committee at China Medical University Hospital (Taiwan) approved the study protocol (approval no. CMUH106-REC1-098).
Study Design
The primary objective was to examine the initial tumor specimen or peripheral blood mononuclear cell (PBMC) expression of CD45, CD4, CD8, PD-L1, and PD-1 in GBM patients who received conventional therapy, compared with those who received conventional therapy with adjuvant autologous dendritic cell tumor antigen (ADCTA) vaccine. The conventional treatment was defined as tumor resection or biopsy (non-resectable) and subsequent concomitant chemoradiotherapy (CCRT) with TMZ, according to the guidelines suggested by Stupp et al. (46) (we defined this as the reference group). The add-on study design included an ADCTA vaccine treatment period, a posttreatment tracking period, and a retrospective pathological analysis (Figure 1A). The ADCTA vaccine therapy began 1–2 months post-surgery in conjunction with concomitant CCRT and TMZ. The vaccination protocol for this 10-injection course was four times every 2 weeks followed by monthly six times for a course of 8 months. For patients who were too weak or for other reasons unable to complete the full 10 injections, a minimum of 4 injections was required; otherwise, the patient was excluded from the study. In the reference group, patients underwent surgery followed by concomitant CCRT with TMZ only.
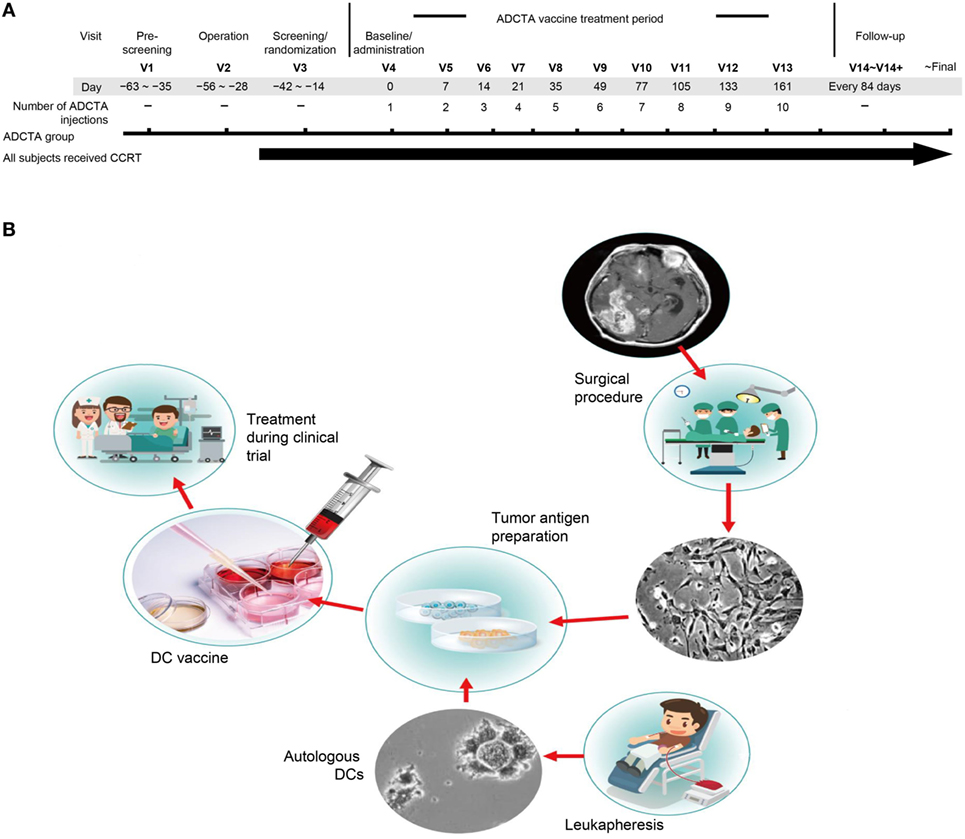
Figure 1. Treatment schema and vaccine preparation. Clinical schematic diagram (A). Subjects with primary GBM will be consent for operation and concomitant chemoradiotherapy (CCRT). Subjects assigned to the ADCTA group will be designated to receive dendritic cell (DC) vaccination ten times following the clinical trial schedule after operation. V: visits to hospital, numbers following indicates times of visit. DC vaccine manufacturing protocol (B). In China Medical University Hospital, the DC vaccine is produced in laboratories that meet the requirements of Good Tissue Practices and Good Manufacturing Practices. The final product is used in a clinical trial of autologous DC therapy for GBM patients between years 2005 and 2010.
Preparation of DC-Based Vaccine
In the ADCTA group, the protocol for DC-based vaccine preparation was based on 2011 and 2012 reports by Chang et al. and Cho et al. (23, 24), and the schematic diagram is represented in Figure 1B.
In brief, fresh tumor tissues removed in the operating room were collected and chopped into small pieces, and then processed by the Brain tumor dissociation kits (130-095-942; MACS®, Miltenyi Biotec, Germany). After cell culture, at least 100–150 million tumor cells were generated to provide sufficient tumor antigens. Cells were irradiated with 20 Gy and then lysed by quick freezing and thawing to produce tumor antigens. At least 2 mg of total protein from the cell lysates were collected from the supernatant after centrifugation for use as the source of tumor antigens. We collected the patient’s PBMC (5.0 × 10⁹ cells/mL) from peripheral blood through leukapheresis. Generally, the leukapheresis was performed in 1 month after subjects had an operation. The monocytes were enriched by 2-h attachment method on the plastic dish at 37°C. The isolated monocytes were cultured in CTS™ AIM V™ Medium (Invitrogen, Carlsbad, CA, USA) with various cytokine proteins for immature DC differentiation. After 7 days, prepared tumor antigens were added into the culture medium for manufacturing DC-based vaccine. Finally, we collected and washed the DC-based vaccines and then divided the cells among 12 tubes, which contain 2–5 × 10⁷ DCs cells. All DC vaccines were stored in the liquid nitrogen tank. Before used, the DC vaccine was thawed and the cells were washed with 4°C normal saline twice and added 1 mL of saline.
Cytoblock Preparation
Peripheral blood mononuclear cells were isolated from patients enrolled in the ADCTA group and used for cytology analysis. Cytoblocks were prepared using a gel-embedding method described by Choi et al. (47).
Immunohistochemistry (IHC) for CD45, CD4, CD8, PD-1, and PD-L1
Immunohistochemical analysis of CD45, CD4, CD8, PD-1, and PD-L1 was performed on 2-µm sequential sections of formalin-fixed, paraffin-embedded (FFPE) GBM tumor tissue, and on FFPE PBMC cytoblocks (CD45, CD4, CD8, and PD-1 only), where the results were scored independently by two board-certified pathologists (Chia-Ing Jan and Horng-Jyh Harn) with no prior knowledge of the patients’ clinical background.
Sequential tissue sections (2 µm) of the GBM tumor sections and cytoblocks isolated from each patient were attached to adhesive glass slides and baked at 70°C for 20 min prior to IHC staining of CD45, CD4, CD8, PD-1, and PD-L1, using the Leica BOND-MAX system (Leica Biosystems, Nussloch, Germany). Tissue sections were dewaxed three times in xylene for 1 min each and rehydrated through graded ethanol for 15 s each, followed by being washed three times with PBS for 15 s each. Antigen retrieval was performed by heating slides in Bond Epitope Retrieval Solution 2 (EDTA, pH 9.0; Leica, Newcastle, United Kingdom) at 100°C for 20 min. After cooling, slides were washed four times with PBS for 15 s each. Sections were incubated with primary monoclonal antibodies against CD45 (clone: X16/99, Leica Biosystems Richmond Inc, USA), at 1:200 dilution, CD4 (clone 1F6 Leica, Newcastle, United Kingdom) at 1:100 dilution, CD8 (clone 1A5, Leica, Newcastle, United Kingdom) at 1:200 dilution, or PD-1 (clone NAT105, Abcam, Cambridge, United Kingdom Abcam) and PD-L1 [clone EPR1161(2), Abcam, Cambridge, United Kingdom Abcam] at 1:200 dilution for 30 min at 25°C. Slides were washed four times with PBS for 20 s each.
For CD45, CD4, CD8, and PD-1, antigen detection was performed with Bond Polymer Refine Red Detection (Leica, Newcastle, United Kingdom). Post primary alkaline phosphatase (AP) was added and incubated for 30 min at room temperature. Subsequent polymer AP was added and incubated for 30 min at room temperature. Sections were then incubated with Leica Red Part substrate for 15 min at room temperature. Finally, slides were counterstained with methyl green (Dako, Glostrup, Denmark) for 5 min and washed with PBS. Isotype controls were performed for each antibody on each specimen.
For PD-L1, Novolink Polymer Detection System (Leica, Newcastle, United Kingdom) was applied after primary antibody incubation. In brief, washed slides were incubated with Novolink Polymer for 30 min, and peroxidase activity was developed with diaminobenzidine (DAB) working solution for 5 min. Finally, the slides were counterstained with hematoxylin. An isotype control was also performed for PD-L1 on each specimen.
In GBM tissue sections stained for PD-L1, tumor cells displayed both patchy/diffuse fibrillary and geographic membraneous staining. We scored PD-L1 expression referring to the methods provided by Berghoff et al. (48) and Nduom et al. (49). When PD-L1 staining was identified with intermediate to strong staining intensity (whether fibrillary or membraneous staining pattern) ≥5% of GBM cells, we defined it as PD-L1 expression, otherwise it was defined as non-expression.
For CD45, CD4, CD8, and PD-1, 25 different high-power fields (HPFs, 400× magnification) containing the most abundant tumor infiltrating lymphocytes (TILs) and 25 random HPFs for PBMCs were counted and summed by two board certified neuropathologists (Chia-Ing Jan and Horng-Jyh Harn) who had been blinded to the patients’ treatment group and clinical history. The count for each patient’s TILs and PBMCs was determined by the two pathologists, and the level of agreement between the pathologists for the manual counting of TILs and PBMCs was compared using kappa statistics.
Immunofluorescence (IF)
Slides were pretreated as described above for IHC. After blocking with 10% fetal bovine serum (GeneDirex, Anaheim, CA, USA) for 1 h, sections were incubated with a rabbit monoclonal antibody against human CD8 (clone SP16 Thermo Fisher, Waltham, MA, USA) for 45 min at 25°C temperature. Tissue sections were washed three times with TBS-Tween 20 at 60 rpm on a shaker for 5 min each and then incubated with Alexa Fluor 488-conjugated goat anti-rabbit secondary antibody (Thermo Fisher, Waltham, MA, USA) for 45 min at 25°C followed by three PBS-Tween 20 washes at 60 rpm on a shaker for 5 min each. PD-1 staining was performed similarly except that a mouse monoclonal mouse antibody against human PD-1 (clone NAT105, Abcam, Cambridge, United Kingdom) at 1:100 dilution and an Alexa Fluor 647-conjugated goat anti-mouse secondary antibody (Thermo Fisher, Waltham, MA, USA) at 1:500 dilution were used. Finally, sections were processed using ProLong Gold Antifade Mountant with DAPI (Thermo Fisher, Waltham, MA, USA) for DAPI nuclear stain and mounting. IF images were captured using a Leica TCS SP8 X white light laser confocal microscope.
Isocitrate Dehydrogenase 1 (IDH1) Mutational Analysis by IHC and DNA Sequencing
For IDH1 IHC, the staining procedures were similar to those for PD-L1; the primary monoclonal antibody IDH1-R132H (clone H09, Dianova, Hamburg, Germany) was diluted at 1:100. Isotype control was also performed. Percentage of positive-stained tumor cells (cytosol + nuclear stain) and staining intensity were scored by the two pathologists. The staining intensity and percentage of positive-stained cells were then semi-quantitated into a three-tiered system (diffuse positive, focal positive, and negative) according to previous literature (50–52). For DNA sequencing, DNA was extracted from FFPE tumor specimens by scraping of tumor sections of three 5-μm-thick unstained paraffin slides. First, excess paraffin and unwanted tissue was removed via trimming with a sterile blade. Then, the remaining tissue on the slides was scraped off with a new sterile blade to remove the tissue section from the slide and transfer the tissue and DNA extraction solution using the DNeasy Blood & Tissue Kit (Qiagen, Hilden, Germany). Mutations in exon 4 of IDH1 were determined by direct sequencing in all cases. Forward and reverse primers used included 5′CGGTCTTCAGAGAAGCCATT3′ and 5′GCAAAATCACATTATTGCCAAC3′, respectively. PCR amplification was performed in a 10-mL reaction mixture containing 50 ng of tumor DNA, 2.5 µL of 10 × Dream Taq buffer, 2.5 µL of 2 mM dNTPs, each forward and reverse primer at 10 µM, and 1.25 µL of Dream Taq DNA Polymerase (Agilent Technologies, Inc., Santa Clara, CA, USA). The initial denaturation was performed at 95°C for 10 min. This was followed by 37 cycles of amplification consisting of denaturation at 95°C for 30 s, annealing at 56°C for 30 s, and extension at 72°C for 30 s.
O6 Methylguanine-DNA Methyltransferase (MGMT) Promoter Methylation by Methylation-Specific PCR (MSP)
The O6 MGMT promoter methylation status of the GBM tumor was determined using MSP analysis. The DNA extraction method was the same as that for IDH1. The DNA extracted from tumor tissues was treated with sodium bisulfite using the EpiTect Fast DNA Bisulfite Kit (Qiagen GmbH, Hilden, Germany). Primer sequences utilized for the methylated forward and reverse primers included 5′GTTTTTAGAACGTTTTGCGTTTCGAC3′ and 5′CACCGTCCCGAA AAAAAACTCCG3′, respectively, and the unmethylated forward and reverse primers used included 5′TGTGTTTTTAGAATGTTTTGTGTTTTGAT3′ and 5′CTACCACCATCCCAAAAAAAAACT CCA3′, respectively. DNA extracted from the colon cancer SW48 cell line (obtained from American Type Culture Collection), which carries a methylated MGMT promoter, was used as a positive control for MGMT promoter methylation. Genomic DNA extracted from peripheral blood leukocytes of normal patients was used as an unmethylated control sample. De-ionized water was used as a double-negative control. A further control reaction without any template DNA was performed together with each PCR experiment.
Flow Cytometry Analysis of PBMCs
Patient PBMCs were isolated by apheresis as described previously (23). Briefly, 1 × 10⁵ PBMCs were collected and stained with antibodies against PD-1 (clone EH12.1 BD Biosciences, San Jose, CA, USA), CD8 (clone RPA-T8, BD Biosciences), CD3 (clone UCHT1, BD Biosciences) or their isotype antibodies, and then analyzed on a Becton Dickinson FACSCanto. The percpCy5.5-labeled CD3+ T cells were identified after prior gating from single and living cell according to size and granularity; then these CD3+ T cells were analyzed by dot-plot with CD8 and PD-1. The cells of PE-Cy7high CD8+ and/or FITChigh PD-1+ were gated less than 1% as isotype control staining. The same gating strategy was applied in another PBMC samples to identify the populations of CD8 and PD-1 expressing T cells. All of the results were analyzed using FACSDiva software.
Statistical Analysis
The primary end point was OS calculated from the date of the first surgery confirming GBM to the date of death. Secondary end points were progression-free survival (PFS) calculated from the date of the first surgery confirming GBM to the date of GBM recurrence confirmed by either pathology or MRI report. All statistical analyses were performed using SPSS version 20.0. Cox proportional hazards models were used to calculate hazard ratios (HRs) of recurrence or death according to the number of CD45+, CD4+, CD8+, and PD-1 TILs and PD-L1 of GBM. Kaplan–Meier survival analysis was used to determine the distribution of OS and PFS time, and differences were analyzed using the log-rank test.
Results
Patient Characteristics and Subtyping of GBM by IDH1 Mutation and MGMT Methylation
There was a total of 47 patients enrolled, of which 27 patients received ADCTA added to conventional therapy (ADCTA group) and 20 patients received conventional therapy only (reference group). Demographic and clinical data of the total patients are shown in Table 1. The mean age was 51.8 years. Detailed individual patient data of the ADCTA and reference groups including sex, age, extent of tumor resection, receiving TMZ or not, receiving radiation therapy/CCRT or not, receiving salvage gamma knife (GKS) for recurrent/residual tumor or not, Karnofsky performance score (KPS), and survival and recurrence (shown as OS and PFS in months), together with tumor expression of IDH1, MGMT, and PD-L1; PD-1+, CD4+, and CD8+ lymphocyte counts; and PD-1+/CD8+ ratio in lymphocytes are shown in Tables 2 and 3. Four out of the total 47 patients (6.99%) exhibited IDH1 mutation on DNA sequencing examinations, and all were R132H (CGT → CAT) mutations. There were three patients with IDH1 mutations in the ADCTA group, and one IDH1 mutation in the reference group. The O6 MGMT promoter methylation examination results showed that 7 out of 47 patients (14.9%) had unmethylated MGMT promoter, including 4 patients with unmethylated MGMT promoter in the ADCTA group and 3 patients with unmethylated MGMT promoter in the reference group. The remaining 40 patients (85.1%) exhibited methylated MGMT promoter. Therefore, in this study, clinical parameters such as IDH-1 and MGMT were well balanced between the two study groups.
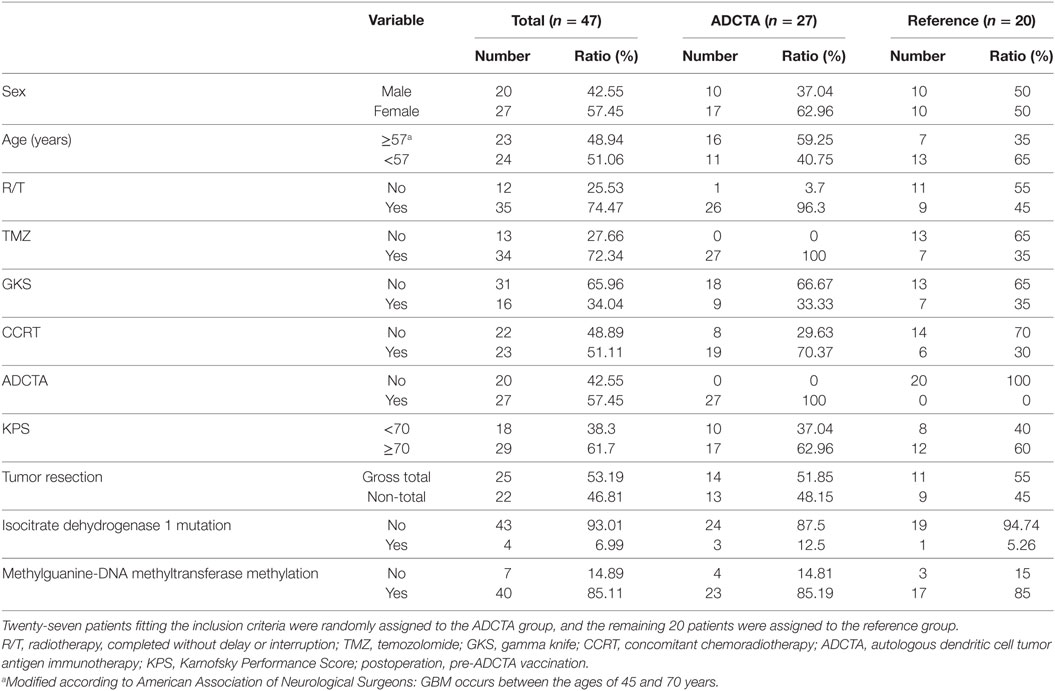
Table 1. Demographic data of total patients and ADCTA and reference groups.
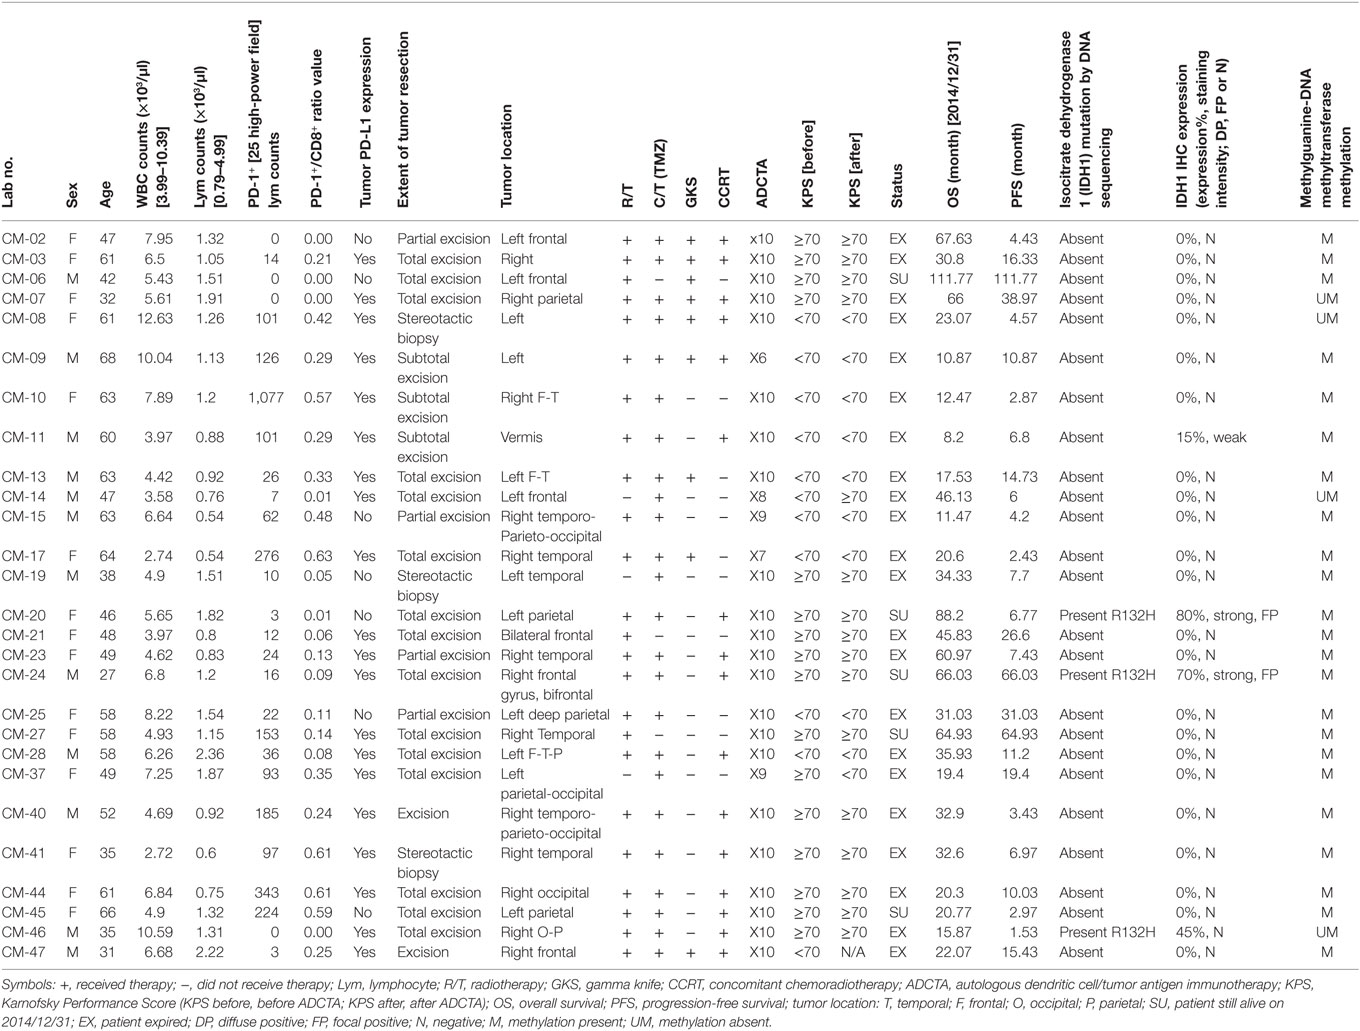
Table 2. Summary of patient data in the ADCTA group.
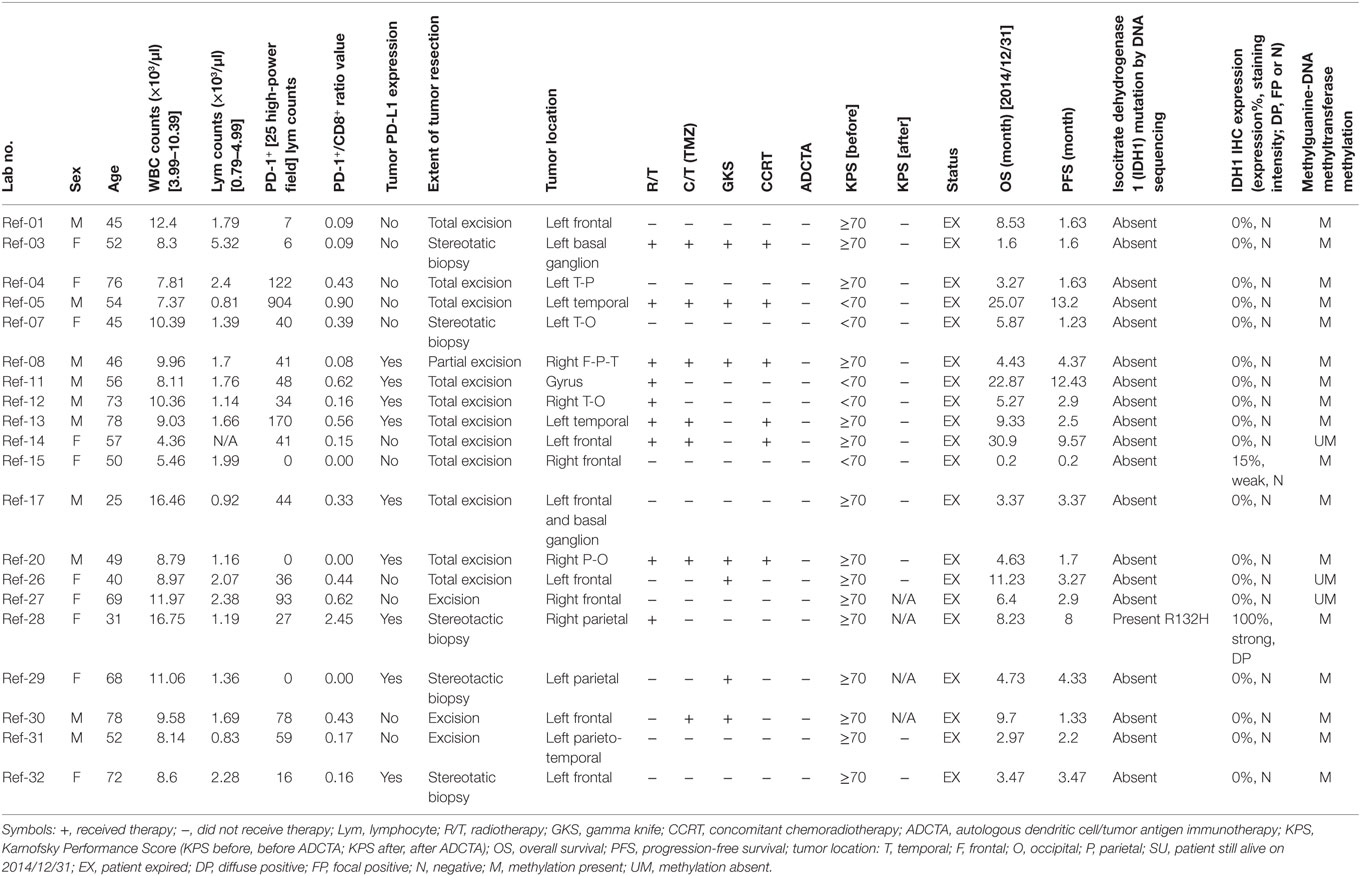
Table 3. Summary of patient data in the reference group.
Expression of CD45, CD4, CD8, and PD-1 in TILs and PBMCs
Immunohistochemistry was used to examine CD45, CD4, CD8, and PD-1 expression in TILs (47 patients) and cytoblocks of PBMCs. Morphologically identified lymphocytes (lymphoid cells exhibiting small, hyperchromatic, round to folded nucleolus with 6–9 µm nuclear diameter and thin rim of cytoplasm) positive for CD45, CD4, CD8, or PD-1 (×400) were scored based on the presence of strong circular membrane staining. Cells showing either incomplete cell membrane staining or weak staining were not scored as positive. Representative photomicrographs of TILs and PBMCs are shown in Figures 2A–H.
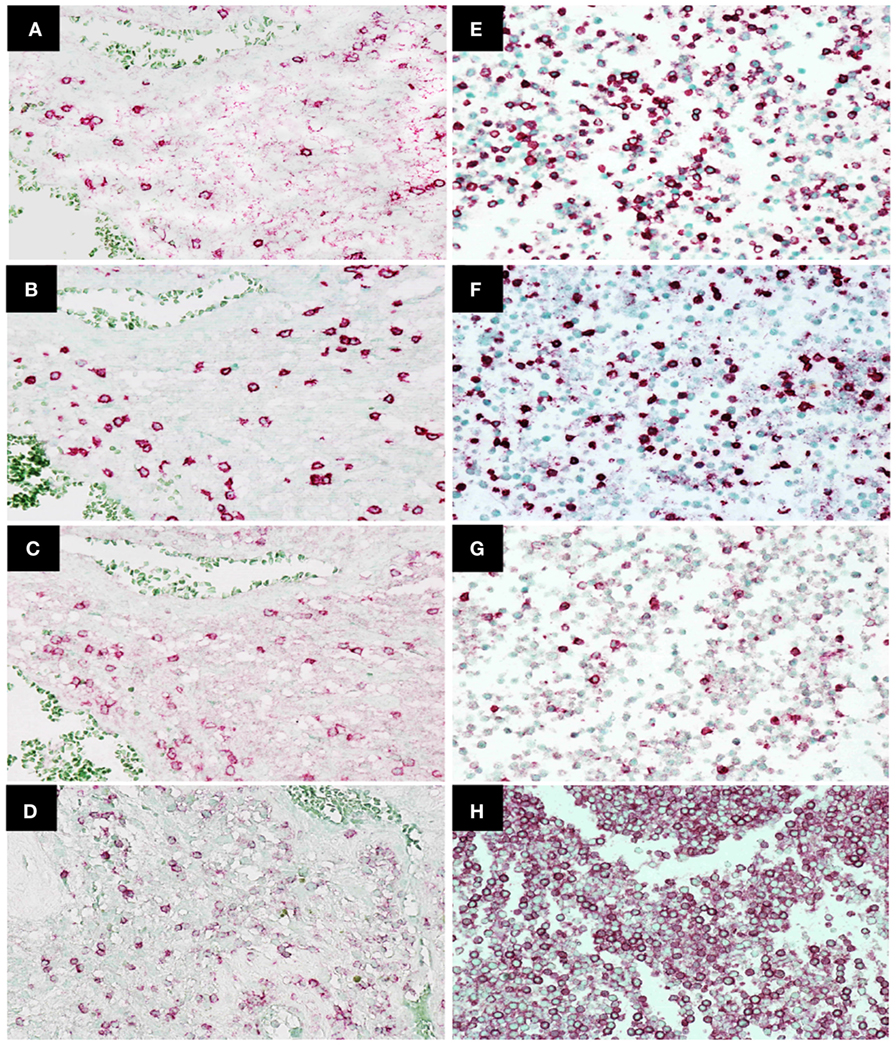
Figure 2. Immunohistochemistry staining of CD4, CD8, programed death 1 (PD-1), and CD45 expression in tumor-infiltrating lymphocytes in glioblastoma (GBM) tissue and peripheral blood mononuclear cells. Representative photomicrographs showing staining for CD4 (A), CD8 (B), PD-1 (C), and CD45 (D) in GBM histological tissue sections (400× magnification) and CD4 (E), CD8 (F), PD-1 (G), and CD45 (H) in peripheral blood mononuclear cell cytoblocks (400× magnification).
Expression of PD-L1 in GBM Tumor Cells Does not Effect Prognosis
GBM tumor cells expressing PD-L1 or not were determined by IHC. Representative photomicrographs of GBM with positive PD-L1 expression and negative PD-L1 expression are shown in Figures 3A,B. GBM tumor cells expressing PD-L1 nor not does not affect the OS and PFS of ADCTA group or reference group patients (ADCTA group OS P = 0.086 and PFS P = 0.239; reference group OS P = 0.376 and PFS P = 0.421).
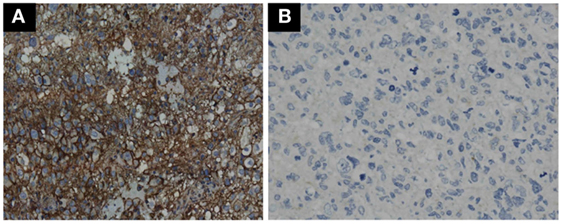
Figure 3. Immunohistochemistry staining pattern of positive and negative PD-L1 expression in GBM tumor cells. Representative photomicrographs showing diffuse strong cell membrane staining for PD-L1 (A), and complete negative staining for PD-L1 (B) in GBM histological tissue sections (400× magnification).
Quantitative Evaluation of CD45+, CD4+, CD8+, and PD-1+ TILs in GBM Tissue Sections and PBMC Cytoblocks
A high level of agreement was observed between the two pathologists for the counting of CD45, CD4, CD8, and PD-1 lymphocytes (κ = 0.9998, P < 0.001 for CD45+, κ = 0.9988, P < 0.001 for CD4+, κ = 0.9997, P < 0.001 for CD8+, and κ = 0.9999, P < 0.001 for PD-1+).
For all patient samples, the total count (expressed as the median and SD) of CD45+, CD4+, CD8+, and PD-1+ lymphocytes and the ratio of PD-1+ lymphocytes to CD8+ lymphocytes (PD-1+/CD8+ ratio) in both groups are shown in Table 4. The median CD45+, CD4+, CD8+, and PD-1+ lymphocyte count and median PD-1+/CD8+ ratio were used for statistical analysis. In tumor-infiltrating lymphocytes, the median CD45+ count was 1,782 in ADCTA group, whereas in the reference group, it was 704 per 25 HPF. The median CD4+ count was 262 in ADCTA group, compared to the reference group it was 130 per 25 HPF. The median CD8+ count was 241 in ADCTA group, and in the reference group it was 141.5 per 25 HPF. The median PD-1+ count was 26 in ADCTA group, whereas in the reference group, it was 40.5 per 25 HPF. The median PD-1+/CD8+ ratio in TILs in the ADCTA group was 0.21, and that in the reference group was 0.25. The median PD-1+/CD8+ ratio in cytoblocks in the ADCTA group was 0.198.
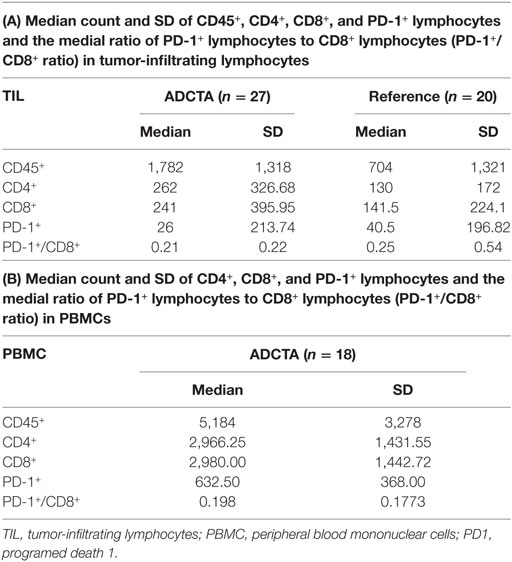
Table 4. The mean, median, and SD values of total count of CD45+, CD4+, CD8+, and PD-1+ lymphocytes and the ratio of PD-1+ lymphocytes in CD8+ lymphocytes (PD-1+/CD8+ ratio) for patients in this study, in ADCTA group, and reference group.
HR Between CD45, CD4, CD8, PD-1-Presenting Lymphocytes and GBM Clinical Prognostic Features
To explore the relationship between CD45, CD4, CD8, PD-1-presenting lymphocytes and GBM clinical prognostic features, we dichotomized the CD45+, CD4+, CD8+, PD-1+ TIL counts and the PD-1+/CD8+ ratio into high and low using either the median count or the median ratio as cutoff points, as appropriate. The HR for each variable was calculated using the Cox proportion hazards model (Tables 5 and 6).
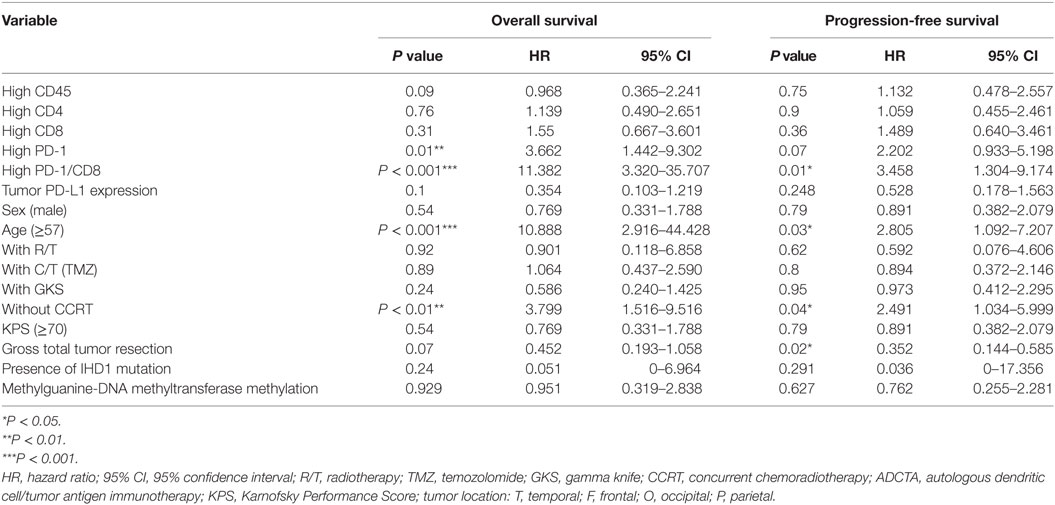
Table 5. Multivariate analysis using a Cox proportional hazards model for overall survival and progression free survival in ADCTA group patients.
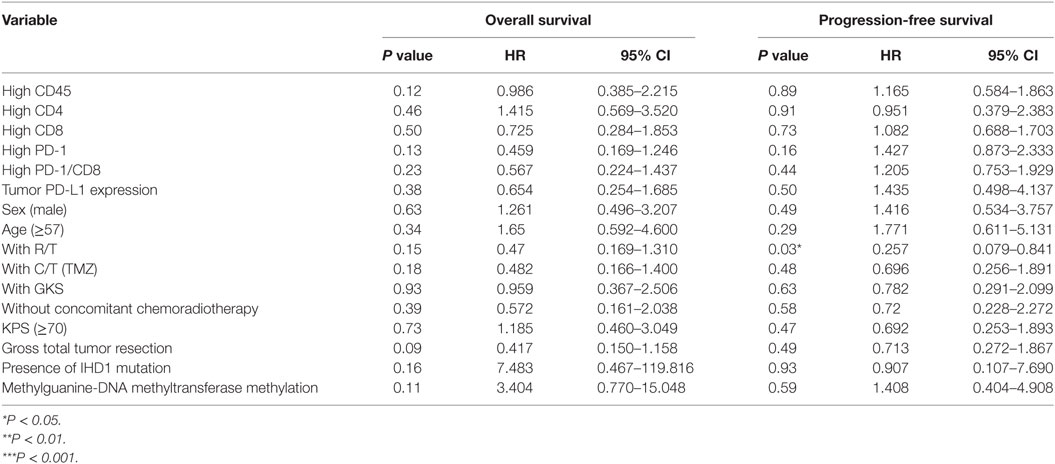
Table 6. Multivariate analysis using a Cox proportional hazards model for overall and progression free survival in reference group patients.
A high PD-1+ TIL count (>median count) in the ADCTA group was associated with an increased estimated risk of death when compared with a low PD-1+ count (≤median count, HR = 3.662; 95% CI = 1.442–9.302; P = 0.01; Table 5). Moreover, a high PD-1+/CD8+ ratio (>median ratio) was associated with an increased estimated risk of death when compared to a low PD-1+/CD8+ ratio (≤median ratio) in patients in the ADCTA group (HR = 11.382; 95% CI = 3.320–35.707; P < 0.001, Table 5). A high PD-1+/CD8+ ratio was also associated with an increased estimated risk of disease recurrence for patients in the ADCTA group (HR = 3.458; 95% CI = 1.304–9.174; P = 0.01, Table 5).
Other independent prognostic factors in patients in the ADCTA group were age <57 (OS; old versus young; HR = 10.088; 95% CI = 2.916–44.428; P < 0.001, PFS HR = 2.805; 95% CI = 1.092–7.207; P = 0.03), and extent of gross tumor resection (PFS; total resection versus non-total resection; HR = 0.352; 95% CI = 0.144–0.585; P = 0.02). CCRT also was another prognostic factor. Patients with completion of CCRT fared better than those without CCRT in OS and PFS (without CCRT versus with CCRT; HR = 3.799; 95% CI = 1.516–9.116; P < 0.01 and HR = 2.491; 95% CI = 1.034–5.999; P = 0.04, respectively).
As for the reference group, only completion of radiotherapy without delay or interruption was an independent prognostic factor for decreased estimated risk of disease recurrence in the reference group (HR = 0.257; 95% CI = 0.079–0.841; P = 0.03, Table 6). None of the other factors described above were of prognostic significance in the reference group in this study.
In both groups, high CD45, high CD4 count, high CD8 count, gender, receiving radiotherapy alone, TMZ therapy alone, salvage gamma knife (GKS) treatment, or tumor cells expressing IDH1 mutation, and MGMT methylation were all not significant prognostic factors under HR evaluation.
Prognostic Significance of CD45, CD4, CD8, and PD-1-Presenting TILs in GBM Tissue Sections
The OS time of patients in the ADCTA group was significantly longer than that of the reference group. The median survival time in the ADCTA group was 31.0 months, whereas it was 16.0 months for the reference group (P < 0.001, Figure 4).
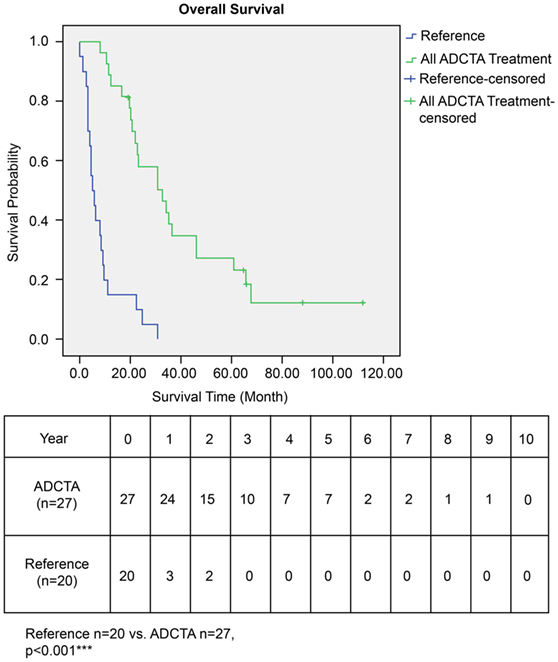
Figure 4. Overall survival (OS) in ADCTA versus reference group glioblastoma patients. Kaplan–Meier survival plots of the OS of 27 ADCTA patients compared to 20 reference patients.
In the ADCTA group, in patients with a low TIL PD-1+/CD8+ ratio, the median OS was 60.97 months (95% CI = 38.7–83.24 months), whereas in patients with a high TIL PD-1+/CD8+, ratio it was 20.07 months (95% CI = 18.42–21.72 months) (Figure 5A, Kaplan–Meier estimates of OS, P < 0.001). As for median PFS, patients with a low TIL PD-1+/CD8+ ratio was 11.2 months (95% CI = 5.01–33.72 months), compared to patients with a high TIL PD-1+/CD8+ ratio was 4.43 months (95% CI = 3.75–5.11 months) (Figure 5B, Kaplan–Meier estimates of DFS, P = 0.008). Therefore, in patients with a low TIL PD-1+/CD8+ ratio, the median survival benefit was 40.9 months. The correlation between ADCTA patients’ TIL PD-1+/CD8+ ratio and survival was not just observed in dichotomized data under Kaplan–Meier survival curves. Using Pearson’s correlation coefficient, we have observed a strong negative correlation in patients’ PD-1+/CD8+ ratio and overall and DFS time after natural logarithm transformation to correct a positively skewed data distribution (Figure 6A; r = −0.655; R2 = 0.429; P < 0.001 and Figure 6B; r = −0.444; R2 = 0.197; P = 0.02). This evidence further strengthens the importance of TIL PD-1+/CD8+ ratio in GBM patients receiving ADCTA therapy.
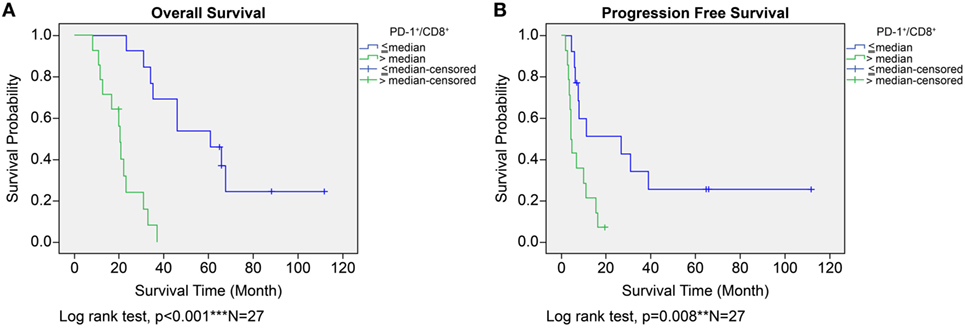
Figure 5. Overall survival (OS) (A) and progression-free survival (PFS) (B) by high or low PD-1+/CD8+ ratio tumor-infiltrating lymphocytes in the ADCTA group. Kaplan–Meier survival plots of OS and PFS of 14 patients with high PD-1+/CD8+ ratio compared to 13 patients with low PD-1+/CD8+ ratio patients.
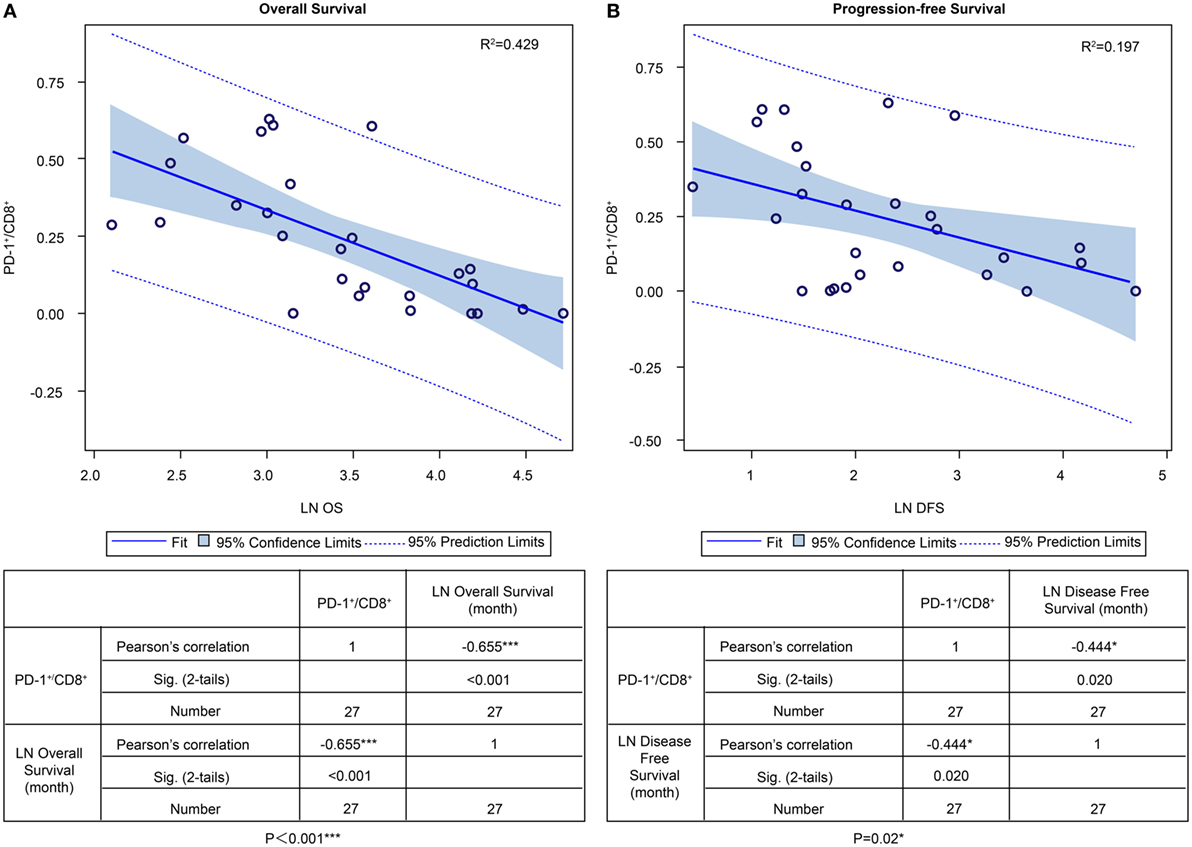
Figure 6. PD-1+/CD8+ ratios of individual patients’ tumor-infiltrating lymphocytes and overall survival (OS) and progression-free survival (PFS) in the ADCTA group. Pearson’s correlation of each patient’s PD1+/CD8+ ratio value and their OS (A) and PFS time (B) after natural logarithm transformation.
We also examined other types of lymphocytes (CD4−, CD8−) expressing PD-1 in the ADCTA group (i.e., lymphocytes with IHC phenotype of CD4−/CD8−/PD-1+/CD45+). We counted in the slides where PD-1+ lymphoid cells overlapped with CD45+ lymphoid cells, but not with CD4+ or CD8+ lymphoid cells. The median count of these cells is 18 per 25 HPF. Lymphocytes with this immunophenotype does not affect the OS and PFS of ADCTA group patients (P = 0.073 and P = 0.249, respectively, Figure S1A in Supplementary Material).
No OS or PFS benefits were noted in patients with a low TIL PD-1+/CD8+ ratio in the reference group (P = 0.227 and P = 0.429, respectively). IHC phenotype of CD4−/CD8−/PD1+/CD45+ lymphoid cells count also does not affect the OS and PFS of reference group patients (P = 0.306 and P = 0.715, respectively, Figure S1B in Supplementary Material).
The prognostic effect of CD45+, CD4+, CD8+, and PD-1+ lymphocyte counts were not of statistical significance in both ADCTA group and reference group.
Positive Correlation Between PBMCs, TILs, and Patient Survival in the ADCTA Group
To determine the correlation between patient survival in the ADCTA group and the PD-1+/CD8+ ratio in TILs and PBMCs, we performed a chi squared test using data from the 18 (out of 27) ADCTA patients who had peripheral blood available for cytoblock preparation of PBMCs. There was a strong positive correlation between the PD-1+/CD8+ ratio found in TILs and that found in the PBMCs (r = 0.775; R2 = 0.6002; P < 0.001; Figure 7).
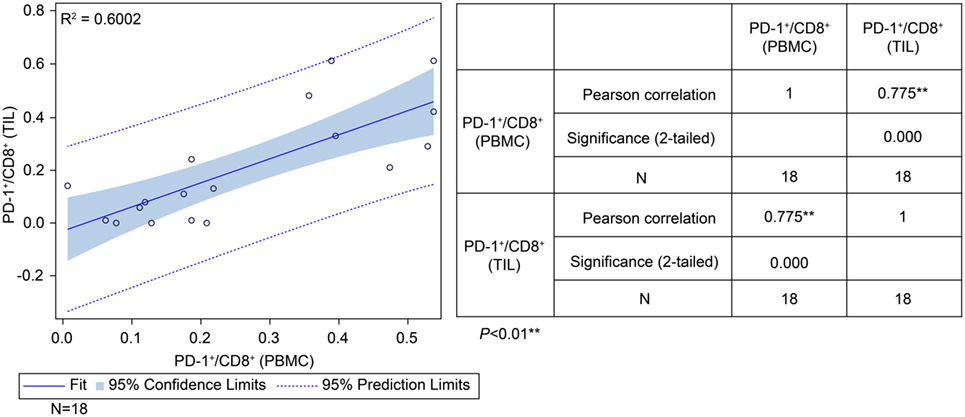
Figure 7. Correlation between tumor-infiltrating lymphocytes and peripheral blood mononuclear cells (PBMCs) in the ADCTA group. Pearson’s correlation between tumor-infiltrating lymphocytes and PBMCs from ADCTA patients (18 patients).
The prognostic significance of CD45+, CD4+, CD8+, and PD-1+ lymphocyte counts and PD-1+/CD8+ lymphocyte ratios in PBMCs was similar to that observed for TILs from the GBM histology sections. High versus low CD45+, CD4+, CD8+, or PD-1+ lymphocyte counts in PBMCs did not correlate with any significant difference in OS or PFS. A high lymphocyte PD-1+/CD8+ ratio was associated with shorter OS as well as shortened progression free survival (PFS) (P = 0.003 and P = 0.016, respectively, Figures 8A,B). Immunophenotype CD4−/CD8−/PD-1+/CD45+ lymphocytes in PBMC also does not affect OS or PFS (P = 0.075 and P = 0.097, respectively, Figure S1C in Supplementary Material).
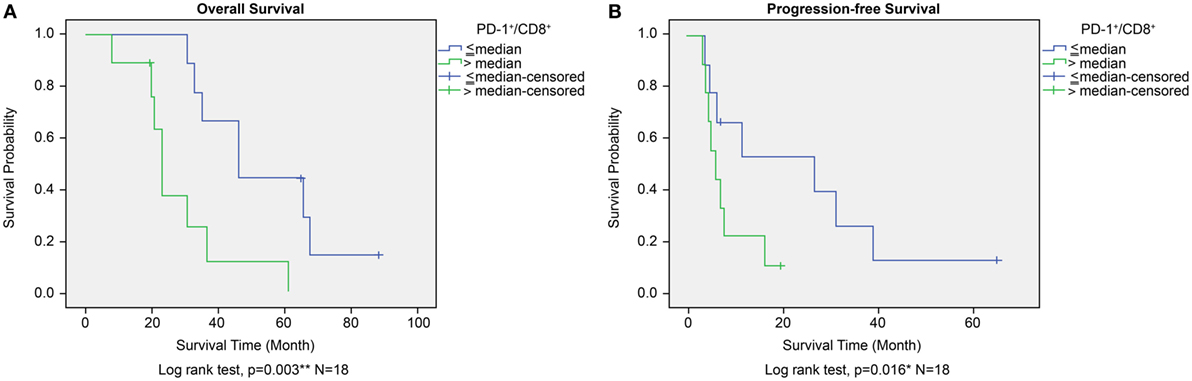
Figure 8. Overall survival (OS) (A) and progression-free survival (PFS) (B) according to high or low PD-1+/CD8+ ratio in peripheral blood mononuclear cells in the ADCTA group. Kaplan–Meier survival plots of OS and PFS of 10 high PD-1+/CD8+ ratio patients compared to 8 low PD-1+/CD8+ ratio patients.
Co-Expression of PD-1 Occurs in CD8+ Lymphocytes in TILs and PBMCs
On the basis of the significant association observed between a high PD-1+/CD8+ ratio in TILs/PBMCs and shorter patient OS or DFS in the ADCTA treatment group, we hypothesized that levels of PD-1 expression in cytotoxic CD8+ lymphocytes may determine the therapeutic efficacy of ADCTA therapy.
To determine whether CD8+ lymphocytes from patients with a high PD-1+/CD8+ ratio did indeed co-express PD-1 and CD8, we performed dual PD-1 and CD8 IF staining of GBM sections and PBMC cytoblocks followed by confocal microscopy. GBM tissue sections and PBMC cytoblocks with both high and low PD-1+/CD8+ ratios were selected for IF staining. As shown in Figure 9A, patient no. CM10 with a high PD-1+/CD8+ ratio showed abundant CD8+ and PD-1+ co-staining in lymphocytes in GBM tissue sections. Furthermore, co-localization of CD8+ and PD-1+ was observed in the merged image, confirmed by reconstruction of single slices of xz and yz planes in the z-axis stacked image (Figure 9A, left low panel). A similar phenotype was observed in the PBMC cytoblock sections from the same patient no. (CM10), in which many CD8+ lymphocytes co-localized with PD-1+ lymphocytes (Figure 9B left upper and low panels). By contrast, GBM tissue sections (Figure 9C left upper and low panels, no. CM 27) and PBMC cytoblock sections (Figure 9D upper and low panels, no. CM27) having a low PD-1+/CD8+ ratio presented abundant CD8+ lymphocytes but, as expected, a low number of PD-1+ lymphocytes, and no co-localization was observed.
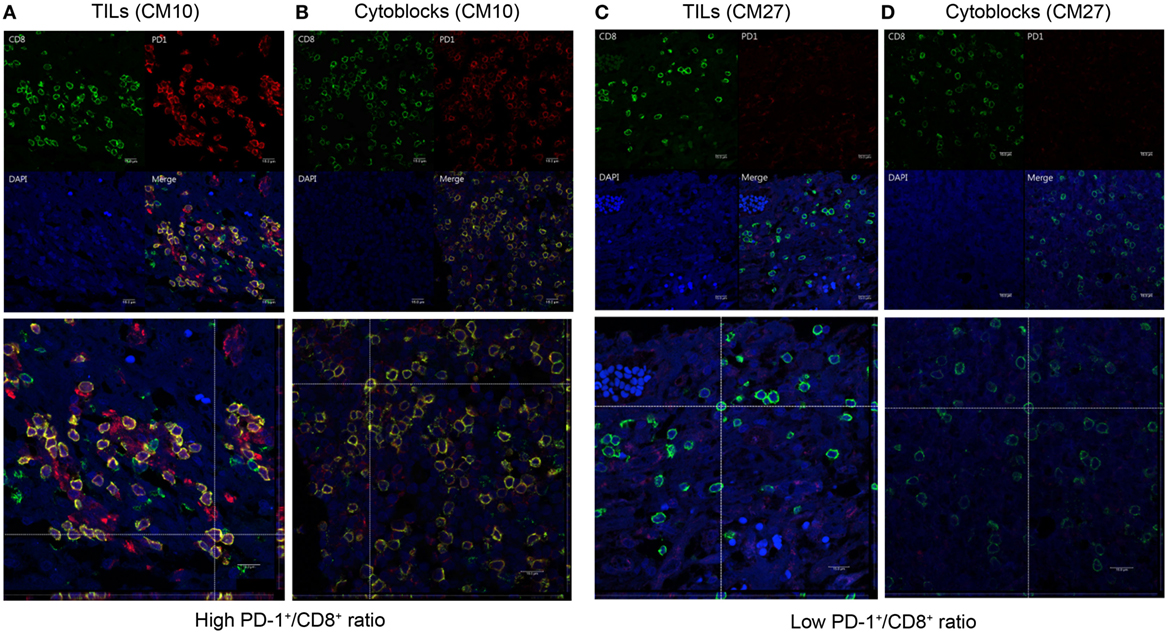
Figure 9. Co-expression of programed death 1 (PD-1) and CD8 in PD-1-positive and CD8-positive tumor-infiltrating lymphocytes and peripheral blood mononuclear cells (PBMCs). Paired GBM tissue sections and PBMC cytoblocks from a representative patient with a high PD-1+/CD8+ ratio were selected for immunofluorescence (IF) analysis of PD-1 and CD8 co-expression. CD8 and PD-1 expression in the TIL of GBM tissue [(A), upper panel] and reconstruction of single slices of the xz and the yz planes in the z-axis stacked image [(A), lower panel]. CD8 and PD-1 expression in PBMCs derived from the same patient [(B), upper panel] and reconstruction of the same immunofluorescent slide [(B), lower panel]. Paired GBM tissue sections and PBMC cytoblocks from a representative patient with a low PD-1+/CD8+ ratio were selected for IF analysis of PD-1 and CD8 co-expression. CD8 and PD-1 expression in the TIL of GBM tissue [(C), upper panel] and reconstruction of single slices of the xz and yz planes in the z-axis stacked image [(C), lower panel]. CD8 and PD-1 expression in PBMCs derived from the same patient [(D), upper panel] and reconstruction of the same immunofluorescent slide [(D), lower panel].
Possible Positive Association Among Frozen PBMCs’ Dual Expression PD-1+/CD8+ Cells and Their PD-1+/CD8+ Ratio in PBMC Cytoblocks, and TILs in ADCTA Group
In order to observe the associations among frozen PBMCs, PBMC cytoblocks, and TILs, we performed flow cytometry analysis of PD-1 and CD8 in frozen PBMCs in ADCTA group from the patients with available frozen PBMCs for flow cytometry analysis. Representative results of high and low PD-1+/CD8+ ratio under flow cytometry were demonstrated. One patient (Figure 10A, CM21) had low PD-1+/CD8+ ratio (0.06 in flow cytometry and 0.07 in IHC TILs and 0.11 in cytoblocks), whereas the other patient (Figure 10B, no. CM41) had a high PD-1+/CD8+ ratio (0.41 in flow cytometry and 0.39 in cytoblocks, 0.61 in TILs). Although we could not achieve a significant statistical correlation among flow cytometry, PBMC cytoblocks, and TILs PD-1+/CD8+ ratio, there seems to be a trend in correlation between flow cytometry evaluation, PBMC cytoblock, and TILs by IHC (flow cytometry versus PBMC cytoblock P = 0.057 and flow cytometry versus TILs P = 0.068, data not shown). Our data suggest that there could be positive correlation between flow cytometry of PD-1+/CD8+ lymophocytes and PMBC cytoblocks PD-1+/CD8+ lymphocytes, and flow cytometry of PD-1+/CD8+ lymophocytes and TIL PD-1+/CD8+ lymophocytes. However, more studies are required to confirm this finding.
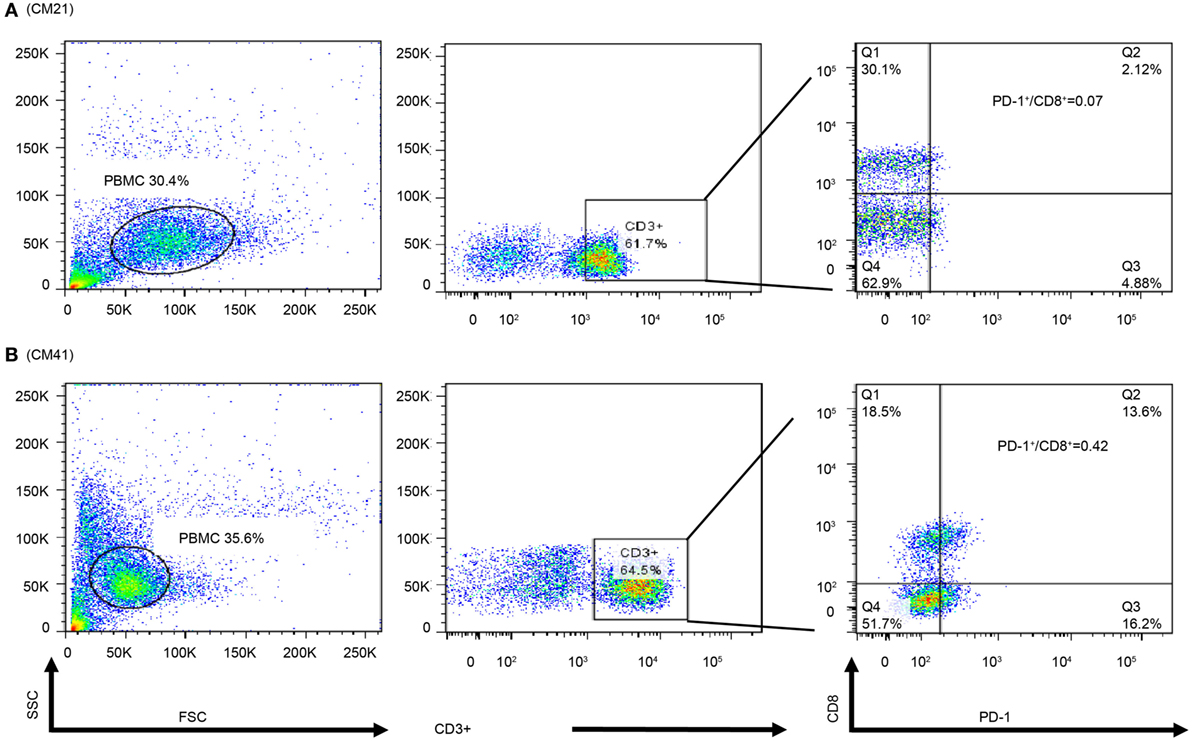
Figure 10. Flow cytometry of peripheral blood mononuclear cells (PBMCs) of representative patients. PBMCs (1 × 10⁵) were collected and stained with antibodies against programed death 1 (PD-1), CD8, and CD3. The percpCy5.5-labeled CD3+ T cells (middle panel) were gated form the size and granularity dot-plot (left panel), then these CD3+ T cells were analyzed by the PE-Cy7 and FITC dot-plot to identify the populations of CD8 and PD-1-expressing cells. Patient 21 had a low PD-1+/CD8+ ratio in the PBMC cytoblock (A). Patient 41 was with a high PD-1+/CD8+ ratio in PBMC cytoblock (B).
Discussion
In this study of glioblastoma patients treated with adjuvant ADCTA immunotherapy compared to conventional adjuvant therapy, the treatment responsiveness in ADCTA group was found to be strongly associated with a low TIL PD-1+/CD8+ ratio within the glioblastoma tumor. Other predictors of treatment response are younger age (<57 years), gross total tumor resection, complete CCRT, and PD-1+ lymphocyte counts. However, CD45+, CD4+, and CD8+ lymphocyte count, and CD4−/CD8−/PD-1+/CD45+ immunophenotype lymphocytes does not seem to effect prognosis. Tumor expression of PD-L1 in this study also failed to predict the effectiveness of adjuvant ADCTA therapy.
From the melanoma experience (53), PD-1+/CD8+ TILs are known to express CTLA4 and Ki67 markers and lack expression of CD127, a phenotypic characteristic of exhausted T-cells. Moreover, effector cytokine production (IL2 and interferon-gamma) is also impaired PD-1+/CD8+ cells (54). In GL261 mice, DC vaccination promotes an antitumor, infiltrating T cell response but vaccination is less effective in intracranial GBM. Treatment with both DC vaccination and PD-1+ blockade resulted in long-term survival, whereas neither agent alone provided a survival benefit in animals with larger, established tumors (45).
To further elucidate the relationship between the PD-1/PD-L1 axis and patient prognosis, initially we also examined the expression of the PD-1 ligand PD-L1, and demonstrated that tumor PD-L1 expression was not significantly associated with prognosis in both ADCTA and reference groups. Although Nduom et al. (49) indicated that expression of PD-L1 in GBM tumor cells is associated with worse OS (49); we could not corroborate this finding in our study. The major reason could be that PD-L1 is present not only in GBM cells but also in tumor-infiltrating myeloid cells (TIMs) such as macrophages and T-regulatory cells. Some reports demonstrated that PD-L1 expression in the GBM microenvironment is contributed by TIM rather than by the tumor cells themselves. This means that patients with scarce PD-L1+ GBM tumor cells but with high TIM numbers surrounding the tumor environment would still have strong immune inhibition (55–57). It may also be due to the complex expression and frequent mutations of PD-L1 in glioblastoma cells (58).
Many clinical trials using DCs to treat GBM have reported an increase in CD8+ TILs after vaccination (59). However, in the complicated tumor microenvironment, GBM tumor cells may inhibit the immune response by the PD-1/PD-L1 pathway. The high PD-1+/CD8+ TIL ratio causes TILs to be exhausted and limits the efficacy of immunotherapy (60–63).
In this study, the median OS and PFS in the ADCTA group was 31 and 16 months without stratification of patients, respectively. But after separating the patients with a low PD-1+/CD8+ ratio, TILs extended the median OS to 61 months and PFS to 11.2 months versus high PD-1+/CD8+ ratio median OS 20.7 months and PFS 4.43 months. This drastic difference was not seen in the reference group. It could be because GBM tumor cells have strong immune system inhibition effecting immune cell proliferation and function (64). In the reference group, there are no so called “tumor antigen activated” cytotoxic T-cells to effectively kill GBM tumor cells, but in ADCTA group, there are many of these cells. So if these “tumor antigen activated” cytotoxic T-cells exhibit anergy, it will surely effect prognosis. Our results also suggest that in the PBMC of ADCTA group, although high counts of PD1+, CD4+, or CD8+ T-cells and high counts of PD-1+, but CD4− and CD8− lymphoid cells (including CD4 and CD8 double-negative T-cells) are identified, not all of these cells can reach the GBM tumor site and effect the ability of tumor killing by T-cells. Tumor microenvironment plays a critical role here. In order for circulating T-cells to reach the tumor microenvironment, they have to pass through the partially permissive anatomic blood–brain barrier, the desmoplastic reaction of produced by the fibroblasts surrounding the tumor cells. In addition, tumor necrosis hinders T-cell trafficking; pericytes and endothelial cells in tumor-associated angiogenesis also inhibit the circulating T-cells from reaching the tumor site.
Based on the findings of the current study, we have proposed a model to illustrate our hypothesis for predicting the effectiveness of ADCTA treatment in GBM patients. In the systemic circulation, PD-1+ or PD-1− cytotoxic T cells in the blood will arrive at post DC vaccine injection regional lymph nodes for antigen activation. After the cytotoxic T cells reaches the tumor microenvironment, the efficiency of killing tumor cells by tumor antigen-activated cytotoxic T (CD8+) cells depends on the proportion of PD-1+ cytotoxic T (CD8+) cells, as shown in Figure 11. If patients have a low PD-1+/CD8+ ratio, they may have a better outcome due to reduced exhausted cytotoxic (CD8+) cells.
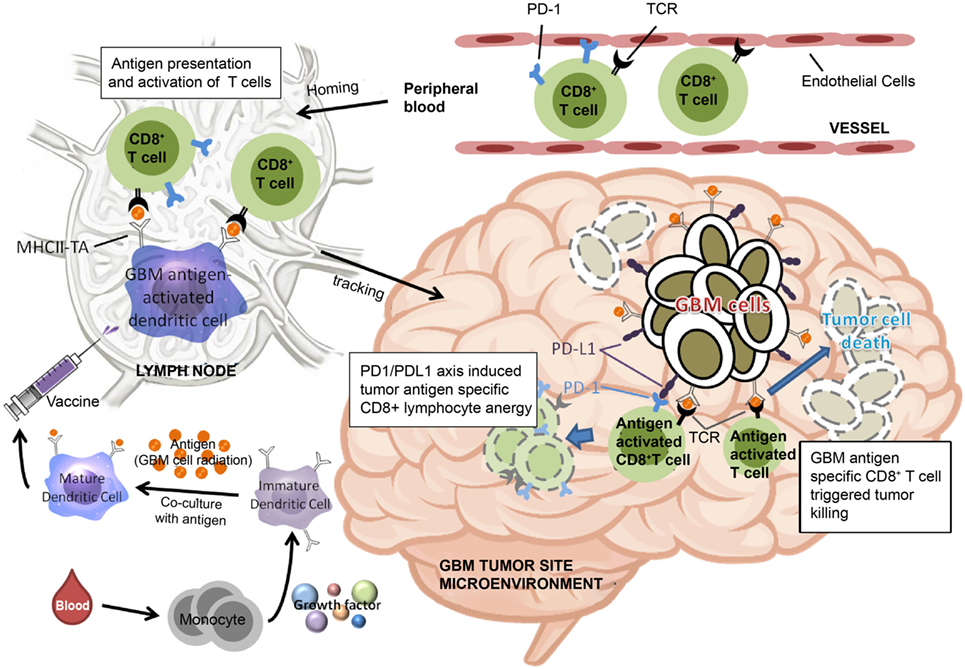
Figure 11. Schematic representation of dendritic cell vaccine treatment PD-1+ or PD-1− cytotoxic T cells in the peripheral blood arrive at lymph nodes for antigen activation after vaccination. After reaching the tumor microenvironment, the efficiency of tumor cell killing by cytotoxic T cells is determined by the proportion of PD-1+ cytotoxic T cells.
Obtaining better GBM control is critical issue. Young age, gross complete tumor resection, neuronavigation with 5 Ala, Gradel (BCNU waffle), irradiation, CCRT, IDH-1 mutation, methylated MGMT, TMZ, Avastin, and immunotherapy (2, 4, 6, 65, 66) have all been studied and may improve the tumor control. In addition, a vaccine preparation with whole tumor lysate under tumor irradiation may also improve vaccine efficacy. Furthermore, many combinatorial therapies such as immunotherapy with checkpoint blockade or with antiangiogenic therapy and cytotoxic therapy may optimize immunogenicity and target tumor adaptive immunosuppressive factors. Recent studies show an increase of the 2-year OS to 40–50%.
Programed death 1 is now a key focus in many cancer controls. In our retrospective study, the low PD-1+/CD8+ ratio may have been similar to a PD-1 blockade, resulting in less immunosuppression and improved efficacy of DC vaccination. However, PD-1 alone is insufficient for GBM control (45); DCs may be necessary to stimulate a large amount of CD8+ cells to attack tumor cells. Therefore, using combinatorial therapy with DCs and PD-1 blockade may provide better outcomes in patients with high immunosuppression (67, 68).
In conclusion, our study results suggest that PD-1+/CD8+ ratio is a critical factor affecting both the OS and PFS of GBM patients receiving ADCTA therapy. Other important, statistically significant factors include: age, gross total tumor removal, receiving complete CCRT, and PD-1 lymphocyte count. The TIL or PBMC PD-1+/CD8+ ratio provides a simple and feasible method of determining whether GBM patients are suitable for ADCTA adjuvant therapy. Patients who still wish to receive ADCTA immunotherapy but have a high TIL or PBMC PD-1+/CD8+ ratio may benefit from a combination therapy with anti-PD-1 and/or anti-PD-L1 monoclonal antibodies or adoptive T-cell therapy (69).
Ethics Statement
This study was carried out in accordance with the recommendations of ethics guidelines of the institutional hospital with written informed consent from all subjects. All subjects gave written informed consent in accordance with the Declaration of Helsinki. The ethics committee at China Medical University Hospital (Taiwan) approved the study protocol (approval no. CMUH106-REC1-098).
Author Contributions
Conception and design: C-IJ and D-YC. Development of methodology: C-IJ, S-CC, and H-JH. Acquisition of data (provided animals, acquired and managed patients, provided facilities, etc.): W-CT, and H-ML. Analysis and interpretation of data (e.g., statistical analysis, biostatistics, computational analysis): C-IJ, H-JH, W-CT, and H-ML. Writing, review, and/or revision of the manuscript: C-IJ, W-CT, S-CC, and D-YC. Administrative, technical, or material support (i.e., reporting or organizing data, constructing databases): W-CS, M-CL, and S-CC. Study supervision: C-IJ, S-CC, and D-YC.
Conflict of Interest Statement
The authors declare that the research was conducted in the absence of any commercial or financial relationships that could be construed as a potential conflict of interest.
Acknowledgments
The authors appreciate the thoughtful and critical review of the manuscript by Dr. Wen-Hwa Lee and Dr. Mien-Chie Hung and comments by Dr. Wen-Kang Yang. We are especially grateful to Dr. Mien-Chie Hung for his kindly support.
Funding
This study was supported by the Ministry of Science and Technology (MOST 104-2314-B-039-028, MOST 105-2314-B-039-007, MOST 106-2320-B-039-040-MY3, and MOST 106-2314-B-039-019-MY3), and Health and Welfare Surcharge of Tobacco Products, China Medical University Hospital Cancer Research Center of Excellence (MOHW107-TDU-B-212-114024, Taiwan). This study was supported in part by China Medical University and Hospital grants (DMR-105-155 awarded to Der-Yang Cho, DMR-104-047 DMR-CELL-17011 awarded to Chia-Ing Jan, and DMR-106-128 awarded to Shao-Chih Chiu, respectively) and was also funded by Research Center for New Drug Development of China Medical University.
Supplementary Material
The Supplementary Material for this article can be found online at https://www.frontiersin.org/articles/10.3389/fimmu.2018.00727/full#supplementary-material.
References
1. Kleihues P, Louis DN, Scheithauer BW, Rorke LB, Reifenberger G, Burger PC, et al. The WHO classification of tumors of the nervous system. J Neuropathol Exp Neurol (2002) 61:215–25. doi:10.1093/jnen/61.3.215
2. Wen PY, Kesari S. Malignant glioma in adults. N Engl J Med (2008) 359:492–507. doi:10.1056/NEJMra0708126
3. Jovcevska I, Kocevar N, Komel R. Glioma and glioblastoma – how much do we (not) know. Mol Clin Oncol (2013) 1:935–41. doi:10.3892/mco.2013.172
4. Stupp R, Hegi ME, Mason WP, van den Bent MJ, Taphoorn MJ, Janzer RC, et al. Effects of radiotherapy with concomitant and adjuvant temozolomide versus radiotherapy alone on survival in glioblastoma in a randomized phase III study: 5-year analysis of the EORTC-NCIC trial. Lancet Oncol (2009) 10:459–66. doi:10.1016/S1470-2045(09)70025-7
5. Park JK, Hodges T, Arko L, Shen M, Dello Iacono D, McNabb A, et al. Scale to predict survival after surgery for recurrent glioblastoma multiforme. J Clin Oncol (2010) 28:3838–43. doi:10.1200/JCO.2010.30.0582
6. Gilbert MR, Dignam JJ, Armstrong TS, Wefel JS, Blumenthal DT, Vogelbaum MA, et al. A randomized trial of bevacizumab for newly diagnosed glioblastoma. N Engl J Med (2014) 370:699–708. doi:10.1056/NEJMoa1308573
7. Omuro A, Beal K, Gutin P, Karimi S, Correa DD, Kaley TJ, et al. Phase II study of bevacizumab, temozolomide, and hypofractionated stereotactic radiotherapy for newly diagnosed glioblastoma. Clin Cancer Res (2014) 20:5023–31. doi:10.1158/1078-0432.CCR-14-0822
8. Lombardi G, Pace A, Pasqualetti F, Rizzato S, Faedi M, Anghileri E, et al. Predictors of survival and effect of short (40 Gy) or standard-course (60 Gy) irradiation plus concomitant temozolomide in elderly patients with glioblastoma: a multicenter retrospective study of AINO (Italian association of neuro-oncology). J Neurooncol (2015) 125:359–67. doi:10.1007/s11060-015-1923-x
9. Mehta M, Wen P, Nishikawa R, Reardon D, Peters K. Critical review of the addition of tumor treating fields (TTFields) to the existing standard of care for newly diagnosed glioblastoma patients. Crit Rev Oncol Hematol (2017) 111:60–5. doi:10.1016/j.critrevonc.2017.01.005
10. Gramatzki D, Kickingereder P, Hentschel B, Felsberg J, Herrlinger U, Schackert G. Limited role for extended maintenance temozolomide for newly diagnosed glioblastoma. Neurology (2017) 88:1422–30. doi:10.1212/WNL.0000000000003809
11. Laws ER, Parney IF, Huang W, Anderson F, Morris AM, Asher A, et al. Survival following surgery and prognostic factors for recently diagnosed malignant glioma: data from the glioma outcomes project. J Neurosurg (2003) 99:467–73. doi:10.3171/jns.2003.99.3.0467
12. Anguille S, Smits EL, Lion E, van Tendeloo VF, Berneman ZN. Clinical use of dendritic cells for cancer therapy. Lancet Oncol (2014) 15:e257–67. doi:10.1016/S1470-2045(13)70585-0
13. Wang X, Zhao HY, Zhang FC, Sun Y, Xiong ZY, Jiang XB. Dendritic cell-based vaccine for the treatment of malignant glioma: a systemic review. Cancer Invest (2014) 32:451–7. doi:10.3109/07357907.2014.958234
14. Yang L, Guo G, Niu XY, Liu J. Dendritic cell-based immunotherapy treatment for glioblastoma multiform. Biomed Res Int (2015) 2015:717530. doi:10.1155/2015/717530
15. Mallick S, Gandhi AK, Rath GK. Therapeutic approach beyond conventional temozolomide for newly diagnosed glioblastoma: review of the present evidence and future direction. Indian J Med Paediatr Oncol (2015) 36:229–37. doi:10.4103/0971-5851.171543
16. Sabado RL, Balan S, Bhardwaj N. Dendritic cell-based immunotherapy. Cell Res (2017) 27:74–95. doi:10.1038/cr.2016.157
17. Xu LW, Chow KK, Lim M, Li G. Current vaccine trials in glioblastoma: a review. J Immunol Res (2014) 2014:796856. doi:10.1155/2014/796856
18. Van Gool S, Maes W, Ardon H, Verschuere T, Van Cauter S, De Vleeschouwer S. Dendritic cell therapy of high-grade gliomas. Brain Pathol (2009) 19:694–712. doi:10.1111/j.1750-3639.2009.00316.x
19. Van Gool SW. Brain tumor immunotherapy: what have we learned so far? Front Oncol (2015) 5:98. doi:10.3389/fonc.2015.00098
20. Yamanaka R, Abe T, Yajima N, Tsuchiya N, Homma J, Kobayashi T, et al. Vaccination of recurrent glioma patients with tumour lysate-pulsed dendritic cells elicits immune responses: results of a clinical phase I/II trial. Br J Cancer (2003) 89:11729. doi:10.1038/sj.bjc.6601268
21. De Vleeschouwer S, Fieuws S, Rutkowski S, Van Calenbergh F, Van Loon J, Goffin J, et al. Postoperative adjuvant dendritic cell-based immunotherapy in patients with relapsed glioblastoma multiforme. Clin Cancer Res (2008) 14:3098–104. doi:10.1158/1078-0432.CCR-07-4875
22. Bregy A, Wong TM, Shah AH, Goldberg JM, Komotar RJ. Active immunotherapy using dendritic cells in the treatment of glioblastoma multiforme. Cancer Treat Rev (2013) 39:891–907. doi:10.1016/j.ctrv.2013.05.007
23. Chang CN, Huang YC, Yang DM, Kikuta K, Wei KJ, Kubota T, et al. A phase I/II clinical trial investigating the adverse and therapeutic effects of a postoperative autologous dendritic cell tumor vaccine in patients with malignant glioma. J Clin Neurosci (2011) 18:1048–54. doi:10.1016/j.jocn.2010.11.034
24. Cho DY, Yang WK, Lee HC, Hsu DM, Lin HL, Lin SZ, et al. Adjuvant immunotherapy with whole-cell lysate dendritic cells vaccine for glioblastoma multiforme: a phase II clinical trial. World Neurosurg (2012) 77:736–44. doi:10.1016/j.wneu.2011.08.020
25. Prins RM, Wang X, Soto H, Young E, Lisiero DN, Frong B, et al. Comparison of glioma-associated antigen peptide-loaded versus autologous tumor lysate-loaded dendritic cell vaccination in malignant glioma patients. J Immunother (2013) 36:152–7. doi:10.1097/CJI.0b013e3182811ae4
26. Hodi FS, O’Day SJ, McDermott DF, Weber RW, Sosman JA, Haanen JB, et al. Improved survival with ipilimumab in patients with metastatic melanoma. N Engl J Med (2010) 363:711–23. doi:10.1056/NEJMoa1003466
27. Zhang Y, Huang SD, Gong DJ, Qin YH, Shen QA. Programmed death-1 upregulation is correlated with dysfunction of tumor-infiltrating CD8(+) T lymphocytes in human non-small cell lung cancer. Cell Mol Immunol (2010) 7:389–95. doi:10.1038/cmi.2010.28
28. Duraiswamy J, Freeman GJ, Coukos G. Therapeutic PD-1 pathway blockade augments with other modalities of immunotherapy T-cell function to prevent immune decline in ovarian cancer. Cancer Res (2013) 73:6900–12. doi:10.1158/0008-5472.CAN-13-1550
29. Sznol M, Chen L. Antagonist antibodies to PD-1 and B7-H1 (PD-L1) in the treatment of advanced human cancer. Clin Cancer Res (2013) 19:1021–34. doi:10.1158/1078-0432.CCR-12-2063
30. Berghoff AS, Ricken G, Widhalm G, Rajky O, Hainfellner JA, Birner P, et al. PD1 (CD279) and PD-L1 (CD274, B7H1) expression in primary central nervous system lymphomas (PCNSL). Clin Neuropathol (2014) 33:42–9. doi:10.5414/NP300698
31. Garon EB, Rizvi NA, Hui R, Leighl N, Balmanoukian AS, Eder JP, et al. Pembrolizumab for the treatment of non-small-cell lung cancer. N Engl J Med (2015) 372:2018–28. doi:10.1056/NEJMoa1501824
32. Rizvi NA, Hellmann MD, Snyder A, Kvistborg P, Makarov V, Havel JJ, et al. Cancer immunology. Mutational landscape determines sensitivity to PD-1 blockade in non-small cell lung cancer. Science (2015) 348:124–8. doi:10.1126/science.aaa1348
33. Topalian SL, Taube JM, Anders RA, Pardoll DM. Mechanism-driven biomarkers to guide immune checkpoint blockade in cancer therapy. Nat Rev Cancer (2016) 16:275–87. doi:10.1038/nrc.2016.36
34. Castro MG, Baker GJ, Lowenstein PR. Blocking immunosuppressive checkpoints for glioma therapy: the more the merrier! Clin Cancer Res (2014) 20:5147–9. doi:10.1158/1078-0432.CCR-14-0820
35. Vlahovic G, Fecci PE, Reardon D, Sampson JH. Programmed death ligand 1 (PD-L1) as an immunotherapy target in patients with glioblastoma. Neuro Oncol (2015) 17:1043–5. doi:10.1093/neuonc/nov071
36. Bouffet E, Larouche V, Campbell BB, Merico D, de Borja R, Aronson M, et al. Immune checkpoint inhibition for hypermutant glioblastoma multiforme resulting from germline biallelic mismatch repair deficiency. J Clin Oncol (2016) 34:2206–11. doi:10.1200/JCO.2016.66.6552
37. Blumenthal DT, Yalon M, Vainer GW, Lossos A, Yust S, Tzach L, et al. Pembrolizumab: first experience with recurrent primary central nervous system (CNS) tumors. J Neurooncol (2016) 129:453–60. doi:10.1007/s11060-016-2190-1
38. Kohrt HE, Tumeh PC, Benson D, Bhardwaj N, Brody J, Formenti S, et al. Unodynamics: a cancer immunotherapy trials network review of immune monitoring in immuno-oncology clinical trials. J Immunother Cancer (2016) 4:15. doi:10.1186/s40425-016-0118-0
39. McDermott DF, Atkins MB. PD-1 as a potential target in cancer therapy. Cancer Med (2013) 2:662–73. doi:10.1002/cam4.106
40. Ahn BJ, Pollack IF, Okada H. Immune-checkpoint blockade and active immunotherapy for glioma. Cancers (Basel) (2013) 5:1379–412. doi:10.3390/cancers5041379
41. Hamid O, Robert C, Daud A, Hodi FS, Hwu WJ, Kefford R, et al. Safety and tumor responses with lambrolizumab (anti-PD1) in melanoma. N Engl J Med (2013) 369:134–44. doi:10.1056/NEJMoa1305133
42. Shi L, Chen S, Yang L, Li Y. The role of PD-1 and PD-L1 in T-cell immune suppression in patients with hematological malignancies. J Hematol Oncol (2013) 6:74. doi:10.1186/1756-8722-6-74
43. Cojocaru G, Rotman G, Levy O, Toporik A, Dassa L, Vaknin I, et al. S9. Proffered paper: identification of novel immune checkpoints as targets for cancer immunotherapy. J Immunother Cancer (2014) 2:I5. doi:10.1186/2051-1426-2-S2-I5
44. Antonios JP, Soto H, Everson RG, Orpilla J, Moughon D, Shin N, et al. PD-1 blockade enhances the vaccination-induced immune response in glioma. JCI Insight (2016) 1(10):e87059. doi:10.1172/jci.insight.87059
45. Antonios JP, Soto H, Everson RG, Moughon D, Orpilla JR, Shin NP, et al. Immunosuppressive tumor-infiltrating myeloid cells mediate adaptive immune resistance via a PD-1/PD-L1 mechanism in glioblastoma. Neuro Oncol (2017) 19(6):796–807. doi:10.1093/neuonc/now287
46. Stupp R, Brada M, van den Bent MJ, Tonn JC, Pentheroudakis G. High-grade glioma: ESMO clinical practice guidelines for diagnosis, treatment and follow-up. Ann Oncol (2014) 3:iii93–101. doi:10.1093/annonc/mdu050
47. Choi SJ, Choi YI, Kim L, Park IS, Han JY, Kim JM, et al. Preparation of compact agarose cell blocks from the residues of liquid-based cytology samples. Korean J Pathol (2014) 48:351–60. doi:10.4132/KoreanJPathol.2014.48.5.351
48. Berghoff AS, Kiesel B, Widhalm G, Rajky O, Ricken G, Wöhrer A, et al. Programmed death ligand 1 expression and tumor-infiltrating lymphocytes in glioblastoma. Neuro Oncol (2015) 17:1064–75. doi:10.1093/neuonc/nou307
49. Nduom EK, Wei J, Yaghi NK, Huang N, Kong LY, Gabrusiewicz K, et al. PD-L1 expression and prognostic impact in glioblastoma. Neuro Oncol (2016) 18:195–205. doi:10.1093/neuonc/nov172
50. Preusser M, Wöhrer A, Stary S, Höftberger R, Streubel B, Hainfellner JA. Value and limitations of immunohistochemistry and gene sequencing for detection of the IHD1-R132H mutation in diffuse glioma biopsy specimens. J Neuropathol Exp Neurol (2011) 70:715–23. doi:10.1097/NEN.0b013e31822713f0
51. Agarwal S, Sharma MC, Jha P, Pathak P, Suri V, Sarkar C, et al. Comparative study of IDH1 mutations in gliomas by immunohistochemistry and DNA sequencing. Neuro Oncol (2013) 15:718–26. doi:10.1093/neuonc/not015
52. Matthew SW, Bill HD, Hai Y. Isocitrate dehydrogenase mutations in gliomas. Neuro Oncol (2016) 18:16–26. doi:10.1093/neuonc/nov136
53. Tsai KK, Zarzoso I, Daud AI. PD-1 and PD-L1 antibodies for melanoma. Hum Vaccin Immunother (2014) 10:3111–6. doi:10.4161/21645515.2014.983409
54. Ahmadzadeh M, Johnson LA, Heemskerk B, Wunderlich JR, Dudley ME, White DE, et al. Tumor antigen-specific CD8 T cells infiltrating the tumor express high levels of PD-1 and are functionally impaired. Blood (2009) 114:1537–44. doi:10.1182/blood-2008-12-195792
55. Liu Y, Zeng B, Zhang Z, Zhang Y, Yang R. B7-H1 on myeloid-derived suppressor cells in immune suppression by a mouse model of ovarian cancer. Clin Immunol (2008) 129:471–81. doi:10.1016/j.clim.2008.07.030
56. Mirghorbani M, Van Gool S, Rezaei N. Myeloid-derived suppressor cells in glioma. Expert Rev Neurother (2013) 13:1395–406. doi:10.1586/14737175.2013.857603
57. Hosseini M, Yousefifard M, Aziznejad H, Nasirinezhad F. The effect of bone marrow-derived mesenchymal stem cell transplantation on allodynia and hyperalgesia in neuropathic animals: a systematic review with meta-analysis. Biol Blood Marrow Transplant (2015) 21:1537–44. doi:10.1016/j.bbmt.2015.05.008
58. Heiland DH, Haaker G, Delev D, Mercas B, Masalha W, Heynckes S, et al. Comprehensive analysis of PD-L1 expression in glioblastoma multiforme. Oncotarget (2017) 8:42214–25. doi:10.18632/oncotarget.15031
59. Liau LM, Prins RM, Kiertscher SM, Odesa SK, Kremen TJ, Giovannone AJ, et al. Dendritic cell vaccination in glioblastoma patients induces systemic and intracranial T-cell responses modulated by the local central nervous system tumor microenvironment. Clin Cancer Res (2005) 11:5515–25. doi:10.1158/1078-0432.CCR-05-0464
60. Topalian SL, Drake CG, Pardoll DM. Targeting the PD-1/B7-H1(PD-L1) pathway to activate anti-tumor immunity. Curr Opin Immunol (2012) 24:207–12. doi:10.1016/j.coi.2011.12.009
61. Sun S, Fei X, Mao Y, Wang X, Garfield DH, Huang O, et al. PD-1(+) immune cell infiltration inversely correlates with survival of operable breast cancer patients. Cancer Immunol Immunother (2014) 63:395–406. doi:10.1007/s00262-014-1519-x
62. Wei B, Wang L, Zhao XL, Du C, Guo YC, Sun ZG. The upregulation of programmed death 1 on peripheral blood T cells of glioma is correlated with disease progression. Tumour Biol (2014) 35:2923–9. doi:10.1007/s13277-013-1376-9
63. Zheng P, Zhou Z. Human cancer immunotherapy with PD-1/PD-L1 blockade. Biomark Cancer (2015) 7:15–8. doi:10.4137/BIC.S29325
64. Razavi SM, Lee KE, Jin BE, Aujla PS, Gholamin S, Li G. Immune evasion strategies of glioblastoma. Front Surg (2016) 3:11. doi:10.3389/fsurg.2016.00011
65. Keles GE, Anderson B, Berger MS. The effect of extent of resection on time to tumor progression and survival in patients with glioblastoma multiforme of the cerebral hemisphere. Surg Neurol (1999) 52:371–9. doi:10.1016/S0090-3019(99)00103-2
66. Han SJ, Rutledge WC, Molinaro AM, Chang SM, Clarke JL, Prados MD, et al. The effect of timing of concurrent chemoradiation in patients with newly diagnosed glioblastoma. Neurosurgery (2015) 77:248–53. doi:10.1227/NEU.0000000000000766
67. Reardon DA, Gilbert MR, Wick W, Liau L. Immunotherapy for neuro-oncology: the critical rationale for combinatorial therapy. Neuro Oncol (2015) 17:vii32–40. doi:10.1093/neuonc/nov178
68. Neagu MR, Reardon DA. An update on the role of immunotherapy and vaccine strategies for primary brain tumors. Curr Treat Options Oncol (2015) 16:54. doi:10.1007/s11864-015-0371-3
Keywords: autologous dendritic cell/tumor antigen, glioblastoma multiforme, tumor-infiltrating lymphocytes, immune checkpoints, peripheral blood mononuclear cell, programmed death protein 1 (PD-1+), cytotoxic T-lymphocytes (CD8+), PD-1+/CD8+ ratio
Citation: Jan C-I, Tsai W-C, Harn H-J, Shyu W-C, Liu M-C, Lu H-M, Chiu S-C and Cho D-Y (2018) Predictors of Response to Autologous Dendritic Cell Therapy in Glioblastoma Multiforme. Front. Immunol. 9:727. doi: 10.3389/fimmu.2018.00727
Received: 26 October 2017; Accepted: 23 March 2018;
Published: 29 May 2018
Edited by:
Fabrizio Mattei, Istituto Superiore di Sanità, ItalyReviewed by:
Udo S. Gaipl, Universitätsklinikum Erlangen, GermanyRodabe N. Amaria, University of Texas MD Anderson Cancer Center, United States
Copyright: © 2018 Jan, Tsai, Harn, Shyu, Liu, Lu, Chiu and Cho. This is an open-access article distributed under the terms of the Creative Commons Attribution License (CC BY). The use, distribution or reproduction in other forums is permitted, provided the original author(s) and the copyright owner are credited and that the original publication in this journal is cited, in accordance with accepted academic practice. No use, distribution or reproduction is permitted which does not comply with these terms.
*Correspondence: Shao-Chih Chiu, c2NjaGl1QG1haWwuY211LmVkdS50dw==;
Der-Yang Cho, ZDUwNTdAbWFpbC5jbXVoLm9yZy50dw==