 Yaxing Hao1
 Yifei Wang2
 Xiaobing Liu1
 Xia Yang1
 Pengcheng Wang1
 Qin Tian1
 Qiang Bai1
 Xiangyu Chen1Zhirong Li1Jialin Wu1Zhunyi Xie1Xinyuan Zhou1Yuyang Zhou1Zhinan Yin2,3*Yuzhang Wu1*Lilin Ye1*
- 1Institute of Immunology, Third Military Medical University, Chongqing, China
- 2The First Affiliated Hospital, Biomedical Translational Research Institute, Guangdong Province Key Laboratory of Molecular Immunology and Antibody Engineering, Jinan University, Guangzhou, China
- 3State Key Laboratory of Biotherapy, Collaborative Innovation Center for Biotherapy, West China Hospital, Sichuan University, Chengdu, China
Follicular helper CD4+ T (TFH) cells are critical for optimal B-cell-mediated humoral immunity by initiating, fueling, and sustaining germinal center reactions. The differentiation of TFH cells relies on multiple intrinsic and extrinsic factors; however, the details by which these factors are integrated to coordinate TFH differentiation are largely unknown. In this study, using a mouse model of acute lymphocytic choriomeningitis virus (LCMV) viral infection, we demonstrate that mTOR complex 2 (mTORC2) kinase integrates TCR signaling and ICOS-mediated co-stimulation to promote late differentiation and functional maturation of virus-specific TFH cells. Specifically, mTORC2 functions to maintain TFH lineage specifications, including phenotypes, migratory characteristics, and functional properties. Thus, our results highlight the importance of mTORC2 in guarding TFH phenotypic and functional maturation.
Introduction
Effective humoral immunity protects individuals from invading pathogens by producing high-affinity, class-switched antibodies, which require cooperation between pathogen-specific B cells and follicular helper CD4+ T (TFH) cells. TFH cells were originally defined as a unique helper CD4+ subset characterized by high expression of the chemokine receptor CXCR5, which facilitates TFH cell migration toward B cell follicles (1–6), where they interact with and assist cognate B cells. TFH cells provide essential signals to B cells, including engagement of the inducible T cell co-stimulator ICOS, the ligand for the costimulatory receptor CD40, T cell inhibitory receptor PD-1, interleukin 21 (IL-21), and interleukin 4 (IL-4) (7), leading to the formation and maintenance of germinal centers (GCs), in which B cells undergo somatic hypermutation, antibody affinity maturation, and final differentiation into long-lived memory B cells and plasma cells (8).
Follicular helper CD4+ T cell differentiation is a multistage process that is tightly controlled by multiple factors (7). In acute viral infection, dendritic cells (DCs) initiate TFH programming by priming antigen-specific CD4+ T cells for activation (9). The activated CD4+ T cells, with upregulated CXCR5 and Bcl-6 but downregulated Blimp-1 expression, differentiate toward TFH cells (10–12). The TFH precursors are generated as early as 2 days after activation (13), which has recently been proven to be mediated by the transcription factor T cell factor-1 (TCF-1) and achaete scute homolog-2 (ASCL2) (14–17). TCF-1 promotes early TFH cell differentiation by upregulating Bcl-6 but repressing Blimp1 expression (14), while ASCL2 participates in early TFH induction by increasing the follicular homing ability of TFH cells (17). These early differentiated TFH cells subsequently migrate to the T cell–B cell border and acquire full polarization into GC TFH cells with maximal functions upon engagement of B cells (18–21). Of note, initiation of TFH differentiation requires priming from DCs but not B cells (7, 9, 22, 23), while full commitment and maintenance of TFH cells depend on the presence of cognate B cells (7, 18, 23). Unlike early TFH early polarization, underlying mechanisms during complete differentiation and functional maturation of TFH cells in the B cell-dependent phase are poorly understood.
The mechanistic target of rapamycin (mTOR) is an evolutionarily conserved serine/threonine kinase that is involved in diverse cellular processes, including cell growth, proliferation, differentiation, metabolism, and survival, by sensing and integrating environmental cues (24). The mTOR kinase exists in two distinct complexes named mTOR complex 1 (mTORC1) and mTOR complex 2 (mTORC2), which are defined by scaffolding subunit regulatory-associated protein of mTOR (Raptor) and rapamycin-insensitive companion of mTOR (Rictor), respectively (25, 26). mTORC1 has been reported to regulate protein translation and glucose and lipid metabolism by phosphorylating the downstream targets ribosomal protein S6 kinase and eIF4E-binding protein 1 (4E-BP1) (27–29). mTORC2 mainly engages in the regulation of cell survival, metabolism, and cytoskeletal organization by phosphorylating many AGC kinases, including AKT (at position Ser473), SGK1 and PKC-α (30). Both mTORC1 and mTORC2 have been reported to participate in a variety of T cell immune responses (31). mTORC1 signaling promotes the differentiation of TH1 and TH17, whereas it inhibits the differentiation and suppressor functions of TReg cells (32–37). Additionally, the interleukin-2 (IL-2)-mTORC1 signaling axis promotes TH1 but inhibits TFH cell differentiation to orchestrate the reciprocal balance between TH1 and TFH cell fates during acute viral infection (38). Additionally, mTORC1 has been reported to regulate follicular regulatory T (TFR) cell differentiation from conventional regulatory T cells (39). In contrast to mTORC1, the knowledge about mTORC2 in the regulation of T cell immunity is quite limited. It is known that mTORC2 signaling favors TH2 differentiation (32, 40). Recently, two groups have reported that mTORC2 is essential for TFH cell differentiation at the steady state in Peyer’s patches (PPs) and upon protein immunization or viral infection (41, 42). However, it remains unknown whether mTORC2 selectively regulates early fate commitment or later lineage maintenance of TFH cells, or both. Additionally, whether mTORC2 regulates the effector functions of differentiated TFH cells remains to be investigated.
Here, we investigate the role of mTORC2 in regulating TFH differentiation at early and late stages, as well as the effector function of TFH cells in response to acute viral infection. We use lymphocytic choriomeningitis virus (LCMV) to establish a mouse model of acute viral infection, in which virus - specific CD4+ T cells primarily differentiate into TFH and TH1 effector cells (43). Our findings demonstrate that mTORC2 signaling is selectively critical for TFH differentiation in the late stage (4–8 days), but not early fate commitment (1–3 days). Moreover, mTORC2 plays an essential role in mediating the effector function of TFH cells to assist B cells, which is accomplished by regulating the TFH transcriptional program and migratory ability toward B cell follicles.
Materials and Methods
Mice, Virus, and Immunization
Rictorfl/fl, Cd4-Cre transgenic, and C57BL/6J (CD45.2+ and CD45.1+) mice were obtained from the Jackson Laboratory. Sh2d1a−/− (Sap−/−) mice were provided by Dr. Hai Qi (Tsinghua University). SMARTA (CD45.1+) transgenic mice and the LCMV Armstrong strain were provided by Dr. Rafi Ahmed (Emory University). The mice were infected with 2 × 10⁵ plaque-forming units (PFU) of LCMV Armstrong at 6–10 weeks of age, and both sexes were included without randomization or “blinding.” Bone marrow (BM) chimeras were infected after 8–10 weeks of reconstitution. To establish bacterial infection, mice were intravenously infected with 1 × 10⁶ colony-forming units of Listeria monocytogenes expressing LCMV glycoprotein-specific I-Ab-restricted CD4+ T cell epitope gp61-80 (LM-gp61), that was created from vector strain1 (44). 4-Hydroxy-3-nitrophenylacetyl-conjugated ovalbumin (NP-OVA) (N-5051-100, Biosearch Technology) was 1:1 emulsified with Complete Freund’s Adjuvants (F5881, Sigma) and immunized mice subcutaneously of 100 µg per mouse. All immunized mice were housed in accordance with institutional biosafety regulations of the Third Military Medical University. All mouse experiments were performed in accordance with the guidelines of the Institutional Animal Care and Use Committees of the Third Military Medical University.
Flow Cytometry and Antibodies
Major histocompatibility complex class II (I-Ab) tetramer specific for the LCMV epitope of glycoprotein amino acids 66–77 was provided by the tetramer core facility of the US National Institutes of Health (Emory). The antibodies used for flow cytometry are listed in Table S1 in Supplementary Material. Surface staining was performed in PBS containing 2% FBS. CXCR5 staining was performed using purified anti-CXCR5 (BD Biosciences) for 1 h at 4°C, followed by biotinylated anti-rat immunoglobulin G (IgG) (Jackson Immunoresearch) and then fluorescently labeled streptavidin (eBioscience) for 30 min on ice. Staining was performed in PBS containing 0.5% BSA, 2% FCS, and 2% normal mouse serum. Staining for Bcl-6, c-Maf, TCF-1, IgG1, IgG2a, and Foxp3 was performed with the Foxp3/Transcription Factor Staining Buffer Set (00-5523, eBioscience). Major histocompatibility complex class II tetramer staining was performed by incubation of the tetramer with cells for 1 h at 37°C. For detection of phosphorylated mTOR signaling proteins, lymphocytes were first stained with surface markers and then were stimulated with anti-CD3 (2 µg/ml, 100302, Biolegend), anti-CD28 (0.5 µg/ml, 102102, Biolegend), anti-ICOS (2 µg/ml, 14-9949-82, eBioscience), gp61–80 peptide (2 µg/ml), or CXCL13 (4 µg/ml, 4583906, Biolegend) at 37°C for 1 h. Stimulated cells were immediately fixed with Phosflow Lyse/Fix buffer (558049, BD Biosciences), followed by permeabilization with Phosflow Perm buffer I (557885, Biosciences) and staining with primary unconjugated antibodies against p-S6 (Ser 235/236) (D57.2.2E, Cell Signaling Technology) and p-AKT (Ser 473) (#4060S, Cell Signaling Technology). Next, primary unconjugated antibodies were detected by secondary staining with anti-rabbit IgG A488 antibody (A21206, Invitrogen) or anti-rabbit IgG A647 antibody (#4414S, Cell Signaling Technology). Flow cytometry data were acquired with a FACS Canto II (BD Biosciences) and were analyzed with FlowJo software (Tree star, Ashland, OR, USA).
Retroviral Constructs and Transduction
The humanized-Cre (hCre) coding sequences were amplified and cloned into the vectors MIGR1 (MSCV-IRES-GFP). Retroviruses were packaged by transfection of plat-E cells with the retroviral vectors along with plasmid pCLeco. SMARTA cells were activated in vivo by injection of 200 µg of peptide (LCMV glycoprotein amino acids 61–80) into SMARTA mice. After 18 h, activated SMARTA cells were purified by negative selection with BeaverBeads Mag500 Streptavidin Matrix (22302, Beaver) and then “spin-infected” for 90 min at 37°C by centrifugation (800 × g) with freshly harvested retrovirus supernatants, 8 µg/ml polybrene (H9268, Sigma-Aldrich), and 20 ng/ml of IL-2 (130-098-221, Miltenyi Biotec). Then, the transduced SMARTA cells were transferred into recipient mice, followed by infection of the hosts with LCMV.
Adoptive Transfer
A total of 1 × 10⁶ (for analysis at day 3) or 2 × 10⁴ (for analysis at day 8) retrovirus-transduced SMARTA (CD45.1+) cells were adoptively transferred into naive C57BL/6J (CD45.2+) mice, which were infected intravenously with 2 × 10⁶ PFU (day 3) or infected intraperitoneally with 2 × 10⁵ PFU (day 8) of the LCMV Armstrong strain on the following day. For assessment of mTOR activity kinetics, a total of 2 × 10⁶ (for analysis at day 2) or 4 × 10⁴ (for analysis at day 5) or 2 × 10⁴ (for analysis at day 8) naive SMARTA (CD45.1+) cells were adoptively transferred into naive C57BL/6J (CD45.2+) mice, which were infected intravenously with 2 × 10⁶ PFU (for analysis at day 2) or infected intraperitoneally with 2 × 10⁵ PFU (for analysis at day 5 and 8) of the LCMV Armstrong strain on the following day. For evaluation of TFH cell function, 3 × 10⁶ sorted TFH cells from Rictor−/− or WT mice (CD45.1+) were adoptively transferred into Sap−/− recipient mice (CD45.2+) which were infected with LCMV 1 day before cell transfer and then the hosts were analyzed on day 6 after cell transfer.
Enzyme-Linked Immunosorbent and Enzyme-Linked Immunospot Assay
Lymphocytic choriomeningitis virus-specific IgG and antibody-secreting cells (ASCs) were measured by enzyme-linked immunosorbent assay (ELISA) and enzyme-linked immunospot (ELISPOT) assay, respectively, which has been described (45, 46).
Generation of Bone Marrow Chimeras
For each chimera, 5 × 10⁶ BM cells of a 4:6 mixture derived from Rictor−/− or Rictorfl/fl (CD45.2+) mice and C57BL/6J (CD45.1+) mice were intravenously transferred into lethally irradiated (2 doses of 550 rads each) C57BL/6J (CD45.1+) recipients. Recipient mice were allowed 8–10 weeks for reconstitution before infection with LCMV.
Immunofluorescence Staining
Tissues immersed in OCT were quickly frozen in liquid nitrogen and cut into 7-µm-thick sections. Frozen tissue sections were fixed in cold acetone for 10 min at −20°C, blocked with 5% BSA and 1:100 Fc-blocker in PBS, and stained with biotin-IgD, FITC-labeled anti-GL7, and PE-labeled anti-CD4, followed by Alex 650 dye-labeled avidin. After each step, the slides were washed at least three times with PBS. Coverslips were mounted on slides using an antifade kit (BOSTER) and then examined using a Zeiss LSM 800 confocal fluorescence microscope. The images were processed with LSM Image Examiner software (Zeiss).
Microarray and Bioinformatics Analysis
Isolation of TFH cells from WT and Rictor−/− mice at day 8 after infection has been described previously (14). Total RNA was extracted according to the TRIzol reagent protocol (Life Technologies) and submitted to CapitalBio for microarray analysis. Gene-set-enrichment analysis (GSEA) software (Broad Institute) was used for analysis (47). The data discussed in this publication have been deposited in NCBI’s Gene Expression Omnibus (48) and are accessible through GEO Series accession number GSE111536 (https://www.ncbi.nlm.nih.gov/geo/query/acc.cgi?acc=GSE111536).
Quantitative RT-PCR
For comparison of gene expression in TFH cells from Rictor−/− and WT mice, the cells were sorted and subsequently lysed in TRIzol LS reagent (10296; Life Technologies). Total RNA was extracted and reverse-transcribed with a RevertAid H Minus First-Strand cDNA Synthesis Kit (K1632; Thermo Scientific). The resulting cDNA was analyzed for expression of various genes with the SYBR Green PCR kit (208054, QIAGEN) on a CFX96 Touch Real-Time System (Bio-Rad) and the appropriate primers for “test genes” (Table S2 in Supplementary Material).
Transwell Migration Chemotaxis Assay
For enrichment of CD4+ T cells, total splenocyte samples from WT and Rictor−/− mice at day 8 after infection with LCMV were subjected to depletion of cells that were positive for lineage markers (Lin+ cells) using biotin-conjugated antibodies [anti-CD8 (53–6.7), anti-B220 (RA3-6B2), anti-CD11c (N418), anti-Gr-1 (RB6-8C5), anti-TER119 (TER-119), and anti-NK1.1 (PK136), all from Biolegend] coupled to the BeaverBeads Mag500 Streptavidin Matrix (22302, Beaver). The surfaces of the Lin− cells were then stained with anti-CD4, anti-CD44, anti-GITR, anti-CD25, and anti-CXCR5 to identify TFH cells. Next, 4 × 10⁵ TFH cells from WT or Rictor−/− mice were loaded into the upper chamber of a 24-well transwell plate (5-µm pore, Corning), and 600 µl of chemotaxis medium supplemented with or without the CXCL13 (4 µg/ml, 4583906, Biolegend) was added to the lower chamber. The cells were allowed to migrate for 3 h in a 5% CO2 incubator at 37°C. Then, all the migrated cells were collected from the lower chamber, and the numbers of migrated TFH cells were determined by flow cytometry (FACS Canto II). Based on the absolute number of TFH cells, the “net migration (% of input)” was calculated as follows: Net migration (% of input) = (# of migrated TFH cells to CXCL13 − # of migrated TFH cells in the absence of CXCL13)/(# of TFH cells in the input sample).
Conjugate Adhesion Assay
B cells were activated in vivo by injection of 30 µg of LPS (ALX-581-008-Loo2, Enzo Life Sciences) into naive C57BL/6J mice and purified by negative selection with magnetic beads (22302, Beaver) after 18 h. Rictorfl/fl-Cd4-Cre-SMARTA (Rictor−/– SMARTA) cells and WT SMARTA (CD45.1+) cells were adoptively transferred into naive C57BL/6J (CD45.2+) mice, following intraperitoneal infection with 2 × 10⁵ PFU of the LCMV Armstrong strain. Rictor−/− and WT SMARTA TFH cells were sorted from Rictor−/− SMARTA and WT SMARTA chimeras, respectively, at day 8 after LCMV infection. Then, 2 × 10⁵ Rictor−/− and WT SMARTA TFH cells were incubated for 1 h at 37°C in 96-well U-bottom plate with 8 × 10⁵ LPS-activated B cells pulsed with gp61–80 peptide (LCMV glycoprotein amino acids 61–80). The frequency of T cell–B cell conjugates was quantified by flow cytometry as CD4+B220+. I-Ab gp66-77 tetramer+ TFH cells were also used to perform the adhesion assay, and 5 × 10⁴ I-Ab gp66–77 tetramer+ TFH cells were incubated for 1 h at 37°C in 96-well U-bottom plate with 2 × 10⁵ LPS-activated B cells pulsed with gp61-80 peptide. The frequency of T cell–B cell conjugates was quantified by flow cytometry as I-Ab gp66-77 tetramer+ CD4+ B220+.
In Vitro TFH Function Assay
Follicular helper CD4+ T (TFH) cells were sorted from WT or Rictor−/− mice, and B cells were sorted from C57BL/6J mice at day 8 after LCMV infection. U-bottom 96-well plates were seeded with 5 × 10⁴ B cells alone, 5 × 10⁴ B cells and 3 × 10⁴ wild-type TFH cells or 5 × 10⁴ B cells and 3 × 10⁴ Rictor−/− TFH cells, and then supplemented with 200 µl of RPMI medium (10% FBS, 1 × Pen–Strep, l-glutamine) containing anti-CD3 (2 µg/ml, 100302, Biolegend) and anti-IgM (5 µg/ml, 115-006-075, Jackson Immunoresearch). The plates were cultured for 4 days at 37°C, followed by FACS staining using anti-GL7, anti-IgG1, anti-IgG2a, anti-I-A/I-E, anti-CD19, and anti-CD4.
Statistical Analysis
Statistical analysis was conducted with Prism 6.0 software (GraphPad). An unpaired two-tailed t-test with 95% confidence interval was used for calculation of P values. For retroviral transduction and BM chimera experiments, a paired two-tailed t-test with 95% confidence interval was used for calculation of P values. For microarray analysis, we used an unpaired one-tailed t-test with 95% confidence interval for calculation of P values. For in vivo and in vitro TFH function assay and T cell–B cell adhesion assay, we used the one-way ANOVA with multiple comparisons for calculation of P values.
Results
mTORC2 Signaling Is Elevated in TFH Cells and Activated by ICOS and CD3
To evaluate the activity of mTORC2 signaling in TFH and TH1 cells in the context of acute viral infection, we infected wild-type C57BL/6J mice with the Armstrong strain of LCMV and measured the level of AKT phosphorylation at Ser 473, which is an indicator of mTORC2 activity, between TFH and TH1 cells in the spleen on day 8 post-infection. Flow cytometry data demonstrated that TFH cells possessed higher mTORC2 activity than TH1 cells upon anti-CD3 plus anti-CD28 stimulation (Figure 1A).
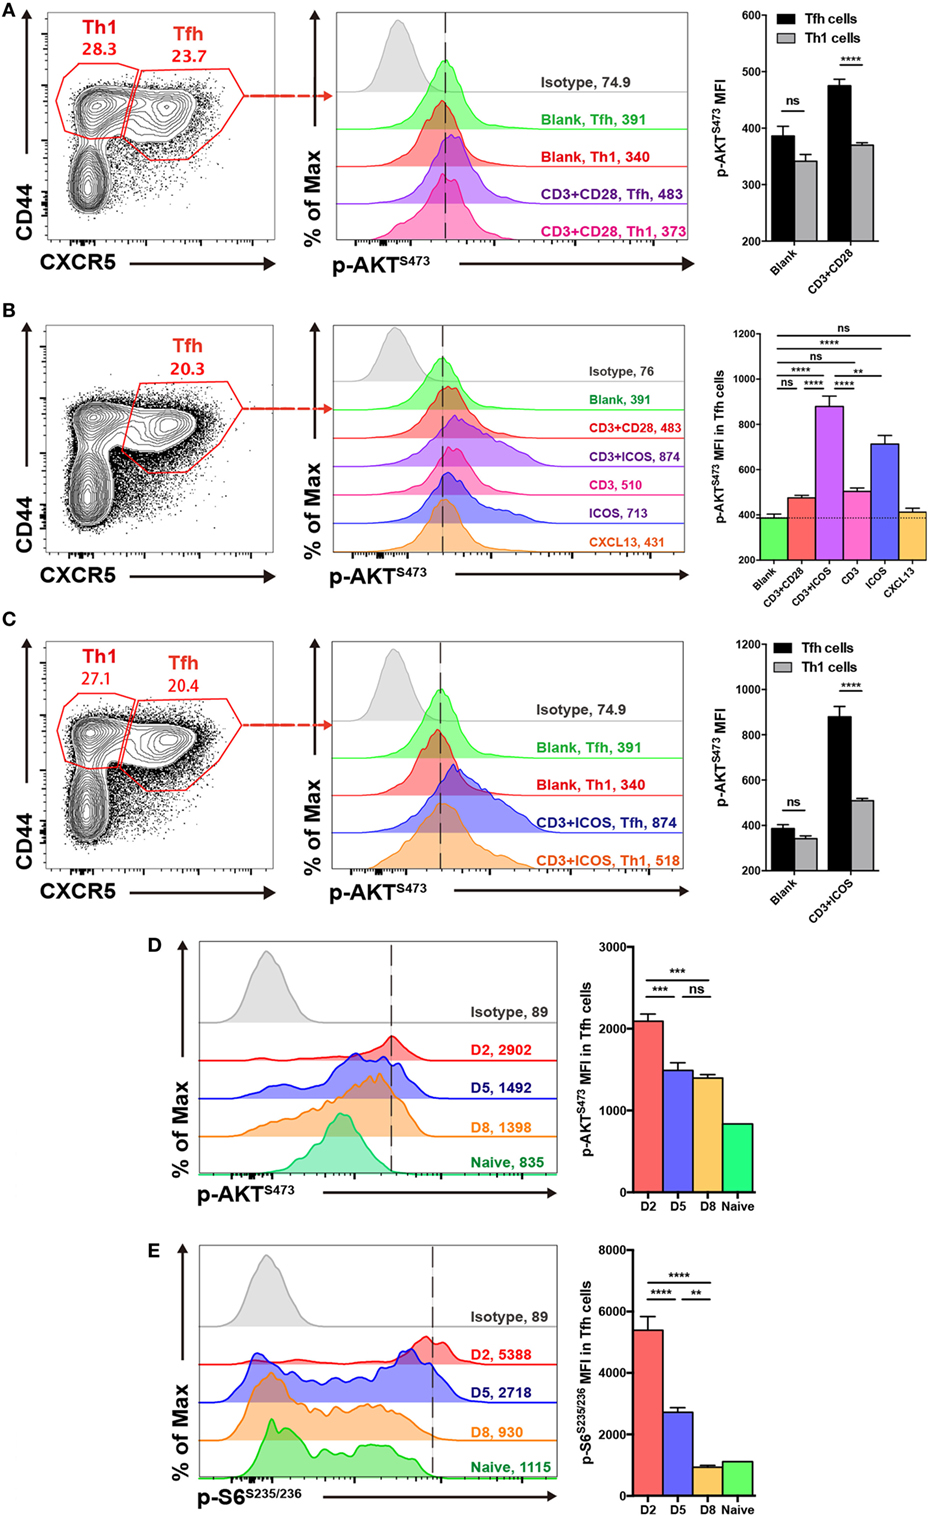
Figure 1. mTOR complex 2 activity is elevated in follicular helper CD4+ T (TFH) cells upon stimulation. (A,C) Comparison of p-AKTS473 mean fluorescence intensity between TFH (CD44hiCXCR5+) and TH1 (CD44hiCXCR5−) cells from the spleen of wild-type C57BL/6J mice at day 8 after lymphocytic choriomeningitis virus infection. (A) TFH and TH1 cells were cultured in medium without any stimulus (blank), or stimulated with anti-CD3 and anti-CD28 (CD3+CD28), and the level of p-AKTS473 was detected by flow cytometry (n = 5 mice per group). (B) TFH cells were activated with different stimuli, and green, red, purple, pink, blue, orange, and gray solid histograms represent the blank, anti-CD3 and anti-CD28, anti-CD3 and anti-ICOS, anti-CD3, anti-ICOS, anti-CXCL13, and isotype control, respectively (n = 5 mice per group). (C) TFH and TH1 cells were cultured in blank medium or stimulated with anti-CD3 and anti-ICOS (CD3+ICOS), and the level of p-AKTS473 was detected by flow cytometry (n = 5 mice per group). (D,E) Kinetics of mTOR activity in SMARTA TFH cells at day 2, 5, and 8 after infection. (D) SMARTA TFH cells were activated with anti-CD3, anti-ICOS, anti-CD28, and gp61-80 peptide, and then the level of p-AKTS473 was detected by flow cytometry (n = 5 mice per group). (E) SMARTA TFH cells were activated with anti-CD3, anti-CD28, and gp61-80 peptide, and then the level of p-S6S235/236 was detected by flow cytometry (n = 5 mice per group). ns, not significant, **p < 0.01, ***p < 0.001, ****p < 0.0001 [unpaired two-tailed t-test (A,C), one-way ANOVA with multiple comparisons (B,D,E)]. Data are representative of three (A–C) or two (D,E) independent experiments. Error bars are SEM (A–C).
Furthermore, to investigate which stimuli were mainly responsible for mTORC2 activation in TFH cells, we stimulated splenocytes from wild-type C57BL/6J mice at day 8 of infection with different combinations, including anti-CD3 plus anti-CD28, anti-CD3 plus anti-ICOS, anti-CD3 only, anti-ICOS only, or CXCL13 only. We then compared mTORC2 activity in TFH cells under these different stimulation conditions and observed that the combination of anti-CD3 plus anti-ICOS elicited the highest mTORC2 signaling (Figure 1B). Next, stimulation of TFH cells with anti-ICOS alone induced high levels of mTORC2 activity, ranking second only to anti-CD3 plus anti-ICOS (Figure 1B). Moreover, TFH cells stimulated with either anti-CD3 or anti-CD3 plus anti-CD28 displayed a certain level of mTORC2 activity, while CXCL13 failed to effectively activate mTORC2 (Figure 1B). These results indicated that ICOS and CD3 signaling were pivotal for mTORC2 signaling activation in TFH cells, while CD28 and CXCL13 signaling might not be necessary. And then, we also compared mTORC2 activity between TFH and TH1 cells upon anti-CD3 plus anti-ICOS stimulation. Consistently, TFH cells also exhibited enhanced mTORC2 activity compared with TH1 cells (Figure 1C).
Next, we analyzed the kinetics of mTOR activity in TFH cells at day 2, 5, and 8 post infection. To achieve this, we adoptively transferred naive SMARTA (CD45.1+) cells with transgenic TCR specific to LCMV glycoprotein I-Ab epitope (49) into naive C57BL/6J (CD45.2+) mice, which were infected with LCMV Armstrong strain on the following day. We found that mTORC2 activity was rapidly induced in early differentiated TFH cells at 48 h post-infection and subsequently maintained at days 5 and 8 post-infection (Figure 1D). In contrast, mTORC1 was highly induced at the initiation phase of TFH differentiation but dramatically declined to the baseline later on (Figure 1E). Taken together, these results demonstrated that TFH cells possessed higher mTORC2 activity compared with TH1 cells. Additionally, ICOS and CD3 signaling might act as important upstream activators of mTORC2 signaling in TFH cells.
mTORC2 Is Intrinsically Required for Effector TFH Cell Differentiation
Since mTORC2 activity was upregulated in TFH cells, we speculated that mTORC2 might play a critical role in TFH cell responses during acute viral infection. To test this hypothesis, we generated Rictorfl/flCd4-Cre mice by crossing Rictorfl/fl mice with transgenic Cd4-Cre mice to conditionally delete Rictor alleles in CD4+ T cells. Next, we infected Rictorfl/flCd4-Cre mice (called “Rictor−/− mice” here) and their Rictorfl/fl littermates (called “WT mice” here) with LCMV Armstrong and measured the level of Rictor mRNA copies and mTORC2 activity in CD4+ T cells. We found that Rictor mRNA expression in both TFH and TH1 cells sorted from Rictor−/− mice was undetectable (Figure S1A in Supplementary Material). Additionally, mTORC2 activity failed to be induced in Rictor−/− CD4+ T cells upon stimulation (Figure S1B in Supplementary Material). However, the level of phosphorylated S6 at Ser 235/236, which is indicative of mTORC1 activity, was comparable between Rictor−/− and WT CD4+ T cells upon stimulation (Figure S1B in Supplementary Material). Therefore, mTORC2 signaling was adequately abrogated in CD4+ T cells from Rictor−/− mice.
Next, we analyzed CD4+ T cell responses at day 8 after LCMV infection, and we found a reduced cell number of total virus-activated CD44hiCD4+ T cells in Rictor−/− mice than control mice (Figure S1C in Supplementary Material) and a similar frequency but lower number of I-Ab restricted LCMV-gp66 epitope-specific CD4+ T cells (Figure 2A). Notably, both the frequency and cell number of tetramer-positive SLAMloCXCR5+ TFH cells were greatly decreased in Rictor−/− mice, whereas the tetramer-positive SLAMhiCXCR5− TH1 cells showed an increased frequency and similar cell number (Figure 2A). Thus, the reduction of total CD44hiCD4+ T cells and tetramer-positive CD4+ T cells were mainly attributable to a decrease in TFH but not TH1 cells, which was in agreement with a previous study showing that mTORC2 was dispensable for TH1 differentiation (32). Moreover, we also measured the expression of CXCR5, Bcl-6, PD-1, and ICOS in tetramer-positive TFH cells and found that all of these TFH cell-associated molecules were downregulated in Rictor−/− mice compared with the WT control (Figure 2B). In addition to tetramer-positive CD4+ T cells, we also analyzed the responses of bulk activated CD4+ T cell and observed similar phenotypes in Rictor−/− mice (Figure 2C; Figure S1D in Supplementary Material). Notably, we observed an approximately 3-fold lower frequency and 10-fold lower cell numbers of Bcl6hicMafhi GC TFH cells in Rictor−/− compared with WT mice (Figure 2D), suggesting an impairment of TFH cell maturation in the absence of mTORC2 signaling. These results showed that mTORC2 signaling was essential for TFH differentiation, but dispensable for TH1 differentiation.
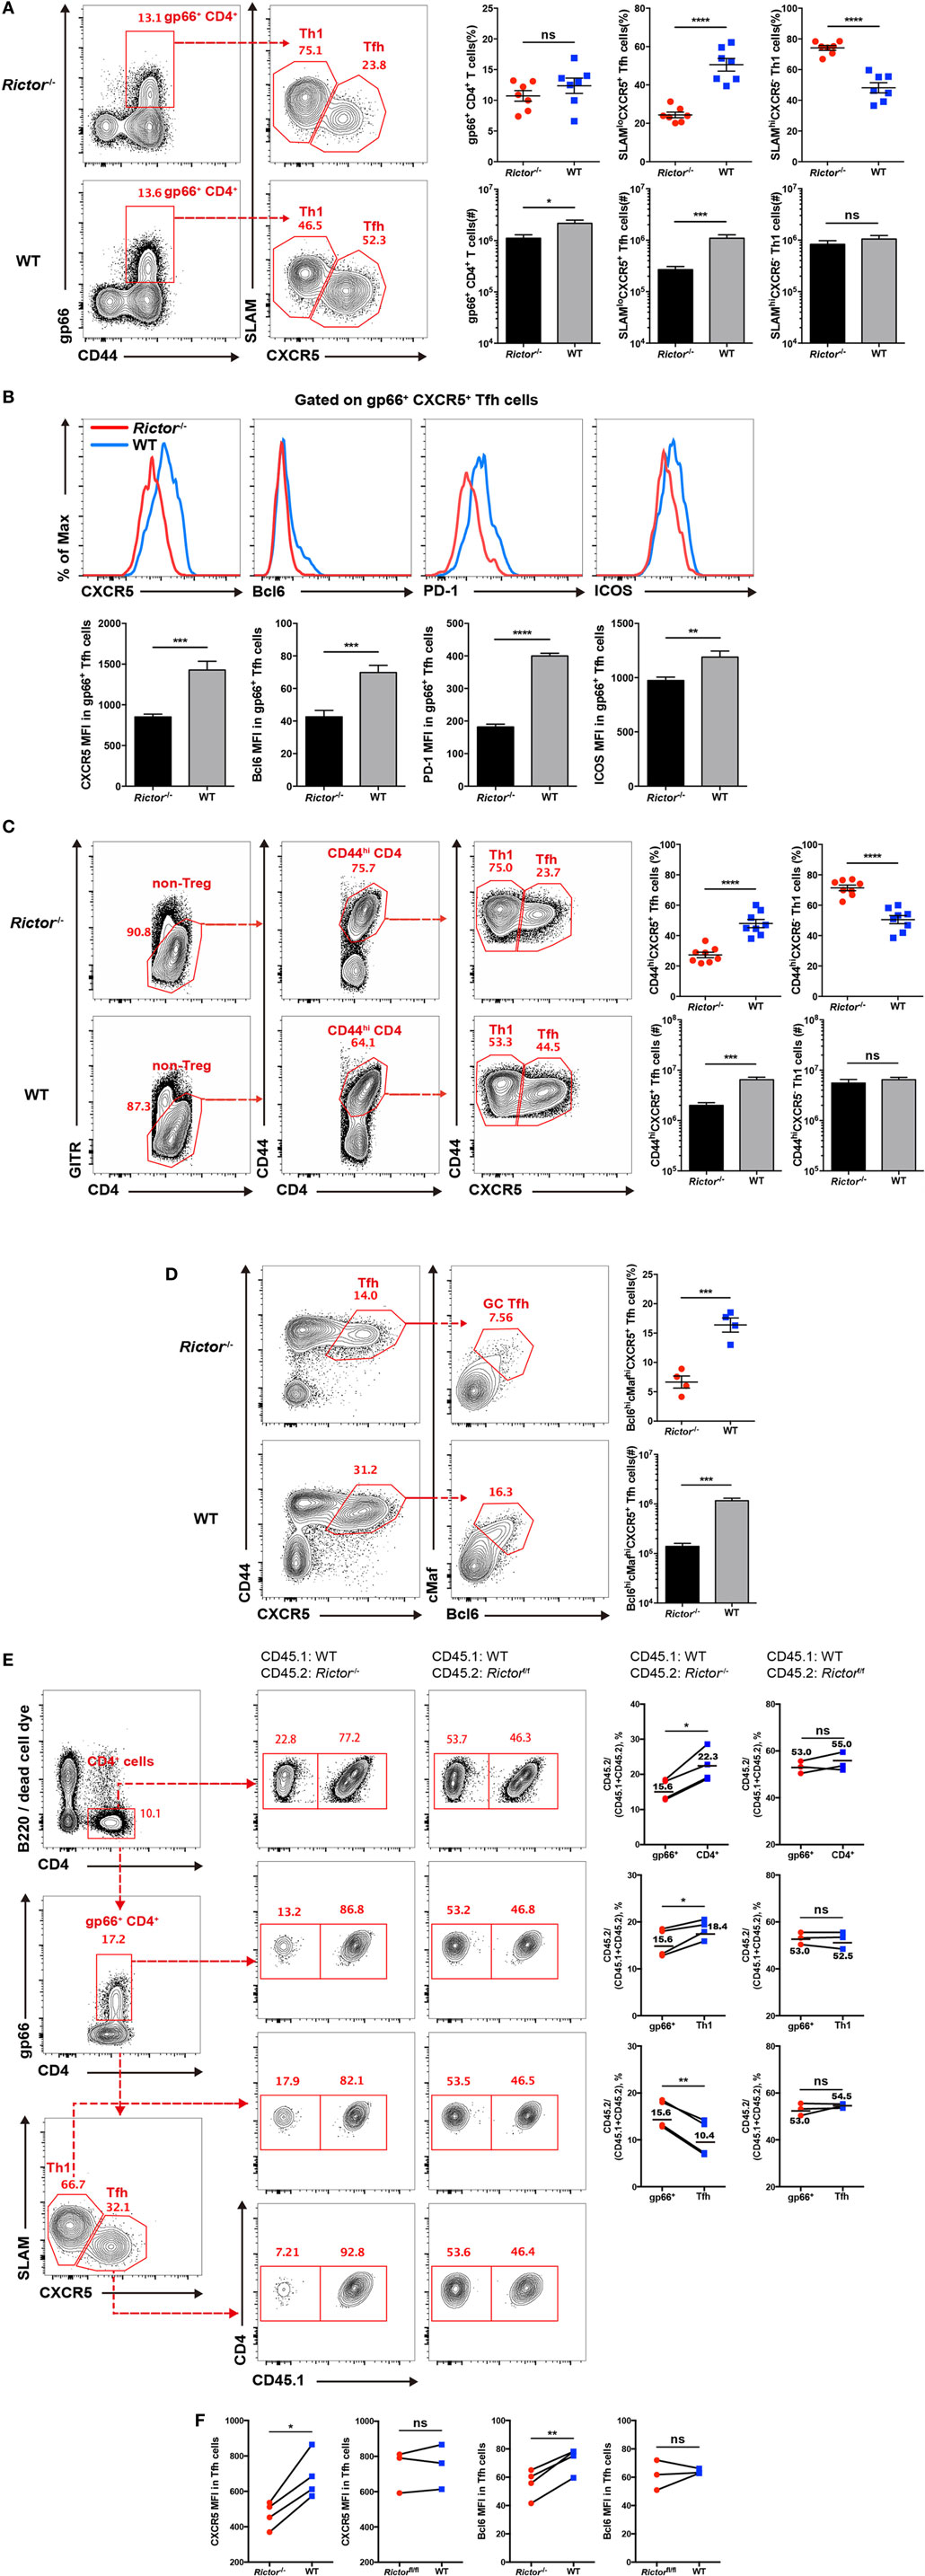
Figure 2. mTOR complex 2 is critical for follicular helper CD4+ T (TFH) differentiation during acute viral infection. (A–D) Cd4-CreRictorfl/fl mice (Rictor−/−) and littermates Rictorfl/fl (WT) mice were infected with lymphocytic choriomeningitis virus (LCMV) Armstrong, and CD4+ T cell responses were assessed in spleen at day 8 after infection. (A) Flow cytometry of TFH (SLAMloCXCR5+) and TH1 (SLAMhiCXCR5−) cells among gp66 tetramer-positive CD4+ T (gp66+ CD4+) cells of Rictor−/− (top) and WT mice (bottom) (left), and summary of the frequency (top) and cell number (bottom) (right) (n = 8 mice per group). (B) Representative flow cytometry plots showing the expression levels of CXCR5, Bcl-6, PD-1, and ICOS on tetramer-positive TFH cells as in (A) from Rictor−/− and WT mice (top), and summary of the mean fluorescence intensity (bottom) (n = 8 mice per group). (C) Flow cytometry of bulk activated TFH (GITRloCD44hiCXCR5+) and TH1 (GITRloCD44hiCXCR5−) cells of Rictor−/− (top) and WT mice (bottom) (left), and summary of the frequency (top) and cell number (bottom) (right) (n = 8 mice per group). (D) Flow cytometry of germinal center TFH cells (Bcl6hicMafhi) among bulk activated TFH cells (GITRloCD44hiCXCR5+) of Rictor−/− (top) and WT mice (bottom) (left), and summary of the frequency (top) and cell number (bottom) (right) (n = 4–5 mice per group). (E,F) Flow cytometry of CD4+ T cell responses in the spleen of KO versus WT bone marrow (BM) chimeras at 8 days after LCMV infection. KO BM chimeras were generated with a mixture of BM cells from Rictor−/− (CD45.2+) and C57BL/6J (WT) (CD45.1+) mice, and WT BM chimeras were reconstituted with a mixture of BM cells from Rictorfl/fl (CD45.2+) and C57BL/6J (WT) (CD45.1+) mice. (E) Representative flow cytometry plots showing competitive contributions by CD45.2+ cells to the total CD4+, gp66+ CD4+, gp66+ TFH, and TH1 cell population in KO and WT BM chimeras (left). Comparison of the contribution of CD45.2+ cells to gp66+ CD4+ versus total CD4+, gp66+ CD4+ versus gp66+ TFH, and gp66+ CD4+ versus gp66+ TH1, respectively (right) (n = 4 mice per group). (F) Expression of CXCR5 and Bcl-6 in KO and WT BM chimeras (n = 4 mice per group). ns, not significant, *p < 0.05, **p < 0.01, ***p < 0.001, ****p < 0.0001 [unpaired (A–D) or paired (E,F) two-tailed t-test]. Data are representative of four (A–D) or two (E,F) independent experiments. Error bars are SEM (A–F).
However, there was a potential concern that CD8+ T cells in Rictor−/− mice were also mTORC2 signaling deficient, which might impact the viral clearance rate and further confound TFH responses. In addition, the impaired TFH cell differentiation in Rictor−/− mice would result in poorer GC B cell responses, which in turn might negatively influence TFH cell responses as a feedback loop. To more precisely assess the role of mTORC2 signaling in TFH cell responses, we established bone marrow (BM) chimeras by transferring cell mixtures of BM cells derived from Rictor−/− mice (CD45.2+) (40%) and C57BL/6J mice (CD45.1+) (60%) into irradiated C57BL/6J recipients (CD45.1+). Control groups were also generated by transferring BM cell mixtures derived from Rictorfl/fl mice (CD45.2+) (40%) and C57BL/6J mice (CD45.1+) (60%). After 8 weeks of reconstitution, we infected these BM chimeras with LCMV Armstrong and analyzed TFH responses at day 8 after infection. First, we gated on the total CD4+ T cell population, CD4+gp66+ population, and gp66+ TFH and TH1 populations, and then we compared the contribution of CD45.2+ cells derived from Rictor−/− or Rictorfl/fl mice among these populations (Figure 2E). We found that CD45.2+ CD4+ T cells originating from Rictor−/− mice accounted for approximately 22.3% of the total CD4+ T cell population; however, CD45.2+ gp66+ cells of Rictor−/− origin accounted for approximately 15.6% of the total gp66+ T cell subset (Figure 2E). Moreover, Rictor-null CD45.2+ TH1 cells contributed approximately 18.4% of the total TH1 cells, while CD45.2+ TFH cell derived from Rictor−/− mice contributed only approximately 10.4% of the total TFH cells (Figure 2E). In control BM chimeras, however, CD45.2+ cells of Rictorfl/fl origin exhibited a stable contribution from 52.53 to 55% among the total CD4+ T, CD4+gp66+, gp66+ TH1, and gp66+ TFH populations (Figure 2E). Additionally, the expression levels of CXCR5 and Bcl-6 were reduced in Rictor−/− TFH cells, but not Rictorfl/fl TFH cells, compared with the control group (Figure 2F). The results from the BM chimera model collectively illustrated that TFH cell differentiation was specifically dampened in the absence of mTORC2 signaling, and more importantly, mTORC2 was required for TFH differentiation in a cell-autonomous manner.
In addition to LCMV infection, we also analyzed TFH responses in different immunization models by infecting Rictor−/− and WT mice with Listeria monocytogenes expressing a CD4+ T cell epitope derived from LCMV gp61-80 (LM-GP61). Phenotypes were observed on day 8 post-infection. In agreement with the results from the LCMV infection, both gp66+ and activated bulk TFH cells from Rictor−/− mice exhibited decreased frequencies and cell numbers compared with Rictorfl/fl littermates (Figure S2A in Supplementary Material). Additionally, similar results were obtained using the 4-hydroxy-3-NP-OVA immunization model (Figure S2B in Supplementary Material). Thus, mTORC2 signaling also played a critical role in TFH cell responses in both bacterial and protein immunization models.
To exclude the possibility that impaired TFH differentiation in Rictor−/− mice was due to defects in CD4+ T cells during T cell development or the naïve state, we assessed the frequencies and cell numbers of single CD4+ T cells, single CD8+ T cells, double-positive, and double-negative T cells in thymus and found no significant differences in these parameters except a slight increase in cell number of double-negative T cells in Rictor−/− mice (Figure S3A in Supplementary Material). We then compared total CD4+ T cell, CD4+CD62Lhi T cell, and CD4+CD44hi T cell populations in spleens from Rictor−/− or WT mice in the naïve state and observed a slightly lower frequency but comparable cell number of total CD4+ T cells in the Rictor−/− group (Figure S3B in Supplementary Material). In addition, the other two populations both displayed similar cell frequencies and numbers between Rictor−/− and WT mice (Figure S3B in Supplementary Material). Therefore, we showed that the decrease in the TFH cell population in Rictor−/− mice was not due to defects in T cell development and homeostasis. Notably, our previous data have shown that the loss of mTORC2 signaling does not alter the generation of TFR cells (39), which indicates that the reduction of the TFH cell population in Rictor−/− mice was probably not due to increased suppression by TFR cells. Therefore, these data demonstrated that intact mTORC2 signaling was essential for effector TFH cell differentiation in viral infection, bacterial infection, and protein immunization models.
Intact mTORC2 Signaling Is Dispensable for TFH Early Induction, but Critical for Late Maturation During TFH Differentiation
To distinguish the role of mTORC2 in early commitment induction or late maturation during TFH differentiation, respectively, we crossed Rictorfl/fl mice with SMARTA mice to generate Rictorfl/fl-SMARTA mice, which enabled us to delete Rictor in SMARTA cells by transducing the humanized - Cre (call “hCre” here) retroviral expression vector in activated SMARTA cells. To achieve this goal, we transduced activated SMARTA cells (CD45.1+) with hCre expressing vector or control empty vector and then adoptively transferred them into WT C57BL/6J recipient mice (CD45.2+), which were subsequently infected with LCMV Armstrong. First, we assessed early TFH differentiation at day 3 after infection, and interestingly, we found that hCre-transduced (GFP+) SMARTA cells with Rictor knocked out showed a similar frequency of Tim3loCXCR5+ TFH cells to empty vector-transduced (GFP+) and non-transduced (GFP−) SMARTA cells (Figure 3A). This result suggested that early differentiated TFH cells were dispensable for mTORC2 signaling.
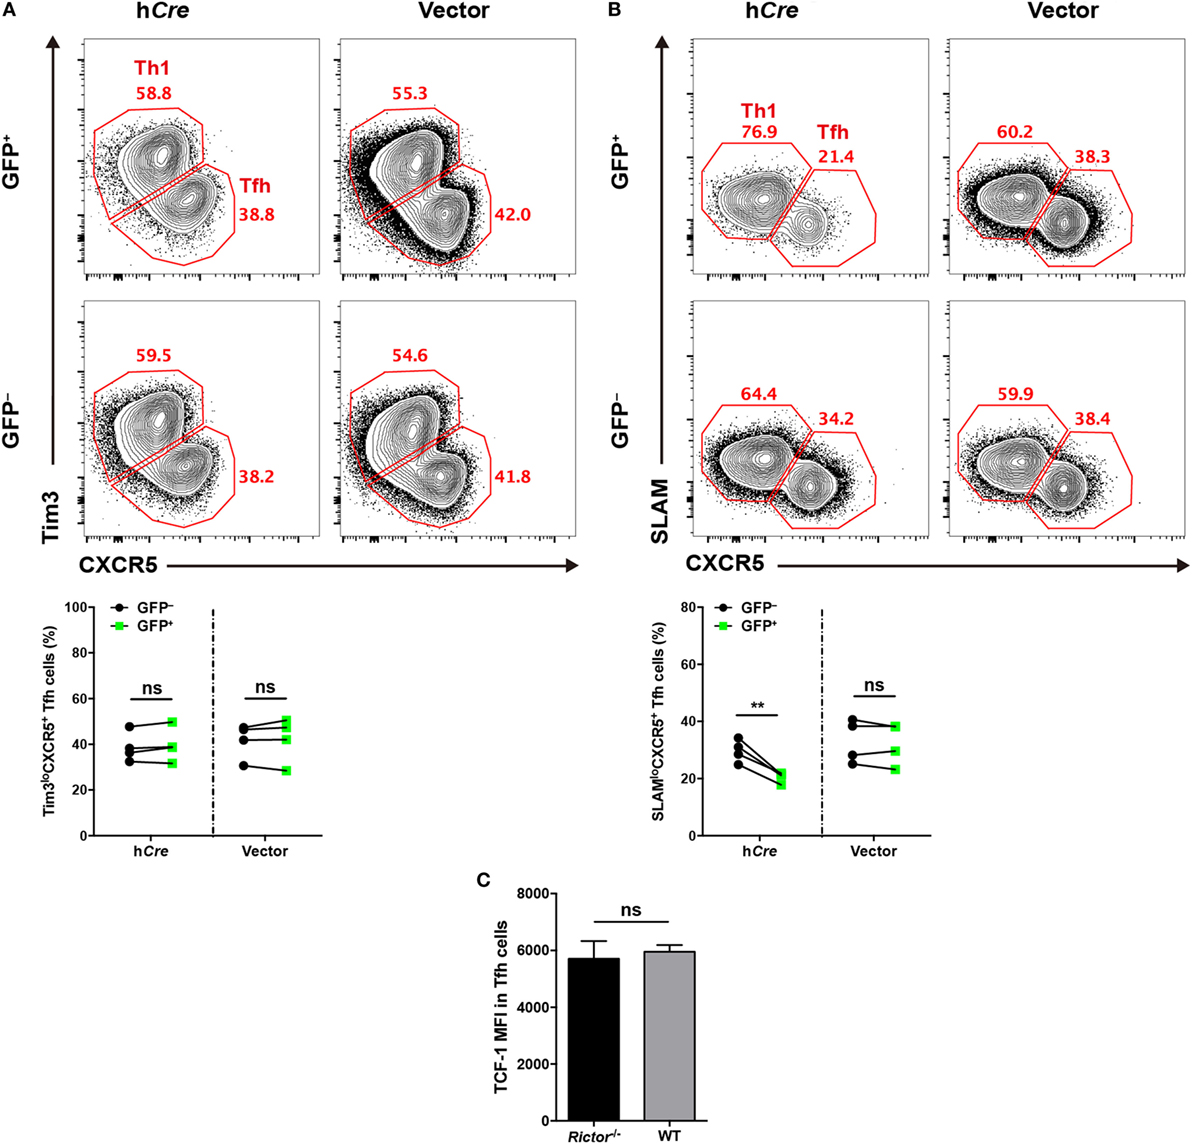
Figure 3. mTOR complex 2 is selectively required for late follicular helper CD4+ T (TFH) differentiation, but not early induction. (A,B) Rictorfl/fl-SMARTA cells were transduced with retrovirus expressing humanized-Cre (hCre) or empty vector (vector) and then transferred cells into recipients (CD45.2+) and subsequently infected with lymphocytic choriomeningitis virus (LCMV). Flow cytometry of TFH differentiation in Rictorfl/fl-SMARTA cells transduced (GFP+) with hCre or vector, or non-transduced (GFP−) at day 3 (A) and 8 (B) after infection (n = 4 mice per group). (C) T cell factor-1 expression in early differentiated TFH cells at day 3 after infection. Rictor−/− or WT SMARTA (CD45.1+) cells were adoptively transferred into naive C57BL/6J (CD45.2+) mice, following intravenously infection with 2 × 10⁶ plaque-forming units of LCMV and analyzed at day 3 after infection (n = 4–6 mice per group). ns, not significant, **p < 0.01 [paired two-tailed t-test (A,B), unpaired two-tailed t-test (C)]. Data are representative of two (A–C) independent experiments. Error bars are SEM (A–C).
Next, we estimated late TFH differentiation at day 8 after infection in comparison to day 3, and we observed a lower abundance of SLAMloCXCR5+ TFH cells differentiating from hCre-transduced SMARTA cells relative to their non-transduced compartments (Figure 3B). However, SMARTA cells transduced with empty vector expressing only GFP showed an equal frequency of TFH cells compared with non-transduced ones (Figure 3B).
Additionally, we generated Rictorfl/flCd4-Cre-SMARTA mice (called “Rictor–/– SMARTA mice” here) by crossing Rictorfl/flCd4-Cre mice with SMARTA mice to specifically delete Rictor in SMARTA cells. Then, we adoptively transferred Rictor−/− or WT SMARTA cells (CD45.1+) into C57BL/6J mice (CD45.2+) and subsequently infected these recipients with LCMV. At day 3 post-infection, we compared the expression of TCF-1 in early differentiated TFH cells from Rictor−/− and WT SMARTA cells, respectively. It turned out that TCF-1 expression level was comparable between these TFH cells, indicating that TCF-1 induction was independent of mTORC2 activity at the early TFH differentiation (Figure 3C). Taken together, these data indicated that mTORC2 signaling was not required for early induction of TFH cells, whereas it played a pivotal role in late maturation of TFH cells.
Defective Responses of mTORC2-Deficient TFH Cells Lead to Impaired Humoral Immunity
Follicular helper CD4+ T cells provide help to cognate B cells to initiate GC reactions and promote the further differentiation of GC B cells into memory B cells and long-lived plasma cells (7). Given the crucial role of TFH cell in B cell responses, the defective TFH differentiation in the absence of mTORC2 appears to have a negative impact on B cell responses. To validate this hypothesis, we first compared the kinetics of GC B cells between Rictor null and WT mice at day 8, 10, and 15 after infection. As expected, we observed a great decrease in the frequencies and cell numbers of GC B cells, as defined by high expression of Fas (CD95) and peanut agglutinin (PNA) (FashiPNAhi) in Rictor−/− mice at all time points (Figure 4A). Likewise, we also observed similar alterations of GC B cells in the Listeria-gp66 and NP-OVA protein immunization model at day 8 after immunization (Figures S4A, B in Supplementary Material). In addition to the decrease in GC B cells, GCs in spleens from Rictor−/− mice were smaller than those in WT mice, and fewer mTORC2-deficient TFH cells could enter and localize within GCs and B cell follicles than WT control (Figure 4B).
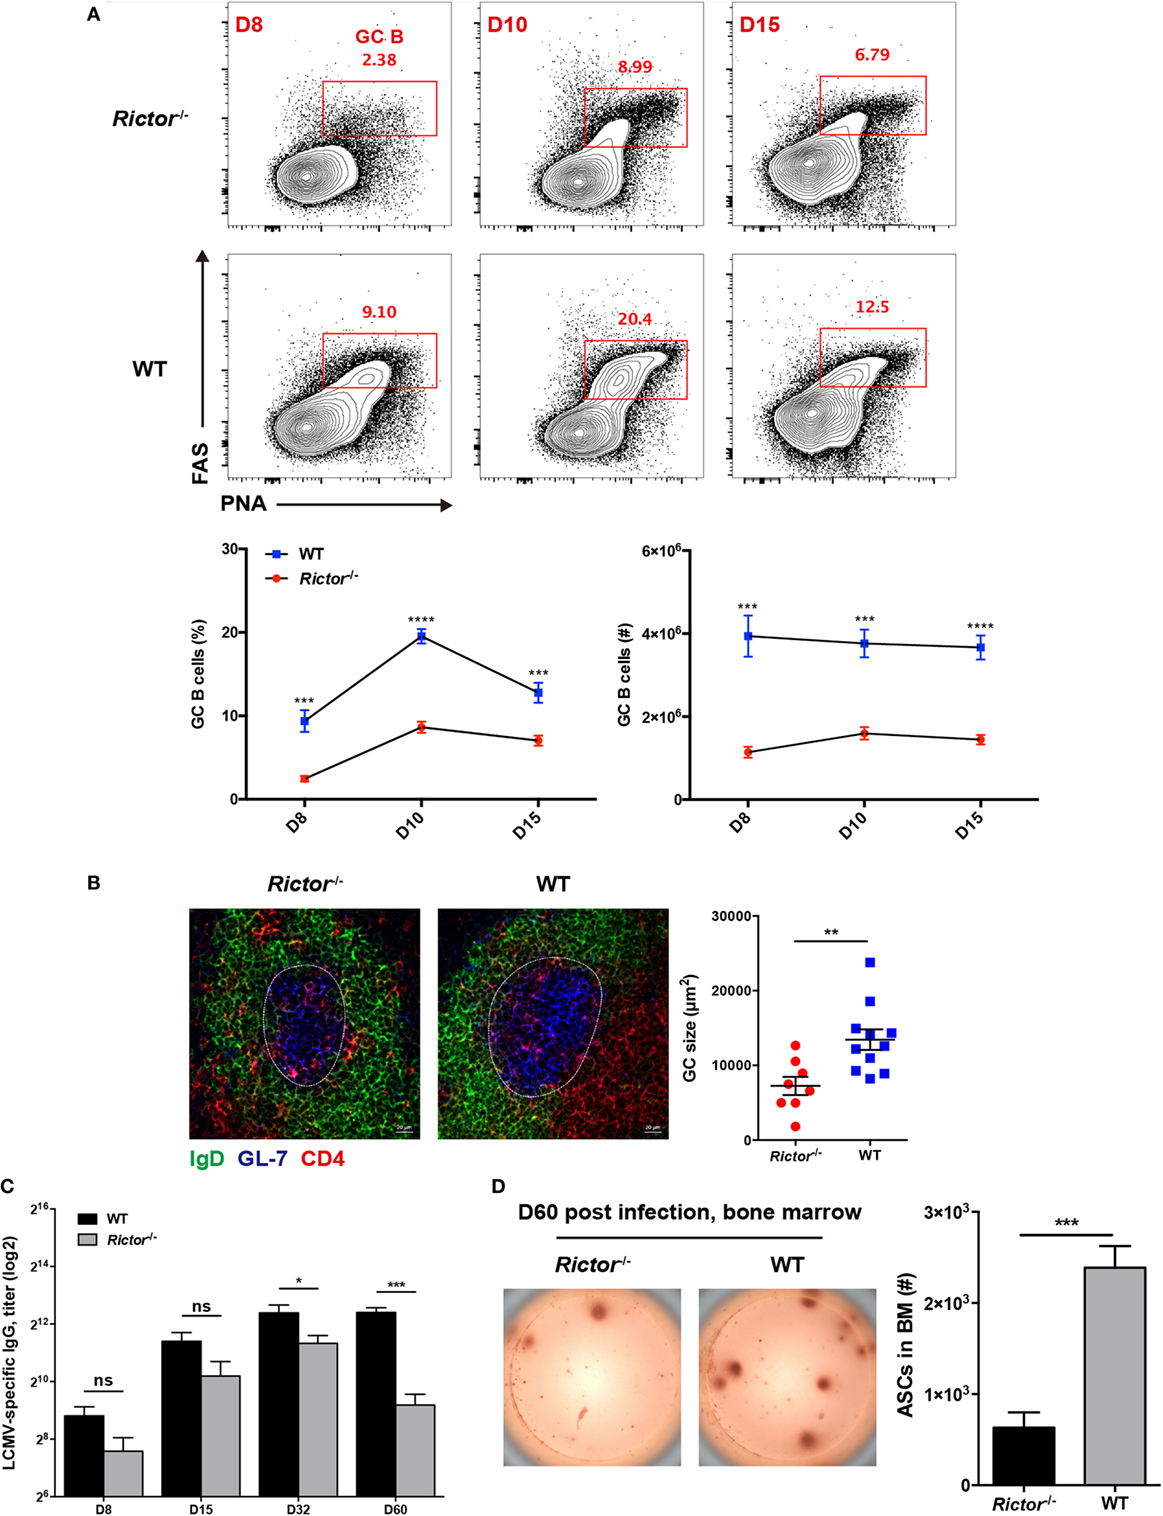
Figure 4. Impaired follicular helper CD4+ T (TFH) differentiation leads to repressed humoral immunity in Rictor−/− mice. (A) Representative flow cytometry plots showing germinal center (GC) B (peanut agglutininhiFAShi) cells in Rictor−/− versus WT mice at day 8, 10, and 15 after lymphocytic choriomeningitis virus (LCMV) infection (top). Summary of GC B cell frequency and cell number (bottom) (n = 5–8 mice per group). (B) Confocal microscopy analysis of GC histology in spleen sections from Rictor−/− and WT mice at day 8 after LCMV infection (green: IgD, blue: GL-7, red: CD4) (Scale bar: 100 µm) (left). Quantification of GC size (right) (n = 3 mice per group). (C) Titers of LCMV-specific immunoglobulin G in serum from Rictor−/− and WT mice at day 8, 15, 32, and 60 after LCMV infection were detected by enzyme-linked immunosorbent assay (n = 5–7 mice per group). (D) Numbers of LCMV-specific antibody-secreting cells (ASCs) in bone marrow from Rictor−/− and WT mice at day 60 after infection, calculated by the enzyme-linked immunospot assay (n = 5 mice per group). ns, not significant, *p < 0.05, **p < 0.01, ***p < 0.001, ****p < 0.0001 [unpaired two-tailed t-test (A–D)]. Data are representative of three (A) or two (B–D) independent experiments. Error bars are SEM (A–D).
Next, we measured LCMV-specific IgG titers in sera at multiple time points after LCMV infection and found that IgG titers were not significantly reduced from day 8 to day 32 in Rictor-deficient compared to control mice; however, they were remarkably downregulated at day 60, indicative of impaired long-term antibody responses (Figure 4C). Consistently, GC-derived LCMV-specific ASCs in the BM were found to be greatly diminished in Rictor−/− compared with WT mice at day 60 post-infection (Figure 4D). Taken together, these data led to the notion that Rictor-deficient mice failed to sustain effective and long-term humoral immunity, which resulted from impaired TFH differentiation.
mTORC2 Regulates Migratory and Functional Properties of Differentiated TFH Cells
Next, we further investigated how mTORC2 regulated TFH cell differentiation and consequently affected humoral immunity. Cognate interactions between TFH and B cells are essential for priming and maintenance of GC responses (50–52), differentiation of memory B cells and long-lived plasma cells (21, 53, 54), and complete differentiation of TFH cells (5, 9, 55). We investigated whether mTORC2 signaling was responsible for the formation of T cell–B cell junctions. To achieve this goal, we constituted SMARTA chimeras by adoptively transferring Rictorfl/flCd4-Cre-SMARTA (called “Rictor–/– SMARTA” here) or WT SMARTA cells (CD45.1+) into C57BL/6J mice (CD45.2+) and subsequently infecting these recipients with LCMV. At day 8 after infection, SMARTA TFH cells were sorted from Rictor−/− and WT SMARTA chimeras and cultured with LPS-activated B cells pulsed or not with gp66 peptide. The T cell–B cell conjugates, which were identified as CD4+B220+ doublets, were quantified by flow cytometry. We found that the frequency of T cell–B cell conjugates was substantially higher in gp66-pulsed groups than unpulsed negative controls (Figure 5A). Of note, a similar frequency of T cell–B cell conjugates was observed between the Rictor−/− and WT group in the presence of gp66 (Figure 5A), and similar results were observed using gp66 tetramer+ TFH cells sorted from Rictor−/− and WT mice (Figure S5A in Supplementary Material). These data indicated that the cell adhesion between TFH and B cells was independent of mTORC2 signaling.
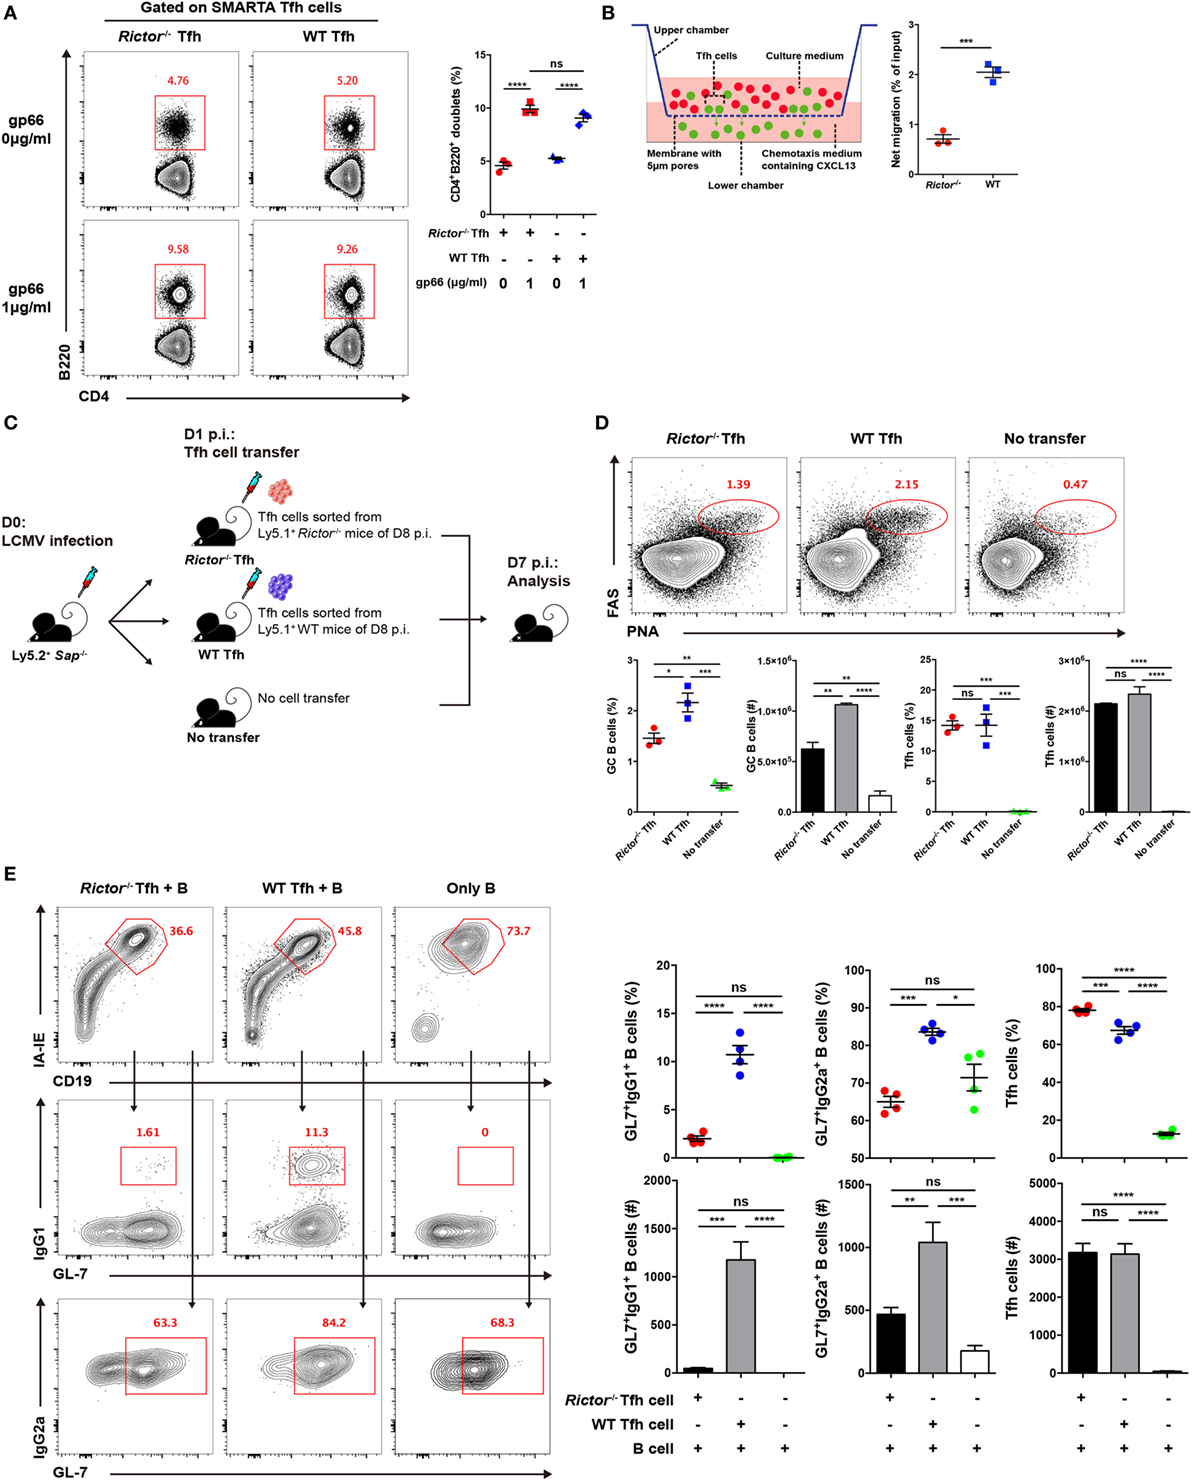
Figure 5. mTOR complex 2 plays an essential role in regulating the migratory ability and effector function of follicular helper CD4+ T (TFH) cells. (A) Rictor−/− or WT SMARTA TFH cells were incubated with LPS-activated B cells pulsed with cognate gp66-peptide or unpulsed (left). The frequency of T cell–B cell conjugates among total SMARTA TFH cells was quantified by flow cytometry (right) (n = 3 samples per group). (B) Working model of the chemotaxis transwell assay for TFH cells (left). The absolute number of migrated TFH cells was quantified by flow cytometry, and the net migration efficiency (% of input) was calculated (right) (n = 3 samples per group). (C) Experimental setup of the in vivo TFH function assay. (D) Representative flow cytometry results of the in vivo TFH function assay (top), Sap−/− mice receiving exogenous TFH cells from Rictor−/− (left) and WT mice (middle) or negative control without cell transfer (right) (top). Summary of frequency and total number of germinal center B cell and exogenous transferred TFH cells in Sap−/− host mice (bottom) (n = 3 mice per group). (E) In vitro TFH function assay assessed at day 4 after culture. Flow cytometry of immunoglobulin G (IgG1)+GL-7+ and IgG2a+GL-7+ GC-like B cells cultured with Rictor−/− or WT TFH cells or in the absence of TFH cells (left). Quantification of the frequencies and total numbers of IgG1+GL-7+, IgG2a+GL-7+ GC-like B cells and TFH cells in culture (right) (n = 4 samples per group). ns, not significant, *p < 0.05, **p < 0.01, ***p < 0.001, ****p < 0.0001 [unpaired two-tailed t-test (B), one-way ANOVA with multiple comparisons (A,D,E)]. Data are representative of two (A–E) independent experiments. Error bars are SEM (A,B,D,E).
High expression of CXCR5 in TFH cells facilitates the response of these cells to the chemokine CXCL13 and migration toward B cell follicles (1–6), where they can engage cognate B cells. Next, to determine whether mTORC2 regulates TFH cell responses by altering its migratory pattern, we conducted a transwell migration assay to analyze the mobility of the TFH cells and ability to directionally respond to CXCL13. We added equal numbers of WT and Rictor−/− TFH cells in the upper chamber of the transwell plate and added medium supplemented with or without CXCL13 in the lower chamber. After 3 h of migration, we found that the number of migrated Rictor−/− TFH cells was largely decreased compared with the WT controls (Figure 5B), suggesting an impairment of the migratory potential of TFH cells lacking mTORC2 signaling in response to CXCL13, which might result in reduced colocalization of TFH and GC B cells and, therefore, constrained TFH differentiation and GC responses.
Finally, we assessed the impact of mTORC2 signaling on the capacity of TFH cells to provide the helper signals for B cell survival and activation. To evaluate the helper function of TFH cell in vivo, we sorted fully differentiated TFH cells from day 8-infected Rictor−/− or WT mice (CD45.1+) and transferred equal number of these cells into Sh2d1a−/− (called Sap−/− here) (CD45.2+) recipients at day 1 of infection (Figure 5C). At day 7 after infection of recipients (6 days after cell transfer), we observed a distinct FashiPNAhi GC B cell population in mice that received exogenous TFH cells from Rictor−/− or WT donor, while mice without cell transfer displayed barely detectable GC B cells (Figure 5D). Additionally, the number of transferred TFH cells was minimally altered (Figure 5D). Importantly, we found that mice that received Rictor−/− TFH cells exhibited an approximately 2-fold lower frequency and number of GC B cells than control mice (Figure 5D), which suggested a disrupted effector function of Rictor-deficient TFH cells.
To further confirm this point, we utilized another approach to assess TFH function in vitro. We sorted fully differentiated TFH cells from Rictor−/− or WT mice and B cells from C57BL/6J mice at day 8 after infection of LCMV and then cultured TFH cells with B cells for 4 days in the presence of anti-CD3 and anti-IgM. Next, we found that the B cells cultured with WT TFH cells formed a distinct population of germinal center-like B cells determined by high expression of IgG1 and GL-7 (IgG1hiGL-7hi) or IgG2a and GL-7 (IgG2ahiGL-7hi), whereas B cells cultured with Rictor−/− TFH cells exhibited a much lower frequency and cell number of activated B cells than that in the WT group (Figure 5E). Moreover, the numbers of Rictor−/− and WT TFH cells were comparable after 4 days of culture (Figure 5E). These data suggested that mTORC2 signaling was essential for the effector function of already differentiated TFH cells to promote B cell differentiation. Therefore, activated B cell responses critically depended on the presence of cognate TFH cells with competent mTORC2 signaling.
mTORC2 Plays an Essential Role in TFH Cell Lineage Identity
To understand the molecular mechanisms by which mTORC2 transcriptionally regulates TFH differentiation and function, we sorted TFH and TH1 cells from Rictor−/− and WT mice at day 8 after infection and performed gene expression microarray analysis. Microarray analysis showed that 561 genes were upregulated and 201 genes were downregulated in Rictor-deficient TFH cells relative to their WT counterparts (Table S3 in Supplementary Material). To further analyze the transcriptomic alterations in Rictor−/− TFH cells, we next selected sets of genes from published datasets (GEO accession codes GSE21379 and GSE21381) that are upregulated and downregulated in TFH cells compared with non-TFH cells (56), for GSEA. GSEA analysis illustrated that the genes related to the TFH cell signature (upregulated in TFH cells) were more enriched in WT TFH cells, but not Rictor−/− TFH cells (Figure 6A). By contrast, Rictor−/− TFH cells showed enrichment for the gene set associated with the non-TFH lineage (downregulated in TFH cells) (Figure 6A). We then assessed 71 genes from the GSEA results and observed a distinct gene expression profile between Rictor−/− TFH cells and WT TFH cells (Figure 6B). These results suggested that mTORC2 signaling deficiency resulted in disruption of TFH lineage specification.
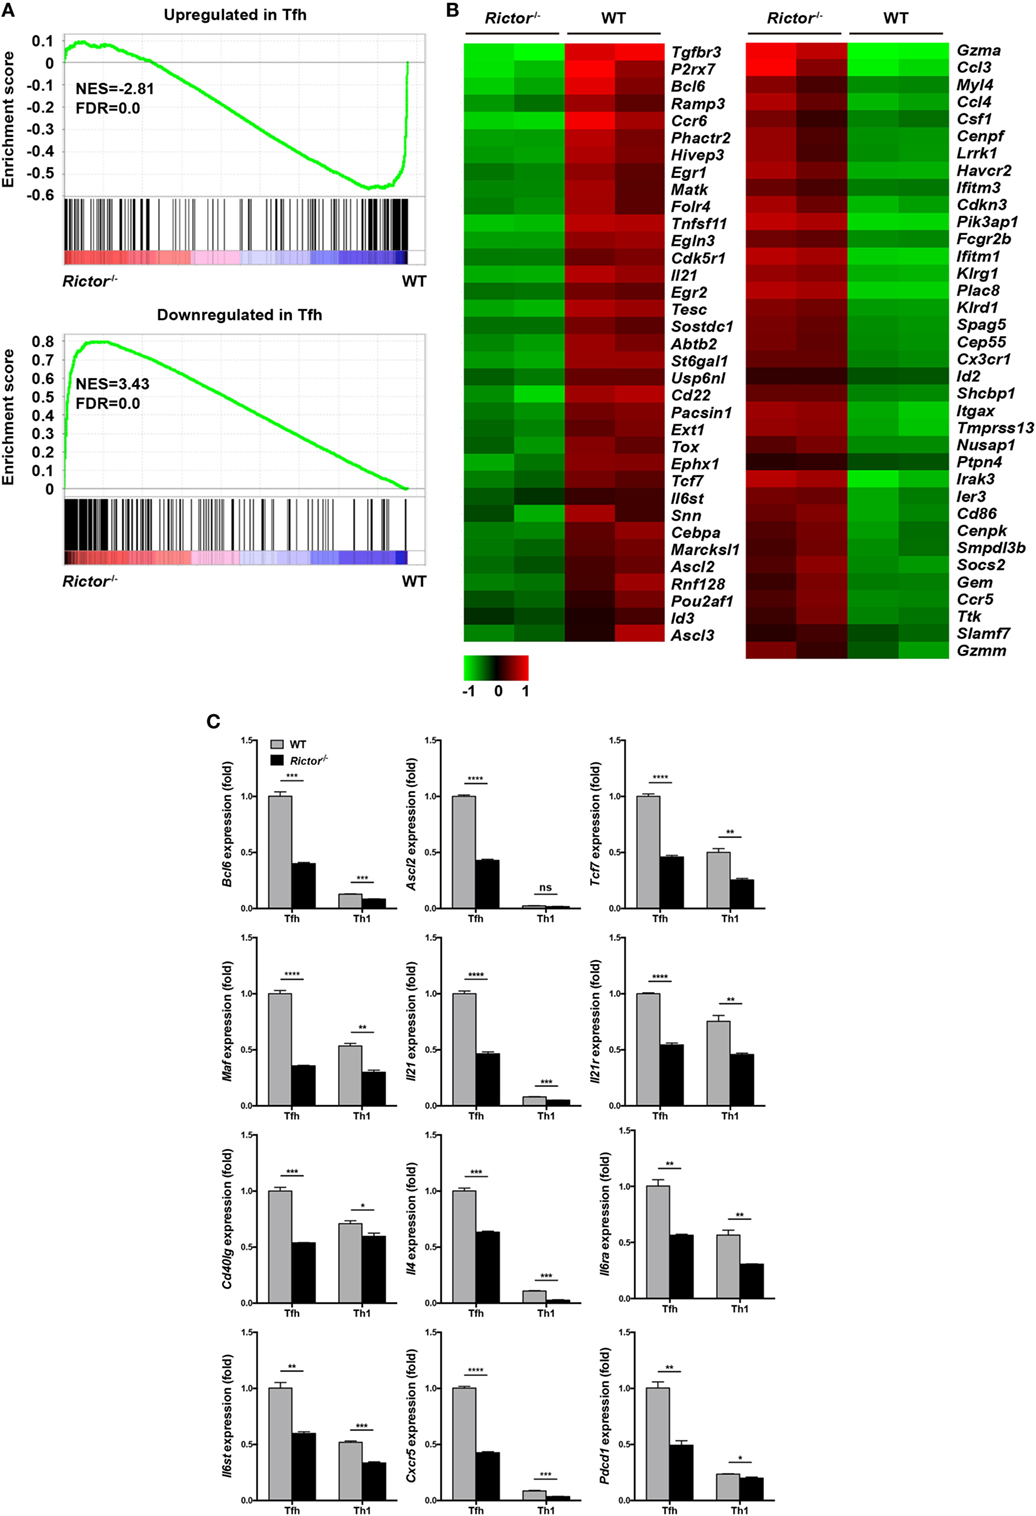
Figure 6. mTOR complex 2 transcriptionally regulates signature programming of follicular helper CD4+ T (TFH) cells. (A) Gene-set-enrichment analysis of gene signatures that were upregulated (top) or downregulated (bottom) in TFH cells relative to their expression in non-TFH cells, TFH cells were sorted from Rictor−/− and WT mice at day 8 after infection with lymphocytic choriomeningitis virus (GEO accession codes GSE21379 and GSE21381). (B) Heat-map representation of the expression of the top 71 genes selected from (A). Red, high gene expression; green, low gene expression. (C) RT-quantitative polymerase chain reaction of selected 12 genes from the microarray data (see Table S3 in Supplementary Material) normalized to the expression level in WT TFH cells (n = 3 samples per group). ns, not significant, *p < 0.05, **p < 0.01, ***p < 0.001, ****p < 0.0001 [unpaired two-tailed t-test (C)]. Data are from one experiment with two biological replicates pooled from six Rictor−/− mice and four WT mice per group (A,B) or are representative of two independent experiments (C). Error bars are SEM (C).
Next, we selected several genes that are closely involved in TFH differentiation and function from the microarray results and confirmed their alterations by quantitative polymerase chain reaction (qPCR) (Figure 6C). We noted that the expression of Bcl6, Ascl2, and Tcf7, which encode key transcription factors in TFH cells, were remarkably downregulated in Rictor-deficient TFH compared with WT TFH cells (Figure 6C). Moreover, we also found that Rictor−/− TFH cells exhibited a lower mRNA abundance of Maf, a c-Maf encoding gene, which induces the expression of IL-21 in TFH cells to support GC development (57, 58) (Figure 6C). Accordingly, both the levels of Il21 and Il21r were downregulated in Rictor-null TFH compared with WT cells (Figure 6C). Similarly, the expression levels of Cd40lg and Il4, encoding CD40L and IL-4 to promote B cell differentiation, were lower in Rictor−/− TFH cells (Figure 6C). Additionally, the expression levels of both Il6ra and Il6st, which encode the IL-6R and gp130 receptors for IL-6, respectively, and are essential for instructing early TFH differentiation, were decreased in Rictor−/− TFH cells (13, 59) (Figure 6C). In addition, we observed a reduction of Cxcr5 and Pdcd1, which respectively encode the TFH distinguishing markers CXCR5 and PD-1 in Rictor−/− TFH cells (Figure 6C). These data suggested that mTORC2 played a critical role in maintaining both TFH lineage identity and functionality.
Discussion
In this study, we focused on dissecting the role of mTORC2 in the temporal regulation of TFH differentiation and effector function upon viral infection. mTORC1 responds to diverse environmental cues, including amino acids, stress, oxygen, energy, and growth factors (25), while mTORC2 is insensitive to nutrients but activated by growth factors (60); however, knowledge is scarce regarding mTORC2 stimuli compared with mTORC1. In our study, we demonstrated that the combination of ICOS and CD3 acted as upstream activators of mTORC2 signaling in TFH cells. Moreover, we found that TFH cells exhibited higher mTORC2 activity than TH1 cells upon stimulation, suggesting that TFH cells might be dependent on mTORC2 activity to a greater degree. Accordingly, the generation of TFH cells, not TH1 cells, was specifically impaired after deletion of Rictor, implying that TFH cells were more sensitive to reduced mTORC2 activity. Furthermore, we found that mTORC2 was required for full differentiation of TFH cells in the B cell-dependent phase, but not priming. In addition to TFH generation, mTORC2 was also necessary for TFH effector functions for helping B cells. Therefore, both lower total numbers and defective functions of TFH cells synergistically resulted in aberrant humoral immunity, characterized by decreased GC B cells, a smaller GC size, poor production of virus-specific IgG, and diminished ASCs in BM. These data collectively indicated a crucial role of mTORC2 signaling in the full commitment of TFH cells and humoral immunity.
Two groups recently reported that mTORC2 signaling regulates TFH differentiation and GC responses in the mesenteric lymph nodes and PPs under the steady state as well as upon protein immunization via distinct mechanisms (41, 42). Yang and colleagues found that mTORC2 promoted TFH cell survival but did not affect proliferation through the phosphorylation of AKT (42). In addition, they showed that the mTORC2–AKT–TCF-1 axis was important for TFH differentiation (42). Another group showed that ICOS-mTORC2-Foxo1 signaling axis was required for TFH differentiation by promoting glucose metabolism and the TFH transcriptional program (41). Moreover, they observed a reduction of TFH and GC B cells after abrogation of mTORC2 signaling in the LCMV acute infection model, which was repeatable in our study (41). However, these studies did not dissect the different roles of mTORC2 in early and late stages during TFH differentiation, respectively, nor assess the influence of mTORC2 on TFH effector functions. Here, we provided unambiguous evidence showing that mTORC2 signaling was required for the late, but early priming, stage of TFH differentiation; in addition, mTORC2 was important for supporting TFH effector functions.
The complete differentiation and maintenance of TFH cells depends on the necessary signals, including CD80, CD86, ICOSL, and CD40, provided by cognate B cells (61–64). To receive signals from B cells, it is critical for TFH cell to migrate to B cell follicles and colocalize with B cells after priming, and subsequently to form T cell–B cell junctions. Although we found that T cell–B cell adhesion was not affected by mTORC2, the TFH migratory capacity in responses to CXCL13 was impaired in the absence of mTORC2, which resulted from downregulated CXCR5 expression. Furthermore, it has been reported that mTORC2 regulates cytoskeletal remodeling and cell migration by phosphorylating a series of proteins of PKC family, including PKC-α, PKC-δ, PKC-ζ, PKC-γ, and PKC-ε (65–69). Therefore, in addition to downregulated CXCR5 expression, mTORC2 may play a potential role in modulating TFH cell migration via the mTORC2–PKC axis; however, the underlying mechanisms remain unclear and merit further exploration. Taken together, a compartmental segregation between TFH and B cells formed after abrogation of mTORC2 signaling, preventing TFH full differentiation in the B cell-dependent phase: fewer TFH cells were maintained, underwent further development into GC TFH cells, and accomplished functional maturation. Accordingly, we found that mTORC2-deficient TFH cells failed to provide adequate help to B cells, even under in vitro culture conditions, which eliminated the interferences from reduced colocalization of TFH and B cell. This indicated that mTORC2 signaling was critical for TFH effector functions assisting B cells, at least in part because mTORC2 promoted the expression of TFH function-related genes, such as Il4, Il21, and Cd40lg.
Our study results led to the conclusion that mTORC2 was involved in the regulation of TFH cell late differentiation and effector functions. Moreover, it is well accepted that exaggerated TFH responses and functions provide a great contribution to the pathogenesis of autoimmune diseases characterized by spontaneous GC formation and autoantibody production, such as systemic lupus erythematosus and rheumatoid arthritis (70–72). Therefore, suppression of TFH responses by targeting the mTORC2 signaling pathway might serve as a potential therapeutic strategy for autoimmune diseases.
Ethics Statement
All mouse experiments were performed in accordance with the guidelines of the Institutional Animal Care and Use Committees of the Third Military Medical University.
Author Contributions
YH, ZY, YZW, and LY designed and oversaw experiments. YH, YFW, XL, XY, PW, QT, XC, ZL, JW, ZX, XZ, and YZ performed experiments. YH and QB analyzed experiments. YH and LY wrote the paper.
Conflict of Interest Statement
The authors declare that the research was conducted in the absence of any commercial or financial relationships that could be construed as a potential conflict of interest.
Acknowledgments
We thank Dr. R. Ahmed (Emory University) for generous providing us LCMV Armstrong virus and SMARTA transgenic mice; We thank Dr. Hai Qi (Tsinghua University) for generous providing us Sh2d1a−/− (Sap−/−) mice. We also thank Dr. Yisong Wan (University of North Carolina) for providing us tetramers. We are grateful to CapitalBio Corporation (Beijing, China) for performing microarray experiments and data analysis, and we thank the core facility center of Third Military Medical University for cell sorting.
Funding
The work was supported by grants from the National Key Research Development Plan (No.2016YFA0502202 to LY), the National Natural Science Foundation of China (No.81471624 to LY).
Supplementary Material
The Supplementary Material for this article can be found online at https://www.frontiersin.org/articles/10.3389/fimmu.2018.01127/full#supplementary-material.
References
1. Schaerli P, Willimann K, Lang AB, Lipp M, Loetscher P, Moser B. CXC chemokine receptor 5 expression defines follicular homing T cells with B cell helper function. J Exp Med (2000) 192(11):1553–62. doi:10.1084/jem.192.11.1553
2. Kim CH, Rott LS, Clarklewis I, Campbell DJ, Wu L, Butcher EC. Subspecialization of CXCR5+ T cells: B helper activity is focused in a germinal center-localized subset of CXCR5+ T cells. J Exp Med (2001) 193(12):1373–82. doi:10.1084/jem.193.12.1373
3. Breitfeld D, Ohl L, Kremmer E, Ellwart JW, Sallusto F, Lipp M, et al. Follicular B helper T cells express Cxc chemokine receptor 5, localize to B cell follicles, and support immunoglobulin production. J Exp Med (2000) 192(11):1545–52. doi:10.1084/jem.192.11.1545
4. Cyster JG, Ansel KM, Reif K, Ekland EH, Hyman PL, Tang HL, et al. Follicular stromal cells and lymphocyte homing to follicles. Immunol Rev (2000) 176:181–93. doi:10.1034/j.1600-065X.2000.00618.x
5. Haynes NM, Allen CDC, Lesley R, Ansel KM, Killeen N, Cyster JG. Role of CXCR5 and CCR7 in follicular Th cell positioning and appearance of a programmed cell death gene-1 high germinal center-associated subpopulation. J Immunol (2007) 179(8):5099–108. doi:10.4049/jimmunol.179.8.5099
6. Ansel KM, Mcheyzerwilliams LJ, Ngo VN, Mcheyzerwilliams MG, Cyster JG. In vivo-activated Cd4 T cells upregulate Cxc chemokine receptor 5 and reprogram their response to lymphoid chemokines. J Exp Med (1999) 190(8):1123–34. doi:10.1084/jem.190.8.1123
7. Crotty S. Follicular helper CD4 T cells (TFH). Annu Rev Immunol (2011) 29(1):621–63. doi:10.1146/annurev-immunol-031210-101400
8. Victora GD, Nussenzweig MC. Germinal centers. Annu Rev Immunol (2012) 30:429–57. doi:10.1146/annurev-immunol-020711-075032
9. Goenka R, Barnett LG, Silver JS, Neill PJO, Hunter CA, Cancro MP, et al. Cutting edge: dendritic cell-restricted antigen presentation initiates the follicular helper T cell program but cannot complete ultimate effector differentiation. J Immunol (2011) 187(3):1091–5. doi:10.4049/jimmunol.1100853
10. Johnston RJ, Poholek AC, DiToro D, Yusuf I, Eto D, Barnett B, et al. Bcl6 and Blimp-1 are reciprocal and antagonistic regulators of T follicular helper cell differentiation. Science (2009) 325(5943):1006–10. doi:10.1126/science.1175870
11. Nurieva RI, Chung Y, Martinez GJ, Yang XO, Tanaka S, Matskevitch TD, et al. Bcl6 mediates the development of T follicular helper cells. Science (2009) 325(5943):1001–5. doi:10.1126/science.1176676
12. Yu D, Rao S, Tsai LM, Lee SK, He Y, Sutcliffe EL, et al. The transcriptional repressor Bcl-6 directs T follicular helper cell lineage commitment. Immunity (2009) 31(3):457–68. doi:10.1016/j.immuni.2009.07.002
13. Choi YS, Eto D, Yang JA, Lao C, Crotty S. Cutting edge: STAT1 is required for IL-6-mediated Bcl6 induction for early follicular helper cell differentiation. J Immunol (2013) 190(7):3049–53. doi:10.4049/jimmunol.1203032
14. Xu L, Cao Y, Xie Z, Huang Q, Bai Q, Yang X, et al. The transcription factor TCF-1 initiates the differentiation of TFH cells during acute viral infection. Nat Immunol (2015) 16(9):991. doi:10.1038/ni.3229
15. Wu T, Shin HM, Moseman EA, Ji Y, Huang B, Harly C, et al. TCF1 is required for the T follicular helper cell response to viral infection. Cell Rep (2015) 12(12):2099–110. doi:10.1016/j.celrep.2015.08.049
16. Choi YS, Gullicksrud JA, Xing S, Zeng Z, Shan Q, Li F, et al. LEF-1 and TCF-1 orchestrate TFH differentiation by regulating differentiation circuits upstream of the transcriptional repressor Bcl6. Nat Immunol (2015) 16(9):980–90. doi:10.1038/ni.3226
17. Liu X, Chen X, Zhong B, Wang A, Wang X, Chu F, et al. Transcription factor achaete-scute homologue 2 initiates follicular T-helper-cell development. Nature (2014) 507(7493):513–8. doi:10.1038/nature12910
18. Xu H, Li X, Liu D, Li J, Zhang X, Chen X, et al. Follicular T-helper cell recruitment governed by bystander B cells and ICOS-driven motility. Nature (2013) 496(7446):523–7. doi:10.1038/nature12058
19. Garside P, Ingulli E, Merica R, Johnson JG, Noelle RJ, Jenkins MK. Visualization of specific B and T lymphocyte interactions in the lymph node. Science (1998) 281(5373):96–9. doi:10.1126/science.281.5373.96
20. Okada T, Miller MJ, Parker I, Krummel MF, Neighbors M, Hartley SB, et al. Antigen-engaged B cells undergo chemotaxis toward the T zone and form motile conjugates with helper T cells. PLoS Biol (2005) 3(6):e150. doi:10.1371/journal.pbio.0030150
21. Allen CDC, Okada T, Cyster JG. Germinal-center organization and cellular dynamics. Immunity (2007) 27(2):190–202. doi:10.1016/j.immuni.2007.07.009
22. Barnett LG, Simkins HMA, Barnett BE, Korn LL, Johnson AL, Wherry EJ, et al. B cell antigen presentation in the initiation of follicular helper T cell and germinal center differentiation. J Immunol (2014) 192(8):3607–17. doi:10.4049/jimmunol.1301284
23. Choi YS, Kageyama R, Eto D, Escobar TC, Johnston RJ, Monticelli L, et al. ICOS receptor instructs T follicular helper cell versus effector cell differentiation via induction of the transcriptional repressor Bcl6. Immunity (2011) 34(6):932–46. doi:10.1016/j.immuni.2011.03.023
24. Zoncu R, Efeyan A, Sabatini DM. mTOR: from growth signal integration to cancer, diabetes and ageing. Nat Rev Mol Cell Biol (2011) 12(1):21–35. doi:10.1038/nrm3025
25. Laplante M, Sabatini DM. mTOR signaling in growth control and disease. Cell (2012) 149(2):274–93. doi:10.1016/j.cell.2012.03.017
26. Laplante M, Sabatini DM. mTOR signaling at a glance. J Cell Sci (2009) 122(20):3589–94. doi:10.1242/jcs.051011
27. Ma XM, Blenis J. Molecular mechanisms of mTOR-mediated translational control. Nat Rev Mol Cell Biol (2009) 10(5):307–18. doi:10.1038/nrm2672
28. Hay N, Sonenberg N. Upstream and downstream of mTOR. Genes Dev (2004) 18(16):1926–45. doi:10.1101/gad.1212704
29. Duvel K, Yecies JL, Menon S, Raman P, Lipovsky AI, Souza AL, et al. Activation of a metabolic gene regulatory network downstream of mTOR complex 1. Mol Cell (2010) 39(2):171–83. doi:10.1016/j.molcel.2010.06.022
30. Oh WJ, Jacinto E. mTOR complex 2 signaling and functions. Cell Cycle (2011) 10(14):2305–16. doi:10.4161/cc.10.14.16586
31. Chi H. Regulation and function of mTOR signalling in T cell fate decisions. Nat Rev Immunol (2012) 12(5):325–38. doi:10.1038/nri3198
32. Delgoffe GM, Pollizzi KN, Waickman AT, Heikamp EB, Meyers DJ, Horton MR, et al. The kinase mTOR regulates the differentiation of helper T cells through the selective activation of signaling by mTORC1 and mTORC2. Nat Immunol (2011) 12(4):295–303. doi:10.1038/ni.2005
33. Battaglia M, Stabilini A, Roncarolo M. Rapamycin selectively expands CD4+CD25+FoxP3+ regulatory T cells. Blood (2005) 105(12):4743–8. doi:10.1182/blood-2004-10-3932
34. Delgoffe GM, Kole TP, Zheng Y, Zarek PE, Matthews KL, Xiao B, et al. The mTOR kinase differentially regulates effector and regulatory T cell lineage commitment. Immunity (2009) 30(6):832–44. doi:10.1016/j.immuni.2009.04.014
35. Haxhinasto S, Mathis D, Benoist C. The AKT–mTOR axis regulates de novo differentiation of CD4+Foxp3+ cells. J Exp Med (2008) 205(3):565–74. doi:10.1084/jem.20071477
36. Liu G, Burns S, Huang G, Boyd KL, Proia RL, Flavell RA, et al. The receptor S1P1 overrides regulatory T cell-mediated immune suppression through Akt-mTOR. Nat Immunol (2009) 10(7):769–77. doi:10.1038/ni.1743
37. Sauer S, Bruno L, Hertweck A, Finlay DK, Leleu M, Spivakov M, et al. T cell receptor signaling controls Foxp3 expression via PI3K, Akt, and mTOR. Proc Natl Acad Sci U S A (2008) 105(22):7797–802. doi:10.1073/pnas.0800928105
38. Ray JP, Staron M, Shyer JA, Ho P, Marshall HD, Gray SM, et al. The interleukin-2-mTORc1 kinase axis defines the signaling, differentiation, and metabolism of T helper 1 and follicular B helper T cells. Immunity (2015) 43(4):690–702. doi:10.1016/j.immuni.2015.08.017
39. Xu L, Huang Q, Wang H, Hao Y, Bai Q, Hu J, et al. The kinase mTORC1 promotes the generation and suppressive function of follicular regulatory T cells. Immunity (2017) 47(3):538–51. doi:10.1016/j.immuni.2017.08.011
40. Lee K, Gudapati P, Dragovic S, Spencer CT, Joyce S, Killeen N, et al. Mammalian target of rapamycin protein complex 2 regulates differentiation of Th1 and Th2 cell subsets via distinct signaling pathways. Immunity (2010) 32(6):743–53. doi:10.1016/j.immuni.2010.06.002
41. Zeng H, Cohen S, Guy C, Shrestha S, Neale G, Brown SA, et al. mTORC1 and mTORC2 kinase signaling and glucose metabolism drive follicular helper T cell differentiation. Immunity (2016) 45(3):540–54. doi:10.1016/j.immuni.2016.08.017
42. Yang J, Lin X, Pan Y, Wang J, Chen P, Huang H, et al. Critical roles of mTOR Complex 1 and 2 for T follicular helper cell differentiation and germinal center responses. Elife (2016) 5:e17936. doi:10.7554/eLife.17936
43. Hale JS, Youngblood B, Latner DR, Mohammed AUR, Ye L, Akondy R, et al. Distinct memory CD4+ T cells with commitment to T follicular helper- and T helper 1-cell lineages are generated after acute viral infection. Immunity (2013) 38(4):805–17. doi:10.1016/j.immuni.2013.02.020
44. Shen H, Slifka MK, Matloubian M, Jensen ER, Ahmed R, Miller JF. Recombinant Listeria monocytogenes as a live vaccine vehicle for the induction of protective anti-viral cell-mediated immunity. Proc Natl Acad Sci U S A (1995) 92(9):3987–91. doi:10.1073/pnas.92.9.3987
45. Rasheed MAU, Latner DR, Aubert RD, Gourley T, Spolski R, Davis CW, et al. Interleukin-21 is a critical cytokine for the generation of virus-specific long-lived plasma cells. J Virol (2013) 87(13):7737–46. doi:10.1128/JVI.00063-13
46. Hao Y, Li Z, Wang Y, Liu X, Ye L. Analyzing mouse B cell responses specific to LCMV infection. In: Liu C, editor. B Cell Receptor Signaling: Methods and Protocols, Methods in Molecular Biology. Vol 1707. New York: Springer (2018). p. 15–38. doi:10.1007/978-1-4939-7474-0_2
47. Subramanian A, Tamayo P, Mootha VK, Mukherjee S, Ebert BL, Gillette MA, et al. Gene set enrichment analysis: a knowledge-based approach for interpreting genome-wide expression profiles. Proc Natl Acad Sci U S A (2005) 102(43):15545–50. doi:10.1073/pnas.0506580102
48. Edgar R, Domrachev M, Lash AE. Gene expression omnibus: NCBI gene expression and hybridization array data repository. Nucleic Acids Res (2002) 30(1):207–10. doi:10.1093/nar/30.1.207
49. Oxenius A, Bachmann MF, Zinkernagel RM, Hengartner H. Virus-specific major MHC class II-restricted TCR-transgenic mice: effects on humoral and cellular immune responses after viral infection. Eur J Immunol (1998) 28(1):390–400. doi:10.1002/(SICI)1521-4141(199801)28:01<390::AID-IMMU390>3.0.CO;2-O
50. Fuller KA, Kanagawa O, Nahm MH. T cells within germinal centers are specific for the immunizing antigen. J Immunol (1993) 151(9):4505–12.
51. Qi H, Cannons JL, Klauschen F, Schwartzberg PL, Germain RN. SAP-controlled T-B cell interactions underlie germinal centre formation. Nature (2008) 455(7214):764–9. doi:10.1038/nature07345
52. Han S, Hathcock K, Zheng B, Kepler TB, Hodes R, Kelsoe G. Cellular interaction in germinal centers. Roles of CD40 ligand and B7-2 in established germinal centers. J Immunol (1995) 155(2):556–67.
53. Kelsoe G, editor. The germinal center: a crucible for lymphocyte selection. Semin Immunol (1996) 8(3):179–84. doi:10.1006/smim.1996.0022
54. Maclennan ICM, Toellner K, Cunningham AF, Serre K, Sze DMY, Zuniga E, et al. Extrafollicular antibody responses. Immunol Rev (2003) 194(1):8–18. doi:10.1034/j.1600-065X.2003.00058.x
55. Kerfoot SM, Yaari G, Patel JR, Johnson KL, Gonzalez D, Kleinstein SH, et al. Germinal center B cell and T follicular helper cell development initiates in the interfollicular zone. Immunity (2011) 34(6):947–60. doi:10.1016/j.immuni.2011.03.024
56. Choi YS, Yang JA, Yusuf I, Johnston RJ, Greenbaum J, Peters B, et al. Bcl6 expressing follicular helper CD4 T cells are fate committed early and have the capacity to form memory. J Immunol (2013) 190(8):4014–26. doi:10.4049/jimmunol.1202963
57. Linterman MA, Beaton LL, Yu D, Ramiscal RR, Srivastava M, Hogan JJ, et al. IL-21 acts directly on B cells to regulate Bcl-6 expression and germinal center responses. J Exp Med (2010) 207(2):353–63. doi:10.1084/jem.20091738
58. Zotos D, Coquet JM, Zhang Y, Light A, Dcosta K, Kallies A, et al. IL-21 regulates germinal center B cell differentiation and proliferation through a B cell-intrinsic mechanism. J Exp Med (2010) 207(2):365–78. doi:10.1084/jem.20091777
59. Eto D, Lao C, Ditoro D, Barnett B, Escobar TC, Kageyama R, et al. IL-21 and IL-6 are critical for different aspects of B cell immunity and redundantly induce optimal follicular helper CD4 T cell (Tfh) differentiation. PLoS One (2011) 6(3):e17739. doi:10.1371/journal.pone.0017739
60. Zinzalla V, Stracka D, Oppliger W, Hall MN. Activation of mTORC2 by association with the ribosome. Cell (2011) 144(5):757–68. doi:10.1016/j.cell.2011.02.014
61. Nurieva R, Chung Y, Hwang D, Yang XO, Kang HS, Ma L, et al. Generation of T follicular helper cells is mediated by interleukin-21 but independent of T helper 1, 2, or 17 cell lineages. Immunity (2008) 29(1):138–49. doi:10.1016/j.immuni.2008.05.009
62. Salekardakani S, Choi YS, Benhnia MR, Flynn R, Arens R, Shoenberger S, et al. B cell-specific expression of B7-2 is required for follicular Th cell function in response to vaccinia virus. J Immunol (2011) 186(9):5294–303. doi:10.4049/jimmunol.1100406
63. Goodjacobson KL, Song E, Anderson SM, Sharpe AH, Shlomchik MJ. CD80 expression on B cells regulates murine T follicular helper development, germinal center B cell survival, and plasma cell generation. J Immunol (2012) 188(9):4217–25. doi:10.4049/jimmunol.1102885
64. Linterman MA, Denton AE, Divekar DP, Zvetkova I, Kane L, Ferreira C, et al. CD28 expression is required after T cell priming for helper T cell responses and protective immunity to infection. Elife (2014) 3:e03180. doi:10.7554/eLife.03180
65. Sarbassov DD, Ali SM, Kim D, Guertin DA, Latek RR, Erdjumentbromage H, et al. Rictor, a novel binding partner of mTOR, defines a rapamycin-insensitive and raptor-independent pathway that regulates the cytoskeleton. Curr Biol (2004) 14(14):1296–302. doi:10.1016/j.cub.2004.06.054
66. Jacinto E, Loewith R, Schmidt A, Lin S, Ruegg MA, Hall A, et al. Mammalian TOR complex 2 controls the actin cytoskeleton and is rapamycin insensitive. Nat Cell Biol (2004) 6(11):1122–8. doi:10.1038/ncb1183
67. Gan X, Wang J, Wang C, Sommer E, Kozasa T, Srinivasula SM, et al. PRR5L degradation promotes mTORC2-mediated PKC-δ phosphorylation and cell migration downstream of Gα12. Nat Cell Biol (2012) 14(7):686–96. doi:10.1038/ncb2507
68. Li X, Gao T. mTORC2 phosphorylates protein kinase Cζ to regulate its stability and activity. EMBO Rep (2014) 15(2):191–8. doi:10.1002/embr.201338119
69. Thomanetz V, Angliker N, Cloetta D, Lustenberger RM, Schweighauser M, Oliveri F, et al. Ablation of the mTORC2 component Rictor in brain or Purkinje cells affects size and neuron morphology. J Cell Biol (2013) 201(2):293–308. doi:10.1083/jcb.201205030
70. Ueno H. T follicular helper cells in human autoimmunity. Curr Opin Immunol (2016) 43:24–31. doi:10.1016/j.coi.2016.08.003
71. Jeon Y, Choi YS. Follicular helper T (Tfh) cells in autoimmune diseases and allograft rejection. Immune Netw (2016) 16(4):219–32. doi:10.4110/in.2016.16.4.219
Keywords: mechanistic target of rapamycin complex 2, follicular helper T cells, germinal center, B cells, acute viral infection
Citation: Hao Y, Wang Y, Liu X, Yang X, Wang P, Tian Q, Bai Q, Chen X, Li Z, Wu J, Xie Z, Zhou X, Zhou Y, Yin Z, Wu Y and Ye L (2018) The Kinase Complex mTOR Complex 2 Promotes the Follicular Migration and Functional Maturation of Differentiated Follicular Helper CD4+ T Cells During Viral Infection. Front. Immunol. 9:1127. doi: 10.3389/fimmu.2018.01127
Received: 09 March 2018; Accepted: 04 May 2018;
Published: 23 May 2018
Edited by:
Yun-Cai Liu, Tsinghua University, ChinaReviewed by:
Hu Zeng, Mayo Clinic, United StatesBin Li, Shanghai Jiao Tong University School of Medicine, China
Copyright: © 2018 Hao, Wang, Liu, Yang, Wang, Tian, Bai, Chen, Li, Wu, Xie, Zhou, Zhou, Yin, Wu and Ye. This is an open-access article distributed under the terms of the Creative Commons Attribution License (CC BY). The use, distribution or reproduction in other forums is permitted, provided the original author(s) and the copyright owner are credited and that the original publication in this journal is cited, in accordance with accepted academic practice. No use, distribution or reproduction is permitted which does not comply with these terms.
*Correspondence: Zhinan Yin, emhpbmFuLnlpbkB5YWxlLmVkdQ==;
Yuzhang Wu, d3V5dXpoYW5nQHRtbXUuZWR1LmNu;
Lilin Ye, eWVsaWxpbmxjbXZAdG1tdS5lZHUuY24=