 Roland Frank
 Michael Gabel
 Kirsten Heiss
 Ann-Kristin Mueller
 Frederik Graw
- 1Centre for Infectious Diseases, Parasitology Unit, University Hospital Heidelberg, Heidelberg, Germany
- 2Centre for Modeling and Simulation in the Biosciences, BioQuant-Center, Heidelberg University, Heidelberg, Germany
- 3German Center for Infection Research (DZIF), Heidelberg, Germany
Whole sporozoite vaccines represent one of the most promising strategies to induce protection against malaria. However, the development of efficient vaccination protocols still remains a major challenge. To understand how the generation of immunity is affected by variations in vaccination dosage and frequency, we systematically analyzed intrasplenic and intrahepatic CD8+ T cell responses following varied immunizations of mice with radiation-attenuated sporozoites. By combining experimental data and mathematical modeling, our analysis indicates a reversing role of spleen and liver in the generation of protective liver-resident CD8+ T cells during priming and booster injections: While the spleen acts as a critical source compartment during priming, the increase in vaccine-induced hepatic T cell levels is likely due to local reactivation in the liver in response to subsequent booster injections. Higher dosing accelerates the efficient generation of liver-resident CD8+ T cells by especially affecting their local reactivation. In addition, we determine the differentiation and migration pathway from splenic precursors toward hepatic memory cells thereby presenting a mechanistic framework for the impact of various vaccination protocols on these dynamics. Thus, our work provides important insights into organ-specific CD8+ T cell dynamics and their role and interplay in the formation of protective immunity against malaria.
Introduction
Despite recent advances and the regulatory approval of the RTS,S vaccine (1–4), the development of an efficient vaccine still remains an urgent priority and one of the major challenges in malaria research. Causing abrogation of parasite development during or shortly after the pre-pathological liver stage of malaria infection, either by radiation of sporozoites, their genetic modification or combined delivery with drug-treatment, has been proven to be the most successful approach to confer sterile protection against malaria infection (5–13). These whole sporozoite vaccination (WSV) strategies, of which, to date, radiation-attenuated sporozoites (RAS) are still the clinically most advanced approach, were shown to induce high levels of protective immunity in humans, non-human primates (NHP) and various mouse models (5, 11, 12). However, many aspects of these approaches still remain to be elucidated to allow the systematic design of effective vaccination protocols. This includes the identification of the actual immune responses mediating protection, as well as the processes regulating their generation and long-term maintenance (13, 14).
Especially studies in animal models, particularly in inbred mice, identified intrahepatic CD8+ memory T cells as the most crucial component mediating protective pre-erythrocytic immunity induced by RAS and other WSV approaches (15–19). The essential role of CD8+ T cells for protection was recently more precisely defined by the characterization of tissue-resident memory CD8+ T cells (TRM) within the liver. These cells shared a specific expression signature, which was largely consistent in two rodent models and correlated with protection in C57BL/6 mice immunized with Plasmodium berghei RAS (PbRAS) (20, 21). Clinical WSV studies also suggested a critical role for liver-resident CD8+ T cell responses, mainly due to a paucity of blood-specific immune correlates of protection and supportive results from studies in NHP (11–13). The effective generation of such local immunity allowing for potent regional recall responses might, therefore, be of utmost importance for the rational design of protective vaccination strategies against malaria (21).
Despite these advances in our current knowledge on protective immune mechanisms and the availability of data from clinical trials, the implementation of WSV approaches still faces major challenges for wide-scale human use. These challenges comprise the development of effective vaccination schedules with regard to the dose and frequency of immunizations. Various regimens have been tested in experimental (17, 19, 22) and clinical trials (12, 13) demonstrating particularly for RAS a requirement for high doses and multiple numbers of intravenous (i.v.) injections. Due to the inaccessibility of the critical tissue-specific CD8+ T cell responses, especially in humans, it remains unclear how these cell populations are formed, maintained, and influenced by alterations in the vaccination regimens.
Several studies in mice have conducted longitudinal analyses of tissue-associated CD8+ T cell responses in spleen and liver following i.v. immunization with RAS. These studies reported (i) increasing frequencies of hepatic CD8+ T effector memory cells (TEM) after consecutive booster immunizations, (ii) exceedingly high threshold frequencies of antigen-specific CD8+ T cell responses necessary for protection, and (iii) different levels of protection dependent on the vaccination protocol (16, 17, 22–24). Despite these findings, we still lack a systematic and quantitative understanding of the differentiation, proliferation, interaction, and maintenance of specific CD8+ T cell subsets in response to vaccination.
To determine how exactly variations in the vaccine dose or number of injections affect these dynamics and, finally, the level and duration of protection, we systematically analyzed the effects of different PbRAS vaccination regimens on the development of tissue-specific CD8+ T cell responses. To this end, we immunized groups of C57BL/6 mice by intravenous injection of PbRAS varying the vaccine dose, the number of injections and the time to analysis. We then used mathematical modeling to infer the underlying dynamics and interactions of different CD8+ T cell subpopulations, with a focus on the central roles of the spleen and the liver in the formation of protective immunity.
Our data revealed differences in the cellular dynamics and maintenance of CD8+ TE/EM responses in spleen and liver depending on vaccination dose and frequency. While the spleen appeared to be critical as priming and source compartment of CD8+ TE/EM responses, the formation of intrahepatic, protection-mediating TRM cells was favored by booster injections and accelerated by higher dosing. Analysis by mathematical models further revealed an almost linear differentiation and migration pathway from splenic precursors toward hepatic memory cells during priming, providing a mechanistic framework for CD8+ T cell differentiation and proliferation by considering the distinct roles, but also the interplay of the spleen and the liver in the formation of protective immunity.
Materials and Methods
Mice and Parasites
Female C57BL/6 mice were obtained from Janvier Labs (Paris, France). NMRI mice were obtained either from Janvier or Charles River Labs (Sulzfeld, Germany). All mice were maintained under specific pathogen-free conditions. At the start of individual experiments mice were age-matched and 6–8 weeks of age.
All experiments were carried out with the rodent parasite Plasmodium berghei ANKA (PbANKA). PbANKA sporozoites were isolated by dissection of salivary glands (SGs) from female Anopheles stephensi mosquitoes at days 17–21 after a bloodmeal on infected NMRI mice. To obtain Pb ANKA radiation-attenuated sporozoites (PbRAS), isolated sporozoites were treated by exposure to 150 Gy of X-rays (X-rad 320, Precision X-Ray, University Hospital Heidelberg).
Immunization and Challenge Experiments
For all immunizations C57BL/6 mice received intravenous (i.v.) injections either with three different doses of PbRAS or an equivalent mock dose of irradiated SG homogenate from uninfected mosquitoes that received a bloodmeal from naïve NMRI mice. All i.v. injections were delivered in a total volume of 100 µl PBS shortly after irradiation using either 1 × 10³ (S-dose), 1 × 10⁴ (N-dose), or 1 × 10⁵ (H-dose) PbRAS. For immunization doses and timings refer to Figure 1 with individual group sizes specified within Table S1 in Supplementary Material.
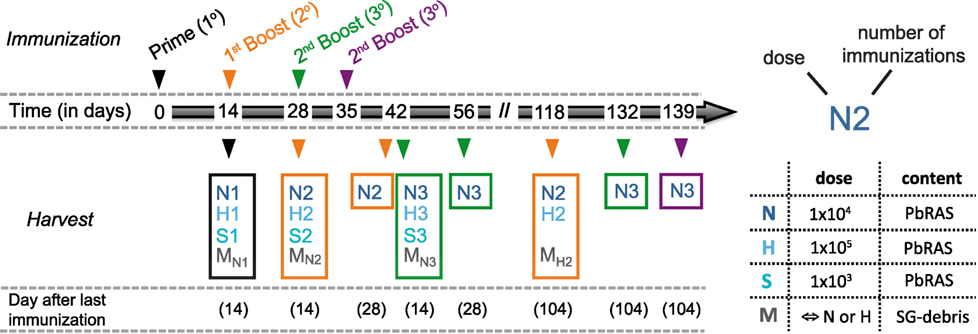
Figure 1. Immunization and analysis schedule. Schematic indicating the time points at which mice were vaccinated and analyzed according to various immunization protocols. Mice received either only a prime (1°, black), a prime-boost (2°, orange), or a prime-boost-boost vaccination scheme (3°, green) with 14 day-intervals between subsequent immunizations using three doses of Plasmodium berghei RAS (PbRAS) including 1 × 10³ (S, sub-protective), 1 × 10⁴ (N, normal), and 1 × 10⁵ (H, high). For one additional group (3°, purple), the second booster injection was administered 21 days after the last boost. Mock-control (M) groups received corresponding doses of salivary gland (SG) debris. Mice were analyzed at indicated timepoints with the time in days after the last immunization noted. Each group is characterized by the dose and the number of injections received and comprised n = 3–6 animals. A detailed table comprising all individual group sizes is shown in Table S1 in Supplementary Material.
Mice were challenged by i.v. injection of 1 × 10³ infectious PbANKA sporozoites in a total volume of 100 µl PBS and examined daily for parasitemia by Giemsa-stained smears from tail blood, starting at day 3 after challenge. In one set of experiments, mice that were protected from a previous challenge received a second i.v. challenge (re-challenge) with 1 × 10⁴ PbANKA sporozoites. Protection was defined as the absence of blood-stage parasites by days 14–28 post-challenge.
Cell Preparation
At defined time points (see Figure 1) mice were euthanized by CO2 inhalation. Spleens and livers were removed following perfusion of the liver with 10 ml PBS. Total splenocyte or liver cell suspensions were obtained by passing the organs through a 70-µm nylon cell strainer (BD Biosciences) or a fine metal strainer (250 µm), respectively. Cells were washed with complete RPMI 1640 medium (RPMI supplemented with 10% FCS, 1× MEM NEAA, 1 mM sodium pyruvate, 5 ml penicillin/streptomycin; all from Gibco). The liver cell suspension was mixed with 36% Easycoll (Biochrom AG) and spun for 10 min, 520 × g at room temperature. For both preparations (liver and spleen), erythrocytes were lysed for 5 min on ice with lysis buffer (0.037 g EDTA, 1 g KHCO3, 8.26 g NH4Cl in 1 l ddH2O, pH 7.4). Subsequently cells were washed with complete medium and counted in Trypan blue.
Cell Staining, Antigen-Specific Stimulation, and Flow Cytometry
Isolated cells from spleen and liver tissue were labeled with monoclonal antibodies (eBioscience): Fluorescein isothiocyanate-conjugated anti-CD8 (53-6.7), allophycocyanin (APC)-conjugated anti-CD44 (IM7), Peridinin Chlorophyll Protein-Cyanine5.5 (PerCP Cy5.5)-conjugated anti-CD62L (MEL-14), phycoerythrin-conjugated anti-IFN-γ (XMG 1.2), phycoerythrin-Cyanine7-conjugated anti-CD69 (H1.2F3). For all stainings, anti-CD16/CD32 (96) was added to block Fc receptors.
Briefly, surface staining was performed in PBS containing monoclonal antibodies for 20 min on ice. Intracellular staining (ICS) was only done following antigen-specific stimulation (see below). For ICS, cells were washed with PBS before fixation with 2% PFA/PBS for 15 min at room temperature followed by staining with anti-IFNγ antibody in permeabilization buffer (0.1% BSA, 0.3% Saponin in PBS) for 20 min on ice. Finally, cells were washed and re-suspended in PBS (subsequent data acquisition) or 1% PFA/PBS, incubated for 5 min at room temperature in the dark, washed once with PBS and stored at 4°C until data acquisition. Among the CD8+ T cells, we distinguished between TN (naïve; CD44lo/CD62Lhi), TCM (central memory; CD44hi/CD62Lhi), TE/EM (effector/effector memory; CD44hi/CD62Llo), and TRM (resident memory; CD44hi/CD62Llo/CD69hi) cells according to their surface markers (Figure S1 in Supplementary Material).
For the analysis of the antigen-specific response to the peptide SALLNVDNL (PbT130) of the PbTRAP protein (25) cells were incubated in complete medium for 16 h at 37°C in the presence of 1 µM PbT130 and Brefeldin A (Sigma-Aldrich, 10 µg/ml) prior to cell staining as described. Cells were measured using a FACSCanto I flow cytometer (BD Bioscience).
Data Analysis and Statistics
Flow cytometry data were analyzed using FlowJo software (version 10.1; FlowJo LLC). Total cell numbers per organ following direct ex vivo surface staining and FACS analysis were calculated by relating percent of the respective cell subset of total detected events to the cell numbers obtained after cell preparation and counting. To calculate total numbers of PbT130-specific CD8+ TE/EM cells per organ, the percentage of IFN-γ-positive (IFN-γ+) cells of CD8+ TE/EM cells measured after 16 h PbT130-stimulation and ICS was related to the total number of CD8+ TE/EM cells obtained directly ex vivo following surface staining assuming equal loss rates for cells during overnight-stimulation. Statistical analysis was performed using nonparametric rank-based relative comparison adjusted for multiple comparisons based on the mctp-function in the R-language of statistical computing (26) to account for small group sizes. p-values with p < 0.05 were considered statistically significant.
Mathematical Model to Describe Booster Effects on Cell Populations Within the Spleen
We developed a simple mathematical model to describe the effect of each prime and booster injection on the number of TCM and TE/EM cells in the spleen 14 days after the last injection. Assuming that the specific cell subpopulation in the spleen, T, increases after each injection, b, by a dose-dependent factor λd, the concentration of cells after b + 1-injections is then defined by
Hereby, T(0) = T0, defines the number of cells within the particular CD8+ T cell subpopulation before prime. While Eq. 1 assumes that the increase in the specific CD8+ T cell subpopulation in the spleen is independent of other compartments, we also extended the model by assuming that additional cell growth in the spleen decreases dependent on the level of TE/EM cells in the liver, TL, thus
Hereby, ΩL, defines the number of TE/EM-cells in the liver at which the additional increase is half of the maximum, and τ a Hill-coefficient indicating the steepness of the assumed saturation effect (see also Appendix A1 in Supplementary Material).
We fitted Eqs. 1 and 2 to the experimental data of TCM and TE/EM cells in the spleen estimating the initial number, T0, the dose-dependent increase per boost, λd, and λd and ΩL, respectively. For Eq. 2, we used the mean values for the measured number of TE/EM cells in the liver and tested different assumptions for the Hill-coefficient τ. Comparison of model performance was assessed by the corrected Akaike information criterion (AICc) (27).
Mathematical Model Describing CD8+ T Cell Differentiation Dynamics in Spleen and Liver
We developed a mathematical model to describe the individual cellular subset dynamics and their interactions in response to different vaccination schemes. The mathematical model is explained in detail in Appendix A2.1 in Supplementary Material. In brief, the modeling framework based on ordinary differential equations considers the proliferation and migration dynamics of five different cellular subtypes including naïve, TCM and TE/EM cells in the spleen, as well as TE/EM and TRM cells in the liver. TCM cells in the liver were neglected as we did not see any influence of immunization protocols on these numbers, suggesting that their appearance in the liver is mainly by chance and dependent on their concentration in the spleen. The modeling framework allows the consideration of all possible interactions and differentiation pathways between the different cellular compartments. We used an unbiased model selection algorithm (Appendix A2.2 in Supplementary Material) to determine the relevant processes and differentiation pathways by fitting the model to the experimental data of all N-dose vaccinated groups based on a maximum likelihood approach. To analyze the dynamics of the vaccination-induced responses, data were normalized by the corresponding measurements for each cellular subset within naïve mice. Model performance was assessed using the corrected AIC (AICc). Identifiability of parameter estimates was assessed using profile likelihood analysis (28) with estimates shown in Figure A2.2 and Table A3.1 in Supplementary Material. All analyses were performed using the R language of statistical computing (26).
Results
CD8+ T Cell Numbers in the Liver Increase Substantially After Booster Injections During Variable PbRAS Vaccination Regimens
In order to examine the effect of variable vaccination regimens on the development of CD8+ T cell responses, we immunized groups of C57BL/6 mice by intravenous (i.v.) injection of PbRAS varying the vaccine dose, number of injections, and time to analysis (Figure 1). A total of three different doses were analyzed, including a “normal” (N-dose: 1 × 10⁴), a “sub-protective” (S-dose: 1 × 10³), and a “high dose” (H-dose: 1 × 10⁵) of PbRAS.
Measuring cell numbers 14 days after the last immunization, we found that both the frequency and total number of TE/EM (CD44hi/CD62Llo) cells in the liver increased with respect to the vaccine dose and the number of injections given (Figures 2A–C). Interestingly, the magnitude of the primary response in the liver measured in absolute cell numbers 14 days after prime did not significantly differ between the N- and H-dose (Figure 2C). However, a notable difference was observed after the first boost, which led to an about threefold higher total number and increased frequency of TE/EM cells in H-dose immunized animals (N2: 0.6 ± 0.15 × 10⁶ and H2: 1.86 ± 0.2 × 10⁶ total TE/EM cells). For the standard immunization with the N-dose we observed that only the second boost (N3) led to a substantial increase in the total TE/EM cell numbers reaching a level of 1.42 ± 0.2 × 10⁶ cells compared to 0.42 ± 0.13 × 10⁶ (N1) and 0.6 ± 0.15 × 10⁶ (N2) cells after prime and first boost, respectively. Here, cell levels obtained after three immunizations with the normal dose are comparable to those that are already reached after one boost with the H-dose (H2) (Figures 2B,C). Thus, a total amount of 3 × 10⁴ PbRAS divided into three i.v. injections (N3) produced similar quantities of TE/EM cells in the liver as detected in mice that received an almost sevenfold higher absolute number of PbRAS administered through only two i.v. injections (H2). While booster effects were much less pronounced following S-dose immunizations, which generated significantly lower proportions of TE/EM cells compared to immunizations by N- and H-doses (Figures 2B,C), the H-dose prime-boost regimen (H2) apparently resulted in a saturation of the TE/EM level in the liver (79.5 ± 1.02% of total CD8+ T cells) that was not further elevated by additional boosting (H3), neither in frequency nor absolute numbers. Analysis of the hepatic CD8+ T cell subsets further revealed that only a small fraction of around 10% of cells exhibited a TCM phenotype (CD44hi/CD62Lhi), which was seemingly unaffected from the choice of dose and number of injections (Figure S2 in Supplementary Material).
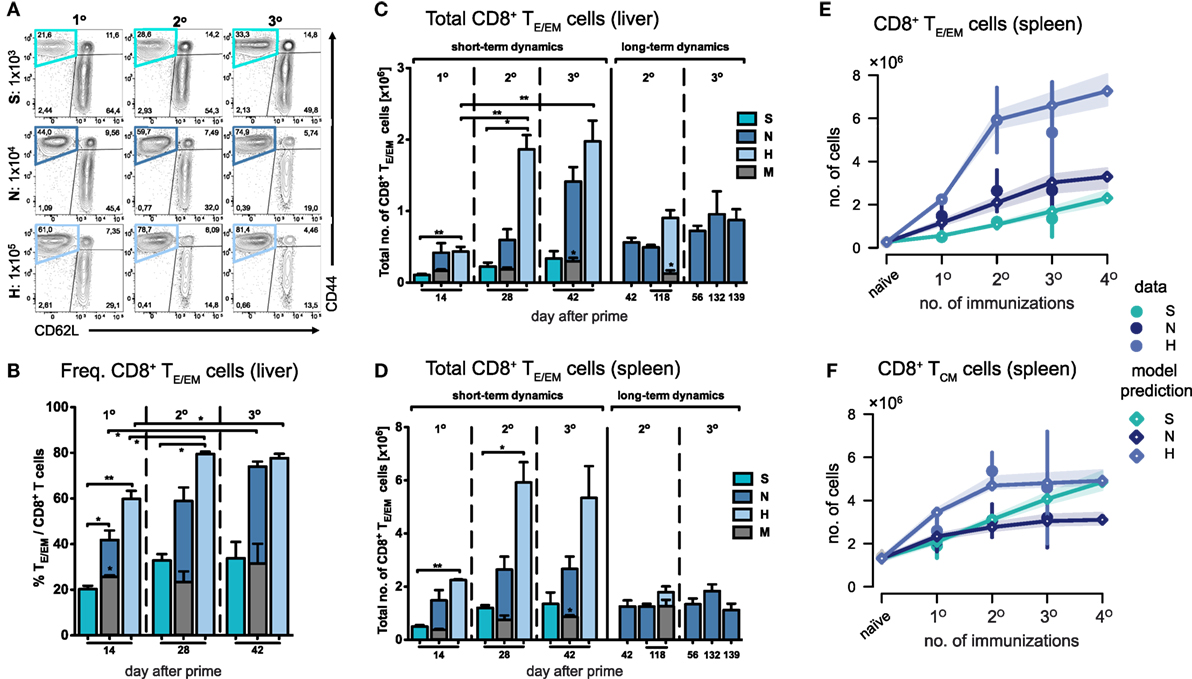
Figure 2. Dynamics of CD8+ TE/EM cells after varying Plasmodium berghei RAS vaccination protocols. (A) Representative FACS-plots of CD8+ T cell responses gated for CD62L and CD44 measured in the liver of mice receiving prime (1°), prime-boost (2°), or prime-boost-boost (3°) immunizations with S-, N-, or H-dose. (B) Increasing percentage of TE/EM cells among CD8+ T cells in the liver with subsequent booster injections dependent on the vaccination dose. Corresponding total number of TE/EM cells in the liver (C) and spleen (D) looking at short-term (measurements taken 14 days after last injection) and long-term dynamics (>14 days after last injection). Numbers below the plots indicate time of measurement in days post prime. Numbers of animals per group are specified within Table S1 in Supplementary Material. Graph bars depict means with SEM; *p < 0.05; **p < 0.01; ***p < 0.001; multiple nonparametric rank-based relative comparison. (E,F) Measured and predicted levels of TE/EM (E) and TCM cells (F) in the spleen using a mathematical model that assumes splenic reactivation to depend on the level of hepatic TE/EM cells prior to immunization. Shaded areas indicate the 95%-confidence intervals of model predictions.
In summary, we observed short-term cumulative booster effects for immunizations with N- and H-doses, but we found no linear relationship between the dose or the number of injections received and the resulting hepatic TE/EM levels.
CD8+ T Cell Dynamics in the Spleen Are Largely Unaffected After Two Immunizations and Influenced by TE/EM Cell Levels Generated in the Liver
In comparison to the liver, TE/EM frequencies in the spleen were much lower, even though the total number of cells was substantially higher (Figure 2D; Figure S3 in Supplementary Material). Most prominently, H-dose immunization led to levels of around three times the amount of the respective hepatic subpopulation 14 days after the first or second boost (H2: 5.92 ± 0.77 × 10⁶ and H3: 5.34 ± 1.2 total TE/EM cells). For all different doses, in particular for the H-dose, the strongest increase in TE/EM cell numbers occurred after the first boost, after which both the TE/EM frequencies and the total number of cells stabilized at levels which were not affected by additional booster injections. This was even true for the normal dose, for which a substantial increase in hepatic TE/EM numbers was observed in response to a second boost (Figures 2C,D). Similar observations were made for the central memory subset, with the number of CD8+ TCM cells in the spleen following similar dynamics than the splenic TE/EM subset, in particular for the N- and H-doses.
Analyzing possible interactions between spleen and liver during immunizations, we found that a mathematical model with the assumption that the dose-dependent increase of TE/EM cells in the spleen is negatively impacted by higher prior-levels of TE/EM cells in the liver at the time of boosting (see Materials and Methods) fitted the data significantly better than a model assuming no interaction between both compartments [AICc: 26.8 (dependent) vs. 39.5 (independent), Figure 2E]. We estimated that N- and H-dose would lead to a maximal additional 3.4- (2.5, 4.6) and 7.4-fold (6.1, 9.2) increase, respectively, in the number of TE/EM cells in the spleen 14 days after injection, compared to an only 1.1-fold (0.8, 1.4) additional increase using the S-dose (see Appendix A1, Table A1.1 in Supplementary Material, numbers in brackets define 95%-confidence intervals of estimates). In addition, we found that an estimated level of around 2.3 × 10⁵ TE/EM cells in the liver reduces the activation of CD8+ T cells in the spleen by 50%. As expected from the data, we only estimate a moderate additive effect of booster injections on the number of TCM cells in the spleen (Table A1.1 in Supplementary Material; Figure 2F).
Thus, as for the liver, we also observed dose-dependent effects on the splenic TE/EM levels with subsequent immunizations but with no further increase in cellular numbers after more than one booster injection, which was irrespective of the given dose and could be explained by the previously generated TE/EM levels in the liver.
Dynamics of Antigen-Specific CD8+ T Cell Responses in Spleen and Liver Indicate Increasing Antigen-Specificity With Subsequent Booster Injections
Due to the general paucity of malaria-specific CD8+ T cell epitopes identified (25, 29), we concentrated our analyses on the dynamics of the total CD8+ T cell response in the context of different immunization schemes. Comparing them to the responses in a corresponding mock-control group (MN), we found that hepatic TE/EM cells remained relatively stable at low levels throughout the vaccination schedule and constituted only about 20% of the TE/EM numbers detected in the respective PbRAS immunized mice after three i.v. administrations (Figure 2C). Notably, total TCM cell numbers did not significantly differ between the mock-control group and mice vaccinated with any other dose, therefore preventing conclusions about PbRAS-specific TCM responses in liver and spleen (Figures S2A–D in Supplementary Material). In order to also assess the dynamics of antigen-specific CD8+ T cells, we re-stimulated isolated lymphocytes with the antigenic peptide SALLNVDNL (PbT130) of the PbTRAP protein and measured intracellular IFN-γ that was specifically secreted by TE/EM cells of PbRAS immunized mice (25). Following three i.v. injections with the N- or H-dose, about 10 or 15% of the overall TE/EM response in liver or spleen, respectively, appeared to be PbT130-specific (Figure S4 in Supplementary Material). Extrapolating these frequencies to the total number of antigen-specific TE/EM cells, the dynamics of the antigen-specific TE/EM response showed a similar pattern as the overall short-term response, however, with a more linear increase in antigen-specific TE/EM cell numbers with respect to the dose and number of injections (Figure 3). In contrast to the overall response our data do not indicate a saturation of PbT130-specific TE/EM cells after multiple immunizations in spleen or liver. This suggests that the composition of the total response is still changing while the magnitude remains constant.
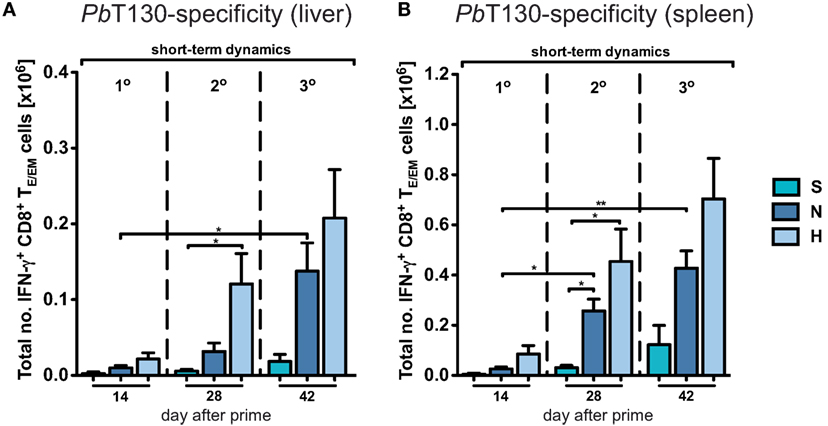
Figure 3. Dynamics of antigen-specific CD8+ TE/EM cells after varying Plasmodium berghei RAS vaccination protocols. Antigen-specificity was measured by IFN-γ expression of CD8+ TE/EM cells following overnight-stimulation with PbT130. The number of IFN-γ expressing TE/EM cells in the liver (A) and spleen (B) of mice receiving different vaccination protocols was determined based on the measured frequencies after overnight-stimulation (Figure S3 in Supplementary Material). Numbers below the plots indicate the time point of measurement in days post prime. Numbers of animals per group are specified within Table S1 in Supplementary Material. Graph bars depict means with SEM; *p < 0.05; **p < 0.01; ***p < 0.001; multiple nonparametric rank-based relative comparison.
The Level of Short-Term Protection Differs Between Different Vaccination Schemes
To compare the efficacy of the previously applied immunization protocols in mediating protection, groups of mice were challenged with 1 × 10³ infectious sporozoites after receiving different numbers of immunizations. Based on previous analyses showing that three i.v. injections with the normal dose of 1 × 10⁴ PbRAS confer long-lasting sterile protection against challenge with infectious sporozoites (19, 30, 31), we were interested to compare the level of protection that is potentially mediated by the measured secondary TE/EM responses following prime-boost immunizations. While secondary responses in H-dose injected mice protected all animals challenged 14 days after the last immunization (n = 7 of 7), two N-dose injections induced a protective level of only 50% (n = 3 of 6) with a mean prepatent period of 5.3 days (Table S2 in Supplementary Material). In contrast, none of the S-dose immunization regimens resulted in protection (Figure 4A). Thus, the level of protection seems to depend on the level of TE/EM cells in the liver.
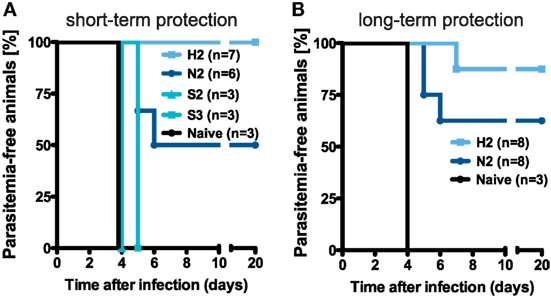
Figure 4. Protective efficacy of different vaccination regimens. (A) Schematic of the protocol determining the groups of mice that were challenged. (B,C) Percentage of protected animals receiving either two or three injections with the N-, H-, or S-dose, respectively. Mice were challenged by i.v. injection of 1 × 10³ infectious PbANKA sporozoites in a total volume of 100 µl PBS on day 14 [(B), short-term] and more than 100 days post last injection [(C), long-term] with protection defined as the absence of blood-stage parasites. See also Table S2 in Supplementary Material.
Long-Term Dynamics Show Decreasing CD8+ T Cell Levels in Liver and Spleen While Protection Levels Are Maintained
We next addressed the question how secondary and tertiary responses progress over time and if secondary responses induced by N- and H-dose immunizations are stable and able to confer protracted protection. Following N-dose prime-boost immunization (N2) for more than 100 days after prime, we found that the long-term TE/EM pool in the liver remained mostly constant (Figure 2C; Figure S3A in Supplementary Material). In contrast to this, numbers of hepatic TE/EM cells in the H2-dose group decreased considerably compared to the short-term response (H2_short-term: 1.86 ± 0.2 × 10⁶ and H2_long-term: 0.9 ± 0.11 × 10⁶ cells) but remained higher compared to the numbers detected after N2-immunizations (N2_long-term: 0.49 ± 0.031 × 10⁶ cells). For mice receiving three immunizations with the normal dose (N3), the long-term TE/EM pool also declined before stabilizing at about the same level as hepatic TE/EM cells in H2-immunized mice, but still slightly higher than TE/EM cell levels after N2-immunizations (Figure 2C).
In comparison to the liver, the observed long-term dynamics was different for the spleen where secondary and tertiary TE/EM pools in N- and H-dose vaccinated mice all decreased to levels that were comparable to the generated number of TE/EM cells after primary responses. In general, there was no difference in these numbers with respect to the dose, the number of boosts or even to M-dose immunizations (Figure 2D; Figure S3B in Supplementary Material), indicating that distinct processes are responsible for the homeostasis of TEM cells in liver and spleen.
Challenging the mice with 1 × 10³ infectious sporozoites more than 100 days after the last immunization demonstrated that the protective efficacy of secondary responses was maintained over time (Figure 4B). We found that for N2-immunization five out of eight mice (62.5%) were protected, while an H2-immunization strategy resulted in sterile protection in seven out of eight mice (87.7%) with the one mouse that became blood-stage positive showing a delayed prepatent period of 7 days. Furthermore, all of the challenged blood-stage negative animals from the N- and H-dose groups also showed complete protection against an intravenous re-challenge with 1 × 10⁴ infectious sporozoites three weeks after the first challenge (Table S2 in Supplementary Material).
In agreement with previous studies that pointed out the importance of the hepatic CD8+ TE/EM subset for protracted protection (16, 21, 24), our analysis of late secondary responses indicated a difference in hepatic but not splenic TE/EM levels between mice that were highly protected (H2) and those displaying only intermediate protection (N2).
Tissue-Resident Memory Cells Dominate the CD8+ T Cell Response in the Liver
As our data indicate an improved maintenance of hepatic compared to splenic TE/EM cells, we looked more closely at the local CD8+ TE/EM cell subsets in the liver. Therefore, we analyzed CD8+ TE/EM cells for the expression of CD69, a TRM marker used for various tissues, including most recently also for liver-specific localization of parasite-specific CD8+ T cells in PbRAS immunized C57BL/6 mice (21, 24) (Figure 5A).
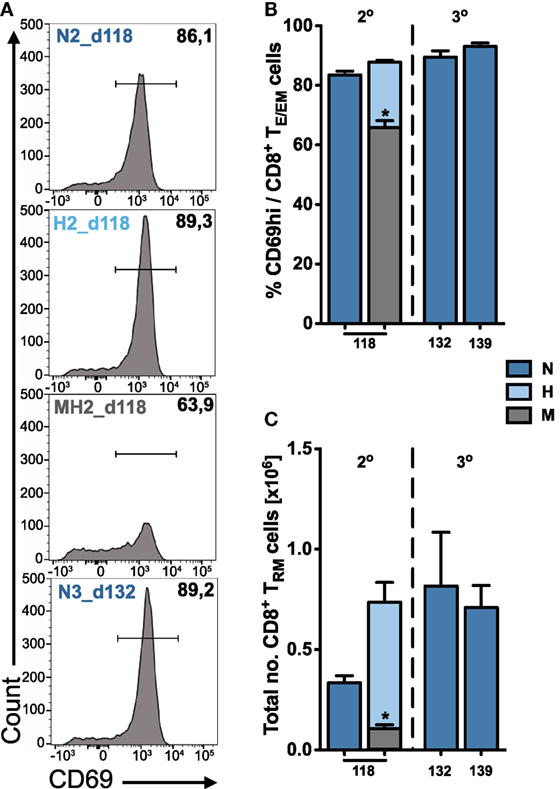
Figure 5. Quantification of tissue-resident CD8+ TRM cells in the liver. (A) Representative FACS histograms showing the expression of CD69 on hepatic TE/EM cells for long-term responses of vaccinated animals. Percentage (B) and total number (C) of tissue-resident CD8+ TRM cells among TE/EM cells indicating increasing numbers according to the dose and number of injections. Numbers below the plots indicate time of measurement in days post prime. Numbers of animals per group are specified within Table S1 in Supplementary Material. Graph bars depict means with SEM; *p < 0.05; **p < 0.01; ***p < 0.001; multiple nonparametric rank-based relative comparison.
We found that long-term hepatic TRM frequencies were only slightly increased following two or three H- and N-dose immunizations (H2, N3) compared to only two N-dose (N2) vaccinations (Figure 5B). However, a substantial difference was observed for the total numbers of TRM cells that were about twofold higher in H2- or N3-immunized animals (H2: 0.74 ± 0.1 × 10⁶ and N3_d132: 0.82 ± 0.27 × 10⁶ cells) than to N2-immunized animals (N2: 0.33 ± 0.04 × 10⁶ cells) more than 100 days after prime (Figure 5C). In contrast to the liver, we did not detect any significant expression or upregulation of CD69 on CD8+ TE/EM cells in the spleen, which is consistent with previous publications (20, 21).
Altogether, our results show that the composition of the hepatic long-term CD8+ TE/EM pool is governed by cells exhibiting a TRM phenotype. This stresses the importance of a liver-resident CD8+ T cell population needed for conferring long-lasting protection against malaria infection.
Mathematical Modeling Reveals the Cell Differentiation Pathway and the Dominant Contribution of Local Reactivation During Booster Injections for the Formation of Hepatic TRM-Levels
In order to obtain a systematic and quantitative understanding on the influence of dosage and frequency of booster injections on the generation of potentially protective hepatic TE/EM cells, we developed a mathematical model that describes the dynamics of the various CD8+ T cell subsets in more detail. Our mathematical model took into account all possible differentiation, migration and proliferation dynamics of the respective cell populations, as well as their interactions between spleen and liver (see Materials and Methods and Appendix A2.1 in Supplementary Material). We then used an unbiased model selection algorithm to identify the relevant processes that would best describe the experimental data (see Appendix A2.2 in Supplementary Material). Testing approximately 2,000 different models and ranking them by their ability to describe the experimental data, we identified one model that clearly outperformed the others when analyzing all N-dose vaccinated animals simultaneously (Figure 6A). This model assumes an almost linear differentiation pathway (Figure 6B): Upon priming, naïve cells first turn into TCM cells in the spleen that differentiate further into TE/EM cells, which migrate into the liver where they turn into TRM cells. In general, nearly all highly ranked models support a naïve to TCM differentiation pathway (TN-TCM) rather than a naïve to TE/EM or a split differentiation pathway (Figure 6A). While proliferation of TCM and differentiation from TCM into TE/EM cells in the spleen, as well as migration of TE/EM cells to the liver and their subsequent proliferation is assumed to occur independent of antigen presence after the first antigen exposure, differentiation into TRM cells in the liver is identified to be dependent on antigenic stimuli that are provided during priming and booster injections (Figure 6B). We also estimate that about 72 ± 3% of hepatic TRM cells after priming originate from splenic precursors, while 84 ± 8% and 92 ± 4% of the additional TRM cells after first and second booster injections, respectively, are generated by local reactivation (Figure 6C; Table S3 in Supplementary Material). Most of the model parameters describing cell net-proliferation and migration can be reliably quantified (Figure A2.2 in Supplementary Material), and a representative plot for the individual subset dynamics is shown in Figures 6D–F. Despite large differences in the prediction for TE/EM cell numbers in spleen and liver during the expansion phases after priming and subsequent booster injections, for which no experimental data were available (Appendix A2.3 in Supplementary Material), all predictions for the long-term dynamics, including the generation of the TRM pools in the liver, are robust independent of the selected parameter combination.
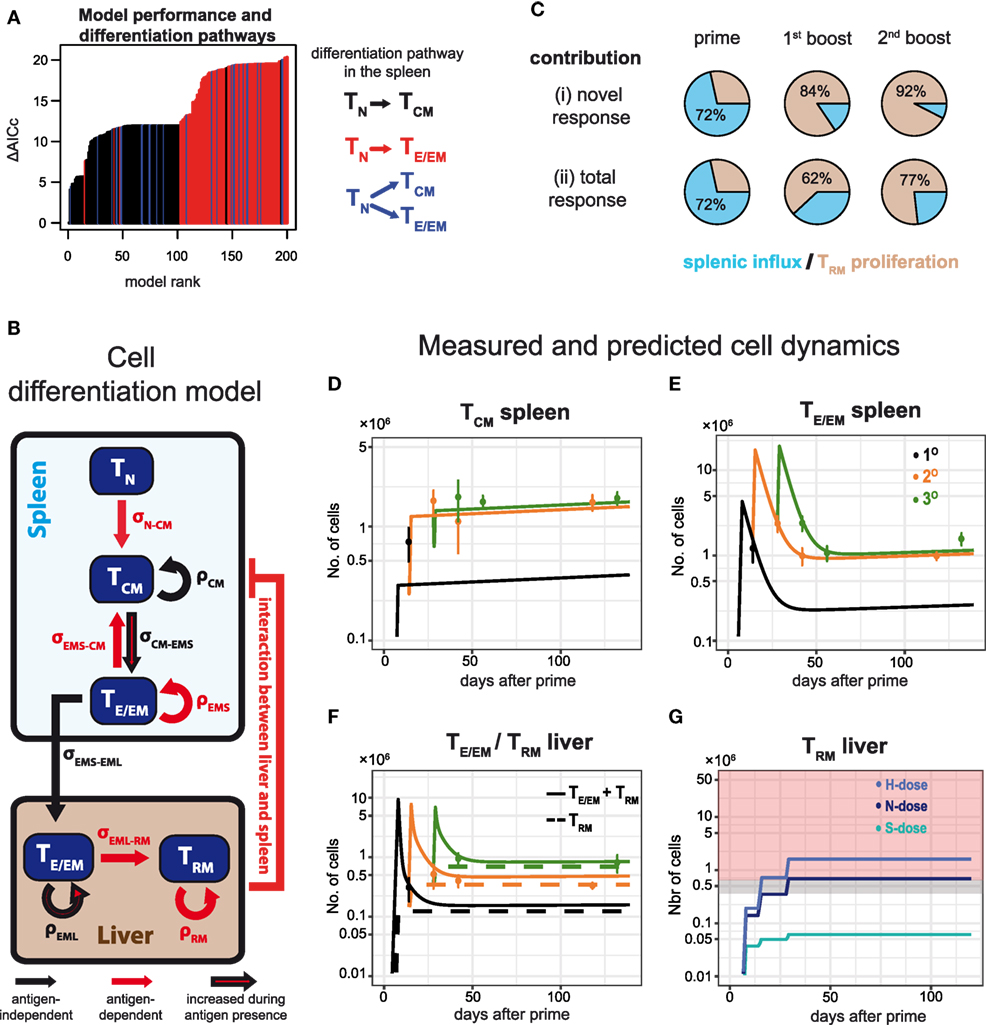
Figure 6. Examining CD8+ T cell differentiation dynamics in response to varying vaccination protocols using mathematical models. (A) The 200 best fitting models explaining CD8+ T cell activation and differentiation dynamics in N-dose vaccinated mice ranked according to the corrected Akaike Information criterion (AICc). Nearly all of the best performing models assume a linear TN–TCM cell differentiation pathway (black) in the spleen. For a detailed explanation of the mathematical models and the unbiased model selection algorithm see Appendices A1 and A2 in Supplementary Material. (B) Schematic of the mathematical model best explaining the observed dynamics indicating proliferation, ρ, and cell migration/differentiation, σ, rates. Processes only active during the immunization periods are indicated in red. (C) Proportion of TRM cells in the liver originating from local reactivation (ocher) or additional influx from the spleen (blue) after each prime and boost distinguished between the newly generated (i) and the total response (ii). (D–F) CD8+ T cell dynamics predicted by the model shown in (B) for the numbers of TCM and TE/EM cells in the spleen (D,E), as well as the numbers for TRM and the total TE/EM cells (TRM + TEML) in the liver (F) of N-dose vaccinated animals. Colored lines indicate the different vaccination protocols corresponding to prime (1°, black), prime-boost (2°, orange) or prime-boost-boost (3°, green). The corresponding measurements for the individual groups are shown as well (mean ± SEM). (G) Predicted dynamics of liver-resident TRM cells for different doses according to the basic vaccination protocol. Gray and red shaded areas correspond to the number of TRM cells required to mediate 50 and 100% protection, respectively, as determined by the challenge experiments.
In addition, following the cellular dynamics identified for the N-dose vaccinated animals (Figure 6B), we studied the impact of varying vaccination doses on these dynamics by incorporating a dose-factor into our mathematical model (see Materials and Methods). We found that the cellular dynamics observed for both the high and the sub-protective dose could be explained mostly by a changed differentiation rate from TCM to TE/EM in the spleen and a dose-dependent change in the TRM net-proliferation rate (Appendix A3 in Supplementary Material). A high dose leads to an estimated 1.2-fold increase in these two rates compared to the normal dose, while for the sub-protective dose we estimate a reduction to around 20% of their baseline values, which explains the failure of this dose to mount a robust TRM response in the liver (Figure 6G).
Thus, our mathematical analysis supports the reversing roles of splenic and hepatic responses during subsequent immunizations, with re-expansion of local TRM cells dominating the generation of protective TRM-levels during booster injections, therefore, emphasizing the need of high-dose booster injections.
Discussion
Understanding the dynamics that shape the development of protective immune responses during immunization is an important prerequisite to design effective vaccination strategies. For malaria, the implementation of promising whole sporozoite vaccination approaches into clinical practice still lacks the identification of appropriate protocols as the correlates of protection and the effect of dosage and frequency of injections on their generation need to be determined (13). In animal models, it has been shown that CD8+ T cells play a critical role in mediating immunity making them an important target for vaccine development (9, 21, 22). Here, using an extensive experimental protocol, we systematically analyzed the impact of various prime-boost vaccination regimes on the dynamics of CD8+ T cell responses in spleen and liver and their influence on protection.
Our data corroborate a critical role for the spleen during priming for effective RAS immunization via the intravenous route. Previous studies already showed that the formation of protective immunity against malaria infection was hampered in splenectomized mice (32), and that the spleen represents the main priming site of vaccine-induced responses by splenic CD8α+ dendritic cells (21, 33). In line with these findings, we observed that splenic CD8+ T cell responses mainly develop during the first two immunizations and are less affected by subsequent booster injections. Our mathematical analysis indicated that this reduced accumulation of TE/EM cells in the spleen by booster immunizations can be explained by the hepatic TE/EM levels obtained during previous vaccinations (Figure 2E). Probably the increased accumulation of tissue-associated CD8+ T cells at the site of infection in the liver makes further involvement of the spleen for systemic immune activation obsolete.
The involvement of the liver or its associated draining lymph nodes in the priming of CD8+ T cells after the first immunization seems to be minor but cannot be totally excluded (33). However, our observations suggest an increasing involvement of the liver for the generation of immunity with subsequent booster immunizations, mainly due to antigen-specific reactivation of preformed hepatic TEM and TRM pools. Based on a mathematical model that describes cell differentiation and proliferation in response to immunizations, we estimate that on average ~84–94% of all newly formed TRM cells in the liver originate from proliferation of locally re-activated CD8+ T cells during booster injections. Migration of splenic TE/EM cells towards the liver, which dominated the TRM-population during priming (~70–75% of cells) seems to only play a minor role at this point (Table S3 in Supplementary Material). Thus, the importance of spleen and liver for mounting protective responses reverts with subsequent booster injections, which is in line with recent findings that show the dominant impact of tissue-resident memory T cells for the generation of secondary memory responses (34, 35).
The increasing involvement of the hepatic CD8+ T cell response might be supported by continuously accumulating, activated dendritic cells at the site of infection, as shown to occur in the course of i.v. RAS immunizations and other infection models (23, 36–40). Enhanced frequencies of antigen-presenting cells (APC) in the liver might promote the reactivation and build-up of local hepatic CD8+ T cell populations during vaccine-induced secondary and tertiary responses.
Importantly, our results show that the accumulation of hepatic CD8+ T cells during booster immunizations appeared to be dose-dependent. While for the H-dose, TE/EM cells in the liver already reached a plateau after the first boost, TE/EM levels still increased for N-dose immunized animals with a second booster injection. In line with these observations, our mechanistic model also predicted dose-dependent effects to mainly affect the generation of hepatic CD8+ T cells, i.e., estimating an increase in both TRM proliferation rates and the conversion of intrahepatic TE/EM to TRM cells for H-dose compared to N-dose immunizations (Appendix A3 in Supplementary Material). A higher immunization dose might cause a stronger inflammatory reaction in the liver thereby accelerating local immune activation and promoting the reversal of the prevailing state of immune-tolerance (18, 41). Notably, a recent study reported that the accumulation and activation status of intrahepatic CD8α+ DC was significantly increased by i.v. injection of a higher compared to a lower PbRAS dose (40).
A change in the hepatic immune milieu accompanied by more frequent antigen-encounter/recognition in the liver potentially also drives the formation of tissue-resident CD8+ TRM cells (21, 42, 43). Indeed, using CD69 as a marker for tissue-residency, we observed an increased accumulation of CD69+ TE/EM (TRM) cells in the liver with subsequent booster injections. Although these hepatic TRM cells might have some potential to reenter the circulation as recently demonstrated for thymic CD69+CD103− memory CD8+ T cells (44), the observation of an increased accumulation of this cell subset in the liver emphasized the general appropriateness of this marker (21, 43, 45).
The generation of sufficient tissue-resident CD8+ T cells in the liver seems to be a key for developing protective immunity against malaria, increasing the need for understanding their differentiation dynamics (21, 46). However, the differentiation of T cells in response to immunization and infection is still highly debated. While some studies point toward a differentiation pathway following naïve-TCM-TE/EM for CD8+ (47) and CD4+ T cells (48), other studies suggest inverse differentiation pathways or TCM and TE/EM cells to be two separate lineages of development (49–51). Performing a systematic analysis of all possible cellular interactions, our analysis supports a differentiation pathway following naïve-TCM-TE/EM and subsequent TRM generation (Figure 6B) corresponding to the findings by Buchholz et al. (47). Differences to other differentiation pathways identified previously could be due to the varying sites at which cells were sampled. Furthermore, our analysis might also be influenced by the requirement to simultaneously analyze priming and booster differentiation pathways, as during booster immunizations a TCM-TE/EM differentiation is likely to be expected (52). Thus, a more detailed analysis of the cellular expansion phase after priming is needed to improve the characterization of the differentiation pathway, and to further determine the processes and factors leading to TRM generation (43, 53).
Despite the complexity of our model in the context of the available data, estimates for all antigen-independent parameters, which determine the long-term dynamics of the response, are remarkably robust (see Appendix A2 in Supplementary Material). Most of the parameters that could not be identified are related to the expansion phase of the response directly after priming and booster injections. Identification of these antigen-dependent parameters is especially important to predict the influence of variations in the timing of immunizations on the generation of protective T cell responses. Using mathematical modeling, a previous study on the interaction of WSV dose and the timing of booster injections recently reported that boosting during the late phase of clonal contraction maximized memory T cell formation when using lower RAS doses, while a single inoculation was more effective in this respect when using a higher dose (54). However, this study only considered administration of a single boost not later than 7 days post priming and did not take into account the impact on interacting organ-specific or late memory responses. Obtaining more detailed information on organ-specific CD8+ T cell subset dynamics during the expansion phase will be essential to improve the characterization of the differentiation dynamics and consequently also to optimize the timings of immunizations.
Furthermore, the general lack of pre-erythrocytic, particularly protection-associated, epitopes hinders a comprehensive analysis of malaria-specific responses. Therefore, our study mainly concentrated on the dynamics of the vaccination-induced total responses. Although the measured responses likely contain activated CD8+ T cells induced by non-malaria antigens or bystander effects, our data indicated a clear vaccination-induced dynamics, as, e.g., shown by the lower cell levels in the corresponding Mock-control groups (Figures 2C,D). In addition, the increase in cellular numbers by booster injections corresponded to an increase in the frequency of antigen-specific CD8+ T cells according to TRAP130 re-stimulation (Figure 3). Remarkably, this increase in T130-specific CD8+ T cell numbers in spleen and liver by consecutive boosting also occurred despite the total number of CD8+ T cells becoming saturated. Thus, although there is indication for a maximal “carrying capacity” of TE/EM and TRM cells, the composition of the response is still changeable as observed in prime-boost vaccination regimes for other pathogens (55, 56). In fact, it was demonstrated that only T130-specific responses were recalled by homologous PbRAS boosting in C57BL/6 mice, while responses to other antigens contracted, similar to results obtained for CSP in the BALB/c mouse model (57, 58). To which extent factors such as antigen abundance, localization and time of expression collectively influence specific pre-erythrocytic CD8+ T cell responses and shape the composition of WSV-induced recall responses remains to be determined (38, 57, 59–61). In this context, it also remains an interesting and open question to which extent sporozoite, liver stage or stage-transcending TRM and TE/EM responses contribute to protective immunity.
In summary, our analysis suggests a reversing role of spleen and liver during priming and subsequent booster injections following i.v. PbRAS immunization. Booster injections are supposed to predominantly reactivate intrahepatic CD8+ T cell pools and are essential for the generation of a protective, mainly self-sustaining TRM-population, with higher dosing accelerating this process. Prime-and-trap vaccination strategies as applied before can exploit this mechanism efficiently (21). To which extent different routes of immunization (e.g., subcutaneous vs. intravenous) (39), as well as supportive drug treatment (62) might additionally influence the dose-dependent generation of protective TRM cells remains to be investigated. A recent study already provided evidence that decreased protection following administration of sporozoites into the skin compared to i.v. injection is not linked to a lower parasite liver load, but rather favors the induction of regulatory immune responses in the liver and skin-draining lymph nodes with a negative impact on memory CD8+ T cell responses (39). Addressing this aspect within a mechanistic and quantitative analysis as presented here, as well as identifying the role of hepatic CD8+ T cells for protection against malaria infections in humans (13), can help to translate these findings made in murine models to clinical application for evaluating and informing the development of effective vaccination strategies (63). Our analysis provides a first mechanistic framework to describe the induction of protective hepatic CD8+ T cell responses against malaria. Identification of novel malaria-specific epitopes, as well as additional information on the expansion dynamics, will help to improve this model to explain dosage dependent vaccination effects on antigen-specific responses. As such it provides an important prerequisite for the rational design of effective immunization protocols and vaccination strategies against Plasmodium-induced infections.
Ethics Statement
All animal experiments were performed according to FELASA category B and GV-SOLAS standard guidelines. Animal experiments were approved by the German authorities (Regierungspräsidium Karlsruhe, Germany), § 8 Abs. 1 Tierschutzgesetz (TierSchG) under the license G-258/12. No human samples were used in this study. All experiments were carried out according to standard institutional biological and gene technology safety guidelines.
Author Contributions
Conceived the study: A-KM and FG; designed the study: RF, MG, A-KM, and FG; performed the experiments: RF and KH; developed the mathematical models and analysis methods: MG and FG; Analyzed the experimental data: RF, MG, A-KM, and FG; Wrote the manuscript: RF, MG, A-KM, and FG.
Conflict of Interest Statement
The authors declare that the research was conducted in the absence of any commercial or financial relationships that could be construed as a potential conflict of interest.
Funding
This work was supported by a grant from the FRONTIER-program of Heidelberg University (ZUK 49/2 5.2.149) and by a grant from the Ministry of Science, Research and the Arts of Baden-Württemberg (Az: 33-7533-30-10/25/26) to FG and A-KM. MG and FG were additionally funded by the Center for Modeling and Simulation in the Biosciences (BIOMS). This project was additionally supported by the DFG (SFB1129 and SPP1580 to A-KM). A-KM is a recipient of a maternity leave stipend through the Deutsche Zentrum für Infektionsforschung (DZIF). The authors acknowledge financial support by the Deutsche Forschungsgemeinschaft within the funding program Open Access Publishing, by the Baden-Württemberg Ministry of Science, Research and the Arts and by Ruprecht-Karls-Universität Heidelberg.
Supplementary Material
The Supplementary Material for this article can be found online at https://www.frontiersin.org/articles/10.3389/fimmu.2018.01137/full#supplementary-material.
References
1. Cohen J, Nussenzweig V, Nussenzweig R, Vekemans J, Leach A. From the circumsporozoite protein to the RTS, S/AS candidate vaccine. Hum Vaccin (2010) 6(1):90–6. doi:10.4161/hv.6.1.9677
2. Agnandji ST, Lell B, Fernandes JF, Abossolo BP, Methogo BG, Kabwende AL, et al. A phase 3 trial of RTS,S/AS01 malaria vaccine in African infants. N Engl J Med (2012) 367(24):2284–95. doi:10.1056/NEJMoa1208394
3. RTS,S Clinical Trials Partnership. Efficacy and safety of RTS,S/AS01 malaria vaccine with or without a booster dose in infants and children in Africa: final results of a phase 3, individually randomised, controlled trial. Lancet (2015) 386(9988):31–45. doi:10.1016/S0140-6736(15)60721-8
4. RTS,S Clinical Trials Partnership. Efficacy and safety of the RTS,S/AS01 malaria vaccine during 18 months after vaccination: a phase 3 randomized, controlled trial in children and young infants at 11 African sites. PLoS Med (2014) 11(7):e1001685. doi:10.1371/journal.pmed.1001685
5. Nussenzweig RS, Vanderberg J, Most H, Orton C. Protective immunity produced by the injection of x-irradiated sporozoites of Plasmodium berghei. Nature (1967) 216(5111):160–2. doi:10.1038/216160a0
6. Beaudoin RL, Strome CP, Mitchell F, Tubergen TA. Plasmodium berghei: immunization of mice against the ANKA strain using the unaltered sporozoite as an antigen. Exp Parasitol (1977) 42(1):1–5. doi:10.1016/0014-4894(77)90054-6
7. Hoffman SL, Goh LM, Luke TC, Schneider I, Le TP, Doolan DL, et al. Protection of humans against malaria by immunization with radiation-attenuated Plasmodium falciparum sporozoites. J Infect Dis (2002) 185(8):1155–64. doi:10.1086/339409
8. Mueller AK, Labaied M, Kappe SH, Matuschewski K. Genetically modified Plasmodium parasites as a protective experimental malaria vaccine. Nature (2005) 433(7022):164–7. doi:10.1038/nature03188
9. Seder RA, Darrah PA, Roederer M. T-cell quality in memory and protection: implications for vaccine design. Nat Rev Immunol (2008) 8(4):247–58. doi:10.1038/nri2274
10. Roestenberg M, McCall M, Hopman J, Wiersma J, Luty AJ, van Gemert GJ, et al. Protection against a malaria challenge by sporozoite inoculation. N Engl J Med (2009) 361(5):468–77. doi:10.1056/NEJMoa0805832
11. Epstein JE, Tewari K, Lyke KE, Sim BK, Billingsley PF, Laurens MB, et al. Live attenuated malaria vaccine designed to protect through hepatic CD8(+) T cell immunity. Science (2011) 334(6055):475–80. doi:10.1126/science.1211548
12. Ishizuka AS, Lyke KE, DeZure A, Berry AA, Richie TL, Mendoza FH, et al. Protection against malaria at 1 year and immune correlates following PfSPZ vaccination. Nat Med (2016) 22(6):614–23. doi:10.1038/nm.4110
13. Mordmüller B, Surat G, Lagler H, Chakravarty S, Ishizuka AS, Lalremruata A, et al. Sterile protection against human malaria by chemoattenuated PfSPZ vaccine. Nature (2017) 542(7642):445–9. doi:10.1038/nature21060
14. Seder RA, Chang LJ, Enama ME, Zephir KL, Sarwar UN, Gordon IJ, et al. Protection against malaria by intravenous immunization with a nonreplicating sporozoite vaccine. Science (2013) 341(6152):1359–65. doi:10.1126/science.1241800
15. Guebre-Xabier M, Schwenk R, Krzych U. Memory phenotype CD8(+) T cells persist in livers of mice protected against malaria by immunization with attenuated Plasmodium berghei sporozoites. Eur J Immunol (1999) 29(12):3978–86. doi:10.1002/(SICI)1521-4141(199912)29:12<3978::AID-IMMU3978>3.0.CO;2-0
16. Berenzon D, Schwenk RJ, Letellier L, Guebre-Xabier M, Williams J, Krzych U. Protracted protection to Plasmodium berghei malaria is linked to functionally and phenotypically heterogeneous liver memory CD8+ T cells. J Immunol (2003) 171(4):2024–34. doi:10.4049/jimmunol.171.4.2024
17. Jobe O, Lumsden J, Mueller AK, Williams J, Silva-Rivera H, Kappe SH, et al. Genetically attenuated Plasmodium berghei liver stages induce sterile protracted protection that is mediated by major histocompatibility complex class I-dependent interferon-gamma-producing CD8+ T cells. J Infect Dis (2007) 196(4):599–607. doi:10.1086/519743
18. Krzych U, Dalai S, Zarling S, Pichugin A. Memory CD8 T cells specific for plasmodia liver-stage antigens maintain protracted protection against malaria. Front Immunol (2012) 3:370. doi:10.3389/fimmu.2012.00370
19. Nganou-Makamdop K, van Gemert GJ, Arens T, Hermsen CC, Sauerwein RW. Long term protection after immunization with P. berghei sporozoites correlates with sustained IFNgamma responses of hepatic CD8+ memory T cells. PLoS One (2012) 7(5):e36508. doi:10.1371/journal.pone.0036508
20. Tse SW, Cockburn IA, Zhang H, Scott AL, Zavala F. Unique transcriptional profile of liver-resident memory CD8+ T cells induced by immunization with malaria sporozoites. Genes Immun (2013) 14(5):302–9. doi:10.1038/gene.2013.20
21. Fernandez-Ruiz D, Ng WY, Holz LE, Ma JZ, Zaid A, Wong YC, et al. Liver-resident memory CD8+ T cells form a front-line defense against malaria liver-stage infection. Immunity (2016) 45(4):889–902. doi:10.1016/j.immuni.2016.08.011
22. Schmidt NW, Butler NS, Badovinac VP, Harty JT. Extreme CD8 T cell requirements for anti-malarial liver-stage immunity following immunization with radiation attenuated sporozoites. PLoS Pathog (2010) 6(7):e1000998. doi:10.1371/journal.ppat.1000998
23. Jobe O, Donofrio G, Sun G, Liepinsh D, Schwenk R, Krzych U. Immunization with radiation-attenuated Plasmodium berghei sporozoites induces liver cCD8alpha+DC that activate CD8+T cells against liver-stage malaria. PLoS One (2009) 4(4):e5075. doi:10.1371/journal.pone.0005075
24. Patel H, Yadav N, Parmar R, Patel S, Singh AP, Shrivastava N, et al. Frequent inoculations with radiation attenuated sporozoite is essential for inducing sterile protection that correlates with a threshold level of plasmodia liver-stage specific CD8(+) T cells. Cell Immunol (2017) 317:48–54. doi:10.1016/j.cellimm.2017.05.001
25. Hafalla JC, Bauza K, Friesen J, Gonzalez-Aseguinolaza G, Hill AV, Matuschewski K. Identification of targets of CD8(+) T cell responses to malaria liver stages by genome-wide epitope profiling. PLoS Pathog (2013) 9(5):e1003303. doi:10.1371/journal.ppat.1003303
26. R Development Core Team. “R: A Language and Environment for Statistical Computing and Graphics”. R-Project for Statistical Computing. (2017). Available from: http://www.r-project.org
27. Burnham KP, Anderson DR. Model Selection and Multinomal Inference: A Practical Information-Theoretic Approach. 2nd ed. New York, Berlin, Heidelberg: Springer (2002).
28. Raue A, Kreutz C, Maiwald T, Bachmann J, Schilling M, Klingmuller U, et al. Structural and practical identifiability analysis of partially observed dynamical models by exploiting the profile likelihood. Bioinformatics (2009) 25(15):1923–9. doi:10.1093/bioinformatics/btp358
29. Van Braeckel-Budimir N, Harty JT. CD8 T-cell-mediated protection against liver-stage malaria: lessons from a mouse model. Front Microbiol (2014) 5:272. doi:10.3389/fmicb.2014.00272
30. Douradinha B, van Dijk MR, Ataide R, van Gemert GJ, Thompson J, Franetich JF, et al. Genetically attenuated P36p-deficient Plasmodium berghei sporozoites confer long-lasting and partial cross-species protection. Int J Parasitol (2007) 37(13):1511–9. doi:10.1016/j.ijpara.2007.05.005
31. Bijker EM, Nganou-Makamdop K, van Gemert GJ, Zavala F, Cockburn I, Sauerwein RW. Studying the effect of chloroquine on sporozoite-induced protection and immune responses in Plasmodium berghei malaria. Malar J (2015) 14:130. doi:10.1186/s12936-015-0626-2
32. Spitalny GL, Rivera-Ortiz CI, Nussenzweig RS. Plasmodium berghei: the spleen in sporozoite-induced immunity to mouse malaria. Exp Parasitol (1976) 40(2):179–88. doi:10.1016/0014-4894(76)90080-1
33. Lau LS, Fernandez-Ruiz D, Mollard V, Sturm A, Neller MA, Cozijnsen A, et al. CD8+ T cells from a novel T cell receptor transgenic mouse induce liver-stage immunity that can be boosted by blood-stage infection in rodent malaria. PLoS Pathog (2014) 10(5):e1004135. doi:10.1371/journal.ppat.1004135
34. Beura LK, Mitchell JS, Thompson EA, Schenkel JM, Mohammed J, Wijeyesinghe S, et al. Intravital mucosal imaging of CD8(+) resident memory T cells shows tissue-autonomous recall responses that amplify secondary memory. Nat Immunol (2018) 19(2):173–82. doi:10.1038/s41590-017-0029-3
35. Park SL, Zaid A, Hor JL, Christo SN, Prier JE, Davies B, et al. Local proliferation maintains a stable pool of tissue-resident memory T cells after antiviral recall responses. Nat Immunol (2018) 19(2):183–91. doi:10.1038/s41590-017-0027-5
36. Leon B, Lopez-Bravo M, Ardavin C. Monocyte-derived dendritic cells formed at the infection site control the induction of protective T helper 1 responses against Leishmania. Immunity (2007) 26(4):519–31. doi:10.1016/j.immuni.2007.01.017
37. Wakim LM, Waithman J, van Rooijen N, Heath WR, Carbone FR. Dendritic cell-induced memory T cell activation in nonlymphoid tissues. Science (2008) 319(5860):198–202. doi:10.1126/science.1151869
38. Montagna GN, Beigier-Bompadre M, Becker M, Kroczek RA, Kaufmann SH, Matuschewski K. Antigen export during liver infection of the malaria parasite augments protective immunity. mBio (2014) 5(4):e1321–1314. doi:10.1128/mBio.01321-14
39. Haeberlein S, Chevalley-Maurel S, Ozir-Fazalalikhan A, Koppejan H, Winkel BMF, Ramesar J, et al. Protective immunity differs between routes of administration of attenuated malaria parasites independent of parasite liver load. Sci Rep (2017) 7(1):10372. doi:10.1038/s41598-017-10480-1
40. Parmar R, Patel H, Yadav N, Parikh R, Patel K, Mohankrishnan A, et al. Infectious sporozoites of Plasmodium berghei effectively activate liver CD8alpha(+) dendritic cells. Front Immunol (2018) 9:192. doi:10.3389/fimmu.2018.00192
41. Frevert U, Krzych U. Plasmodium cellular effector mechanisms and the hepatic microenvironment. Front Microbiol (2015) 6:482. doi:10.3389/fmicb.2015.00482
42. Wakim LM, Woodward-Davis A, Liu R, Hu Y, Villadangos J, Smyth G, et al. The molecular signature of tissue resident memory CD8 T cells isolated from the brain. J Immunol (2012) 189(7):3462–71. doi:10.4049/jimmunol.1201305
43. Mueller SN, Mackay LK. Tissue-resident memory T cells: local specialists in immune defence. Nat Rev Immunol (2016) 16(2):79–89. doi:10.1038/nri.2015.3
44. Park SL, Mackay LK, Gebhardt T. Distinct recirculation potential of CD69(+)CD103(-) and CD103(+) thymic memory CD8(+) T cells. Immunol Cell Biol (2016) 94(10):975–80. doi:10.1038/icb.2016.60
45. Schenkel JM, Masopust D. Tissue-resident memory T cells. Immunity (2014) 41(6):886–97. doi:10.1016/j.immuni.2014.12.007
46. Schmidt NW, Podyminogin RL, Butler NS, Badovinac VP, Tucker BJ, Bahjat KS, et al. Memory CD8 T cell responses exceeding a large but definable threshold provide long-term immunity to malaria. Proc Natl Acad Sci U S A (2008) 105(37):14017–22. doi:10.1073/pnas.0805452105
47. Buchholz VR, Flossdorf M, Hensel I, Kretschmer L, Weissbrich B, Graf P, et al. Disparate individual fates compose robust CD8+ T cell immunity. Science (2013) 340(6132):630–5. doi:10.1126/science.1235454
48. Durek P, Nordstrom K, Gasparoni G, Salhab A, Kressler C, de Almeida M, et al. Epigenomic profiling of human CD4(+) T cells supports a linear differentiation model and highlights molecular regulators of memory development. Immunity (2016) 45(5):1148–61. doi:10.1016/j.immuni.2016.10.022
49. Kaech SM, Wherry EJ, Ahmed R. Effector and memory T-cell differentiation: implications for vaccine development. Nat Rev Immunol (2002) 2(4):251–62. doi:10.1038/nri778
50. Akondy RS, Fitch M, Edupuganti S, Yang S, Kissick HT, Li KW, et al. Origin and differentiation of human memory CD8 T cells after vaccination. Nature (2017) 552(7685):362–7. doi:10.1038/nature24633
51. Crauste F, Mafille J, Boucinha L, Djebali S, Gandrillon O, Marvel J, et al. Identification of nascent memory CD8 T cells and modeling of their ontogeny. Cell Syst (2017) 4(3):306–17.e4. doi:10.1016/j.cels.2017.01.014
52. Graef P, Buchholz VR, Stemberger C, Flossdorf M, Henkel L, Schiemann M, et al. Serial transfer of single-cell-derived immunocompetence reveals stemness of CD8(+) central memory T cells. Immunity (2014) 41(1):116–26. doi:10.1016/j.immuni.2014.05.018
53. Farber DL, Yudanin NA, Restifo NP. Human memory T cells: generation, compartmentalization and homeostasis. Nat Rev Immunol (2014) 14(1):24–35. doi:10.1038/nri3567
54. Fernandez-Arias C, Arias CF, Zhang M, Herrero MA, Acosta FJ, Tsuji M. Modeling the effect of boost timing in murine irradiated sporozoite prime-boost vaccines. PLoS One (2018) 13(1):e0190940. doi:10.1371/journal.pone.0190940
55. Masopust D, Ha SJ, Vezys V, Ahmed R. Stimulation history dictates memory CD8 T cell phenotype: implications for prime-boost vaccination. J Immunol (2006) 177(2):831–9. doi:10.4049/jimmunol.177.2.831
56. Vezys V, Yates A, Casey KA, Lanier G, Ahmed R, Antia R, et al. Memory CD8 T-cell compartment grows in size with immunological experience. Nature (2009) 457(7226):196–9. doi:10.1038/nature07486
57. Murphy SC, Kas A, Stone BC, Bevan MJ. A T-cell response to a liver-stage Plasmodium antigen is not boosted by repeated sporozoite immunizations. Proc Natl Acad Sci U S A (2013) 110(15):6055–60. doi:10.1073/pnas.1303834110
58. Billman ZP, Kas A, Stone BC, Murphy SC. Defining rules of CD8(+) T cell expansion against pre-erythrocytic Plasmodium antigens in sporozoite-immunized mice. Malar J (2016) 15:238. doi:10.1186/s12936-016-1295-5
59. Bongfen SE, Torgler R, Romero JF, Renia L, Corradin G. Plasmodium berghei-infected primary hepatocytes process and present the circumsporozoite protein to specific CD8+ T cells in vitro. J Immunol (2007) 178(11):7054–63. doi:10.4049/jimmunol.178.11.7054
60. Cockburn IA, Tse SW, Radtke AJ, Srinivasan P, Chen YC, Sinnis P, et al. Dendritic cells and hepatocytes use distinct pathways to process protective antigen from Plasmodium in vivo. PLoS Pathog (2011) 7(3):e1001318. doi:10.1371/journal.ppat.1001318
61. Doll KL, Pewe LL, Kurup SP, Harty JT. Discriminating protective from nonprotective Plasmodium-specific CD8+ T cell responses. J Immunol (2016) 196(10):4253–62. doi:10.4049/jimmunol.1600155
62. Belnoue E, Costa FT, Frankenberg T, Vigario AM, Voza T, Leroy N, et al. Protective T cell immunity against malaria liver stage after vaccination with live sporozoites under chloroquine treatment. J Immunol (2004) 172(4):2487–95. doi:10.4049/jimmunol.172.4.2487
Keywords: malaria, Plasmodium berghei, radiation-attenuated sporozoites, liver-resident CD8+ T cells, mathematical modeling, experimental vaccination
Citation: Frank R, Gabel M, Heiss K, Mueller A-K and Graw F (2018) Varying Immunizations With Plasmodium Radiation-Attenuated Sporozoites Alter Tissue-Specific CD8+ T Cell Dynamics. Front. Immunol. 9:1137. doi: 10.3389/fimmu.2018.01137
Received: 03 March 2018; Accepted: 07 May 2018;
Published: 28 May 2018
Edited by:
Urszula Krzych, Walter Reed Army Institute of Research, United StatesReviewed by:
Noah Butler, University of Iowa, United StatesTracey Lamb, University of Utah, United States
Georges Snounou, Centre national de la recherche scientifique (CNRS), France
Copyright: © 2018 Frank, Gabel, Heiss, Mueller and Graw. This is an open-access article distributed under the terms of the Creative Commons Attribution License (CC BY). The use, distribution or reproduction in other forums is permitted, provided the original author(s) and the copyright owner are credited and that the original publication in this journal is cited, in accordance with accepted academic practice. No use, distribution or reproduction is permitted which does not comply with these terms.
*Correspondence: Ann-Kristin Mueller, YW5uLWtyaXN0aW4ubXVlbGxlckB1bmktaGVpZGVsYmVyZy5kZQ==;
Frederik Graw, ZnJlZGVyaWsuZ3Jhd0BiaW9xdWFudC51bmktaGVpZGVsYmVyZy5kZQ==
†These authors have contributed equally to this work.