 Corinne Letendre1†
 Jean-Philippe Auger2†
 Paul Lemire1
 Tristan Galbas3
 Marcelo Gottschalk2
 Jacques Thibodeau3*
 Mariela Segura1*
- 1Laboratory of Immunology, Faculty of Veterinary Medicine, University of Montreal, Saint-Hyacinthe, QC, Canada
- 2Laboratory of Research on Streptococcus suis, Faculty of Veterinary Medicine, University of Montreal, Saint-Hyacinthe, QC, Canada
- 3Laboratory of Molecular Immunology, Department of Microbiology, Infectiology and Immunology, University of Montreal, Montreal, QC, Canada
Streptococcus suis is an important swine pathogen and emerging zoonotic agent. Encapsulated strains of S. suis modulate dendritic cell (DC) functions, leading to poorly activated CD4+ T cells. However, the antigen presentation ability of S. suis-stimulated DCs has not been investigated yet. In this work, we aimed to characterize the antigen presentation profiles of S. suis-stimulated DCs, both in vitro and in vivo. Upon direct activation in vitro, S. suis-stimulated murine bone marrow-derived DCs (bmDCs) preserved their antigen capture/processing capacities. However, they showed delayed kinetics of MHC-II expression compared to lipopolysaccharide-stimulated bmDCs. Meanwhile, splenic DCs from infected mice exhibited a compromised MHC-II expression, despite an appropriate expression of maturation markers. To identify potential interfering mechanisms, Class II Major Histocompatibility Complex Transactivator (CIITA) and membrane-associated RING-CH (MARCH)1/8 transcription were studied. S. suis-stimulated DCs maintained low levels of CIITA at early time points, both in vitro and in vivo, which could limit their ability to increase MHC-II synthesis. S. suis-stimulated DCs also displayed sustained/upregulated levels of MARCH1/8, thus possibly leading to MHC-II lysosomal degradation. The bacterial capsular polysaccharide played a partial role in this modulation. Finally, interleukin (IL)-12p70 production was inhibited in splenic DCs from infected mice, a profile compatible with DC indirect activation by pro-inflammatory compounds. Consequently, these cells induced lower levels of IL-2 and TNF-α in an antigen-specific CD4+ T cell presentation assay and blunted T cell CD25 expression. It remains unclear at this stage whether these phenotypical and transcriptional modulations observed in response to S. suis in in vivo infections are part of a bacterial immune evasion strategy or rather a feature common to systemic inflammatory response-inducing agents. However, it appears that the MHC-II-restricted antigen presentation and Th1-polarizing cytokine production capacities of DCs are impaired during S. suis infection. This study highlights the potential consequences of inflammation on the type and magnitude of the immune response elicited by a pathogen.
Introduction
Streptococcus suis is one of the most important bacterial pathogens in pigs causing meningitis, septicemia, and sudden death (1). It is responsible for major economic losses to the swine industry worldwide, and yet there is currently no real effective vaccine available to control infections caused by this bacterium (2). S. suis is also an emerging zoonotic agent that can cause meningitis and septicemia. High mortality rates have been observed in humans, particularly in cases of streptococcal toxic shock-like syndrome in Asia (1). Similarly, mice infected with S. suis have been shown to develop a strong systemic inflammatory response within 6 h post infection, and septicemia leading to death within 48 h (3–5). S. suis is an encapsulated bacterium, and a total of 35 serotypes have been defined based on the antigenicity of their capsular polysaccharides (CPS) (2). Serotype 2 is the most virulent for both pigs and humans, and most studies have been performed with this serotype (1). S. suis possesses several virulence factors (6), among which the CPS is clearly critical for the pathogenesis of S. suis infections (7).
Dendritic cells (DCs) are the most potent antigen-presenting cells (APCs); they connect innate and adaptive immunity (8, 9). During an infection, DC maturation can be initiated indirectly by inflammatory mediators released by innate immune cells [indirectly activated mature DCs (indir-mDCs)] or through direct contact with the pathogen [directly activated mature DCs (dir-mDCs)] (10). In both instances, DC maturation is characterized by the expression of cell surface molecules, particularly the MHC class II (MHC-II) molecules and costimulatory molecules, such as CD86 (10, 11). DCs that have captured a pathogen then process it and load its derived antigenic peptides on their MHC-II molecules (12), forming peptide-MHC-II complexes (pMHC-II) that will be exported from the endosomal peptide-loading compartments to the cell surface (12, 13). The whole process is usually complete within 1–3 h (14). These pMHC-II will then be recognized by an antigen-specific T cell receptor (TCR) (15, 16). Specific pMHC-II recognition is the first signal for CD4+ T cell activation and is essential for the induction of the adaptive response (17). The second signal determines the ability of the antigen-specific CD4+ T cell to expand and involves binding of the costimulatory molecules on the naïve T cell (17, 18). Finally, the third signal for CD4+ T cell activation is conveyed by DC-derived cytokines that will induce T cell polarization toward different CD4+ T helper lineages with distinct effector functions (18, 19). Host protection against infections caused by S. suis is mediated primarily by opsonophagocytosis, a process favored by type 1 IgG subclasses. These antibody subclasses with a high protective potential are mainly associated with Th1-type immune responses (2). Interleukin (IL)-12 is known as the primary cytokine for the differentiation of the Th1 subset (20). However, indir-mDCs do not secrete IL-12 in situations where dir-mDCs do and are thus unable to induce functional T cell responses (20, 21).
Different antigenic peptides can be loaded either on newly synthesized or on recycling MHC-II molecules (14). MHC-II transcription is tightly regulated by the Class II Major Histocompatibility Complex Transactivator (CIITA); this master regulator induces de novo transcription of MHC-II genes (13, 21). Upon exposure to a Toll-like receptor (TLR) ligand, a transient increase in MHC-II synthesis has been observed as early as 1 h after challenge (14). However, CIITA transcription (and thus the ensuing MHC-II synthesis) is severely reduced within hours (22, 23), as well as the uptake of new antigens for processing (8, 22). Independently from CIITA control, MHC-II expression also undergoes regulation at the protein level (13). The trafficking of MHC-II molecules and their cell surface expression are regulated, among other mechanisms, via ubiquitination by ubiquitin ligases of the membrane-associated RING-CH (MARCH) family, particularly MARCH1 and MARCH8 (11, 13, 15). In fact, ubiquitination by MARCH1 of the transmembrane glycoproteins MHC-II and CD86 is known to lead to lysosomal degradation of these molecules in immature DCs (11). However, MARCH1/8 expression is downregulated in dir-mDCs (11, 21, 24). It has been suggested that while MARCH1 activity allows the turnover of various pMHC-II in immature DCs, termination of MARCH1 expression in dir-mDCs would considerably prolong the half-life of pMHC-II and CD86 and enhance the stability of pMHC-II derived from the activating pathogen (11). Such regulation processes would allow the DC to present large and stable amounts of relevant pMHC-II, thereby increasing its ability to activate an antigen-specific CD4+ T cell in an efficient manner (22, 23, 25). By contrast, indir-mDCs retain their capacity to present new antigens and have a high pMHC-II turnover rate (thus reducing the stability of relevant pMHC-II derived from the pathogen) as they do not downregulate MARCH1 synthesis (26, 27).
Streptococcus suis recognition by DCs has been reported to occur essentially through TLR2 (28). Encapsulated strains of S. suis have been shown to modulate DC functions in a variety of ways. First of all, these strains exhibit anti-phagocytic properties in murine, porcine, and human DCs (7, 9, 29, 30). They also modulate the expression of the maturation markers CD80/CD86 and MHC-II in murine and porcine DCs (9, 29) and CD83/CD86 in human DCs (30). Moreover, encapsulated strains are known to impair cytokine production/release by DCs from all three species; the CPS most probably hinders the recognition of immunogenic cell wall components (9, 29, 30). However, the antigen presentation ability of S. suis-stimulated DCs has never been investigated thoroughly. Interference of S. suis with the signals required for antigen presentation in DCs could have profound consequences on the development of the ensuing adaptive response (31). This could account, at least in part, for the weak CD4+ T cell activation (32), the low primary and memory humoral responses observed in both mice and pigs (2, 33), as well as for some of the difficulties experienced in developing an effective vaccine to control S. suis disease in swine (2). Finally, the low antibody titers obtained against a bystander antigen [ovalbumin (OVA)] in S. suis-preinfected mice (32) suggest that the antigen presentation machinery is altered. It is hypothesized here that S. suis interferes with the ability of DCs to present antigens to CD4+ T cells via the MHC-II pathway and thus compromises the development of an efficient adaptive immune response. The purpose of the present study was to investigate in an in vitro, in vivo, and ex vivo mouse model the signals involved in antigen presentation, from antigen capture and processing to T cell-polarizing cytokine production, in S. suis-stimulated DCs. A non-encapsulated S. suis serotype 2 mutant was also included in the study to dissect the role of the CPS regarding the MHC-II pathway.
Materials and Methods
Ethics Statement
This study was carried out in accordance with the recommendations of the guidelines and policies of the Canadian Council on Animal Care and the principles set forth in the Guide for the Care and Use of Laboratory Animals. The protocols and procedures were approved by the Animal Welfare Committee of the University of Montreal (protocol number rech-1399).
Bacterial Strains
Streptococcus suis serotype 2 virulent strain P1/7 and its isogenic non-encapsulated mutant strain ΔcpsF (29) were used. S. suis strains were grown on sheep blood agar plates at 37°C for 18 h, and isolated colonies were used as inocula for Todd–Hewitt Broth (THB) (Becton Dickinson, Mississauga, ON, Canada). For in vitro experiments, 5 ml of inoculated THB was incubated for 16 h at 37°C with agitation; working cultures were then obtained by inoculating 300 µl of these cultures in 10 ml of THB and incubating for 5 h at 37°C with agitation. For the in vivo experiment, 5 ml of inoculated THB was incubated for 8 h at 37°C with agitation; working cultures were obtained by inoculating 10 µl of a 10−3 dilution of these cultures in 30 ml of THB and incubating for 16 h at 37°C with agitation. Both bacterial growth protocols were standardized to obtain late-logarithmic bacteria timely synchronized for in vitro or in vivo infections. Bacteria were washed twice in phosphate-buffered saline (PBS), pH 7.3, and appropriately diluted in complete cell culture medium for in vitro assays or THB for the in vivo experiment. The number of CFU/ml in the final suspension was determined by plating samples onto THB agar using an Autoplate 4000 Automated Spiral Plater (Spiral Biotech, Norwood, MA).
Mice and CD4+ T Cell Hybridoma
C57BL/6 female mice were purchased from Charles River Laboratories (Wilmington, MA, USA). Animals were used at 5–6 weeks of age. The BO97.10 CD4+ T cell hybridoma specific for the OVA323–339 peptide on I-Ab (a kind gift from M. Desjardins) was maintained in Kappler–Marrack complete medium, as previously described (34).
Reagents
Anti-mouse antibodies (BD Pharmingen, Mississauga, ON, Canada; unless otherwise noted) used for FACS analysis were as follows: FITC-conjugated anti-CD25 (7D4), Alexa488-conjugated anti-CD11c (N418; BioLegend, San Diego, CA, USA), PE-conjugated anti-I-Ab (AF6-120.1) and anti-CD86 (GL1), PE/Cy5-conjugated anti-CD3ε (145-2C11) and anti-CD11c (N418; BioLegend), and APC-conjugated IL-12p40 (C15.6) and anti-CD11c (HL3).
Generation of Mouse Bone Marrow-Derived Dendritic Cells (bmDCs)
Cells were generated from naïve mice as previously described (28). Briefly, bone marrow was removed from femurs and tibiae. After red blood cell lysis (eBioScience, San Diego, CA, USA), the total bone marrow cells (2.5 × 10⁵ cells/ml) were cultured in RPMI 1640 supplemented with 5% heat-inactivated FBS, 10 mM HEPES, 20 µg/ml gentamycin, 100 U/ml penicillin–streptomycin, 2 mM l glutamine and 50 µM 2-ME (Gibco, Invitrogen, Burlington, ON, Canada). Complete medium was complemented with 20% GM-CSF from a mouse GM-CSF-transfected cell line (Ag8653) as a source of GM-CSF (35). Cells were cultured for 7 days at 37°C in a 5% CO2 incubator, and fresh medium was added on days 3 and 5. On day 7, clusters were harvested and subcultured overnight to remove adherent cells. Non-adherent cells were harvested on day 8, washed, and used as immature DCs for the studies in complete medium containing 5% GM-CSF. Cell purity routinely comprised 86–90% CD11chigh, as determined by FACS analysis and as previously reported (28).
In Vitro Analysis of OVA Uptake and Processing by bmDCs
BODIPY dye (DQ-OVA, Molecular Probes, Invitrogen), a self-quenching molecule that is degraded into peptides that exhibit a bright, photostable fluorescence after uptake and intracellular processing, was used as described before to determine cellular internalization and processing of OVA by DCs (36). Briefly, bmDCs were suspended at 5 × 10⁶ cells/ml in RPMI complete medium (without antibiotics) and incubated with S. suis strain P1/7 (5 × 10⁷ CFU/ml; initial MOI: 10) for 45 min. Then, bmDCs were washed and incubated with 50 µg/ml of OVA labeled with BODIPY dye or with non-labeled OVA for 15 min at 37°C in complete medium. After three washing steps with cold PBS to remove non-internalized OVA, cells were suspended in PBS with 5% FBS and incubated at 37°C (time 0). The processing of OVA into peptides after internalization was assayed at different times ranging from 0 to 60 min by FACS. The culture conditions and concentrations of DQ-OVA were determined based on pretrials (data not shown). Non-infected cells served as negative control.
In Vitro bmDCs Stimulation Assay
A total of 1 × 10⁶ cells in RPMI complete medium (without antibiotics) were seeded into 24-well flat-bottomed plates (500 µl/well). Cells were allowed to rest for 1 h at 37°C with 5% CO2. Afterward, cells were stimulated in technical duplicates for each condition with S. suis strains P1/7 and ΔcpsF (1 × 10⁶ CFU; initial MOI:1; final volume 1 ml). Conditions used were based on those already published (28). Cells were harvested after the desired incubation time for FACS and RT-qPCR analysis. Unstimulated cells served as negative control at each time point, while cells treated with the TLR4 ligand lipopolysaccharide (LPS) at 1 µg/ml [from Escherichia coli 0127:B8 (Sigma-Aldrich, Oakville, ON, Canada)] were used as positive control at each time point.
Isolation of Splenic DCs From Naïve Mice and Stimulation In Vitro
Spleen cells were obtained from a pool of 10 naïve mice. Spleens were harvested, perfused with RPMI complete medium (Gibco), and pressed gently through a sterile fine wire mesh. After red blood cells lysis (eBioscience), total splenocytes were suspended in 2 mM EDTA-PBS solution and separated using Lympholyte-M density gradient (Cedarlane Labs, Burlington, ON, Canada). Low-density cells at the interphase were isolated and then further FACS-purified for CD11c+ (APC-conjugated) with the FACSAria Fusion flow sorter (BD Biosciences, San Jose, CA, USA) using “low-recovery high-purity” sorting settings. A purity of >98% was obtained. Cells were allowed to rest for 1 h at 37°C with 5% CO2. Afterward, cells were stimulated with S. suis strains P1/7 and ΔcpsF (initial MOI:1) or LPS at 1 µg/ml for 2, 4, and 18 h.
In Vivo Infection Model and Isolation of Splenic DCs
On the day of the experiment, mice were injected intraperitoneally with 1 ml of the bacterial suspension (5 × 10⁷ CFU of S. suis strain P1/7) or sterile vehicle solution (THB), as previously standardized in our laboratory (3). The use of 5 × 10⁷ CFU was the optimal dose to induce a positive bacteremia and elicit clinical signs of disease and a strong inflammatory response within 6 h. Spleens from naïve and infected mice were harvested 3 or 6 h post infection and processed individually (see the number of animals in figure legends). Infected mice showing clinical signs of septic disease (e.g., ruffled coat, prostration, and depression) were selected for the experiments. At the time of euthanasia, blood was collected by terminal cardiac puncture and bacteremia (the number of CFU/ml) was determined by plating samples onto THB agar using an Automated Spiral Plater. Infected mice had a positive bacteremia (~1–3 × 10⁸ CFU/ml of blood) as previously reported (32, 37). For the purification of splenic DCs, spleens (from either naïve or infected mice) were harvested and total splenocytes were separated using Lympholyte-M density gradient as described above. Low-density cells at the interphase were purified by MACS positive selection using CD11c MicroBeads and MS columns (Miltenyi Biotec, Auburn, CA, USA) as per the manufacturer’s recommendations. The enriched CD11c+ cells had >86–90% purity and similar yield for both naïve and infected mice by FACS analysis using CD11c antibody (Figure 2A).
Ex Vivo Splenic DC Stimulation Assay
Splenic DCs from naïve or infected mice were isolated at 6 h post infection as described above. A total of 5 × 10⁵ cells in RPMI complete medium with antibiotics (100 µg/ml gentamycin) were seeded into 48-well flat-bottomed plates (250 µl/well). Cells were allowed to rest for 1 h at 37°C with 5% CO2. Afterward, cells were stimulated either with CpG oligodeoxynucleotides at 1 µM (ODN 1826; Invivogen, San Diego, CA, USA) or LPS at 1 µg/ml (final volume 500 µl). Plates were incubated for 24 h, before supernatant harvesting for cytokine quantification. Unstimulated cells served as negative controls or basal expression.
Ex Vivo Antigen Presentation Assay
Splenic DCs from naïve or infected mice were isolated at 6 h post infection as described above. A suspension of 1 × 10⁵ cells/ml in Kappler–Marrack complete medium with antibiotics (100 µg/ml gentamycin) were seeded into 48-well flat-bottomed plates (250 µl/well). Cells were allowed to rest for 1 h at 37°C with 5% CO2. Afterward, CD4+ T cells (BO97.10) were added to the wells (DC:T cell ratio of 1:3, final volume 500 µl) in Kappler–Marrack complete medium containing OVA (500 µg/ml; grade VII, Sigma). Cocultures incubated with medium alone served as negative controls, while cocultures treated with LPS (1 µg/ml) and OVA served as positive controls. Coculture plates were incubated for 24 h. The supernatant was harvested for ELISA testing, while cells were collected for FACS analysis. Single cell cultures (either DCs alone or T cells alone) were also included as controls. Culture conditions were based on in vitro pretrials (Figure S1 in Supplementary Material and data not shown).
FACS Analysis
To determine cellular internalization and processing of OVA by DCs, FACS was performed after each incubation time using a Cell Lab Quanta™ SC MultiPlate Loader instrument (Beckman Colter, Mississauga, ON, Canada). 20,000 gated events were acquired per sample. Data are expressed as the increase in the mean fluorescence intensity (MFI) over time and were analyzed using Cell Lab Quanta Collection/Analysis software. For evaluation of MHC-II and CD86 cell surface expression in vitro, bmDCs were harvested at each time point, washed, and fixed (eBioScience). Cells were then treated with an FcR-blocking reagent (FcγIII/II Rc Ab, BD Pharmingen) for 15 min on ice. Cells were stained with PE/Cy5-conjugated anti-CD11c (45 min on ice), then washed and stained with either PE-conjugated anti-CD86 or anti-MHC-II I-Ab (45 min on ice). After washing steps, cells were suspended in sorting buffer for FACS analysis. Splenic DCs from the in vivo experiment were similarly treated for the evaluation of MHC-II and CD86 expression. In vitro-stimulated splenic DCs were stained only with PE-conjugated anti-CD86 or anti-MHC-II I-Ab as they had already been stained with APC-conjugated anti-CD11c for FACS sorting. For IL-12p40 intracellular staining, splenic DCs were surface stained with Alexa488-conjugated anti-CD11c (45 min on ice), fixed and permeabilized using the IC Fixation/Permeabilization kit (eBioScience) as per the manufacturer’s recommendation. Following fixation and permeabilization, cells were stained (20 min at room temperature) with APC-conjugated anti-IL-12p40. For evaluation of CD25 expression on DC–T cell cocultures, cells were harvested, washed, blocked, and surface stained with FITC-conjugated anti-CD25 (45 min on ice), before washing steps and staining with PE/Cy5-conjugated anti-CD3ε or APC-conjugated anti-CD11c. For the in vitro experiment with splenic DCs, flow cytometry analysis was performed with the FACSAria™ Fusion flow sorter (BD Biosciences) and data were analyzed using the FACSDiva software. For all other experiments, flow cytometry was performed using a BD Accuri™ C6 cytometer (BD Biosciences, Mississauga, ON, Canada). At least 30,000 gated events were acquired per sample, and data analysis was performed using BD Accuri™ C6 software. Quadrants were drawn based on single stain and isotype controls and were plotted on logarithmic scales.
Quantitative Real-Time PCR
Bone marrow-derived dendritic cells and splenic DCs from the in vitro and in vivo experiments were washed, transferred in QIAzol (1 ml/106 cells; Qiagen, Mississauga, ON, Canada), and maintained at −80°C after each time point. The total cellular RNA was later extracted and quantified by spectrophotometry (Nanodrop ND-1000). Total RNA (500 ng) was reverse-transcribed with the QuantiTect® Reverse Transcription kit (Qiagen) as per the manufacturer’s recommendations. The cDNA was amplified using the SsoFast™ EvaGreen® Supermix kit (Bio-Rad, Hercules, CA, USA). A real-time thermal cycler CFX96 (Bio-Rad) was used for amplification of target cDNA, and quantitation of differences between the different groups was calculated using the 2−ΔΔCt method. Peptidylprolyl isomerase A (PPIA) was used as the normalizing gene to compensate for potential differences in cDNA amounts. The unstimulated DCs were used as the calibrator reference in the analysis. Each sample was run in triplicates and a no-template control without cDNA was run for every primer set. The primers used for amplification of the different target cDNA (Integrated DNA Technologies, Coralville, IA) are as follows: CIITA, forward 5′-AACCTGCGCTGACCTCCCGTGTAA-3′ and reverse 5′-GCTCCCTTTCCTGGCTCTTGTTGC-3′; MARCH1, forward 5′-CAGATGACCACGAGCGAAAG-3′ and reverse 5′-CCAATAGCCACCACAACCAG-3′; MARCH8, 5′-TGGCTTCATGTTGTTCCCTTTATTTC-3′ and reverse 5′-CAGCCGTGCCTTGCCAGTC-3′; PPIA, 5′-TGCTGGACCAAACACAAACGGTTC-3′ and reverse 5′-CAAAGACCACATGCTTGCCATCCA-3′.
Cytokine Quantification by ELISA
Interleukin-12p70 and IL-10 levels in ex vivo supernatants, as well as IL-2, TNF-α, IFN-γ, and IL-10 levels in DC–T cell coculture supernatants, were measured by sandwich ELISA using pair-matched antibodies (R&D Systems, Minneapolis, MN, USA) as per the manufacturer’s recommendations. Twofold dilutions of recombinant murine cytokines were used to generate the standard curves. Sample dilutions giving optical density readings in the linear portion of the appropriate standard curve were used to quantify the levels of the cytokine. Absorbance was measured at 450 nm.
Cytokine and Chemokine Quantification by Luminex
Interleukin-6, G-CSF, CCL2 (MCP-1), CCL3 (MIP-1α), CCL4 (MIP-1β), CCL5 (RANTES), CXCL2 (MIP-2), and CXCL9 (MIG) levels in ex vivo supernatants were determined using a liquid multiarray system (Bio-Plex Pro™) according to the manufacturer’s instructions. Commercial multiplex-coated beads (custom-made cytokine panel), biotinylated Abs, and Beadlyte microtiter 96-well filter plates were obtained from Bio-Rad. Data were collected with Bio-Plex Manager™ software and analyzed with Bio-Plex® MAGPIX system. Standard curves for each cytokine and chemokine were obtained using the reference concentrations supplied by the manufacturer.
Statistical Analysis
Data for the in vitro kinetic experiments were analyzed for significance using a two-way analysis of variance (ANOVA). For the in vivo transcription profile of splenic DCs and the coculture experiments, a one-way ANOVA was used. All pairwise comparisons were run, and P-values were Bonferroni-adjusted. The FACS data for the in vivo experiments and data for the ex vivo stimulation experiments were analyzed using Student’s unpaired t-test. A P < 0.05 was considered as statistically significant. Data are expressed as mean ± SEM. All statistical analyses were performed using the IBM SPSS Statistics software (v. 24).
Results
S. suis Does Not Interfere With Soluble Antigen Uptake and Processing in bmDCs
The ability of S. suis-stimulated bmDCs to capture and process a reporter antigen linked to a self-quenching molecule, DQ-OVA, was first investigated. Although bmDCs preincubated with S. suis tended to express lower MFI of DQ-OVA than unstimulated cells at all time points, there was no statistically significant difference (Figure S2 in Supplementary Material). Similar data were obtained when using different DQ-OVA doses, bacterial MOI, and incubation times (data not shown). S. suis-stimulated bmDCs thus appear to have intact soluble antigen capture and processing capacities.
In Vitro Stimulation of bmDCs With the Encapsulated Strain of S. suis Induces an Enhanced Expression of MHC-II, but With a Delayed Kinetics
MHC-II cell surface expression (T cell activation signal 1) was investigated in naïve and S. suis-stimulated bmDCs at 1, 2, 4, 12, and 18 h after stimulation. Moreover, as S. suis is an encapsulated bacterium, the impact of CPS on MHC-II expression was evaluated by comparing the wild-type (WT) strain P1/7 with its non-encapsulated mutant, ΔcpsF. LPS-treated bmDCs served as positive controls for the expected kinetics of MHC-II expression in bmDCs responding to a TLR ligand (dir-mDCs). While LPS-treated bmDCs significantly increased their MHC-II expression within 1 h, S. suis-stimulated cells only reached such high percentages of MHC-II+ cells at late time points (Figure 1). Overall, the total MFI levels were similar among treatments, but a similar delay in the increase of MFI levels was observed in S. suis-stimulated cells when considering the MHClow subpopulation (P1, see Figure S3 in Supplementary Material). In fact, bmDCs stimulated with the WT strain showed no significant increase of MHC-II expression at early time points, in contrast to ΔcpsF-stimulated cells. A statistically significant difference was observed between the two strains at 4 h, thus suggesting that the presence of the CPS on S. suis plays a partial role in the delayed maturation process underwent by S. suis-stimulated bmDCs.
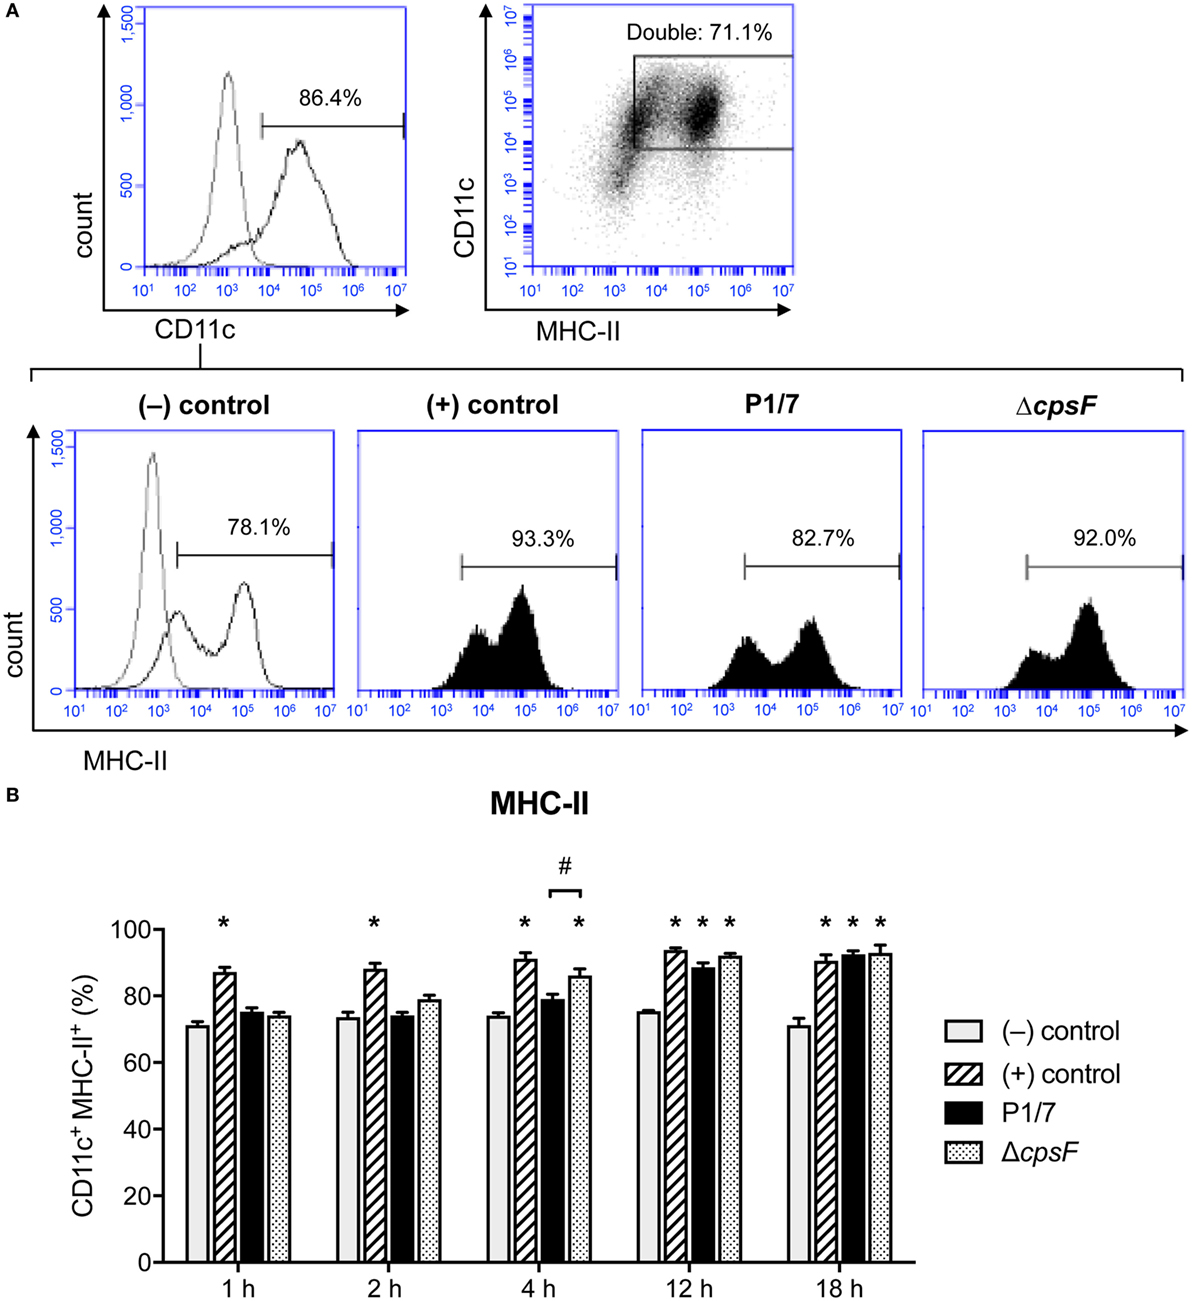
Figure 1. Bone marrow-derived dendritic cells (BmDCs) enhance their MHC-II cell surface expression with a delayed kinetics upon stimulation with Streptococcus suis wild-type (WT) strain. Cells were stimulated for 1, 2, 4, 12, or 18 h with S. suis WT strain P1/7 or the non-encapsulated mutant ΔcpsF (initial MOI:1) in technical duplicates. Unstimulated cells served as negative (−) control for basal expression at each time point. Cells stimulated with LPS (1 µg/ml) were used as positive (+) control. Cells were harvested and fixed after each incubation time. Once the last incubation time was over, cells were surface stained for CD11c and MHC-II and analyzed by FACS. Events are gated on CD11c+ cells. (A) Representative histograms have been selected for this figure (at time = 4 h). The gray lines are isotype controls. At least 30,000 gated events were acquired per sample and data analysis was performed using BD Accuri™ C6 software. Quadrants were drawn based on PE/Cy5- and PE-control stains and plotted on logarithmic scales, a representative dot plot is displayed. (B) Data are expressed as mean ± SEM (% of positive cells) and are from three independent experiments. *P < 0.05 indicates a statistically significant difference compared to (−) control cells. #P < 0.05 indicates a statistically significant difference between P1/7-stimulated bmDCs and ΔcpsF-stimulated bmDCs.
S. suis Induces Splenic DC Maturation In Vivo but With a Low Intensity of MHC-II Expression on the Cell Surface
MHC-II expression was investigated in purified splenic DCs in an in vivo mouse model. Unfortunately, as non-encapsulated S. suis mutants are rapidly cleared from circulation (6), in vivo investigation of the role of this virulence factor was impossible and the experiment had to be conducted with the WT strain only. Splenic DCs have never been studied in the context of S. suis infection; we thus evaluated the maturation profile of these cells during an acute systemic infection, along with their MHC-II expression. Splenic DCs derived from S. suis-infected mice showed an increased expression (at both % and MFI levels) of the DC maturation marker CD86 (T cell activation signal 2) compared to naïve mice (Figure 2B). This suggests that the initiation of the DC maturation process occurs quickly in splenic DCs during a systemic infection with S. suis. Moreover, the percentage of splenic DCs expressing MHC-II molecules on their cell surface remained elevated after infection and was therefore in agreement with this DC maturation profile (Figure 2C). However, DCs from S. suis-infected mice showed a lower MFI. This observation could imply that the total number of MHC-II molecules on the surface of each MHC-II+ cell was reduced; in spite of the initiation of the DC maturation process, S. suis could downregulate the expression of MHC-II molecules on splenic DCs in vivo.
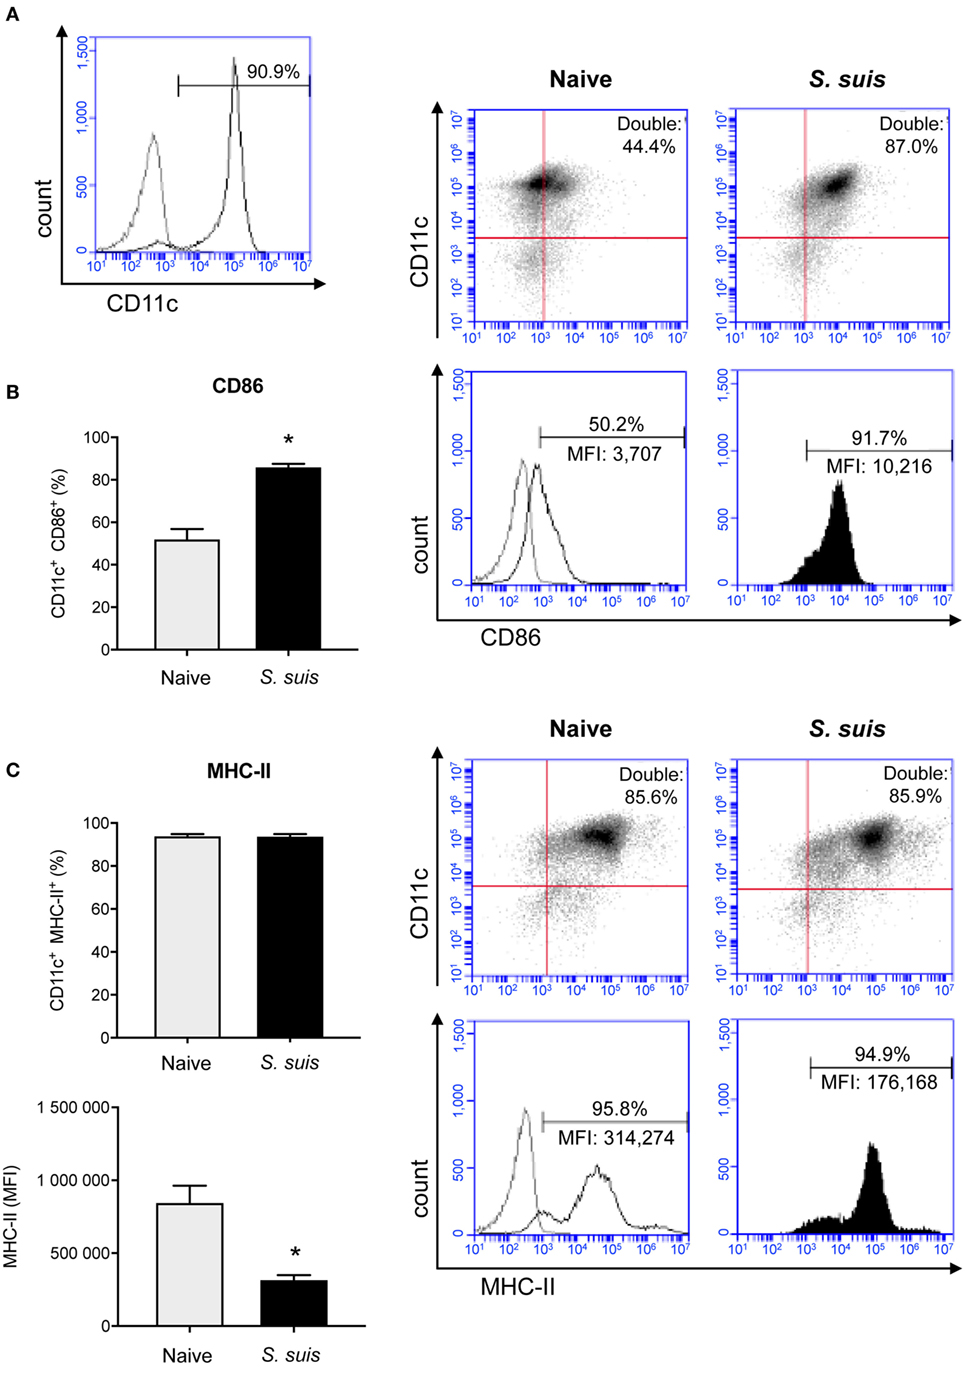
Figure 2. Splenic dendritic cells (DCs) become phenotypically mature but show a reduction in their MHC-II expression levels during Streptococcus suis in vivo infection. C57BL/6 mice were injected intraperitoneally with 5 × 10⁷ CFU of S. suis wild-type (WT) strain P1/7. Spleens from mock-infected (naïve) and infected mice were harvested 6 h after infection (n = 2–3 per group × 2 independent experiments). Splenic DCs were purified by MACS positive selection and cells were surface stained for FACS analysis. CD11c purity is shown in (A). The expression of (B) CD86 and (C) MHC-II was evaluated. Data are expressed as mean ± SEM (of % double positive cells or of mean fluorescence intensity (MFI). In the latter case, events are gated on CD11c+ cells). Representative dot plots and histograms have been selected for this figure. The gray lines on the histograms are isotype controls. 30,000 events were acquired per sample and data analysis was performed using BD Accuri™ C6 software. Quadrants were drawn based on PE/Cy5- and PE-control stains and plotted on logarithmic scales. *P < 0.05 indicates a statistically significant difference compared to naïve cells.
BmDCs and Splenic DCs Stimulated In Vitro With S. suis Have Different Maturation Profiles Compared to Splenic DCs From Infected Mice
As bmDCs and splenic DCs from infected mice were found to differ in their patterns of MHC-II expression levels, we investigated whether these differences were inherent to the cell type or were rather due to complex interactions occurring in vivo (i.e., direct vs indirect activation). We stimulated naïve splenic DCs in vitro and evaluated their MHC-II expression kinetics in response to S. suis. All treatments yielded high percentages of MHC-II+ and CD86+ cells, but analysis of the MHC-IIhigh subpopulation revealed a consistently lower MHC-II MFI for WT S. suis-stimulated cells, as compared to cells stimulated with LPS or the non-encapsulated mutant (Figure 3; Figure S4 in Supplementary Material). This maturation profile is similar to those observed at short incubation times in bmDCs (Figure 1B). However, while bmDCs upregulate their MHC-II and CD86 expression at late time points [Figure 1; (29)], WT S. suis-stimulated splenic DCs still displayed low MHC-II MFI levels as late as 18 h (Figure 3B). Splenic DCs stimulated in vitro with the WT strain also maintained low CD86 MFI levels (Figure 3B), which contrasts with the maturation profile obtained in splenic DCs from infected mice (Figure 2B). These results suggest that while S. suis–DC interactions might partly depend on the cell origin, other complex modulations are also likely to be involved in vivo.
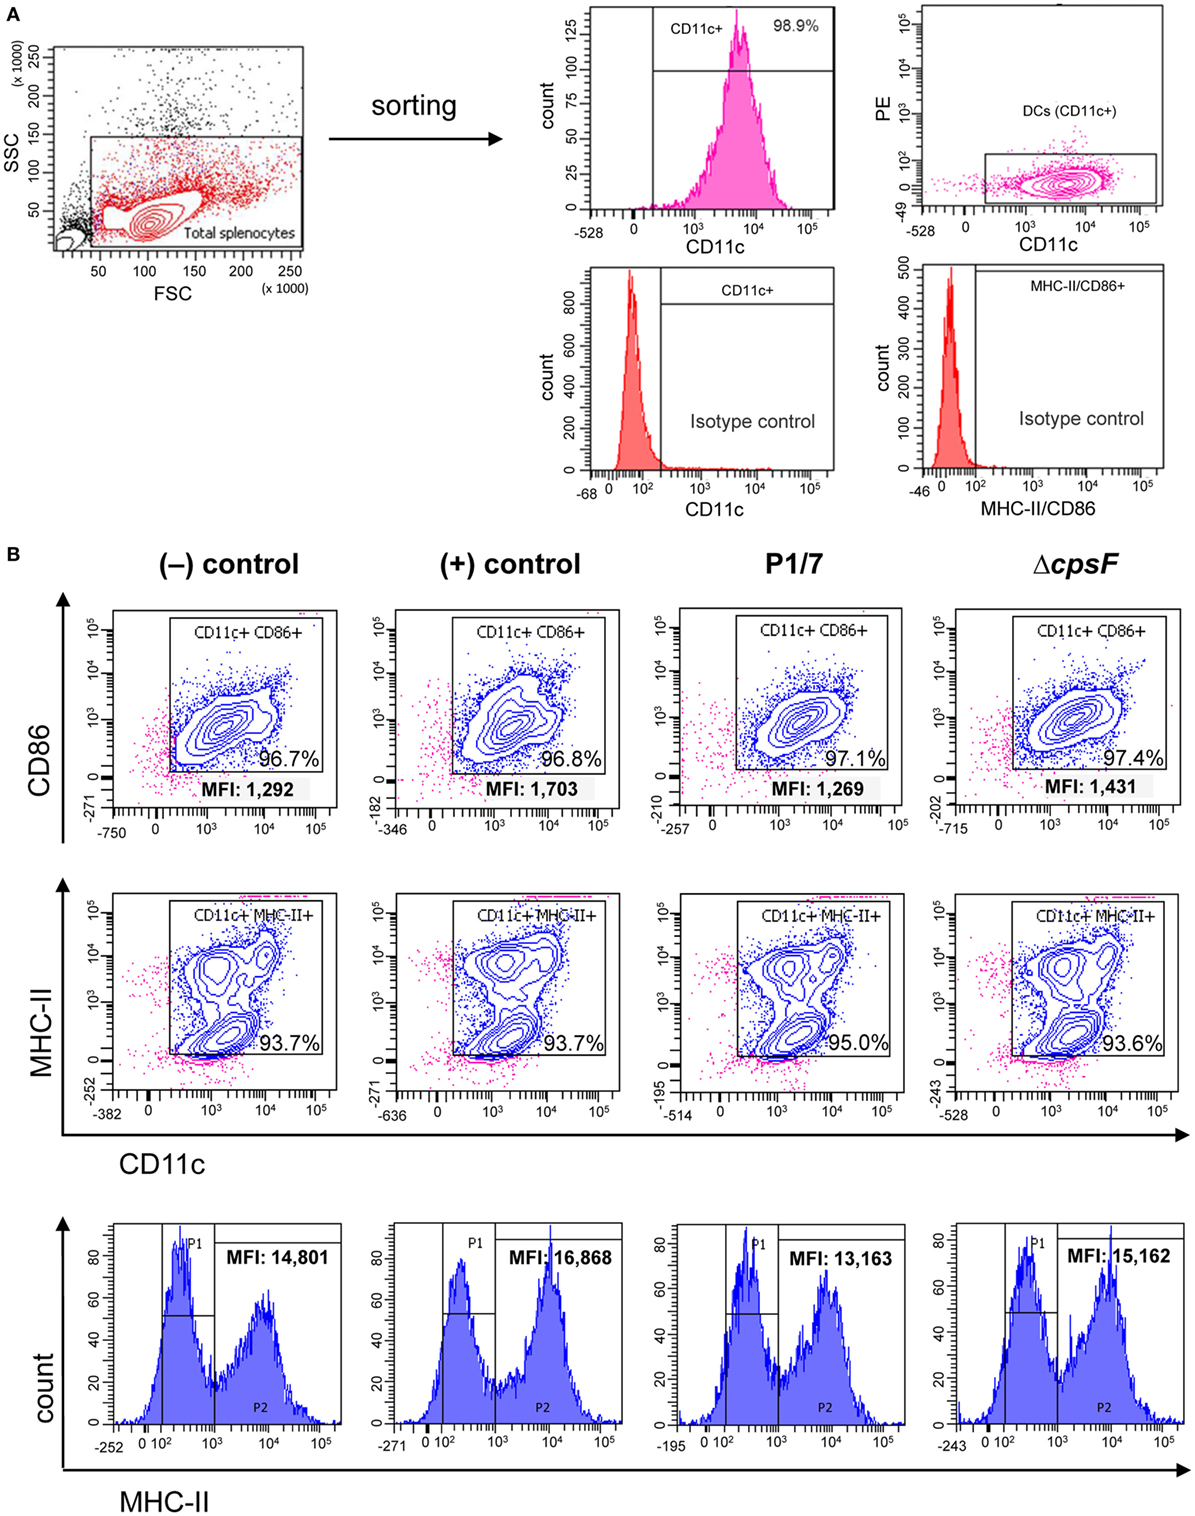
Figure 3. Naïve splenic dendritic cells (DCs) show low intensity of MHC-II expression upon in vitro stimulation with the encapsulated strain of Streptococcus suis. Spleen cells from a pool of 10 naïve C57BL/6 mice were FACS-purified and CD11c+ cells (APC-conjugated anti-CD11c) were sorted with the BD FACSAria™ Fusion flow sorter as illustrated in (A). (B) Purified cells were stimulated for 2, 4, or 18 h with S. suis wild-type (WT) strain P1/7 or the non-encapsulated mutant ΔcpsF (initial MOI:1). Unstimulated cells served as negative (−) control for basal expression at each time point. Cells stimulated with lipopolysaccharide (LPS) (1 µg/ml) were used as positive (+) control. Cells were harvested and surfaced stained for CD86 or MHC-II. Representative density plots have been selected for this figure (at time = 18 h). Histograms of MHC-II expression (gated on CD11c+ cells) have also been included to illustrate variations in the mean fluorescence intensity (MFI) of the MHC-IIhigh population (P2, at time = 18 h). Data analysis was performed using FACSDiva software. Density plots were drawn based on APC- and PE-control stains and plotted on logarithmic scales.
S. suis-Stimulated DCs Maintain Low Transcriptional Levels of CIITA, Both In Vitro and In Vivo
Given the key role of CIITA in de novo transcription of MHC-II genes and its potential implication in the modulation of MHC-II expression by S. suis, the transcriptional expression of CIITA was evaluated in in vitro-stimulated bmDCs as well as in splenic DCs derived from infected mice. CIITA expression was investigated in bmDCs stimulated with the WT strain and its non-encapsulated mutant for 1, 2, or 4 h. Interestingly, S. suis-stimulated bmDCs showed globally low levels of CIITA for both strains (Figure 4A). No significant difference was observed between the WT strain and its non-encapsulated mutant. By contrast, under our assay conditions, LPS-treated bmDCs showed CIITA upregulation at 2 and 4 h, as reported previously (23). The expression of CIITA mRNA was also investigated in vivo at 3 and 6 h after infection, with splenic DCs derived from S. suis-infected mice showing low levels of CIITA compared to naïve mice (Figure 5A). These results might reflect a bacterial strategy to limit the ability of the DC to increase MHC-II synthesis and thus possibly impair the presentation of relevant pathogen-derived peptides.
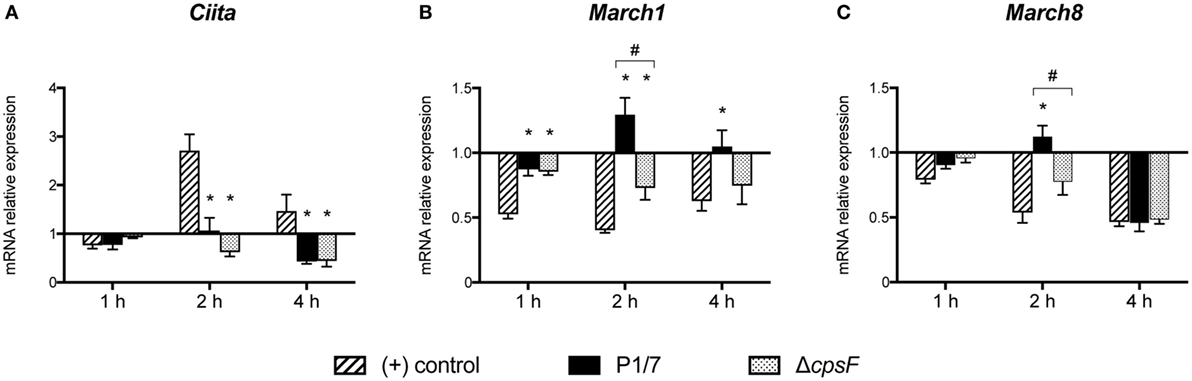
Figure 4. Streptococcus suis-stimulated bone marrow-derived dendritic cells (bmDCs) and directly activated bmDCs have distinct Class II Major Histocompatibility Complex Transactivator (CIITA), MARCH1 and MARCH8 transcriptional profiles. BmDCs were stimulated for 1, 2, or 4 h with S. suis wild-type (WT) strain P1/7 or the non-encapsulated mutant ΔcpsF (initial MOI:1) in technical duplicates. Total cellular RNA was extracted and analyzed by RT-qPCR for (A) CIITA, (B) MARCH1, and (C) MARCH8 mRNA expression. Expression is illustrated as fold level over unstimulated cells [(−) control]. Cells stimulated with lipopolysaccharide (LPS) (1 µg/ml) served as positive (+) control. Data are expressed as mean ± SEM from four independent experiments. *P < 0.05 indicates a statistically significant difference compared to (+) control cells. #P < 0.05 indicates a statistically significant difference between P1/7-stimulated bmDCs and ΔcpsF-stimulated bmDCs.
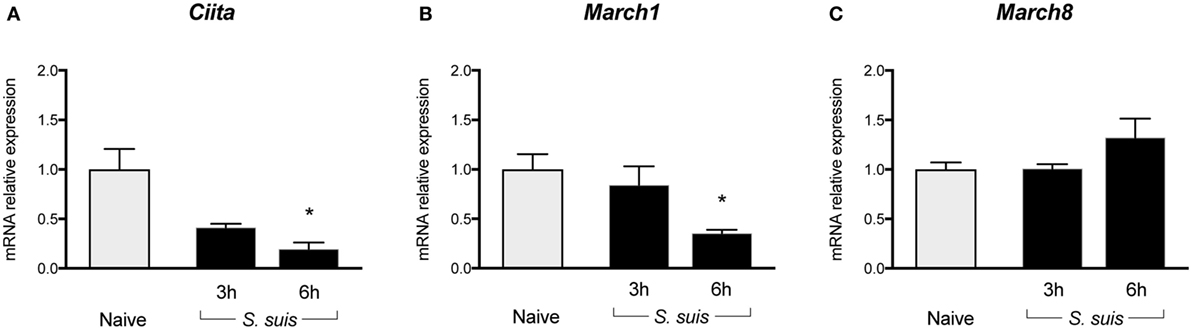
Figure 5. Splenic dendritic cells (DCs) show reduced transcription of Class II Major Histocompatibility Complex Transactivator (CIITA) and sustained/upregulated transcription of MARCH1 and MARCH8 during Streptococcus suis infection. C57BL/6 mice were injected intraperitoneally with 5 × 10⁷ CFU of S. suis wild-type (WT) strain P1/7. Spleens from mock-infected (naïve) and infected mice were harvested 3 or 6 h after infection (n = 2 to 3 per group × 2 independent experiments). Splenic DCs were purified by MACS positive selection, then total cellular RNA was extracted and analyzed by RT-qPCR for (A) CIITA, (B) MARCH1, and (C) MARCH8 mRNA expression. Expression is illustrated as fold level as compared to expression in naïve mice. Data are expressed as mean ± SEM. *P < 0.05 indicates a statistically significant difference compared to naïve cells.
S. suis-Stimulated DCs Upregulate Their Transcriptional Expression of MARCH1 and MARCH8, Both In Vitro and In Vivo, With the CPS Playing a Partial Role in This Regulation
To identify additional mechanisms potentially responsible for MHC-II modulation, the transcriptional expression of the ubiquitin ligases MARCH1 and MARCH8 was evaluated. As these molecules are involved in the fate (either lysosomal degradation or recycling) of pMHC-II at the cell surface, these molecules were promising regulatory candidates to investigate. BmDCs were stimulated in vitro with S. suis strains P1/7 and ΔcpsF for 1, 2, or 4 h. LPS-treated bmDCs showed MARCH1 and MARCH8 downregulation, as is expected in bmDCs responding to a TLR ligand. Meanwhile, transcription of these genes was poorly downregulated or even upregulated in S. suis-stimulated bmDCs (Figures 4B,C). In fact, incubation with the WT strain led to MARCH1 levels significantly higher than those observed in LPS-treated bmDCs at all time points. As MARCH1 is known to ubiquitinate the costimulatory molecule CD86 as well as the MHC-II molecules, CD86 cell surface expression was analyzed by FACS to corroborate these results. S. suis-stimulated bmDCs displayed percentages of CD86+ cells that remained similar to those found in unstimulated cells, until at least 4 h, which is thus in agreement with the sustained/upregulated levels of MARCH1. Meanwhile, LPS-stimulated cells showed an increased expression of CD86 (Figure S5 in Supplementary Material). Similarly, the WT strain induced significantly higher MARCH8 levels than those obtained with LPS at early time points in bmDCs. As for the role of the CPS, cells stimulated with the non-encapsulated mutant quickly downregulated MARCH1 and MARCH8, and their expression levels became significantly different from those obtained with the WT strain at 2 h (Figures 4B,C). These results suggest that the presence of the CPS allows S. suis to hamper antigen presentation by promoting ubiquitination of MHC-II and thus lysosomal degradation of these molecules early after infection. MARCH1 and MARCH8 expression levels were also investigated in vivo at 3 and 6 h after infection. Splenic DCs derived from S. suis-infected mice showed sustained levels until at least 3 h for MARCH1 and 6 h for MARCH8 (Figures 5B,C). These results might support the previous in vitro findings or reflect just as well DC indirect activation.
S. suis Infection Interferes With IL-12 Production in Splenic DCs but Does Not Impair Other Cytokine Production
As Th1 immune responses are known to be protective against S. suis infection, the production of IL-12, the key Th1-polarizing signal 3, by splenic DCs was evaluated in vivo at 6 h after infection. The p40 subunit of IL-12 (also described as a subunit of IL-23) was detected by IC-FACS. Splenic DCs derived from S. suis-infected mice showed significantly higher percentages of IL-12p40+ cells than naïve controls, but their MFI levels were overall reduced (Figure 6A). To detect IL-12p70 (the bioactive heterodimeric form), splenic DCs from either naïve or infected mice were cultured ex vivo with CpG or LPS for 24 h and the supernatants were tested by ELISA. DCs from infected mice failed to produce IL-12p70 in both instances, while their naïve counterparts produced significant amounts of this cytokine (Figure 6B). Meanwhile, unstimulated DCs, derived from both naïve and infected mice, showed no significant production of IL-12p70. Interestingly, IL-10 production remained unchanged in DCs derived from S. suis-infected mice in response to CpG or LPS (Figure 6B). This thus led to an altered IL-10/IL-12 ratio, as reported previously in S. suis-stimulated bmDCs (29). To confirm that this inhibition was IL-12p70 specific and had no effect on cytokine production in a more general way, we also measured other cytokine levels by Luminex in these ex vivo supernatants. Following stimulation with CpG or LPS, DCs from infected mice were found to release similar or higher amounts of IL-6, G-CSF, CCL2, CCL3, CCL4, CCL5, CXCL2, and CXCL9, as compared to naïve DCs (Figure 7). Thus, mere cytotoxicity does not seem to be the underlying reason for DC impaired IL-12p70 production. In fact, these data rather suggest that DC exposure to inflammatory compounds during the acute phase of S. suis infection modulates the T cell-polarizing signal 3.
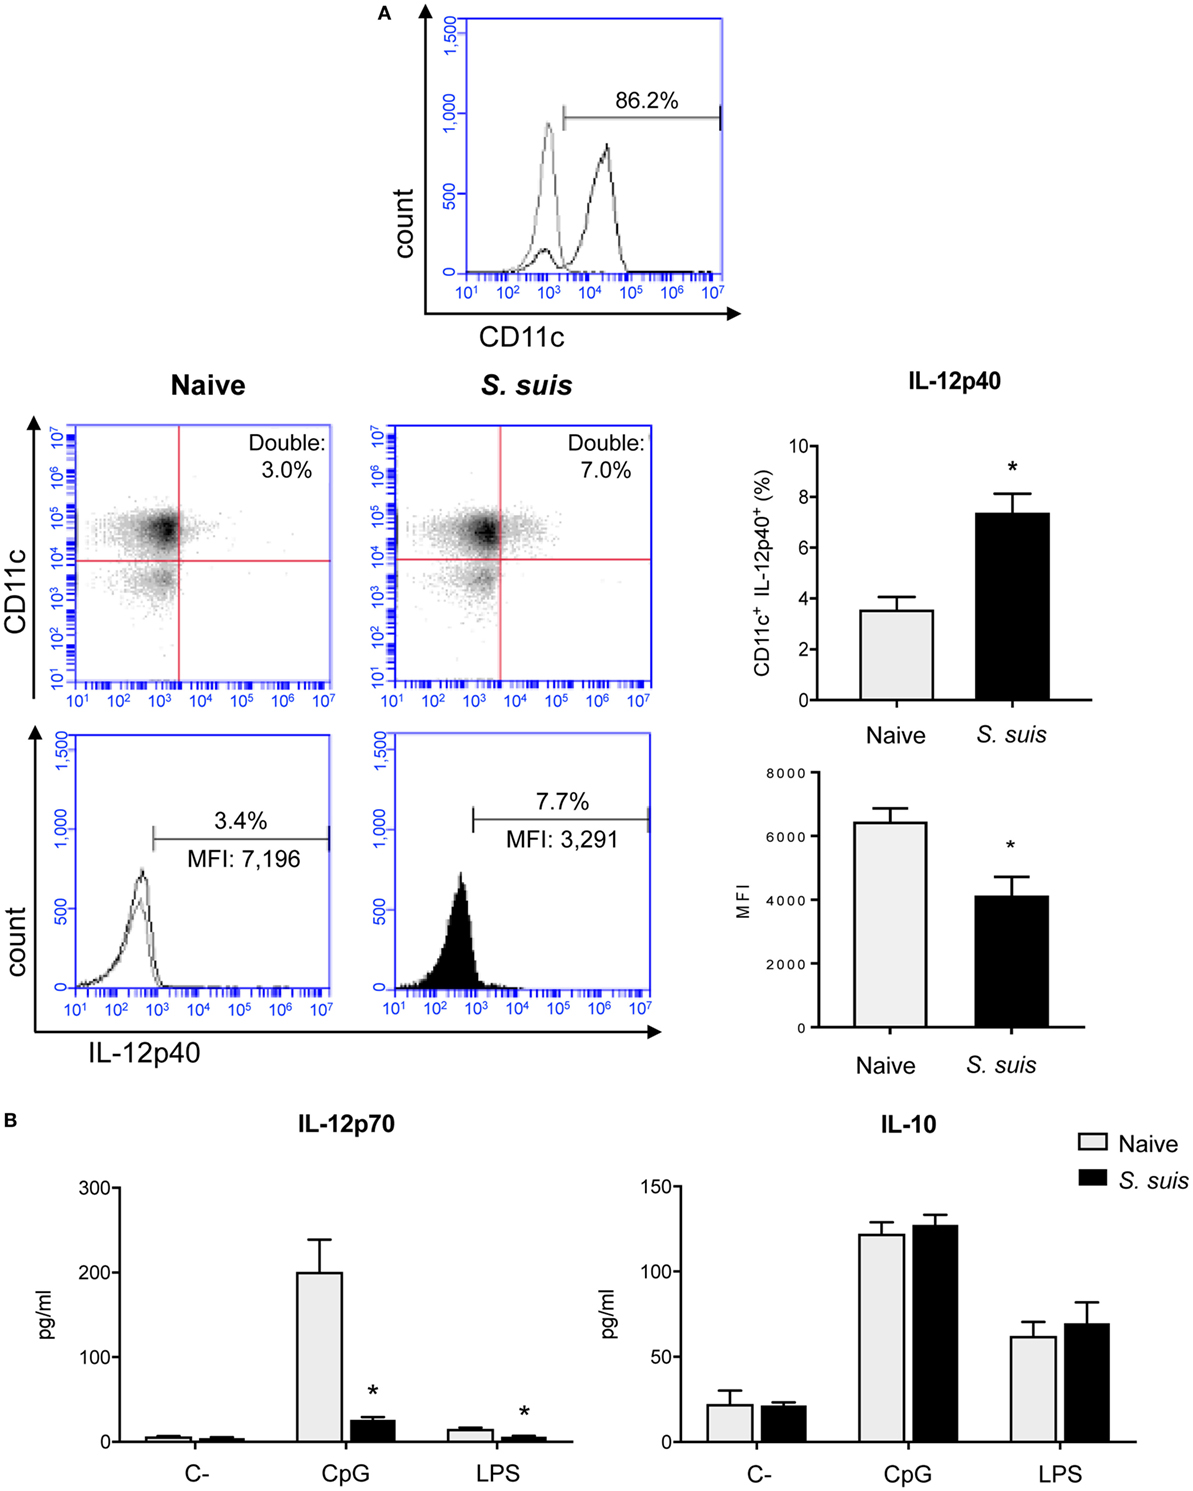
Figure 6. Splenic dendritic cells (DCs) have an impaired IL-12p70 secretion capacity following Streptococcus suis infection. C57BL/6 mice were injected intraperitoneally with 5 × 10⁷ CFU of S. suis wild-type (WT) strain P1/7. Spleens from mock-infected (naïve) and infected mice were harvested 6 h after infection (n = 8 per group). Splenic DCs were purified by MACS positive selection and CD11c purity is shown in (A). Cells were stained for IC-FACS analysis of IL-12p40 expression. Events are gated on total cells and data are expressed as mean ± SEM [% of double positive cells or of mean fluorescence intensity (MFI)]. Representative dot plots and histograms have been selected for this figure. The gray line on the histogram is the isotype control. 30,000 gated events were acquired per sample and data analysis was performed using BD Accuri™ C6 software. Quadrants were drawn based on Alexa488- and APC-control stains and plotted on logarithmic scales. (B) Cells were cultured for 24 h ex vivo with CpG oligodeoxynucleotides (1 µM) or LPS (1 µg/ml). Supernatants were harvested and IL-12p70 and IL-10 levels were quantified by ELISA. Unstimulated cells served as negative controls (C−) for basal expression. Data are expressed as mean ± SEM (in pg/ml). *P < 0.05 indicates a statistically significant difference compared to naïve cells.
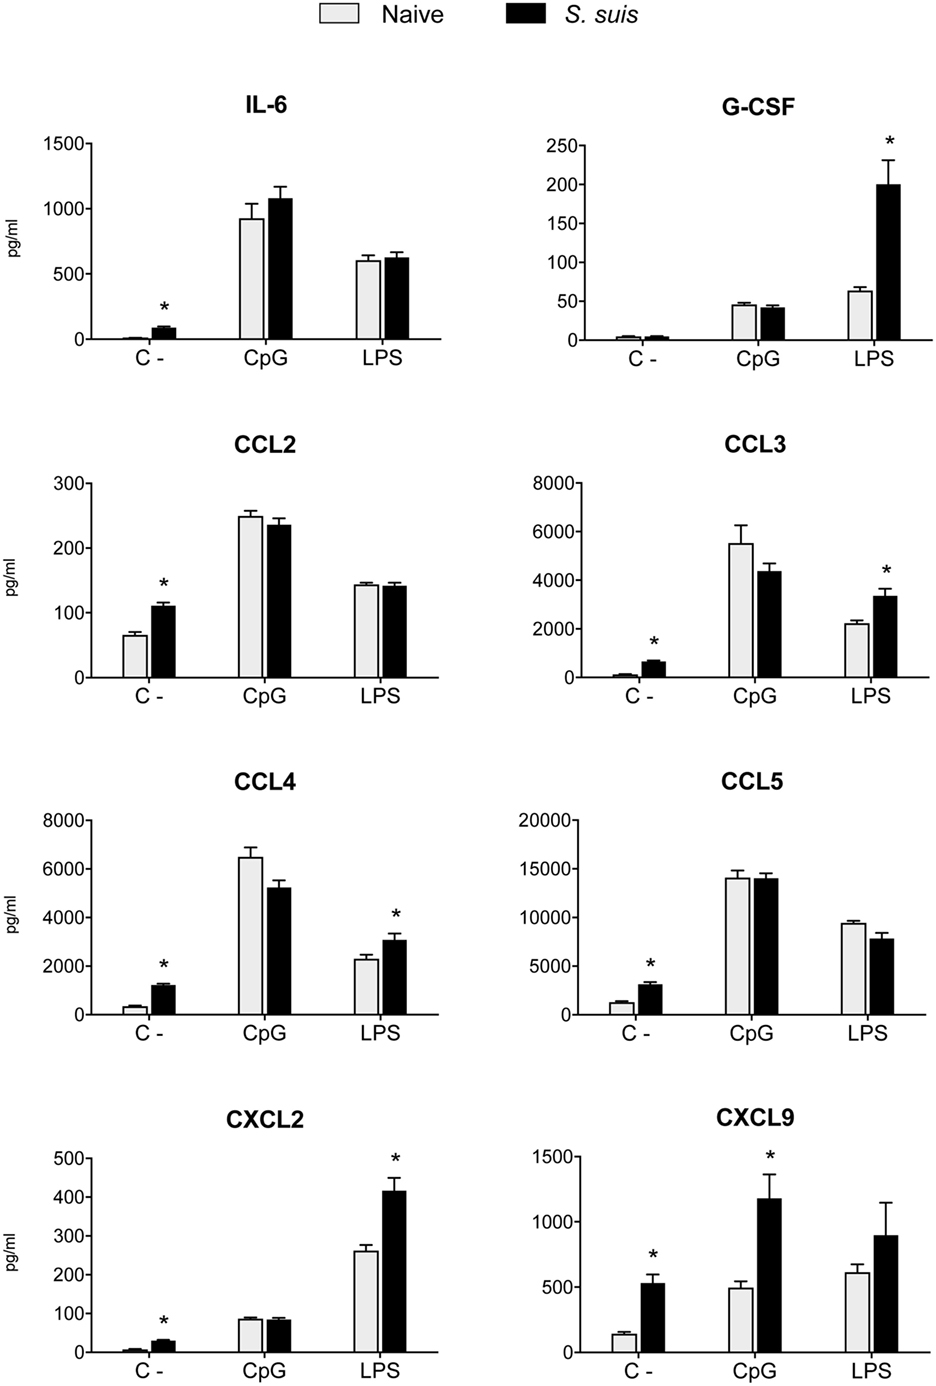
Figure 7. Splenic dendritic cells (DCs) maintain their secretion capacity of various cytokines and chemokines following Streptococcus suis infection. C57BL/6 mice were injected intraperitoneally with 5 × 10⁷ CFU of S. suis wild-type (WT) strain P1/7. Spleens from mock-infected (naïve) and infected mice were harvested 6 h after infection (n = 8 per group). Splenic DCs were purified by MACS positive selection. Cells were cultured for 24 h ex vivo with CpG oligodeoxynucleotides (1 µM) or LPS (1 µg/ml). Supernatants were harvested, and cytokine and chemokine levels were quantified by Luminex. Unstimulated cells served as negative controls (C−) for basal expression. Data were collected with Bio-Plex Manager™ software and analyzed with Bio-Plex® MAGPIX system. Data are expressed as mean ± SEM (in pg/ml). *P < 0.05 indicates a statistically significant difference compared to naïve cells.
S. suis Infection Impairs the MHC-II-Restricted Antigen Presentation Capacity of Splenic DCs
Finally, we analyzed whether S. suis infection could interfere with MHC-II-restricted antigen presentation. To this aim, we cocultured for 24 h splenic DCs derived from either naïve or infected mice with the T cell hybridoma BO97.10, specific for OVA323–339 epitope on I-Ab. The production of IL-2, TNF-α, IFN-γ, and IL-10 was measured in the supernatants by ELISA, as a way to evaluate CD4+ T cell activation in response to processing and presentation of the OVA323–339 peptide by DCs. CD4+ T cells incubated with DCs from infected mice showed significantly lower IL-2 production than CD4+ T cells exposed to naïve DCs (Figure 8). This diminished CD4+ T cell response was further supported by the reduced expression (at both % and MFI levels) of the CD25 receptor (IL-2 receptor α chain) that was observed by FACS on CD3ε+ cells after 24 h of coculture with DCs from infected mice. Meanwhile, CD25 expression remained unchanged on CD11c+ cells (Figure 9). DCs derived from S. suis-infected mice also induced a lower TNF-α production by CD4+ T cells as compared to their naïve counterparts (Figure 8). While S. suis infection did not alter the OVA-induced production of IFN-γ, it is interesting to note that these cells also failed to upregulate their IFN-γ production to the levels obtained with the positive control. No increased production of the regulatory cytokine IL-10 was detected in the cocultures, as was observed with the splenic DCs cultured ex vivo (Figure 6B).
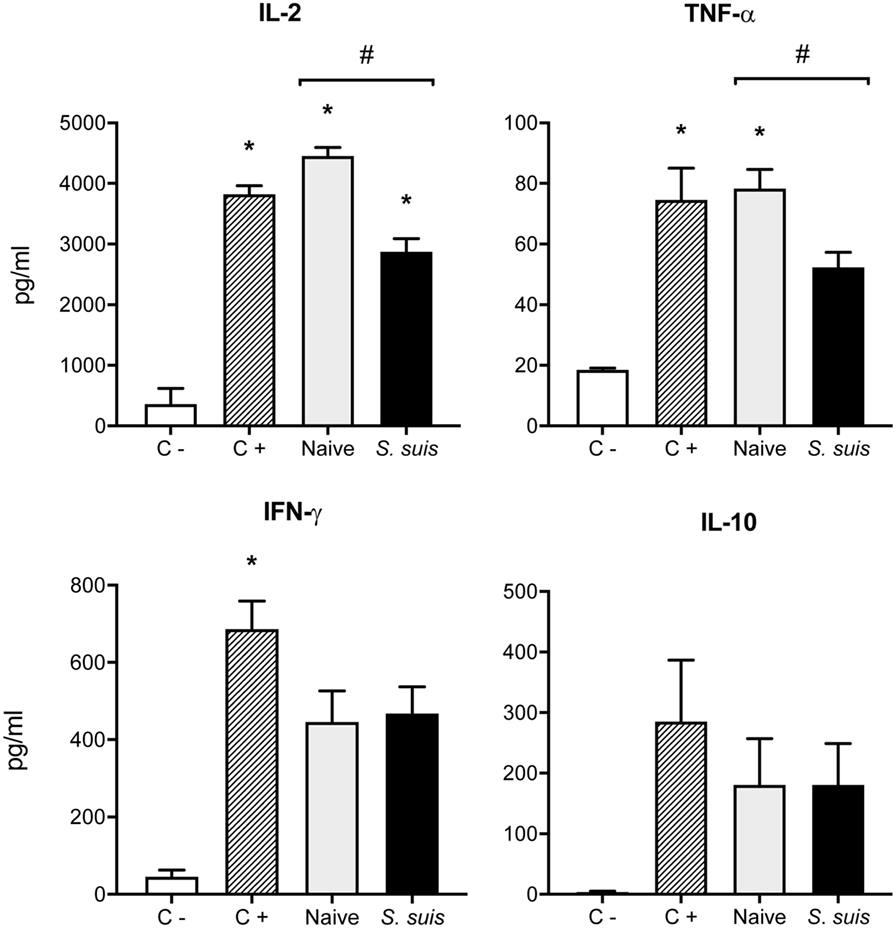
Figure 8. Splenic dendritic cells (DCs) from infected mice induce low Th1 cytokine production by CD4+ T cells. C57BL/6 mice were injected intraperitoneally with 5 × 10⁷ CFU of Streptococcus suis wild-type (WT) strain P1/7. Spleens from mock-infected (naïve) and infected mice were harvested 6 h after infection (n = 8 per group). Splenic DCs were purified by MACS positive selection and cocultured 24 h ex vivo with BO97.10 cells (DC:T cell ratio of 1:3) in Kappler–Marrack complete medium containing ovalbumin (OVA) (500 µg/ml) and antibiotics (100 µg/ml gentamycin). Supernatants were harvested and IL-2, TNF-α, IFN-γ, and IL-10 levels were quantified by ELISA. Cocultures incubated with medium alone served as negative controls (C−), while cocultures treated with LPS (1 µg/ml) and OVA served as positive controls (C+). Data are expressed as mean ± SEM (in pg/ml). *P < 0.05 indicates a statistically significant difference compared to unstimulated control cells. #P < 0.05 indicates a statistically significant difference between cells derived from naïve and infected mice.
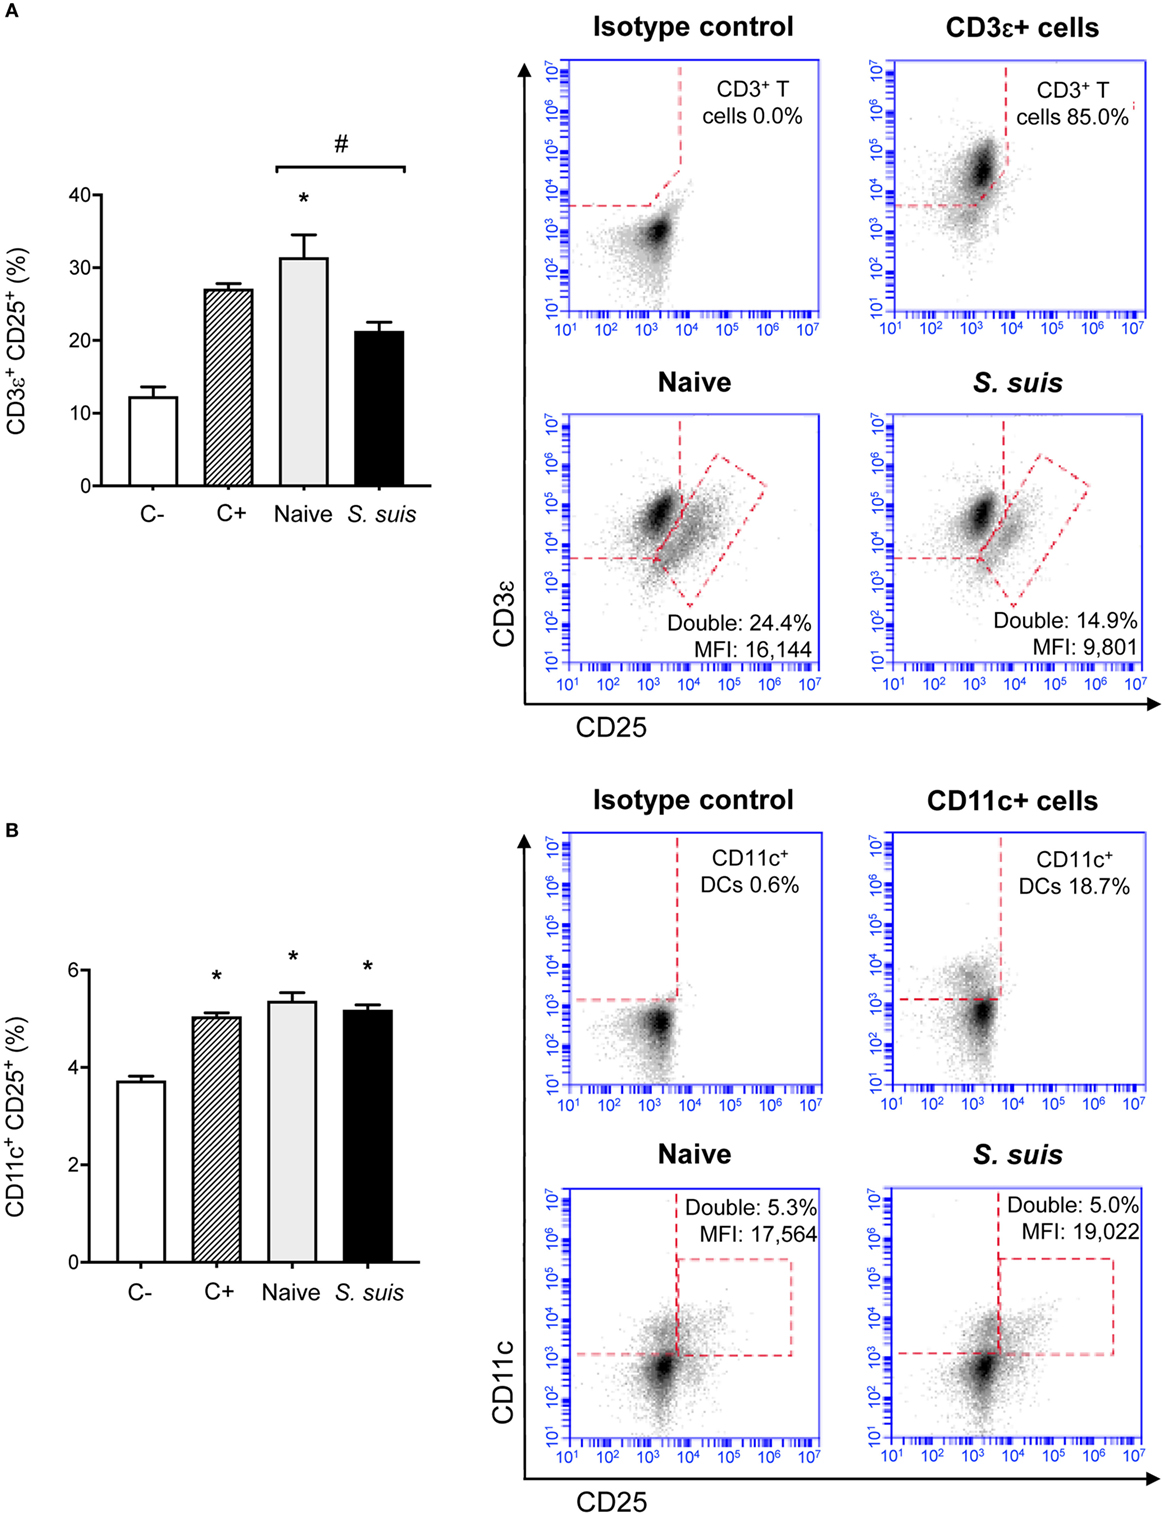
Figure 9. Splenic dendritic cells (DCs) from infected mice induce low CD25 expression on CD3ε+ cells but not on CD11c+ cells. C57BL/6 mice were injected intraperitoneally with 5 × 10⁷ CFU of Streptococcus suis wild-type (WT) strain P1/7. Spleens from mock-infected (naïve) and infected mice were harvested 6 h after infection (n = 8 per group). Splenic DCs were purified by MACS positive selection and cocultured 24 h ex vivo with BO97.10 cells (DC:T cell ratio of 1:3) in Kappler–Marrack complete medium containing ovalbumin (OVA) (500 µg/ml) and antibiotics (100 µg/ml gentamycin). Cocultures incubated with medium alone served as negative controls (C−), while cocultures treated with LPS (1 µg/ml) and OVA served as positive controls (C+). Cells were harvested and surface stained for FACS analysis of CD25 expression on (A) CD3ε+ or (B) CD11c+ cells. Events are gated on total cells and data are expressed as mean ± SEM (% of double positive cells). Representative dot plots have been selected for this figure, including mean fluorescence intensity (MFI) values. 30,000 gated events were acquired per sample and data analysis was performed using BD Accuri™ C6 software. Quadrants were drawn based on FITC-, PE/Cy5-, and APC-control stains and plotted on logarithmic scales. *P < 0.05 indicates a statistically significant difference compared to unstimulated control cells. #P < 0.05 indicates a statistically significant difference between cells derived from naïve and infected mice.
Single cell cultures (either DCs or T cells alone) were included as controls and showed no significant cytokine production. Moreover, the WT strain ability to induce polyclonal CD4+ T cell activation was investigated in S. suis-infected cocultures without OVA and was found to be negligible (data not shown). Interestingly, bmDCs infected in vitro with S. suis (thus yielding dir-mDCs) and cocultured with BO97.10 cells induced no clear difference in OVA-induced IL-2 and TNF-α levels, compared to non-infected cocultures (Figure S1 in Supplementary Material). Hence, these results suggest that indirect activation of DCs during the acute, pro-inflammatory phase of S. suis infection leads to suboptimal CD4+ T cell activation, while direct activation of DCs by S. suis itself might not interfere with this process to the same extent.
Discussion
While S. suis is known as a potent inducer of pro-inflammatory mediators during acute/peracute systemic infections (3, 6, 28), evidence of its ability to impair various immune cell functions and prevent the development of an effective adaptive immune response is not less substantial (6, 29, 32). In this regard, S. suis modulations of DC functions have been documented in mice, swine, and humans (9, 28–30), and CD4+ T cells were shown to be poorly activated during S. suis infection (32). However, a comprehensive evaluation of the DC antigen presentation ability has yet to be performed. This prompted us to evaluate MHC-II-restricted antigen presentation by DCs, as well as the other signals required for CD4+ T cell activation.
T cell receptor recognition of a specific antigenic peptide presented on an MHC-II molecule constitutes the first signal for CD4+ T cell activation. In order for an extracellular pathogen such as S. suis to have its antigenic peptides enter the MHC-II pathway in a DC, it must first be captured and processed by the APC. Therefore, we investigated the ability of S. suis-stimulated bmDCs to capture and degrade a soluble protein into peptides, using DQ-OVA. The CPS of S. suis is well known for conferring resistance to phagocytosis (7, 29, 38), and it has been shown to inhibit the entry of latex beads in macrophages (7); we thus expected S. suis-stimulated DCs to display impaired capture and consequently process OVA. However, our observations led us to conclude that, in DCs, S. suis does not significantly affect this phase of antigen presentation. S. suis CPS has been reported to block phagocytosis of bacterial size particles (such as latex beads), yet other endocytic pathways might remain unaltered. In fact, macropinocytosis has been described as a far more important endocytic process in DC-mediated antigen presentation to T cells (8). It should also be noticed that once S. suis is internalized (albeit at low levels) (9, 39), it is rapidly degraded intracellularly, thereby supporting the results of normal processing of DQ-OVA.
The MHC-II pathway involves a series of complex intracellular events that eventually lead to the trafficking of pMHC-II to the cell surface. The expression of MHC-II molecules on S. suis-stimulated DCs had only been studied thus far at long incubation times (16 h), like a mere cellular maturation marker (9, 29). However, the events that take place in the first few hours following stimulation appear to be decisive for the antigen repertoire selection, at least for dir-mDCs as these cells process microbial antigens at the time of the TLR stimulus only (27). Hence, we sought to investigate MHC-II expression in DCs responding to S. suis at short incubation times. Unfortunately, due to the lack of immunological tools available for S. suis, loading of MHC-II molecules with S. suis-derived peptides could not be evaluated directly in the present study, and the expression of MHC-II molecules on the cell surface (e.g., independently of the antigenic fragments they bore) was investigated instead. Through comparison with LPS-treated cells, in vitro kinetic studies evidenced a delayed increase of MHC-II+ cells in S. suis-stimulated bmDCs. Interestingly, this delay appeared to be more pronounced with the encapsulated strain, suggesting a role of the CPS in this modulation by either limiting bacterial internalization and/or hindering the recognition of immunogenic cell wall components by TLRs at the cell surface level (9, 29). We cannot undermine here the limitations of comparing S. suis with a pure TLR4 ligand, as a live pathogen is bound to interact with DCs in a much more complex way than the latter. However, for the sake of comparison with literature, LPS offered interesting perspectives: this ligand has been used extensively in molecular studies of the MHC-II pathway (in contrast to TLR2 ligands) and has also proven to be useful in the context of S. suis for normalizing the expression of DC maturation markers (30). The reduction of the MHC-II expression levels on naïve splenic DCs stimulated in vitro with encapsulated S. suis or splenic DCs derived from S. suis-infected mice supports the relevance of the in vitro findings and is consistent with a modulation of MHC-II expression by encapsulated S. suis. Moreover, it has been reported that the timing of DC antigen encounter and the subsequent changes induced by DC maturation can dramatically affect the outcome of vaccination (10).
To get an insight into the mechanisms potentially involved in the modulation of MHC-II expression in S. suis-stimulated DCs, transcriptional expression of CIITA, MARCH1, and MARCH8 was evaluated. Low CIITA mRNA levels were observed in S. suis-stimulated bmDCs and splenic DCs from S. suis-infected mice. These results suggest that S. suis impairs the ability of DCs to increase the synthesis of new MHC-II molecules shortly after they encounter the pathogen. The fact that newly synthesized MHC-II molecules constitute the primary source for antigen presentation (10) underscores the likelihood that S. suis disturbs the optimal timing between the processing of pathogen-derived antigens and MHC-II loading/trafficking, through CIITA modulation. Similarly, monocytes/macrophages infected with Mycobacterium tuberculosis or M. bovis BCG (40, 41) or Brucella abortus (42) were shown to downregulate the expression of IFN-γ-stimulated CIITA and MHC-II genes at very early time points in a way to prevent recognition by T cells and establish a chronic infection. Yet, this is the first time that CIITA regulation is observed in DCs with an extracellular pathogen. As for the transcription of the ubiquitin ligases MARCH1/8, our results suggest that the encapsulated strain of S. suis hijacks MARCH1/8-mediated MHC-II ubiquitination in DCs, thereby promoting lysosomal degradation of these molecules with obvious consequences on antigen presentation to CD4+ T cells. Modulation of MARCH1 expression and subsequent MHC-II downregulation has already been described in Francisella tularensis-infected macrophages and attributed to a PGE2-inducible host factor capable of inducing IL-10 (43). However, it appears unlikely that S. suis would use a similar mechanism to modulate MARCH1 expression in DCs since the effect of IL-10 on antigen presentation is MARCH1-independent in this cell type (11). Our in vivo results support, at least in part, a modulation of MARCH1/8 expression by S. suis, as sustained transcription levels of these molecules were observed in splenic DCs derived from infected mice, without involving IL-10 upregulation. In a murine model of multiple organ dysfunction syndrome (MODS), which is characterized by the loss of control over systemic inflammatory responses, the protein expression levels of MHC-II and functional immune activities of DCs were also inversely related to MARCH1 expression. The authors suggested that MARCH1-mediated ubiquitination and aberrant degradation of MHC-II on DC surfaces affected the pathological progression of MODS (44).
Modulation of MHC-II expression in S. suis-stimulated DCs cannot be analyzed without discussing the maturation profile of the cells. Although a clear and unanimous definition of mature and immunogenic DCs is yet to be determined, phenotypically mature DCs are usually defined, regardless of their activation mode, by their high surface expression of appropriate “maturation markers” such as MHC-II, CD80, CD86, CD40, and CCR7 (20, 21). BmDCs were most probably activated directly in our in vitro experiments, as autocrine production of inflammatory mediators is likely negligible in a closed system at short incubation times. However, the delayed MHC-II kinetics and a low CD86 expression that we observed at early time points suggest that S. suis failed to induce optimal cellular maturation at those times. Upregulation of MARCH1/8 in S. suis-stimulated bmDCs could be responsible for their impaired MHC-II and CD86 expression, but other regulatory mechanisms must be involved, as bmDCs stimulated with the non-encapsulated mutant still displayed a low CD86 expression despite an adequate downregulation of MARCH1/8. Meanwhile, splenic DCs from infected mice showed high percentages of CD86+ cells but low CIITA expression and sustained mRNA levels of MARCH1/8, with concomitant reduction in expression levels of MHC-II. These last results support our in vitro findings, even though splenic DCs form a heterogeneous population of DC subsets with distinct maturation phenotypes, levels of infection, and T cell-priming capacities (45). S. suis could also interact differently with DCs of various origins, as in vitro-stimulated bmDCs and splenic DCs were found to differ in their MHC-II expression profile at late time points. Finally, our in vivo approach possibly yielded both dir-mDCs and indir-mDCs as splenocytes had the opportunity to encounter either the pathogen itself or the inflammatory mediators released by innate immune cells during the acute phase of the infection.
The last signal required for full CD4+ T cell activation is the production of polarizing cytokines by the APC. Host protection against S. suis is highly dependent on antibodies associated with Th1 immune responses (2). However, encapsulated S. suis serotype 2 has been shown to induce, in murine and human DCs in vitro, a high IL-10/IL-12 ratio, which indicates the potential to polarize T cell responses toward Th2/Treg, or at least to impair optimal T cell activation (29, 30). Actually, S. suis systemic infection induces a weak Th1 response with low levels of TNF-α, IFN-γ, and IL-2 as well as the production of IL-10. S. suis CPS is known to interfere with CD4+ T cell activation (32). Here, we found that splenic DCs derived from S. suis-infected mice specifically failed to secrete IL-12p70 in response to ex vivo stimulation with CpG or LPS, thus revealing that the infection primarily leads, in fact, to indir-mDCs. Consequently, these cells elicited a significant inhibition of IL-2 production by CD4+ T cells in an antigen presentation assay, along with low levels of TNF-α and IFN-γ. These results were further supported by the downregulated expression of CD25 that we observed on CD3ε+ cells, which reflects the inhibition of T cell activation (46) in response to S. suis infection. Meanwhile, the fact that CD11c+ cells from infected mice expressed similar levels of CD25 as their naïve counterparts might suggest that the infection does not induce regulatory DCs (47, 48) or Th17-polarizing DCs (49). Nevertheless, the slight increase of IL-12p40+ cells that we detected by IC-FACS in splenic DCs from infected mice might still reflect the initiation of a Th17 response—rather than representing a bioactive IL-12p70 production—as IL-12p70 shares its subunit p40 with IL-23, a key cytokine for Th17 and Th1 responses against extracellular bacteria (19, 50). Interestingly, the direct activation of porcine or mouse bmDCs by S. suis results in increased levels of IL-23 production in vitro (29, 51), once again suggesting possible generation of both dir-mDCs and indir-mDCs during in vivo S. suis infection.
Similarly, M. tuberculosis has been reported to impair IL-12p70 secretion and antigen presentation to CD4+ T cells, thus diverting T cell differentiation toward Tregs or Th2 cells that are not productive toward an intracellular pathogen like M. tuberculosis (52, 53). Impaired antigen presentation ability of DCs has also been demonstrated for Salmonella enterica (54, 55) and B. suis (56), all intracellular pathogens. Albeit these mechanisms seem to be generalized to several intracellular pathogens, this is the first time that in vitro and in vivo transcriptional regulation of MHC-II, ex vivo DC antigen presentation, and downstream effects on T cell activation are evaluated in the context of an infection with an extracellular pathogen. To the best of our knowledge, only one study has previously reported that bmDCs exposed in vitro to live S. mutans fail to drive antigen-specific T cell proliferation (57), which is different from what was observed with S. suis dir-mDCs in this study. Finally, in vivo experiments conducted in parallel with another Gram-positive encapsulated bacterium, Group B Streptococcus (GBS), have shown that both pathogens have similar surface expression profiles of MHC-II and CD86 and transcription levels of antigen presentation genes (unpublished observations); yet, GBS-infected mice developed optimal primary and memory T cell responses (58). It thus remains to further investigate whether the observed modulation of IL-12p70 is a feature common to systemic inflammatory response-inducing agents, a particular bacterial immune evasion strategy, or even a combination of both mechanisms.
This work offers a comprehensive study of the signals involved in antigen presentation in DCs responding to S. suis and their consequences on CD4+ T cell activation. We have shown that S. suis modulates MHC-II expression, both in vitro and in vivo. S. suis CPS was found to be only partly accountable for these transcriptional profiles. In fact, a variety of factors defining the strain pathogenicity might be involved in the modulation of the APC functions by systemic inflammatory response-inducing pathogens. Nevertheless, this is the first report of an in vivo transcriptional kinetics study of CIITA and MARCH1/8 in DCs responding to a live bacterial pathogen. More importantly, we described, in splenic DCs from infected mice, a cytokine secretion profile that is compatible with indirect activation by inflammatory mediators during the acute phase of S. suis infection. These cells have an impaired MHC-II-restricted antigen presentation capacity and an altered cytokine profile, which could lead to the formation of heterogeneous Th cells (21). This study thus highlights the potential consequences of inflammation on the type and magnitude of the immune response elicited by a pathogen. Better characterization of dir-mDCs and indir-mDCs profiles will help understand in the future how pathogens modulate T cell activation signals 1 and 2.
Ethics Statement
This study was carried out in accordance with the recommendations of the guidelines and policies of the Canadian Council on Animal Care and the principles set forth in the Guide for the Care and Use of Laboratory Animals. The protocols and procedures were approved by the Animal Welfare Committee of the University of Montreal (protocol number rech-1399).
Author Contributions
Conceived and designed the experiments: CL, MG, JT, and MS. Performed the experiments: CL, PL, J-PA, and TG. Analyzed the data and contributed to the writing of the manuscript: CL, MG, JT, and MS. All authors have read and approved the manuscript.
Conflict of Interest Statement
The authors declare that the research was conducted in the absence of any commercial or financial relationships that could be construed as a potential conflict of interest.
Acknowledgments
The authors would like to thank Sonia Lacouture, Marie-Pier Lecours, and David Roy for technical help, and Dr. Michel Desjardins for the BO97.10 hybridoma. An earlier version of this manuscript was included in CL’s master’s thesis (59).
Funding
This work was mainly supported by the Natural Sciences and Engineering Research Council of Canada (NSERC) through a grant to MS (no. 342150) and by Canadian Institutes of Health Research (CIHR) and Canada Foundation for Innovation (CFI) through grants to Jacques Thibodeau (CIHR no. 93592). CL is the recipient of an M.S. award granted by NSERC and of a Zoetis Investment in Innovation Award.
Supplementary Material
The Supplementary Material for this article can be found online at https://www.frontiersin.org/articles/10.3389/fimmu.2018.01199/full#supplementary-material.
Abbreviations
bmDC, bone marrow-derived dendritic cell; CIITA, Class II major histocompatibility complex transactivator; CPS, capsular polysaccharide; dir-mDC, directly activated mature DC; indir-mDC, indirectly activated mature DC; MARCH, membrane-associated RING-CH; OVA, ovalbumin; pMHC-II, peptide–MHC-II complexes; WT, wild type.
References
1. Goyette-Desjardins G, Auger JP, Xu J, Segura M, Gottschalk M. Streptococcus suis, an important pig pathogen and emerging zoonotic agent—an update on the worldwide distribution based on serotyping and sequence typing. Emerg Microbes Infect (2014) 3(6):e45. doi:10.1038/emi.2014.45
2. Segura M. Streptococcus suis vaccines: candidate antigens and progress. Expert Rev Vaccines (2015) 14(12):1587–608. doi:10.1586/14760584.2015.1101349
3. Dominguez-Punaro MC, Segura M, Plante MM, Lacouture S, Rivest S, Gottschalk M. Streptococcus suis serotype 2, an important swine and human pathogen, induces strong systemic and cerebral inflammatory responses in a mouse model of infection. J Immunol (2007) 179(3):1842–54. doi:10.4049/jimmunol.179.3.1842
4. Dominguez-Punaro MC, Segura M, Radzioch D, Rivest S, Gottschalk M. Comparison of the susceptibilities of C57BL/6 and A/J mouse strains to Streptococcus suis serotype 2 infection. Infect Immun (2008) 76(9):3901–10. doi:10.1128/IAI.00350-08
5. Lachance C, Gottschalk M, Gerber PP, Lemire P, Xu J, Segura M. Exacerbated type II interferon response drives hypervirulence and toxic shock by an emergent epidemic strain of Streptococcus suis. Infect Immun (2013) 81(6):1928–39. doi:10.1128/IAI.01317-12
6. Fittipaldi N, Segura M, Grenier D, Gottschalk M. Virulence factors involved in the pathogenesis of the infection caused by the swine pathogen and zoonotic agent Streptococcus suis. Future Microbiol (2012) 7(2):259–79. doi:10.2217/fmb.11.149
7. Houde M, Gottschalk M, Gagnon F, Van Calsteren MR, Segura M. Streptococcus suis capsular polysaccharide inhibits phagocytosis through destabilization of lipid microdomains and prevents lactosylceramide-dependent recognition. Infect Immun (2012) 80(2):506–17. doi:10.1128/IAI.05734-11
8. Liu Z, Roche PA. Macropinocytosis in phagocytes: regulation of MHC class-II-restricted antigen presentation in dendritic cells. Front Physiol (2015) 6:1. doi:10.3389/fphys.2015.00001
9. Lecours MP, Segura M, Lachance C, Mussa T, Surprenant C, Montoya M, et al. Characterization of porcine dendritic cell response to Streptococcus suis. Vet Res (2011) 42(1):72. doi:10.1186/1297-9716-42-72
10. Vega-Ramos J, Villadangos JA. Consequences of direct and indirect activation of dendritic cells on antigen presentation: functional implications and clinical considerations. Mol Immunol (2013) 55(2):175–8. doi:10.1016/j.molimm.2012.10.034
11. Mittal SK, Cho KJ, Ishido S, Roche PA. IL-10 mediated immunosuppression: March-I induction regulates antigen presentation by macrophages but not dendritic cells. J Biol Chem (2015) 290(45):27158–67. doi:10.1074/jbc.M115.682708
12. Blum JS, Wearsch PA, Cresswell P. Pathways of antigen processing. Annu Rev Immunol (2013) 31:443–73. doi:10.1146/annurev-immunol-032712-095910
13. Thibodeau J, Bourgeois-Daigneault MC, Lapointe R. Targeting the MHC class II antigen presentation pathway in cancer immunotherapy. Oncoimmunology (2012) 1(6):908–16. doi:10.4161/onci.21205
14. Cella M, Engering A, Pinet V, Pieters J, Lanzavecchia A. Inflammatory stimuli induce accumulation of MHC class II complexes on dendritic cells. Nature (1997) 388(6644):782–7. doi:10.1038/42030
15. Mintern JD, Macri C, Villadangos JA. Modulation of antigen presentation by intracellular trafficking. Curr Opin Immunol (2015) 34:16–21. doi:10.1016/j.coi.2014.12.006
16. Hivroz C, Chemin K, Tourret M, Bohineust A. Crosstalk between T lymphocytes and dendritic cells. Crit Rev Immunol (2012) 32(2):139–55. doi:10.1615/CritRevImmunol.v32.i2.30
17. Bakdash G, Sittig SP, Van Dijk T, Figdor CG, De Vries IJ. The nature of activatory and tolerogenic dendritic cell-derived signal II. Front Immunol (2013) 4:53. doi:10.3389/fimmu.2013.00053
18. De Jong EC, Smits HH, Kapsenberg ML. Dendritic cell-mediated T cell polarization. Springer Semin Immunopathol (2005) 26(3):289–307. doi:10.1007/s00281-004-0167-1
19. Zhu J, Paul WE. Heterogeneity and plasticity of T helper cells. Cell Res (2010) 20(1):4–12. doi:10.1038/cr.2009.138
20. Joffre O, Nolte MA, Sporri R, Reis e Sousa C. Inflammatory signals in dendritic cell activation and the induction of adaptive immunity. Immunol Rev (2009) 227(1):234–47. doi:10.1111/j.1600-065X.2008.00718.x
21. Vega-Ramos J, Roquilly A, Zhan Y, Young LJ, Mintern JD, Villadangos JA. Inflammation conditions mature dendritic cells to retain the capacity to present new antigens but with altered cytokine secretion function. J Immunol (2014) 193(8):3851–9. doi:10.4049/jimmunol.1303215
22. Cho KJ, Roche PA. Regulation of MHC class II-peptide complex expression by ubiquitination. Front Immunol (2013) 4:369. doi:10.3389/fimmu.2013.00369
23. Pan H, O’brien TF, Wright G, Yang J, Shin J, Wright KL, et al. Critical role of the tumor suppressor tuberous sclerosis complex 1 in dendritic cell activation of CD4 T cells by promoting MHC class II expression via IRF4 and CIITA. J Immunol (2013) 191(2):699–707. doi:10.4049/jimmunol.1201443
24. De Gassart A, Camosseto V, Thibodeau J, Ceppi M, Catalan N, Pierre P, et al. MHC class II stabilization at the surface of human dendritic cells is the result of maturation-dependent MARCH I down-regulation. Proc Natl Acad Sci U S A (2008) 105(9):3491–6. doi:10.1073/pnas.0708874105
25. Carreno LJ, Gonzalez PA, Kalergis AM. Modulation of T cell function by TCR/pMHC binding kinetics. Immunobiology (2006) 211(1–2):47–64. doi:10.1016/j.imbio.2005.09.003
26. Vega-Ramos J, Roquilly A, Asehnoune K, Villadangos JA. Modulation of dendritic cell antigen presentation by pathogens, tissue damage and secondary inflammatory signals. Curr Opin Pharmacol (2014) 17:64–70. doi:10.1016/j.coph.2014.07.013
27. Simmons DP, Wearsch PA, Canaday DH, Meyerson HJ, Liu YC, Wang Y, et al. Type I IFN drives a distinctive dendritic cell maturation phenotype that allows continued class II MHC synthesis and antigen processing. J Immunol (2012) 188(7):3116–26. doi:10.4049/jimmunol.1101313
28. Lecours MP, Segura M, Fittipaldi N, Rivest S, Gottschalk M. Immune receptors involved in Streptococcus suis recognition by dendritic cells. PLoS One (2012) 7(9):e44746. doi:10.1371/journal.pone.0044746
29. Lecours MP, Gottschalk M, Houde M, Lemire P, Fittipaldi N, Segura M. Critical role for Streptococcus suis cell wall modifications and suilysin in resistance to complement-dependent killing by dendritic cells. J Infect Dis (2011) 204(6):919–29. doi:10.1093/infdis/jir415
30. Meijerink M, Ferrando ML, Lammers G, Taverne N, Smith HE, Wells JM. Immunomodulatory effects of Streptococcus suis capsule type on human dendritic cell responses, phagocytosis and intracellular survival. PLoS One (2012) 7(4):e35849. doi:10.1371/journal.pone.0035849
31. Rescigno M. Dendritic cell functions: learning from microbial evasion strategies. Semin Immunol (2015) 27(2):119–24. doi:10.1016/j.smim.2015.03.012
32. Lecours MP, Letendre C, Clarke D, Lemire P, Galbas T, Benoit-Biancamano MO, et al. Immune-responsiveness of CD4+ T cells during Streptococcus suis serotype 2 infection. Sci Rep (2016) 6:38061. doi:10.1038/srep38061
33. Calzas C, Lemire P, Auray G, Gerdts V, Gottschalk M, Segura M. Antibody response specific to the capsular polysaccharide is impaired in Streptococcus suis serotype 2-infected animals. Infect Immun (2015) 83(1):441–53. doi:10.1128/IAI.02427-14
34. Matheoud D, Moradin N, Bellemare-Pelletier A, Shio MT, Hong WJ, Olivier M, et al. Leishmania evades host immunity by inhibiting antigen cross-presentation through direct cleavage of the SNARE VAMP8. Cell Host Microbe (2013) 14(1):15–25. doi:10.1016/j.chom.2013.06.003
35. Stockinger B, Zal T, Zal A, Gray D. B cells solicit their own help from T cells. J Exp Med (1996) 183(3):891–9. doi:10.1084/jem.183.3.891
36. Segura M, Su Z, Piccirillo C, Stevenson MM. Impairment of dendritic cell function by excretory–secretory products: a potential mechanism for nematode-induced immunosuppression. Eur J Immunol (2007) 37(7):1887–904. doi:10.1002/eji.200636553
37. Lemire P, Galbas T, Thibodeau J, Segura M. Natural killer cell functions during the innate immune response to pathogenic streptococci. Front Microbiol (2017) 8:1196. doi:10.3389/fmicb.2017.01196
38. Segura M, Gottschalk M, Olivier M. Encapsulated Streptococcus suis inhibits activation of signaling pathways involved in phagocytosis. Infect Immun (2004) 72(9):5322–30. doi:10.1128/IAI.72.9.5322-5330.2004
39. Segura MA, Cleroux P, Gottschalk M. Streptococcus suis and group B Streptococcus differ in their interactions with murine macrophages. FEMS Immunol Med Microbiol (1998) 21(3):189–95. doi:10.1111/j.1574-695X.1998.tb01165.x
40. Richardson ET, Shukla S, Sweet DR, Wearsch PA, Tsichlis PN, Boom WH, et al. Toll-like receptor 2-dependent extracellular signal-regulated kinase signaling in Mycobacterium tuberculosis-infected macrophages drives anti-inflammatory responses and inhibits Th1 polarization of responding T cells. Infect Immun (2015) 83(6):2242–54. doi:10.1128/IAI.00135-15
41. Ghorpade DS, Holla S, Sinha AY, Alagesan SK, Balaji KN. Nitric oxide and KLF4 protein epigenetically modify class II transactivator to repress major histocompatibility complex II expression during Mycobacterium bovis bacillus Calmette-Guerin infection. J Biol Chem (2013) 288(28):20592–606. doi:10.1074/jbc.M113.472183
42. Velasquez LN, Milillo MA, Delpino MV, Trotta A, Fernandez P, Pozner RG, et al. Brucella abortus down-regulates MHC class II by the IL-6-dependent inhibition of CIITA through the downmodulation of IFN regulatory factor-1 (IRF-1). J Leukoc Biol (2017) 101(3):759–73. doi:10.1189/jlb.4A0416-196R
43. Hunt D, Wilson JE, Weih KA, Ishido S, Harton JA, Roche PA, et al. Francisella tularensis elicits IL-10 via a PGE(2)-inducible factor, to drive macrophage MARCH1 expression and class II down-regulation. PLoS One (2012) 7(5):e37330. doi:10.1371/journal.pone.0037330
44. Li F, Lu JY, Liu Q, Wang HW, Guo H. Altered MARCH1 ubiquitination-regulated dendritic cell immune functions during the early stage of zymosan-induced multiple organ dysfunction syndrome (MODS) in mice. Immunol Lett (2013) 150(1–2):105–15. doi:10.1016/j.imlet.2012.12.012
45. Mitchell LM, Brzoza-Lewis KL, Henry CJ, Grayson JM, Westcott MM, Hiltbold EM. Distinct responses of splenic dendritic cell subsets to infection with Listeria monocytogenes: maturation phenotype, level of infection, and T cell priming capacity ex vivo. Cell Immunol (2011) 268(2):79–86. doi:10.1016/j.cellimm.2011.03.001
46. Kang JO, Lee JB, Chang J. Cholera toxin promotes Th17 cell differentiation by modulating expression of polarizing cytokines and the antigen-presenting potential of dendritic cells. PLoS One (2016) 11(6):e0157015. doi:10.1371/journal.pone.0157015
47. Driesen J, Popov A, Schultze JL. CD25 as an immune regulatory molecule expressed on myeloid dendritic cells. Immunobiology (2008) 213(9–10):849–58. doi:10.1016/j.imbio.2008.07.026
48. Schmidt SV, Nino-Castro AC, Schultze JL. Regulatory dendritic cells: there is more than just immune activation. Front Immunol (2012) 3:274. doi:10.3389/fimmu.2012.00274
49. Liang D, Zuo A, Shao H, Born WK, O’brien RL, Kaplan HJ, et al. Role of CD25+ dendritic cells in the generation of Th17 autoreactive T cells in autoimmune experimental uveitis. J Immunol (2012) 188(11):5785–91. doi:10.4049/jimmunol.1200109
50. Kim BJ, Lee S, Berg RE, Simecka JW, Jones HP. Interleukin-23 (IL-23) deficiency disrupts Th17 and Th1-related defenses against Streptococcus pneumoniae infection. Cytokine (2013) 64(1):375–81. doi:10.1016/j.cyto.2013.05.013
51. Auray G, Lachance C, Wang Y, Gagnon CA, Segura M, Gottschalk M. Transcriptional analysis of PRRSV-infected porcine dendritic cell response to Streptococcus suis infection reveals up-regulation of inflammatory-related genes expression. PLoS One (2016) 11(5):e0156019. doi:10.1371/journal.pone.0156019
52. Heuer M, Behlich AS, Lee JS, Ribechini E, Jo EK, Lutz MB. The 30-kDa and 38-kDa antigens from Mycobacterium tuberculosis induce partial maturation of human dendritic cells shifting CD4(+) T cell responses towards IL-4 production. BMC Immunol (2013) 14:48. doi:10.1186/1471-2172-14-48
53. Madan-Lala R, Sia JK, King R, Adekambi T, Monin L, Khader SA, et al. Mycobacterium tuberculosis impairs dendritic cell functions through the serine hydrolase Hip1. J Immunol (2014) 192(9):4263–72. doi:10.4049/jimmunol.1303185
54. Atif SM, Winter SE, Winter MG, Mcsorley SJ, Baumler AJ. Salmonella enterica serovar Typhi impairs CD4 T cell responses by reducing antigen availability. Infect Immun (2014) 82(6):2247–54. doi:10.1128/IAI.00020-14
55. Bueno SM, Riquelme S, Riedel CA, Kalergis AM. Mechanisms used by virulent Salmonella to impair dendritic cell function and evade adaptive immunity. Immunology (2012) 137(1):28–36. doi:10.1111/j.1365-2567.2012.03614.x
56. Billard E, Dornand J, Gross A. Brucella suis prevents human dendritic cell maturation and antigen presentation through regulation of tumor necrosis factor alpha secretion. Infect Immun (2007) 75(10):4980–9. doi:10.1128/IAI.00637-07
57. Butcher JP, Malcolm J, Benson RA, Deng DM, Brewer JM, Garside P, et al. Effects of Streptococcus mutans on dendritic cell activation and function. J Dent Res (2011) 90(10):1221–7. doi:10.1177/0022034511412970
58. Clarke D, Letendre C, Lecours MP, Lemire P, Galbas T, Thibodeau J, et al. Group B Streptococcus induces a robust IFN-gamma response by CD4(+) T cells in an in vitro and in vivo model. J Immunol Res (2016) 2016:5290604. doi:10.1155/2016/5290604
Keywords: Streptococcus suis, inflammation, dendritic cells, T cells, antigen presentation, MHC-II, Th1 response, Interleukin-12
Citation: Letendre C, Auger J-P, Lemire P, Galbas T, Gottschalk M, Thibodeau J and Segura M (2018) Streptococcus suis Serotype 2 Infection Impairs Interleukin-12 Production and the MHC-II-Restricted Antigen Presentation Capacity of Dendritic Cells. Front. Immunol. 9:1199. doi: 10.3389/fimmu.2018.01199
Received: 18 December 2017; Accepted: 14 May 2018;
Published: 30 May 2018
Edited by:
Abhay Satoskar, The Ohio State University, United StatesReviewed by:
Beatrix Schumak, Universität Bonn, GermanyRoland Lang, Universitätsklinikum Erlangen, Germany
Copyright: © 2018 Letendre, Auger, Lemire, Galbas, Gottschalk, Thibodeau and Segura. This is an open-access article distributed under the terms of the Creative Commons Attribution License (CC BY). The use, distribution or reproduction in other forums is permitted, provided the original author(s) and the copyright owner are credited and that the original publication in this journal is cited, in accordance with accepted academic practice. No use, distribution or reproduction is permitted which does not comply with these terms.
*Correspondence: Jacques Thibodeau, amFjcXVlcy50aGlib2RlYXVAdW1vbnRyZWFsLmNh;
Mariela Segura, bWFyaWVsYS5zZWd1cmFAdW1vbnRyZWFsLmNh
†These authors have contributed equally to this work.