 Kim Ohl1*†
 Athanassios Fragoulis2,3†
 Patricia Klemm1Julian Baumeister1Wiebke Klock1
 Eva Verjans1,4Svenja Böll1,4Julia Möllmann5Michael Lehrke5Ivan Costa6
 Bernd Denecke6Angela Schippers1
 Johannes Roth7Norbert Wagner1Christoph Wruck2‡
 Klaus Tenbrock1*‡
- 1Department of Pediatrics, Medical Faculty, RWTH Aachen, Aachen, Germany
- 2Department of Anatomy and Cell Biology, Medical Faculty, RWTH Aachen, Aachen, Germany
- 3Department of General Visceral and Transplantation Surgery, Molecular Tumor Biology, Medical Faculty, RWTH Aachen, Aachen, Germany
- 4Institute of Pharmacology and Toxicology, RWTH Aachen, Aachen, Germany
- 5Department of Medicine I, Medical Faculty, RWTH Aachen, Aachen, Germany
- 6Interdisciplinary Centre for Clinical Research (IZKF) Aachen, Medical Faculty, RWTH Aachen, Aachen, Germany
- 7Institute of Immunology, University of Münster, Münster, Germany
Arising in inflammatory conditions, myeloid-derived suppressor cells (MDSCs) are constantly confronted with intracellular and extracellular reactive oxygen species molecules and oxidative stress. Generating mice with a constitutive activation of Nuclear factor (erythroid-derived 2)-like 2 (Nrf2) we show a pivotal role of the antioxidant stress defense for development of these immune-modulatory cells. These mice are characterized by a massive increase of splenic CD11b+Gr-1+ cells, which exhibit typical suppressive characteristics of MDSCs. Whole transcriptome analysis revealed Nrf2-dependent activation of cell cycle and metabolic pathways, which resemble pathways in CD11b+Gr-1+ MDSCs expanded by in vivo LPS exposure. Constitutive Nrf2 activation thereby regulates activation and balance between glycolysis and mitochondrial metabolism and hence expansion of highly suppressive MDSCs, which mediate protection in LPS-induced sepsis. Our study establishes Nrf2 as key regulator of MDSCs and acquired tolerance against LPS-induced sepsis.
Introduction
Myeloid-derived suppressor cells (MDSCs) are a heterogeneous population of immature myeloid cells (IMCs), induced under pathological conditions such as infection and sepsis, chronic inflammation, and cancer (1). The main feature of these cells is their potent immunosuppressive activity. It is therefore not surprising that MDSCs have emerged as major regulators of pathogenic and inflammatory immune responses (2). In addition to its important role in cancer, MDSCs expand during murine sepsis as well as in septic patients (3, 4). Although sepsis patients have high levels of inflammatory mediators, components of their immune system are suppressed as well. This modified steady state of innate immunity after infection is referred to as innate memory (5, 6). Innate memory is based on epigenetic reprogramming which is broadly defined as sustained change in transcription programs and cell physiology (5, 7). Induction of innate memory is thus accompanied by significant changes in cellular metabolism. When inappropriately activated, innate memory programs can become maladaptive as in post-sepsis immune paralysis, which is associated with severe energy metabolism defects of leukocytes (8). Molecular mechanism that mediate innate memory at the level of cell types and the immunological metabolic and epigenetic processes behind are therefore an important area of research. By suppressing innate as well as adaptive immune responses, MDSCs have protective roles in the initial hyper-inflammatory reaction, however, are also involved in sepsis-induced innate immunoparalysis (3, 4, 9–11). We would therefore specify MDSCs as central player in innate memory. However, there still remain open questions about, how expansion and functions of MDSCs are regulated in sepsis and how metabolic dysregulations of MDSCs affect innate immunity in sepsis.
Cellular metabolism and oxidative stress are intimately linked, immune cells are constantly confronted with intracellular and extracellular reactive oxygen species (ROS) molecules in steady state and moreover in inflammatory conditions. During sepsis, enhanced levels of ROS molecules, either produced by NADPH oxidases during oxidative bursts or by mitochondrial dysfunction, lead to oxidative stress conditions (12). Interestingly immune cell types vary with regard to their ROS susceptibility and although ROS are toxic to most cells, MDSC survive despite their elevated content and release of ROS (13). Moreover, high numbers of MDSCs arise in oxidative stress prone conditions such as inflammation, infection, and cancer.
This prompted us to analyze ROS-mediated signaling pathways in myeloid cells in steady state and sepsis. We hereby identified Nuclear factor (erythroid-derived 2)-like 2 (Nrf2), the transcriptional regulator of the antioxidant stress defense, as key regulator of metabolic reprogramming of MDSCs.
Materials and Methods
Mice Strains
Experiments were performed with age-matched WT, Keapfl/fl, VAVcreKeapfl/fl, and Nrf2−/− mice (all C57BL/6). VAVcreKeapfl/fl mice were generated by crossing Keap1-flox mice (14) with VAVcre mice. VAVcre−Keapfl/fl mice were used as controls (denoted as Keapfl/fl). Nrf2−/− mice have been described previously (15) and were bred in our animal facility and kept under standardized conditions, as were the OT-II mice, CD45.1 congenic mice (C57BL/6), and RAG−/− mice used.
LPS Treatment
8- to 10-week-old mice with at least 25 g were used for this study. Treatments were conducted with either vehicle + lethal dose 5 mg/kg BW LPS (sepsis group) or low dose + lethal doses 30 mg/kg BW LPS (tolerance group) in 250 µl 0.9% NaCl i.p. All animals were monitored thrice per day in 6 h intervals to document weight and body temperature.
Rapamycin was first solved in ethanol and then diluted in 5.2% PEG/Tween in NaCl. Mice received either vehicle (5.2% PEG/Tween) or 2 mg/kg of body weight rapamycin by daily i.p. injections.
Transfer Colitis
To induce transfer colitis, RAG2−/− mice were adoptively transferred with either 2 × 10⁶ CD4+CD25− T cells alone, with 2 × 10⁶ CD11b+Gr-1+ cells alone or with both 2 × 10⁶ CD4+ T cells and 2 × 10⁶ CD11b+Gr1+ cells. After 6 weeks, the mice were sacrificed. Spleens and mesenterial lymph nodes (mLNs) were harvested for further analysis. One part of the colon was fixed in formalin for histological scoring and the other part was fixed in RNAlater (Qiagen, Germany) for subsequent mRNA analysis.
Histological Scoring
4 µm paraffin sections from the fixed colon were cut serially, mounted onto glass slides, and deparaffinized. The colon sections were stained with hematoxylin and eosin by the Core Facility (IZKF) of the RWTH Aachen University. Blinded histological scoring was performed using a standard microscope, based on The Jackson Laboratory Score method as described previously (16, 17). Each colon section was scored for the four general criteria: severity, degree of hyperplasia, degree of ulceration, if present, and percentage of area involved. A subjective range of 1–3 (1 = mild, 2 = moderate, 3 = severe) was used for the first three categories. Severity: focally small or widely separated multifocal areas of inflammation limited to the lamina propria were graded as mild lesions (1). Multifocal or locally extensive areas of inflammation extending to the submucosa were graded as moderate lesions (2). If the inflammation extended to all layers of the intestinal wall or the entire intestinal epithelium was destroyed, lesions were graded as severe (3). Hyperplasia: mild hyperplasia consisted of morphologically normal lining epithelium that was at least twice as thick (length of crypts) as adjacent or control mucosa. Moderate hyperplasia was characterized by the lining epithelium being two or three times normal thickness, cells were hyperchromatic, numbers of goblet cells were decreased, and scattered individual crypts developed an arborizing pattern. Severe hyperplastic regions exhibited markedly thickened epithelium (four or more times normal thickness), marked hyperchromasia of cells, few to no goblet cells, a high mitotic index of cells within the crypts, and numerous crypts with arborizing pattern. Ulceration was graded as: 0 = no ulcer, 1 = 1–2 ulcers (involving up to a total of 20 crypts), 2 = 1–4 ulcers (involving a total of 20–40 crypts), and 3 = any ulcers exceeding the former in size. A 10% scale was used to estimate the area involved in the inflammatory process (0 = 0%, 1 = 10–30%, 2 = 40–70%, 3 = >70%).
BrdU Assay
Mice were fed orally with 0.8 mg/ml BrdU (BD) in drinking water. Drinking water was changed every 2 days. After 14 days mice were sacrificed, spleens and BMDCs were harvested, and BrdU incorporation was assessed by flow cytometry according to the manufacturer’s instructions (BrdU Flow, Kit, BD).
Mixed Bone Marrow Chimeras
BM cells were isolated from femurs and tibias of age-matched donor animals (WT CD45.1 and VAVcreKeapfl/fl CD45.2). RAG2−/− mice were lethally irradiated (2 Gy × 6.8 Gy) and co-injected with 5 × 10⁶ cells of each genotype after irradiation, or injected with 10 × 106 cells of only one genotype (WT CD45.1 or VAVcreKeapfl/fl CD45.2 cells). The mice received antibiotic treatment for 14 days [40 µl Borgal-solution (24%)/100 ml drinking water]. Eight weeks later, the mice were sacrificed and spleens analyzed by flow cytometry.
Cell Isolation
Mouse BM cells were flushed from femurs and tibias with Dulbecco medium. Erythrocytes were lysed with lysis buffer (eBioscience) for 3 min at room temperature, and the remaining cells were washed once with PBS. Single cell suspensions were isolated from spleens and erythrocytes were lysed with lysis buffer. MDSCs were isolated from splenocytes by magnetic cell separation (Miltenyi, Germany). Flow cytometric analysis revealed high purity (90%) of isolated CD11b+Gr-1+ cells. CD4+ cells were isolated by magnetic cell separation using the CD4+ T cell isolation kit (Miltenyi), while CD4+CD25+ Treg cell isolation kits (Miltenyi) were used to isolate CD4+CD25− cells and perform adoptive transfer colitis.
Flow Cytometry
For surface staining, single cell suspensions were stained with anti-CD11b, anti-Gr-1, anti-CD4, anti-CD3, anti-CD8, anti-CD25, anti-CD19, anti-CD11c, anti-F4/80, anti-CD45.1, and anti-CD45.2 (all from eBioscience, Germany). To analyze Foxp3, pS6, p4EBP-1, Nos2, p-mTOR, and arginase expression, cells were fixed and permeabilized with a FOXP3 staining buffer set (eBioscience, Germany) following the manufacturer’s instructions and stained with anti-Foxp3 antibodies (eBioscience, Germany), anti pS6, p4EBP-1 (BD Biosciences), anti-p-mTOR (ebioscience, Germany), anti-arginase and sheep-IgG (both R&D), or anti-NOS2 and mouse-IgG2a (both eBiosience) antibodies for 30 min. To analyze mitochondrial mass by flow cytometry, cells were incubated with 25 ng/ml nonyl acridine orange (Thermo Fischer Scientific) for 10 min at 37°C and maintained on ice until flow cytometric analysis. Glucose uptake was determined by means of a glucose uptake cell-based kit (Cayman Chemical). 2 × 10⁶ cells/ml were incubated in glucose-free medium for 2 h. Afterwards 100 µg/ml 2-NBDG was added and incubation continued in a cell incubator at 37°C. Incubation was stopped by immediate transfer of cell culture plates to 4°C conditions. Cells were washed with a cell-based assay buffer according to the manufacturer’s instructions and kept at 4°C until flow cytometric analysis. A total reactive oxygen species assay kit (eBioscience) was used to identify ROS, following the manufacturer’s instructions. In detail, this involved incubation of the cells with ROS assay stain for 60 min at 37°C, washing once with PBS and analysis on the flow cytometer. To identify apoptotic cells, cells were first labeled with cell viability dye (eBioscience) and then incubated with fluorochrome conjugated Annexin-V (eBioscience) in Annexin-V binding buffer according to the manufacturer’s instructions. BrdU staining was performed according to the manufacturer’s protocol with BrdU Flow Kit (BD Pharmingen). 7-AAD staining was performed by adding 7-AAD (BD Pharmingen) directly to the cells before measurement.
Flow cytometry was carried out using FACSCanto II device (BD Biosciences, Germany). Data analysis was performed using FCS Express Software.
RNA Isolation and Real-Time PCR
Total RNA from isolated MDSCs and colon tissue was isolated using the RNeasy Mini Kit (Qiagen, Germany). cDNA was then generated from 200 ng total RNA using the RevertAid H Minus First Strand cDNA Synthesis Kit (Thermo Fisher Scientific, USA) according to the manufacturer’s instructions. RT-PCR was performed using the SYBR Green PCR kit (Eurogentec, Germany) and data were acquired with the ABI prism 7300 RT-PCR system (Applied Biosystems/Life Technologies, Germany). Each measurement was set up in duplicate. After normalization to the endogenous reference control gene β-actin for mice, the relative expression was calculated. The sequences of primers used in this study are listed in Table S1 in Supplementary Material.
Seahorse Assay
2 × 10⁵ cells were seeded on gelatin-coated plates and OCR/ECAR measured using the XF96 Extracellular Flux Analyzer (Seahorse Bioscience) following the manufacturer’s instructions. OCR was measured in XF media containing 11 mmol/l glucose and 1 mmol/l sodium pyruvate under basal conditions and in response to 1 µmol/l oligomycin, 1 µmol/l carbonyl cyanide p-trifluoromethoxyphenylhydrazone (FCCP), and 0.1 µmol/l rotenone plus 0.1 µmol/l antimycin A. Extracellular acidification rate (ECAR) was measured in assay medium (XF Media supplemented with 4.5 g/l glucose and 2 mM glutamine) under basal conditions and in response to 10 mM glucose, 1 M oligomycin, and 100 mM 2-deoxyglucose.
In Vitro MDSC Generation
2 × 10⁶ murine bone marrow cells per ml were cultured in RPMI with 2 g/l glucose supplemented with 10% heat-inactivated FCS (Life Technologies). In some experiments, glucose concentrations were adapted as indicated. To obtain BM-derived MDSCs, medium was supplemented with IL-6 (10 ng/ml) and GM-CSF (20 ng/ml) (both Peprotech). On day 3 of culture, the original medium was replaced with fresh medium containing cytokines and cultures were maintained at 37°C in 5% CO2-humidified atmosphere for an additional 3 days. To analyze effects of rapamycin, 1 µM rapamycin (Cayman Chemical) were added at day 0 and 3.
To analyze dimethyl fumarate (DMF) effects on human cells, 2 × 10⁶ human PBMCs per ml were cultured in RPMI in the presence or absence of 2 µg/ml DMF.
Suppression Assays
DCs were generated by culturing BM cells in the presence of GM-CSF (50 ng/ml) and IL-4 (40 ng/ml) for 6 days. Cells were fed with OVA peptide (1 µM) for 2 h and extensively washed with PBS. CD4+ OT-II cells were isolated by magnetic cell separation and labeled with cell proliferation dye (5 µM) (eBioscience) according to the manufacturer’s instructions. DCs and CD4+ T cells were co-cultured in a 1:10 ratio in U-bottom 96-well plates. MDSCs were isolated by magnetic cell isolation and were added to DC/T cell cultures in ratios of 1:1 or 1:0.5. After 3 days, proliferation of CD4 T cells was assessed by flow cytometry.
RNA Extraction and Microarray for Gene Expression Analysis
Genome wide transcriptome analyses for VAVcreKeapfl/fl and WT (VAVcre−Keapfl/fl) MDSCs were performed in independent triplicates using Gene Chip® Mouse Gene 2.0 arrays (Affymetrix, Santa Clara, CA, USA). Total RNA extraction was carried out using the RNeasy Micro Kit (Qiagen, Germany) according to the manufacturer’s protocol and then quantified (Nanodrop). RNA quality was assessed using the RNA 6000 Nano Assay with the 2100 Bioanalyzer (Agilent, Santa Clara, CA, USA). Samples for the Gene 2.0 arrays were prepared and hybridized to the arrays according to the Affymetrix WT Plus Kit manual. Briefly, for each sample, 100 ng of total RNA was reversed transcribed into cDNA using a random hexamer oligonucleotide tagged with a T7 promoter sequence. After second strand synthesis, double strand cDNA was used as a template for amplification with T7 RNA polymerase to obtain antisense cRNA. Random hexamers and dNTPs spiked out with dUTP were then used to reverse transcribe the cRNA into single stranded sense strand cDNA. The cDNA was then fragmented with uracil DNA glycosylase and apurinic/apyrimidic endonuclease 1. Fragment size was checked using the 2100 Bioanalyzer and ranged from 50 to 200 bp. Fragmented sense cDNA was biotin-endlabeled with TdT and probes were hybridized to the Gene 2.0 arrays at 45°C for 16 h with 60 rpm. Hybridized arrays were washed and stained on a Fluidics Station 450 (program: FS450 0002) and scanned on a GeneChip® Scanner 3000 7 G (both Affymetrix). Raw image data were analyzed with Affymetrix® Expression Console™ Software (Affymetrix, USA), and gene expression intensities were normalized and summarized with a robust multiarray average algorithm (18). Transcripts that were expressed differently more than 1.5-fold with a raw p-value lower than 0.05 between the sample groups were categorized as regulated. Enrichment analysis for Wiki pathways was performed using WebGestalt (19). For the enrichment analysis, only genes changed at least 1.5-fold with a p-value lower than 0.05 between VAVcreKeapfl/fl and WT (VAVcre−Keapfl/fl) samples were taken into consideration.
Statistical Analysis
All data are presented as mean ± SEM or SD if indicated. Differences between two groups were evaluated using two-tailed, unpaired or paired (if indicated) Student’s t-test. All statistical analysis and subsequent graphics generation were performed using GraphPad Prism version 7.0 (GraphPad Software, USA). A p-value <0.05 was considered to be statistically significant.
Study Approval
The study was approved by the regional government authorities and animal procedures were performed according to German legislation for animal protection. Permission for the projects was granted by the Regierungspräsident/LANUV Nordrhein-Westfalen.
Results
VAVcreKeapfl/fl Mice Develop Splenomegaly Due to an Accumulation of CD11b+Gr-1+ Cells
To analyze oxidative stress signaling in immune cells, we generated a mouse with constitutive Nrf2 activation in all hematopoietic cells by breeding Kelch ECH associating protein 1 (Keap1)-flox mice with VAV-CRE recombinase mice (VavcreKeapfl/fl). Keap1 suppresses Nrf2 transcriptional activity under basal conditions, thus deletion of Keap1 results in constitutive nuclear accumulation and activation of Nrf2 (20). VavcreKeapfl/fl mice are born at expected Mendelian ratios, are healthy and cancer-free, and have a normal life span. However, on aging, VavcreKeapfl/fl mice develop splenomegaly (Figures 1A,B) due to an increase in cell size (Figure S1A in Supplementary Material). Flow cytometric analysis of immune cells in the spleens revealed a specific enrichment of two immunosuppressive cell subsets, namely regulatory T (Treg) and CD11b+Gr-1+ cells (Figures 1C,D). While absolute numbers (Figure S1B in Supplementary Material) and frequencies (Figure 1D) of B cells (CD19+), DCs (CD11c+), macrophages (CD11b+F4/80+) and T cells (CD3+), as well as cytotoxic T cells (CD3+CD8+) and T helper cells (CD3+CD4+) were not raised in VAVcreKeapfl/fl mice compared to Keapfl/fl mice, frequencies and numbers of CD3+CD4+CD25+Foxp3+ as well as CD11b+Gr-1+ cells were altered significantly. CD11b+Gr-1+ cells are already expanded in spleens of younger mice but their numbers increased progressively with age (Figure 1E) in correlation with spleen weight (Figure 1B). The dominant cell type among CD11b+ cells of VAVcreKeapfl/fl mice were Ly6G+ PMN-MDSCs, and levels of these were significantly enhanced (Figure 1F). It has been shown before that Keapfl/fl mice already reveal reduced expression of Keap1 protein in various tissues compared to WT mice (21), we therefore additionally compared numbers of CD11b+Gr-1+ cells in B6-WT and Keapfl/fl mice, however, numbers of MDSC were not altered in these groups (Figure S1C in Supplementary Material) and we concluded from this that Keapfl/fl and WT controls are comparably fitting controls in our experiments. NAD(P)H quinine oxidoreductase (Nqo-1), which is one of the most specific Nrf2 targets, was strongly enhanced in VAVcreKeapfl/fl CD11b+Gr-1+ cells compared to Keapfl/fl cells, while CD11b+Gr-1+ cells from Nrf2−/− mice exhibited reduced Nqo-1 expression (Figure S1D in Supplementary Material), which shows that Nrf2 is hyperactivated in VAVcreKeapfl/fl compared to Keapfl/fl cells. CD11b+Gr-1+ cells in BM are IMCs, which differentiate into mature granulocytes, macrophages, or DCs in healthy individuals. However, proliferation of IMCs and blockade of their differentiation can result in the accumulation of MDSCs in lymphoid organs. In most cases, accumulation of MDSCs is caused by pathogenic conditions such as cancer, inflammation, and autoimmunity (1). We therefore wanted to find out whether the observed expansion of CD11b+Gr-1+ cells is a secondary effect or whether it is indeed regulated by cell autonomous Nrf2/Keap1 signaling in these cells. To answer this question, we performed in vitro MDSC generation assays with BM-derived cells from Keapfl/fl, Nrf2−/−, and VAVcreKeapfl/fl mice. Culturing of BM cells from naive mice with GM-CSF and IL-6 has previously been shown to lead to an enrichment of suppressive Gr-1+CD11b+ cells (22, 23). Interestingly, Nrf2-deficient BM-derived cells exhibited a quite low expression of Gr-1 and CD11b in comparison to Keapfl/fl BM-derived cells, whereas VAVcreKeapfl/fl cells showed the highest capacity to acquire a CD11b+Gr-1+ phenotype (Figure 1G). To further confirm that Nrf2/Keap1 signaling directly induces CD11b+Gr-1+ cells, we generated mixed BM chimeras. To this end, we transferred equal numbers of CD45.1 WT and CD45.2 VAVcreKeapfl/fl BM cells into lethally irradiated Rag−/− mice, which led to complete reconstitution of the hematopoietic system within 8 weeks. As expected, numbers of splenic CD11b+Gr-1+ CD45.1+ (WT derived) cells were lower than numbers of splenic CD45.2+ (Keap−/− derived) cells in the recipient mice (Figures 1H,I).
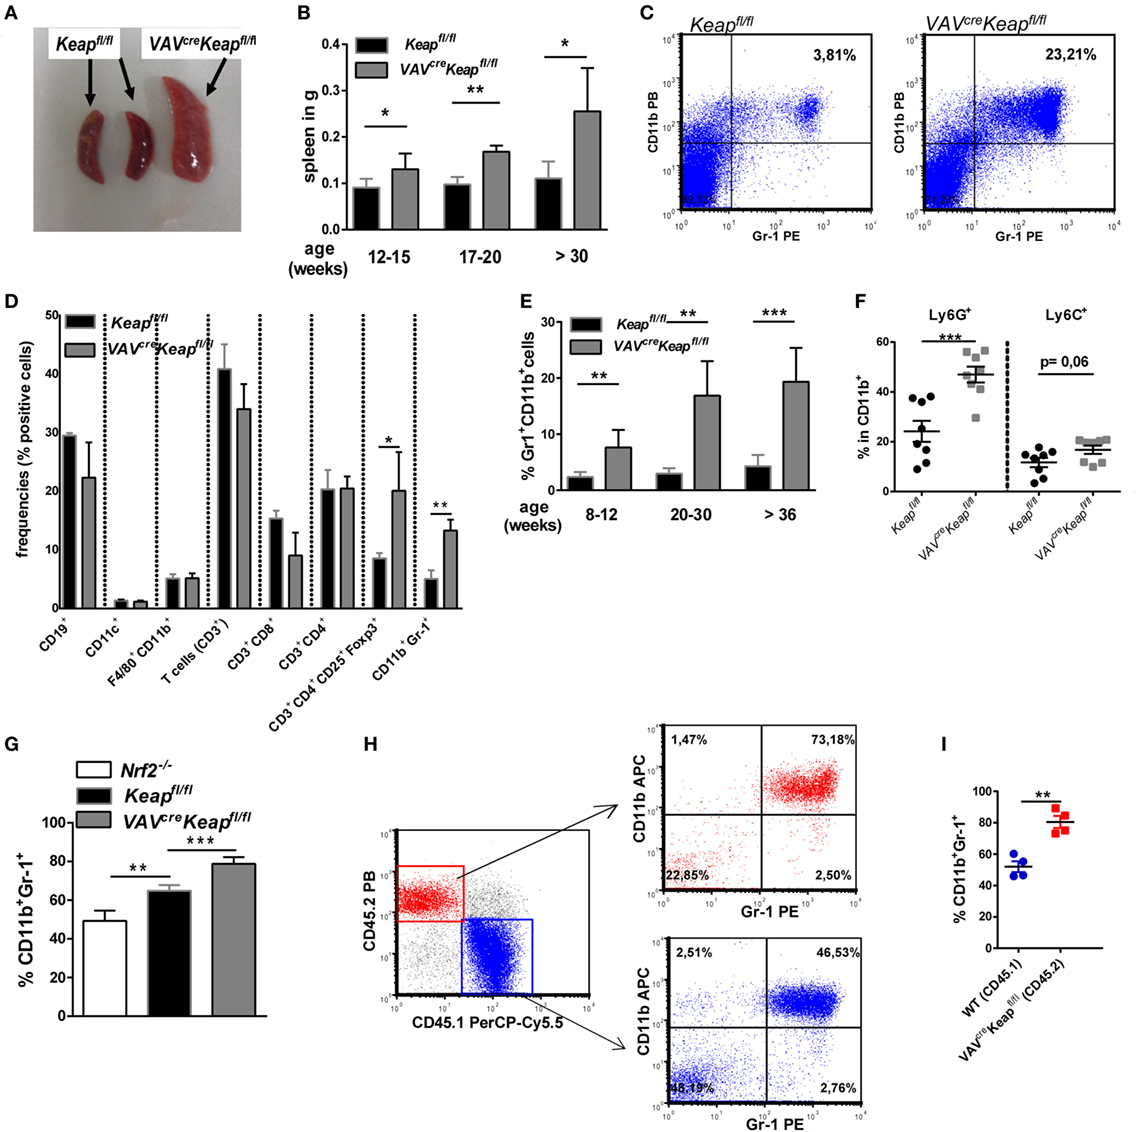
Figure 1. Nrf2 activation enhances CD11b+ Gr-1+ cells. (A) Spleens from old (50–52 weeks) Keapfl/fl and VAVcreKeapfl/fl mice. (B) Weight of spleens from Keapfl/fl and VAVcreKeapfl/fl mice at different ages. Bars indicate mean ± SD of at least three mice per group. (C) Representative dot plot depicting frequencies of CD11b+Gr-1+ cells in spleens from old (50–52 weeks) Keapfl/fl and VAVcreKeapfl/fl mice. (D) Frequencies of immune cell populations in spleens from 16-week-old Keapfl/fl and VAVcreKeapfl/fl mice. Bars indicate mean ± SEM of three mice per group. (E) Frequencies of CD11b+ Gr-1+ cells in spleens from Keapfl/fl and VAVcreKeapfl/fl mice at different ages. Bars indicate mean ± SD of at least six mice per group. (F) Frequencies of Ly6G+ and Ly6C+ cells within splenic CD11b+ cells from Keapfl/fl and VAVcreKeapfl/fl mice. (G) BM-derived cells were incubated with GM-CSF and IL-6 and frequencies of CD11b+Gr-1+ cells were assessed by flow cytometry. Bars indicate mean ± SD of at least three mice per group. (H) Mixed BM chimeric mice were analyzed 8 weeks after transfer of CD45.1 WT and CD45.2 VAVcreKeapfl/fl BM cells into lethally irradiated RAG2−/− recipient mice. WT mice were used, since Keapfl/fl CD45.1 mice were not available. Representative dot plots of splenic CD45.2+ Gr-1+CD11b+ and CD45.1+ Gr-1+CD11b+ cells are shown. (I) Percentages of splenic CD11b+Gr-1+ cells of CD45.1 and CD45.2 origin in bone marrow chimeras. For (F,I), each symbol indicates an individual mouse. Horizontal lines represent the mean; error bars represent SEM. Two-tailed unpaired t-tests were used to determine p-values for all statistical analysis.
Nrf2 Activation in Myeloid Cells Results in Cells Which Display MDSC Characteristics
Expression of Gr-1 and CD11b are known characteristics of MDSCs. However, these markers are expressed by a quite heterogeneous cell population and additional attributes are required to define cells as MDSCs. These include the expression of immune suppressive factors such as arginase (encoded by ARG1), inducible nitric oxide synthase (also known as Nos2) an increase in the production of ROS. Interestingly, VAVcreKeapfl/fl CD11b+ Gr-1+ cells showed all the characteristic hallmarks of MDSCs such as production of arginase (Figure 2A; Figure S2A in Supplementary Material) and Nos2 (Figures 2B,C). ROS production was lower in VAVcreKeapfl/fl CD11b+ Gr-1+ cells than in Keapfl/fl cells (Figures 2D,E). This may be explained by a high activity of the anti-oxidative machinery in VAVcreKeapfl/fl cells, leading to a rapid scavenging of produced ROS molecules in these cells. Interestingly, most notably VAVcreKeapfl/fl Ly6G+ CD11b+ cells revealed a reduction of ROS molecules (Figure S2B in Supplementary Material). In addition, such as WT CD11b+Gr-1+ cells, VAVcreKeapfl/fl CD11b+Gr-1+ cells showed a lower expression of maturation and differentiation markers like CD11c, CD80, CD86, and MHC-II compared to CD11b+Gr-1− cells (Figure S2C in Supplementary Material). With regard to inflammatory cytokines, IL-6 was not detectable and levels of IL-1 and IL-12 were markedly reduced in VAVcreKeapfl/fl compared to Keapfl/fl CD11b+Gr-1+ cells (Figure 2F). Furthermore, inhibition of T cells by means of T cell suppression assays is the “gold” standard for evaluation of MDSC function (2). Addition of Keapfl/fl and VAVcreKeapfl/fl CD11b+Gr-1+ cells to antigen-specific stimulated T cells reduced percentages of proliferated cells (Figures 2G,H), diminished absolute numbers of T cells (Figure 2I), and enhanced percentages of dead T cells (Figure 2J). Furthermore, VAVcreKeapfl/fl CD11b+Gr-1+ suppressed T cell mediated transfer colitis (Figure 2K). While RAG-deficient (RAG2−/−) recipients of CD4+ T cells suffered from severe colitis with weight loss and high-grade intestinal inflammation (Figure 2K; Figures S3A,B,C in Supplementary Material), co-transfer of Keap-deficient CD11b+Gr-1+ cells markedly reduced loss of weight and intestinal inflammation (Figure 2K; Figures S3B,C in Supplementary Material). Absolute numbers of CD3+CD4+ cells in spleens and mLNs were reduced as well (Figure 2L). Furthermore, Treg cells numbers increased (Figure S3D in Supplementary Material) while levels of inflammatory cytokines in the gut were markedly reduced in RAG2−/− mice transferred with MDSCs in addition to CD4+ T cells (Figure S3E in Supplementary Material).
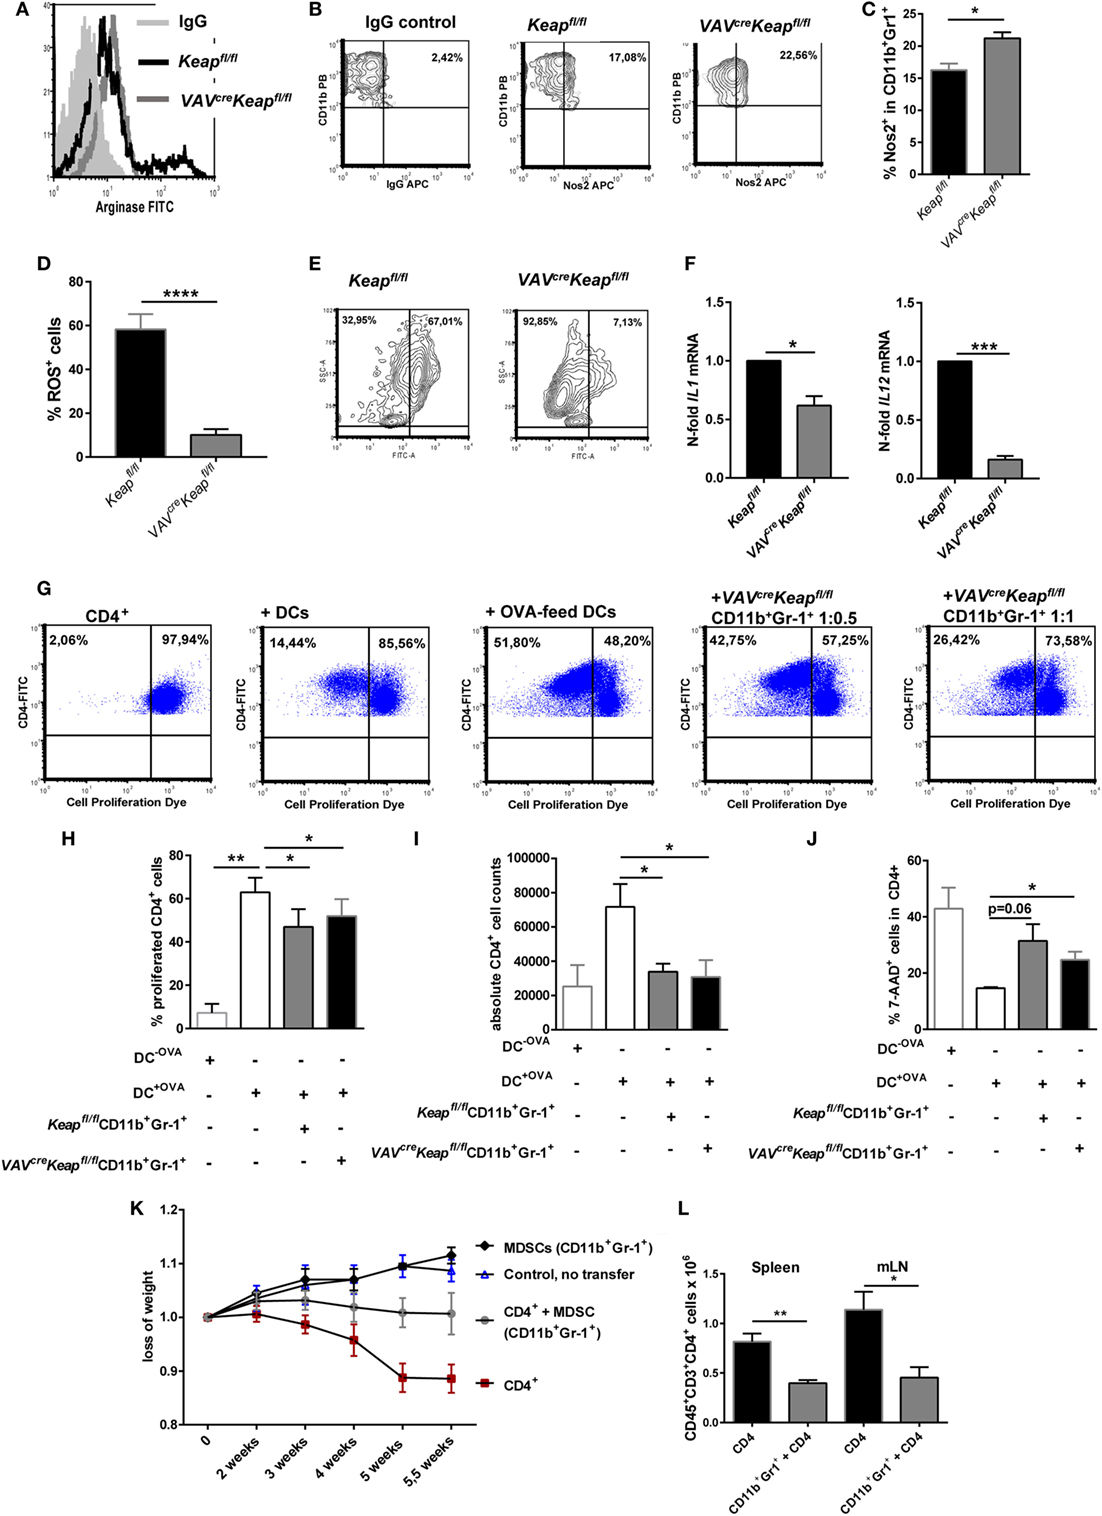
Figure 2. CD11b+Gr-1+ cells from VAVcreKeapfl/fl reveal characteristics of myeloid-derived suppressor cells (MDSCs). (A) Representative arginase-histogram showing overlays of pre-gated CD11b+Gr-1+ cells in spleens from Keapfl/fl (black), VAVcreKeapfl/fl mice (gray), and an appropriate isotype control. (B) Flow cytometric analysis of Nos2 expression in pre-gated CD11b+Gr-1+ cells from spleens. Representative contour plots showing isotype control (left) and Nos2 expression from Keapfl/fl (middle) and VAVcreKeapfl/fl mice (right). (C) Statistical analysis of Nos2-positive cells in pre-gated CD11b+Gr-1+ Keapfl/fl (n = 3) and VAVcreKeapfl/fl (n = 3) mice, two-tailed unpaired t-test. Bars indicate mean and error bars SEM of three mice per group. (D) Statistical analysis of ROS+ cells in pre-gated CD11b+Gr-1+ from Keapfl/fl (n = 6) and VAVcreKeapfl/fl (n = 8) mice, two-tailed unpaired t-test. (E) Representative contour plots showing reactive oxygen species (ROS) positive cells pre-gated on CD11b+Gr-1+ cells cultured at 37°C for 1 h. (F) N-fold mRNA expression of cytokines in MACS isolated Keapfl/fl and VAVcreKeapfl/fl CD11b+Gr-1+ (n = 4) cells analyzed by RT-qPCR. Bars indicate mean and error bars SEM, two-tailed one sample test. (G–J) OT-II CD4+ T cells were labeled with the cell proliferation dye eFluor 660 and cultured alone, in the presence of DCs, or in the presence of OVA-fed DCs, or co-cultured with OVA-fed DCs or different ratios of Gr1+CD11b+ cells from VAVcreKeapfl/fl mice. (G) After 3 days of culture, T cell proliferation was measured by loss of eFluor fluorescence on flow cytometry. (H) Statistical analysis of cell proliferation, as assessed by percentages of proliferated cells. Bars indicate the mean of three independent experiments and error bars SEM (two-tailed, paired t-test). (I) Statistical analysis of absolute CD4+ cells after 3 days of culture. (J) Statistical analysis of dead CD4+ T cells, as determined by incorporation of 7-AAD, two-tailed unpaired t-test. Bars indicate the mean of three independently performed experiments and error bars SEM. (K) CD4+CD25− transfer colitis: body weight as a percent of starting weight of control mice (n = 4, blue symbols), MDSC recipient control mice (n = 2, black), CD4+CD25− recipient mice (n = 8, red), and CD4+CD25− + MDSCs recipient mice (gray, n = 7) over the course of 5.5 weeks. (L) Statistical analysis of frequencies of CD4+ T cells in spleen and mesenterial lymph nodes (mLNs).
We conclude from these experiments that CD11b+Gr-1+ VAVcreKeapfl/fl cells show all hallmarks and functional properties of MDSCs, such as production of arginase and Nos2 but low expression of maturation and differentiation markers and inflammatory cytokines and a high ability to suppress T cell proliferation in vitro and in vivo.
Metabolic Pathways and Cell Cycle Pathways Are Enriched in MDSC With Constitutive Nrf2 Activation
Next, to investigate how Nrf2/Keap1 signaling induces expansion of MDSCs, we performed whole transcriptome analysis in MDSCs isolated from VAVcreKeapfl/fl mice and Keapfl/fl mice using Affymetrix arrays. Several genes, which belong to the oxidative stress pathway, Nrf2/Keap1 signaling pathway, and glutathione metabolism, were activated in VAVcreKeapfl/fl MDSCs and differed significantly from WT MDSCs, which confirm constitutive Nrf2 activation in these cells at a transcriptional level (Figures 3A,B). Most interestingly, in addition to this, we noticed altered expression of genes belonging to metabolic as well as cell cycle pathways (Figures 3A,B). In detail, genes of the cell cycle, the pentose phosphate pathway (PPP), and nucleotide, metabolism showed enhanced expression in VAVcreKeapfl/fl compared to WT MDSCs.
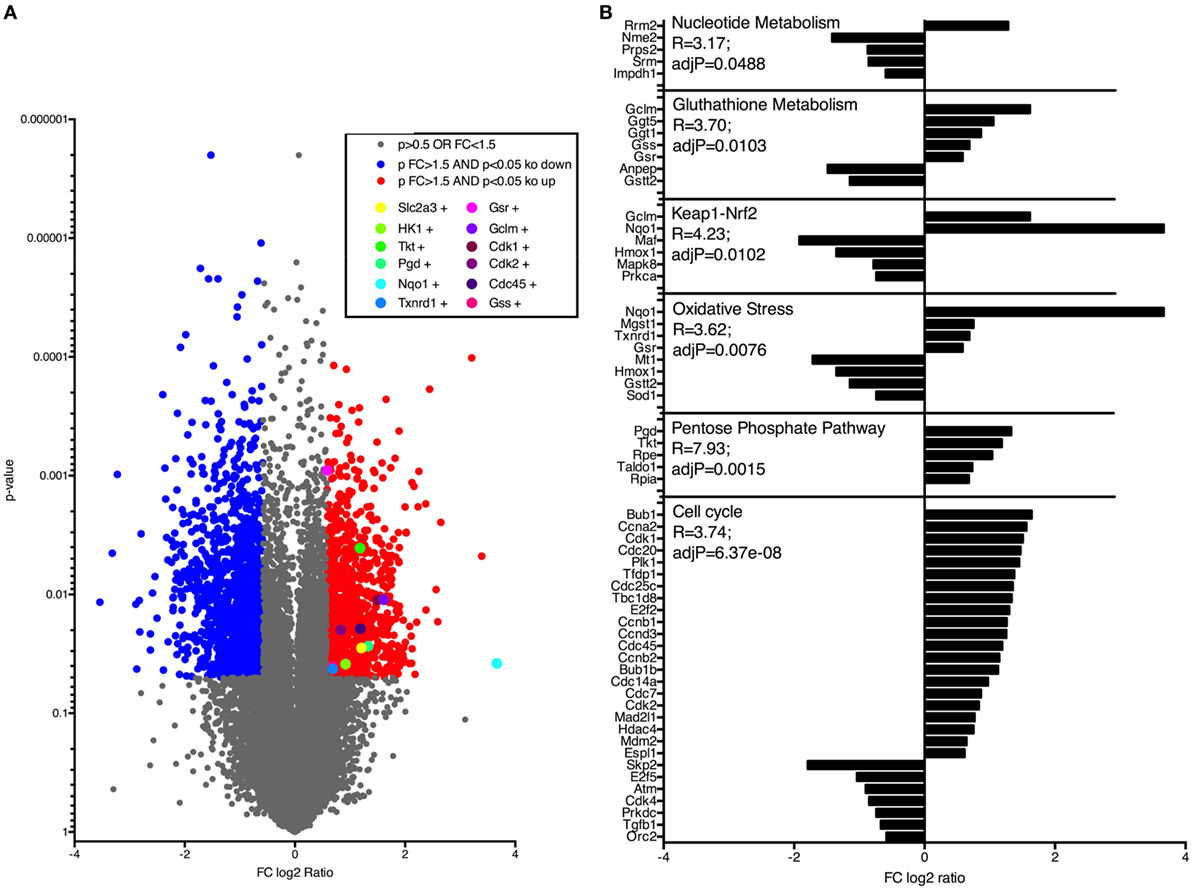
Figure 3. Nrf2 activates genes regulating cell cycle and metabolic pathways in myeloid-derived suppressor cells (MDSCs). (A) Gene expression in CD11b+Gr-1+ cells from Keapfl/fl and VAVcreKeapfl/fl mice. Colors indicate significant upregulation (of at least 1.5-fold; red) or downregulation (of at least 1.5-fold; blue). (B) Selection of pathways and associated genes which were significantly enriched.
Nrf2 Enhances Proliferation of CD11b+Gr-1+ Cells
Based on our microarray data, we hypothesized that the accumulation of MDSCs in spleen is caused by a higher proliferation rate. Analysis of Ki-67 expression in the spleen and BM cells confirmed a larger growth fraction within VAVcreKeapfl/fl CD11b+Gr-1+ cells compared to Keapfl/fl cells (Figures 4A,B). Furthermore, in vitro generated MDSCs from VAVcreKeapfl/fl mice displayed higher Ki-67 expression as well (Figure 4C). In addition, BM CD11b+Gr-1+ cells from VAVcreKeapfl/fl mice exhibited a higher BrdU incorporation than the respective CD11b+Gr-1+ cells from Keapfl/fl (Figures 4D,E) while BrdU incorporation into CD11b+Gr1+ cells from VAVcreKeapfl/fl spleens was only tendentially increased (Figure 4E). However, the rates of apoptosis, as analyzed by the frequencies of early apoptotic (AnnexinV+ cell viability dye−) and late apoptotic (AnnexinV+ cell viability dye+) MDSCs were the same in Keapfl/fl and VAVcreKeapfl/fl mice (Figure S4 in Supplementary Material). From that, we conclude that Nrf2 accelerates proliferation of MDSCs without affecting apoptosis.
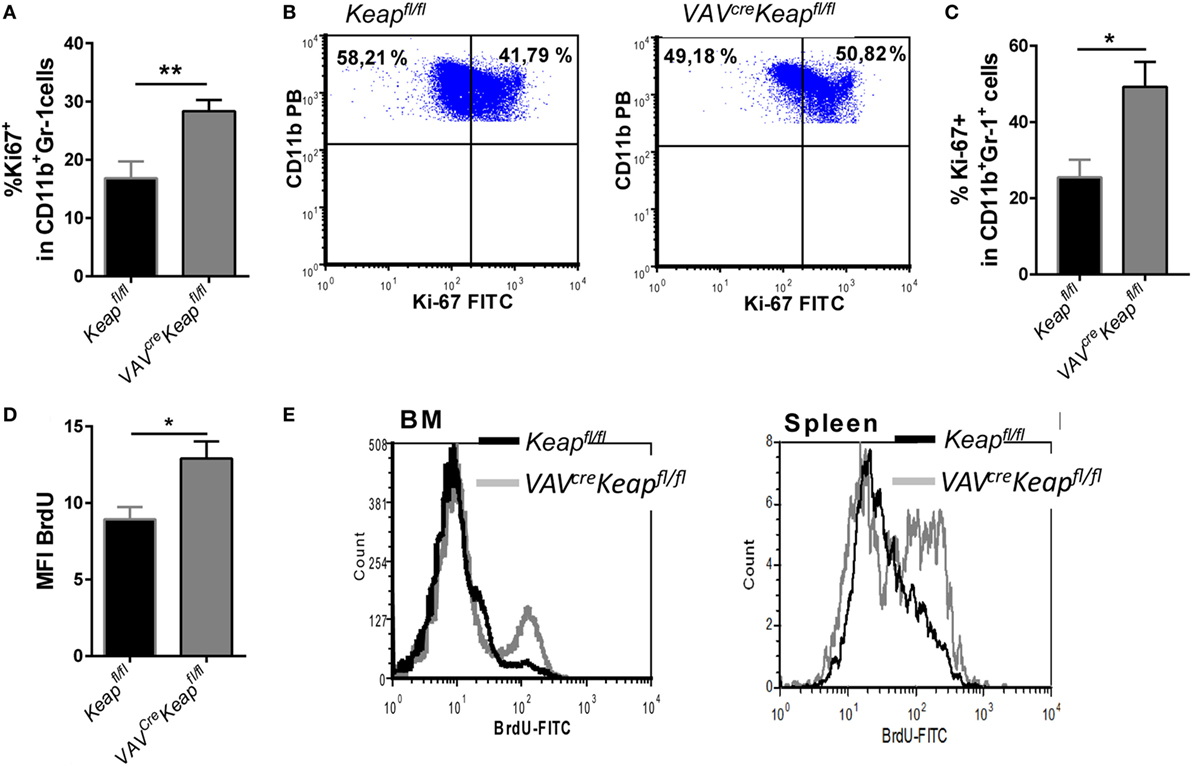
Figure 4. Nrf2 induces proliferation of myeloid-derived suppressor cells (MDSCs). (A) Statistical analysis of Ki-67 expression in pre-gated splenic CD11b+Gr-1+ Keapfl/fl (n = 5) and VAVcreKeapfl/fl (n = 5) cells. Bars indicate mean of mean fluorescence intensity and error bars SEM. (B) Representative dot plots showing Ki-67 expression in pre-gated CD11b+Gr-1+ BM-derived cells. (C) BM-derived cells were incubated with GM-CSF and IL-6 for 8 days and frequencies of Ki-67+ cells within CD11b+Gr-1+ cells were assessed by flow cytometry. Bars indicate mean ± SEM of four independently performed experiments. (D) Keapfl/fl and VAVcreKeapfl/fl mice were fed orally with BrdU for 14 days. Statistical analysis of BrdU incorporation among pre-gated CD11b+Gr-1 cells of Keapfl/fl (n = 5) and VAVcreKeapfl/fl (n = 6) mice. (E) Representative histogram shows overlays of BrdU incorporation in pre-gated CD11b+Gr-1+ cells of spleen and BM. Two-tailed unpaired t-tests were used to determine p-values for all statistical analysis.
Nrf2 Enhances Metabolic Activity of CD11b+Gr-1+Cells
The metabolic characteristics regulating MDSCs have not yet been fully elucidated and may also differ within this quite heterogeneous cell population. Tumor-infiltrating MDSCs increase fatty acid oxidation compared to splenic MDSCs (24). On the other hand, rapamycin, the specific inhibitor of mTOR, decreased M-MDSC in mice with allografts or tumors (25). A significant enrichment of genes of the PPP was observed in our microarray data, together with an enhancement of genes involved in glycolysis. RT-qPCR was used to validate upregulation of the following genes: glucose transporter 3 (Glut3, SLC2A3), the glucose receptor of white blood cells, hexokinase (Hk)1 and Hk2, enzymes responsible for committing glucose to the glycolytic pathway, 6-phosphofructo-2-kinase/fructose-2,6-biphosphatase 3 (PFKFB3) which is known as vital regulator of glycolysis and furthermore promotes cell cycle progression, glucose-6-phosphate dehydrogenase (G6pd) the rate-limiting enzyme of the PPP, phosphogluconate dehydrogenase (Pgd), the second dehydrogenase in the PPP, transketolase (Tkt), which delivers excess sugar phosphates for glycolysis in the PPP, and pyruvate kinase isozyme M2 (Pkm2), which catalyzes the last step within glycolysis (Figures 5A,B). In addition, glucose uptake, as measured by flow cytometry, was faster in VAVcreKeapfl/fl MDSCs compared to Keapfl/fl MDSCs (Figure 5C) and glucose availability was a prerequisite for generation of MDSCs in vitro (Figure 5D). MDSC generation in WT cells was enhanced by glucose in a dose-dependent manner, while VAVcreKeapfl/fl cells differentiated into MDSCs even with low amounts of glucose, which suggests a more efficient uptake and faster utilization of glucose. Nrf2-deficient cells benefit from higher glucose levels, but failed to reach the same frequencies as Keapfl/fl cells even at high glucose concentrations (Figure 5D). Moreover, rapamycin, a specific mTOR inhibitor which is known to decrease glucose uptake during MDSC differentiation in vitro and thereby inhibits MDSC differentiation in vitro (25) restores the enhanced MDSC differentiation of VAVcreKeapfl/fl BM cells to WT levels (Figures 5E,F). P-mTOR expression was enhanced in splenic VAVcreKeapfl/fl MDSCs as well (Figure 5G) and activation of mTOR signaling was reflected in the phosphorylation of S6 ribosomal protein (p-S6) (Figure 5H). In addition, mitochondrial mass was enhanced in VAVcreKeapfl/fl MDSCs (Figure 5I). Seahorse assays revealed higher maximal respiration rates (OCR) (Figures 5J,K), while extracellular acidification rates (ECAR), a measurement of lactate production, were not enhanced (Figure 5L), which in addition to the higher mitochondrial mass rates might suggests that VAVcreKeapfl/fl MDSCs use oxidative phosphorylation to generate ATP from glucose instead of glycolysis with subsequent lactate secretion. Overall, we conclude from these data that Keap1-deficient MDSCs exhibit higher uptake of abundant nutrients and a higher overall metabolic activity, which leads to an increase in metabolic pathways and pushes them into proliferative states.
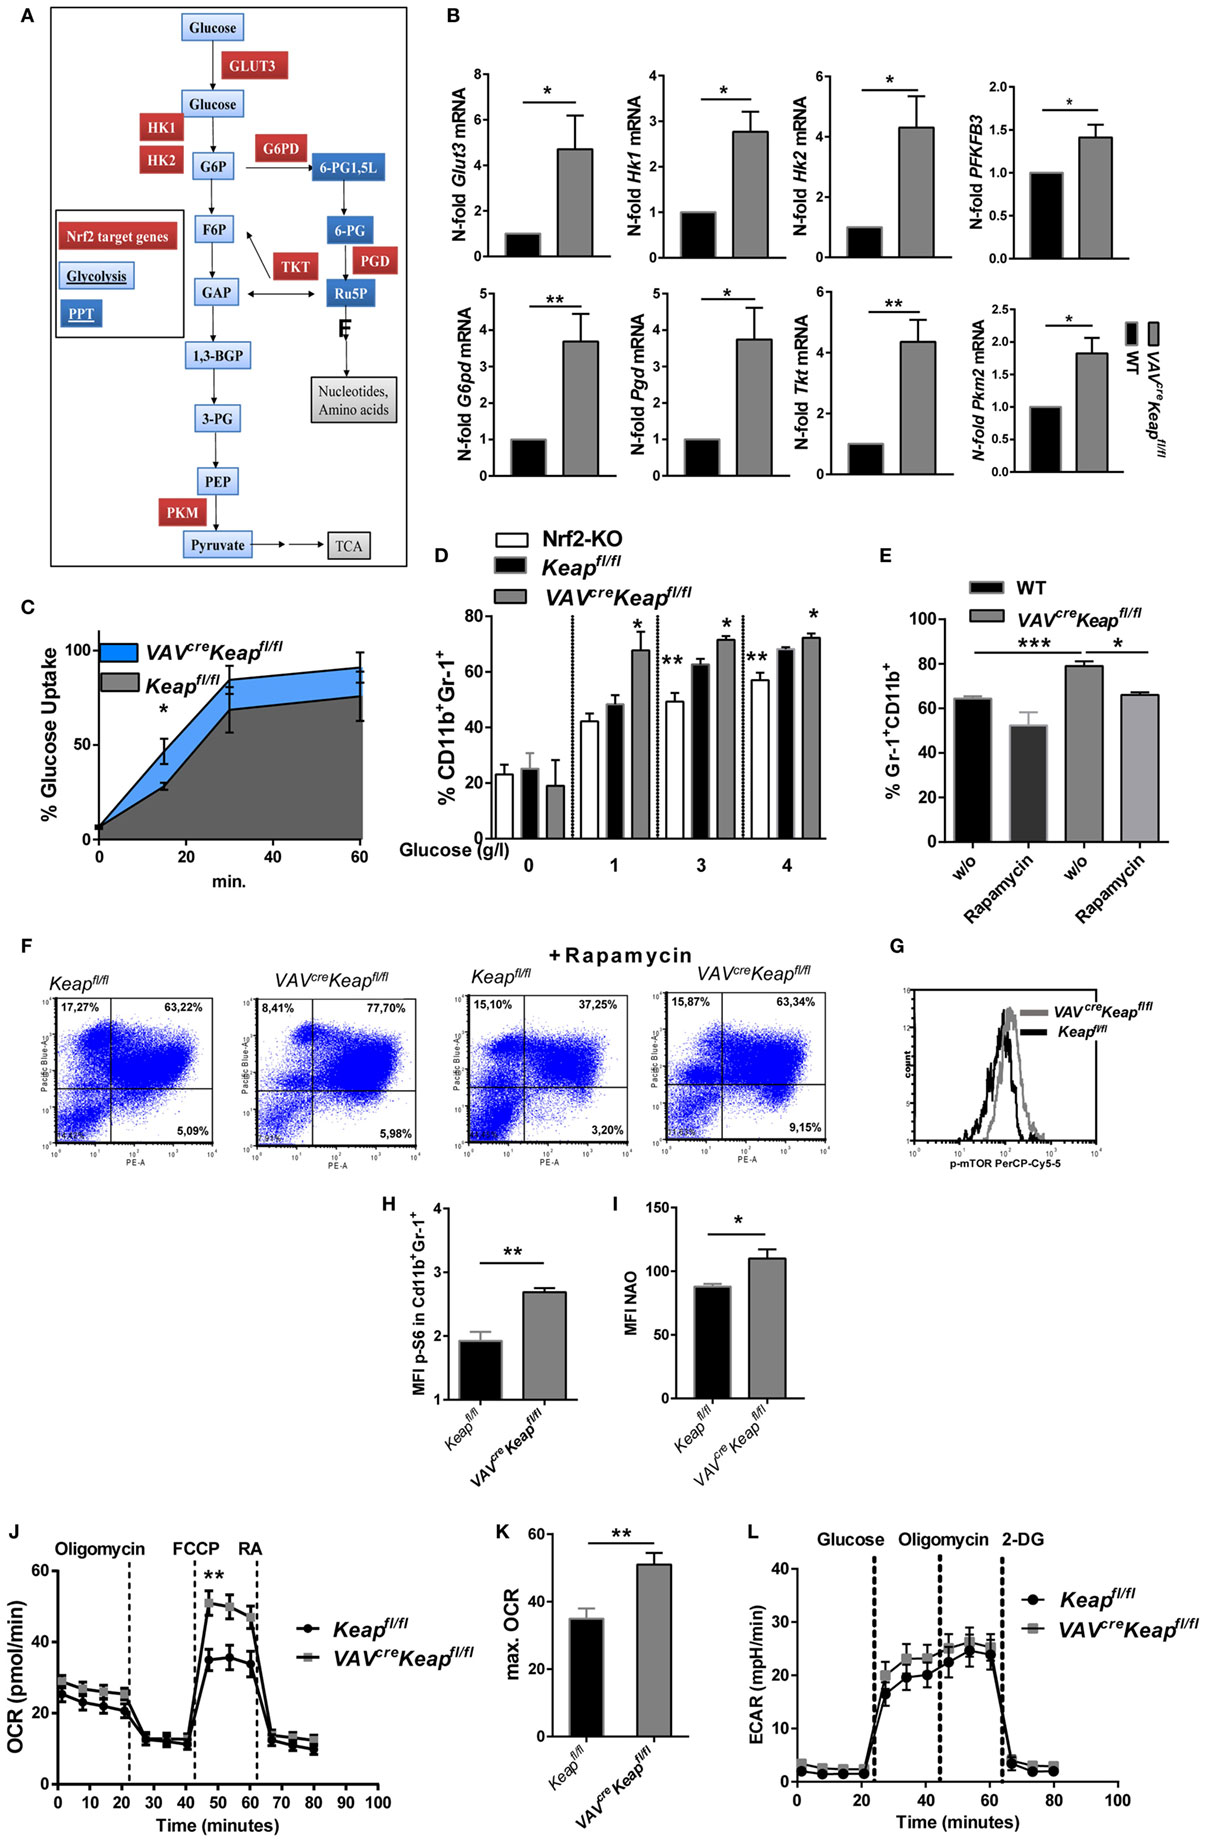
Figure 5. Nrf2 induces metabolic activity in myeloid-derived suppressor cells (MDSCs). (A) Metabolic enzymes regulated by Nrf2 in glucose metabolism in MDSCs (own microarray and RT-qPCR data). (B) N-fold mRNA expression of metabolic enzymes in MACS isolated Keapfl/fl and VAVcreKeapfl/fl CD11b+Gr-1+ (n = 7–8, PFKFB3 n = 5) cells analyzed by RT-qPCR. Bars indicate mean and error bars SEM, two-tailed one sample test. (C) 2NBD-glucose incorporation was analyzed in CD11b+Gr1+ splenocytes from Keapfl/fl (n = 3) and VAVcreKeapfl/fl (n = 4) mice at different time-points, two-tailed unpaired t-test. (D) BM-derived cells were incubated with GM-CSF and IL-6 for 8 days with different glucose concentrations, and frequencies of CD11b+Gr-1+ cells were assessed by flow cytometry. Bars indicate mean ± SEM of three independent experiments per group, two-tailed unpaired t-test. (E,F) BM-derived cells were incubated with GM-CSF and IL-6 for 8 days in the absence or presence of 1 µM rapamycin, n = 4, two-tailed unpaired t-test. (G) Representative histogram of five experiments (p = 0.0155, two-tailed paired t-test) showing p-mTOR expression in splenic CD11b+Gr-1+ cells. (H) Mean fluorescent intensity of pS6 expression in CD11b+Gr-1+ cells. (I) Statistical analysis of mitochondrial mass of Keapfl/fl (n = 4) and VAVcreKeapfl/fl (n = 4) CD11b+Gr-1+ cells evaluated by assessing NAO mean fluorescence intensity, n = 3, two-tailed unpaired t-test. (J) OCR measured under basal conditions and after addition of the indicated drugs. Points indicate mean from six Keapfl/fl (n = 6) and six VAVcreKeapfl/fl (n = 6) CD11b+Gr-1+ cells, error bars SEM. (K) Statistical analysis of max. OCR. Bars indicate mean ± SEM. (L) ECAR measured under basal conditions and after addition of the indicated drugs. Points indicate mean from six Keapfl/fl (n = 6) and six VAVcreKeapfl/fl (n = 6) CD11b+Gr-1+ cells, error bars SEM, two-tailed unpaired t-test.
Nrf2 Activation Resembles LPS-Induced MDSC Expansion
Myeloid-derived suppressor cells strongly expand under septic conditions in mice and men (3, 4). We also observed higher levels of Nrf2 protein expression in CD11b+Gr-1+ cells after treating mice with sublethal doses LPS (Figure 6A). We therefore speculated whether LPS-induced MDSCs are regulated by Nrf2 signaling and would show similarities with MDSCs of VAVcreKeapfl/fl mice. Mice were treated with sublethal doses of LPS (5 mg/kg/bw) which resulted in a significant enrichment of CD11b+Gr-1+ cells in spleens (Figure 6B). Systems biology analysis identified a high number of alike regulated genes in LPS-treated MDSCs and VAVcreKeapfl/fl MDSCs (Figure 6C), which revealed strikingly more transcriptional similarities (e.g., less differentially expressed genes) between LPS-induced MDSCs and Keapfl/fl MDSCs than between MDSCs of Keapfl/fl mice vs. Keapfl/fl mice (Figure 6C). In detail, we identified 1,798 genes showing significant expression changes (>2-fold change, p < 0.05) in LPS-treated vs. Keapfl/fl mice. By contrast, only 214 genes were differentially expressed between LPS treated and VAVcreKeapfl/fl MDSCs using the same significance criteria (Figure 6C). In addition, pathway gene set enrichment analysis revealed similar patterns in VAVcreKeapfl/fl MDSC and LPS-induced MDSCs, which included metabolic pathways like the PPP pathway, as well as nucleotide metabolism and the cell cycle pathway. The same was true for the statin pathway, complement activation and macrophage markers (Figure S5 in Supplementary Material). Consequently, LPS-induced CD11b+Gr-1+ cells revealed higher Ki-67 expression (Figure 6D) and enhanced mRNA levels of genes, which belong to the glucose and PPP pathway (Figure 6E) as well as faster glucose uptake (Figure 6F). LPS-induced CD11b+Gr-1+ cells had increased ECAR on a basal level and after addition of glucose and furthermore after addition of Oligomycin, which blocks mitochondrial ATP production and promotes maximal rates of glycolysis (Figure 6G). In addition to this, OCR was enhanced as well under basal conditions but also after addition of Oligomycin and FCCP, which uncouples oxidative phosphorylation from electron transport and allows maximal respiration (Figure 6H). While OCR was enhanced in VAVcreKeapfl/fl MDSCs as well, an enhanced ECAR seems to be more specific for LPS-induced MDSCs and might occur independently of Nrf2 signaling. To proof if inhibition of mTOR influences LPS-mediated induction of MDSC in vivo, we treated mice with sublethal doses of LPS together with rapamycin. In vivo administration of rapamycin (2 mg/kg/bw i.p. every day) significantly reduced numbers of CD11b+Gr-1+ cells in spleens of LPS-treated mice (Figure 6I). In conclusion, these data show that LPS-induced MDSCs show some similarities with Nrf2-activated MDSCs and are as well characterized by an activation of metabolic pathways and higher proliferation states.
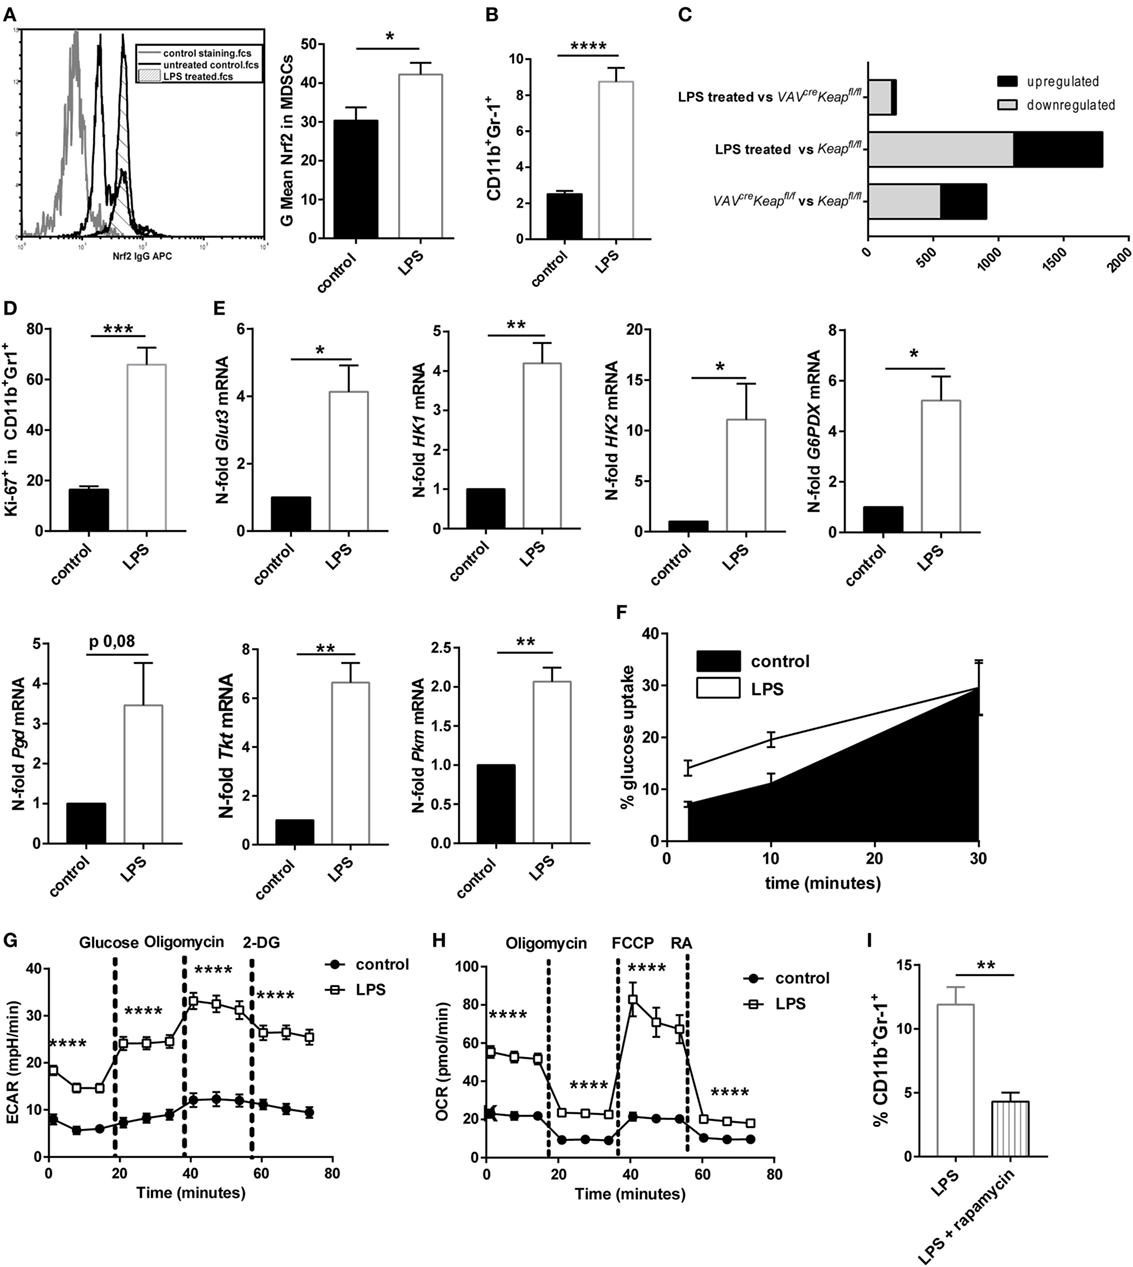
Figure 6. Nrf2 activation resembles LPS-induced myeloid-derived suppressor cell (MDSC) expansion. (A) MFI of Nrf2 expression in CD11b+Gr-1+ cells of untreated mice and mice after low-dose LPS treatment, unpaired one-tailed t-test, n = 3. Bars indicate mean ± SEM. (B) Flow cytometric analysis of CD11b+Gr-1+ cells in spleens from untreated Keapfl/fl mice and mice after LPS treatment. Bars indicate mean and error bars SEM of three experiments with a total of nine mice per group. (C) Diagram of differentially expressed genes (p < 0.05, >2-fold) between LPS-induced MDSCs vs. VAVcreKeapfl/fl (top), LPS-induced MDSCs vs. Keapfl/fl (middle), and of VAVcreKeapfl/fl and WT (bottom). (D) Statistical analysis of Ki-67 expression in pre-gated splenic CD11b+Gr-1+ cells from untreated (n = 4) and LPS treated (n = 4) mice. Bars indicate mean of mean fluorescence intensity and error bars SEM, two-tailed, unpaired t-test. (E) N-fold mRNA expression of metabolic enzymes in MACS isolated CD11b+Gr-1+ cells analyzed by RT-qPCR. Bars indicate mean and error bars SEM, n = 5, two-tailed, one sample test. (F) 2NBD-glucose incorporation was analyzed in CD11b+Gr1+ splenocytes from control (n = 6) and LPS treated Keapfl/fl mice (n = 6) mice at different time-points. (G) ECAR measured under basal conditions and after addition of the indicated drugs. Points indicate mean from three control and three LPS treated Keapfl/fl mice ± SEM of quintuplicates. (H) OCR measured under basal conditions and after addition of the indicated drugs. Points indicate mean CD11b+Gr-1+ cells from three control and three LPS treated Keapfl/fl mice ± SEM of quintuplicates. (I) Flow cytometric analysis of CD11b+Gr-1+ cells in spleens from Keapfl/fl mice 4 days after LPS treatment and daily administration of vehicle or rapamycin. Bars indicate mean and error bars SEM of three experiments with a total of four mice per group.
Nrf2 Activation Contributes to TLR4-Mediated MDSCs Expansion
To finally analyze the functional significance of our findings in vivo we performed an acute lethal model and a tolerance sepsis model. Mice were treated with either lethal doses (acute, lethal model) or either with sublethal (tolerizing) and subsequent lethal LPS doses (tolerance model). While treatment with low doses and subsequent lethal doses of LPS expectedly induced MDSC expression in wild-type mice and induced a protection against the lethal dose, Nrf2−/− mice had to be taken out of the experiment and sacrificed at day 2 or 3 without acquiring an enhanced MDSC population (Figures 7A,B). But it should be considered that the reduced numbers of MDSCs during the sepsis experiment in Nrf2−/− mice might be related to the early death of the mice. However, mice with deletion of Nrf2 were not protected by a tolerizing dose of LPS and died after the second lethal dose of LPS, while WT mice that underwent the same procedure were protected and displayed expanded numbers of MDSCs. In addition, mice with a constitutive expression of Nrf2 in hematopoietic cells (VAVcreKeapfl/fl) were resistant against lethal doses of LPS even without previous treatment with tolerizing LPS doses (Figures 7A,B). To further test if LPS mediates MDSC expansion and metabolic activation by promoting Nrf2 activation, we analyzed VAVcreKeapfl/fl CD11b+Gr-1+ cells after tolerizing LPS treatment. While LPS significantly enhanced ECAR also in VAVcreKeapfl/fl CD11b+Gr-1+ cells, which was comparable to the effect in wild-type MDSCs (Figure 7C), the OCR was only slightly enhanced compared to LPS-induced OCR activation of WT CD11b+Gr-1+ cells (Figures 7D,E). This experiment shows clearly that LPS favors aerobic glycolysis and lactate production in CD11b+Gr-1+ cells independently from Nrf2, but that Nrf2 translocation indeed contributes to enhanced ATP generation from oxidative phosphorylation in MDSCs, which might be protective in LPS-induced septic shock.
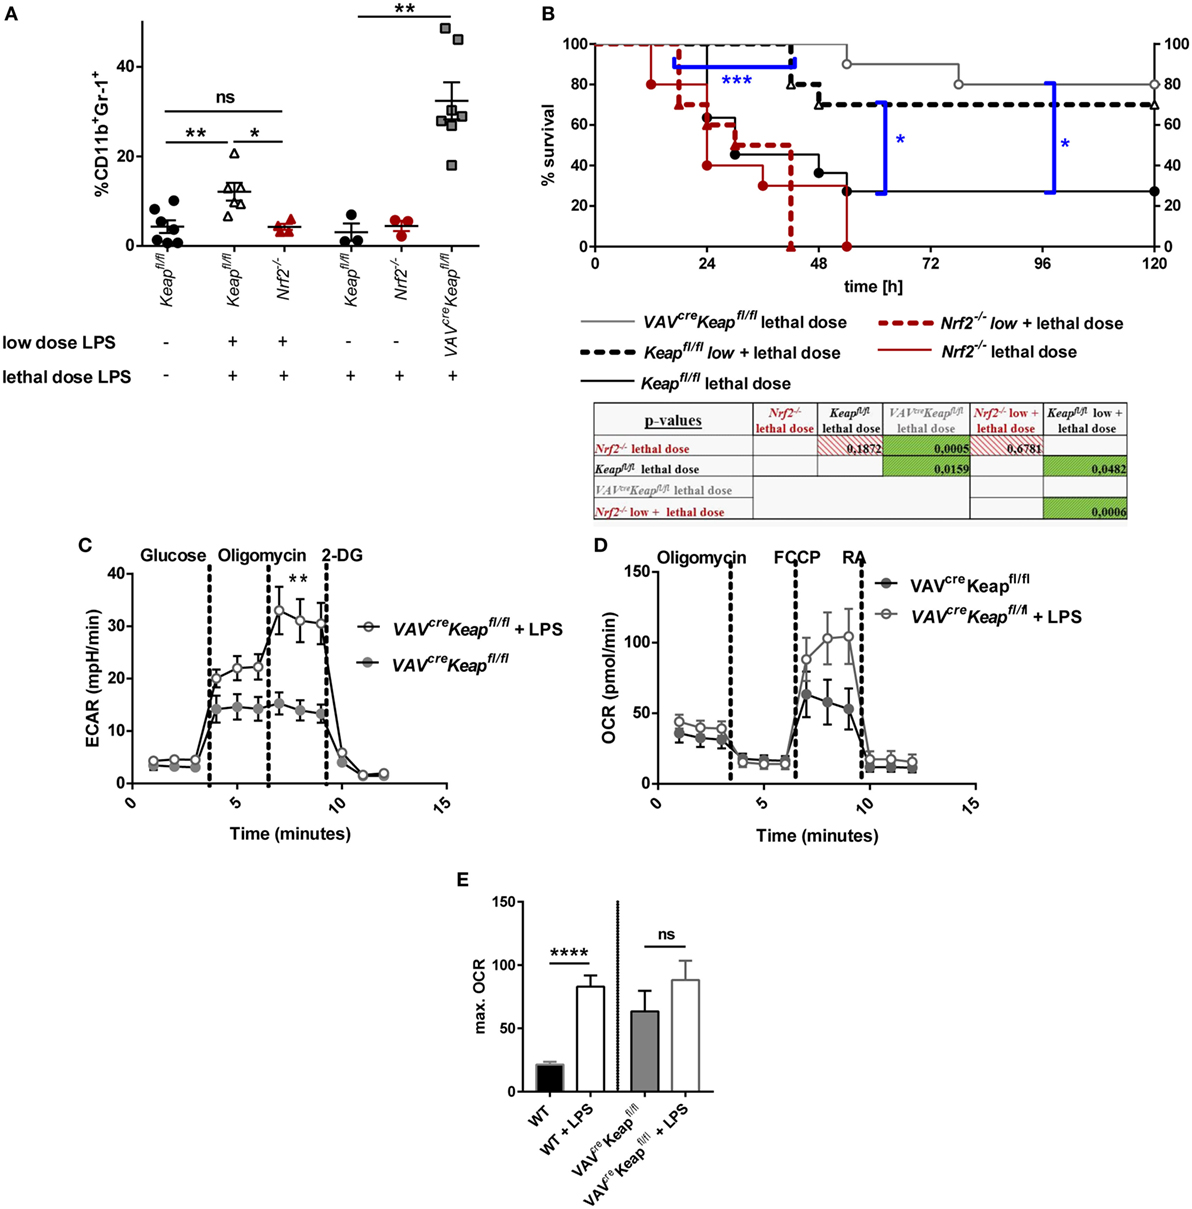
Figure 7. Nrf2 activation in myeloid-derived suppressor cells (MDSCs) regulates LPS-mediated disease. (A) Mice were injected with either a low dose of LPS (5 mg/kg of body weight) and subsequently with a lethal dose of LPS (30 mg/kg of body weight) or solely with a lethal dose of LPS (30 mg/kg of body weight). Mice were euthanized depending on a scoring system (usually within the first 48 h after the single lethal dose) or 72 h after injection of the subsequent lethal dose and frequencies of CD11b+Gr-1+ cells were determined, unpaired, two-tailed t-test, ±SEM, N = 10 mice/group. (B) Kaplan–Meyer survival curves of mice, p-values were determined by Log-rank/Mantel-Cox Test of survival curves (single comparisons) and a subsequent FDR correction of single p-value for multiple comparison test. (C) ECAR measured under basal conditions and after addition of the indicated drugs. Points indicate mean from three control and three LPS treated VAVcreKeapfl/fl splenic MDSCs ± SEM. (D) OCR measured under basal conditions and after addition of the indicated drugs. Points indicate CD11b+Gr-1+ cells from three control and three LPS treated mice ± SEM. (E) Statistical analysis of max. OCR. Bars indicate mean ± SEM.
Discussion
Nrf2 is a key transcriptional regulator, driving antioxidant gene expression and protection from oxidant injury, and is activated by ROS. Nrf2 regulated genes include a battery of antioxidant enzymes such as Nqo-1. Under quiescent conditions, Nrf2 is bound to Keap1 in the cytoplasm, resulting in proteasomal degradation. Cellular stimuli, such as oxidative stress, induce conformational changes in Keap1 resulting in the release of Nrf2 (26). Subsequently, Nrf2 translocates to the nucleus and transactivates expression of genes containing an antioxidant response element in their promoter regions (27). Nrf2 has been described before as a positive regulator of myeloid differentiation (28) and it skews the differentiation potential of HSCs toward the granulocyte-monocyte lineage (29). Nevertheless, the role for Nrf2 activation in MDSCs in different relevant diseases like cancer is contra dictionary (13, 30, 31). We therefore performed a comprehensive approach to study Nrf2/Keap1 signaling in MDSCs in steady state and sepsis and identified Nrf2 as a key metabolic regulator of these immunosuppressive cells.
In detail, we could show that Nrf2/Keap1 signaling enhances MDSCs in a cell intrinsic manner, Nrf2 activated MDSCs are suppressive in vitro and in vivo and reveal other characteristics of MDSCs such as expression of arginase and NOS2 and low expression of inflammatory cytokines. Furthermore, Nrf2 induces transcriptional reprogramming of MDSCs, which resembles the transcriptional profile of LPS-induced MDSCs and might thus critically contribute to LPS-mediated tolerance. While it was shown before that Nrf2 is protective in models of sepsis by suppressing LPS-induced inflammatory cytokine expression in macrophages (32–35), these studies did not address MDSCs and our observations in metabolic reprogramming of MDSCs might critically contribute to the protective role of Nrf2 in this context.
Nrf2 is involved in metabolic reprogramming of cancer cells and in regulation of mitochondrial respiration (36–38). Furthermore, a direct mTOR activation by Nrf2 has been shown in human cell lines (39). These earlier data from other cell types support our study, as we also detected an higher metabolic activity, higher glucose uptake and mitochondrial masses, and high mTOR phosphorylation in Nrf2-induced MDSCs cells and could even block Nrf2-induced MDSC generation with rapamycin.
Collectively our study suggests that Nrf2 is a key modulator of MDSCs which might contribute to innate memory in sepsis. Nrf2 activation induces expansion of MDSCs; Nrf2 is also necessary to expand MDSCs in the situation of LPS tolerance. Finally, these MDSCs are protective in acute LPS-induced sepsis. While Nrf2 activated MDSCs share several transcriptional similarities with LPS-tolerized WT MDSCs, we found one striking difference in energy consumption between VAVcreKeapfl/fl MDSCs and LPS-tolerized WT MDSCs. The latter ones prefer aerobic glycolysis for ATP generation. Even the VAVcreKeapfl/fl MDSCs can change their metabolic expenditures after LPS treatment to enhanced aerobic glycolysis, which suggests that glycolysis with subsequent lactate production is mainly regulated independently of Nrf2. One advantage of glycolysis in comparison to oxidative phosphorylation is a better maintenance of the redox balance. Most of cellular ROS is produced during oxidative phosphorylation in the mitochondria (40). VAVcreKeapfl/fl MDSCs show low levels of intracellular ROS despite enhanced mitochondrial mass. This can be explained by constitutive activation and availability of antioxidant enzymes in these cells and might be an important mechanism which enables the cells to enhance mitochondrial ATP production by counteracting subsequent high ROS levels at the same time. With this regard, it is interesting that Nrf2 activation in particular enhances PMN-MDSCs, which are known to produce excessive amount of ROS (41) and that Nrf2 activation also mainly reduces this high ROS levels in PMN-MDSCs and not in M-MDSCs. Therefore, PM-MDSCs may benefit more from Nrf2 activation and subsequent reduction of oxidative stress.
Host defense against recurrent infections is mediated by innate immune memory. The phenomena of trained immunity and endotoxin tolerance are examples of such innate-type memory, with trained immunity describing an adaption that results in the long-lasting capacity to respond more strongly and tolerance describing a hypoinflammatory state. However, it is not clear if these are two fundamentally divergent programs or just represent different facets of innate memory (5). Whereas the priming with β-glucan from Candida albicans leads to a state of trained immunity with a potentiation of inflammatory cytokine production, TLR4 stimulation with LPS can induce a state of endotoxin tolerance and suppression of inflammatory cytokines. Recent studies showed that aerobic glycolysis is the metabolic basis for trained immunity (42). The metabolism of tolerant myeloid cells, especially of MDSCs, is less clear and was matter of our study. It is generally accepted that, naïve or tolerant cells rely mainly on oxidative phosphorylation as energy sources while activated cells, e.g., after LPS stimulation, shift their metabolism toward aerobic glycolysis (43). By contrast, leukocytes from patients with severe sepsis and immunoparalysis display a generalized metabolic defect at the level of both glycolysis and oxidative metabolism in cellular energy metabolism (5), which means that a complete metabolic reprogramming occurs between acute sepsis and immunoparalysis. We could show that tolerizing mice with a low-dose LPS induced an activation of both glycolysis and OXPHOS in MDSCs. Mice with a constitutive Nrf2 activation already revealed at least higher OCR level and were even protected without any tolerizing pretreatment. Interestingly, MDSCs generated during infection show a strong anti-inflammatory phenotype, compared to splenic CD11b+Gr1+ cells under steady-state conditions (11) and we also detected reduced level of inflammatory cytokines in VAVcreKeapfl/fl mice compared to untreated MDSCs. This further suggests that MDSCs need to be primed to acquire an anti-inflammatory phenotype either by LPS and/or by Nrf2 activation.
One limitation of our study is that we so far only used LPS injections as a model for sepsis, therefore further studies will also include the cecal ligation and puncture model in order to test the effects of Nrf2 activation in different animal models of sepsis.
In conclusion, our data demonstrate for the first time that Nrf2/Keap signaling critically contributes to generation of tolerant MDSCs, which bear an intact cellular energy metabolism and are protective in sepsis (Figure 8). Thereby, our study provides new insights into the regulation of MDSCs, a myeloid cell population that might be relevant in trained immunity of the innate immune system (11, 44).
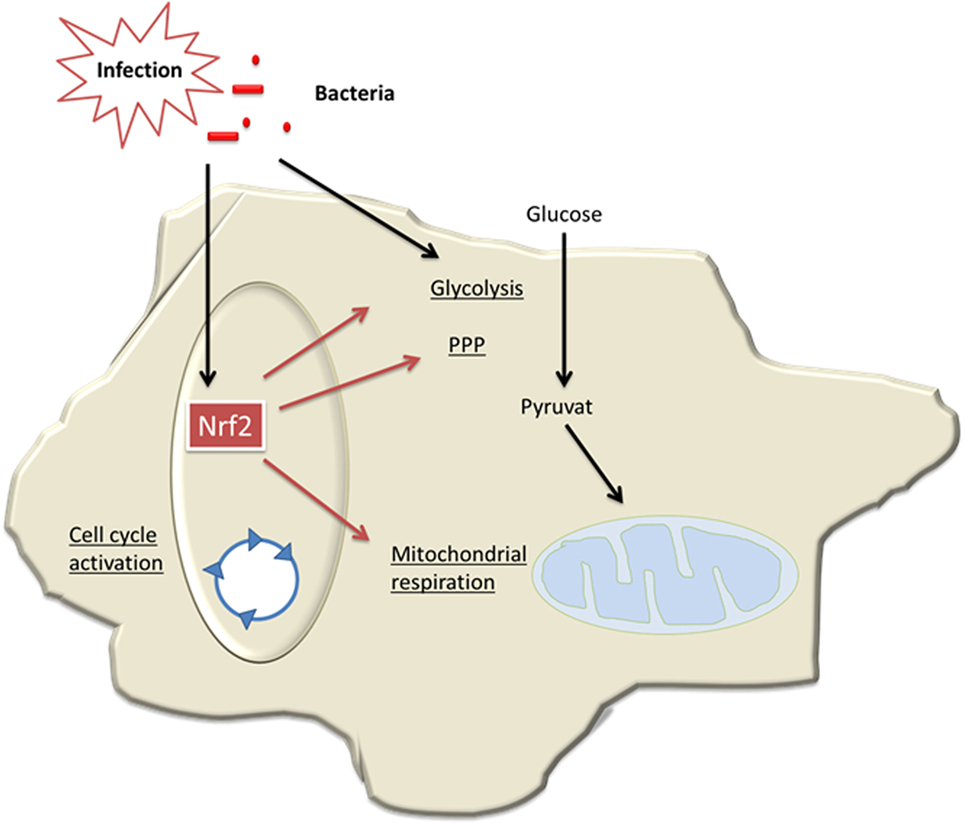
Figure 8. Model of Nrf2-mediated roles in myeloid-derived suppressor cells (MDSCs) in sepsis. During infection and sepsis, Nrf2 is activated by reactive oxygen species (ROS) molecules or TLR pathways. Nrf2 induces cell cycle activation and enhances metabolic activity and thereby contributes to expansion of MDSCs in sepsis.
Ethics Statement
The study was approved by the regional government authorities and animal procedures were performed according to German legislation for animal protection. Permission for the projects was granted by the Regierungspräsident/LANUV Nordrhein-Westfalen.
Author Contributions
KO developed the study, performed experiments, analyzed data, and wrote the paper. AF generated VAVcreKeapfl/fl mice and performed in vivo sepsis experiments. PK, WK, and JB performed experiments. ML and JM performed seahorse assays. IC performed bioinfomatic analyses. BD performed and analyzed microarrays. EV and SB performed experiments. AS, JR, and NW contributed to the writing of the paper. CW and KT developed the study and wrote the paper.
Conflict of Interest Statement
The authors declare that the research was conducted in the absence of any commercial or financial relationships that could be construed as a potential conflict of interest.
Acknowledgments
We would like to thank Lilia Kopp for assistance in this study. This research project was supported by the START-Program of the Faculty of Medicine (15/16), RWTH Aachen and by the DFG (OH 252/2-1).
Supplementary Material
The Supplementary Material for this article can be found online at https://www.frontiersin.org/articles/10.3389/fimmu.2018.01552/full#supplementary-material.
Abbreviations
ECAR, extracellular acidification rate; DMF, dimethyl fumarate; G6pd, glucose-6-phosphate dehydrogenase; Glut3, glucose transporter 3; Hk, hexokinase; IMCs, immature myeloid cells; Keap1, Kelch ECH associating protein 1; mLN, mesenterial lymph node; MDSC, myeloid-derived suppressor cell; Nrf2, nuclear factor (erythroid-derived 2)-like 2; OCR, oxygen consumption rate; Pgd, phosphogluconate dehydrogenase; Pkm2, pyruvate kinase isozyme M2; PPP, pentose phosphate pathway; ROS, reactive oxygen species; TJL, The Jackson Laboratory Score; Tkt, transketolase; Treg cell, regulatory T cell.
References
1. Gabrilovich DI, Nagaraj S. Myeloid-derived suppressor cells as regulators of the immune system. Nat Rev Immunol (2009) 9:162–74. doi:10.1038/nri2506
2. Bronte V, Brandau S, Chen SH, Colombo MP, Frey AB, Greten TF, et al. Recommendations for myeloid-derived suppressor cell nomenclature and characterization standards. Nat Commun (2016) 7:12150. doi:10.1038/ncomms12150
3. Darcy CJ, Minigo G, Piera KA, Davis JS, McNeil YR, Chen Y, et al. Neutrophils with myeloid derived suppressor function deplete arginine and constrain T cell function in septic shock patients. Crit Care (2014) 18:R163. doi:10.1186/cc14003
4. Derive M, Bouazza Y, Alauzet C, Gibot S. Myeloid-derived suppressor cells control microbial sepsis. Intensive Care Med (2012) 38:1040–9. doi:10.1007/s00134-012-2574-4
5. Netea MG, Joosten LA, Latz E, Mills KH, Natoli G, Stunnenberg HG, et al. Trained immunity: a program of innate immune memory in health and disease. Science (2016) 352:aaf1098. doi:10.1126/science.aaf1098
6. Seeley JJ, Ghosh S. Molecular mechanisms of innate memory and tolerance to LPS. J Leukoc Biol (2017) 101:107–19. doi:10.1189/jlb.3MR0316-118RR
7. Saeed S, Quintin J, Kerstens HH, Rao NA, Aghajanirefah A, Matarese F, et al. Epigenetic programming of monocyte-to-macrophage differentiation and trained innate immunity. Science (2014) 345:1251086. doi:10.1126/science.1251086
8. Cheng SC, Scicluna BP, Arts RJ, Gresnigt MS, Lachmandas E, Giamarellos-Bourboulis EJ, et al. Broad defects in the energy metabolism of leukocytes underlie immunoparalysis in sepsis. Nat Immunol (2016) 17:406–13. doi:10.1038/ni.3398
9. Delano MJ, Scumpia PO, Weinstein JS, Coco D, Nagaraj S, Kelly-Scumpia KM, et al. MyD88-dependent expansion of an immature GR-1(+)CD11b(+) population induces T cell suppression and Th2 polarization in sepsis. J Exp Med (2007) 204:1463–74. doi:10.1084/jem.20062602
10. McPeak MB, Youssef D, Williams DA, Pritchett CL, Yao ZQ, McCall CE, et al. Frontline science: myeloid cell-specific deletion of Cebpb decreases sepsis-induced immunosuppression in mice. J Leukoc Biol (2017) 102(2):191–200. doi:10.1189/jlb.4HI1216-537R
11. Sander LE, Sackett SD, Dierssen U, Beraza N, Linke RP, Muller M, et al. Hepatic acute-phase proteins control innate immune responses during infection by promoting myeloid-derived suppressor cell function. J Exp Med (2010) 207:1453–64. doi:10.1084/jem.20091474
12. Mantzarlis K, Tsolaki V, Zakynthinos E. Role of oxidative stress and mitochondrial dysfunction in sepsis and potential therapies. Oxid Med Cell Longev (2017) 2017:5985209. doi:10.1155/2017/5985209
13. Beury DW, Carter KA, Nelson C, Sinha P, Hanson E, Nyandjo M, et al. Myeloid-derived suppressor cell survival and function are regulated by the transcription factor Nrf2. J Immunol (2016) 196:3470–8. doi:10.4049/jimmunol.1501785
14. Okawa H, Motohashi H, Kobayashi A, Aburatani H, Kensler TW, Yamamoto M. Hepatocyte-specific deletion of the keap1 gene activates Nrf2 and confers potent resistance against acute drug toxicity. Biochem Biophys Res Commun (2006) 339:79–88. doi:10.1016/j.bbrc.2005.10.185
15. Chan K, Lu R, Chang JC, Kan YW. NRF2, a member of the NFE2 family of transcription factors, is not essential for murine erythropoiesis, growth, and development. Proc Natl Acad Sci U S A (1996) 93:13943–8. doi:10.1073/pnas.93.24.13943
16. Bleich A, Mahler M, Most C, Leiter EH, Liebler-Tenorio E, Elson CO, et al. Refined histopathologic scoring system improves power to detect colitis QTL in mice. Mamm Genome (2004) 15:865–71. doi:10.1007/s00335-004-2392-2
17. Pils MC, Bleich A, Prinz I, Fasnacht N, Bollati-Fogolin M, Schippers A, et al. Commensal gut flora reduces susceptibility to experimentally induced colitis via T-cell-derived interleukin-10. Inflamm Bowel Dis (2011) 17:2038–46. doi:10.1002/ibd.21587
18. Irizarry RA, Hobbs B, Collin F, Beazer-Barclay YD, Antonellis KJ, Scherf U, et al. Exploration, normalization, and summaries of high density oligonucleotide array probe level data. Biostatistics (2003) 4:249–64. doi:10.1093/biostatistics/4.2.249
19. Wang J, Duncan D, Shi Z, Zhang B. WEB-based GEne SeT AnaLysis Toolkit (WebGestalt): update 2013. Nucleic Acids Res (2013) 41:W77–83. doi:10.1093/nar/gkt439
20. Wakabayashi N, Itoh K, Wakabayashi J, Motohashi H, Noda S, Takahashi S, et al. Keap1-null mutation leads to postnatal lethality due to constitutive Nrf2 activation. Nat Genet (2003) 35:238–45. doi:10.1038/ng1248
21. Taguchi K, Maher JM, Suzuki T, Kawatani Y, Motohashi H, Yamamoto M. Genetic analysis of cytoprotective functions supported by graded expression of Keap1. Mol Cell Biol (2010) 30:3016–26. doi:10.1128/MCB.01591-09
22. Drujont L, Carretero-Iglesia L, Bouchet-Delbos L, Beriou G, Merieau E, Hill M, et al. Evaluation of the therapeutic potential of bone marrow-derived myeloid suppressor cell (MDSC) adoptive transfer in mouse models of autoimmunity and allograft rejection. PLoS One (2014) 9:e100013. doi:10.1371/journal.pone.0100013
23. Marigo I, Bosio E, Solito S, Mesa C, Fernandez A, Dolcetti L, et al. Tumor-induced tolerance and immune suppression depend on the C/EBPbeta transcription factor. Immunity (2010) 32:790–802. doi:10.1016/j.immuni.2010.05.010
24. Hossain F, Al-Khami AA, Wyczechowska D, Hernandez C, Zheng L, Reiss K, et al. Inhibition of fatty acid oxidation modulates immunosuppressive functions of myeloid-derived suppressor cells and enhances cancer therapies. Cancer Immunol Res (2015) 3:1236–47. doi:10.1158/2326-6066.CIR-15-0036
25. Wu T, Zhao Y, Wang H, Li Y, Shao L, Wang R, et al. mTOR masters monocytic myeloid-derived suppressor cells in mice with allografts or tumors. Sci Rep (2016) 6:20250. doi:10.1038/srep20250
26. Huang Y, Li W, Su ZY, Kong AN. The complexity of the Nrf2 pathway: beyond the antioxidant response. J Nutr Biochem (2015) 26:1401–13. doi:10.1016/j.jnutbio.2015.08.001
27. Kensler TW, Wakabayashi N, Biswal S. Cell survival responses to environmental stresses via the Keap1-Nrf2-ARE pathway. Annu Rev Pharmacol Toxicol (2007) 47:89–116. doi:10.1146/annurev.pharmtox.46.120604.141046
28. Bobilev I, Novik V, Levi I, Shpilberg O, Levy J, Sharoni Y, et al. The Nrf2 transcription factor is a positive regulator of myeloid differentiation of acute myeloid leukemia cells. Cancer Biol Ther (2011) 11:317–29.
29. Murakami S, Shimizu R, Romeo PH, Yamamoto M, Motohashi H. Keap1-Nrf2 system regulates cell fate determination of hematopoietic stem cells. Genes Cells (2014) 19:239–53. doi:10.1111/gtc.12126
30. Hiramoto K, Satoh H, Suzuki T, Moriguchi T, Pi J, Shimosegawa T, et al. Myeloid lineage-specific deletion of antioxidant system enhances tumor metastasis. Cancer Prev Res (Phila) (2014) 7:835–44. doi:10.1158/1940-6207.CAPR-14-0094
31. Satoh H, Moriguchi T, Taguchi K, Takai J, Maher JM, Suzuki T, et al. Nrf2-deficiency creates a responsive microenvironment for metastasis to the lung. Carcinogenesis (2010) 31:1833–43. doi:10.1093/carcin/bgq105
32. Kim JH, Choi YK, Lee KS, Cho DH, Baek YY, Lee DK, et al. Functional dissection of Nrf2-dependent phase II genes in vascular inflammation and endotoxic injury using Keap1 siRNA. Free Radic Biol Med (2012) 53:629–40. doi:10.1016/j.freeradbiomed.2012.04.019
33. Kobayashi EH, Suzuki T, Funayama R, Nagashima T, Hayashi M, Sekine H, et al. Nrf2 suppresses macrophage inflammatory response by blocking proinflammatory cytokine transcription. Nat Commun (2016) 7:11624. doi:10.1038/ncomms11624
34. Kong X, Thimmulappa R, Craciun F, Harvey C, Singh A, Kombairaju P, et al. Enhancing Nrf2 pathway by disruption of Keap1 in myeloid leukocytes protects against sepsis. Am J Respir Crit Care Med (2011) 184:928–38. doi:10.1164/rccm.201102-0271OC
35. Thimmulappa RK, Scollick C, Traore K, Yates M, Trush MA, Liby KT, et al. Nrf2-dependent protection from LPS induced inflammatory response and mortality by CDDO-imidazolide. Biochem Biophys Res Commun (2006) 351:883–9. doi:10.1016/j.bbrc.2006.10.102
36. Dinkova-Kostova AT, Abramov AY. The emerging role of Nrf2 in mitochondrial function. Free Radic Biol Med (2015) 88:179–88. doi:10.1016/j.freeradbiomed.2015.04.036
37. Holmstrom KM, Baird L, Zhang Y, Hargreaves I, Chalasani A, Land JM, et al. Nrf2 impacts cellular bioenergetics by controlling substrate availability for mitochondrial respiration. Biol Open (2013) 2:761–70. doi:10.1242/bio.20134853
38. Mitsuishi Y, Taguchi K, Kawatani Y, Shibata T, Nukiwa T, Aburatani H, et al. Nrf2 redirects glucose and glutamine into anabolic pathways in metabolic reprogramming. Cancer Cell (2012) 22:66–79. doi:10.1016/j.ccr.2012.05.016
39. Bendavit G, Aboulkassim T, Hilmi K, Shah S, Batist G. Nrf2 transcription factor can directly regulate mTOR: linking cytoprotective gene expression to a major metabolic regulator that generates redox activity. J Biol Chem (2016) 291:25476–88. doi:10.1074/jbc.M116.760249
40. Holmstrom KM, Finkel T. Cellular mechanisms and physiological consequences of redox-dependent signalling. Nat Rev Mol Cell Biol (2014) 15:411–21. doi:10.1038/nrm3801
41. Parker KH, Beury DW, Ostrand-Rosenberg S. Myeloid-derived suppressor cells: critical cells driving immune suppression in the tumor microenvironment. Adv Cancer Res (2015) 128:95–139. doi:10.1016/bs.acr.2015.04.002
42. Cheng SC, Quintin J, Cramer RA, Shepardson KM, Saeed S, Kumar V, et al. mTOR- and HIF-1alpha-mediated aerobic glycolysis as metabolic basis for trained immunity. Science (2014) 345:1250684. doi:10.1126/science.1250684
43. O’Neill LA, Kishton RJ, Rathmell J. A guide to immunometabolism for immunologists. Nat Rev Immunol (2016) 16:553–65. doi:10.1038/nri.2016.70
Keywords: Nrf2, myeloid-derived suppressor cell, LPS, sepsis, ROS
Citation: Ohl K, Fragoulis A, Klemm P, Baumeister J, Klock W, Verjans E, Böll S, Möllmann J, Lehrke M, Costa I, Denecke B, Schippers A, Roth J, Wagner N, Wruck C and Tenbrock K (2018) Nrf2 Is a Central Regulator of Metabolic Reprogramming of Myeloid-Derived Suppressor Cells in Steady State and Sepsis. Front. Immunol. 9:1552. doi: 10.3389/fimmu.2018.01552
Received: 03 March 2018; Accepted: 22 June 2018;
Published: 06 July 2018
Edited by:
Rudolf Lucas, Augusta University, United StatesReviewed by:
Shengjun Wang, Jiangsu University, ChinaSuowen Xu, University of Rochester, United States
Copyright: © 2018 Ohl, Fragoulis, Klemm, Baumeister, Klock, Verjans, Böll, Möllmann, Lehrke, Costa, Denecke, Schippers, Roth, Wagner, Wruck and Tenbrock. This is an open-access article distributed under the terms of the Creative Commons Attribution License (CC BY). The use, distribution or reproduction in other forums is permitted, provided the original author(s) and the copyright owner(s) are credited and that the original publication in this journal is cited, in accordance with accepted academic practice. No use, distribution or reproduction is permitted which does not comply with these terms.
*Correspondence: Kim Ohl, a29obEB1a2FhY2hlbi5kZQ==;
Klaus Tenbrock, a3RlbmJyb2NrQHVrYWFjaGVuLmRl
†These authors have shared first authorship.
‡These authors have shared last authorship.