 Anja Seckinger1
 Jens Hillengass1Martina Emde1
 Susanne Beck1Christoph Kimmich1Tobias Dittrich1Michael Hundemer1Anna Jauch2Ute Hegenbart1Marc-Steffen Raab1Anthony D. Ho1Stefan Schönland1
 Dirk Hose1*
- 1Medizinische Klinik V, Universitätsklinikum Heidelberg, Heidelberg, Germany
- 2Institut für Humangenetik, Universität Heidelberg, Heidelberg, Germany
Monoclonal antibodies against the cell surface antigen CD38, e.g., isatuximab, daratumumab, or Mor202, have entered the therapeutic armamentarium in multiple myeloma due to single agent overall response rates of 29 vs. 36 vs. 31%, effectivity in combination regimen, e.g., with lenalidomide or bortezomib plus dexamethasone, and tolerable side effects. Despite clinical use, many questions remain. In this manuscript, we address three of these: first, upfront CD38 target-expression in AL-amyloidosis, monoclonal gammopathy of unknown significance (MGUS), asymptomatic, symptomatic, and relapsed multiple myeloma. Second, relation of CD38-expression to survival, disease stages, molecular entities, and high-risk definitions. Third, alternative splicing or lack of CD38-expression as potential mechanisms of upfront resistance. We assessed CD138-purified plasma cell samples from 196 AL-amyloidosis, 62 MGUS, 259 asymptomatic, 764 symptomatic, and 90 relapsed myeloma patients, including longitudinal pairs of asymptomatic/symptomatic (n = 34) and symptomatic/relapsed myeloma (n = 57) regarding interphase fluorescence in situ hybridization (n = 1,380), CD38-expression by gene expression profiling (n = 1,371), RNA-sequencing (n = 593), and flow cytometry (n = 800). Samples of normal bone marrow plasma cells (n = 10), memory B-cells (n = 9), polyclonal plasmablastic cells (n = 9), and human myeloma cell lines (n = 54) were used as comparators. CD38 was expressed in all malignant plasma cell samples, but significantly lower compared to normal plasma cells with small but significant downregulation in longitudinal sample pairs. Higher CD38 expression was associated with the presence of t(4;14) and high-risk according to the UAMS70-gene score, lower expression was associated with del17p13 and hyperdiploidy in symptomatic myeloma as well as t(11;14) in asymptomatic myeloma. Higher CD38-expression was associated with slower progression to symptomatic and relapsed myeloma and better overall survival in the latter two entities. CD38 expression, t(4;14), del17p13, and gain of 1q21 are independently prognostic in multivariate analysis. By contrast, high CD38-expression is associated with adverse survival in AL-amyloidosis. Regarding mechanisms of upfront anti-CD38-treatment resistance, lack of CD38-expression and alternative splicing of receptor binding-sites could be excluded. Here, of the two protein coding CD38-transcripts CD38-001 (eight-exon, full length) and CD38-005 (truncated), CD38-001 conveyed >97% of reads spanning the respective CD38 splice junction.
Introduction
Monoclonal antibodies against the cell surface antigen CD38, e.g., isatuximab, daratumumab, or Mor202, have entered the therapeutic armamentarium in multiple myeloma due to single agent overall response rates of 29 vs. 36 vs. 31%, respectively, effectivity in combination regimen, e.g., with lenalidomide or bortezomib plus dexamethasone, and tolerable side effects (1–6).
Despite clinical use, many questions remain. First, CD38-target expression has mainly been studied for either relapsed/refractory myeloma, small patient cohorts, or after gating using CD38 (among other markers) to identify the plasma cell population (7–11). The latter analysis implies that per definition (as gated) all plasma cells show expression of CD38, i.e., was not designed to address variation or absence thereof. What is its expression in a large patient cohort without these limitations? Is it higher expressed in previously untreated patients and especially asymptomatic stages, suggesting earlier use? Information is also unavailable for patients with AL-amyloidosis. Second, no data are available for the presence of CD38-expression in high-risk entities as defined by molecular alterations including fluorescence in situ hybridization or gene expression-based factors. For our German-Speaking-Myeloma-Multicenter-Group (GMMG), this posed a surprising hurdle in defining the rationale of our CONCEPT trial (EudraCT 2016-000432-17), adding anti-CD38 treatment for symptomatic high-risk patients. Likewise, whether CD38-expression is associated with prognosis. Third, whether upfront resistance to single-agent anti-CD38 treatment could be mediated by either the absence of CD38-expression or alternative CD38-splicing removing the antibody binding site in a subfraction of patients.
Materials and Methods
Patients, Healthy Donors, and Samples
Consecutive patients with AL-amyloidosis (n = 196), monoclonal gammopathy of unknown significance (MGUS) (n = 62), asymptomatic (n = 259), symptomatic, therapy-requiring (n = 764), and relapsed/refractory myeloma (n = 90), as well as healthy donors (n = 19) as comparators were included in the study approved by the ethics committee (#229/2003, #S-152/2010) after written informed consent (Figure 1; Table S1 in Supplementary Material). Normal bone marrow plasma cells (BMPCs) and myeloma cells were purified using anti-CD138 microbeads (Miltenyi Biotec, Bergisch Gladbach, Germany) (12, 13). Peripheral blood CD27+ memory B-cells (MBCs) (n = 9) were FACS-sorted and polyclonal plasmablastic cells (PPCs) (n = 9) were in vitro differentiated as described (14).
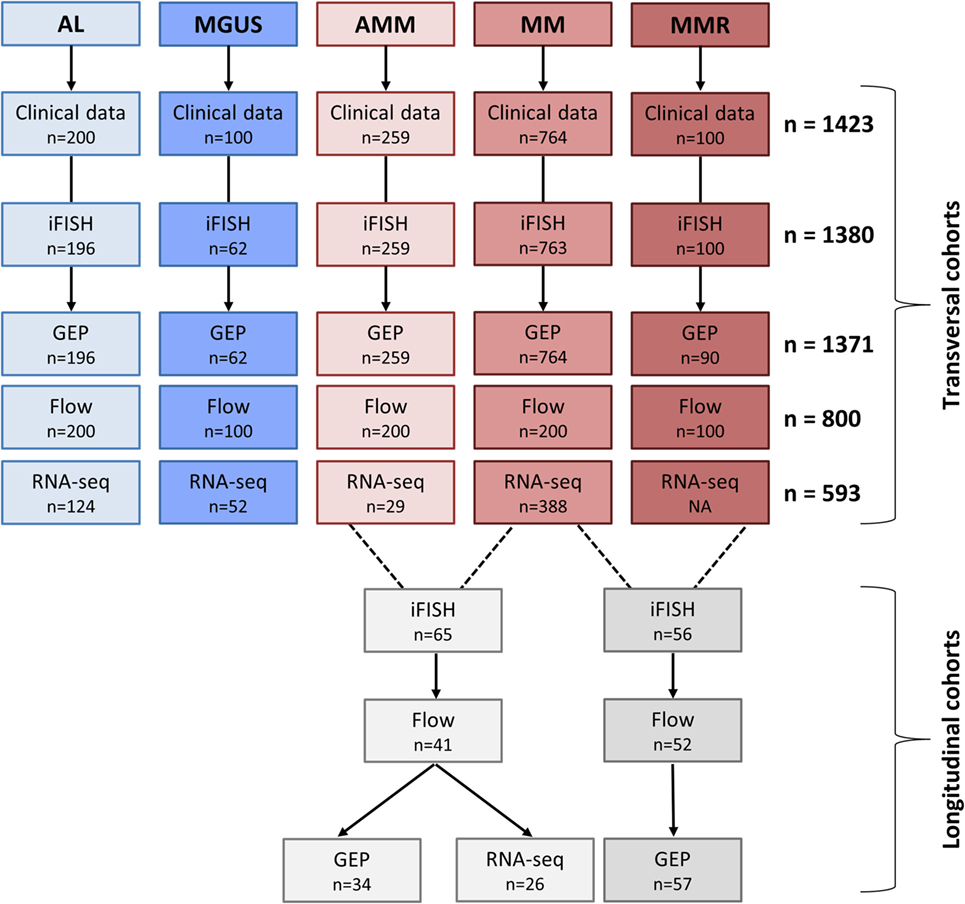
Figure 1. Overview of patient cohorts and investigations. Shown are the patient numbers within our transversal and longitudinal cohorts for whom the respective data were available. Abbreviations: AL, AL-amyloidosis; MGUS, monoclonal gammopathy of unknown significance; AMM, asymptomatic multiple myeloma; MM, therapy-requiring multiple myeloma; MMR, relapsed multiple myeloma; iFISH, interphase fluorescence in situ hybridization; GEP, gene expression profiling; RNA-seq, RNA-sequencing; Flow, flow cytometric analysis.
The human myeloma cell lines (HMCLs) L363, SK-MM-2, LP-1, RPMI-8226, AMO-1, KMS-18, JIM-3, JJN3, KARPAS-620, KMS-12-BM, ANBL-6, KMS-11, MM1S, NCI-H929, KMS-12-PE, OPM-2, MOLP-8, MOLP-2, KMM-1, U266, and EJM were purchased from the German Collection of Microorganisms and Cell Cultures (Braunschweig, Germany), American Type Cell Culture (Wesel, Germany), or the National Institutes of Biomedical Innovation, Health and Nutrition (Osaka, Japan); the HG-lines HG1, HG3, HG4, HG5, HG6, HG7, HG8, HG9, HG11, HG12, HG13, HG14, HG15, HG17, and HG19 were generated at the Myeloma Research Laboratory Heidelberg, the XG1, XG2, XG3, XG4, XG5, XG6, XG7, XG10, XG11, XG12, XG13, XG14, XG16, XG19, XG20, XG21, XG22, XG23, and XG24 at Montpellier. Cell line identity was assessed for proprietary cell lines by DNA-fingerprinting, mycoplasma-contamination excluded by PCR-based assays, and EBV-infection status by clinical routine PCR-based diagnostics.
Measurement of CD38-Expression
Gene Expression Profiling (GEP)
Gene expression profiling using U133 2.0 plus arrays (Affymetrix, Santa Clara, CA, USA) was performed as published (12, 13, 15). Expression data are deposited in ArrayExpress under accession numbers E-MTAB-4715, E-MTAB-4717, E-MTAB-5212, E-TABM-937, and E-TABM-1088.
RNA-Sequencing
RNA-sequencing was performed as published (12, 16, 17). In brief, full-length double-stranded cDNA was generated from 5 ng of total RNA and amplified using the SMARTer Ultra Low RNA Kit (Illumina, San Diego, CA, USA). Library preparation was performed from 10 ng of fragmented cDNA using the NEBNext Chip-Seq Library Prep protocol (New England BioLabs, Ipswich, MA, USA). Libraries were sequenced on an Illumina Hiseq2000 with 2 × 50-bp paired-end reads.
Flow Cytometry
Bone marrow aspirates were stained with anti-CD138-PE (clone B-B4, Miltenyi Biotec) and anti-CD38-FITC (clone HB 7, Becton Dickinson, Heidelberg, Germany). Cells stained with corresponding isotype antibodies were used as control. Analysis was performed on a FACSCalibur (Becton Dickinson) using BD CellQuest software (Becton Dickinson) and FlowJo version x.0.7 (FLOWJO, LLC, Ashland, OR, USA).
Interphase Fluorescence In Situ Hybridization (iFISH)
Interphase fluorescence in situ hybridization analysis was conducted on CD138-purified plasma cells using probes for chromosomes 1q21, 5p15, 5q31 or 5q35, 8p21, 9q34, 11q22.3 or 11q23, 13q14.3, 15q22, 17p13, 19q13, IgH-breakapart, as well as translocations t(4;14) (p16.3;q32.3), t(11;14) (q13;q32.3), and t(14;16) (q32.3;q32) (Kreatech, Amsterdam, The Netherlands and MetaSystems, Altlussheim, Germany) as published (18, 19).
Statistical Analysis
Microarray gene expression analyses were performed on GC-RMA (20) preprocessed data for our cohort as well as mas5 for the total therapy 2 and 3 cohort (see below). Due to two different IVT labeling kits used, batch correction was performed using ComBat (21). To assess presence or absence of gene expression, the “Presence-Absence calls with Negative Probesets” (PANP) algorithm (22) was used. The EMC92-gene score (23), UAMS70-gene score (24), Rs-score (25), our gene expression-based proliferation index (GPI) (13), as well as the TC (26) and the molecular classification (24) have been calculated as published. For calculation of the UAMS70-score and the TC-classification, data were normalized using mas5.
Next generation sequencing RNA fastq-files were analyzed with STAR with default options (27). A genome reference was generated with STAR using GRCh38 genome and annotation information of Ensembl databases release 82 (28). Files were aligned to GRCh38 genome build and reads counted per gene and splice junction. STAR uses HTSeq (29) internally for counting reads and sorts the resulting bam files by coordinate. Technical replicated were summed and reads per gene were normalized with edgeR (30). Therefore, normalization factors were calculated with default options and counts per million were computed with accounting for library size. Then log2 transformation was performed with a prior count of 1. A transcript reference was generated with RSEM using GRCh38 genome and annotation information of Ensembl databases release 82 and using option–star for creating STAR indices. Files were aligned with STAR per transcripts and expression was calculated with RSEM (31) with default options. Plots were generated with RSEM function “rsem-plot-transcript-wiggles” presenting read depth of uniquely and multiple mapping reads.
Expression values from flow cytometry were analyzed as log transformed MFI values.
Differences in clinical parameters [e.g., ISS stage (32), tumor mass surrogates, i.e., free light chain ratio involved:uninvolved of ≥100 (33), immunoparesis as defined by suppression of one or two of the non-involved immunoglobulins below the lower limit of normal (34), model according to Kyle et al. (35) and the Mayo-model (36), number of affected organs, or the Mayo2004-score (37)], cytogenetics and between defined groups were investigated by exact Wilcoxon rank-sum test (38).
Computations were performed using R1 version 3.3 and Bioconductor (39), version 3.3.2 Effects were considered statistically significant if the p value of corresponding statistical tests was below 5%. To correct for multiple testing, p values in Table 3 were adjusted with Benjamini–Hochberg correction (40).
Overall and event-free survival was investigated for AL-amyloidosis, symptomatic multiple myeloma undergoing high-dose therapy, and refractory multiple myeloma, and progression-free survival for asymptomatic myeloma patients using Cox’s proportional hazard model (41). In AL-amyloidosis, hematologic event-free survival, i.e., hematologic relapse or progression, initiation of a new therapy or death (whichever came first), were defined as events (42). Survival data were validated by an independent cohort of 701 myeloma patients treated with high-dose chemotherapy within the total therapy 2 or 3 protocol (TT2/TT3), respectively (43, 44).
For the analysis of the prognostic value of CD38, patients with “high” and “low” CD38-expression in microarray data were delineated using maximally selected rank statistics3 with thresholds calculated for each disease entity. For validation purposes, thresholds calculated on our cohort of symptomatic myeloma patients were applied to the TT2/TT3 cohort.
Survival curves were computed with nonparametric survival estimates for censored data using the Kaplan–Meier method (45). Difference between the curves was tested using the G-rho Log-rank test (46).
Results
Expression of CD38 in Malignant Plasma Cells
Using GEP, we found CD38 expressed in all 1,371 malignant plasma cell samples derived from symptomatic, relapsed, asymptomatic, MGUS-, and AL-amyloidosis patients (Figure 2A; Table 1). Expression of CD38 was validated by RNA-sequencing (n = 593) and flow cytometry (n = 800) (Figures 2B,C; Table 1). The expression levels in all entities were significantly lower compared to normal BMPCs, but remained for all samples above the level of MBCs, in which CD38-expression is absent. Expression levels varied within each of the entities by two orders of magnitude (Table 1). In paired samples, a trend for lower expression in more advanced stages was found. This difference was significant for CD38-expression (GEP) in asymptomatic vs. symptomatic myeloma (n = 34, p = 0.01; Figures 2D1–D3) and symptomatic vs. relapsed myeloma in flow cytometry (n = 52, p = 0.001), however, the absolute difference was small (Figures 2E1,E2). The same trend can also be seen for the subgroup of patients with AL-amyloidosis: lower CD38-expression is found with underlying asymptomatic myeloma compared to MGUS, being significant for GEP (p = 0.02) and flow cytometry (p = 0.008), respectively.
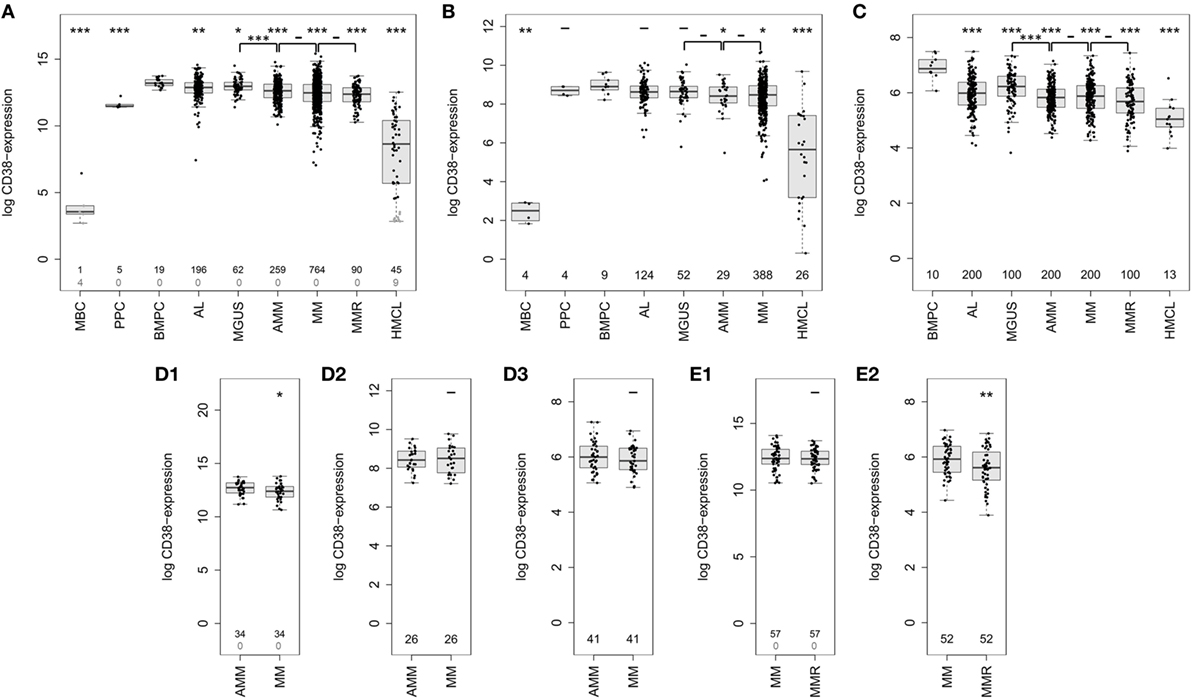
Figure 2. Expression of CD38 in normal and malignant plasma cells. CD38-expression determined by (A) gene expression profiling using Affymetrix U133 2.0 DNA-microarrays (probe set 205692_s_at) in normal plasma cell precursors, i.e., memory B-cells (MBCs, n = 5), in vitro generated polyclonal plasmablastic cells (PPC, n = 5), and normal bone marrow plasma cells (BMPCs, n = 19), malignant plasma cells from patients with AL-amyloidosis (AL, n = 196), monoclonal gammopathy of unknown significance (MGUS, n = 62), asymptomatic myeloma (AMM, n = 259), symptomatic myeloma (MM, n = 764), relapsed multiple myeloma (MMR, n = 90), as well as human myeloma cell lines (HMCLs, n = 54). Black numbers correspond to the number of samples which express CD38 according to the PANP algorithm, gray numbers reflect those that do not express CD38. (B) Confirmation using RNA-sequencing of PPC (n = 4), MBC (n = 4), normal (n = 9) and malignant plasma cells from patients with AL (n = 124), MGUS (n = 52), AMM (n = 29), and MM (n = 388), as well as cell lines (n = 26). (C) CD38 expression on protein level as determined by flow cytometry on the surface of normal (n = 10) and malignant plasma cell samples from patients with AL-amyloidosis (n = 200), MGUS (n = 100), AMM (n = 200), MM (n = 200), and MMR (n = 100). (D) Expression of CD38 in longitudinal (paired) samples of asymptomatic and symptomatic myeloma as per (D1) gene expression profiling (GEP) (n = 34 pairs, p < 0.05), (D2) RNA-sequencing (n = 26 pairs), and (D3) flow cytometry (n = 41 pairs). (E) Expression of CD38 in longitudinal samples of symptomatic and relapsed myeloma according to (E1) GEP (n = 57 pairs, p = n.s.) and (E2) flow cytometry (n = 52 pairs, p < 0.01). Significant difference between the groups is depicted by one asterisk (*) for a level of p < 0.05, two asterisks (**) for a level of p < 0.01, and three (***) for p < 0.001 with corresponding patient numbers being depicted in the boxplots. In the upper row, asterisks compare the expression of cohorts against the expression of BMPCs, the lower row compares disease entities pairwise.
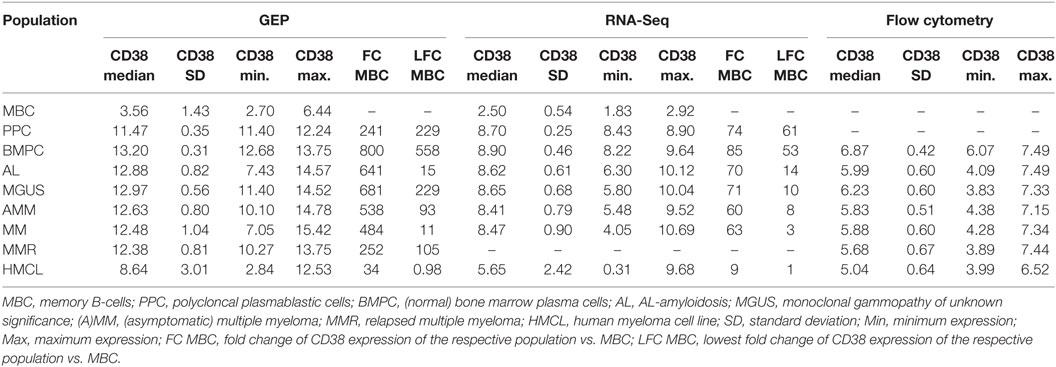
Table 1. Expression (log) of CD38 by gene expression profiling (GEP, RNA-sequencing) and flow cytometry.
Relation of CD38-Expression to Survival, Molecular Entities, and High-Risk Definitions
Asymptomatic patients with high CD38-expression (CD38high, delineated by logrank-based threshold) according to GEP, the largest cohort analyzed, had a significantly longer time to progression (p = 0.04; Figure 3A) and symptomatic patients had better event-free as well as overall survival (p = 0.03 and p = 0.02; Figure 3B1). For symptomatic patients, this was validated in the independent TT2/TT3 cohort from the University of Arkansas (p = 0.04 and p = 0.02; Figure 3B2). Better overall survival in case of CD38high expression was likewise found for patients with relapsed/refractory myeloma (p = 0.04; Figure 3C). By contrast, AL-amyloidosis patients with CD38high expressing malignant plasma cells did worse regarding hematologic event-free survival (p = 0.009) and a trend for overall survival (p = 0.1; Figure 3D). The relative hazard ratio of CD38-expression for symptomatic myeloma patients [including all cytogenetic entities, HR OS = 0.78 (0.6–1), p = 0.03] is comparable to those by adverse chromosomal aberrations, e.g., for del17p13 [HR OS = 1.53 (1.2–2), p = 0.002], t(4;14) [HR OS = 1.75 (1.4–2.3), p < 0.001], or 1q21 [HR OS = 1.65 (1.4–2) for >2 vs. 2 copies, p < 0.001, and HR OS = 2.23 (1.5–3.3) for >3 vs. 2 copies, p < 0.001], and altered gene expression, i.e., the UAMS70-gene score [HR OS = 1.94 (1.6–2.4), p < 0.001] or proliferation [HR OS = 1.4 (1.1–1.7) for medium vs. low risk, p = 0.001, and HR OS = 2.42 (1.8–3.2) for high vs. low risk, p < 0.001] (Table S2 in Supplementary Material). In multivariate analysis regarding event-free survival in multiple myeloma, CD38-expression (GEP) and the chromosomal aberrations t(4;14), del17p13, 1q21 (>2 and >3 copies) are independently prognostic, whereas t(11;14) and hyperdiploidy are not (Table S3 in Supplementary Material).
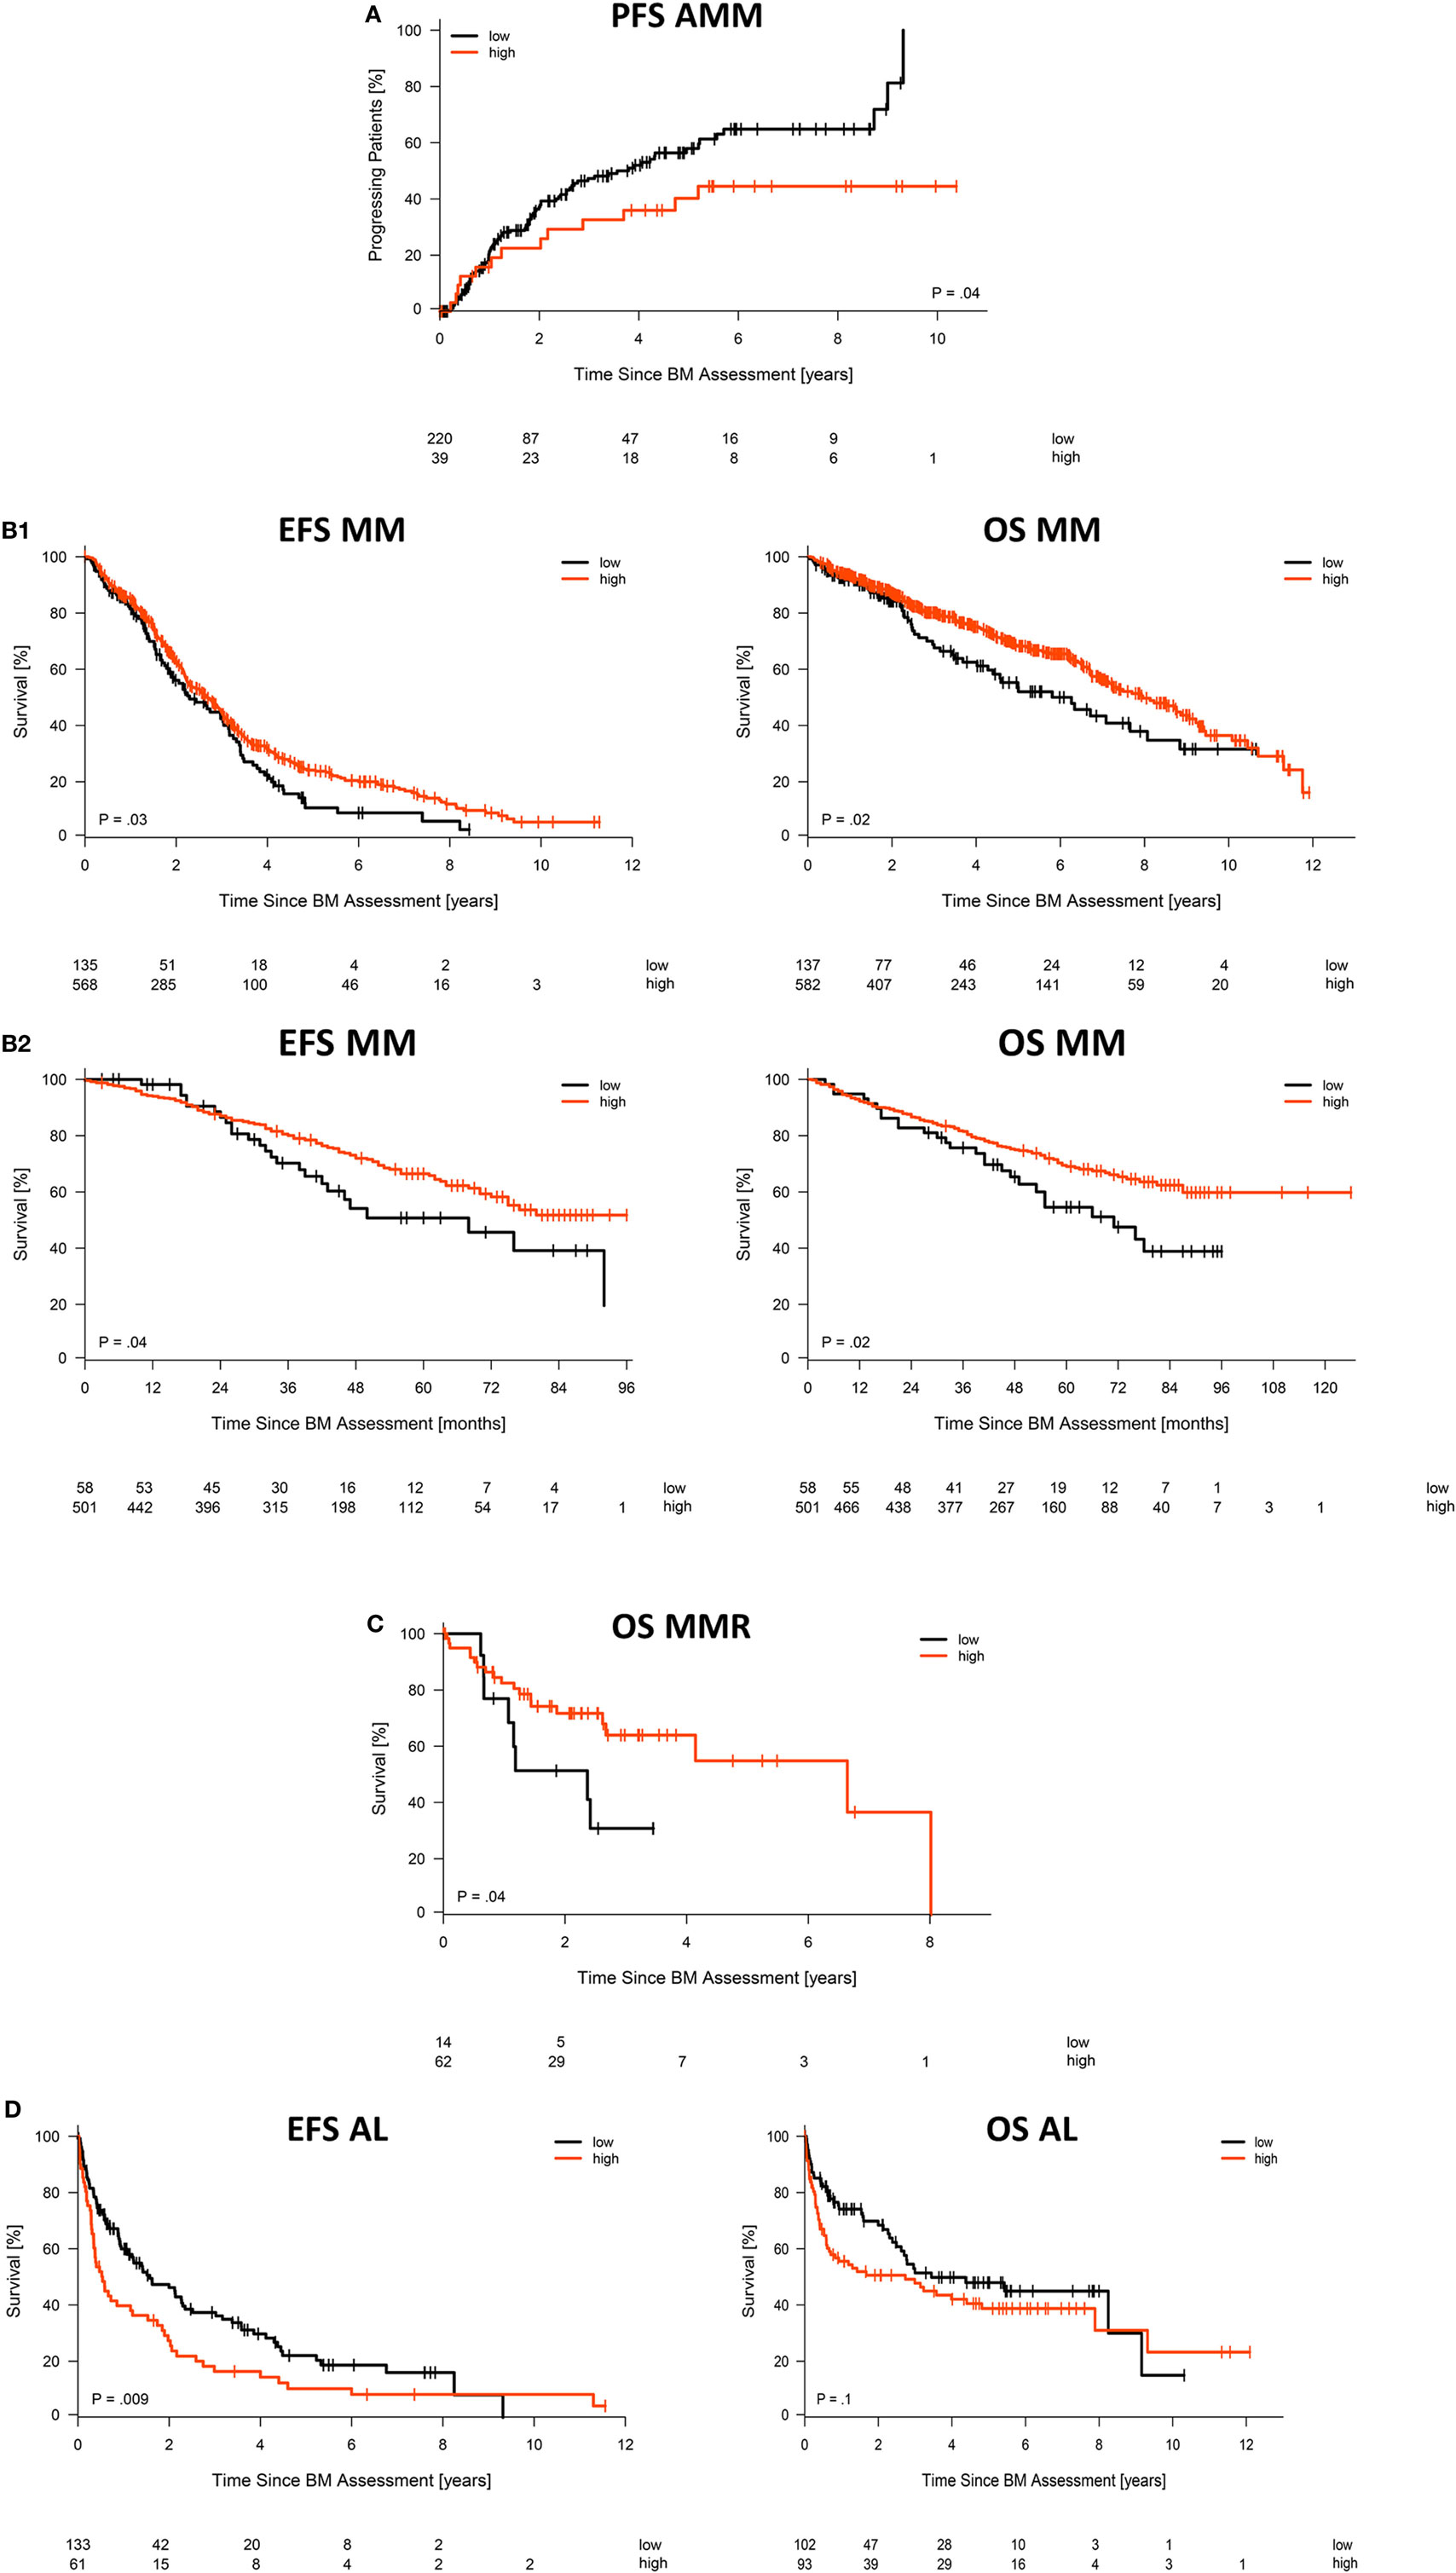
Figure 3. Association with survival. Impact of low vs. high CD38 expression according to gene expression profiling on (A) time to progression in asymptomatic myeloma patients, (B1) event-free and overall survival for our patient cohort treated with high-dose chemotherapy followed by autologous stem cell transplantation, including (B2) validation for patients treated within the total therapy 2 or 3 protocol, respectively, (C) overall survival of patients with relapsed/refractory myeloma, as well as (D) hematologic event-free and overall survival for patients with AL-amyloidosis. Patients with “high” and “low” CD38 expression in microarray data were delineated using maximally selected rank statistics with maxstat thresholds calculated for each entity: 13.34 (AMM), 11.64 (MM), 11.53 (MMR), and 13.15/12.95 (AL EFS/OS), respectively.
Chromosomal alterations showed different patterns of association with CD38-expression (according to GEP, the largest cohort analyzed; Tables 2 and 3; Figure S1 in Supplementary Material) in symptomatic myeloma. Whereas no difference was found for gain of 1q21 (2 vs. >2 vs. >3 copies), lower expression levels were found for del17p13 (p = 0.008) in contrast to higher CD38-expression in case of the presence of t(4;14) (p < 0.001). In the latter case, significant differences were found likewise for MGUS (p = 0.01) and asymptomatic myeloma (p = 0.002). Significantly lower CD38-expression was found for hyperdiploidy in symptomatic patients (p < 0.001) and for t(11;14) in asymptomatic myeloma (p = 0.006). Results were validated by RNA-seq for t(4;14) and hyperdiploidy (Tables 2 and 3; Figure S2A in Supplementary Material), the latter also in flow cytometric assessment (all patients; Tables 2 and 3; Figure S2B in Supplementary Material). Our iFISH- and ISS-based GMMG high-risk sore (19) did not show an association with CD38-expression.
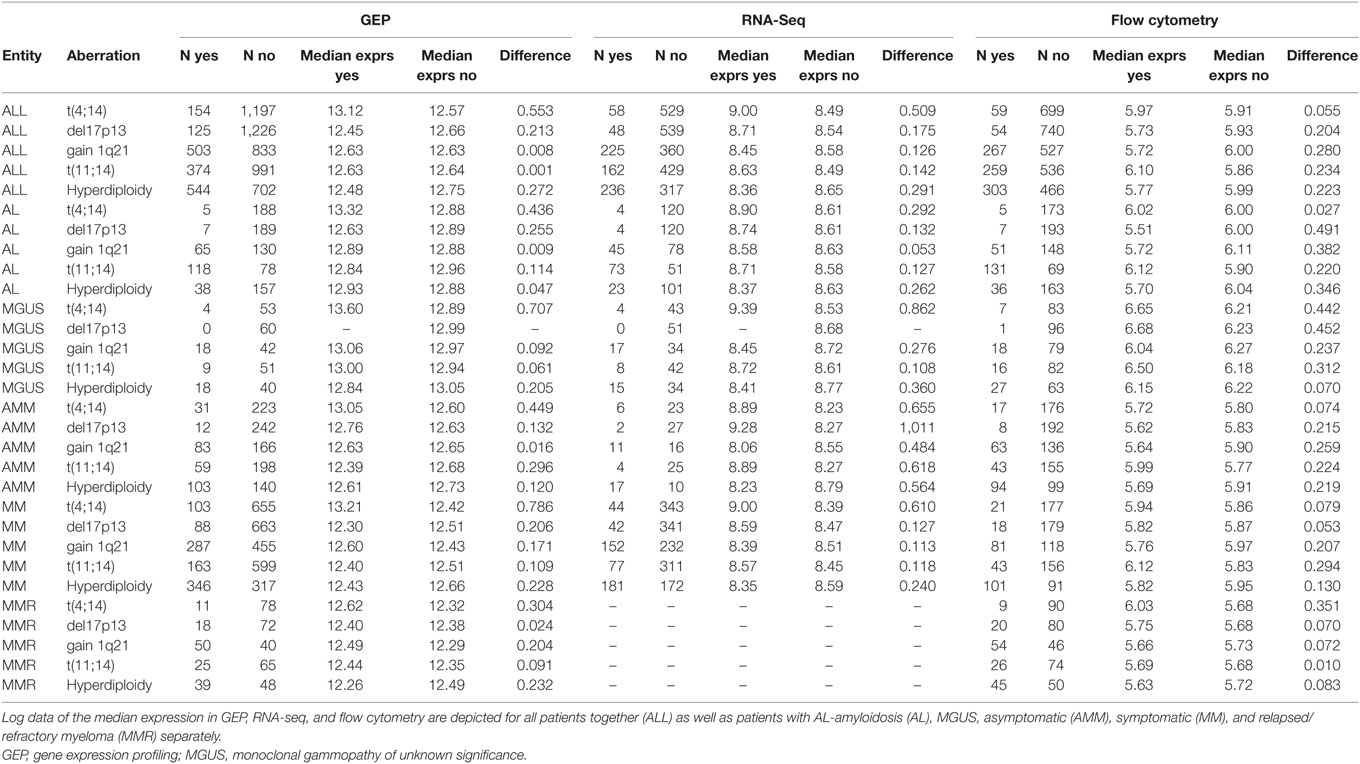
Table 2. Expression levels of CD38 for different chromosomal aberrations in patients presenting with (yes) vs. without (no) the corresponding aberration.
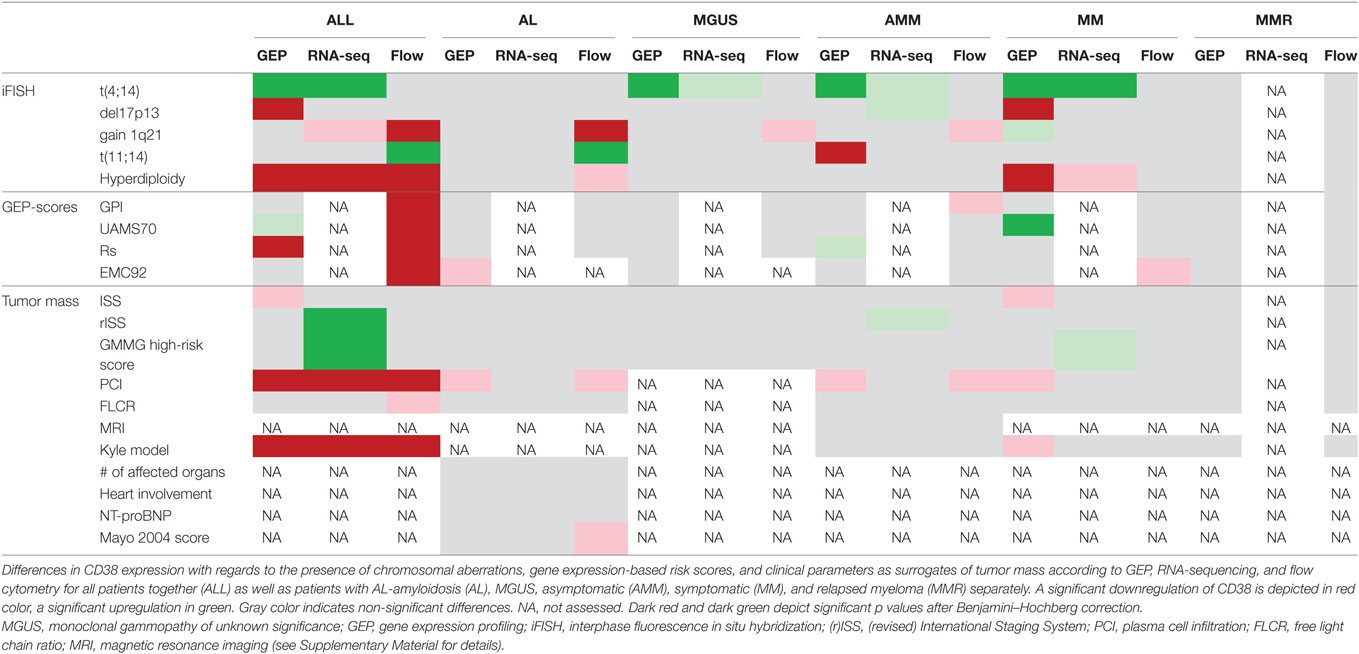
Table 3. Differences in CD38 expression.
From investigated gene expression-based factors including proliferation, only the UAMS70-gene-score showed an association with CD38-expression in symptomatic myeloma patients (p < 0.001); surprisingly, high risk correlated with significantly higher CD38-expression (Table 3; Figure S3 in Supplementary Material). This association could be validated in the independent TT2/TT3 cohort.
Correlation of CD38-expression with prognostic clinical parameters was neither observed in symptomatic nor asymptomatic myeloma patients in more than one assessment of CD38-expression (Table 3; Figures S4–S6 in Supplementary Material).
In patients with AL-amyloidosis, CD38-expression is neither associated with the number of affected organs, involvement of the heart as the most critical organ, nor the surrogate marker NT-proBNP (<332 vs. ≥332 ng/l) or the Mayo2004-score (Table 3; Figures S4–S6 in Supplementary Material). Patients in the CD38high expressing cohort in terms of overall survival (maxstat cutoff) showed slightly but significantly higher NT-proBNP-levels (p = 0.04).
Potential Mechanisms of Primary Resistance
As we could exclude lack of CD38-expression as potential mechanism of upfront resistance to single-agent anti-CD38 treatment (Figure 1; Table 1), we investigated alternative CD38-splicing potentially leading to the removal of the antibody binding site. We assessed the five CD38 transcripts annotated in GRCh38 in terms of the presence and abundance of (specific) splice junctions. We focused on the two protein coding transcripts CD38-001 and CD38-005, both of which can be identified by a transcript specific splice junction. The full-length eight-exon-transcript CD38-001 was expressed in all malignant plasma cell samples (Figure 4A). It was by far the most abundant protein coding transcript with >97% of associated reads in CD38-specific splice junctions in all individual malignant and normal plasma cell samples (Table 4). CD38-005 transcript specific splice junction with a read count above 10 was detected in 20/593 (3.4%) patient samples with a maximum frequency of 1.8% compared to that of CD38-001 (Figure 4B). Exemplary data are shown in Figure 4C.
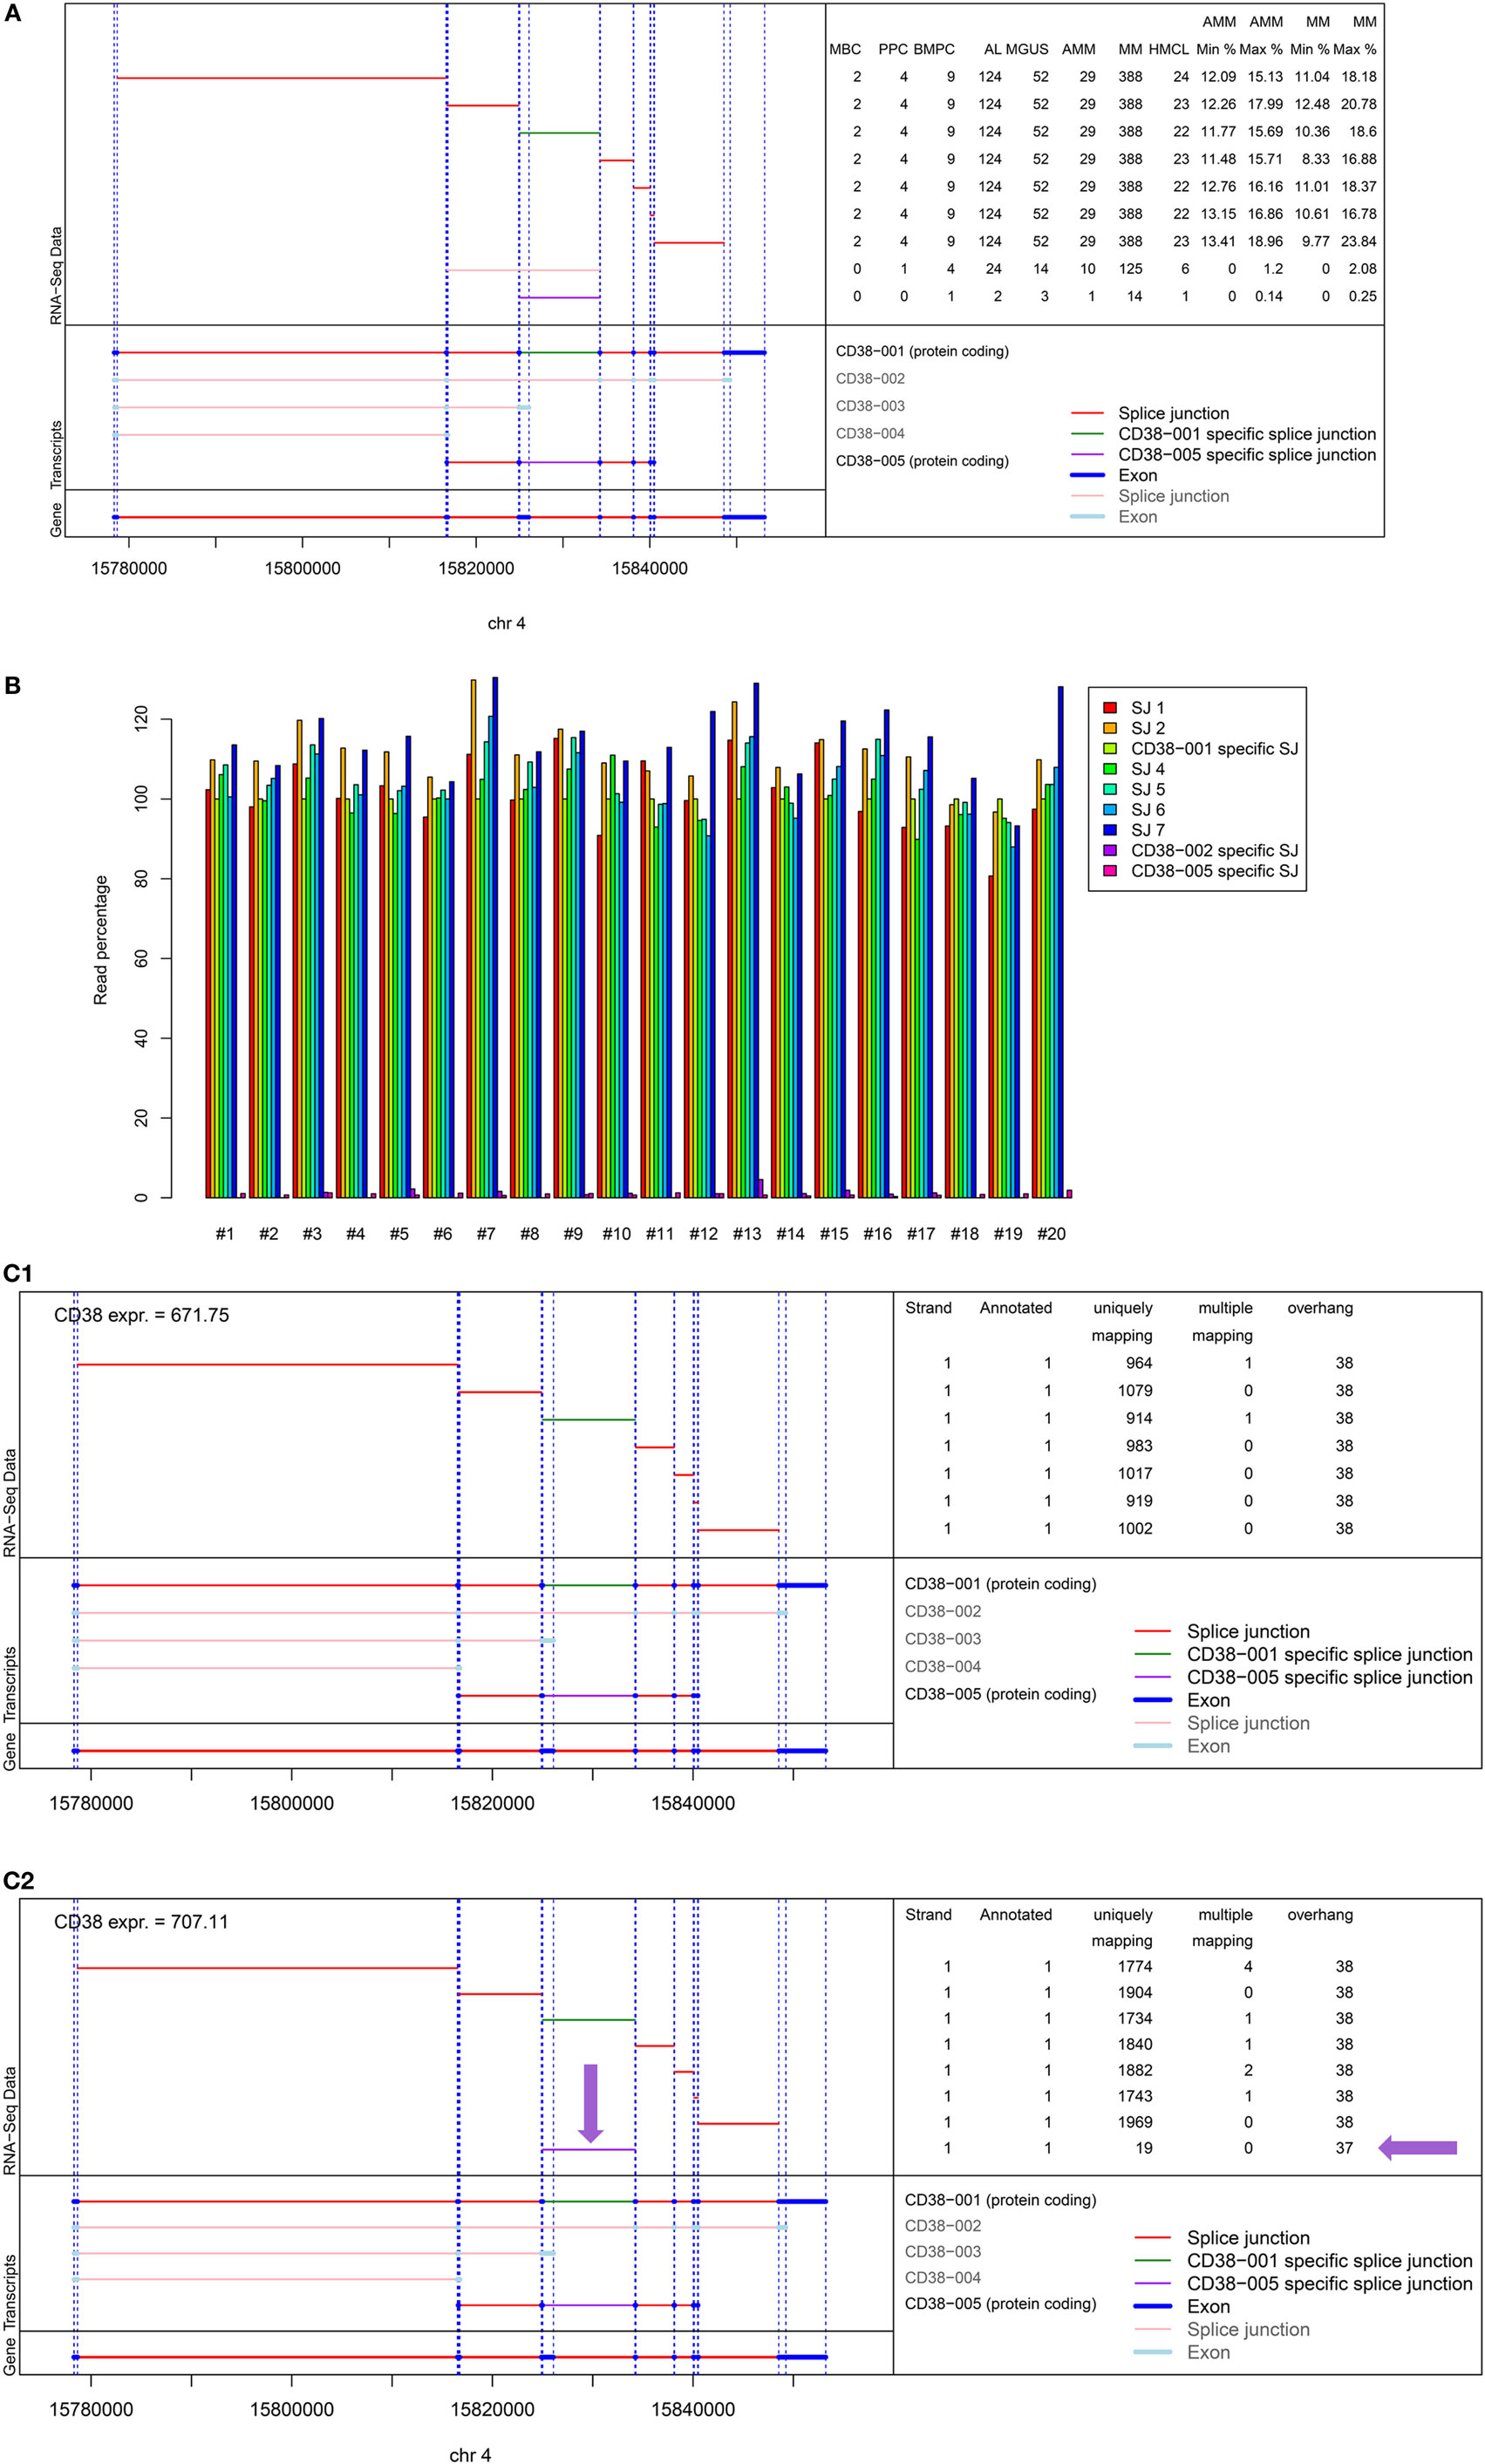
Figure 4. Analysis of alternative splicing of CD38. Five splice variants for CD38 are annotated in GRCh38, two of which being protein encoding, i.e., CD38-001 and CD38-005, focused on here. Of the three remaining transcripts, CD38-003 and CD38-004 are both non-protein coding due to retained intron sequences, and CD38-002 shows nonsense-mediated decay. (A) Shown is the structure of the CD38 locus (bottom left) followed by the different transcripts (n = 5) with splice junctions (n = 9) depicted in red and exons (n = 17) depicted in dark blue. Eight exons and seven splice junctions belong to CD38-001 and one junction exists only in CD38-001, depicted in green. The splice junction specific for CD38-005 is depicted in lilac. This is likewise explained in the bottom right part of the figure. The left part of the top panel shows the individual splice junctions expressed in RNA-seq analysis. The right part of the top panel gives the number of samples expressing the respective splice junction. The splice junction specific for CD38-001 is expressed in all 593 plasma cell samples while the one for CD38-005 is expressed only in 2/124 AL-patients (1.6%), 3/52 MGUS (5.8%), 1/29 AMM (3.4%), and 14/388 MM patient samples (3.6%), respectively. The last four columns give the minimum (min) and maximum (max) percentage of raw reads for the specific junctions compared to all reads spanning a CD38 splice junction in asymptomatic and symptomatic myeloma patients. (B) Given is the relative abundance of reads per splice junction in comparison to CD38-001 specific splice junction for the 20 patients in whom CD38-005 (lilac) supported by at least 10 reads was found. The maximum observed frequency is 1.8%. (C) Exemplary data for (C1) a patient showing expression of CD38-001 only. All seven splice junctions and eight exons are present. Reads for individual splice junctions are depicted to the right. (C2) Exemplary patient showing additional alternative splicing in terms of expression of CD38-005 but with low frequency (lilac arrows). In the depicted patient, the relative abundance of this specific junction compared to that of CD38-001 is 1.1%. See also Table S3 in Supplementary Material. RSEM transcript analysis for the same patients confirming the data is shown in Figure S7 in Supplementary Material.
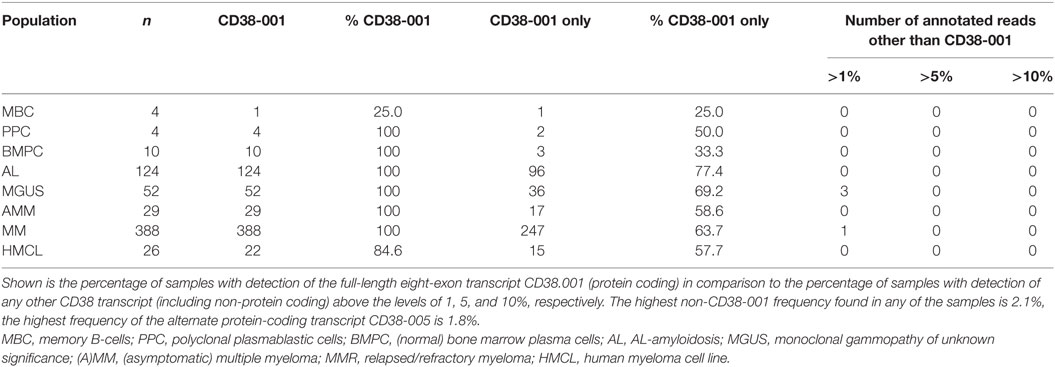
Table 4. Alternative splicing of CD38 and relative abundance of protein coding transcripts.
Results are confirmed by RSEM transcript analysis. Here, a high number of mapping reads is present for transcript 1 compared with few for transcript 5. The analysis shows a gap in matching reads for transcript 5 between position 161 and 162, i.e., exactly the position of the transcript 5 specific splice junction; reads overlapping this splice junction are missing (see Figure S7 in Supplementary Material for exemplary data).
Discussion
Monoclonal antibodies against the cell surface antigen CD38, e.g., isatuximab, daratumumab, or Mor202, have entered the therapeutic armamentarium in multiple myeloma. Of these, daratumumab is approved for the treatment of relapsed/refractory myeloma in Europe and the US. Daratumumab is likewise approved in the US for the upfront-treatment of non-transplant eligible patients in combination with melphalan and prednisone based on recent data from the ALCYONE trial (47). Trials with daratumumab and other anti-CD38 antibodies are ongoing for upfront treatment of symptomatic (e.g., NCT03012880 and NCT02541383) and asymptomatic/smoldering myeloma (e.g., NCT02316106) as well as AL-amyloidosis (6). In the latter disease, treatment requires a quick reduction of the malignant cell clone to stop amyloid production and organ deposition, but amyloid-associated morbidities frequently limit intensity of treatment (48, 49).
In our study, we fist addressed expression of CD38 in a large cohort of patients with different stages of plasma cell diseases. We find that CD38 is expressed on malignant plasma cells of all entities, including AL-amyloidosis, with two-log fold variation of expression within the respective entities. From a methodological point of view, although not being contradictory, results obtained with different methods do not show complete overlap in terms of significant differences for all cohorts investigated. We see two main explanations. First, methods assessing abundance of mRNAs (GEP, RNA-sequencing) vs. those addressing protein surface expression (flow cytometry). Methodological differences are likewise present for the first two methods; whereas for GEP (microarrays) the number of binding sites and thus corresponding fluorescence intensity is limited and saturation effects come into place with high expression, this is not the case for RNA-seq where the actual number of transcripts (reads) is measured (with normalization to allow comparison between different samples). Observed significant differences are secondly impacted by the number of samples assessed by the respective method.
We next investigated the association of CD38-expression with molecular entities and patient survival. An interesting question to this end is, at what stage the downregulation compared to normal plasma cells appears. A significant downregulation is found between MGUS and asymptomatic myeloma stage, but not between subsequent stages thereafter. The latter can only be seen for comparison of longitudinal cohorts of asymptomatic/symptomatic or symptomatic/relapsed myeloma with small differences. Expression wise, there is thus no obvious preferential timing of anti-CD38 treatment. A further analysis was triggered when our GMMG-study group planned the CONCEPT trial (EudraCT 2016-000432-17) for upfront treatment of previously untreated high-risk myeloma patients [defined by the presence of t(4;14), del17p13, or >3 copies of 1q21 and ISS-stage II or III (19)] with addition of the anti-CD38-antibody isatuximab to intensified treatment. As no data were available, we considered it prudent to investigate whether in a subfraction of high-risk patients CD38-expression might be absent, potentially reducing anti-CD38 treatment efficacy. This is, however, not the case.
It is interesting to briefly discuss the potentially confusing associations of CD38-expression with survival and molecular entities. First, lower CD38-expression is associated independently with faster progression of asymptomatic to symptomatic and symptomatic to relapsed myeloma. At the same time, CD38-expression (according to GEP, the largest cohort analyzed) in symptomatic myeloma showed different patterns of association with adverse prognostic aberrations. Whereas no difference was found for gain of 1q21, lower levels of expression were found for del17p13, in contrast to higher CD38-expression in case of presence of t(4;14) independently for symptomatic myeloma, asymptomatic myeloma, and MGUS. Based on our multivariate analysis, CD38-expression and the chromosomal aberrations del17p13, t(4;14), and gain of 1q21 are independent. Adverse chromosomal aberrations can thus be associated with higher or lower CD38-expression, i.e., the intrinsic prognostic impact of these aberrations is either ameliorated by higher CD38-expression (good prognosis) or aggravated, as for del17p13 and lower CD38-expression (adverse prognosis). Both parameters can thus lead in the same or different prognostic direction. The relative hazard ratio of CD38-expression (symptomatic myeloma, including all cytogenetic entities) was comparable to those by adverse chromosomal aberrations and altered gene expression. In other words, the beneficial effect of high CD38-expression as potential surrogate for less dedifferentiated plasma cells is independent and only partially overcomes (if, in different prognostic direction) the adverse impact of chromosomal aberrations and altered gene expression. Analogously, significantly lower CD38-expression was found for t(11;14) in asymptomatic myeloma, associated in this entity with slower progression (data not shown), and hyperdiploidy in symptomatic patients; here with different prognostic directions: while hyperdiploidy is associated with good/standard risk (50, 51), low CD38-expression is associated with adverse prognosis.
In AL-amyloidosis, we found the opposite association: higher CD38-expression is associated with adverse survival. What are potential explanations? AL-amyloidosis is a different entity. First, treatment regimen can show different outcome in AL-compared to multiple myeloma patients, e.g., t(11;14) carrying AL-amyloidosis patients lack benefit from bortezomib-based treatment (49). Second, prognosis in AL-amyloidosis is mainly driven by the pattern (organotropism) and amount of AL-amyloid deposition, which outweigh malignant plasma cell features (42, 48). The amount of AL-amyloid deposition is driven by the number of malignant plasma cells, their individual light chain production, and the amyloidogeneic potential of an individual patient’s light chains. AL-patients with higher CD38 expression show slightly but significantly higher serum NT-proBNP-levels and thus cardiac involvement. Immunoglobulin or light chain production by malignant plasma cells in turn is significantly lower compared to normal plasma cells and can degrade with evolvement or plasmablastic disease (52). At the same time, we find a downregulation of CD38-expression in malignant compared to normal plasma cells that increases with more advanced stages, in relapse, and HMCLs, i.e., the degree of derangement from normal plasma cells. Patients with advanced disease show a higher frequency of molecular high-risk features, adversely associated with prognosis (13, 53). Taken together, we hypothesize that the higher level of AL-amyloid production per cell in less “abnormal” (differentiated) plasma cells (with concomitantly higher CD38-expression) thus outweighs the potentially beneficial association with a less deranged molecular phenotype.
What do we know about the mechanism of upfront resistance, i.e., why do two-thirds of relapsed/refractory myeloma patients not reach at least a partial remission (1, 4, 5)? From proposed mechanisms, we can first exclude complete absence of CD38-expression in agreement with previous reports of smaller cohorts and mainly relapsed patients (7–9, 11). Second, we show for the first time that expression of a truncated CD38-molecule with removed antibody binding-sequence by alternative splicing does not occur; of the two protein coding transcripts CD38-001 (eight-exon full length) and CD38-005 (truncated), non-CD38-001 transcripts are very rare (see Figure 4). Given that, e.g., daratumumab binds to amino acid (aa) 267–280 at the C-terminal region of human CD38 in combination with aa 233–246 (assessment report EMA/278085/2016), and one of these (aa 233–246) is encoded by both CD38-001 and CD38-005, whereas the other (aa 267–280) is found in CD38-001 only, daratumumab would not bind to the protein transcript encoded by CD38-005. Third, Nijhof et al. have shown that inhibition of the immune response due to the presence of inhibitory cell surface proteins on malignant plasma cells, e.g., CD46, CD55, or CD59, are neither associated with daratumumab-mediated complement-dependent cytotoxicity, nor the clinical response to the antibody (7). These three mechanisms can thus not be the culprit. The likely explanation seems more subtle: relative expression height of CD38 is reported as being important for anti-CD38 activity: in vitro, daratumumab-mediated antibody-dependent cellular and complement-dependent cytotoxicity is associated with expression of CD38 on target cells (54). In vivo, relapsed myeloma patients reaching a partial remission or better vs. responding less to daratumumab-treatment show higher CD38-expression on myeloma cells (7), but no “threshold” for anti-CD38 activity was found. Indeed, we find a two-log variation between CD38-expression in malignant plasma cell dyscrasias, with median expression in none of the entities reaching the level of normal plasma cells. Taken together, these findings suggest an association but no absolute correlation (threshold) of CD38-expression as background of reduced activity.
Relative association of CD38-expression and anti-CD38 response have prompted efforts investigating pharmacological upregulation of CD38 during anti-CD38 exposure, e.g., by using all-trans retinoic acid (54) or panobinostat (55). Median CD38-expression levels significantly below normal plasma cells in all entities in our study give further evidence for potential pharmacological upregulation of CD38 concomitantly with anti-CD38 treatment.
In conclusion, CD38 is expressed in all plasma cell dyscrasias with two-log variation within the entities, though at lower level compared to normal plasma cells. High CD38-expression is associated with lower risk of progression from asymptomatic to symptomatic and symptomatic to relapsed myeloma and better overall survival in the latter two. By contrast, high CD38-expression is prognostically adverse in AL-amyloidosis. Upfront resistance against anti-CD38 treatment is neither mediated by (complete absence) of CD38-expression nor alternative splicing removing the antibody target sequence, but likely only influenced by a gradual difference in expression levels.
Ethics Statement
This study was carried out in accordance with the recommendations of the ethics board of the Medical Faculty Heidelberg. The protocol was approved by the ethics committee (#229/2003, #S-152/2010). All subjects gave written informed consent in accordance with the Declaration of Helsinki.
Author Contributions
Conception and design: DH and AS. Provision of study materials or patients: JH, DH, CK, TD, MH, M-SR, ADH, UH, and SS. Collection and assembly of data: AS, ME, SB, CK, TD, AJ, UH, SS, and DH. Data analysis and interpretation: DH, AS, JH, and SS. Manuscript writing: AS and DH. Final approval of manuscript: all authors.
Conflict of Interest Statement
The authors declare research funding from Sanofi. Sanofi was not involved in the study design, interpretation of data, or writing of the manuscript.
Acknowledgments
The authors would like to thank Maria Dörner, Ewelina Nickel, and Birgit Schneiders for technical assistance in the enrichment of CD138-positive plasma cells, Tomi Bähr-Ivacevic for performing RNA-sequencing, Annekathrin Borowski, Michaela Brough, Michelle Ebentheuer, Mireille Klossek, Desireé Kirn, and Stephanie Pschowski-Zuck for technical assistance in performing iFISH analysis, Sybille Seyfried for assistance in patient documentation, as well as the Genomics Core Facility at EMBL Heidelberg and the Transcriptomics Platform at INSERM Montpellier.
Funding
This work was supported in part by grants from the German Federal Ministry of Education (BMBF) within the framework of the e:Med research and funding concept “CLIOMMICS” under grant number 01ZX1309 and “CAMPSIMM” under grant number 01ES1103, the Deutsche Forschungsgemeinschaft (SFB/TRR79; TP B1, B8, B12, M9), as well as Sanofi. We acknowledge financial support by Deutsche Forschungsgemeinschaft within the funding programme Open Access Publishing, by the Baden-Württemberg Ministry of Science, Research and the Arts and by Ruprecht-Karls-Universität Heidelberg.
Supplementary Material
The Supplementary Material for this article can be found online at https://www.frontiersin.org/articles/10.3389/fimmu.2018.01676/full#supplementary-material.
Footnotes
References
1. Lokhorst HM, Plesner T, Laubach JP, Nahi H, Gimsing P, Hansson M, et al. Targeting CD38 with daratumumab monotherapy in multiple myeloma. N Engl J Med (2015) 373(13):1207–19. doi:10.1056/NEJMoa1506348
2. Dimopoulos MA, Oriol A, Nahi H, San-Miguel J, Bahlis NJ, Usmani SZ, et al. Daratumumab, lenalidomide, and dexamethasone for multiple myeloma. N Engl J Med (2016) 375(14):1319–31. doi:10.1056/NEJMoa1607751
3. Palumbo A, Chanan-Khan A, Weisel K, Nooka AK, Masszi T, Beksac M, et al. Daratumumab, bortezomib, and dexamethasone for multiple myeloma. N Engl J Med (2016) 375(8):754–66. doi:10.1056/NEJMoa1606038
4. Raab MS, Chatterjee M, Goldschmidt H, Agis H, Blau I, Einsele H, et al. A phase I/IIa study of the CD38 antibody MOR202 alone and in combination with pomalidomide or lenalidomide in patients with relapsed or refractory multiple myeloma. Blood (2016) 128(22):1152. Available from: http://www.bloodjournal.org/content/128/22/1152
5. Richter JR, Martin TG, Vij R, Cole C, Atanackovic D, Zonder JA, et al. Updated data from a phase II dose finding trial of single agent isatuximab (SAR650984, anti-CD38 mAb) in relapsed/refractory multiple myeloma (RRMM). J Clin Oncol (2016) 34:abstr 8005. doi:10.1200/JCO.2016.34.15_suppl.8005
6. Kaufman GP, Schrier SL, Lafayette RA, Arai S, Witteles RM, Liedtke M. Daratumumab yields rapid and deep hematologic responses in patients with heavily pretreated AL amyloidosis. Blood (2017) 130(7):900–2. doi:10.1182/blood-2017-01-763599
7. Nijhof IS, Casneuf T, van Velzen J, van Kessel B, Axel AE, Syed K, et al. CD38 expression and complement inhibitors affect response and resistance to daratumumab therapy in myeloma. Blood (2016) 128(7):959–70. doi:10.1182/blood-2016-03-703439
8. Nijhof IS, Groen RW, Noort WA, van Kessel B, de Jong-Korlaar R, Bakker J, et al. Preclinical evidence for the therapeutic potential of CD38-targeted immuno-chemotherapy in multiple myeloma patients refractory to lenalidomide and bortezomib. Clin Cancer Res (2015) 21(12):2802–10. doi:10.1158/1078-0432.CCR-14-1813
9. Lin P, Owens R, Tricot G, Wilson CS. Flow cytometric immunophenotypic analysis of 306 cases of multiple myeloma. Am J Clin Pathol (2004) 121(4):482–8. doi:10.1309/74R4TB90BUWH27JX
10. Lisenko K, Schonland S, Hegenbart U, Wallenwein K, Braun U, Mai EK, et al. Potential therapeutic targets in plasma cell disorders: a flow cytometry study. Cytometry B Clin Cytom (2017) 92(2):145–52. doi:10.1002/cyto.b.21351
11. Robillard N, Wuilleme S, Moreau P, Bene MC. Immunophenotype of normal and myelomatous plasma-cell subsets. Front Immunol (2014) 5:137. doi:10.3389/fimmu.2014.00137
12. Seckinger A, Delgado JA, Moser S, Moreno L, Neuber B, Grab A, et al. Target expression, generation, preclinical activity, and pharmacokinetics of the BCMA-T cell bispecific antibody EM801 for multiple myeloma treatment. Cancer Cell (2017) 31(3):396–410. doi:10.1016/j.ccell.2017.02.002
13. Hose D, Reme T, Hielscher T, Moreaux J, Meissner T, Seckinger A, et al. Proliferation is a central independent prognostic factor and target for personalized and risk adapted treatment in multiple myeloma. Haematologica (2011) 96:87–95. doi:10.3324/haematol.2010.030296
14. Moreaux J, Cremer FW, Reme T, Raab M, Mahtouk K, Kaukel P, et al. The level of TACI gene expression in myeloma cells is associated with a signature of microenvironment dependence versus a plasmablastic signature. Blood (2005) 106(3):1021–30. doi:10.1182/blood-2004-11-4512
15. Seckinger A, Meißner T, Moreaux J, Depeweg D, Hillengass J, Hose K, et al. Clinical and prognostic role of annexin A2 in multiple myeloma. Blood (2012) 120(5):1087–94. doi:10.1182/blood-2012-03-415588
16. Schmitt M, Huckelhoven AG, Hundemer M, Schmitt A, Lipp S, Emde M, et al. Frequency of expression and generation of T-cell responses against antigens on multiple myeloma cells in patients included in the GMMG-MM5 trial. Oncotarget (2017) 8:84847–62. doi:10.18632/oncotarget.11215
17. Seckinger A, Bähr-Ivacevic T, Benes V, Hose D. RNA-sequencing from low-input material in multiple myeloma for application in clinical routine. In: Heuck C, Weinhold N, editors. Multiple Myeloma – Methods and Protocols. 1792. Methods Molecular Biology. New York, NY: Humana Press (2018). p. 97–115. doi:10.1007/978-1-4939-7865-6_7
18. Neben K, Jauch A, Hielscher T, Hillengass J, Lehners N, Seckinger A, et al. Progression in smoldering myeloma is independently determined by the chromosomal abnormalities del(17p), t(4;14), gain 1q, hyperdiploidy, and tumor load. J Clin Oncol (2013) 31(34):4325–32. doi:10.1200/JCO.2012.48.4923
19. Neben K, Lokhorst HM, Jauch A, Bertsch U, Hielscher T, van der Holt B, et al. Administration of bortezomib before and after autologous stem cell transplantation improves outcome in multiple myeloma patients with deletion 17p. Blood (2012) 119(4):940–8. doi:10.1182/blood-2011-09-379164
20. Wu Z, Irizarry RA, Gentleman R, Martinez-Murillo F, Spencer F. A model-based background adjustment for oligonucleotide expression arrays. J Am Stat Assoc (2004) 99:909–17. doi:10.1198/016214504000000683
21. Johnson WE, Li C, Rabinovic A. Adjusting batch effects in microarray expression data using empirical Bayes methods. Biostatistics (2007) 8(1):118–27. doi:10.1093/biostatistics/kxj037
22. Warren P, Taylor D, Martini PGV, Jackson J, Bienkowska J, editors. PANP – a new method of gene detection on oligonucleotide expression arrays. Proceedings of the 7th IEEE International Conference on Bioinformatics and Bioengineering. 2007 Oct 14–17 Boston, MA: IEEE (2007). doi:10.1109/BIBE.2007.4375552
23. Kuiper R, Broyl A, de Knegt Y, van Vliet MH, van Beers EH, van der Holt B, et al. A gene expression signature for high-risk multiple myeloma. Leukemia (2012) 26(11):2406–13. doi:10.1038/leu.2012.127
24. Shaughnessy JD, Zhan F, Burington BE, Huang Y, Colla S, Hanamura I, et al. A validated gene expression model of high-risk multiple myeloma is defined by deregulated expression of genes mapping to chromosome 1. Blood (2007) 109(6):2276–84. doi:10.1182/blood-2006-07-038430
25. Reme T, Hose D, Theillet C, Klein B. Modeling risk stratification in human cancer. Bioinformatics (2013) 29(9):1149–57. doi:10.1093/bioinformatics/btt124
26. Bergsagel PL, Kuehl WM, Zhan F, Sawyer J, Barlogie B, Shaughnessy J. Cyclin D dysregulation: an early and unifying pathogenic event in multiple myeloma. Blood (2005) 106(1):296–303. doi:10.1182/blood-2005-01-0034
27. Dobin A, Davis CA, Schlesinger F, Drenkow J, Zaleski C, Jha S, et al. STAR: ultrafast universal RNA-seq aligner. Bioinformatics (2013) 29(1):15–21. doi:10.1093/bioinformatics/bts635
28. Kersey PJ, Allen JE, Armean I, Boddu S, Bolt BJ, Carvalho-Silva D, et al. Ensembl genomes 2016: more genomes, more complexity. Nucleic Acids Res (2016) 44(D1):D574–80. doi:10.1093/nar/gkv1209
29. Anders S, Pyl PT, Huber W. HTSeq – a Python framework to work with high-throughput sequencing data. Bioinformatics (2015) 31(2):166–9. doi:10.1093/bioinformatics/btu638
30. Robinson MD, McCarthy DJ, Smyth GK. edgeR: a Bioconductor package for differential expression analysis of digital gene expression data. Bioinformatics (2010) 26(1):139–40. doi:10.1093/bioinformatics/btp616
31. Li B, Dewey CN. RSEM: accurate transcript quantification from RNA-Seq data with or without a reference genome. BMC Bioinformatics (2011) 12:323. doi:10.1186/1471-2105-12-323
32. Greipp PR, Miguel JS, Durie BGM, Crowley JJ, Barlogie B, Bladé J, et al. International staging system for multiple myeloma. J Clin Oncol (2005) 23(15):3412–20. doi:10.1200/JCO.2005.04.242
33. Larsen JT, Kumar SK, Dispenzieri A, Kyle RA, Katzmann JA, Rajkumar SV. Serum free light chain ratio as a biomarker for high-risk smoldering multiple myeloma. Leukemia (2013) 27(4):941–6. doi:10.1038/leu.2012.296
34. Perez-Persona E, Vidriales MB, Mateo G, Garcia-Sanz R, Mateos MV, de Coca AG, et al. New criteria to identify risk of progression in monoclonal gammopathy of uncertain significance and smoldering multiple myeloma based on multiparameter flow cytometry analysis of bone marrow plasma cells. Blood (2007) 110(7):2586–92. doi:10.1182/blood-2007-05-088443
35. Kyle RA, Remstein ED, Therneau TM, Dispenzieri A, Kurtin PJ, Hodnefield JM, et al. Clinical course and prognosis of smoldering (asymptomatic) multiple myeloma. N Engl J Med (2007) 356(25):2582–90. doi:10.1056/NEJMoa070389
36. Dispenzieri A, Kyle RA, Katzmann JA, Therneau TM, Larson D, Benson J, et al. Immunoglobulin free light chain ratio is an independent risk factor for progression of smoldering (asymptomatic) multiple myeloma. Blood (2008) 111(2):785–9. doi:10.1182/blood-2007-08-108357
37. Dispenzieri A, Gertz MA, Kyle RA, Lacy MQ, Burritt MF, Therneau TM, et al. Serum cardiac troponins and N-terminal pro-brain natriuretic peptide: a staging system for primary systemic amyloidosis. J Clin Oncol (2004) 22(18):3751–7. doi:10.1200/JCO.2004.03.029
38. Bauer DF. Constructing confidence sets using rank statistics. J Am Stat Assoc (1972) 67(339):687–90. doi:10.1080/01621459.1972.10481279
39. Gentleman RC, Carey VJ, Bates DM, Bolstad B, Dettling M, Dudoit S, et al. Bioconductor: open software development for computational biology and bioinformatics. Genome Biol (2004) 5(10):R80. doi:10.1186/gb-2004-5-10-r80
40. Benjamini Y, Hochberg Y. Controlling the false discovery rate: a practical and powerful approach to multiple testing. J R Stat Soc Ser B (1995) 57(1):289–300.
41. Fleming TR, Harrington DP. Nonparametric estimation of the survival distribution in censored data. Comm Stat Theory Methods (1984) 13(20):2469–86. doi:10.1080/03610928408828837
42. Bochtler T, Hegenbart U, Kunz C, Benner A, Kimmich C, Seckinger A, et al. Prognostic impact of cytogenetic aberrations in AL amyloidosis patients after high-dose melphalan: a long-term follow-up study. Blood (2016) 128(4):594–602. doi:10.1182/blood-2015-10-676361
43. Barlogie B, Tricot G, Rasmussen E, Anaissie E, van Rhee F, Zangari M, et al. Total therapy 2 without thalidomide in comparison with total therapy 1: role of intensified induction and posttransplantation consolidation therapies. Blood (2006) 107(7):2633–8. doi:10.1182/blood-2005-10-4084
44. van Rhee F, Szymonifka J, Anaissie E, Nair B, Waheed S, Alsayed Y, et al. Total therapy 3 for multiple myeloma: prognostic implications of cumulative dosing and premature discontinuation of VTD maintenance components, bortezomib, thalidomide and dexamethasone, relevant to all phases of therapy. Blood (2010) 116:1220–7. doi:10.1182/blood-2010-01-264333
45. Kaplan EL, Meier P. Nonparametric estimation from incomplete observations. J Am Stat Assoc (1958) 53(282):457–81. doi:10.1080/01621459.1958.10501452
46. Harrington DP, Fleming TRA. Class of rank test procedures for censored survival data. Biometrika (1982) 69(3):553–66. doi:10.1093/biomet/69.3.553
47. Mateos MV, Dimopoulos MA, Cavo M, Suzuki K, Jakubowiak A, Knop S, et al. Daratumumab plus bortezomib, melphalan, and prednisone for untreated myeloma. N Engl J Med (2018) 378(6):518–28. doi:10.1056/NEJMoa1714678
48. Merlini G, Seldin DC, Gertz MA. Amyloidosis: pathogenesis and new therapeutic options. J Clin Oncol (2011) 29(14):1924–33. doi:10.1200/JCO.2010.32.2271
49. Bochtler T, Hegenbart U, Kunz C, Granzow M, Benner A, Seckinger A, et al. Translocation t(11;14) is associated with adverse outcome in patients with newly diagnosed AL amyloidosis when treated with bortezomib-based regimens. J Clin Oncol (2015) 33(12):1371–8. doi:10.1200/JCO.2014.57.4947
50. Avet-Loiseau H, Attal M, Moreau P, Charbonnel C, Garban F, Hulin C, et al. Genetic abnormalities and survival in multiple myeloma: the experience of the Intergroupe Francophone du Myelome. Blood (2007) 109(8):3489–95. doi:10.1182/blood-2006-08-040410
51. Chretien ML, Corre J, Lauwers-Cances V, Magrangeas F, Cleynen A, Yon E, et al. Understanding the role of hyperdiploidy in myeloma prognosis: which trisomies really matter? Blood (2015) 126(25):2713–9. doi:10.1182/blood-2015-06-650242
52. Durie BG, Salmon SE. A clinical staging system for multiple myeloma. Correlation of measured myeloma cell mass with presenting clinical features, response to treatment, and survival. Cancer (1975) 36(3):842–54. doi:10.1002/1097-0142(197509)36:3<842::AID-CNCR2820360303>3.0.CO;2-U
53. Hose D, Rème T, Meissner T, Moreaux J, Seckinger A, Lewis J, et al. Inhibition of aurora kinases for tailored risk-adapted treatment of multiple myeloma. Blood (2009) 113(18):4331–40. doi:10.1182/blood-2008-09-178350
54. Nijhof IS, Groen RW, Lokhorst HM, van Kessel B, Bloem AC, van Velzen J, et al. Upregulation of CD38 expression on multiple myeloma cells by all-trans retinoic acid improves the efficacy of daratumumab. Leukemia (2015) 29(10):2039–49. doi:10.1038/leu.2015.123
Keywords: multiple myeloma, amyloidosis, immunotherapy, CD38, alternative splicing, survival
Citation: Seckinger A, Hillengass J, Emde M, Beck S, Kimmich C, Dittrich T, Hundemer M, Jauch A, Hegenbart U, Raab M-S, Ho AD, Schönland S and Hose D (2018) CD38 as Immunotherapeutic Target in Light Chain Amyloidosis and Multiple Myeloma—Association With Molecular Entities, Risk, Survival, and Mechanisms of Upfront Resistance. Front. Immunol. 9:1676. doi: 10.3389/fimmu.2018.01676
Received: 13 March 2018; Accepted: 09 July 2018;
Published: 20 July 2018
Edited by:
Matteo Bellone, San Raffaele Hospital (IRCCS), ItalyReviewed by:
Aristeidis Chaidos, Imperial College London, United KingdomRoberto Ria, University of Bari Medical School, Italy
Copyright: © 2018 Seckinger, Hillengass, Emde, Beck, Kimmich, Dittrich, Hundemer, Jauch, Hegenbart, Raab, Ho, Schönland and Hose. This is an open-access article distributed under the terms of the Creative Commons Attribution License (CC BY). The use, distribution or reproduction in other forums is permitted, provided the original author(s) and the copyright owner(s) are credited and that the original publication in this journal is cited, in accordance with accepted academic practice. No use, distribution or reproduction is permitted which does not comply with these terms.
*Correspondence: Dirk Hose, ZGlyay5ob3NlQG1lZC51bmktaGVpZGVsYmVyZy5kZQ==