Abstract
Aging results in chronic systemic inflammation that can alter neuroinflammation of the brain. Specifically, microglia shift to a pro-inflammatory phenotype predisposing them to hyperactivation upon stimulation by peripheral immune signals. It is proposed that certain nutrients can delay brain aging by preventing or reversing microglial hyperactivation. Butyrate, a short-chain fatty acid (SCFA) produced primarily by bacterial fermentation of fiber in the colon, has been extensively studied pharmacologically as a histone deacetylase inhibitor and serves as an attractive therapeutic candidate, as butyrate has also been shown to be anti-inflammatory and improve memory in animal models. In this study, we demonstrate that butyrate can attenuate pro-inflammatory cytokine expression in microglia in aged mice. It is still not fully understood, however, if an increase in butyrate-producing bacteria in the gut as a consequence of a diet high in soluble fiber could affect microglial activation during aging. Adult and aged mice were fed either a 1% cellulose (low fiber) or 5% inulin (high fiber) diet for 4 weeks. Findings indicate that mice fed inulin had an altered gut microbiome and increased butyrate, acetate, and total SCFA production. In addition, histological scoring of the distal colon demonstrated that aged animals on the low fiber diet had increased inflammatory infiltrate that was significantly reduced in animals consuming the high fiber diet. Furthermore, gene expression of inflammatory markers, epigenetic regulators, and the microglial sensory apparatus (i.e., the sensome) were altered by both diet and age, with aged animals exhibiting a more anti-inflammatory microglial profile on the high fiber diet. Taken together, high fiber supplementation in aging is a non-invasive strategy to increase butyrate levels, and these data suggest that an increase in butyrate through added soluble fiber such as inulin could counterbalance the age-related microbiota dysbiosis, potentially leading to neurological benefits.
Introduction
During healthy aging, there is a disruption in the communication and balance between the brain and immune system. Microglia shift to a pro-inflammatory phenotype that makes them hypersensitive to signals from the peripheral immune system (1, 2). The precise mechanisms during aging that are responsible for this detrimental transition is not known, but overproduction of the pro-inflammatory cytokine interleukin (IL)-1β has been shown to play a role. In a recent study, we demonstrated that aged mice had decreased methylation of the IL-1β gene promoter in primary microglia basally or following systemic lipopolysaccharide (LPS) that is associated with increased IL-1β mRNA (3). This is critical because overproduction of IL-1β can cause cognitive dysfunction in rodent models (4) and increased IL-1β in aged individuals is associated with risk of neurodegenerative diseases such as Alzheimer’s (5).
It is proposed that certain nutrients can manipulate the epigenome to delay brain aging by preventing or reversing microglial aging, potentially through DNA methylation, histone modifications, and their interactions (6). Butyrate, a short-chain fatty acid (SCFA) produced by bacterial fermentation of fiber in the colon, has been extensively studied for its beneficial effects through free fatty acid receptor signaling and metabolic regulation, but also pharmacologically as a histone deacetylase (HDAC) inhibitor. HDAC inhibitors have become an attractive therapeutic candidate due to the ability to increase histone acetylation and promote the expression of neurotrophic and anti-inflammatory genes (7, 8). Although most studies using butyrate have focused on its effects on histone acetylation, there is also evidence that butyrate can affect DNA methylation (9–11).
Sodium butyrate (NaB), the sodium salt form of butyrate, is most commonly used in pharmacological studies and has been shown to decrease pro-inflammatory cytokines of microglia in vitro as well as improve learning and memory in mouse models of neurodegenerative diseases when injected intraperitoneally (i.p.) (12, 13). It has also recently been demonstrated that NaB triggers elongation of microglial processes and can abolish LPS-induced depressive-like behaviors through decreasing microglial activation (14, 15).
To date, only a handful of studies have probed the mechanistic basis surrounding the beneficial neurological effects of a high fermentable fiber diet, which has the capacity to shift SCFA production to favor butyrate (16). Notably, one study found significant immune benefits in the brain of mice fed a high fermentable (soluble) fiber diet and found that they recovered faster from LPS-induced sickness (17). After exposure to LPS, mice fed the soluble fiber diet showed an increase in the IL-1 antagonist, IL-1RA, and a decrease in IL-1β and TNF-α in the brain. Brain IL-4 mRNA was also increased, and as IL-4 expression is enhanced by increased histone acetylation, the authors hypothesized that the elevated butyrate from the dietary fiber fermentation may contribute to the immune response. It is still not fully understood, however, if an increase in butyrate-producing bacteria in the gut as a consequence of soluble fiber diet, could affect microglial activation, and specifically microglial activation in aging.
Short-chain fatty acid concentrations are likely less than optimal in older adults, as data indicate daily dietary fiber intake for both older men and women is roughly 40% below the recommended adequate intake (18). There is also a lower capacity to produce butyrate in the elderly gut microbiome, as suggested by fewer copies of the butyryl-CoA:acetate CoA transferase gene compared with younger adults and lower amounts of bacterial groups which are known butyrate producers (19, 20). Therefore, the aging population is an important demographic for where increased fiber supplementation is needed. Of note, inulin is a soluble dietary fiber that increases butyrate-producing bacteria (21). Inulin belongs to a group of non-digestible carbohydrates called fructans and is considered a prebiotic (22). Studies have specifically demonstrated that inulin is beneficial for age-related inflammation, as a nutritional supplement with inulin increased innate immunity and protection against infections in elderly people (23). Thus, an increase in butyrate through added soluble fiber such as inulin could counterbalance the age-related microbiota dysbiosis, and potentially lead to neurological benefits.
We first determined if direct administration of NaB had beneficial effects on microglia in aged mice with and without an immune challenge. Building on these findings, we investigated whether soluble fiber (inulin) administered to aged mice would promote changes in the microbiome that reduced peripheral inflammation concurrent to decreased neuroinflammation. We hypothesized that NaB administration and a high soluble fiber diet could diminish or even reverse the aged neuroinflammatory phenotype in mice following an immune challenge.
Materials and Methods
Experiment 1: Effects of Intraperitoneal Administration of Sodium Butyrate in Adult and Aged Mice on the Microglial and Hippocampal Response to LPS
Animals
Adult (3- to 6-month olds) and aged (22- to 25-month olds) Balb/c male mice were reared in-house and provided with ad libitum access to chow (Teklad 8640, Harlan Laboratories, Indianapolis, IN, USA) and water. Mice were individually housed in a temperature-controlled environment with a 12-h reversed-phase light/dark cycle (lights on 21:00 h).
Treatment groups comprised the 2 × 2 factorial arrangement of LPS and NaB and were initiated at the onset of the dark cycle. Both Escherichia coli LPS (serotype 0127:B8, Sigma, St. Louis, MO, USA) and NaB (Sigma, St. Louis, MO, USA) were dissolved in sterile saline before experimentation. Mice from both age groups were injected i.p. with either saline (control) or NaB at 1.2 g/kg body weight and 2 h later with saline or LPS at 0.33 mg/kg body weight. This dose of NaB was selected based on previous studies demonstrating significant beneficial effects in other rodent models (12, 24, 25). This dose of LPS was selected based on previous studies demonstrating that 0.33 mg/kg LPS produced prolonged sickness behavior in aged compared with young mice (26). Treatments were administered at 9 a.m. for all cohorts. Body weight was measured at baseline and 4 h after injections as an index of sickness response. All studies were carried out in accordance with United States National Institutes of Health guidelines and approved by the University of Illinois Institutional Animal Care and Use Committee.
Tissue Collection and Microglia Isolation
Animals were euthanized via CO2 asphyxiation and transcardial perfusion with sterile ice-cold saline. Brain tissue (all but the hippocampus which was frozen in dry ice) was collected and used immediately for microglia isolation using a procedure adapted from Nikademova and Watters (27). Brains were enzymatically digested using the Neural Tissue Dissociation Kit (Miltenyi Biotec, Germany) for 35 min at 37°C. Further processing was performed at 4°C. Tissue debris was removed by passing the cell suspension through a 40-µm cell strainer. After myelin removal using 30% Percoll Plus (GE Healthcare, Princeton, NJ, USA), cells in PBS supplemented with 0.5% BSA and 2 mM EDTA were incubated for 15 min with anti-Cd11b magnetic beads (Miltenyi Biotec, Germany). CD11b+ cells were extensively washed and separated in a magnetic field using MS columns (Miltenyi Biotec, Germany) before being directly placed in Trizol reagent (Invitrogen).
RNA Isolation and Real-Time RT-PCR
Total RNA from microglia and hippocampus was isolated using the Tri Reagent protocol (Invitrogen). Synthesis of cDNA was carried out using a high-capacity RT kit (Applied Biosystems, Grand Island, NY, USA) according to the manufacturer’s instructions. Real-time RT-PCR was performed on an ABI PRISM 7900HT-sequence detection system (Perkin Elmer, Forest City, CA, USA). All genes were analyzed using PrimeTime real-time RT-PCR Assays (Integrated DNA Technologies, Coralville, IA, USA) and were compared with the housekeeping control gene GAPDH (Mm99999915_g1) using the calculation method as previously described (28). Recent papers have established that in response to LPS, GAPDH has stable expression levels compared to other housekeeping genes (29). Based on this and on numerous other papers that have reliably used GAPDH (30–32), we chose to use GAPDH as our housekeeping gene. Data are expressed as fold change versus saline control adult mice.
Fluidigm
Total RNA from microglia was isolated using the Tri Reagent protocol (Invitrogen) and synthesis of cDNA was carried out using a high-capacity RT kit (Applied Biosystems) as previously described for real-time RT-PCR. Fluidigm reactions were performed by the UIUC Functional Genomics Unit of the W.M. Keck Center using a 96 × 96 chip and included two technical replicates for each combination of sample and assay. Data were acquired using the Fluidigm Real-Time PCR Analysis software 3.0.2 (Fluidigm, San Francisco, CA, USA). Data from Fluidigm runs were manually checked for reaction quality before analysis, and Ct values for each gene target (see Table 1) were normalized to Ct values for the housekeeping gene Gapdh.
Table 1
| Gene | Assay ID |
|---|---|
| Arg1 | Mm.PT.58.8651372 |
| Casp1 | Mm.PT.58.13005595 |
| CD53 | Mm.PT.58.30699738 |
| CD68 | Mm.PT.58.12034788.g |
| Cx3cr1 | Mm.PT.58.17555544 |
| Dnmt1 | Mm.PT.58.30881142 |
| Dnmt3a | Mm.PT.58.13545327 |
| Dnmt3b | Mm.PT.58.31955137 |
| Dnmt3l | Mm.PT.58.41749889 |
| Ffar2 | Mm.PT.58.32870135 |
| Gadd45b | Mm.PT.58.10699383.g |
| Gapdh | Mm.PT.39a.1 |
| Gfap | Mm.PT.58.31297710 |
| Gpr34 | Mm.PT.58.46001700 |
| Hdac1 | Mm.PT.58.43356830.g |
| Hdac2 | Mm.PT.58.12358619 |
| Hdac3 | Mm.PT.58.11480126 |
| Hdac4 | Mm.PT.58.17651425 |
| Hdac5 | Mm.PT.58.11472897 |
| Hdac6 | Mm.PT.58.16685964 |
| Il-1β | Mm.PT.58.41616450 |
| Il-1rn | Mm.PT.58.43781580 |
| Il-10 | Mm.PT.58.23604055 |
| Il-17 | Mm.PT.58.6531092 |
| Il-23 | Mm.PT.58.10594618.g |
| Il-4 | Mm.PT.58.32703659 |
| Il-6 | Mm.PT.58.13354106 |
| Mct1 | Mm.PT.58.7080950 |
| Mecp2 | Mm.PT.58.13934895.g |
| Muc2 | Mm.PT.58.29496069.g |
| Nlrp3 | Mm.PT.58.13974318 |
| Ocln | Mm.PT.58.30118962 |
| P2ry12 | Mm.PT.58.43542033 |
| P2ry13 | Mm.PT.58.42597879.g |
| Pycard | Mm.PT.56a.42872867 |
| Siglech | Mm.PT.58.45915252 |
| Socs1 | Mm.PT.58.11527306.g |
| Socs3 | Mm.PT.58.7804681 |
| Stat3 | Mm.PT.58.11877007 |
| Tet1 | Mm.PT.58.43326803 |
| Tet2 | Mm.PT.58.30089849 |
| Tet3 | Mm.PT.58.11954119 |
| Tff3 | Mm.PT.58.43353357 |
| Tgfbr1 | Mm.PT.58.10230349 |
| Tjp1 | Mm.PT.58.29459730 |
| Tjp2 | Mm.PT.58.16834535 |
| Tlr2 | Mm.PT.58.45820113 |
| Tlr4 | Mm.PT.58.41643680 |
| Tlr7 | Mm.PT.58.10526075 |
| Tlr8 | Mm.PT.58.16021150 |
| Tmem119 | Mm.PT.58.6766267 |
| Trem2 | Mm.PT.58.7992121 |
| Tnf | Mm.PT.58.12575861 |
Primers used in real-time RT-PCR and Fluidigm experiments.
Experiment 2: Effects of Low and High Soluble Fiber Diets on Central and Peripheral Inflammation in Adult and Aged Mice
Animals and Diet
Adult (3- to 6-month olds) and aged (22- to 25-month olds) male Balb/c mice were housed as described in Experiment 1, but were fed either AIN-93M diet with 5% cellulose (product # D10012M, Research Diets, Inc., New Brunswick, NJ, USA) or one of two AIN-93M modified diets that contained either 1% cellulose (product # D16060605, Research Diets, Inc., New Brunswick, NJ, USA) or 1% cellulose and 5% inulin (product # D16060606, Research Diets, Inc., New Brunswick, NJ, USA) for 4 weeks. Composition of these diets can be seen in Table 2, modified from Research Diets, Inc. Fecal samples were taken from adult and aged mice (on chow) prior to the start of the study to assess the microbiome at baseline. Mice from both age groups were injected i.p. with either saline (control) or LPS at 0.33 mg/kg body weight. Treatments were administered at 9 a.m. for all cohorts. Body weight was measured at baseline and 4 h after injections as an index of sickness response. All studies were carried out in accordance with United States National Institutes of Health guidelines and approved by the University of Illinois Institutional Animal Care and Use Committee.
Table 2
| Product # | D10012M | D16060605 | D16060606 | |||
|---|---|---|---|---|---|---|
| AIN-93M | 10 g cellulose/3,850 kcal | 10 g cellulose + 50 g inulin/3,850 kcal | ||||
| g % | kcal % | g % | kcal % | g % | kcal % | |
| Protein | 14 | 15 | 15 | 15 | 14 | 15 |
| Carbohydrate | 73 | 76 | 76 | 76 | 72 | 74 |
| Fat | 4 | 9 | 4 | 9 | 4 | 9 |
| Total | 100 | 100 | 98 | |||
| kcal/g | 3.85 | 4.01 | 3.88 | |||
| Ingredient | g | kcal | g | kcal | g | kcal |
| Casein | 140 | 560 | 140 | 560 | 140 | 560 |
| l-Cystine | 1.8 | 7 | 1.8 | 7 | 1.8 | 7 |
| Corn starch | 495.692 | 1,983 | 495.692 | 1,983 | 476.942 | 1,908 |
| Maltodextrin 10 | 125 | 500 | 125 | 500 | 125 | 500 |
| Sucrose | 100 | 400 | 100 | 400 | 100 | 400 |
| Cellulose, BW200 | 50 | 0 | 10 | 0 | 10 | 0 |
| Inulin | 0 | 0 | 0 | 0 | 50 | 75 |
| Soybean oil | 40 | 360 | 40 | 360 | 40 | 360 |
| t-Butylhydroquinone | 0.008 | 0 | 0.008 | 0 | 0.008 | 0 |
| Mineral mix S10022M | 35 | 0 | 35 | 0 | 35 | 0 |
| Vitamin mix V10037 | 10 | 40 | 10 | 40 | 10 | 40 |
| Choline bitartrate | 2.5 | 0 | 2.5 | 0 | 2.5 | 0 |
| FD&C yellow dye #5 | 0 | 0 | 0 | 0 | 0 | 0 |
| FD&C red dye #40 | 0 | 0 | 0.05 | 0 | 0.025 | 0 |
| FD&C blue dye #1 | 0 | 0 | 0 | 0 | 0.025 | 0 |
| Total | 1,000 | 3,850 | 960.05 | 3,850 | 991.3 | 3,850 |
| Cellulose (g/kg diet) | 50.0 | 10.4 | 10.1 | |||
| Inulin (g/kg diet) | 0.0 | 0.0 | 50.4 | |||
AIN-93M mature rodent diet and modified AIN-93M diets with 10 g cellulose or 10 g cellulose + 50 g inulin per 3,850 kcal.
Tissue Collection and Microglia Isolation
Four hours after LPS injections, animals were euthanized via CO2 asphyxiation, blood was taken, and animals were perfused with sterile ice-cold saline. Samples were collected from colon, liver, mesenteric lymph nodes, and hippocampus and were frozen on dry ice. Cecal content and feces were also taken for analysis of SFCA concentrations and microbiota compositions, respectively. Distal colon was taken for histological analysis. Brain tissue (all but the hippocampus) was collected and used immediately for microglia isolation as described in Experiment 1.
Bacterial DNA Isolation and 16S rRNA Sequencing
Fecal bacterial DNA was extracted using the PowerLyzer PowerSoil DNA Isolation Kit (MOBIO Laboratories, Inc.) and quality was assessed via gel electrophoresis. The DNA library was constructed using a Fluidigm Access Array system in the Functional Genomics Unit of the Roy J. Carver Biotechnology Center at the University of Illinois at Urbana (UIUC). After library construction, a 250-bp region of the 16S rRNA gene (V4) were amplified using a PCR amplification method modified from Muturi et al. (33). Briefly, DNA samples were diluted to 2 ng/µL and amplified with Roche High Fidelity Fast Start Kit and 20× Access Array loading reagent prior to PCR. Samples were amplified using the following Access Array cycling program 50°C for 2 min (1 cycle), 70°C for 20 min (1 cycle), 95°C for 10 min (1 cycle), followed by 10 cycles at 95°C for 15 s, 60°C for 30 s, and 72°C for 1 min, 2 cycles at 95°C for 15 s, 80°C for 30 s, 60°C for 30 s, and 72°C for 1 min, 8 cycles at 95°C for 15 s, 60°C for 30 s, and 72° for 1 min, 2 cycles at 95°C for 15 s, 80°C for 30 s, 60°C for 30 s, and 72°C for 1 min, 8 cycles at 95°C for 15 s, 60°C for 30 s, and 72°C for 1 min, and 5 cycles at 95°C for 15 s. After PCR, all samples were run on a Fragment Analyzer (Advanced Analytics, Ames, IA, USA). Samples were then pooled in equal amounts according to PCR product concentration. The pooled products were then size selected on a 2% agarose E-gel (Life Technologies) and extracted from the isolated gel slice with Qiagen gel extraction kit (Qiagen). Cleaned size selected products were run on an Agilent Bioanalyzer to confirm appropriate profile and determination of average size. The final library pool was spiked with 10% non-indexed PhiX control library (Illumina®) and sequenced using Illumina® MiSeq® V3 Bulk system. The libraries were sequenced from both ends of the molecules to a total read length of 250 nt from each end. High-quality (>25) sequence data (FASTQ) from the forward read were analyzed with QIIME 2.0 (34). Quality control consisted of depleting or removing barcodes, primers, and short sequences (<187 bp), sequences with ambiguous base calls, and sequences with homopolymer runs exceeding 6 bp. After removal of singletons, OTUs were classified using closed reference picking against Greengenes database at 97% similarity. β-diversity (weighted and unweighted UniFrac distances) were computed at an even sampling depth of 10,048 sequences per sample based on α-diversity (Chao1) rarefaction plots (Figure S1 in Supplementary Material).
SCFA Analysis
Short-chain fatty acids were analyzed by dry matter content as described previously by Panasevich et al. (35), courtesy of the Metabolomics Center at the University of Illinois at Urbana-Champaign. To calculate dry matter percentage, a portion (~0.08–0.15 g) of wet cecal contents were weighed and then heated in oven for 24 h to dry samples. Resulting dry matter percentage was calculated as [weight of dry sample/weight (g) of wet sample (g) × 100]. The rest of the cecal contents (~0.05–0.15 g) were acidified immediately after collection in 6.25% meta-phosphoric acid solution and stored at −20°C until analysis. SCFA concentrations (wet) were determined by gas chromatography by using a gas chromatograph (Hewlett-Packard 5890A Series II) and a glass column (180 cm × 4 mm i.d.), packed with 10% SP-1200/1% H3PO4 on 80/100 + mesh Chromosorb WAW (Supelco, Inc.). Nitrogen was the carrier gas with a flow rate of 75 mL/min. Oven, detector, and injector temperatures were 125°, 175°, and 180°C, respectively. Acetic, n-butyric, and propionic acid solutions (Sigma-Aldrich) were used as standards.
RNA Isolation and Real-Time RT-PCR
Total RNA from microglia, hippocampus, colon, liver, and mesenteric lymph nodes was isolated and synthesis of cDNA was carried out as described in Experiment 1. Real-time RT-PCR was performed also as described in Experiment 1 with the exception that data are expressed as fold change versus control adult mice on AIN-93M diet.
Fluidigm
As described in Experiment 1.
DNA Isolation and Pyrosequencing
Total DNA from microglia and hippocampus tissue was isolated using the Tri Reagent protocol (Invitrogen). DNA methylation for 2 5′—C—phosphate—G—3′ (CpG) sites within the proximal promoter region of IL-1β was assessed via bisulfite pyrosequencing on bisulfite modified DNA (Zymo Research, Irvine, CA, USA). The mouse IL-1β methylation assay (ID ADS3713-RS1) was purchased from EpigenDx (Hopkinton, MA, USA) and has been previously used to assess methylation status in microglia (36). PCRs were run in duplicate and contained 20 ng of bisulfite converted DNA as starting template. Product specificity was determined by gel electrophoresis. The primer was also tested using bisulfite converted DNA from high and low methylation controls (EpigenDx, Hopkinton, MA, USA). Qiagen’s PyroMark Q24 Advanced Pyrosequencer was used to detect DNA methylation levels following manufacturer’s protocols and default settings (Qiagen, Valencia, CA, USA), similar to a previous study (37).
Distal Colon Histology
Distal colon was fixed in Methacarn (60% methanol, 30% chloroform, and 10% acetic acid) for 72 h and then placed in 100% ethanol until tissue embedding. Distal colon tissue was paraffin embedded, and 5-µm sections mounted on glass slides were stained with hematoxylin and eosin (H&E) for assessment of intestinal morphology, courtesy of the Histology Laboratory in the College of Veterinary Medicine at University of Illinois at Urbana-Champaign. Histology was scored by a trained, blinded observer on a modified version of a published scoring (38) system that considers four criteria: inflammatory cell infiltration (0–4), goblet cell mucus depletion (0–4), destruction of architecture (0–4), and crypt abscesses (0–4). Overall histology score was quantified using an aggregate of these scores.
LPS Binding Protein (LBP) Assay
LPS binding protein was quantified in serum samples using the Mouse LBP enzyme-linked immunosorbent assay Kit (catalog #: HK205-02, Hycult Biotech Inc., Plymouth Meeting, PA, USA). The assay was run according to the manufacturer’s instructions.
Statistical Analyses
Body weight, gene expression (including Fluidigm), SCFA analysis, pyrosequencing, colon histology scoring, and LBP data were analyzed using Statistical Analysis System (SAS, Cary, NC, USA) and were subjected to two-way analysis of variance (ANOVA). Where ANOVA revealed a significant interaction (p < 0.05), Fisher’s LSD test was used for post hoc comparisons. Microbiome community compositions (β-diversity; weighted Unifrac) were compared across ages and diets with permutational analysis of variance analysis (PERMANOVA). Next, to unbiasedly identify key features of the gut microbiota that are affected by age and fiber diets, Random Forest (RF) alongside Boruta feature selection was performed. Boruta selection uses RF to iteratively compare importance of independent variables with that of pseudo-random (shadow) attributes (39). Variables “confirmed” by Boruta feature selection had significantly higher RF importance scores than “shadow” attributes and could therefore delineate between diet and age. Analysis was performed on R RF package with 1,000 trees and all other default values. All data are expressed as mean ± SEM.
Results
Sodium Butyrate Downregulates Il-1β Gene Expression in Response to LPS in Adult and Aged Microglia and Hippocampus
To test the effects of NaB on LPS-induced neuroinflammation, adult and aged mice were either pretreated i.p. with saline (SAL) or NaB, and then given an i.p. injection of either SAL or LPS 2 h later. For body weight, LPS-treated adult and aged mice lost more weight than saline-treated controls as expected (main effect of LPS, p = 0.0052 and p < 0.0001), but there was also an interaction (NaB × LPS, p = 0.0391) with the aged mice in that NaB pretreated mice with LPS did not lose as much weight as the SAL pretreated mice with LPS (data not shown).
Fluidigm gene expression analysis on microglia was performed to gain a more comprehensive assessment of microglial gene regulation in response to NaB (Tables S1 and S2 in Supplementary Material). However, there were very few changes associated with NaB in the majority of genes analyzed, so we chose to focus on pro-inflammatory cytokine gene expression (Figures 1A–C). In adult microglia, immune activation by LPS increased Il-1β, and butyrate attenuated Il-1β expression [main effects of LPS (p = 0.0005), NaB (p = 0.0447), and a trending interaction (p = 0.0774)]. An interesting finding was that for aged microglia, there were more pronounced changes in Il-1β in that NaB decreased LPS-induced Il-1β expression [main effects of LPS (p < 0.0001), NaB (p = 0.0497), and an interaction (p = 0.0178)]. LPS increased microglial Tnf in both adult and aged mice (main effects of LPS, p = 0.02 and p = 0.003), and LPS increased microglial Il-6 in only aged mice (main effect of LPS, p < 0.0001).
Figure 1

Microglial and hippocampal gene expression 4 h after SAL/lipopolysaccharide (LPS) i.p. injections in adult and aged mice pretreated with i.p. SAL/NaB. Data are presented as mean ± SEM (n = 7–10) for microglial (A)Il-1β, (B)Tnf, (C)Il-6 and hippocampal (D)Il-1β, (E)Tnf, and (F)Il-6 gene expression. Treatment means with different letters are significantly different at p < 0.05.
Similar changes were also observed in the hippocampus (Figures 1D–F), a brain region that is particularly sensitive to the effects of neuroinflammation (40). In the adult hippocampus, LPS increased Il-1β (main effect of LPS, p = 0.0018). But in the aged hippocampus, LPS increased Il-1β and NaB attenuated LPS-induced Il-1 [main effects of LPS (p < 0.0001), NaB (p = 0.0246), and an interaction (p = 0.0257)]. For hippocampal Tnf and Il-6, LPS increased their expression in both adult and aged mice (main effects of LPS, p = 0.0031 and p < 0.0001, and p = 0.0475 and p = 0.0069), although in aged mice there were trends for a NaB main effect and interaction for Tnf (p = 0.0804 and p = 0.0651).
Significant Shifts in the Microbiome Associated With Age
Microbiome analysis was performed to identify differences between adult and aged mice at baseline. β-diversity analysis revealed that gut microbiota composition was different between adult (3–6 months) and aged (22–25 months) mice fed a normal chow diet (PERMANOVA p < 0.05). RF analysis with Boruta feature selection identified lower levels of Mucuspirillum spp. and Odoribacter spp., and higher levels of in Ruminococcus spp., Coprococcus spp., and Rikenellaceae in aged versus adult mice.
High Soluble Fiber Diet Alters Microbiota and Increases Production of SCFAs
Adult and aged mice were fed either a low fiber (1% cellulose) or high fiber (1% cellulose + 5% inulin) diet for 4 weeks, and microbiome analysis from fecal samples was performed to identify changes from baseline and confirm previous effects of high fiber diet on the microbiome. Mice were injected i.p. with SAL or LPS, but we chose to focus on SAL animals, so all results presented here are in SAL animals unless otherwise stated. For body weight, there were no differences in body weight for age or diet (p > 0.05, data not shown).
β-diversity analysis revealed a robust effect of just 4 weeks of soluble fiber feeding on gut microbiota composition (PERMANOVA p < 0.05; Figure S2 in Supplementary Material). Of note, inulin feeding led to lower abundances of Ruminococcus spp. and f. Rikenellaceae, two taxa that were more highly represented in aged mice fed a chow diet (Figure 2). Cecal contents were analyzed for SCFA concentrations to assess the magnitude and profile of fermentation end products (Figure 3). Inulin feeding led to an increase in cecal acetate (p = 0.0066), butyrate (p = 0.009), and total SCFAs (p = 0.0107), irrespective of age. Propionate concentrations were not responsive to diet nor affected by age (p > 0.05; Figure 3C).
Figure 2

Random forest analysis with Boruta feature identifies eight bacterial genera within the fecal microbiome that discriminate between adult and aged mice fed a normal chow diet. N = 20 per group. Scale represents relative abundance.
Figure 3
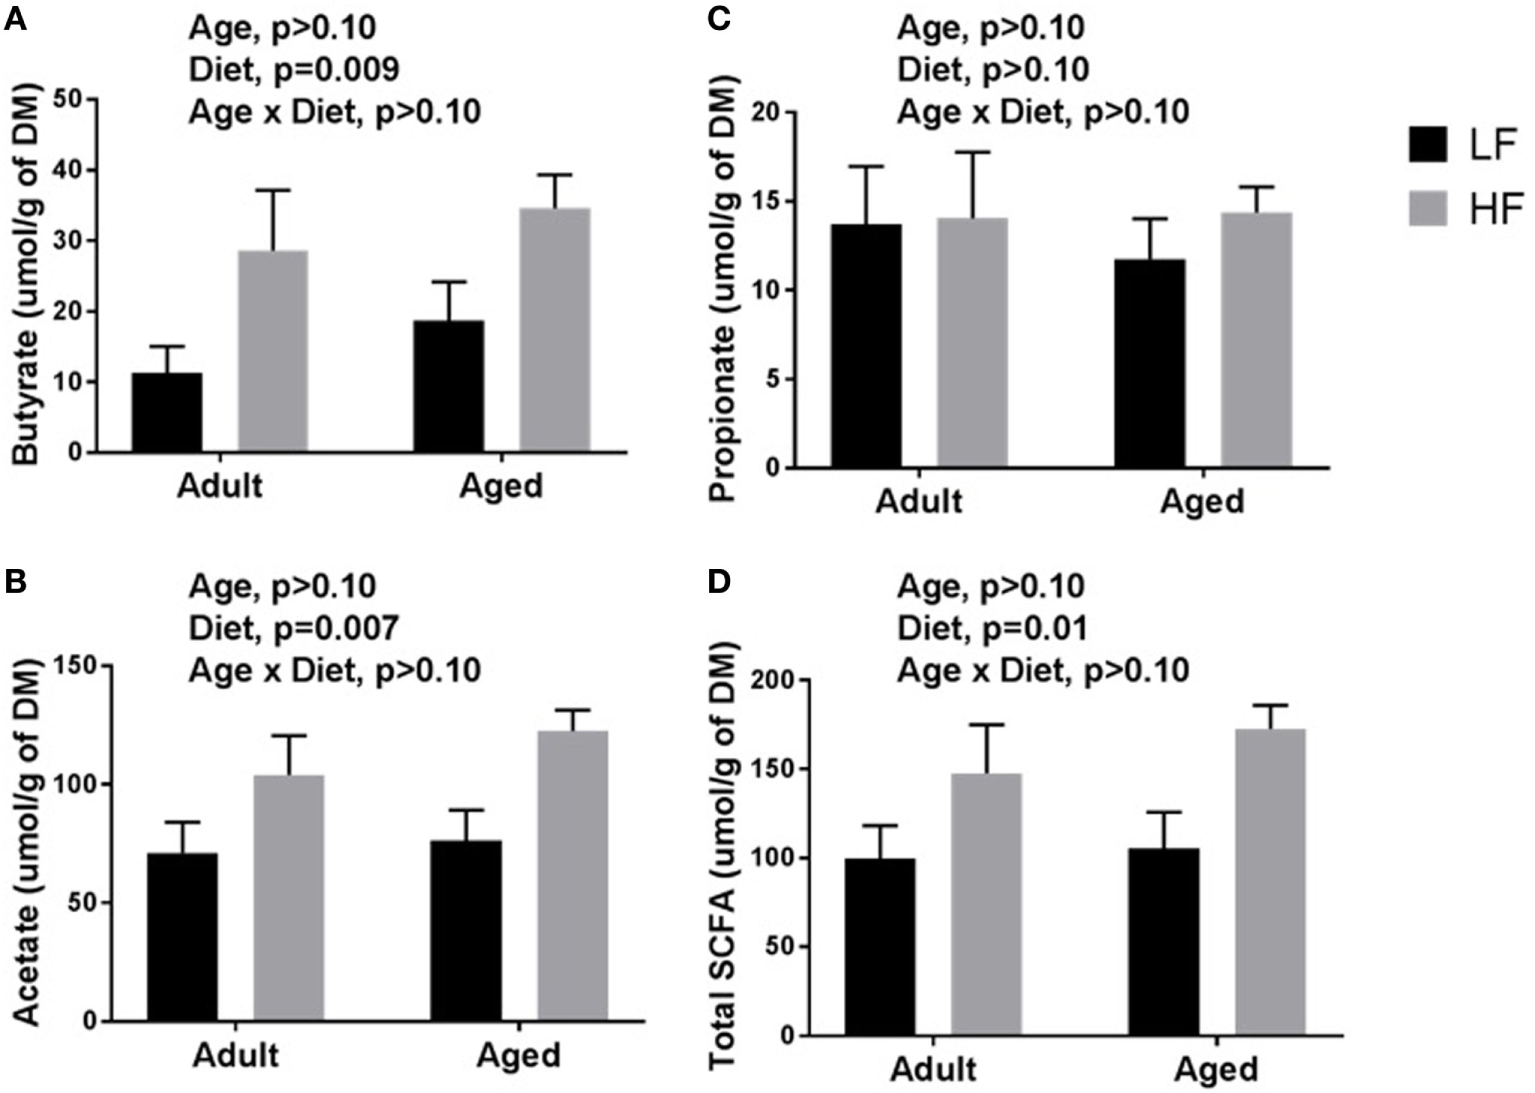
Cecal content concentrations of (A) butyrate, (B) acetate, (C) propionate, and (D) total short-chain fatty acids (SCFAs) in adult and aged mice fed a LF (1% cellulose) or HF (1% cellulose and 5% inulin) diet. Data are presented as mean ± SEM (n = 6–8).
Soluble Fiber Diet Reduces Colonic Inflammation but Does Not Rescue Signs of Systemic Endotoxemia in Aged Mice
Since we observed changes in the microbiome and SCFA analysis with adult and aged mice fed different fiber diets, we hypothesized that high fiber would reduce signs of inflammation within the periphery. Representative images of the cecum and colon from mice fed low fiber and high fiber diets revealed increased cecal size with the high fiber diet, indicative of increased fermentation (Figure 4A). Distal colon samples were stained with H&E to examine morphological changes due to age and fiber diet. Representative pictures (Figures 4B,C) indicated severe inflammation associated with immune infiltration in aged animals on a low fiber diet. Scoring of histology sections for inflammatory infiltrate reveal that there was a main effect of diet (p = 0.0499) and an interaction (p = 0.0499) in that aged mice on the high fiber diet had decreased inflammatory infiltrate, with scoring not significantly different from either low fiber or high fiber adult groups (Figure 4D). With regards to total histological scoring, there was a trending main effect for diet (p = 0.088) in that diet decreased total score (Figure 4E). Lastly, we assessed LBP in serum of adult and aged animals fed low and high fiber diets as an indirect measure of gut permeability (41). LBP was increased by age (p = 0.0298) which matches previous findings from our lab (unpublished results), but no significant effect of diet (Figure 4F).
Figure 4
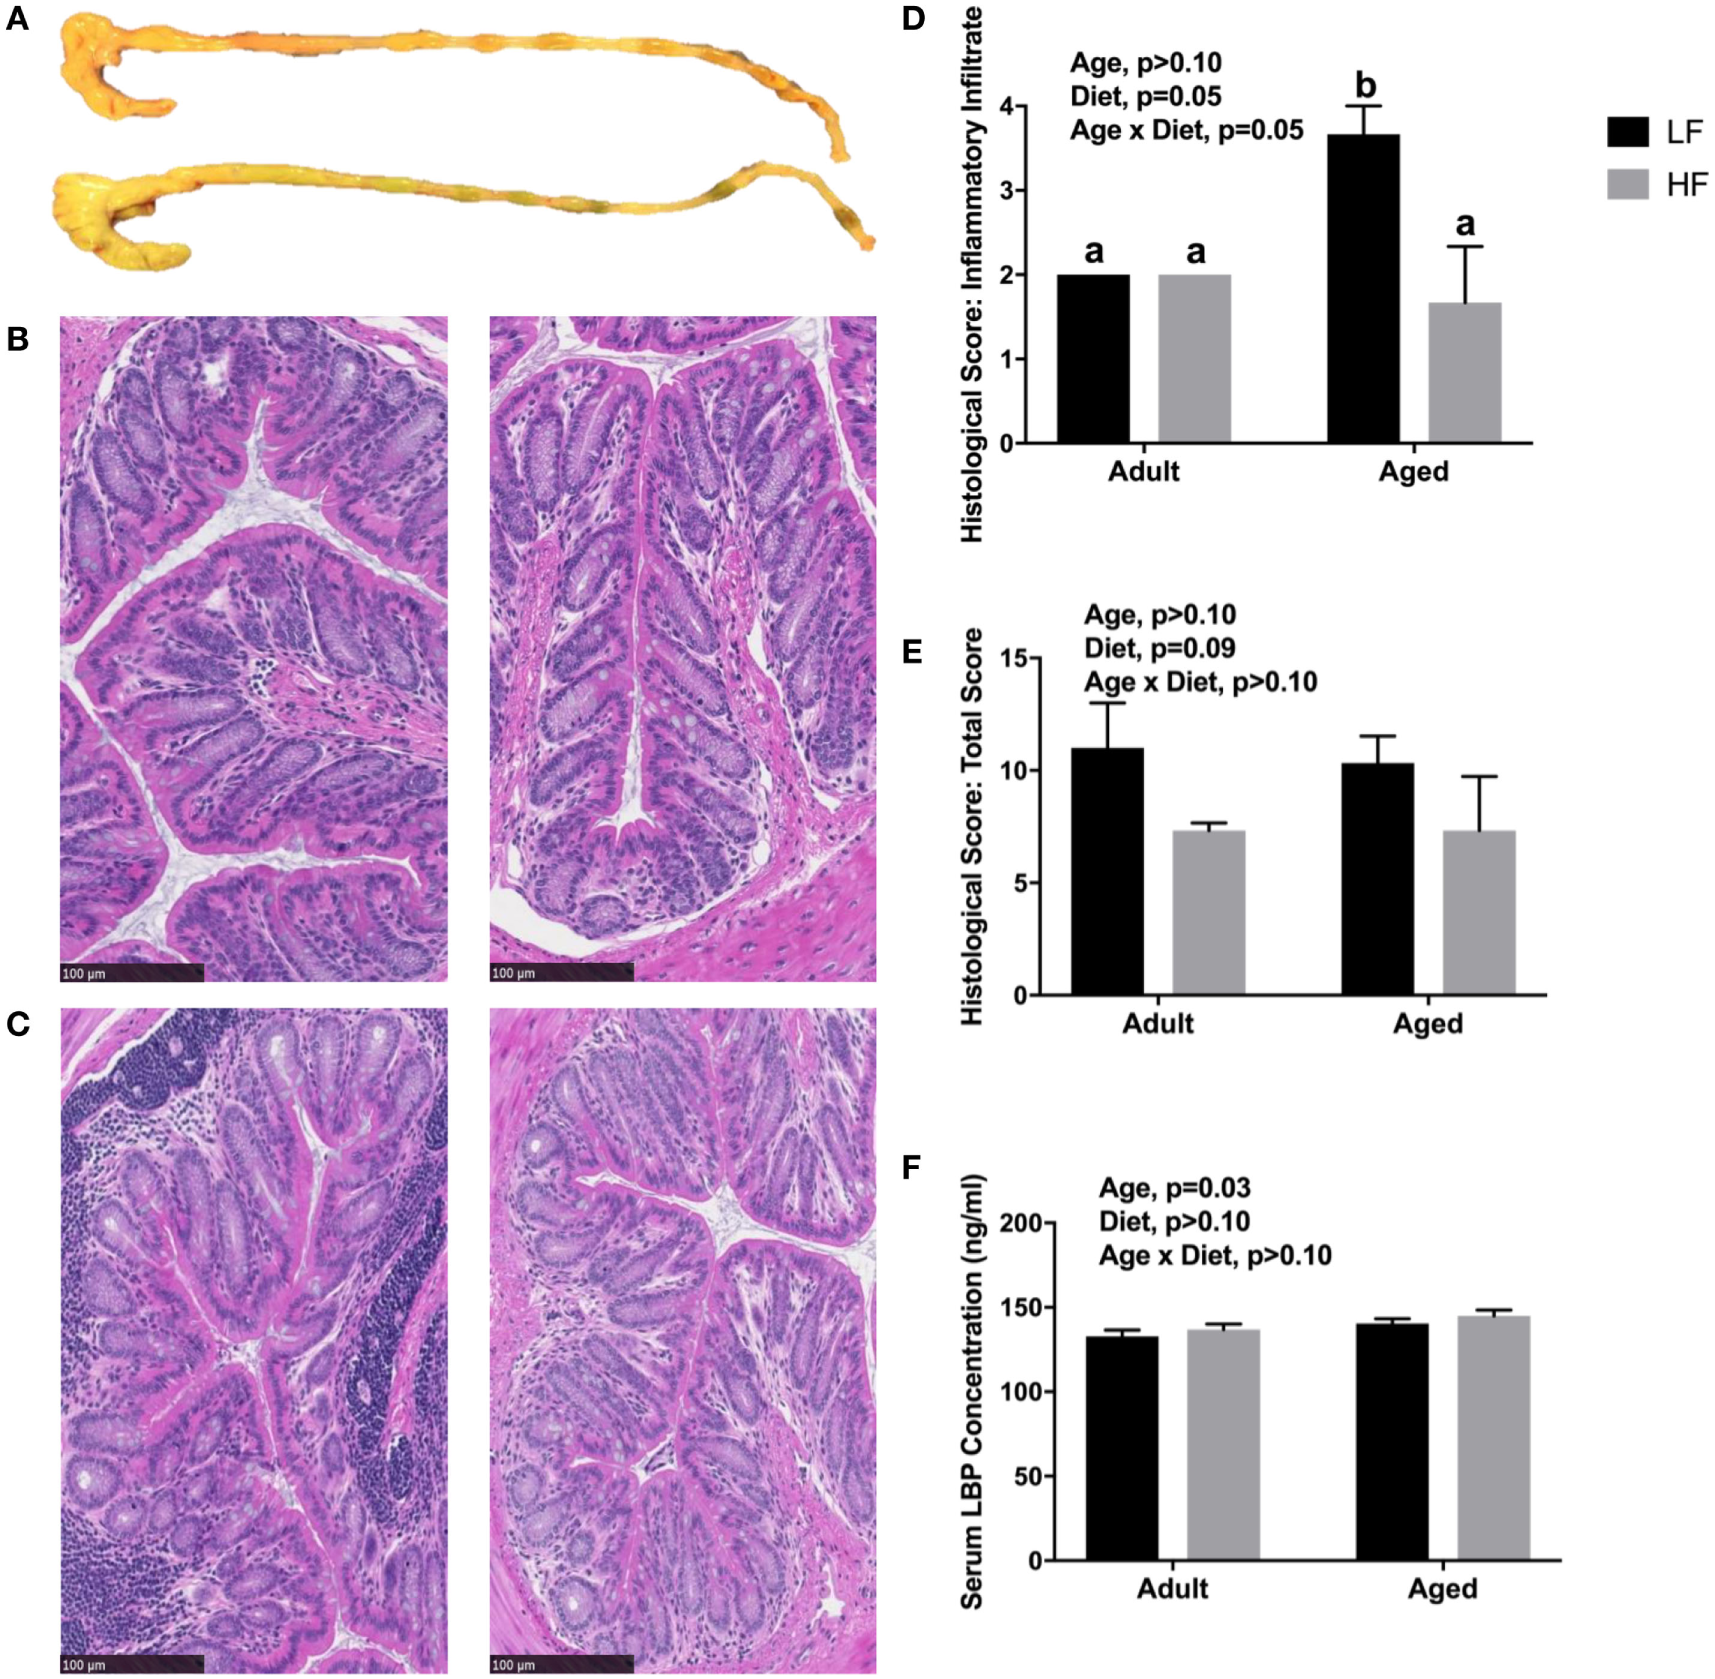
(A) Representative images of cecum and colon in mice fed either a low (top) or high (bottom) fiber diet. Representative sections of the distal colon of 4-month-old (B) and 24-month-old (C) mice fed either a low (left) or a high (right) diet. Sections were stained with hematoxylin and eosin. Scale bar = 100 µM. Blinded histological scoring of distal colons: (D) inflammatory cell infiltration (score 0–4) and (E) total histology score (0–16) [includes aggregate scores of inflammatory cell infiltration (0–4), goblet cell mucus depletion (0–4; data not shown), destruction of architecture (0–4; data not shown), and crypt abscesses (0–4; data not shown)]. Data are presented as mean ± SEM (n = 3). Bars with no SEM indicate identical scoring for all mice in the group. Treatment means with different letters are significantly different at p < 0.05. (F) Serum LPS binding protein (LBP) measured in adult and aged mice fed low or high fiber diets. Data are presented as mean ± SEM (n = 7–9).
Tight Junctions Regulating Colonic Barrier Function Are Higher in Aged Mice Fed a High Fiber Diet
Butyrate and other SCFAs exert their effects through HDAC inhibition, but are also used as an energy source and can bind G protein-coupled receptors (GPCRs) that are involved in the resolution of inflammation in the gut (42). Therefore, gene expression for the pro-inflammatory cytokines Il-1β and Tnf, other inflammatory regulators including Il-10 and Il-1rn, Il-17, and Il-23, the HDAC Hdac3, tight junction proteins/intestinal markers Tjp1, Tjp2, Tff3, Ocln, Mct1, and Muc2, as well as the FFARs Ffar2 and Gpr109a were measured in colon (Figure 5A). There were no significant differences in any of the genes analyzed in adult mice (data not shown), so we chose to focus on aged animals. Surprisingly, there were no effects of diet on pro-inflammatory gene expression, but there was an effect of diet for Tjp2 (p = 0.0396) and Ffar2 (p = 0.0319). There were also trending effects of diet for Tjp1 (0.0738) and Ocln (p = 0.0857). Gene expression for the pro-inflammatory cytokines Il-1β, Tnf, and Il-6 were assessed in lymph nodes and liver, but there were no differences between low fiber and high fiber groups in adult (data no shown) or aged mice (Figure 5B). However, numerically there was lower expression of the pro-inflammatory cytokines in lymph nodes of aged animals on the high fiber diet.
Figure 5
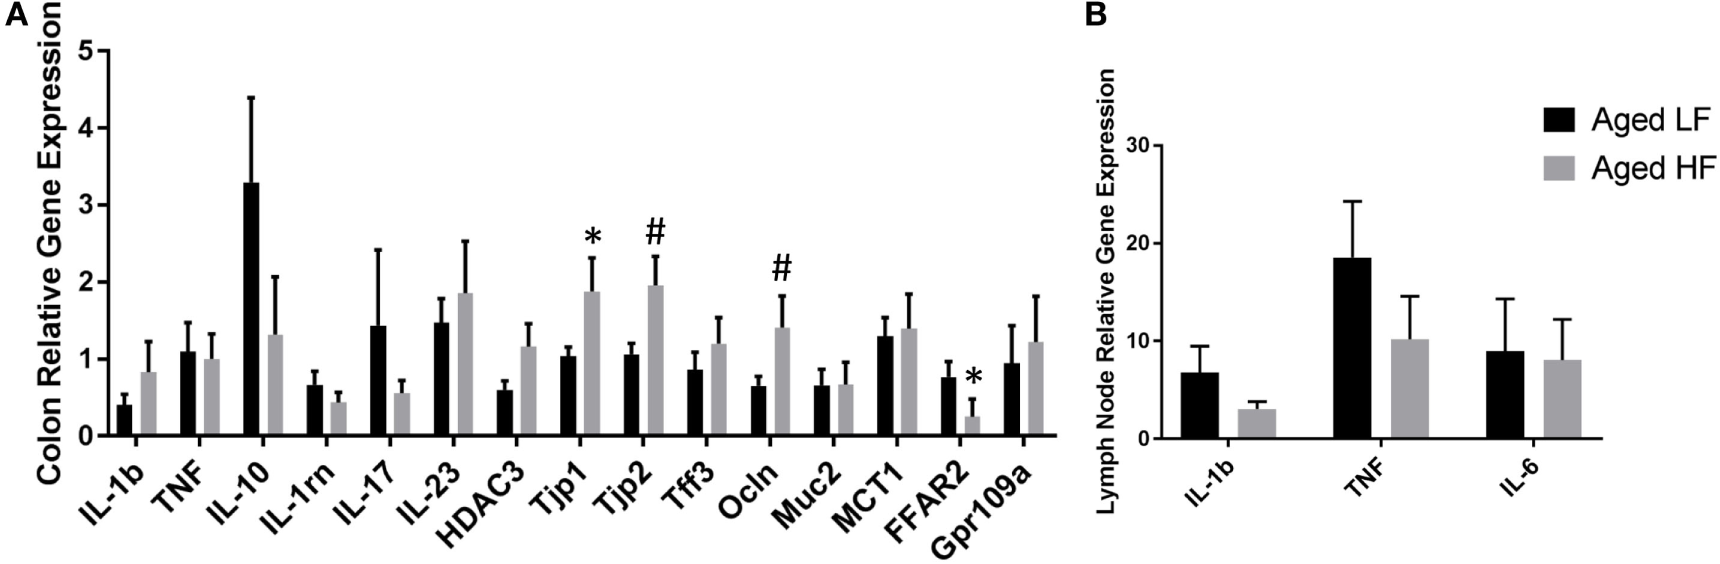
Gene expression of (A) colon and (B) lymph nodes from aged mice fed either a low or high fiber diet. Data are presented as mean ± SEM (n = 5–7). * indicates significance at p < 0.05 and # indicates significance at p < 0.1.
Fiber Alters Expression of Inflammatory, Sensome, and Epigenetic Regulator Genes in Adult and Aged Microglia
We next wanted to determine whether beneficial changes in the periphery through high fiber diet could affect microglial gene regulation (Figure 6A). For inflammatory and regulators of inflammatory genes, Fluidigm analysis indicated that there were a number of significant main effects of diet in that high fiber decreased gene expression (Il-1β, Il-1rn, Il-6, Nlrp3, Tlr4, and Tnf) (Table 3). For sensome genes, there were main effects of diet for all genes analyzed (Table 3), as well as an interaction with Trem2 in which aged mice on the low fiber diet had the highest expression but decreased to levels similar to the adult groups with the high fiber diet. For epigenetic regulator genes, there were also main effects of almost all genes analyzed, in that high fiber decreased expression (Table 3). Of note, some epigenetic regulator genes were affected by age similar to what has been demonstrated previously (Hdac1 and Gadd45b) (3).
Figure 6

(A) Heat map visualization of relative expression of genes in microglia analyzed by Fluidigm. Microglia were collected from adult and aged mice fed a LF (1% cellulose) or HF (1% cellulose and 5% inulin) diet. Hippocampal (B)Il-1β, (C)Tnf, (D)Il-6 gene expression and DNA methylation of the Il-1β promoter at (E) CpG1 and (F) CpG2. Data are presented as mean ± SEM (n = 6–8).
Table 3
| p-Values | |||||||
|---|---|---|---|---|---|---|---|
| Gene | Adult LF | Adult HF | Aged LF | Aged HF | Age | Diet | Age × DIET |
| (A) Inflammatory and regulators of inflammatory genes | |||||||
| Casp1 | 1.10 ± 0.15 | 0.68 ± 0.12 | 1.28 ± 0.15 | 0.59 ± 0.09 | 0.734 | <0.0001* | 0.315 |
| Cd68 | 1.80 ± 0.32 | 1.27 ± 0.22 | 3.24 ± 0.46 | 1.42 ± 0.32 | 0.025* | 0.0012* | 0.067 |
| Cx3cr1 | 1.38 ± 0.22 | 0.96 ± 0.21 | 1.46 ± 0.23 | 0.72 ± 0.17 | 0.695 | 0.0079* | 0.447 |
| HIF-1α | 1.96 ± 0.35 | 1.89 ± 0.59 | 2.74 ± 0.33 | 0.85 ± 0.15 | 0.753 | 0.019* | 0.028* |
| Ido1 | 1.37 ± 0.21 | 0.94 ± 0.27 | 1.26 ± 0.17 | 0.76 ± 0.16 | 0.491 | 0.0279* | 0.872 |
| Igf1 | 0.49 ± 0.09 | 0.68 ± 0.22 | 1.95 ± 0.30 | 0.74 ± 0.15 | 0.0013* | 0.0276* | 0.0027* |
| Il-1β | 1.91 ± 0.30 | 1.30 ± 0.29 | 6.34 ± 0.68 | 4.03 ± 0.84 | <0.0001* | 0.012* | 0.134 |
| Il-1rn | 0.48 ± 0.06 | 0.25 ± 0.07 | 3.35 ± 3.51 | 1.26 ± 0.19 | <0.0001* | 0.0002* | 0.0023* |
| Il-10 | 0.70 ± 0.18 | 2.22 ± 0.64 | 2.57 ± 0.48 | 1.07 ± 0.32 | 0.512 | 0.989 | 0.0094* |
| Il-6 | 1.62 ± 0.17 | 1.08 ± 0.23 | 1.63 ± 0.17 | 0.70 ± 0.14 | 0.327 | 0.0002* | 0.300 |
| Niarc1 | 1.44 ± 0.15 | 1.13 ± 0.08 | 2.65 ± 0.30 | 1.46 ± 0.20 | 0.0002* | 0.0004* | 0.0293* |
| Nlrp3 | 2.24 ± 0.27 | 1.55 ± 0.39 | 3.87 ± 0.56 | 1.57 ± 0.40 | 0.060 | 0.001* | 0.066 |
| Pycard | 1.58 ± 0.25 | 0.93 ± 0.19 | 1.87 ± 0.25 | 0.91 ± 0.19 | 0.539 | 0.0007* | 0.506 |
| Socs1 | 1.30 ± 0.08 | 1.29 ± 0.05 | 0.93 ± 0.11 | 1.14 ± 0.06 | 0.0022* | 0.246 | 0.187 |
| Socs3 | 1.71 ± 0.30 | 1.11 ± 0.27 | 2.27 ± 0.44 | 1.60 ± 0.51 | 0.181 | 0.105 | 0.918 |
| Stat3 | 1.03 ± 0.16 | 0.72 ± 0.13 | 1.04 ± 0.13 | 0.58 ± 0.10 | 0.617 | 0.0051* | 0.577 |
| Tlr2 | 1.21 ± 0.19 | 0.73 ± 0.14 | 2.24 ± 0.33 | 1.04 ± 0.22 | 0.0048* | 0.0006* | 0.125 |
| Tlr4 | 1.40 ± 0.17 | 0.85 ± 0.18 | 1.31 ± 0.17 | 0.67 ± 0.13 | 0.419 | 0.0006* | 0.762 |
| Tlr7 | 1.35 ± 0.14 | 1.02 ± 0.24 | 1.35 ± 0.17 | 0.65 ± 0.11 | 0.302 | 0.0048* | 0.293 |
| Tlr8 | 2.10 ± 0.46 | 2.30 ± 0.59 | 8.72 ± 1.55 | 2.60 ± 0.52 | 0.089 | 0.113 | 0.013* |
| Tnf | 2.09 ± 0.29 | 1.46 ± 0.47 | 6.42 ± 0.93 | 3.17 ± 1.03 | 0.0001* | 0.011* | 0.081 |
| (B) Sensome genes | |||||||
| Cd53 | 2.67 ± 0.59 | 1.40 ± 0.28 | 2.53 ± 0.47 | 1.08 ± 0.21 | 0.602 | 0.003* | 0.851 |
| Gpr34 | 1.46 ± 0.16 | 0.87 ± 0.22 | 1.26 ± 0.15 | 0.54 ± 0.11 | 0.119 | 0.0003* | 0.698 |
| P2ry12 | 1.05 ± 0.22 | 1.05 ± 0.22 | 1.29 ± 0.17 | 0.60 ± 0.11 | 0.134 | 0.005* | 0.267 |
| P2ry13 | 1.66 ± 0.28 | 1.26 ± 0.30 | 1.95 ± 0.31 | 0.87 ± 0.21 | 0.876 | 0.011* | 0.231 |
| Siglech | 1.43 ± 0.16 | 0.81 ± 0.18 | 1.18 ± 0.14 | 0.54 ± 0.11 | 0.089 | <0.0001* | 0.933 |
| Tgfbr1 | 1.84 ± 0.32 | 1.14 ± 0.22 | 2.10 ± 0.28 | 0.81 ± 0.19 | 0.891 | 0.0003* | 0.262 |
| Tmem119 | 2.15 ± 0.38 | 1.36 ± 0.38 | 2.36 ± 0.34 | 0.82 ± 0.25 | 0.636 | 0.0014* | 0.283 |
| Trem2 | 2.80 ± 0.61 | 1.82 ± 0.33 | 6.23 ± 1.04 | 1.99 ± 0.53 | 0.011* | 0.0004* | 0.021* |
| (C) Epigenetic regulator genes | |||||||
| Dnmt3a | 1.28 ± 0.19 | 0.83 ± 0.18 | 1.49 ± 0.18 | 0.77 ± 0.16 | 0.681 | 0.0019* | 0.456 |
| Dnmt3b | 2.01 ± 0.31 | 0.96 ± 0.20 | 1.41 ± 0.21 | 0.63 ± 0.12 | 0.046* | 0.0002* | 0.566 |
| Gadd45b | 1.01 ± 0.12 | 0.81 ± 0.22 | 3.04 ± 0.35 | 1.60 ± 0.40 | <0.0001* | 0.006* | 0.033* |
| Hdac1 | 1.11 ± 0.02 | 0.95 ± 0.07 | 0.83 ± 0.04 | 0.82 ± 0.03 | <0.0001* | 0.068 | 0.106 |
| Hdac2 | 1.67 ± 0.30 | 1.00 ± 0.22 | 1.87 ± 0.23 | 0.63 ± 0.14 | 0.704 | 0.0001* | 0.224 |
| Hdac3 | 1.22 ± 0.17 | 0.94 ± 0.18 | 1.50 ± 0.20 | 0.71 ± 0.12 | 0.855 | 0.0029* | 0.145 |
| Hdac4 | 2.20 ± 0.47 | 1.27 ± 0.33 | 2.25 ± 0.38 | 0.93 ± 0.73 | 0.699 | 0.0037* | 0.595 |
| Hdac5 | 2.13 ± 0.38 | 1.48 ± 0.41 | 3.18 ± 0.65 | 2.60 ± 1.04 | 0.100 | 0.350 | 0.957 |
| Hdac6 | 1.91 ± 0.27 | 1.38 ± 0.39 | 1.86 ± 0.29 | 0.74 ± 0.17 | 0.256 | 0.0085* | 0.331 |
| Mecp2 | 1.13 ± 0.17 | 0.77 ± 0.16 | 1.13 ± 0.17 | 0.54 ± 0.10 | 0.429 | 0.0019* | 0.457 |
| Tet1 | 1.49 ± 0.17 | 1.01 ± 0.20 | 1.09 ± 0.15 | 0.44 ± 0.09 | 0.004* | 0.001* | 0.609 |
| Tet2 | 1.75 ± 0.27 | 1.22 ± 0.23 | 1.97 ± 0.24 | 0.64 ± 0.10 | 0.422 | 0.0001* | 0.080 |
| Tet3 | 3.54 ± 0.70 | 1.90 ± 0.50 | 5.55 ± 1.09 | 5.55 ± 2.23 | 0.021* | 0.488 | 0.489 |
Expression of (A) inflammatory, (B) sensome, and (C) epigenetic regulator genes in microglia collected from adult and aged mice fed low or high fiber diets.
Data are presented as mean ± SEM (n = 7–10) and p-values for main effects of age and diet as well as age × diet interactions are also included.
*indicates significance at p < 0.05.
We also wanted to determine if the increased peripheral butyrate as a result of a fiber diet is related to central anti-inflammatory effects. Here, we observed that microglial expression of Il-1β, Tnf, and Il-6 inversely associated with cecal butyrate concentrations (data not shown). However, higher acetate and total SCFA concentrations were also inversely associated with Il-1β, Tnf, and Il-6, and propionate was only significantly correlated with Il-1β (data not shown).
Fiber Does Not Alter Expression of Inflammatory Genes or Il-1β DNA Methylation in Adult and Aged Hippocampus
Only main effects of age were observed in the hippocampus of adult and aged mice fed low and high fiber diets, in that age increased pro-inflammatory gene expression (Il-1β, p = 0.0074, Tnf, p = 0.0145, and Il-6, p > 0.05) (Figures 6B–D). Recently, it has been found that SCFA can modify not only histone modifications, but also DNA methylation. Therefore, we chose to assess the effects of fiber diet on DNA methylation patterns within the brain. Due to low DNA yield, we were not able to assess Il-1β DNA methylation in microglia. However, in the hippocampus (Figures 6E,F), analysis of Il-1β DNA methylation revealed a main effect of age in Il-1β CpG1 (p = 0.0395). There were no changes in Il-1β CpG2.
Differences in Central Immunoreactivity Is Minimal Between Mice Fed Low and High Fiber Diets
For Experiment 2, a separate cohort of mice was injected i.p. with LPS to characterize differences in immune stimulus associated with diet. LPS decreased body weight as expected (1–2 g on average, data not shown), differences in body weight existed with respect to age or diet (p > 0.05, data not shown).
Fluidigm analysis from microglia is shown in Table S3 in Supplementary Material. Interestingly, the majority of the diet main effects and interactions were seen in the sensome (Cd53, Siglech, P2ry12, P2ry13, Trem2, and Tmem119). For the hippocampus, only one main effect of age was observed in adult and aged mice fed low and high fiber diets (Il-1β, p = 0.0325, Tnf, p = > 0.05, and Il-6, p > 0.05) (Figure S3 in Supplementary Material). Due to low DNA yield, we were not able to assess Il-1β DNA methylation in microglia. However, in the hippocampus (Figure S3 in Supplementary Material), analysis of Il-1β DNA methylation revealed a main effect of age in Il-1β CpG2 (p = 0.001) and an interaction (p = 0.0064) in that aged mice had less DNA methylation than both adult groups but adult mice with the high fiber diet had increased DNA methylation compared with adult mice with the low fiber diet. There were no differences as a result of diet and age in Il-1β CpG1. With regards to the periphery, colon, lymph nodes, and liver gene expression were analyzed in the same way as Figure 5. The only effect of diet was Ffar2 colon gene expression (p = 0.0179), in that Ffar2 increased in aged animals with the high fiber compared with the low fiber diet (Figure S4 in Supplementary Material). There were also no differences in LBP (Figure S3 in Supplementary Material).
Discussion
These studies tested the hypotheses that (1) peripheral administration of NaB attenuates basal inflammation and immune reactivity in aged microglia, (2) a high soluble fiber diet, through production of butyrate, attenuates peripheral and central inflammation associated with aging, and that (3) a high soluble fiber diet attenuates aging-induced microglial hyperactivity observed in response to an immune challenge.
First, we demonstrated that LPS-induced Il-1β gene expression was decreased in microglia and hippocampus in NaB-pretreated aged mice. There were similar trends in adult mice, but surprisingly, effects were much more pronounced in the aged. It has been found in other models that aged animals are more responsive to the effects of butyrate (24, 43), and it is suggested that divergent gene expression and behavioral patterns in adult and aged animals from HDACi treatment may be due to differential chromatin modifications within the brain (44). Furthermore, as some of these effects of butyrate occur with improvements in metabolism, it may be possible that benefits are more pronounced in the aged because butyrate is able to counteract aspects of age-related metabolic dysfunction that is not seen in adult animals. Nonetheless, our results support the hypothesis that butyrate can attenuate pro-inflammatory cytokine expression in microglia, similar to previous findings (7, 8). Because NaB exerted an anti-inflammatory effect on microglia in our aged mouse model, we wanted to determine whether an increase in butyrate through a high soluble fiber diet had the potential to alter neuroinflammation.
It has previously been observed that there are distinct microbiomes in aged versus young mice, a finding that has been reported to be related to aging-induced inflammation (45, 46). Of note, there were lower levels of Mucuspirillum spp. and Odoribacter spp., and higher levels of in Ruminococcus spp., Coprococcus spp., and Rikenellaceae in aged versus adult mice, even though the mice were from the same colony, maintained in the same room, and fed an identical diet. Higher levels of Ruminococcus spp. have been observed in elderly humans and were associated with high frailty scores (47), while higher levels of Rikenellaceae have been shown in aged mice compared with adult mice (48). Interestingly, high fiber diets decreased both Ruminococcus spp. and Rikenellaceae, indicative of a potential beneficial effect. Surprisingly, we saw no differences in the butyryl-CoA:acetate CoA transferase (data not shown), a gene that is thought to be a valuable marker for gastrointestinal microbiota function and increased butyrate production/butyrate-producing bacteria (20). However, SCFA analysis revealed higher acetate and butyrate production in response to a high fiber diet irrespective to any significant changes in SCFA producing genes. This discrepancy in results may be due to the fact that mice were only on low and high fiber diets for 4 weeks. A longer diet intervention may be necessary for more pronounced changes in SCFA gene abundance. Furthermore, since SCFAs are essential metabolic regulators of the microbiome, intermediary metabolites such as lactate and succinate should also be considered to play a role, and optimizing SCFA production may require other dietary manipulations (49).
Colon histology revealed significant immune infiltration within the colon lamina propria of mice fed a lower-fiber diet, while aged mice on the high fiber diet exhibited relatively lower inflammatory infiltrate. Such an effect was not observed in adult mice. This demonstrates that a low fiber diet creates an inflammatory environment that is more pronounced in aged, and that a high fiber diet has the potential to limit colonic inflammation.
A surprising finding was that although fiber led to attenuated pro-inflammatory gene expression in the brain, these findings were not directly mirrored in the colon, lymph nodes, or liver. This could be due to length of the diet, or to the heterogeneous mix of cells within these tissues. Interestingly, in a recent study with pigs, oral NaB after 4 weeks changed regional brain glucose metabolism and hippocampal neurogenesis, with little effects on the gut, demonstrating CNS-specific effects due to butyrate (50). There were, however, effects of diet in the colon for Tjp2 and trending effects for Tjp1 and Ocln in that high fiber diet increased all of the genes, indicating a potential beneficial change in gut permeability. These findings concur with previous studies indicating the ability of butyrate to upregulate tight junction proteins (51). There was also a significant decrease in Ffar2, which may be related to decreased neutrophil infiltration (52). Emerging evidence indicates that the microbiome regulates neutrophil homeostasis and specifically that SCFAs regulates neutrophil-mediated inflammation (53). Moreover, with the greater understanding of neutrophil populations within the brain (54), and the fact that neutrophils have been demonstrated to promote Alzheimer’s like pathology and cognitive decline (55), this cell type is likely to play an important role in cell trafficking in response to SCFAs in the brain. Further studies are warranted to determine whether an altered microbiome due to aging, inflammation, or diet could induce changes in neutrophil phenotype, and whether targeting neutrophils has an effect on the microbiome and brain.
Fiber was effective in limiting central inflammation associated with age, evidenced by lower microglial inflammatory gene expression (Il-1β, Il-1rn, Il-6, Nlrp3, Tlr4, and Tnf). Novel findings also indicated differences in sensome and epigenetic regulator genes, suggesting that high fiber can promote changes in a microglial-specific and epigenetic-dependent manner. Since Il-1β, Tnf, and Il-6 gene expression was strongly decreased by diet, we correlated these genes with corresponding concentrations of butyrate and other SCFAs in the mice. For Il-1β and Tnf (trend for Il-6), higher butyrate correlated with lower pro-inflammatory gene expression. The mechanisms behind such an association are unclear, but many possible explanations exist, including regulation of FFARs on peripheral immune cells signaling to the brain or differential activation of the vagus nerve (56). It is important to note that not all effects seen by administration of butyrate were recapitulated by high fiber diet, so it will be important in future studies to determine the precise mechanisms of how high fiber diet affect microglial activation. For example, other SCFAs demonstrate anti-inflammatory properties (57) and high fiber diets can change other aspects of metabolism through variations in the gut microbiota leading to decreased inflammation (58), so these will be important avenues to explore.
Butyrate and other dietary factors can affect DNA methylation within various peripheral tissues (59). Our findings do not indicate any changes to DNA methylation in the hippocampus in response to fiber feeding. These effects paralleled the lack of differences in inflammatory gene expression within the hippocampus. These findings strengthen the idea that the anti-inflammatory changes seen with diet are likely microglial specific. It will be important to confirm these results in the future, along with modifications of histones and DNA hydroxymethylation that are known to be affected in Il-1β (60, 61). Furthermore, it is exciting that newly discovered histone modifications such as histone propionylation and butyrylation could have the potential to be regulated by dietary fiber (62).
A high fiber diet was not able to effectively diminish the exaggerated inflammatory responses to immune challenge in aged mice in the same way that was demonstrated with NaB treatment. This may be due to route of administration, as SCFAs from fiber feeding are metabolized by colonocytes within the gut. We were unable to compare differences between the amount of butyrate that may have been observed in the circulation and brain during high fiber feeding compared to a NaB injection. But this will be an important future step to determine how much butyrate from diet can be detected directly in the brain or if butyrate’s mechanisms of action on neuroinflammation are predominantly indirect (16). However, it is interesting that there was an interaction of age × diet in one of the CpG sites analyzed for Il-1β DNA methylation, in that aged mice had less DNA methylation than both adult groups, but adult mice with the high fiber diet had increased DNA methylation compared to adult mice with the low fiber diet. This may indicate that DNA methylation is more dynamic and responsive to a dietary intervention (63), but the mechanism of this is unclear. Using a lower dose of LPS or a live infection more accurately mimicking a typical immune response in humans may be necessary to see more nuanced differences and understand the epigenetic mechanisms involved in the inflammatory response of aged individuals.
In conclusion, data thus far support a role of high fermentable fiber in altering the microbiome and potentially immune infiltration/gut permeability, which supports beneficial microglial function in aged mice. Our results suggest that the effects of butyrate and potentially butyrate through high fiber feeding are due to a combination of mechanisms, including epigenetic regulation, metabolic regulation, and GPCR signaling. More work needs to be performed to examine the mode of action of butyrate-producing diets in the brain and whether or not these results relate to the beneficial effects seen with NaB. The characteristic that butyrate is synthesized endogenously via fermentation of non-digestible fibers by bacteria in the colon makes the prevention or at least suppression of neuroinflammatory conditions such as aging possible (16). High fiber supplementation in the elderly therefore may be a non-invasive strategy to increase butyrate levels and support an environment with decreased chronic neuroinflammation.
Statements
Ethics statement
All studies were carried out in accordance with United States National Institutes of Health guidelines and approved by the University of Illinois Institutional Animal Care and Use Committee.
Author contributions
SM, ML, JA, JW, and RJ contributed conception of the study. SM, JA, and ML contributed design of the study. SM, ML, and JA contributed significant intellectual content in order to perform the experiments of the study. SM, ML, JA, and LM performed the actual experiments. SM performed the statistical analysis and wrote the first draft of the manuscript. JA wrote sections of the manuscript. All the authors contributed to manuscript revision, read, and approved the submitted version. RJ was responsible for the final approval of the submitted version.
Funding
This work was supported by NIH R01 AG16710 and the University of Illinois College of ACES Undergraduate Research Program.
Acknowledgments
The authors would like to thank Jalisa Zimmerman, Kyle Coots, Elizaveta Mangutov, Brianna Bucknor, Gabriel Dungan, and Jordan Holm for their help in generating animals and biochemistry.
Conflict of interest
The authors declare that the research was conducted in the absence of any commercial or financial relationships that could be construed as a potential conflict of interest.
Supplementary material
The Supplementary Material for this article can be found online at https://www.frontiersin.org/articles/10.3389/fimmu.2018.01832/full#supplementary-material.
Figure S1α-diversity rarefaction plots as determined by Chao1. No differences in α-diversity were observed as a result of age (blue: adult mice red: aged mice; shown above) or fiber feeding (data not shown).
Figure S2β-diversity analysis (weighted Unifrac) reveals differences in gut microbiota community composition between high fiber-fed (green) and low fiber-fed (orange) mice after 4 weeks of feeding.
Figure S3Hippocampal (A) Il-1β, (B) Tnf, (C) Il-6 gene expression and DNA methylation of the Il-1β promoter at (D) CpG1 and (E) CpG2 in adult and aged mice fed low or high fiber diets 4 h post-lipopolysaccharide (LPS) injection. Data are presented as mean ± SEM (n = 6–8). (F) Serum LPS binding protein (LBP) measured in adult and aged mice fed low or high fiber diets 4 h post-LPS injection. Data are presented as mean ± SEM (n = 7–9).
Figure S4Gene expression of (A) colon and (B) lymph nodes from aged mice fed either a low or high fiber diet 4 h post-lipopolysaccharide (LPS) injection. Data are presented as mean ± SEM (n = 5–7). * indicates significance at p < 0.05 and # indicates significance at p < 0.1.
References
1
DiSabatoDJQuanNGodboutJP. Neuroinflammation: the devil is in the details. J Neurochem (2016) 139(Suppl 2):136–53.10.1111/jnc.13607
2
MattSMJohnsonRW. Neuro-immune dysfunction during brain aging: new insights in microglial cell regulation. Curr Opin Pharmacol (2016) 26:96–101.10.1016/j.coph.2015.10.009
3
MattSMLawsonMAJohnsonRW. Aging and peripheral lipopolysaccharide can modulate epigenetic regulators and decrease IL-1beta promoter DNA methylation in microglia. Neurobiol Aging (2016) 47:1–9.10.1016/j.neurobiolaging.2016.07.006
4
SimenAABordnerKAMartinMPMoyLABarryLC. Cognitive dysfunction with aging and the role of inflammation. Ther Adv Chronic Dis (2011) 2(3):175–95.10.1177/2040622311399145
5
WangW-YTanM-SYuJ-TTanL. Role of pro-inflammatory cytokines released from microglia in Alzheimer’s disease. Ann Transl Med (2015) 3(10):136.10.3978/j.issn.2305-5839.2015.03.49
6
HoeijmakersLHeinenYvan DamA-MLucassenPJKorosiA. Microglial priming and Alzheimer’s disease: a possible role for (early) immune challenges and epigenetics?Front Hum Neurosci (2016) 10:398.10.3389/fnhum.2016.00398
7
HuuskonenJSuuronenTNuutinenTKyrylenkoSSalminenA. Regulation of microglial inflammatory response by sodium butyrate and short-chain fatty acids. Br J Pharmacol (2004) 141(5):874–80.10.1038/sj.bjp.0705682
8
PatnalaRArumugamTVGuptaNDheenST. HDAC inhibitor sodium butyrate-mediated epigenetic regulation enhances neuroprotective function of microglia during ischemic stroke. Mol Neurobiol (2017) 54(8):6391–411.10.1007/s12035-016-0149-z
9
SarkarSAbujamraALLoewJEFormanLWPerrineSPFallerDV. Histone deacetylase inhibitors reverse CpG methylation by regulating DNMT1 through ERK signaling. Anticancer Res (2011) 31(9):2723–32.
10
ShinHKimJHLeeYSLeeYC. Change in gene expression profiles of secreted frizzled-related proteins (SFRPs) by sodium butyrate in gastric cancers: induction of promoter demethylation and histone modification causing inhibition of Wnt signaling. Int J Oncol (2012) 40(5):1533–42.10.3892/ijo.2012.1327
11
WeiYBMelasPAWegenerGMathéAALavebrattC. Antidepressant-like effect of sodium butyrate is associated with an increase in TET1 and in 5-hydroxymethylation levels in the Bdnf gene. Int J Neuropsychopharmacol (2015) 18(2):pyu032.10.1093/ijnp/pyu032
12
GovindarajanNAgis-BalboaRCWalterJSananbenesiFFischerA. Sodium butyrate improves memory function in an Alzheimer’s disease mouse model when administered at an advanced stage of disease progression. J Alzheimers Dis (2011) 26(1):187–97.10.3233/JAD-2011-110080
13
KilgoreMMillerCAFassDMHennigKMHaggartySJSweattJDet alInhibitors of class 1 histone deacetylases reverse contextual memory deficits in a mouse model of Alzheimer’s disease. Neuropsychopharmacology (2010) 35(4):870–80.10.1038/npp.2009.197
14
WangPZhangYGongYYangRChenZHuWet alSodium butyrate triggers a functional elongation of microglial process via Akt-small RhoGTPase activation and HDACs inhibition. Neurobiol Dis (2018) 111:12–25.10.1016/j.nbd.2017.12.006
15
YamawakiYYoshiokaNNozakiKItoHOdaKHaradaKet alSodium butyrate abolishes lipopolysaccharide-induced depression-like behaviors and hippocampal microglial activation in mice. Brain Res (2018) 1680:13–38.10.1016/j.brainres.2017.12.004
16
BourassaMWAlimIBultmanSJRatanRR. Butyrate, neuroepigenetics and the gut microbiome: can a high fiber diet improve brain health?Neurosci Lett (2016) 625:56–63.10.1016/j.neulet.2016.02.009
17
SherryCLKimSSDilgerRNBauerLLMoonMLTappingRIet alSickness behavior induced by endotoxin can be mitigated by the dietary soluble fiber, pectin, through up-regulation of IL-4 and Th2 polarization. Brain Behav Immun (2010) 24(4):631–40.10.1016/j.bbi.2010.01.015
18
KingDEMainousAGIIILambourneCA. Trends in dietary fiber intake in the United States, 1999-2008. J Acad Nutr Diet (2012) 112(5):642–8.10.1016/j.jand.2012.01.019
19
BiagiECandelaMFranceschiCBrigidiP. The aging gut microbiota: new perspectives. Ageing Res Rev (2011) 10(4):428–9.10.1016/j.arr.2011.03.004
20
HippeBZwielehnerJLisztKLasslCUngerFHaslbergerAG. Quantification of butyryl CoA:acetate CoA-transferase genes reveals different butyrate production capacity in individuals according to diet and age. FEMS Microbiol Lett (2011) 316(2):130–5.10.1111/j.1574-6968.2010.02197.x
21
SchaafsmaGSlavinJL. Significance of inulin fructans in the human diet. Comprehen Rev Food Sci Food Saf (2015) 14(1):37–47.10.1111/1541-4337.12119
22
RoberfroidM. Prebiotics: the concept revisited. J Nutr (2007) 137(3 Suppl 2):830S–7S.10.1093/jn/137.3.830S
23
BunoutDBarreraGHirschSGattasVde la MazaMPHaschkeFet alEffects of a nutritional supplement on the immune response and cytokine production in free-living Chilean elderly. J Parenter Enteral Nutr (2004) 28(5):348–54.10.1177/0148607104028005348
24
BlankMWereniczAVelhoLAPintoDFFediACLopesMWet alEnhancement of memory consolidation by the histone deacetylase inhibitor sodium butyrate in aged rats. Neurosci Lett (2015) 594:76–81.10.1016/j.neulet.2015.03.059
25
DashPKOrsiSAMooreAN. Histone deactylase inhibition combined with behavioral therapy enhances learning and memory following traumatic brain injury. Neuroscience (2009) 163(1):1–8.10.1016/j.neuroscience.2009.06.028
26
GodboutJPChenJAbrahamJRichwineAFBergBMKelleyKWet alExaggerated neuroinflammation and sickness behavior in aged mice following activation of the peripheral innate immune system. FASEB J (2005) 19(10):1329–31.10.1096/fj.05-3776fje
27
NikodemovaMWattersJ. Efficient isolation of live microglia with preserved phenotypes from adult mouse brain. J Neuroinflammation (2012) 9(1):147.10.1186/1742-2094-9-147
28
LivakKJSchmittgenTD. Analysis of relative gene expression data using real-time quantitative PCR and the 2(-delta delta C(T)) method. Methods (2001) 25(4):402–8.10.1006/meth.2001.1262
29
BoutejHRahimianRThammisettySSBelandLCLalancette-HebertMKrizJ. Diverging mRNA and protein networks in activated microglia reveal SRSF3 suppresses translation of highly upregulated innate immune transcripts. Cell Rep (2017) 21(11):3220–33.10.1016/j.celrep.2017.11.058
30
DasAArifuzzamanSYoonTKimSHChaiJCLeeYSet alRNA sequencing reveals resistance of TLR4 ligand-activated microglial cells to inflammation mediated by the selective jumonji H3K27 demethylase inhibitor. Sci Rep (2017) 7(1):6554.10.1038/s41598-017-06914-5
31
PatelABTsilioniILeemanSETheoharidesTC. Neurotensin stimulates sortilin and mTOR in human microglia inhibitable by methoxyluteolin, a potential therapeutic target for autism. Proc Natl Acad Sci U S A (2016) 113(45):E7049–58.10.1073/pnas.1604992113
32
WynneAMHenryCJHuangYClelandAGodboutJP. Protracted downregulation of CX3CR1 on microglia of aged mice after lipopolysaccharide challenge. Brain Behav Immun (2010) 24(7):1190–201.10.1016/j.bbi.2010.05.011
33
MuturiEJDonthuRKFieldsCJMoiseIKKimCH. Effect of pesticides on microbial communities in container aquatic habitats. Sci Rep (2017) 7:44565.10.1038/srep44565
34
LiuTWParkYMHolscherHDPadillaJScrogginsRJWellyRet alPhysical activity differentially affects the cecal microbiota of ovariectomized female rats selectively bred for high and low aerobic capacity. PLoS One (2015) 10(8):e0136150.10.1371/journal.pone.0136150
35
PanasevichMRAllenJMWalligMAWoodsJADilgerRN. Moderately fermentable potato fiber attenuates signs and inflammation associated with experimental colitis in mice. J Nutr (2015) 145(12):2781–8.10.3945/jn.115.218578
36
ChoSHChenJASayedFWardMEGaoFNguyenTAet alSIRT1 deficiency in microglia contributes to cognitive decline in aging and neurodegeneration via epigenetic regulation of IL-1beta. J Neurosci (2015) 35(2):807–18.10.1523/JNEUROSCI.2939-14.2015
37
BustamanteACAielloAEGaleaSRatanatharathornANoronhaCWildmanDEet alGlucocorticoid receptor DNA methylation, childhood maltreatment and major depression. J Affect Disord (2016) 206:181–8.10.1016/j.jad.2016.07.038
38
ErbenULoddenkemperCDoerfelKSpieckermannSHallerDHeimesaatMMet alA guide to histomorphological evaluation of intestinal inflammation in mouse models. Int J Clin Exp Pathol (2014) 7(8):4557–76.
39
KursaMB. Robustness of random forest-based gene selection methods. BMC Bioinformatics (2014) 15(1):8.10.1186/1471-2105-15-8
40
BarrientosRMKittMMWatkinsLRMaierSF. Neuroinflammation in the normal aging hippocampus. Neuroscience (2015) 309:84–99.10.1016/j.neuroscience.2015.03.007
41
KellyJRKennedyPJCryanJFDinanTGClarkeGHylandNP. Breaking down the barriers: the gut microbiome, intestinal permeability and stress-related psychiatric disorders. Front Cell Neurosci (2015) 9:392.10.3389/fncel.2015.00392
42
MaslowskiKMVieiraATNgAKranichJSierroFYuDet alRegulation of inflammatory responses by gut microbiota and chemoattractant receptor GPR43. Nature (2009) 461(7268):1282–6.10.1038/nature08530
43
WalshMEBhattacharyaASataranatarajanKQaisarRSloaneLRahmanMMet alThe histone deacetylase inhibitor butyrate improves metabolism and reduces muscle atrophy during aging. Aging Cell (2015) 14(6):957–70.10.1111/acel.12387
44
CastellanoJFFletcherBRKelley-BellBKimDHGallagherMRappPR. Age-related memory impairment is associated with disrupted multivariate epigenetic coordination in the hippocampus. PLoS One (2012) 7(3):e33249.10.1371/journal.pone.0033249
45
LangilleMGMeehanCJKoenigJEDhananiASRoseRAHowlettSEet alMicrobial shifts in the aging mouse gut. Microbiome (2014) 2(1):50.10.1186/s40168-014-0050-9
46
ThevaranjanNPuchtaASchulzCNaidooASzamosiJCVerschoorCPet alAge-associated microbial dysbiosis promotes intestinal permeability, systemic inflammation, and macrophage dysfunction. Cell Host Microbe (2017) 21(4):455–66.e4.10.1016/j.chom.2017.03.002
47
van TongerenSPSlaetsJPHarmsenHJWellingGW. Fecal microbiota composition and frailty. Appl Environ Microbiol (2005) 71(10):6438–42.10.1128/AEM.71.10.6438-6442.2005
48
NeyrinckAMTaminiauBWalgraveHDaubeGCaniPDBindelsLBet alSpirulina protects against hepatic inflammation in aging: an effect related to the modulation of the gut microbiota?Nutrients (2017) 9(6):633.10.3390/nu9060633
49
LouisPFlintHJ. Formation of propionate and butyrate by the human colonic microbiota. Environ Microbiol (2017) 19(1):29–41.10.1111/1462-2920.13589
50
Val-LailletDGuerinSCoqueryNNogretIFormalMRomeVet alOral sodium butyrate impacts brain metabolism and hippocampal neurogenesis, with limited effects on gut anatomy and function in pigs. FASEB J (2018) 32(4):2160–71.10.1096/fj.201700547RR
51
BordinMAtriFGuillemotLCitiS. Histone deacetylase inhibitors up-regulate the expression of tight junction proteins. Mol Cancer Res (2004) 2(12):692.
52
FournierBMParkosCA. The role of neutrophils during intestinal inflammation. Mucosal Immunol (2012) 5(4):354–66.10.1038/mi.2012.24
53
KrugerPSaffarzadehMWeberANRRieberNRadsakMvon BernuthHet alNeutrophils: between host defence, immune modulation, and tissue injury. PLoS Pathog (2015) 11(3):e1004651.10.1371/journal.ppat.1004651
54
MrdjenDPavlovicAHartmannFJSchreinerBUtzSGLeungBPet alHigh-dimensional single-cell mapping of central nervous system immune cells reveals distinct myeloid subsets in health, aging, and disease. Immunity (2018) 48(2):380–95.e6.10.1016/j.immuni.2018.01.011
55
ZenaroEPietronigroEBiancaVDPiacentinoGMarongiuLBuduiSet alNeutrophils promote Alzheimer’s disease-like pathology and cognitive decline via LFA-1 integrin. Nat Med (2015) 21:880.10.1038/nm.3913
56
MuCYangYZhuW. Gut microbiota: the brain peacekeeper. Front Microbiol (2016) 7:345.10.3389/fmicb.2016.00345
57
TedelindSWestbergFKjerrulfMVidalA. Anti-inflammatory properties of the short-chain fatty acids acetate and propionate: a study with relevance to inflammatory bowel disease. World J Gastroenterol (2007) 13(20):2826–32.10.3748/wjg.v13.i20.2826
58
TremaroliVBackhedF. Functional interactions between the gut microbiota and host metabolism. Nature (2012) 489(7415):242–9.10.1038/nature11552
59
vel SzicKSDeclerckKVidakovićMVanden BergheW. From inflammaging to healthy aging by dietary lifestyle choices: is epigenetics the key to personalized nutrition?Clin Epigenet (2015) 7(1):1–18.10.1186/s13148-015-0068-2
60
HaseebAMakkiMSHaqqiTM. Modulation of ten-eleven translocation 1 (TET1), isocitrate dehydrogenase (IDH) expression, alpha-ketoglutarate (alpha-KG), and DNA hydroxymethylation levels by interleukin-1beta in primary human chondrocytes. J Biol Chem (2014) 289(10):6877–85.10.1074/jbc.M113.512269
61
SchaafsmaWZhangXvan ZomerenKCJacobsSGeorgievaPBWolfSAet alLong-lasting pro-inflammatory suppression of microglia by LPS-preconditioning is mediated by RelB-dependent epigenetic silencing. Brain Behav Immun (2015) 48:205–21.10.1016/j.bbi.2015.03.013
62
KebedeAFNieborakAShahidianLZLe GrasSRichterFGomezDAet alHistone propionylation is a mark of active chromatin. Nat Struct Mol Biol (2017) 24(12):1048–56.10.1038/nsmb.3490
63
JonesMJGoodmanSJKoborMS. DNA methylation and healthy human aging. Aging Cell (2015) 14(6):924–32.10.1111/acel.12349
Summary
Keywords
microglia, butyrate, aging, neuroinflammation, epigenetics, microbiome, fiber diet
Citation
Matt SM, Allen JM, Lawson MA, Mailing LJ, Woods JA and Johnson RW (2018) Butyrate and Dietary Soluble Fiber Improve Neuroinflammation Associated With Aging in Mice. Front. Immunol. 9:1832. doi: 10.3389/fimmu.2018.01832
Received
20 April 2018
Accepted
25 July 2018
Published
14 August 2018
Volume
9 - 2018
Edited by
Jia Sun, Jiangnan University, China
Reviewed by
Bart Everts, Leiden University Medical Center, Netherlands; Jasenka Zubcevic, University of Florida, United States
Updates
Copyright
© 2018 Matt, Allen, Lawson, Mailing, Woods and Johnson.
This is an open-access article distributed under the terms of the Creative Commons Attribution License (CC BY). The use, distribution or reproduction in other forums is permitted, provided the original author(s) and the copyright owner(s) are credited and that the original publication in this journal is cited, in accordance with accepted academic practice. No use, distribution or reproduction is permitted which does not comply with these terms.
*Correspondence: Rodney W. Johnson, rwjohn@illinois.edu
Specialty section: This article was submitted to Nutritional Immunology, a section of the journal Frontiers in Immunology
Disclaimer
All claims expressed in this article are solely those of the authors and do not necessarily represent those of their affiliated organizations, or those of the publisher, the editors and the reviewers. Any product that may be evaluated in this article or claim that may be made by its manufacturer is not guaranteed or endorsed by the publisher.