 Daniela A. Covino1
 Cristina Purificato1Laura Catapano1Clementina M. Galluzzo1
 Maria Cristina Gauzzi1Stefano Vella1
 Eric Lefebvre2
 Star Seyedkazemi2Mauro Andreotti1†
 Laura Fantuzzi1*†
- 1National Center for Global Health, Istituto Superiore di Sanità, Rome, Italy
- 2Allergan plc, South San Francisco, CA, United States
Apolipoprotein B mRNA editing enzyme catalytic polypeptide-like 3 (APOBEC3) family members are cytidine deaminases that play crucial roles in innate responses to retrovirus infection. The mechanisms by which some of these enzymes restrict human immunodeficiency virus type 1 (HIV-1) replication have been extensively investigated in vitro. However, little is known regarding how APOBEC3 proteins affect the pathogenesis of HIV-1 infection in vivo and how antiretroviral therapy influences their expression. In this work, a longitudinal analysis was performed to evaluate APOBEC3G/3A expression in peripheral blood mononuclear cells of antiretroviral-naive HIV-1-infected individuals treated with cenicriviroc (CVC) or efavirenz (EFV) at baseline and 4, 12, 24, and 48 weeks post-treatment follow-up. While APOBEC3G expression was unaffected by therapy, APOBEC3A levels increased in CVC but not EFV arm at week 48 of treatment. APOBEC3G expression correlated directly with CD4+ cell count and CD4+/CD8+ cell ratio, whereas APOBEC3A levels inversely correlated with plasma soluble CD14. These findings suggest that higher APOBEC3G/3A levels may be associated with protective effects against HIV-1 disease progression and chronic inflammation and warrant further studies.
Introduction
Highly active antiretroviral therapy dramatically reduced human immunodeficiency virus type 1 (HIV-1)-related morbidity and mortality and currently suppresses viral replication in the majority of compliant patients. Antiretroviral drug regimens usually containing three active drugs from two or more classes are recommended for virologic suppression (1). Initial drug combinations generally consist of two nucleoside reverse transcriptase inhibitors plus a third drug such as an integrase inhibitor, a non-nucleoside reverse transcriptase inhibitor, or a protease inhibitor. In case of virologic failure or multi-class resistance, drugs not generally recommended for initial therapy can be considered, such as CC chemokine receptor 5 (CCR5) antagonists. Despite viral suppression, signs of inflammation and immune activation persist in most patients (2–6). Cenicriviroc (CVC) is a small-molecule CCR5 antagonist which has completed phase II of clinical development in HIV-1 infection (7, 8). It also inhibits CCR2, a receptor for CC chemokine ligand 2 (CCL2). The CCR2/CCL2 axis has been associated with various inflammatory diseases as well as with the high level of immune activation/inflammation and virus-associated disorders in HIV-1-infected individuals (9–12).
The apolipoprotein B mRNA editing enzyme catalytic polypeptide-like 3 (APOBEC3; A3) proteins are cytidine deaminases playing a crucial role in antiviral innate immunity (13, 14). Among the seven human A3 enzymes (from A to H), A3G was identified as the cellular restriction factor responsible for inhibiting HIV-1 replication in the absence of the virally encoded protein virion infectivity factor (15). It is encapsidated into virions and blocks HIV-1 replication upon entry in newly infected cells mainly by causing C-to-U deamination on the single stranded viral DNA during reverse transcription, leading to either the hypermutation of the viral genome or the degradation of viral DNA by cellular repair mechanisms. Other family members, such as A3F and A3H, can be encapsidated into budding virions and exert their antiviral activity in newly infected cells. Conversely, A3A is the only A3 enzyme which can restrict infection directly in the target cells where it is endogenously expressed (16). The A3 proteins are expressed in a tissue- and cell type-specific manner (17–19). Peripheral blood leukocytes express transcripts for all the family members, with A3G and A3A being the most highly represented (18). The former is greatly expressed in CD4+ T lymphocytes and myeloid cells (20), whereas expression of the latter is quite specific to myeloid lineage cells (21–24). While much has been learned about A3 proteins and their roles in HIV-1 restriction in vitro, little is known about how they impact on the in vivo pathogenesis of HIV-1 in the host (25, 26). Although some studies investigated A3 expression (mainly A3G and A3F) and activity in HIV-1+ subjects and the correlations with clinical parameters of infection, scattered data are available on the impact of antiretroviral therapy. The aim of this study was to assess the expression of A3G and A3A in patients treated with CVC or conventional therapy and evaluate its association with virological, immunological, and inflammatory parameters.
Materials and Methods
Study Patients and Ethical Issues
This study was exempt from ethics approval since it involved the secondary use of stored anonymized biological material from a subset of HIV-1+ patients enrolled in Study 202 (ClinicalTrials.gov NCT01338883), a multicenter 48-week phase 2b trial comparing treatment with CVC at two different doses (100 and 200 mg) versus efavirenz (EFV) 600 mg, both in combination with emtricitabine/tenofovir disoproxil fumarate, in antiretroviral treatment-naive, HIV-1-infected adults with CCR5-tropic virus (7). Study 202 was conducted in accordance with the Declaration of Helsinki, was approved by central or local institutional review boards or ethics committees at each study site, and a written informed consent was obtained from study participants. The trial included the measurement of biomarkers associated with inflammation and immune activation and sample storage for possible future studies. Available cryo-preserved peripheral blood mononuclear cell (PBMC) samples collected at baseline and after 4, 12, 24, and 48 weeks of treatment from participants who completed the follow-up period were used.
Western Blot Analysis of A3 Proteins
A3G and A3A expression was determined by western blot. Whole cell extracts were obtained by lysing PBMCs in RIPA buffer [150 mM NaCl, 50 mM Tris–Cl (pH 7.5), 1% Nonidet P-40, 0.5% sodium deoxycholate, and 0.1% sodium-dodecyl sulfate (SDS)] containing a cocktail of protease (Roche, Basel, Switzerland) and phosphatase inhibitors (Sigma-Aldrich, Milan, Italy) as previously described (21). Protein concentration was determined using the Bradford reagent (Bio-Rad, Milan, Italy) and a standard curve obtained with bovine serum albumin (Bio-Rad). Cell lysates (20 µg per lane) were fractionated on 10–12% SDS-PAGE and electroblotted to nitrocellulose filters (Protran BA 85, Schleicher & Schuell, Keene, Netherlands). A reference curve with dose-scale concentration (20–10–5 μg) of protein extracts derived from healthy donor PBMCs was used to assess the best primary and secondary antibody (Ab) dilutions and was included in each blot (data not shown). Membranes were incubated with 4–5% fat-free milk dissolved in PBS-T (PBS 1×, 0.05%) to block non-specific binding and then probed with the following Abs: anti-human A3A (rabbit polyclonal D23, Santa Cruz Biotechnology, Santa Cruz, CA, USA), anti-human A3G (rabbit polyclonal D9C6Z, Cell Signaling Technology, Beverly, MA, USA), and anti-actin (mouse monoclonal Abs-5, BD Biosciences, San Diego, CA, USA) as gel loading control. In some patients, A3G/A3A expression was confirmed by using a rabbit polyclonal anti–human A3G/A3A serum kindly provided by Dr. M. Malim (data not shown) (27). Blots were then incubated with appropriate secondary Abs conjugated with horseradish peroxidase (Santa Cruz Biotechnology) followed by Amersham ECL Western blot detection Reagent (GE Healthcare Life Sciences, Pittsburgh, PA, USA) or Pierce SuperSignal West Femto Substrate (Thermo Fisher Scientific, Waltham, MA, USA) according to the manufacturer’s instructions. Levels of A3A, A3G, and actin proteins were detected and quantified by using Chemidoc XRS (Bio-Rad).
Measurement of Virological, Immunological, and Inflammatory Parameters
Human immunodeficiency virus type 1 RNA levels, blood CD4+ and CD8+ cell counts, immune activation (CD3/CD4/CD38 and CD3/CD8/CD38), and inflammatory [high sensitivity C-reactive protein (hs-CRP), D-dimer, fibrinogen, and soluble CD14 (sCD14)] biomarkers were assessed at baseline and after 4 (except for sCD14), 12, 24, and 48 weeks of treatment. Viral load was quantified by the TaqMan assay (Applied Biosciences, Life Technologies, Carlsbad, CA, USA). The immune activation marker CD38 was measured by flow cytometry using cryo-preserved PBMCs. D-dimer was quantified by immunoturbidimetric assay using a D-dimer assay (Liatest) kit (Diagnostica Stago, Asnieres, France), hs-CRP by immunochemiluminometric assay using a quantitative C-reactive protein kit (Roche Diagnostics), and fibrinogen by polymerization function by the Clauss method using the Stago Fibrinogen kit (Diagnostica Stago); these biomarkers were measured by LabCorp Clinical Trials (Cranford, NJ, USA). sCD14 was quantified by R&D Systems using a solid phase sandwich ELISA with a human sCD14 Quantikine ELISA kit (R&D Systems, Minneapolis, MN, USA). All the parameters used in the correlation analysis were previously reported (7).
Statistical Analysis
Intra-group variations between time points were assessed using Wilcoxon signed-rank tests, while the comparison between groups was done by the Mann–Whitney U test. Non-parametric Spearman tests were used to determine correlation coefficients. Observations were considered statistically significant when p < 0.05. SPSS version 24 (IBM Corp., Armonk, NY, USA) and GraphPad Prism version 7 (GraphPad Software, Inc., San Diego, CA, USA) were used for statistical analyses and graphs drawing.
Results
We have performed a longitudinal analysis of A3G and A3A expression in PBMCs from 41 Study 202 participants (26 from the CVC 200 arm and 15 from the EFV arm). Demographic and baseline clinical characteristics prior therapy initiation of the HIV-1-infected subjects analyzed are provided in Table 1. Total cell extracts were obtained from patient PBMCs collected before and 4, 12, 24, and 48 weeks after therapy initiation, and A3G and A3A protein levels were assessed by western blot and normalized to actin by densitometric analysis. A3G was detected in all the subjects analyzed, whereas A3A protein was under the detection limit of the assay in 5 out of 41 patients (2 and 3 in CVC and EFV arms, respectively). Expression of both A3 proteins at baseline did not significantly differ between the two arms (Table S1 in Supplementary Material). As shown in Figure 1A, expression of A3G was not altered over the 48 weeks in both treatment arms. Conversely, A3A levels were significantly increased at week 48 of treatment in the CVC arm (p = 0.001), whereas no significant differences were observed in the EFV arm (Figure 2A).
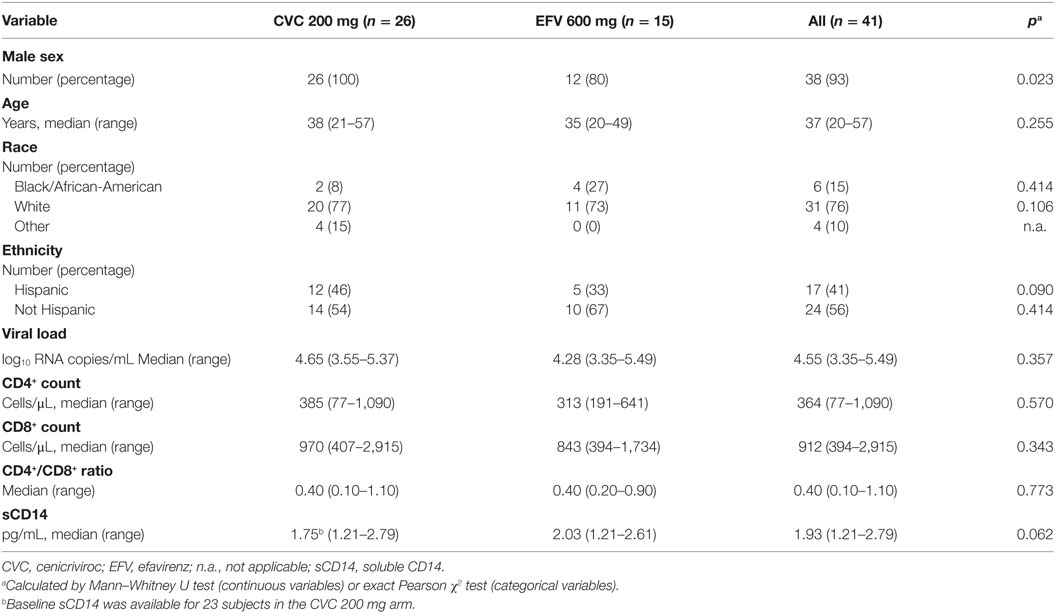
Table 1. Demographic and baseline clinical characteristics of study subjects.
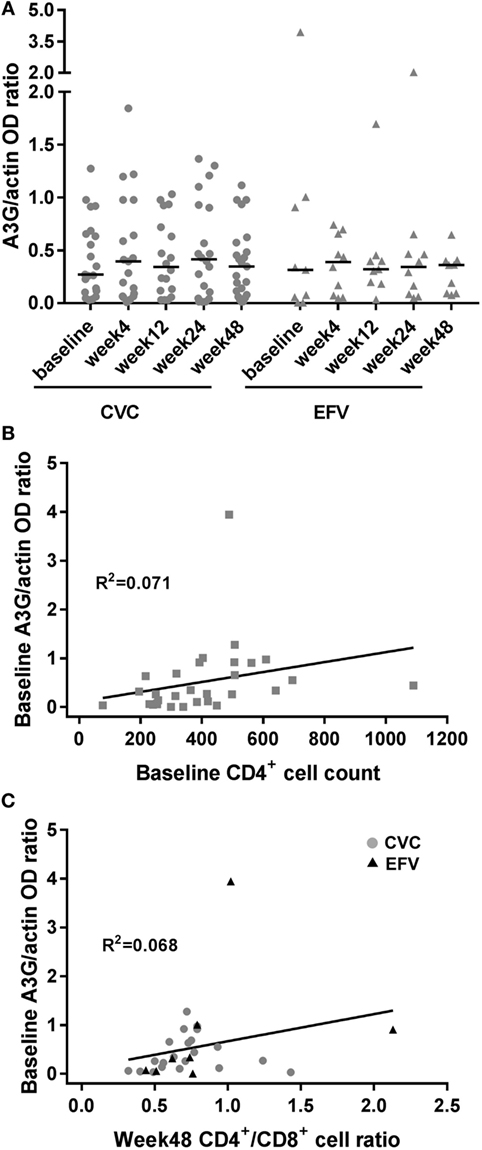
Figure 1. A3G expression in cenicriviroc (CVC) and efavirenz (EFV) arms and correlation with surrogate markers of disease progression. (A) Expression of A3G in peripheral blood mononuclear cells of subjects treated with CVC (circles) or EFV (triangles). The dot plots show the ratios of A3G to actin OD determined by densitometry for each time point of the patients analyzed (CVC: n = 21 baseline, n = 19 week 4, n = 18 week 12, n = 20 week 24, n = 23 week 48; EFV: n = 9 baseline, n = 10 week 4, n = 9 week 12, n = 10 week 24, n = 9 week 48). Median values (50th percentiles) are shown by the horizontal bars. (B) Correlation between baseline A3G levels and CD4+ cell counts (n = 30). (C) Correlation between baseline A3G levels and week 48 CD4+/CD8+ cell ratio (n = 29; CVC: n = 21; EFV: n = 8). Gray circles and black triangles, CVC- and EFV-treated subjects, respectively. Statistical analysis was done using the Wilcoxon signed-rank test (A) and the non-parametric one-tailed Spearman’s test to determine correlation coefficients (B,C).
Figure 2. A3A expression in cenicriviroc (CVC) and efavirenz (EFV) arms and correlation with the biomarker of inflammation soluble CD14 (sCD14). (A) Expression of A3A in peripheral blood mononuclear cells of subjects treated with CVC (circles) or EFV (triangles). The dot plots show the ratios of A3A to actin OD determined by densitometry for each time point of the patients analyzed (CVC: n = 20 baseline, n = 17 week 4, n = 17 week 12, n = 18 week 24, n = 22 week 48; EFV: n = 8 baseline, n = 8 week 4, n = 8 week 12, n = 9 week 24, n = 9 week 48). Median values (50th percentiles) are shown by the horizontal bars. **p = 0.001 (week 48 versus baseline). (B) Correlation between baseline A3A and sCD14 levels (n = 25). (C) Correlation between week 48 A3A and sCD14 levels (n = 31; CVC: n = 22; EFV: n = 9). Gray circles and black triangles, CVC- and EFV-treated subjects, respectively. Statistical analysis was done using the Wilcoxon signed-rank test (A) and the non-parametric one-tailed Spearman’s test to determine correlation coefficients (B,C).
To ascertain whether the observed levels of A3G/A3A expression had any clinical significance, the subjects’ viral loads, CD4+ and CD8+ cell counts and CD4+/CD8+ cell ratios, measured at baseline and at the end of the follow-up period (week 48), were examined as surrogate markers of disease progression. Table 2 summarizes these clinical parameters of study subjects during the treatment follow-up period. Spearman’s correlation was used to estimate the association between these biomarkers and A3G or A3A protein levels. No correlation was found between A3G or A3A expression and viral load (data not shown). Baseline A3G levels correlated directly with baseline CD4+ cell counts (coefficient = 0.541; p = 0.002) as well as CD4+/CD8+ cell ratios at week 48 of treatment (coefficient = 0.451; p = 0.01) (Figures 1B,C). Conversely, no correlation was found between A3A expression and these parameters or monocyte counts (data not shown). Interestingly, baseline A3A levels inversely correlated with baseline sCD14 (coefficient = −0.435; p = 0.03), and this effect was even stronger at week 48 of treatment (coefficient = −0.46; p = 0.009) (Figures 2B,C). As shown in Figure 3, levels of sCD14 were significantly higher in EFV-treated subjects compared to CVC arm at weeks 12, 24, and 48 of treatment but not at baseline (see Table 1). Moreover, sCD14 levels were significantly increased at week 12 of treatment in the EFV arm (p = 0.026), whereas no changes were observed during the follow-up period in the CVC arm. No correlation was observed between A3A expression and other non-specific markers of inflammation, namely hs-CRP, D-dimer, and fibrinogen, as well as the activation marker CD38 expressed on CD4+ and CD8+ lymphocytes (data not shown), which did not differ across the arms during follow-up (see Table S2 in Supplementary Material).
Table 2. Clinical parameters of study subjects during treatment follow-up.
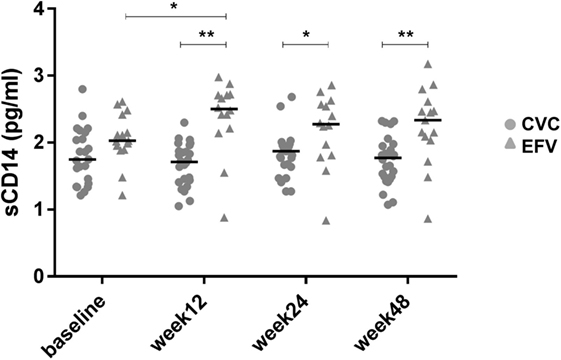
Figure 3. Levels of soluble CD14 (sCD14) in cenicriviroc (CVC) and efavirenz (EFV) arms. The dot plots show plasma sCD14 levels measured by ELISA at each time point of the patients analyzed (CVC: n = 23 baseline, n = 26 week 12, n = 25 week 24, n = 26 week 48; EFV: n = 15 baseline, n = 14 week 12, n = 14 week 24, n = 15 week 48). Median values (50th percentiles) are shown by the horizontal bars. Statistical analysis was done using the Mann–Whitney U or Wilcoxon signed-rank tests for unpaired or paired data. *p < 0.05; **p < 0.005.
Discussion
The role of A3s in regulating HIV-1 replication in vivo is unclear. Previous studies have addressed A3G (and A3F) expression and function in PBMCs of HIV-1+ subjects by quantifying A3 transcripts or editing in HIV-1 DNA. A positive correlation of A3G mRNA levels and/or viral DNA hypermutation with CD4+ cell count of HIV-1+ subjects and a negative correlation with viral load were identified in some studies (28–32) but not in others (33, 34). Higher levels of A3G were also observed in HIV-1-exposed uninfected individuals compared to healthy control or infected subjects (28, 35) and in long-term non-progressors compared to HIV-1-uninfected individuals and normal progressors (30). However, not all the studies were concordant with these associations (36), and higher A3G levels were found in HIV-1− compared to HIV-1+ individuals, including matched pre- and post-infection samples from the same subjects, suggesting that A3G transcription may be downregulated upon infection (33). These contrasting results might be due to either technical issues or the size/characteristics of the cohorts studied. In this study, we conducted a longitudinal ex vivo analysis of A3G and A3A protein expression in PBMCs of HIV-1-infected individuals at baseline and at various times of antiretroviral therapy with CVC or EFV. Our results highlight a direct correlation between baseline A3G levels and either baseline CD4+ cell counts, as previously reported by others (28, 29, 37), or CD4+/CD8+ cell ratios at week 48 of treatment. The former is a well-known predictor of disease progression, and even the latter has been proposed in recent years as a marker of immune dysfunction, viral reservoir size, and a prognostic indicator for non-AIDS mortality (38). Although correlation does not necessarily indicate causation, these results support the hypothesis that enhanced A3G expression, even if not correlating with viral load, may provide protective effects against disease progression through the association with either increased CD4+ cell count in therapy naive patients or CD4+/CD8+ cell ratio during antiretroviral treatment.
To our knowledge, this study is the first to show that therapy initiation with diverse antiretroviral regimens can differently affect the expression of A3 proteins. Indeed, treatment with CVC, but not with EFV, determined an increase of A3A, but not A3G, expression. Although type I IFNs are the best characterized inducers of A3A expression, its role in the modulation of A3A levels in CVC-treated subjects was not investigated in this study. However, other stimuli have been shown to modulate the expression of this protein in an IFN-independent manner (19). In particular, our group demonstrated that endogenous CCL2 represents an autocrine factor acting as a negative regulator of A3A expression in macrophages. Indeed, the neutralization of this chemokine determined a specific increase in A3A, but not A3G, expression in either uninfected or HIV-1-infected monocyte-derived macrophages, and this effect was associated with a decrease of viral replication. Treatment with anti-IFN-α/β serum demonstrated that CCL2 blocking-mediated A3A induction was type I IFN independent (21, 39). Thus, the increase of A3A levels induced by CVC treatment may be a consequence of the CCR2 antagonistic activity of the drug. This is further supported by the lack of induction of A3G expression following CVC treatment. These results add new insights into the notion that blocking the CCR2/CCL2 axis may regulate the expression of this innate intracellular viral antagonist. Unlike A3G, in vivo A3A expression in HIV-1+ subjects has been poorly investigated. A3A transcripts were shown to be downregulated after initiation of antiretroviral therapy in whole blood samples from 10 Ugandans with AIDS (40). In addition, A3A baseline expression in PBMCs from HIV-1-infected patients was found to significantly correlate with viral load decline observed following 3 weeks of treatment with pegylated IFN-α-2a (41). Although in the patients’ cohort analyzed in this study A3A levels do not correlate with either viral load or CD4+/CD8+ cell counts and ratios, an inverse correlation was found between A3A expression and sCD14 levels. CD14 is a coreceptor for LPS and its soluble form is a marker of monocyte activation, and represents an independent predictor of morbidity and mortality in people with HIV-1 infection (2). When considering the association between A3A and sCD14 within the two arms, we did not detect a significant correlation (data not shown), likely due to the limited number of subjects in each arm.
Chronic inflammation is considered nowadays a driving force of immune dysfunction and AIDS progression. A residual chronic immune activation persists even in HIV-1-infected patients in which viral replication is inhibited by antiretroviral therapy. In fact, persistent latently infected cells contribute to the continuous activation of immune cells, establishing a dangerous vicious cycle between viral persistence and immune activation which contributes to the development of pathological conditions and hinders a complete remission (2). Although virologic success and CD4+ cell count increase were similar across CVC and EFV arms (7), lower levels of sCD14 were present in the CVC-treated group, suggesting the potential anti-inflammatory effects of this drug. This was confirmed in a very recent study in which virally suppressed chronic HIV-1-infected individuals were treated with CVC for 24 weeks (42). Despite the power of our study was limited by the small number of subjects analyzed, the increased expression of A3A in the CVC-treated group suggests an unprecedented link between decreased inflammation and innate antiviral responses. A3A is mainly expressed by monocytes, but the low amount of patient’s cells available imposed to perform the analysis of A3A levels on whole PBMCs. Additional work with larger cohorts and purified leukocyte populations is needed to robustly define the association between A3A expression and inflammation.
Ethics Statement
This study was exempt from ethics approval since it involved the secondary use of stored anonymized biological material from a subset of HIV-1+ patients enrolled in Study 202 (ClinicalTrials.gov NCT01338883), a multicenter 48-week phase 2b trial comparing treatment with CVC at two different doses (100 and 200 mg) versus efavirenz (EFV) 600 mg, both in combination with emtricitabine/tenofovir disoproxil fumarate, in antiretroviral treatment-naive, HIV-1-infected adults with CCR5-tropic virus (7). Study 202 was conducted in accordance with the Declaration of Helsinki, was approved by central or local institutional review boards or ethics committees at each study site, and a written informed consent was obtained from study participants. The trial included the measurement of biomarkers associated with inflammation and immune activation and sample storage for possible future studies. Available cryo-preserved peripheral blood mononuclear cell (PBMC) samples collected at baseline and after 4, 12, 24, and 48 weeks of treatment from participants who completed the follow-up period were used.
Author Contributions
DC designed and performed experiments, analyzed and interpreted the data, designed the figures, and contributed to write the manuscript. CP, LC, and CG performed experiments. MG contributed to data interpretation and manuscript writing. SV provided scientific advice and edited the manuscript. EL and SS contributed patients samples and clinical data. MA and LF conceived and designed the study, analyzed and interpreted the data, and wrote the manuscript. All the authors reviewed and approved the final manuscript.
Conflict of Interest Statement
EL and SS are employees of Allergan. All other authors: no potential conflicts of interest.
The reviewer LL and handling Editor declared their shared affiliation.
Acknowledgments
We thank Michael H. Malim for providing the anti-A3G/A3A serum, Bill Tan for assistance with patients data, and Daniela Diamanti and Fabiola Diamanti for excellent technical support.
Funding
This work was supported by a grant from the Italian Ministry of Health, Ricerca Finalizzata RF-2011-02347224 to LF.
Supplementary Material
The Supplementary Material for this article can be found online at https://www.frontiersin.org/articles/10.3389/fimmu.2018.01839/full#supplementary-material.
References
1. Cihlar T, Fordyce M. Current status and prospects of HIV treatment. Curr Opin Virol (2016) 18:50–6. doi:10.1016/j.coviro.2016.03.004
2. Klatt NR, Chomont N, Douek DC, Deeks SG. Immune activation and HIV persistence: implications for curative approaches to HIV infection. Immunol Rev (2013) 254:326–42. doi:10.1111/imr.12065
3. Hileman CO, Funderburg NT. Inflammation, immune activation, and antiretroviral therapy in HIV. Curr HIV/AIDS Rep (2017) 14:93–100. doi:10.1007/s11904-017-0356-x
4. Hunt PW, Lee SA, Siedner MJ. Immunologic biomarkers, morbidity, and mortality in treated HIV infection. J Infect Dis (2016) 214(Suppl 2):S44–50. doi:10.1093/infdis/jiw275
5. Paiardini M, Muller-Trutwin M. HIV-associated chronic immune activation. Immunol Rev (2013) 254:78–101. doi:10.1111/imr.12079
6. Rajasuriar R, Khoury G, Kamarulzaman A, French MA, Cameron PU, Lewin SR. Persistent immune activation in chronic HIV infection: do any interventions work? AIDS (2013) 27:1199–208. doi:10.1097/QAD.0b013e32835ecb8b
7. Thompson M, Saag M, DeJesus E, Gathe J, Lalezari J, Landay AL, et al. A 48-week randomized phase 2b study evaluating cenicriviroc versus efavirenz in treatment-naive HIV-infected adults with C-C chemokine receptor type 5-tropic virus. AIDS (2016) 30:869–78. doi:10.1097/QAD.0000000000000988
8. Lalezari J, Gathe J, Brinson C, Thompson M, Cohen C, Dejesus E, et al. Safety, efficacy, and pharmacokinetics of TBR-652, a CCR5/CCR2 antagonist, in HIV-1-infected, treatment-experienced, CCR5 antagonist-naive subjects. J Acquir Immune Defic Syndr (2011) 57:118–25. doi:10.1097/QAI.0b013e318213c2c0
9. Covino DA, Sabbatucci M, Fantuzzi L. The CCL2/CCR2 axis in the pathogenesis of HIV-1 infection: a new cellular target for therapy? Curr Drug Targets (2016) 17:76–110. doi:10.2174/138945011701151217110917
10. Ansari AW, Heiken H, Meyer-Olson D, Schmidt RE. CCL2: a potential prognostic marker and target of anti-inflammatory strategy in HIV/AIDS pathogenesis. Eur J Immunol (2011) 41:3412–8. doi:10.1002/eji.201141676
11. Ansari AW, Kamarulzaman A, Schmidt RE. Multifaceted impact of host C-C chemokine CCL2 in the immuno-pathogenesis of HIV-1/M. tuberculosis co-infection. Front Immunol (2013) 4:312. doi:10.3389/fimmu.2013.00312
12. Ansari AW, Schmidt RE, Shankar EM, Kamarulzaman A. Immuno-pathomechanism of liver fibrosis: targeting chemokine CCL2-mediated HIV:HCV nexus. J Transl Med (2014) 12:341. doi:10.1186/s12967-014-0341-8
13. Refsland EW, Harris RS. The APOBEC3 family of retroelement restriction factors. Curr Top Microbiol Immunol (2013) 371:1–27. doi:10.1007/978-3-642-37765-5_1
14. Stavrou S, Ross SR. APOBEC3 proteins in viral immunity. J Immunol (2015) 195:4565–70. doi:10.4049/jimmunol.1501504
15. Sheehy AM, Gaddis NC, Choi JD, Malim MH. Isolation of a human gene that inhibits HIV-1 infection and is suppressed by the viral Vif protein. Nature (2002) 418:646–50. doi:10.1038/nature00939
16. Berger G, Durand S, Fargier G, Nguyen XN, Cordeil S, Bouaziz S, et al. APOBEC3A is a specific inhibitor of the early phases of HIV-1 infection in myeloid cells. PLoS Pathog (2011) 7:e1002221. doi:10.1371/journal.ppat.1002221
17. Koning FA, Newman EN, Kim EY, Kunstman KJ, Wolinsky SM, Malim MH. Defining APOBEC3 expression patterns in human tissues and hematopoietic cell subsets. J Virol (2009) 83:9474–85. doi:10.1128/JVI.01089-09
18. Refsland EW, Stenglein MD, Shindo K, Albin JS, Brown WL, Harris RS. Quantitative profiling of the full APOBEC3 mRNA repertoire in lymphocytes and tissues: implications for HIV-1 restriction. Nucleic Acids Res (2010) 38:4274–84. doi:10.1093/nar/gkq174
19. Covino DA, Gauzzi MC, Fantuzzi L. Understanding the regulation of APOBEC3 expression: current evidence and much to learn. J Leukoc Biol (2018) 103:433–44. doi:10.1002/JLB.2MR0717-310R
20. Stopak KS, Chiu YL, Kropp J, Grant RM, Greene WC. Distinct patterns of cytokine regulation of APOBEC3G expression and activity in primary lymphocytes, macrophages, and dendritic cells. J Biol Chem (2007) 282:3539–46. doi:10.1074/jbc.M610138200
21. Sabbatucci M, Covino DA, Purificato C, Mallano A, Federico M, Lu J, et al. Endogenous CCL2 neutralization restricts HIV-1 replication in primary human macrophages by inhibiting viral DNA accumulation. Retrovirology (2015) 12:4. doi:10.1186/s12977-014-0132-6
22. Graziano F, Vicenzi E, Poli G. Plastic restriction of HIV-1 replication in human macrophages derived from M1/M2 polarized monocytes. J Leukoc Biol (2016) 100:1147–53. doi:10.1189/jlb.4AB0316-158R
23. Sharma S, Patnaik SK, Taggart RT, Kannisto ED, Enriquez SM, Gollnick P, et al. APOBEC3A cytidine deaminase induces RNA editing in monocytes and macrophages. Nat Commun (2015) 6:6881. doi:10.1038/ncomms7881
24. Gekonge B, Bardin MC, Montaner LJ. Short communication: nitazoxanide inhibits HIV viral replication in monocyte-derived macrophages. AIDS Res Hum Retroviruses (2015) 31:237–41. doi:10.1089/aid.2014.0015
25. Moris A, Murray S, Cardinaud S. AID and APOBECs span the gap between innate and adaptive immunity. Front Microbiol (2014) 5:534. doi:10.3389/fmicb.2014.00534
26. Albin JS, Harris RS. Interactions of host APOBEC3 restriction factors with HIV-1 in vivo: implications for therapeutics. Expert Rev Mol Med (2010) 12:e4. doi:10.1017/S1462399409001343
27. Newman EN, Holmes RK, Craig HM, Klein KC, Lingappa JR, Malim MH, et al. Antiviral function of APOBEC3G can be dissociated from cytidine deaminase activity. Curr Biol (2005) 15:166–70. doi:10.1016/j.cub.2004.12.068
28. Vazquez-Perez JA, Ormsby CE, Hernandez-Juan R, Torres KJ, Reyes-Teran G. APOBEC3G mRNA expression in exposed seronegative and early stage HIV infected individuals decreases with removal of exposure and with disease progression. Retrovirology (2009) 6:23. doi:10.1186/1742-4690-6-23
29. Jin X, Brooks A, Chen H, Bennett R, Reichman R, Smith H. APOBEC3G/CEM15 (hA3G) mRNA levels associate inversely with human immunodeficiency virus viremia. J Virol (2005) 79:11513–6. doi:10.1128/JVI.79.17.11513-11516.2005
30. Kourteva Y, De Pasquale M, Allos T, McMunn C, D’Aquila RT. APOBEC3G expression and hypermutation are inversely associated with human immunodeficiency virus type 1 (HIV-1) burden in vivo. Virology (2012) 430:1–9. doi:10.1016/j.virol.2012.03.018
31. Ulenga NK, Sarr AD, Thakore-Meloni S, Sankale JL, Eisen G, Kanki PJ. Relationship between human immunodeficiency type 1 infection and expression of human APOBEC3G and APOBEC3F. J Infect Dis (2008) 198:486–92. doi:10.1086/590212
32. Land AM, Ball TB, Luo M, Pilon R, Sandstrom P, Embree JE, et al. Human immunodeficiency virus (HIV) type 1 proviral hypermutation correlates with CD4 count in HIV-infected women from Kenya. J Virol (2008) 82:8172–82. doi:10.1128/JVI.01115-08
33. Reddy K, Winkler CA, Werner L, Mlisana K, Abdool Karim SS, Ndung’u T, et al. APOBEC3G expression is dysregulated in primary HIV-1 infection and polymorphic variants influence CD4+ T-cell counts and plasma viral load. AIDS (2010) 24:195–204. doi:10.1097/QAD.0b013e3283353bba
34. Cho SJ, Drechsler H, Burke RC, Arens MQ, Powderly W, Davidson NO. APOBEC3F and APOBEC3G mRNA levels do not correlate with human immunodeficiency virus type 1 plasma viremia or CD4+ T-cell count. J Virol (2006) 80:2069–72. doi:10.1128/JVI.80.4.2069-2072.2006
35. Biasin M, Piacentini L, Lo Caputo S, Kanari Y, Magri G, Trabattoni D, et al. Apolipoprotein B mRNA-editing enzyme, catalytic polypeptide-like 3G: a possible role in the resistance to HIV of HIV-exposed seronegative individuals. J Infect Dis (2007) 195:960–4. doi:10.1086/511988
36. Gandhi SK, Siliciano JD, Bailey JR, Siliciano RF, Blankson JN. Role of APOBEC3G/F-mediated hypermutation in the control of human immunodeficiency virus type 1 in elite suppressors. J Virol (2008) 82:3125–30. doi:10.1128/JVI.01533-07
37. Zhao M, Geng W, Jiang Y, Han X, Cui H, Dai D, et al. The associations of hA3G and hA3B mRNA levels with HIV disease progression among HIV-infected individuals of China. J Acquir Immune Defic Syndr (2010) 53(Suppl 1):S4–9. doi:10.1097/QAI.0b013e3181c7d349
38. McBride JA, Striker R. Imbalance in the game of T cells: what can the CD4/CD8 T-cell ratio tell us about HIV and health? PLoS Pathog (2017) 13:e1006624. doi:10.1371/journal.ppat.1006624
39. Sabbatucci M, Covino DA, Purificato C, Mallano A, Federico M, Lu J, et al. Erratum to: endogenous CCL2 neutralization restricts HIV-1 replication in primary human macrophages by inhibiting viral DNA accumulation. Retrovirology (2015) 12:47. doi:10.1186/s12977-015-0166-4
40. Boulware DR, Meya DB, Bergemann TL, Williams D, Vlasova-St Louis IA, Rhein J, et al. Antiretroviral therapy down-regulates innate antiviral response genes in patients with AIDS in sub-saharan Africa. J Acquir Immune Defic Syndr (2010) 55:428–38. doi:10.1097/QAI.0b013e3181ef4963
41. Katsounas A, Frank AC, Lempicki RA, Polis MA, Asmuth DM, Kottilil S. Differential specificity of interferon-alpha inducible gene expression in association with human immunodeficiency virus and hepatitis C virus levels and declines in vivo. J AIDS Clin Res (2015) 6:410. doi:10.4172/2155-6113.1000410
Keywords: APOBEC3A, APOBEC3G, antiretroviral therapy, cenicriviroc, chronic inflammation, disease progression
Citation: Covino DA, Purificato C, Catapano L, Galluzzo CM, Gauzzi MC, Vella S, Lefebvre E, Seyedkazemi S, Andreotti M and Fantuzzi L (2018) APOBEC3G/3A Expression in Human Immunodeficiency Virus Type 1-Infected Individuals Following Initiation of Antiretroviral Therapy Containing Cenicriviroc or Efavirenz. Front. Immunol. 9:1839. doi: 10.3389/fimmu.2018.01839
Received: 11 April 2018; Accepted: 25 July 2018;
Published: 08 August 2018
Edited by:
Guido Poli, Università Vita-Salute San Raffaele, ItalyReviewed by:
Lucia Lopalco, San Raffaele Hospital (IRCCS), ItalyDaria Trabattoni, Università degli Studi di Milano, Italy
Copyright: © 2018 Covino, Purificato, Catapano, Galluzzo, Gauzzi, Vella, Lefebvre, Seyedkazemi, Andreotti and Fantuzzi. This is an open-access article distributed under the terms of the Creative Commons Attribution License (CC BY). The use, distribution or reproduction in other forums is permitted, provided the original author(s) and the copyright owner(s) are credited and that the original publication in this journal is cited, in accordance with accepted academic practice. No use, distribution or reproduction is permitted which does not comply with these terms.
*Correspondence: Laura Fantuzzi, bGF1cmEuZmFudHV6emlAaXNzLml0
†These authors have contributed equally to this work.