 Jacques J. M. van Dongen1*†
 Mirjam van der Burg2,3†
 Tomas Kalina4†
 Martin Perez-Andres5,6†
 Ester Mejstrikova4
 Marcela Vlkova7
 Eduardo Lopez-Granados8
 Marjolein Wentink2
 Anne-Kathrin Kienzler9
 Jan Philippé10
 Ana E. Sousa11
 Menno C. van Zelm2,12
 Elena Blanco5,6
 Alberto Orfao5,6† on behalf of the EuroFlow Consortium
- 1Department of Immunohematology and Blood Transfusion, Leiden University Medical Center, Leiden, Netherlands
- 2Department of Immunology, Erasmus MC, Rotterdam, Netherlands
- 3Department of Pediatrics, Leiden University Medical Center, Leiden, Netherlands
- 4Department of Pediatric Hematology and Oncology, University Hospital Motol, Charles University, Prague, Czechia
- 5Department of Medicine, Cancer Research Centre (IBMCC, USAL-CSIC), Cytometry Service (NUCLEUS), University of Salamanca (USAL), Institute of Biomedical Research of Salamanca (IBSAL), Salamanca, Spain
- 6Biomedical Research Networking Centre Consortium of Oncology (CIBERONC), CB/16/12/00233, Instituto Carlos III, Madrid, Spain
- 7Institute of Clinical Immunology and Allergology, St. Anne's University Hospital Brno, Masaryk University, Brno, Czechia
- 8Department of Immunology, Hospital Universitario La Paz, Madrid, Spain
- 9Experimental Medicine Division, Nuffield Department of Medicine, University of Oxford, Oxford, United Kingdom
- 10Department of Laboratory Medicine, University Hospital Ghent, Ghent, Belgium
- 11Faculdade de Medicina, Instituto de Medicina Molecular, Universidade de Lisboa, Lisbon, Portugal
- 12Department of Immunology and Pathology, Central Clinical School, Alfred Hospital, Monash University, Melbourne, VIC, Australia
Guidelines for screening for primary immunodeficiencies (PID) are well-defined and several consensus diagnostic strategies have been proposed. These consensus proposals have only partially been implemented due to lack of standardization in laboratory procedures, particularly in flow cytometry. The main objectives of the EuroFlow Consortium were to innovate and thoroughly standardize the flowcytometric techniques and strategies for reliable and reproducible diagnosis and classification of PID of the lymphoid system. The proposed EuroFlow antibody panels comprise one orientation tube and seven classification tubes and corresponding databases of normal and PID samples. The 8-color 12-antibody PID Orientation tube (PIDOT) aims at identification and enumeration of the main lymphocyte and leukocyte subsets; this includes naïve pre-germinal center (GC) and antigen-experienced post-GC memory B-cells and plasmablasts. The seven additional 8(-12)-color tubes can be used according to the EuroFlow PID algorithm in parallel or subsequently to the PIDOT for more detailed analysis of B-cell and T-cell subsets to further classify PID of the lymphoid system. The Pre-GC, Post-GC, and immunoglobulin heavy chain (IgH)-isotype B-cell tubes aim at identification and enumeration of B-cell subsets for evaluation of B-cell maturation blocks and specific defects in IgH-subclass production. The severe combined immunodeficiency (SCID) tube and T-cell memory/effector subset tube aim at identification and enumeration of T-cell subsets for assessment of T-cell defects, such as SCID. In case of suspicion of antibody deficiency, PIDOT is preferably directly combined with the IgH isotype tube(s) and in case of SCID suspicion (e.g., in newborn screening programs) the PIDOT is preferably directly combined with the SCID T-cell tube. The proposed ≥8-color antibody panels and corresponding reference databases combined with the EuroFlow PID algorithm are designed to provide fast, sensitive and cost-effective flowcytometric diagnosis of PID of the lymphoid system, easily applicable in multicenter diagnostic settings world-wide.
Introduction
Primary immunodeficiencies (PID) are inherited disorders of the immune system, generally presenting with recurrent, sometimes life-threatening infections. To date, more than 350 genes have been identified that can be mutated in PID patients (1–3). Depending on the genetic defect, one part of the immune system or one cell type can be absent, decreased or dysfunctional. The majority of PID patients (60–65%) have a defect in the lymphoid system, involving B- and/or T-cells alone or in combination with other cells (1–5). Flowcytometric immunophenotyping plays a central role in the diagnostic workup of patients suspected of PID, particularly those involving lymphoid cells (1, 6). An accurate immunophenotypic diagnosis is essential for guiding further functional testing as well as for genetic testing, whether Sanger sequencing or next generation sequencing (NGS) targeted to specific genes, whole exome sequencing (WES), whole genome sequencing (WGS) or combinations thereof (2, 5, 7–10). Considering the clinical heterogeneity in genetically homogeneous disease entities, immunophenotyping has an additional role in understanding the clinical heterogeneity in disease presentation and outcome (11–13). Immunophenotyping can also support treatment decisions and monitoring, such as in case of immunoglobulin (Ig) replacement therapy, hematopoietic stem cell transplantation, and gene therapy (7, 8, 14–18).
In complex diseases with high numbers of affected genes and still many genes to be discovered, some investigators recommend the “Genetics First” approach via targeted NGS, WES, and/or WGS, already at an early phase in the diagnostic process (19, 20). Indeed, in absence of other in-depth diagnostic methods, the “Genetics First” approach has clearly contributed to better classification and more insight in some well-defined disease categories with high genetic diagnosis yields, such as in intellectual disability syndrome, hereditary spastic paraplegias, and neuromuscular disorders (21–24). However, in the complex field of PID most targeted NGS and/or WES studies have genetic diagnosis yields varying from 15 to 30% (25–29), sometimes increasing to 40% or higher, depending on the number of targeted genes (varies from 170 to 571), young age (higher yield in children), high frequency of X-linked diseases, high frequency of families with PID history, and highly consanguineous populations with high frequencies of autosomal recessive diseases, such as in the Middle East and North Africa region (9, 30–34). Importantly, virtually all above-mentioned NGS and/or WES studies did not apply the “Genetics First” approach, because the included PID patients were defined according to the guidelines of the European Society for Immunodeficiencies (ESID) and the International Union of Immunological Societies (IUIS), which include flowcytometric immunophenotyping (2, 5, 6). In fact, the genetic diagnosis yield in immunophenotypically defined PID (sub)categories ranges from >95% in severe combined immunodeficiency (SCID), 85–90% in well-defined agammaglobulinemia patients, ~75% in Hyper IgM syndrome, down to 10–20% among the most frequently occurring PID, such as common variable immunodeficiency (CVID) and immunoglobulin (Ig) isotype deficiencies (5, 35–38).
Clearly, adequate clinical and immunophenotypic characterization of PID patients should guide the diagnostic process; this is supported by the diagnosis and classification guidelines of ESID, IUIS, and Clinical Immunology Society (CIS) (2, 6, 39). Compared to other organ systems, many different genes are involved in the immune system, particularly in mature B-cells during and after germinal center (GC) responses. Use of WES and WGS will detect many allelic immune gene variants, which might not be causally related to disease, implying that significant efforts in immunobiological validation studies will be needed. Furthermore, in-depth immunological and functional studies are essential to define the consequences of genetic defects for the immune system. At least part of these studies will be based on flow cytometry. Especially in case of hypomorphic defects, flow cytometry can help to better understand the effects of the genetic defect on the composition of the lymphoid compartment (11–13, 40, 41). Finally, flow cytometry is an important tool for monitoring of targeted therapies, including cellular therapies (15, 16, 18, 42).
Many PID centers have developed their own local multi-color flowcytometric protocols and antibody panels for diagnosis and classification of PID (8, 14, 43–45). These single-center initiatives have led to a great variability in sample processing, antibody panels, immunostaining procedures, instrument setup, sample measurement and data analysis. In addition, the low incidence and the clinical-immunological heterogeneity of PID hamper prospective multicenter diagnostic validation in large patient series and age-matched healthy controls (43–45). As a consequence, the typical but rare immunophenotypic PID patterns are difficult to compare between centers at the national and international level.
Whilst several recent international efforts have tried to harmonize flowcytometric diagnostics of PID (43–48), they have only been partially successful, mainly because these efforts have been restricted to parts of the full pathway of pre-analytical, analytical and post-analytical procedures, frequently focusing on the antibody panels only. Most proposed antibody panels aim at identification of severe defects in B and T lymphocytes, NK-cells, and/or diagnostic screening for a specific inherited disorder or a specific subgroup of disorders. Examples of such disease-oriented antibody panels are meant for: (i) diagnostic screening and classification of SCID based on quantification of B-, T- and NK-cells with CD3, CD19, and CD56 or CD16; (ii) diagnostic screening of congenital agammaglobulinemia, merely based on enumeration of blood B lymphocytes; (iii) classification of common variable immunodeficiency (CVID) according to the proportion of transitional, non-switched/marginal zone-like (smIgMD+) and class-switched (smIgMD−), and CD21dim B lymphocytes; (iv) diagnostic screening of DiGeorge patients based on relative blood counts of recent thymic emigrant (RTE) CD4+ T-cells, and; (v) quantification of CD4/CD8-double negative TCRαβ+ T-cells (DNT) for screening of autoimmune lymphoproliferative syndrome (ALPS) (49, 50). Consequently, such antibody panels do not provide a complete overview of the many distinct subsets of circulating leukocytes, as required for fast, efficient, and cost-effective PID diagnostics.
Several initiatives in other fields of clinical immunology have also lead to consensus antibody panels for harmonized flowcytometric immune monitoring, such as the CLIP study (51), the NIH study (52), the ONE study (53), the Pasteur initiative (54), and the NATURIMMUN consortium (55). These antibody panels allow identification of several subpopulations of B-, T-, and NK-cells (e.g., naïve vs. memory, activated cells, TCRγδ vs. TCRαβ) together with the identification of monocytes, dendritic cells, and granulocytes. However, the proposed antibody combinations do not provide the fully integrated information as needed for diagnosis and classification of PID.
Here we describe newly designed, fully validated EuroFlow procedures and tools for comprehensive immunophenotypic diagnostic screening and classification of PID of the lymphoid system. The proposed EuroFlow PID approach relies on: 1. Optimized and validated ≥8-color antibody panels; 2. Standardized procedures for sample preparation, immunostaining, acquisition, and analysis of up to millions of cells per sample; 3. Automated gating procedures for reproducible identification of the many different immune cell subsets in blood and bone marrow (BM). A diagnostic algorithm and age-related reference values are provided for guiding the flowcytometric PID diagnosis and classification process; the entries in the EuroFlow diagnostic algorithm are based on available clinical information and basic laboratory data (Figure 1A), followed by stepwise application of the newly designed antibody combinations with age-related reference values of lymphocyte subsets in absolute counts (Figures 1A,B).

Figure 1. Strategy for flowcytometric immunophenotyping for screening and classification of lymphoid PID. (A) EuroFlow algorithm. On the basis of several entries of clinical and laboratory parameters, blood samples of patients suspected to have PID are screened with the 8-color (or 10-color) PID Orientation tube (PIDOT). Based on the obtained results, additional 8-color or 10-color T- and/or B-cell classification tubes are applied in a stepwise fashion, including the BM B-cell precursor (BM-BCP) tube. In case of suspicion of PAD, both the PIDOT and the IgH-isotype tube(s) should be applied together. In case of suspicion of (S)CID and cases with strongly reduced TRECs, both the PIDOT and the SCID/RTE tube can be applied together. See text for detailed description of the stepwise application of the EuroFlow PID tubes. GC, germinal center; PAD, predominantly antibody deficiency; RTE, recent thymic emigrant; SCID, severe combined immunodeficiency. (B) Age-related reference values. Absolute counts of all lymphocyte subsets are provided in the format of age-related percentile bars (median; 25–75 percentiles; 10–90 percentiles; 5–95 percentiles). The age groups are: cord blood (n = 15), newborns (n = 16), 1–11 months (n = 19), 12–23 months (n = 30), 2–4 years (n = 35), 5–9 years (n = 28), 10–17 years (n = 33), 18–60 years (n = 79), and >60 years (n = 66). In case of naïve TCRαβ+CD4+ T-cells, CM/TM TCRαβ+CD4+ T-cells, EM TCRαβ+ CD4+ T-cells, TCRγδ+ T-cells, naïve TCRαβ+CD8+, CM/TM TCRαβ+CD8+ T-cells, EM TCRαβ+CD8+ T-cells, TCRαβ+CD4−CD8− T-cells, IgM+ plasmablasts, IgG+ plasmablasts, and IgA+ plasmablasts, the age groups of 10–17 years and >60 years contained only n = 18 and n = 21 individuals, respectively. The original data set with the age-related reference values will be available via the EuroFlow website (www.EuroFlow.org) and will continuously be updated when more data become available, also for other leukocyte subsets.
This report describes the overall EuroFlow PID approach, while detailed validation and reference value studies, including healthy subjects and PID patient series, are provided per PID tube (set) in separate EuroFlow PID reports (56–60).
Methods
Design of the EuroFlow-PID Study
The design of the EuroFlow PID study took advantage of the experience built in the field of leukemia and lymphoma diagnosis, classification, and monitoring (61–65) and the previously developed EuroFlow pre-analytical and analytical standard operating procedures (SOPs) for sample collection, transportation and staining of ≥106 nucleated cells (63, 64), together with EuroFlow 8-color instrument set-up and calibration procedures (62), extended to ≥12-color flow cytometry (56). Multicenter evaluation of the performance of antibody panels was done in consecutive cycles of design-testing-evaluation-redesign in large series of healthy controls and patient samples in 10 EuroFlow centers, experienced in PID diagnostics (56–59). For this purpose we used EuroFlow multivariate analytical tools (66), incorporated in the Infinicyt software and developed by Cytognos SL (Salamanca, Spain).
Stepwise application of newly-designed and validated antibody combinations and available clinical and laboratory information resulted in an algorithm for guiding immunophenotypic diagnosis and classification of PID. The final versions of the EuroFlow PID tubes were used to build EuroFlow databases of normal and patient samples, for automated classification of cell populations (i.e., automated gating) and disease profiles (i.e., orientation of PID diagnosis and classification), as described in detail elsewhere (64, 65, 67).
The multiple cycles of design-testing-evaluation-redesign started in 2012 and took a total of 6 years and 20 in-person EuroFlow PID meetings to reach the final results. No single EuroFlow laboratory could have afforded the above described efforts on its own. Solely thanks to intensive collaboration and frequent exchange of results and information during the EuroFlow meetings, the here described results could be achieved, supported by local funds and by royalty income from pre-existing EuroFlow patents in the leukemia-lymphoma field.
Flow Cytometers and Instrument Settings and Calibration
Most laboratories (9 out of 10) used FACSCanto-II flowcytometers (BD Biosciences, San Jose, CA), one laboratory used a Navios flowcytometer (Beckman-Coulter, Hialeah, FL). Standardized EuroFlow SOPs for instrument set-up and calibration were used for both instruments, as provided in detail via the EuroFlow website (www.EuroFlow.org) and by Kalina et al. (62). With such protocols, fully comparable results are obtained as previously demonstrated for both FACSCanto II, Navios, and other ≥8-color instruments, even when run by different operators (68).
For condensing sets of two 8-color tubes into single 12-color tubes, BD LSR Fortessa X-20 or FACSLyric instruments (BD Biosciences) were used in four centers where the EuroFlow instrument set-up and calibration SOPs were extended for the required extra colors, as described elsewhere (56, 58) and on the EuroFlow website (www.EuroFlow.org).
EuroFlow Standard Operating Procedures for Sample Preparation and Acquisition of High Cell Numbers
To gain detailed insight into the composition of the lymphocyte compartment, including robust identification of small cell populations such as plasmablasts subsets, EuroFlow developed SOPs for acquisition of high cell numbers (≥1–5 × 10⁶ total nucleated cells) and/or large sample volumes (up to 2 mL per tube) (56, 63, 64). These procedures can be used for fresh (<36 h, preferably <24 h) blood and BM samples (69).
For acquisition of high cell numbers, the EuroFlow bulk-lysis-and-stain technique is recommended (56, 64), as described also on the EuroFlow website (www.EuroFlow.org). Briefly, the sample (up to 2 mL) is diluted in a total volume of 50 mL of an ammonium chloride hypotonic solution (1:25 mL vol:vol per 50 mL tube), gently mixed and incubated for 15 min in a roller. Then, nucleated cells were centrifuged and washed twice in phosphate buffered saline (PBS) containing 0.5% bovine serum albumin (BSA). Subsequently, the surface membrane markers on nucleated cells are stained with the corresponding antibody mixtures. Overall, ≥1–5 × 10⁶ nucleated cells were measured for each antibody combination.
Construction of Antibody Panels
Antibody panels were designed for unequivocal identification and full dissection of lymphocyte subsets and their maturation-associated pathways, in parallel to other leukocyte subpopulations, which might show uniquely altered patterns in different PID categories. Specific combinations of fluorochrome-conjugated reagents were selected based on the need for brightness, stability, limited fluorescence spill-over and compensation requirements, as described elsewhere (58, 62, 70). These antibody combinations were evaluated in parallel in multiple centers (at least 4 centers per testing round) and they were optimized via multiple consecutive cycles of design-testing-evaluation-redesign. In each testing cycle, the Infinicyt software was used to identify antibodies for optimal recognition and clear-cut separation of the target cell subsets, while other antibodies were discarded because of insufficient separation of target cell subsets, poor contribution and/or redundancy, as exemplified for the PIDOT in Van der Burg et al. (59). Once optimal recognition and separation of the different target cell subsets was achieved with high reproducibility among the different laboratories, the antibody combination was frozen for final validation in large series of normal and PID patient samples (56, 59, 60). This included an intra-laboratory and inter-laboratory coefficient of variation (CV) for the identification of different minor and major lymphoid subsets of <10 and <30%, respectively, as described for example for the PIDOT (60) and the IgH-isotype tube (57).
Optimal recognition and clear-cut separation of target cell populations avoids arbitrary marker settings between cell populations with vague cutoff values, which easily vary between different laboratories, particularly when different antibody clones and fluorochrome conjugates are used. Therefore, the above described procedures are essential for obtaining reproducible results, which allow comparison of flowcytometric patterns of PID patients between centers at the international level.
Patients and Age-Matched Healthy Controls
The proposed antibody panels were extensively evaluated in multicenter studies by analyzing blood (n = 541) and BM (n = 43) samples. Blood samples from healthy controls (n = 300) included different age groups: cord blood (n = 15), newborns (n = 16), 1–11 months (n = 19), 12–23 months (n = 30), 2–4 years (n = 35), 5–9 years (n = 28), 10–17 years (n = 33), 18–60 years (n = 79), and >60 years (n = 66).
The PID patients included in the study were all genetically-defined cases, except for the most frequent subgroups of predominantly antibody deficiencies (CVID, Ig-subclass deficiencies), for which the ESID and IUIS diagnostic and classification criteria (1, 5) were applied. The PID patients (n = 241) concerned: SCID (n = 24), CVID (n = 66), DiGeorge syndrome (n = 6), ALPS (n = 5), Wiskott-Aldrich Syndrome (n = 3), selective IgA-deficiency (n = 68), BTK-deficiency (n = 10), CD40L-deficiency (n = 6), other less profound CID (n = 6), other CID with syndromic features (n = 11), and several other PID subgroups (n = 36), such as IgG subclass deficiency with IgA deficiency (n = 10), PI3K delta syndrome (n = 5), GATA2 deficiency (n = 5), other diseases of immune dysregulation (n = 4), together with other PID patients not classified as primary defects of the lymphoid system, e.g., chronic granulomatous disease (n = 5), defects of innate immunity (n = 3) and complement deficiencies (n = 4) (59).
Normal blood samples were obtained from healthy adult volunteers or from children upon informed consent of the parents. The BM samples concerned remaining cell material of sibling BM stem cell transplantation donors who consented to participate in the study. All normal and patient samples were collected in tubes containing EDTA as anti-coagulant and processed within 24 h after sampling (69).
Ethical approval and informed consent procedures were according to the local ethical guidelines of the participating EuroFlow institutions and the Declaration of Helsinki (University of Salamanca, Salamanca, Spain; Charles University, Prague, Czech Republic; La Paz Hospital, Madrid, Spain; Erasmus MC, Rotterdam, The Netherlands; University Hospital Ghent, Belgium; and St. Anne's University, Brno, Czech Republic). The study was approved by the local ethics committees of the participating centers: University of Salamanca, Salamanca, Spain (USAL CSIC 20-02-2013); Charles University, Prague, Czech Republic (15-28541A); Erasmus MC, Rotterdam, The Netherlands (MEC-2013-026); University Hospital Ghent, Belgium (B670201523515); and St. Anne's University, Brno, Czech Republic (METC 1G2015).
Data Acquisition and Data Analysis With EuroFlow Software Tools
Data acquisition was performed at low-medium speed (5,000–10,000 cells/s) using either FACSDiva (version 8) or the Navios software. For data analysis, the Infinicyt software (version 2.0) was used. Briefly, standardized Boolean gating strategies were defined and used for manual gating of the distinct cell populations identified in each tube. The merge function of the Infinicyt software was used to merge data files into reference databases. For each cell population its relative distribution among all nucleated cells, lymphocytes, and the corresponding B-, T-, and NK-cell subsets, were calculated and the MFI values per marker reported for each cell subset identified. In addition, absolute lymphocyte counts were calculated using a CD45PerCP, CD3FITC, CD19APC, and CD16+CD56PE TruCOUNT tube (BD Biosciences) following the instructions of the manufacturer.
For automated identification of the cell populations present in the PID tubes, PID databases were built, containing normal blood samples stained with the same antibody combination(s). Reference ranges with abnormality alarms were set per age-group, based on the analysis of a large cohort of 250 healthy control samples: cord blood (n = 15), childhood <18 years (n = 146), and adults ≥18 years (n = 89).
Multicenter Validation of PID Tubes
In order to ensure full comparability between the MFI per marker per cell subset in different samples stained at distinct centers, all EuroFlow centers were trained in the EuroFlow instrument set-up and calibration as well as sample preparation SOPs. Afterward, each center was enrolled in the EuroFlow Quality Assurance program (71, 72). EuroFlow QA program showed that overall QA results of EuroFlow laboratories showed CVs below 30% in more than 90 and 70% of cell populations in 59/72 (82%) and in 71/72 (99%) QA sets, irrespectively of the flowcytometer used and the participant.
In addition, normal blood samples stained with the PID Orientation tube upon strictly following the EuroFlow SOPs, showed ≤ 1% abnormality alarms for the normal lymphocyte and myeloid cell populations.
Results
EuroFlow Algorithm for PID Diagnosis and Classification
Suspicious patient features, such as recurrent and unusual infections, particularly with the same pathogen, auto-immunity, inflammation, lymphoproliferation, and/or organomegaly are triggers for application of the “PID Orientation tube” (PIDOT). In line with the EuroFlow PID algorithm (Figure 1A), the results of the PIDOT will guide the next steps:
- When the PIDOT identifies strongly reduced B-cell counts (<1 cell/μL; see Figure 1B) in the absence of a T-cell problem, the diagnosis of agammaglobulinemia is likely. In such case analysis of the B-cell precursor (BCP) compartment in BM with the PID-BCP tube might be informative to define the position and degree of blockade in early B-cell development, which differs between different genetic defects (37, 38).
- In case the PIDOT reveals reduced B-cell (subset) counts (<5th percentile ≈ <2 SD values; see Figure 1B), application of the “Pre- and Post-GC B-cell tubes” is advised.
- The results of the “Pre- and Post-GC B-cell tubes” might directly support the diagnosis of Hyper IgM syndrome or CD19 complex deficiency (Figure 1A).
- If the “Pre- and Post-GC B-cell tubes” do not detect plasmablasts in blood (<0.01 cell/μL; see Figure 1B), in the presence of reduced memory B-cell subsets, the CVID diagnosis should be considered (57). The IgH isotype tube can further support such diagnosis (57).
- If the “Pre- and Post-GC B-cell tubes” reveal IgH class aberrancies in memory B-cell subsets or plasmablast subsets (<5th percentile ≈ <2 SD values; see Figure 1B), application of the IgH isotype tubes is advised.
- When the PIDOT tube identifies virtually no (naïve) T-cells (<1 cell/μL; see Figure 1B), application of the “SCID/recent thymic emigrant (RTE)” tube is advised to confirm the lack of T-cell production. It should be noted that SCID patients might have normal or reduced T-cell counts in the virtual absence of naïve T-cells (<1 cell/μL; see Figure 1B) with T-cell “right shifts” to more mature T-cell subsets; this is typically seen in subgroups of SCID patients such as “leaky SCID” and Omen syndrome (59) and generally appear to concern oligoclonal expansions of mature T-cells (73, 74).
- In case of reduced T-cell (subset) counts (<5th percentile ≈ <2 SD values; see Figure 1B), application of the T-cell subset tube is proposed.
The combined results of all (n = 241) evaluated PID patients demonstrated that in patients with suspicion of predominantly antibody deficiency, e.g., recurrent respiratory infections, low serum Ig levels, and poor antibody response to vaccination, the PID Orientation tube should (at diagnostic screening) directly be combined with the “IgH-isotype B-cell tubes”.
Similarly, in case of infants with failure to thrive and severe recurrent infections with unusual pathogens, the “SCID/RTE tube” should directly be combined with the PID Orientation tube at diagnostic screening. Such combined SCID/RTE + PIDOT tube approach will also be useful for positive cases from newborn screening (NBS) programs, i.e., cases with strongly reduced T-cell receptor excision circles (TRECs) in blood (14, 75–77).Whenever specific diseases such as ALPS or XLP are suspected (e.g., increased CD4−/CD8− counts or increased total T-cells counts; Figure 1B) additional studies need to be performed (not addressed in this manuscript).
PID Orientation Tube
The PID Orientation tube has been designed for full dissection of all major blood leukocyte (sub)populations (n = 27) in a single tube (Figure 2). The choice of markers, corresponding antibodies and fluorochromes aim at reliable detection and quantitation of these blood leukocyte subsets and their potential alterations.
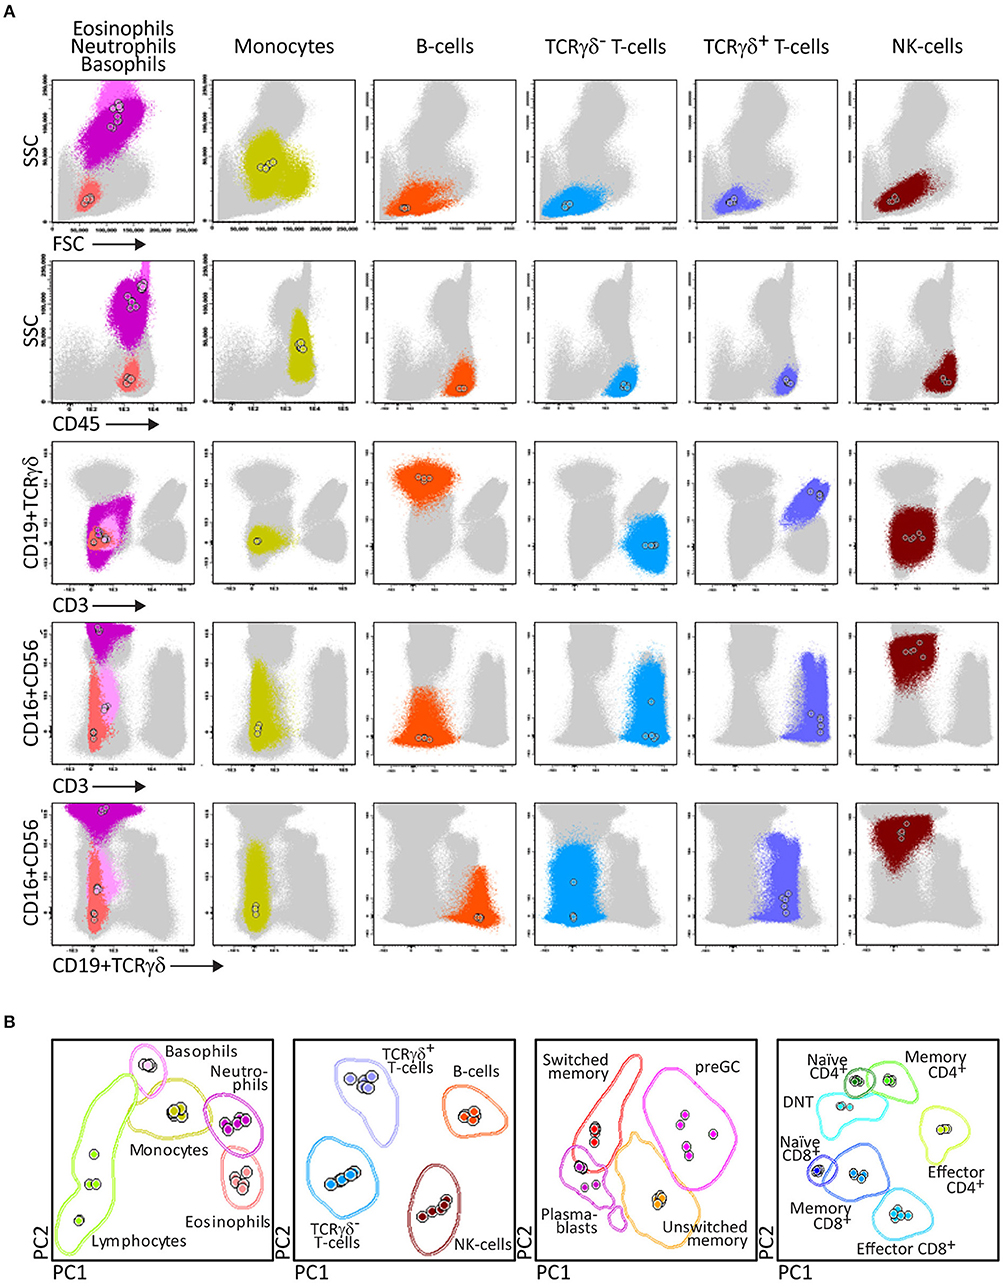
Figure 2. Generation of a reference principal component analysis 1 (PCA1) vs. PCA2 representation in an n-dimensional space for discrimination of the lymphocytes subsets identified with PIDOT. (A) Data files from 5 healthy donors were merged and lymphocyte subsets of interest identified using bivariate plots. (B) The merged data were used to define an n-dimensional space with the best principal component analysis 1 (PC1) vs. PC2 representation to discriminate these subsets. The PCA representation of the data is resumed in 2 × Standard Deviation (SD) curves to be used as a reference for supervised automatic analysis of the samples.
After four cycles of design-testing-evaluation-redesign, the final version of the 8-color PID Orientation tube consisted of 12 markers: CD27, CD45RA, CD8, IgD, CD16, CD56, CD4, IgM, CD19, CD3, CD45, and either TCRαβ or preferably TCRγδ, wherein the following antibody pairs CD8/IgD, CD16/CD56, CD4/IgM, and CD19/TCRγδ or CD19/TCRαβ are conjugated to the same fluorochrome (Table 1). These reagents aim at detailed dissection of eight major blood leukocyte subsets (Figure 2): B-cells, T-cells, NK-cells, monocytes (including non-classical CD16+ monocytes), dendritic cells, basophils, neutrophils and eosinophils. Additionally, B-cells and T-cells can be classified into a total of four and twelve different maturation pathway-associated subsets, respectively. Accordingly, B-cells are divided into pre-GC B-cells (including both immature/transitional and naïve B-cells), unswitched (including IgM+IgD+, IgM-only and IgD-only) and Ig-switched memory B-cells (MBC) and generally also plasmablasts (Figure 2). The T-cell compartment can be divided into different functional subsets according to the TCRγδ or TCRαβ lineage and according to CD4 and CD8 expression. These T-cell subsets can be further subdivided according to their maturation stage into naïve, central/transitional memory, and effector memory/terminally differentiated T-cells (Figure 2).
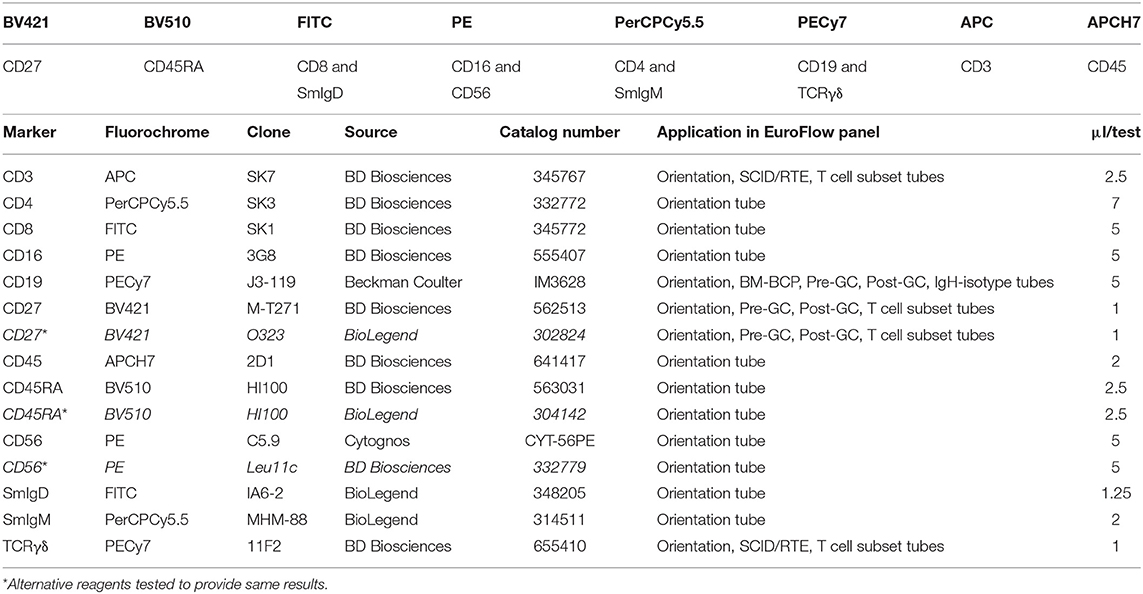
Table 1. Composition of the 8-color PID Orientation tube and technical information on reagents.
Therefore, the PID Orientation tube detects defects in the production of B-cells, T-cells and NK-cells, together with alterations (defective but also increase) in the production of monocytes, dendritic cells, neutrophils, eosinophils, and basophils. Three typical PID patient examples (STAT3, IL2RG, and RAG2 deficiency) are shown in Figure 3 to illustrate the disease-associated immunophenotypic profiles. However, in most cases the PID Orientation tube does not allow precise (sub)classification of the T-cell and B-cell defects, implying that further characterization is required with additional B-cell and T-cell tubes, according to the EuroFlow PID algorithm (Figure 1A), as described below [see also (59)].
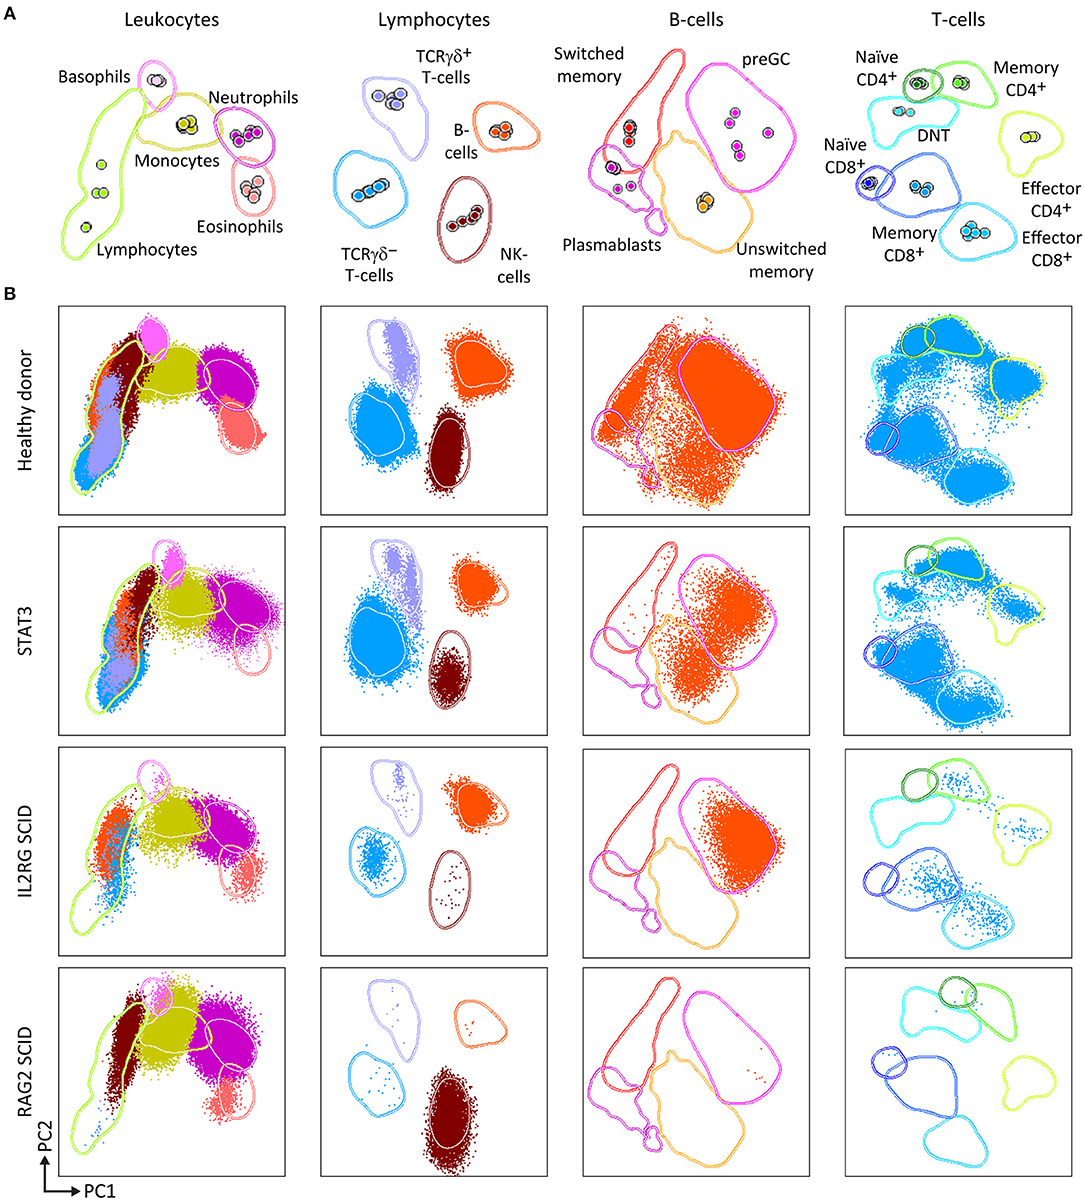
Figure 3. PCA representation of PIDOT results, showing the distinct blood leukocyte subsets in the reference data file and supervised analysis of blood samples from a healthy donor and three different PID patients. (A) Reference principal component analysis. PCA1 vs. PCA2 representation was generated from five healthy donors data files, analyzed with the EuroFlow PIDOT. (B) Different patient samples were analyzed against the healthy donor PCA reference. Blood samples from a healthy donor, a patient with mutated STAT3, a SCID patient with IL2 receptor gamma chain (IL2RG) deficiency, and a SCID patient with recombination activating gene 2 (RAG2) deficiency were stained and acquired under identical/comparable conditions. The STAT3 deficient patient shows the typical pattern of reduced naïve T-cells, virtually no IgH-class switched B-cells, and no eosinophils. The IL2RG deficient SCID patient has virtually no T-cells, particularly no naïve T-cells (<1 cell/μL; see Figure 1B), B-cells are present, but no memory B-cells or plasmablasts, and NK-cells are virtually absent. The RAG2 deficient SCID patient has no B-cells and no T-cells, while NK-cells are present in normal numbers. DNT, double negative T-cells, negative for CD4 and CD8, but positive for CD3.
Some diagnostic laboratories in the PID field use a simple B-T-NK tube as first screening step, while most laboratories use several 4- to 6-color tubes in parallel to perform initial screening (generally using 12–18 antibodies with multiple repeats). The here proposed 8-color tube with 12 antibodies provides information on up to 20 different leukocyte (sub)populations, clearly separated in multidimensional principal component analysis (Figures 2, 3), thereby providing the basis for further classification of PID of the lymphoid system.
B-Cell Tubes
For antibody deficiencies and combined T/B-cell defects, detailed analysis of the B-cell compartment in blood and BM is required. B-cells originate from the BCP differentiation pathway in BM into immature and naïve B-cells that enter the periphery, including blood. In the periphery, the B-cells encounter antigen which induces a GC reaction. Consequently, blood contains naïve B-cells that did not yet undergo a GC reaction (pre-GC B-cells) or that have already been exposed to antigen, such as antigen-experienced memory B-cells (MBC), plasmablasts and plasma cells. The antigen-experienced subsets can be further subdivided according to class switching of their IgH-isotypes (and subclasses): IgM, IgD, IgE, IgG (including IgG1, IgG2, IgG3, IgG4), and IgA (including IgA1, IgA2).
Therefore two 8-color panels were designed for the identification of (i) different pre-GC B-cell subsets, including immature/transitional, naïve CD5+ and naïve CD5− B-cells, and (ii) antigen-experienced subsets, including MBC and plasmablasts (Figure 4). The latter panel includes sub-classification of both MBC and PC according to IgH-isotype (IgM, IgD, IgG, IgA, IgE). Further IgH subsetting according to the specific subclasses (IgM, IgD, IgG1, IgG2, IgG3, IgG4, IgA1, and IgA2) was designed in a combination of two separate 8-color tubes or a single 10 or 12-color tube (56).
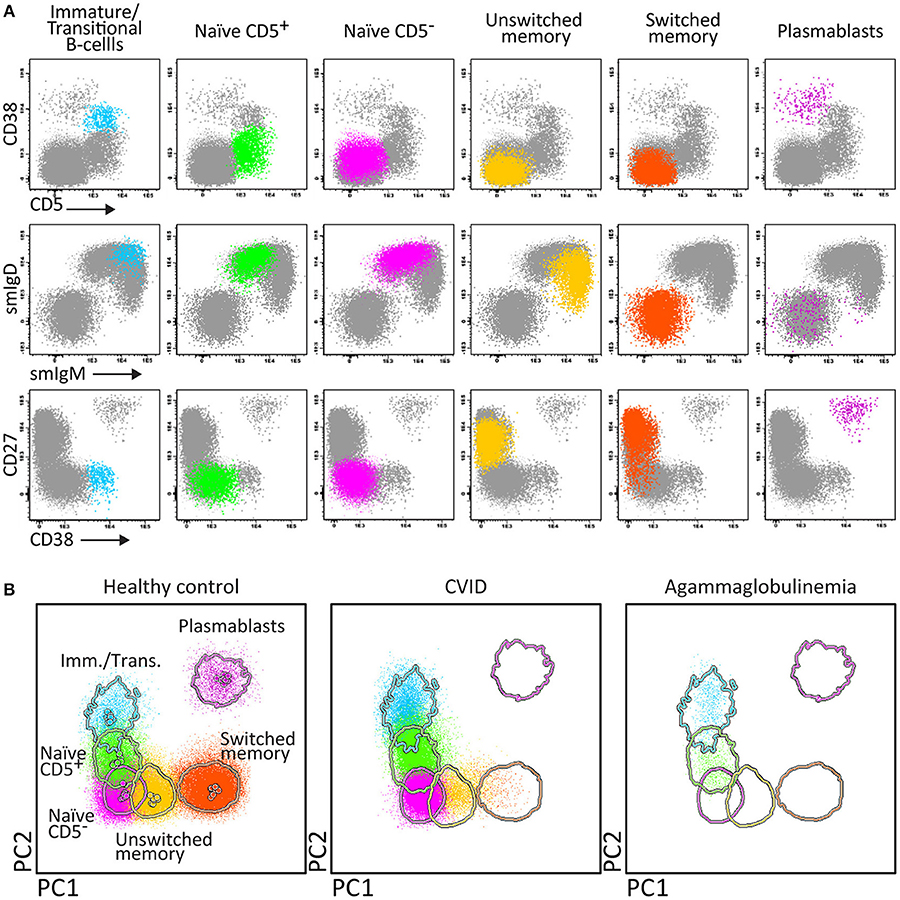
Figure 4. Application of the Pre-GC tube, showing the major B-cell subsets in blood of healthy controls, and PID patients using classical 2-dimensional plots vs. n-dimensional PCA. Analysis of circulating B-cell subsets (FS/SSloCD19+) identified within 2 × 10⁶ blood leukocytes using the markers from the Pre-GC tube: Immature (CD5+ CD27− CD38++ smIgM++ smIgD+), CD5+ and CD5− naïve B-cells (CD27− CD38+d smIgM+ smIgD++), Ig non-switched and Ig-switched memory B-cells (CD5− CD27+ CD38− smIgM+ smIgD++ and CD5− CD27+/− CD38− smIgM− smIgD−, respectively), and plasmablasts (CD5− CD27++ CD38+++). (A) The identification of biologically relevant subsets of B-cells using the minimum number of bivariate plots required for a 5 marker-combination (three bivariate plots/cell population). (B) The same data via PC1 vs. PC2 representation of a 5-dimensional space in blood of six healthy controls (left panel), in blood of a patient with common variable immunodeficiency (CVID; middle) and in blood of a patient with agammaglobulinemia (right), all stained with the Pre-GC tube under comparable conditions. The CVID patient lacks plasmablasts in blood (<0.01 cell/μL blood) and has reduced IgH-class switched MBC. The agammaglobulinemia patient has no plasmablasts, no MBC, and also the naïve B-cell compartment is strongly reduced.
Accordingly, the EuroFlow 8-color PID B-cell tube set consists of five tubes for detailed subsetting of blood pre-GC B-cells (Pre-GC B-cell tube), antigen-experienced B-cells (Post-GC B-cell tube), including detailed IgH-isotype and subclass analysis of MBC and plasmablasts (IgH-isotype B-cell tubes 1 and 2), and BM BCP analysis (BCP tube) (Figure 1A).
Briefly, the “Pre-GC B-cell tube” contains CD27, IgM, CD38, CD5, IgD, CD19, CD21, and CD24 markers (Table 2), which allows detection of immature/transitional B-cells, CD5+ and CD5− naïve B-cells (including their CD21 and CD24 subsets), unswitched (including IgM+IgD+, IgM-only, and IgD-only) and switched MBC and PC. The “Post-GC B-cell tube” contains CD27, IgM, IgA, IgG, IgD, CD19, CD21, CD38, and optionally IgE, wherein two distinctly labeled antibodies against IgA allow to have the IgE/IgA pair and IgG/IgA pair conjugated to the same fluorochrome (Table 2) (78). The “IgH-Isotype B-cell tube-1 and tube-2” (Figure 5A) both contain CD27, IgM, IgD, CD19, CD21, and CD38 together with IgG4, IgG2, IgG1, or with IgA2, IgA1, IgG3, respectively. In this composition two distinctly labeled antibodies against IgG2 and IgA1 are used, wherein the antibodies within the pairs IgG1/IgG2 and IgG2/IgG4 or IgA1/IgG3 and IgA1/IgA2 are conjugated to the same fluorochrome (Table 2).
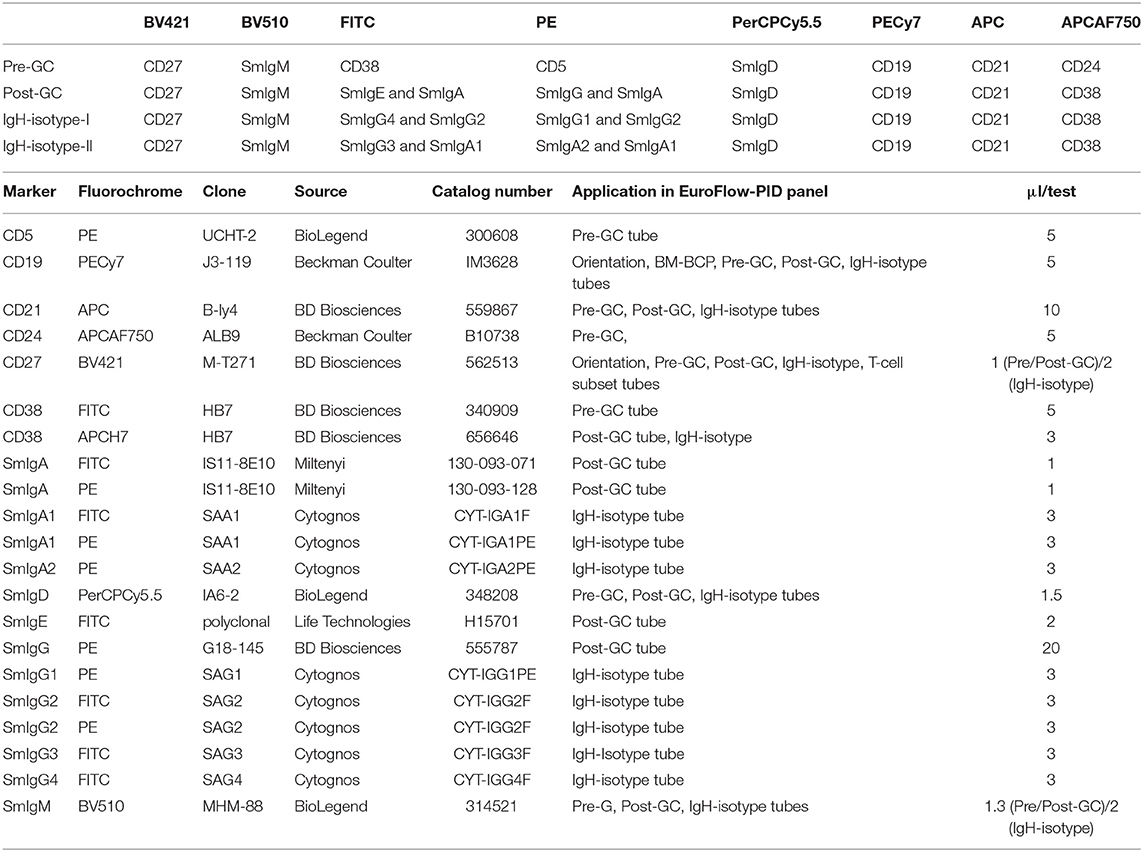
Table 2. Composition of the 8-color B-cell tubes and technical information on reagents.
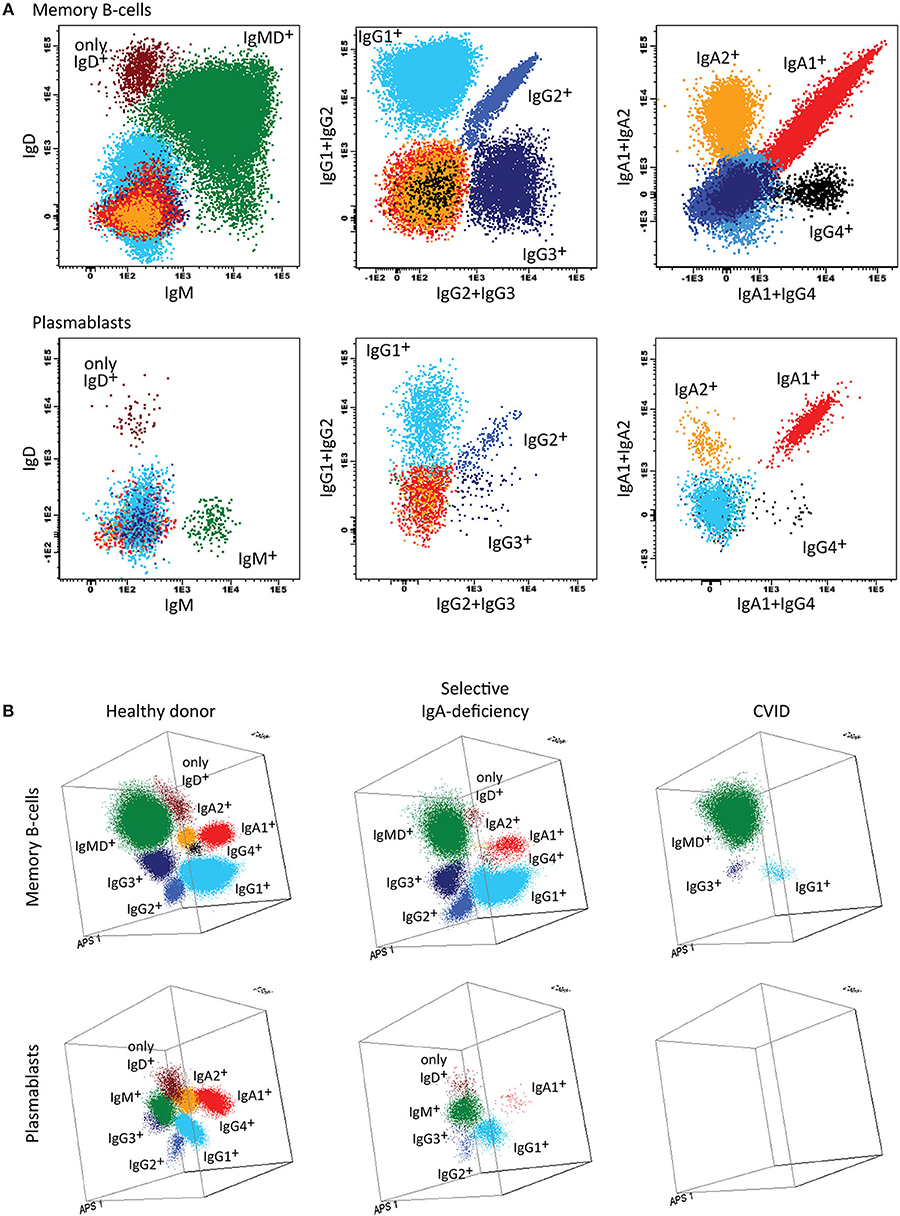
Figure 5. Application of the IgH-isotype tube for the dissection of switched memory B-cells and plasmablasts in blood from healthy donors and PID patients. (A) Bivariate plots showing the distribution of switched memory B-cells (smIgMD−CD19+CD38−) and plasmablasts (CD19+CD27++CD38+++) according to the surface membrane expression of the different IgH-isotypes (IgG1, IgG2, IgG3, IgG4, IgA1, and IgA2) in 5 × 10⁶ peripheral blood leukocytes analyzed with the IgH-isotype tubes in samples from a healthy adult. (B) Three dimensional PCA representation of IgH-isotype subsets in memory B-cells (top) and plasmablasts (lower) in a healthy adult donor (left), a selective IgA-deficient patient (middle), and a CVID patient (right). No plasmablasts were detected in blood from the CVID patient (count of <0.01 cells/μL blood), while variable defects were detected in the memory B-cell compartment, particularly involving switched memory B-cells. The defects in the IgA-deficient patient mainly concerned the IgA-class-switched plasmablasts.
Finally, the BCP-BM tube consists of the seven cell surface membrane markers CD20, IgM, CD38, IgD, CD19, CD34, and CD10 and the three intracellular markers cyIgμ, nuTdT, and cyCD79a (Table 3). This combination of markers allows detailed analysis of the BM-BCP compartment from the CD19-negative stage until the naïve B-cells and can visualize complete and partial blocks in BCP differentiation as well as aberrant expression profiles (Wentink et al., unpublished results).
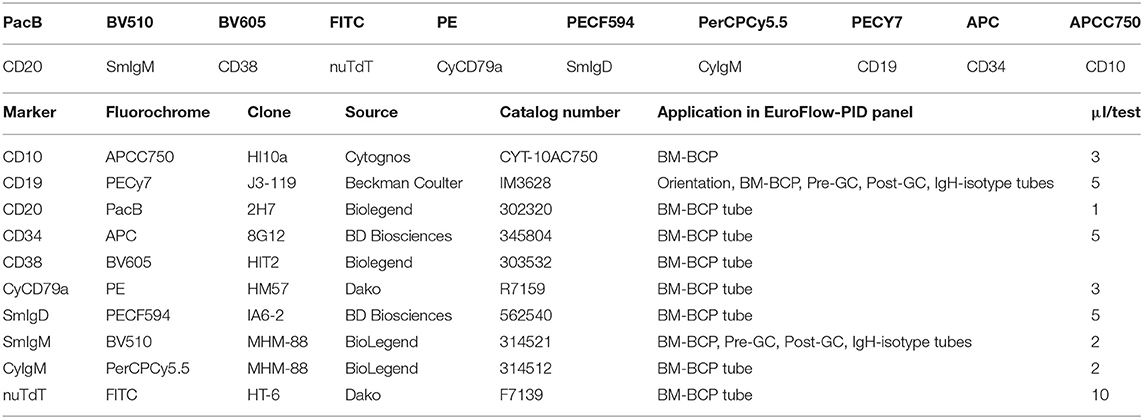
Table 3. Composition of the 10-color BM-BCP tube and technical information on reagents.
For reasons of efficiency, the two IgH-isotype tubes can be combined into a single 10-color IgH-isotype tube with CD27, IgM, IgG3, IgG2, IgG1, IgD, CD19, CD21, CD38, IgA1, IgA2, and IgG4, with two distinctly labeled antibodies against IgG2 and two distinctly labeled antibodies against IgA1 (“10-color IgH-isotype tube”). Preferably, the four blood B-cell tubes (Pre-GC, Post-GC, and the two IgH-isotype tubes) can be combined into a single 12-color tube by the further addition of CD5 and CD24 (“12-color IgH-isotype B-cell tube”) (56, 57).
In summary, the Pre-GC and Post-GC tubes can visualize blockades in differentiation of transitional to mature naïve B-cells in e.g., a subset of XLA patients, and variable defects in IgH-switched MBC and plasmablasts, such as in patients with Hyper IgM syndrome, CD19 complex deficiencies, IgH class aberrancies, and CVID with almost systematic absence of plasmablasts (<0.01 cell/uL) (Figures 1B, 4B) (57). In addition, the IgH-isotype tubes can uncover more subtle defects in IgH-class switching e.g., in selective IgA- and IgG-subclass deficiencies (Figure 5B) (57). Finally, the BCP tube detects early blockades in BCP maturation in BM.
T-Cell Tubes
In many cases with suspicion of PID of the lymphoid system, analysis of T-cell subsets is an essential part of making a correct diagnosis. If the PID Orientation tube indicates reduced T-cell (subset) counts or abnormal T-cell maturation, further investigation of the blood T-cell compartment is recommended. The SCID/RTE tube is meant for cases with strongly reduced (naïve) T-cell production (<1 cell/μL; see Figure 1B), whereas the T-cell subset tube should be applied when the PID orientation tubes reveals an imbalanced composition of the memory and effector T-cell compartments.
In case of high suspicion of SCID in children of <1 year with severe recurrent infections by unusual pathogens and failure to thrive, the SCID/RTE tube should be directly applied in combination with the PID Orientation tube (Figures 1A, 6). In such patients the detected blood T-cells might be (non-autologous) transplacentally-derived maternal T-cells. The predominant presence of (activated) memory T-cells (either autologous or maternal) in the absence of T-cells recently emigrated from the thymus (RTE), further supports the SCID diagnosis (Figure 6).
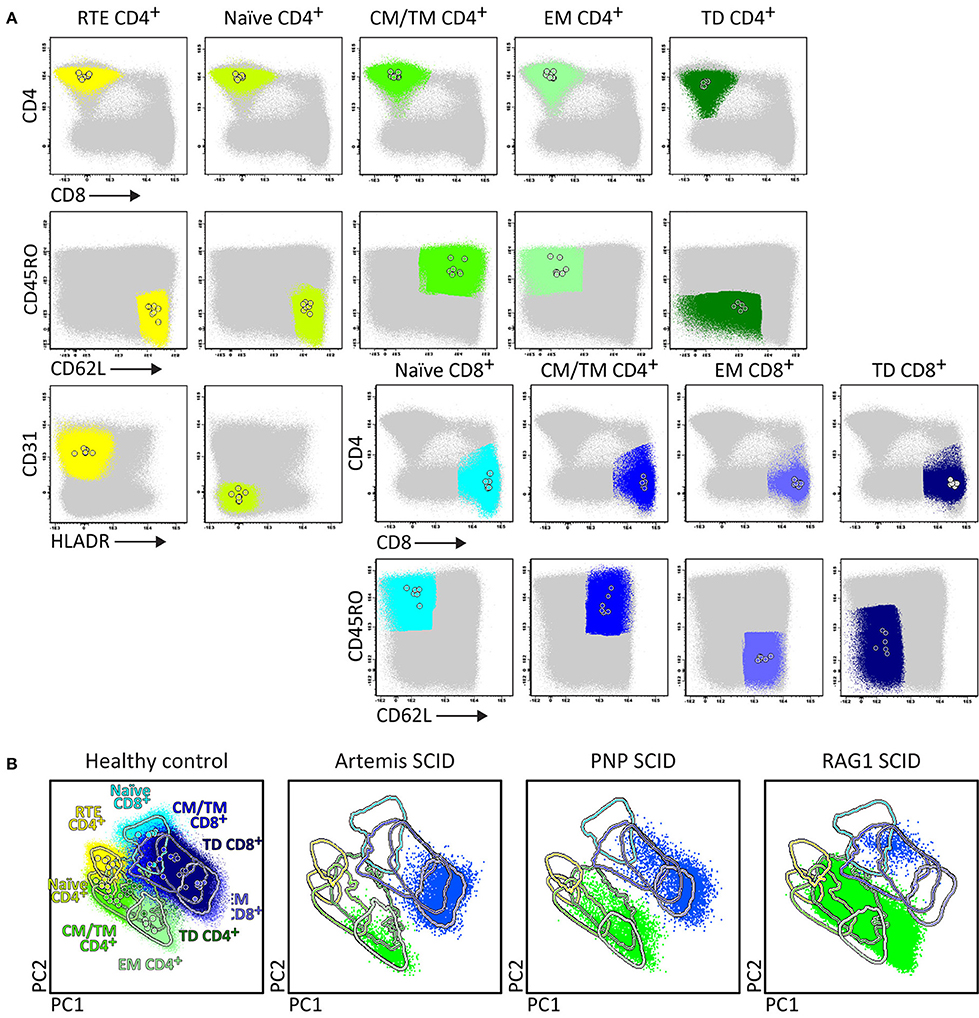
Figure 6. Application of the RTE-SCID tube in healthy controls and T-cell defects. Analysis of circulating T-cell subsets (FS/SSloCD3+) identified within 1x10⁶ blood leukocytes using the markers from the RTE-SCID tube: Recent Thymic Emigrants (RTE) CD4+ T-cells (CD4+ CD8− CD45RO− CD62L+ CD31+ HLA-DR−), and naïve (CD45RO− CD62L+ CD31+ HLA-DR−), Central/Transitional Memory (CM/TM) (CD45RO+ CD62L+), Effector Memory (EM) (CD45RO+ CD62L−), and Terminally Differentiated (TD) (CD45RO− CD62L−) CD4+ and CD8+ T-cells. (A) The identification of biologically relevant T-cell subsets in six healthy controls using the minimum number of bivariate plots required for a 6 marker-combination (three bivariate plots/cell population). (B) Comparable T-cell data via PCA1 vs. PCA2 representation of a 6-dimensional space in six healthy controls (left) as well as in three severe combined immunodeficiency (SCID) patients, diagnosed with Artemis, PNP and RAG-1 defects, all stained with the RTE/SCID tube under comparable conditions. All three SCID patients show “leakiness” with virtually complete absence of naïve T-cells (<1 cell/μL blood) and clear “right shift” to mature CM/TM, EM, and TD T-cells in both the CD4 and CD8 lineages.
Upfront identification of the major TCRγδ, TCRαβ, CD4, and CD8 T-cell lineages is required for further detailed dissection of their maturation pathways into (CD31+) RTE, naïve, memory and effector subsets, including activated (HLA-DR+) T-cells (Figure 6). The T-cell subset tube further dissects the blood T-cell lineages into central memory (CM), transitional memory (TM), effector memory (EM), terminal differentiated (TD), and terminal effector (TE) subsets (Figure 7).
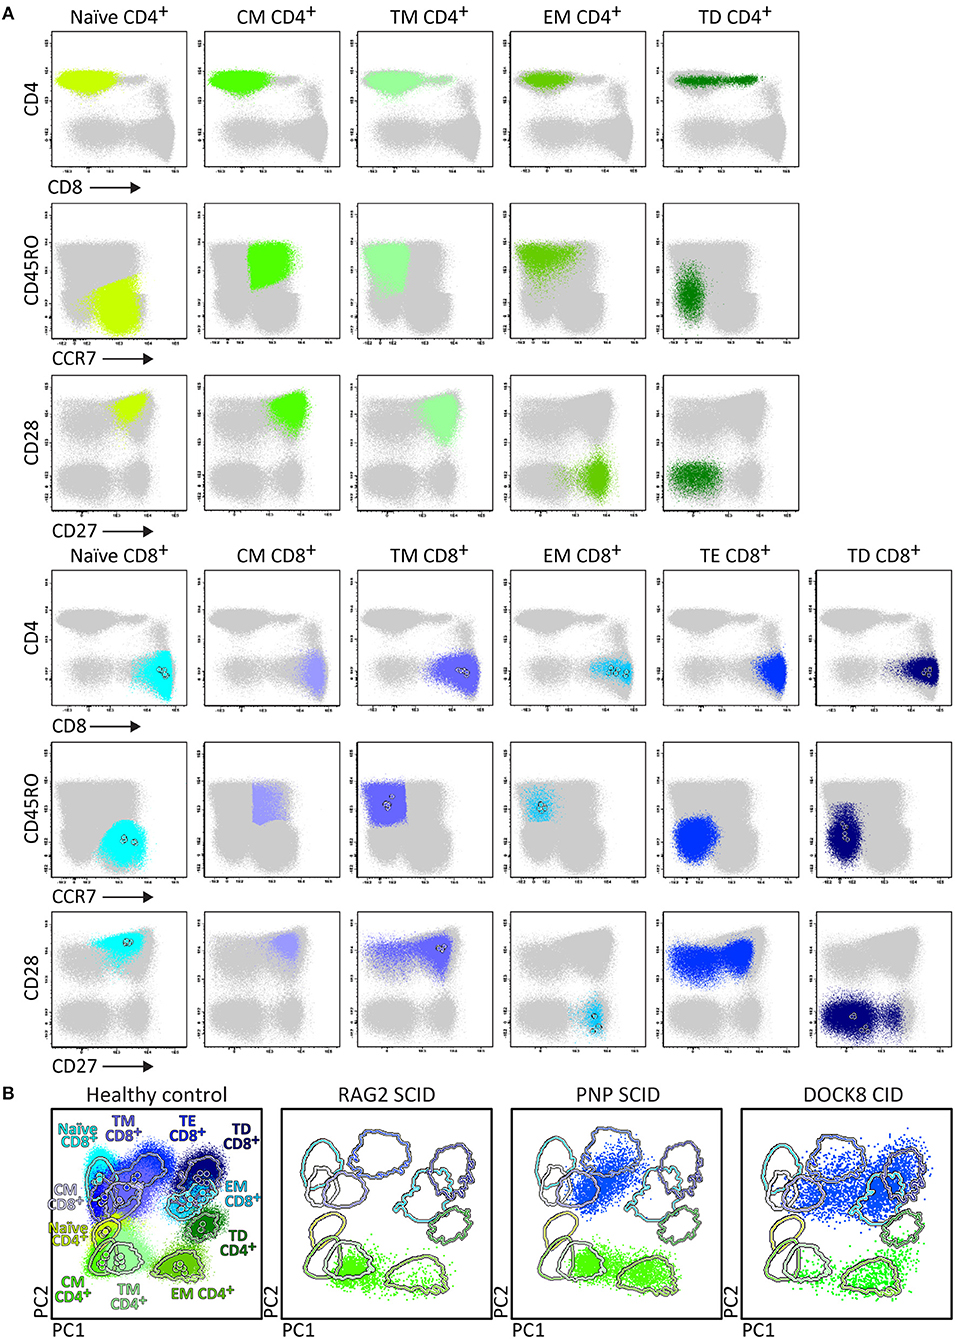
Figure 7. Application of the T-cell panel tube in healthy controls and PID patients with T-cell defects. Analysis of circulating T-cell subsets (FS/SSloCD3+) identified within 1 × 10⁶ blood leukocytes using the markers from the T-cell panel tube: naïve (CD45RO− CCR7+ CD27+ CD28+), Central Memory (CM) (CD45RO+ CCR7+ CD27+ CD28+), Transitional Memory (TM) (CD45RO+ CCR7− CD27+ CD28+/−), Effector Memory (EM) (CD45RO+ CCR7− CD27− CD28+), Terminal Effector (TE) (CD45RO− CCR7− CD27+ CD28+/−), and Terminally Differentiated (TD) (CD45RO− CCR7− CD27− CD28+/−) CD4+ and CD8+ T-cells. (A) The identification of biologically relevant subsets of T-cells in six healthy controls using the minimum number of bivariate plots required for a 6 marker-combination (three bivariate plots/cell population). (B) Comparable data via PCA1 vs. PCA2 representation of a 6-dimensional space in blood of six healthy controls (left) as compared to blood samples of three severe combined immunodeficiency (SCID) patients, diagnosed with RAG2, PNP, and DOCK8 defects, all stained with the RTE/SICD tube under comparable conditions. The SCID patients show “leakiness” with absence of naïve T-cells (<1 cell/μL blood) and variable “right shift” to mature CM/TM, EM, and TD T-cells in the CD4 lineage (all 3 SCID patients) and CD8 lineage (PNP and DOCK8 defects).
Briefly, two 8-color T-cell tubes have been designed: (i) the SCID/RTE tube with the five backbone markers CD3, CD4, CD8, CD45RO, and TCRαβ or TCRγδ, supplemented with the subsetting markers CD31, CD62L, HLA-DR for identification of RTEs and activated T-cells (Table 4); and (ii) the T-cell subset tube with the same five backbone markers, combined with CD27, CD28, and CCR7 (Table 4) for detailed dissection of the above mentioned memory and effector compartments (Figures 6, 7).
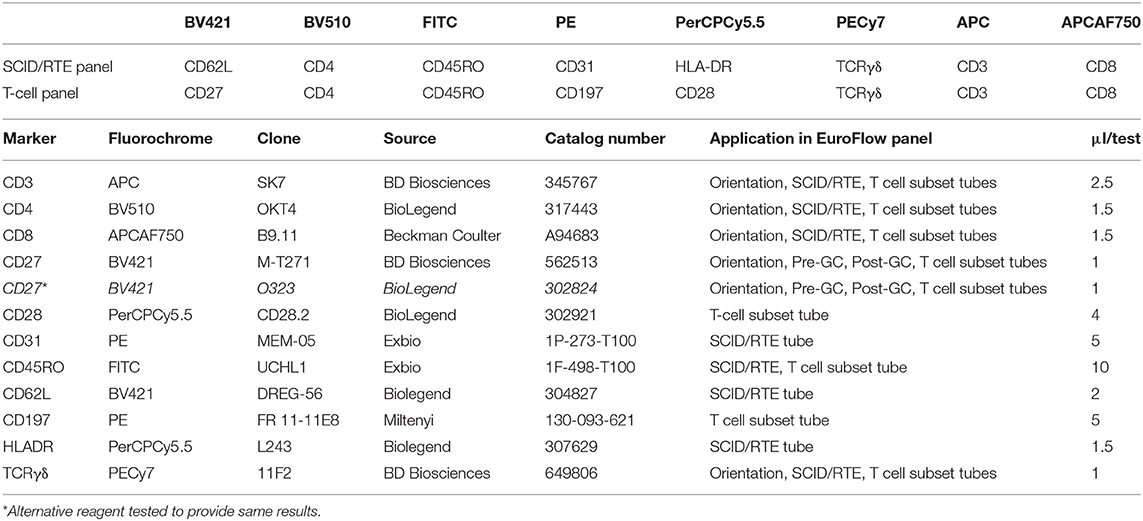
Table 4. Composition of the 8-color BM-BCP tube and technical information on reagents.
In summary, while the first tube identifies major defects in T-cell production, the second tube focusses on milder defects in T-cell production and/or altered T-cell responses (Figures 6, 7).
EuroFlow Reference Databases as Essential Tool for Easy, Fast, and Reproducible Analysis of Patient Samples
Similarly to the EuroFlow leukemia-lymphoma diagnosis and monitoring databases (64–66), reference databases have been generated for the EuroFlow PID tubes to facilitate: 1. Automated gating of all leukocyte subsets; 2. Identification of PID-associated immune cell profiles vs. normal age-matched reference values and phenotypes; and 3. Further sub-classification of PID cases into distinct diagnostic categories (Figures 2–7).
Stepwise application of the EuroFlow PID tubes according to the proposed algorithm (Figure 1A) supports the diagnosis of many PID evaluated so far (n = 233), and provides further classification of most lymphoid PID cases into distinct diagnostic categories according to altered flowcytometric immune cell profiles (Table 5). For example, the PIDOT together with the IgH-isotype tubes (Figure 8) support the diagnosis of virtually all IgA- and IgG-subclass deficiencies and CVID patients, including their detailed characterization (57). Figure 9 shows an example of combined application of the PIDOT, the Pre-GC tube and the T-cell subset tube in a patient with a WASp defect, showing several aberrancies in T-cell subsets.
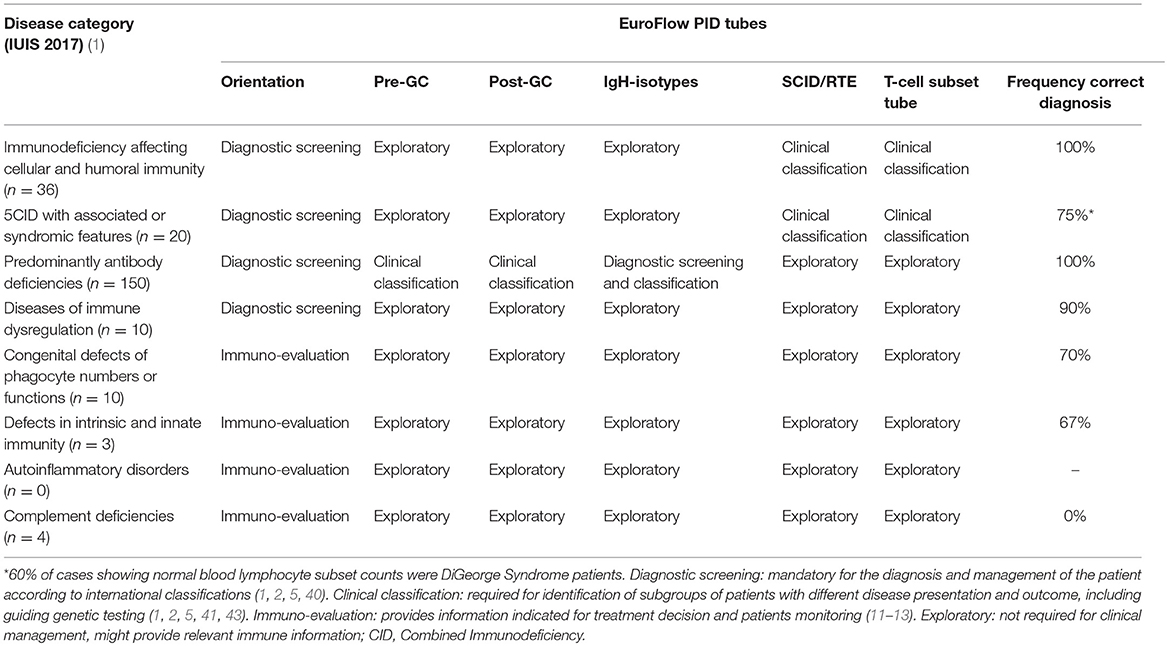
Table 5. Application of EuroFlow PID tubes for the primary immunodeficiency disease categories.
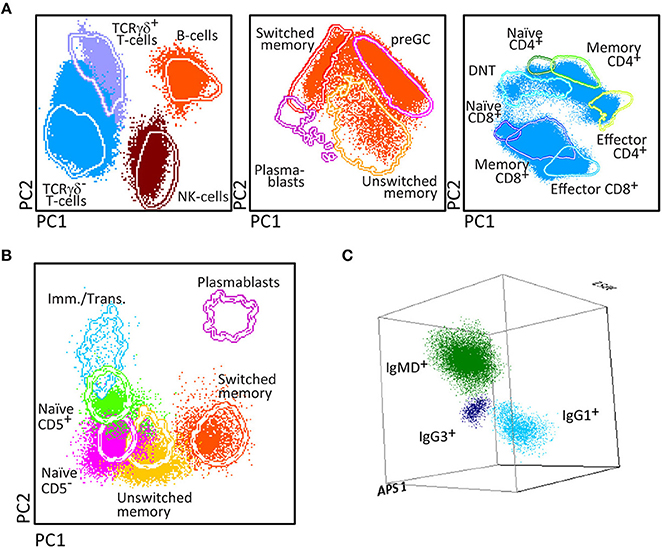
Figure 8. PCA representation of the biologically relevant subsets in a patient diagnosed with IgG2 subclass deficiency with IgA deficiency (40 years). The distribution of the biologically relevant PB lymphocyte subsets has been represented using multidimensional reference plots. The supervised analysis of the PID orientation tube using PC1 vs. PC2 reference plots (A) shows that plasmablasts were undetectable in the patient sample after acquiring 1 × 10⁶ cells. Lack of plasma cells was confirmed in the analysis of the Pre-GC and Post-GC B-cell tubes (B). In addition, three dimensional PCA representation of IgH-isotype subsets in memory B-cells (C) showed that although the counts of total switched memory B-cells was normal in the previous tubes, the subsets of IgG2+, IgA1+, and IgA2+ were undetectable with a sensitivity of 10 cells in a mL of peripheral blood (0.01 cells/μL).
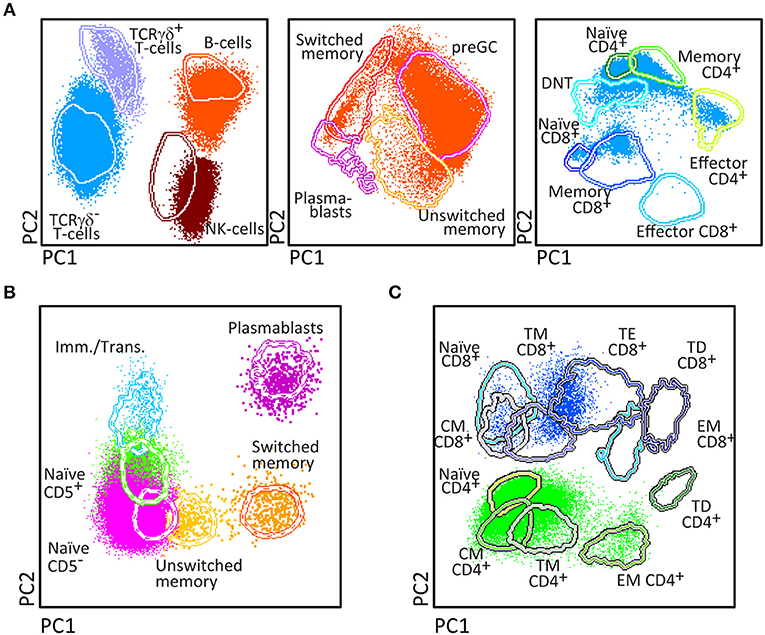
Figure 9. PCA representation of the biologically relevant subsets in a patient diagnosed with a WASp defect (5 years-old). The distribution of the biologically relevant PB lymphocyte subsets has been represented using multidimensional reference plots. The supervised analysis of the PID orientation tube using PC1 vs. PC2 reference plots (A) shows that low numbers of total and naïve CD8+ T-cells, and unswitched and switched memory B-cells, were detected in the patient sample after acquiring 1 × 10⁶ cells. Decreased counts of unswitched memory B-cells was confirmed in the analysis of the B-cell tubes (B). In addition, PCA1 vs. PCA2 representation of the T-cell tube (C) confirmed that naïve CD8+ T-cells were decreased.
More detailed results on the application of the individual EuroFlow PID tubes and their corresponding reference databases and age-matched reference values are provided in separate publications (57, 59) and are implemented in the EuroFlow-based Infinicyt software, respectively.
Discussion
Diagnosis and classification of rare diseases deserves well-defined strategies that are efficient and easily accessible, providing a diagnosis at an early stage, in order to prevent diagnostic delays with higher chances of irreversible organ damage. In case of PID, this requires awareness of general practitioners and pediatricians about the most efficient and cost-effective diagnostic pathways as proposed by ESID and IUIS (2, 5, 6). These diagnostic pathways include flowcytometric immunophenotyping at an early stage, which can guide other diagnostic tests such as functional assays and genetic studies.
Specialized reference centers are required for full diagnostics and clinical management of rare diseases such as PID. Broad and easy access to fast diagnostic screening strategies and linkage to these highly specialized PID reference centers of excellence shall reduce morbidity and mortality of PID patients. The medical indications for testing of PID are well-defined (“the 10 warning signs of PID”) and several consensus reports on stepwise diagnostic strategies have been proposed (2, 5, 7, 79, 80). However practical implementation of these consensus proposals has only partially been achieved. This is mainly due to lack of standardization in the pre-analytical and analytical laboratory procedures, particularly in flow cytometry and NGS/WES (9, 10, 43–45). At least in part, this lack of standardization is caused by the fast technological developments in both fields, which has led to great variability in technical procedures and assays between individual laboratories, thereby hampering comparability of diagnostic results, even among reference PID centers.
The main objectives of the EuroFlow Consortium were to innovate and standardize the flowcytometric techniques and strategies, applied in the diagnosis and classification of PID of the lymphoid system and to generate reliable and reproducible results across laboratories and countries, for guiding both functional testing and genetic testing in flowcytometrically-defined PID subgroups. To achieve these objectives, the EuroFlow Consortium took advantage of its concepts, technologies, tools and experience from the field of leukemia and lymphoma diagnosis, classification and monitoring (61–65). Consequently, we sequentially (i) developed 8-color tubes (and one 12-color BM tube) for efficient diagnostic testing and classification of PID in multiple multicenter cycles of design-testing-evaluation-redesign, following strict rules for selection of optimal combinations of antibody clones and their fluorochrome conjugates; (ii) validated the approved antibody tubes in healthy controls and PID patient series (56–59); (iii) constructed reference databases of normal samples and well-annotated patient samples, which can serve as templates for prospective data analysis; and (iv) provided the basis for standardized interpretation of the results obtained in individual laboratories, which apply the same EuroFlow methods and tools.
As evaluated in more than 240 PID patients, the stepwise application of the proposed tubes according to the EuroFlow PID algorithm (Figure 1A) provides efficient and cost-effective flowcytometric diagnostic screening and classification of virtually all PID of the lymphoid system, based on fast, sensitive, easy, and reproducible identification and enumeration of all relevant subsets (Figure 1). The B-cell tubes have proven to more accurately dissect the blood memory B-cell and plasmablast compartments than achieved previously, thereby providing new possibilities to better diagnose and classify antibody deficiencies, including IgH-subclass deficiencies and CVID (57). In patients suspected of SCID (e.g., in the TREC-based NBS programs), the combined application of the PIDOT and SCID tubes will be highly informative (14, 75–77). Furthermore, the diagnostic procedures for secondary immunodeficiencies might profit as well from the proposed PID tubes and tools (81). Still several subsets of PID patients might present with no or minimally altered lymphoid subset numbers, such as in some DiGeorge patients and part of ALPS, Nijmegen breakage syndrome and ataxia telangiectasia patients at young age. In such cases functional and genetic testing are more informative. Finally, in this study not all types of lymphoid PID could be studied in large series, implying that more cases of the rare diagnostic PID categories should be evaluated. This will be a continuous process to further support the clinical use of the proposed PID tubes; the EuroFlow Consortium will continue to contribute to this process.
Based on our experience in the leukemia and lymphoma field, we believe that the provided standardized strategies, tools, and reference databases are cost-effective and can easily be implemented, not only in specialized PID reference centers, but in any medical immunology laboratory equipped with an 8-color flow cytometer in any PID center in the world. However, it should be noted that standardized flow cytometry, although critical for PID evaluation, does not replace and has to be coupled to immunological functional and genetic testing in order to reach a final diagnosis in most cases.
Ethics Statement
The study was approved by the local ethics committees of the participating centers [University of Salamanca, Salamanca, Spain (USAL CSIC 20-02-2013); Charles University, Prague, Czech Republic (15-28541A); Erasmus MC, Rotterdam, The Netherlands (MEC-2013-026); University Hospital Ghent, Belgium (B670201523515); and St. Anne's University, Brno, Czech Republic (METC 1G2015)].
Author's Note
All authors wish to stress that they are scientifically independent and have full freedom to act without any obligation to industry other than scientific advice to companies in the context of licensed patents. The selection of antibodies by the EuroFlow consortium is always explicitly based on quality, relevance, and continuous availability. Consequently all proposed antibody panels consist of mixtures of antibodies from many different companies (see Tables 1–4).
Author Contributions
JvD, MvdB, TK, MP-A, MvZ, and AO contributed conception and design of the study. TK, MP-A, EM, MV, EL-G, MW, A-KK, JP, AS, and EB performed the data acquisition and data analysis. MP-A and EB organized the database. JvD, MP-A, and AO wrote the manuscript. All authors contributed to manuscript revision, read, and approved the submitted version.
Funding
The coordination and innovation processes of this study were financially supported and coordinated by the EuroFlow Consortium (Chairmen: JvD and AO). MvZ is supported by Senior Research Fellowship GNT1117687 from the Australian National Health and Medical Research Council. TK and EM were supported by projects 15-28541A from Ministry of Health, LO1604 from Ministry of Education, Youth and Sports and GBP302/12/G101 from Grant Agency of the Czech Republic. MP-A, EB, and AO were supported by a grant from the Junta de Castilla y León (Fondo Social Europeo, ORDEN EDU/346/2013, Valladolid, Spain) and the CB16/12/00400 grant (CIBER/ONC, Instituto de Salud Carlos III, Ministerio de Economía y Competitividad, -Madrid, Spain- and FONDOS FEDER), the FIS PI12/00905-FEDER grant (Fondo de Investigación Sanitaria of Instituto de Salud Carlos III, Madrid, Spain), and a grant from Fundación Mutua Madrileña (Madrid, Spain).
Conflict of Interest Statement
JvD, MvdB, TK, MP-A, MV, EL-G, A-KK, MvZ, EB, and AO each report being one of the inventors on the EuroFlow-owned patent PCT/NL 2015/050762 (Diagnosis of primary immunodeficiencies). The Infinicyt software is based on intellectual property (IP) of some EuroFlow laboratories (University of Salamanca in Spain and Federal University of Rio de Janeiro in Brazil) and the scientific input of other EuroFlow members. All above mentioned intellectual property and related patents are licensed to Cytognos (Salamanca, ES), which company pays royalties to the EuroFlow Consortium. These royalties are exclusively used for continuation of the EuroFlow collaboration and sustainability of the EuroFlow consortium. JvD and AO report an Educational Services Agreement from BD Biosciences (San José, CA) and a Scientific Advisor Agreement with Cytognos; all related fees and honoraria are for the involved university departments at Leiden University Medical Center and University of Salamanca.
The remaining authors declare that the research was conducted in the absence of any commercial or financial relationships that could be construed as a potential conflict of interest.
Acknowledgments
We thank our EuroFlow colleagues Christina Grosserichter, Quentin Lecrevisse, and Sandra Posthumus, Ingrid Pico for their technical support in performing the PID studies and our clinical colleagues Sonia de Arriba-Mendez, Ana Remesal, Noemi Puig, Cristina Serrano, Susana Silva, and Carolien Bonroy for recruiting PID patients and control sample donations, and W. Marieke Bitter for her continuous support in the management of the EuroFlow Consortium.
References
1. Picard C, Bobby Gaspar H, Al-Herz W, Bousfiha A, Casanova JL, Chatila T, et al. International Union of Immunological Societies: 2017 Primary Immunodeficiency Diseases Committee Report on Inborn Errors of Immunity. J Clin Immunol. (2018) 38:96–128. doi: 10.1007/s10875-017-0464-9
2. Bousfiha A, Jeddane L, Picard C, Ailal F, Bobby Gaspar H, Al-Herz W, et al. The 2017 IUIS phenotypic classification for primary immunodeficiencies. J Clin Immunol. (2018) 38:129–43. doi: 10.1007/s10875-017-0465-8
3. ESID. European Society for Immunodeficiencies: ESID Database Statistics 2004-2014. Available online at: https://esid.org/Working-Parties/Registry/ESID-Database-Statistics (accessed May 25, 2019)
4. Kindle G, Gathmann B, Grimbacher B. The use of databases in primary immunodeficiencies. Curr Opin Aller Clin Immunol. (2014) 14:501–8. doi: 10.1097/ACI.0000000000000113
5. ESID. European Society for Immunodeficiencies: ESID Registry - Clinical diagnosis criteria of PID. Available online at: https://esid.org/Working-Parties/Registry/Diagnosis-criteria (accessed May 25, 2019)
6. de Vries E. Patient-centred screening for primary immunodeficiency, a multi-stage diagnostic protocol designed for non-immunologists: 2011 update. Clin Exp Immunol. (2012) 167:108–19. doi: 10.1111/j.1365-2249.2011.04461.x
7. Bonilla FA, Khan DA, Ballas ZK, Chinen J, Frank MM, Hsu JT, et al. Practice parameter for the diagnosis and management of primary immunodeficiency. J Allergy Clin Immunol. (2015) 136:1186–205.e1-78. doi: 10.1016/j.jaci.2015.04.049
8. Dorsey MJ, Dvorak CC, Cowan MJ, Puck JM. Treatment of infants identified as having severe combined immunodeficiency by means of newborn screening. J Allergy Clin Immunol. (2017) 139:733-42. doi: 10.1016/j.jaci.2017.01.005
9. Stray-Pedersen A, Sorte HS, Samarakoon P, Gambin T, Chinn IK, Coban Akdemir ZH, et al. Primary immunodeficiency diseases: Genomic approaches delineate heterogeneous Mendelian disorders. J Allergy and clinical immunology. (2017) 139:232-45. doi: 10.1016/j.jaci.2016.05.042
10. Abolhassani H, Chou J, Bainter W, Platt CD, Tavassoli M, Momen T, et al. Clinical, immunologic, and genetic spectrum of 696 patients with combined immunodeficiency. J Allergy Clin Immunol. (2018) 141:1450-8. doi: 10.1016/j.jaci.2017.06.049
11. Schuetz C, Pannicke U, Jacobsen EM, Burggraf S, Albert MH, Honig M, et al. Lesson from hypomorphic recombination-activating gene (RAG) mutations: Why asymptomatic siblings should also be tested. J Allergy Clin Immunol. (2014) 133:1211-5. doi: 10.1016/j.jaci.2013.10.021
12. Volk T, Pannicke U, Reisli I, Bulashevska A, Ritter J, Bjorkman A, et al. DCLRE1C (ARTEMIS) mutations causing phenotypes ranging from atypical severe combined immunodeficiency to mere antibody deficiency. Hum Mol Genet. (2015) 24:7361–72. doi: 10.1093/hmg/ddv437
13. IJspeert H, Driessen GJ, Moorhouse MJ, Hartwig NG, Wolska-Kusnierz B, Kalwak K, et al. Similar recombination-activating gene (RAG) mutations result in similar immunobiological effects but in different clinical phenotypes. J Allergy Clin Immunol. (2014) 133:1124–33. doi: 10.1016/j.jaci.2013.11.028
14. Kwan A, Abraham RS, Currier R, Brower A, Andruszewski K, Abbott JK, et al. Newborn screening for severe combined immunodeficiency in 11 screening programs in the United States. JAMA. (2014) 312:729–38. doi: 10.1001/jama.2014.9132
15. Ogonek J, Kralj Juric M, Ghimire S, Varanasi PR, Holler E, Greinix H, et al. Immune Reconstitution after Allogeneic Hematopoietic Stem Cell Transplantation. Front Immunol. (2016) 7:507. doi: 10.3389/fimmu.2016.00507
16. Heimall J, Logan BR, Cowan MJ, Notarangelo LD, Griffith LM, Puck JM, et al. Immune reconstitution and survival of 100 SCID patients post-hematopoietic cell transplant: a PIDTC natural history study. Blood. (2017) 130:2718–27. doi: 10.1182/blood-2017-05-781849
17. Ameratunga R, Woon ST, Gillis D, Koopmans W, Steele R. New diagnostic criteria for common variable immune deficiency (CVID), which may assist with decisions to treat with intravenous or subcutaneous immunoglobulin. Clin Exp Immunol. (2013) 174:203–11. doi: 10.1111/cei.12178
18. Barmettler S, Price C. Continuing IgG replacement therapy for hypogammaglobulinemia after rituximab–for how long? J Allergy Clin Immunol. (2015) 136:1407–9. doi: 10.1016/j.jaci.2015.06.035
19. Rabbani B, Mahdieh N, Hosomichi K, Nakaoka H, Inoue I. Next-generation sequencing: impact of exome sequencing in characterizing Mendelian disorders. J Hum Genet. (2012) 57:621–32. doi: 10.1038/jhg.2012.91
20. Stessman HA, Bernier R, Eichler EE. A genotype-first approach to defining the subtypes of a complex disease. Cell. (2014) 156:872–7. doi: 10.1016/j.cell.2014.02.002
21. Jansen S, Hoischen A, Coe BP, Carvill GL, Van Esch H, Bosch DGM, et al. A genotype-first approach identifies an intellectual disability-overweight syndrome caused by PHIP haploinsufficiency. Eur J Hum Genet. (2018) 26:54-63. doi: 10.1038/s41431-017-0039-5
22. D'Amore A, Tessa A, Casali C, Dotti MT, Filla A, Silvestri G, et al. Next generation molecular diagnosis of hereditary spastic paraplegias: an Italian cross-sectional study. Front Neurol. (2018) 9:981. doi: 10.3389/fneur.2018.00981
23. Chae JH, Vasta V, Cho A, Lim BC, Zhang Q, Eun SH, et al. Utility of next generation sequencing in genetic diagnosis of early onset neuromuscular disorders. J Med Genet. (2015) 52:208–16. doi: 10.1136/jmedgenet-2014-102819
24. Waldrop MA, Pastore M, Schrader R, Sites E, Bartholomew D, Tsao CY, et al. Diagnostic utility of whole exome sequencing in the neuromuscular clinic. Neuropediatrics. (2019) 50):96–102. doi: 10.1055/s-0039-1677734
25. Al-Mousa H, Abouelhoda M, Monies DM, Al-Tassan N, Al-Ghonaium A, Al-Saud B, et al. Unbiased targeted next-generation sequencing molecular approach for primary immunodeficiency diseases. J Allergy Clin Immunol. (2016) 137:1780–7. doi: 10.1016/j.jaci.2015.12.1310
26. Gallo V, Dotta L, Giardino G, Cirillo E, Lougaris V, D'Assante R, et al. Diagnostics of primary immunodeficiencies through next-generation sequencing. Front Immunol. (2016) 7:466. doi: 10.3389/fimmu.2016.00466
27. Stoddard JL, Niemela JE, Fleisher TA, Rosenzweig SD. Targeted NGS: A cost-effective approach to molecular diagnosis of PIDs. Front Immunol. (2014) 5:531. doi: 10.3389/fimmu.2014.00531
28. Chi ZH, Wei W, Bu DF, Li HH, Ding F, Zhu P. Targeted high-throughput sequencing technique for the molecular diagnosis of primary immunodeficiency disorders. Medicine. (2018) 97:e12695. doi: 10.1097/MD.0000000000012695
29. Cifaldi C, Brigida I, Barzaghi F, Zoccolillo M, Ferradini V, Petricone D, et al. Targeted NGS platforms for genetic screening and gene discovery in primary immunodeficiencies. Front Immunol. (2019) 10:36. doi: 10.3389/fimmu.2019.00316
30. Rae W, Ward D, Mattocks C, Pengelly RJ, Eren E, Patel SV, et al. Clinical efficacy of a next-generation sequencing gene panel for primary immunodeficiency diagnostics. Clin Genet. (2018) 93:647–55. doi: 10.1111/cge.13163
31. Abolhassani H, Kiaee F, Tavakol M, Chavoshzadeh Z, Mahdaviani SA, Momen T, et al. Fourth update on the iranian national registry of primary immunodeficiencies: integration of molecular diagnosis. J Clin Immunol. (2018) 38:816–32. doi: 10.1007/s10875-018-0556-1
32. Al-Herz W, Chou J, Delmonte OM, Massaad MJ, Bainter W, Castagnoli R, et al. Comprehensive genetic results for primary immunodeficiency disorders in a highly consanguineous population. Front Immunol. (2018) 9:3146. doi: 10.3389/fimmu.2018.03146
33. Xia Y, He T, Luo Y, Li C, Lim CK, Abolhassani H, et al. Targeted next-generation sequencing for genetic diagnosis of 160 patients with primary immunodeficiency in south China. Pediatr Allergy Immunol. (2018) 29:863–72. doi: 10.1111/pai.12976
34. Al-Mousa H, Al-Saud B. Primary immunodeficiency diseases in highly consanguineous populations from middle east and north Africa: epidemiology, diagnosis, and care. Front Immunol. (2017) 8:678. doi: 10.3389/fimmu.2017.00678
35. Bogaert DJ, Dullaers M, Lambrecht BN, Vermaelen KY, De Baere E, Haerynck F. Genes associated with common variable immunodeficiency: one diagnosis to rule them all? J Med Genet. (2016) 53:575–90. doi: 10.1136/jmedgenet-2015-103690
36. Mahlaoui N, Picard C, Bach P, Costes L, Courteille V, Ranohavimparany A, et al. Genetic diagnosis of primary immunodeficiencies: a survey of the French national registry. J Allergy Clin Immunol. (2019) 143:1646–9. doi: 10.1016/j.jaci.2018.12.994
37. van der Burg M, van Zelm MC, Driessen GJ, van Dongen JJ. New frontiers of primary antibody deficiencies. Cell Mol Life Sci. (2012) 69:59–73. doi: 10.1007/s00018-011-0836-x
38. van der Burg M, van Zelm MC, Driessen GJ, van Dongen JJ. Dissection of B-cell development to unravel defects in patients with a primary antibody deficiency. Adv Exp Med Biol. (2011) 697:183–96. doi: 10.1007/978-1-4419-7185-2_13
39. Heimall JR, Hagin D, Hajjar J, Henrickson SE, Hernandez-Trujillo HS, Tan Y, et al. Use of Genetic testing for primary immunodeficiency patients. J Clin Immunol. (2018) 38:320–9. doi: 10.1007/s10875-018-0489-8
40. Abolhassani H, Wang N, Aghamohammadi A, Rezaei N, Lee YN, Frugoni F, et al. A hypomorphic recombination-activating gene 1 (RAG1) mutation resulting in a phenotype resembling common variable immunodeficiency. J Allergy Clin Immunol. (2014) 134:1375–80. doi: 10.1016/j.jaci.2014.04.042
41. Notarangelo LD, Kim MS, Walter JE, Lee YN. Human RAG mutations: biochemistry and clinical implications. Nat Rev Immunol. (2016) 16:234–46. doi: 10.1038/nri.2016.28
42. Rao VK, Webster S, Dalm V, Sediva A, van Hagen PM, Holland S, et al. Effective “activated PI3Kdelta syndrome”-targeted therapy with the PI3Kdelta inhibitor leniolisib. Blood. (2017) 130:2307–16. doi: 10.1182/blood-2017-08-801191
43. O'Gorman MR, Zollett J, Bensen N. Flow cytometry assays in primary immunodeficiency diseases. Methods Mol Biol. (2011) 699:317–35. doi: 10.1007/978-1-61737-950-5_15
44. Boldt A, Borte S, Fricke S, Kentouche K, Emmrich F, Borte M, et al. Eight-color immunophenotyping of T-, B-, and NK-cell subpopulations for characterization of chronic immunodeficiencies. Cytom B Clincytom. (2014) 86:191–206. doi: 10.1002/cytob.21162
45. Takashima T, Okamura M, Yeh TW, Okano T, Yamashita M, Tanaka K, et al. Multicolor flow cytometry for the diagnosis of primary immunodeficiency diseases. J Clin Immunol. (2017) 37:486–95. doi: 10.1007/s10875-017-0405-7
46. Abraham RS, Aubert G. Flow cytometry, a versatile tool for diagnosis and monitoring of primary immunodeficiencies. Clinical Vacc Immunol. (2016) 23:254–71. doi: 10.1128/CVI.00001-16
47. Oliveira JB, Notarangelo LD, Fleisher TA. Applications of flow cytometry for the study of primary immune deficiencies. Curr Opinion Allergy Clin Immunol. (2008) 8:499–509. doi: 10.1097/ACI.0b013e328312c790
48. Kanegane H, Hoshino A, Okano T, Yasumi T, Wada T, Takada H, et al. Flow cytometry-based diagnosis of primary immunodeficiency diseases. Allergol Int. (2018) 67:43–54. doi: 10.1016/j.alit.2017.06.003
49. Warnatz K, Wehr C, Drager R, Schmidt S, Eibel H, Schlesier M, et al. Expansion of CD19(hi)CD21(lo/neg) B cells in common variable immunodeficiency (CVID) patients with autoimmune cytopenia. Immunobiology. (2002) 206:502–13. doi: 10.1078/0171-2985-00198
50. Wehr C, Kivioja T, Schmitt C, Ferry B, Witte T, Eren E, et al. The EUROclass trial: defining subgroups in common variable immunodeficiency. Blood. (2008) 111:77–85. doi: 10.1182/blood-2007-06-091744
51. Biancotto A, Fuchs JC, Williams A, Dagur PK, McCoy JP, Jr. High dimensional flow cytometry for comprehensive leukocyte immunophenotyping (CLIP) in translational research. J Immunol Method. (2011) 363:245–61. doi: 10.1016/j.jim.2010.06.010
52. Maecker HT, McCoy JP, Nussenblatt R. Standardizing immunophenotyping for the human immunology project. Nat Rev Immunol. (2012) 12:191–200. doi: 10.1038/nri3158
53. Streitz M, Miloud T, Kapinsky M, Reed MR, Magari R, Geissler EK, et al. Standardization of whole blood immune phenotype monitoring for clinical trials: panels and methods from the ONE study. Transplant Res. (2013) 2:17. doi: 10.1186/2047-1440-2-17
54. Duffy D, Rouilly V, Libri V, Hasan M, Beitz B, David M, et al. Functional analysis via standardized whole-blood stimulation systems defines the boundaries of a healthy immune response to complex stimuli. Immunity. (2014) 40:436–50. doi: 10.1016/j.immuni.2014.03.002
55. Veluchamy JP, Delso-Vallejo M, Kok N, Bohme F, Seggewiss-Bernhardt R, van der Vliet HJ, et al. Standardized and flexible eight colour flow cytometry panels harmonized between different laboratories to study human NK cell phenotype and function. Sci Rep. (2017) 7:43873. doi: 10.1038/srep43873
56. Blanco E, Perez-Andres M, Arriba-Mendez S, Contreras-Sanfeliciano T, Criado I, Pelak O, et al. Age-associated distribution of normal B-cell and plasma cell subsets in peripheral blood. J Allergy Clin Immunol. (2018) 141:2208–19.e16. doi: 10.1016/j.jaci.2018.02.017
57. Blanco E, Perez-Andres M, Arriba-Mendez S, Serrano C, Criado I, Pino-Molina LD, et al. Defects in memory B-cell and plasma cell subsets expressing different immunoglobulin-subclasses in CVID and Ig-subclass deficiencies. J Allergy Clin Immunol. (2019). doi: 10.1016/j.jaci.2019.02.017. [Epub ahead of print].
58. Blanco E, Perez-Andres M, Sanoja-Flores L, Wentink M, Pelak O, Martin-Ayuso M, et al. Selection and validation of antibody clones against IgG and IgA subclasses in switched memory B-cells and plasma cells. J. Immunol Method. (2017). doi: 10.1016/j.jim.2017.09.008. [Epub ahead of print].
59. van der Burg M, Kalina T, Perez-Andres M, Vlkova M, Lopez-Granados E, Blanco E, et al. The EuroFlow PID orientation tube for flow cytometric diagnostic screening of primary immunodeficiencies of the lymphoid system. Front Immunol. (2019) 10:246. doi: 10.3389/fimmu.2019.00246
60. van der Velden VH, Flores-Montero J, Perez-Andres M, Martin-Ayuso M, Crespo O, Blanco E, et al. Optimization and testing of dried antibody tube: The EuroFlow LST and PIDOT tubes as examples. J Immunol Method. (2017). doi: 10.1016/j.jim.2017.03.011. [Epub ahead of print].
61. van Dongen JJ, Lhermitte L, Bottcher S, Almeida J, van der Velden VH, Flores-Montero J, et al. EuroFlow antibody panels for standardized n-dimensional flow cytometric immunophenotyping of normal, reactive and malignant leukocytes. Leukemia. (2012) 26:1908–75. doi: 10.1038/leu.2012.120
62. Kalina T, Flores-Montero J, van der Velden VH, Martin-Ayuso M, Bottcher S, Ritgen M, et al. EuroFlow standardization of flow cytometer instrument settings and immunophenotyping protocols. Leukemia. (2012) 26:1986–2010. doi: 10.1038/leu.2012.122
63. Theunissen P, Mejstrikova E, Sedek L, van der Sluijs-Gelling AJ, Gaipa G, Bartels M, et al. Standardized flow cytometry for highly sensitive MRD measurements in B-cell acute lymphoblastic leukemia. Blood. (2017) 129:347–57. doi: 10.1182/blood-2016-07-726307
64. Flores-Montero J, Sanoja-Flores L, Paiva B, Puig N, Garcia-Sanchez O, Bottcher S, et al. Next generation flow for highly sensitive and standardized detection of minimal residual disease in multiple myeloma. Leukemia. (2017) 31:2094–103. doi: 10.1038/leu.2017.29
65. Lhermitte L, Mejstrikova E, van der Sluijs-Gelling AJ, Grigore GE, Sedek L, Bras AE, et al. Automated database-guided expert-supervised orientation for immunophenotypic diagnosis and classification of acute leukemia. Leukemia. (2018) 32:874-81. doi: 10.1038/leu.2017.313
66. Pedreira CE, Costa ES, Lecrevisse Q, van Dongen JJ, Orfao A. Overview of clinical flow cytometry data analysis: recent advances and future challenges. Trends Biotechnol. (2013) 31:415–25. doi: 10.1016/j.tibtech.2013.04.008
67. van Dongen JJ, van der Velden VH, Bruggemann M, Orfao A. Minimal residual disease diagnostics in acute lymphoblastic leukemia: need for sensitive, fast, and standardized technologies. Blood. (2015) 125:3996–4009. doi: 10.1182/blood-2015-03-580027
68. Novakova M, Glier H, Brdickova N, Vlkova M, Santos AH, Lima M, et al. How to make usage of the standardized EuroFlow 8-color protocols possible for instruments of different manufacturers. J Immunol Method. (2017). doi: 10.1016/j.jim.2017.11.007. [Epub ahead of print].
69. Diks, A. M., Bonroy, C., Teodosio, C., Groenland, R. J., De Mooij, B., De Maertelaere, E., et al. (in press). Impact of blood storage and sample handling on quality of high dimensional flow cytometric data in multicenter clinical research. J. Immunol. Method. doi: 10.1016/j.jim.2019.06.007
70. Bottcher S, van der Velden VHJ, Villamor N, Ritgen M, Flores-Montero J, Murua Escobar H, et al. Lot-to-lot stability of antibody reagents for flow cytometry. J Immunol Method. (2017). doi: 10.1016/j.jim.2017.03.018. [Epub ahead of print].
71. Kalina T, Flores-Montero J, Lecrevisse Q, Pedreira CE, van der Velden VH, Novakova M, et al. Quality assessment program for EuroFlow protocols: summary results of four-year (2010–2013) quality assurance rounds. Cytom A. (2015) 87:145–56. doi: 10.1002/cyto.a.22581
72. Kalina T, Brdickova N, Glier H, Fernandez P, Bitter M, Flores-Montero J, et al. Frequent issues and lessons learned from EuroFlow QA. Journal of immunological methods. (2018). doi: 10.1016/j.jim.2018.09.008. [Epub ahead of print].
73. Frenkel J, Neijens HJ, den Hollander JC, Wolvers-Tettero IL, van Dongen JJ. Oligoclonal T cell proliferative disorder in combined immunodeficiency. Pediatric Res. (1988) 24:622–7. doi: 10.1203/00006450-198811000-00017
74. Harville TO, Adams DM, Howard TA, Ware RE. Oligoclonal expansion of CD45RO+ T lymphocytes in Omenn syndrome. J Clin Immunol. (1997) 17:322–32. doi: 10.1023/A:1027330800085
75. Chan K, Puck JM. Development of population-based newborn screening for severe combined immunodeficiency. J Allergy Clin Immunol. (2005) 115:391–8. doi: 10.1016/j.jaci.2004.10.012
76. Brown L, Xu-Bayford J, Allwood Z, Slatter M, Cant A, Davies EG, et al. Neonatal diagnosis of severe combined immunodeficiency leads to significantly improved survival outcome: the case for newborn screening. Blood. (2011) 117:3243–6. doi: 10.1182/blood-2010-08-300384
77. Thakar MS, Hintermeyer MK, Gries MG, Routes JM, Verbsky JW. A practical approach to newborn screening for severe combined immunodeficiency using the t cell receptor excision circle assay. Front Immunol. (2017) 8:1470. doi: 10.3389/fimmu.2017.01470
78. Berkowska MA, Heeringa JJ, Hajdarbegovic E, van der Burg M, Thio HB, van Hagen PM, et al. Human IgE(+) B cells are derived from T cell-dependent and T cell-independent pathways. J Allergy Clin Immunol. (2014) 134:688–97.e6. doi: 10.1016/j.jaci.2014.03.036
79. JMF. Jeffrey Modell Foundation: 4 Stages of Testing for Primary Immunodeficiency. Available online at: http://downloads.info4pi.org/pdfs/Physician-Algorithm-2-.pdf (accessed May 25, 2019)
80. ESID. European Society for Immunodeficiencies: The 6 ESID Warning Signs for ADULT Primary Immunodeficiency Diseases. Available online at: https://esid.org/Education/6-Warning-Signs-for-PID-in-Adults (accessed May 25, 2019)
Keywords: immunodeficiency, immunophenotyping, flow cytometry, diagnosis, classification, EuroFlow, standardization
Citation: van Dongen JJM, van der Burg M, Kalina T, Perez-Andres M, Mejstrikova E, Vlkova M, Lopez-Granados E, Wentink M, Kienzler A-K, Philippe J, Sousa AE, van Zelm MC, Blanco E and Orfao A (2019) EuroFlow-Based Flowcytometric Diagnostic Screening and Classification of Primary Immunodeficiencies of the Lymphoid System. Front. Immunol. 10:1271. doi: 10.3389/fimmu.2019.01271
Received: 06 December 2018; Accepted: 17 May 2019;
Published: 13 June 2019.
Edited by:
Sergio Rosenzweig, National Institutes of Health (NIH), United StatesReviewed by:
Vijaya Knight, University of Colorado Denver, United StatesThomas Arthur Fleisher, American Academy of Allergy, Asthma and Immunology, United States
Copyright © 2019 van Dongen, van der Burg, Kalina, Perez-Andres, Mejstrikova, Vlkova, Lopez-Granados, Wentink, Kienzler, Philippe, Sousa, van Zelm, Blanco and Orfao. This is an open-access article distributed under the terms of the Creative Commons Attribution License (CC BY). The use, distribution or reproduction in other forums is permitted, provided the original author(s) and the copyright owner(s) are credited and that the original publication in this journal is cited, in accordance with accepted academic practice. No use, distribution or reproduction is permitted which does not comply with these terms.
*Correspondence: Jacques J. M. van Dongen, ai5qLm0udmFuX2RvbmdlbkBsdW1jLm5s
†These authors have contributed equally to this work