 Tytti Heinonen
 Eleonora Ciarlo
 Ersilia Rigoni
 Didier Le Roy
 Thierry Roger
- Infectious Diseases Service, Department of Medicine, Lausanne University Hospital and University of Lausanne, Lausanne, Switzerland
Sirtuin 2 (SIRT2) and SIRT3 are cytoplasmic and mitochondrial NAD-dependent deacetylases. SIRT2 and SIRT3 target proteins involved in metabolic, proliferation and inflammation pathways and have been implicated in the pathogenesis of neurodegenerative, metabolic and oncologic disorders. Both pro- and anti-inflammatory effects have been attributed to SIRT2 and SIRT3, and single deficiency in SIRT2 or SIRT3 had minor or no impact on antimicrobial innate immune responses. Here, we generated a SIRT2/3 double deficient mouse line to study the interactions between SIRT2 and SIRT3. SIRT2/3−/− mice developed normally and showed subtle alterations of immune cell populations in the bone marrow, thymus, spleen, blood and peritoneal cavity that contained notably more anti-inflammatory B-1a cells and less NK cells. In vitro, SIRT2/3−/− macrophages favored fatty acid oxidation (FAO) over glycolysis and produced increased levels of both proinflammatory and anti-inflammatory cytokines. In line with metabolic adaptation and increased numbers of peritoneal B-1a cells, SIRT2/3−/− mice were robustly protected from endotoxemia. Yet, SIRT2/3 double deficiency did not modify endotoxin tolerance. Overall, these data suggest that sirtuins can act in concert or compensate each other for certain immune functions, a parameter to be considered for drug development. Moreover, inhibitors targeting multiple sirtuins developed for clinical purposes may be useful to treat inflammatory diseases.
Introduction
Sentinel immune cells like monocytes/macrophages, dendritic cells (DCs) and polymorphonuclear neutrophils (PMNs) sense microbial- and danger-associated signals through pattern recognition receptors (PRRs) expressed at cell surface, in endosomes and in cytoplasm. The main families of PRRs are Toll-like receptors (TLRs), C-type lectin receptors, NOD-like receptors, RIG-I-like receptors and cytosolic DNA sensors (1, 2). Triggering PRRs through microbial and endogenous agonists activates mitogen-activated protein kinase (MAPK), NF-κB and interferon-related factor signal transduction pathways. Signaling leads to the production of effector molecules, such as cytokines, critical to activate innate and adaptive immunity. Tight regulation of inflammation and innate immune responses is vital for controlling microbial invasion while ensuring prompt tissue repair and return to homeostasis. Hence, innovative immunomodulatory therapies have been proposed to fight severe infections and sepsis (3–8).
Mammals express seven sirtuins (SIRT1-7). Sirtuins are NAD+-dependent enzymes, originally described as histone deacetylases (HDACs). Each sirtuin potentially targets thousands of non-histone proteins (9). SIRT1, SIRT6, and SIRT7 localize mainly in the nucleus, SIRT2 in the cytoplasm, and SIRT3-5 in the mitochondria. Shuttling between organelles have been observed for several sirtuins, for example SIRT2 and SIRT3 into the nucleus and SIRT5 into the cytoplasm (10). Besides a deacetylase activity described for all but SIRT4, sirtuins function as decrotonylase (SIRT1-3), demyristylase (SIRT2), ADP-ribosyltransferase (SIRT4, SIRT6), lipoamidase (SIRT4), demalonylase, deglutarylase, and desuccinylase (SIRT5), and deacylase (SIRT6) (11).
SIRT2 is the most expressed sirtuin in the brain and myeloid cells (12, 13). SIRT2 regulates cellular stability and division by targeting tubulin in the cytoplasm (14) and acting as a mitotic checkpoint in the nucleus during the G2/M phase transition (15). SIRT2 is involved in myelogenesis and other brain functions and is a promising target for treating neurodegenerative conditions among which Parkinson's disease and Huntington's disease (16). SIRT2 is a tumor suppressor gene but has also been associated with tumorigenesis (17). SIRT2 is likely linked to disease progression through cell metabolism regulation. SIRT2 inhibits glycolysis and adipogenesis and promotes lipolysis, gluconeogenesis and the pentose phosphate pathway (PPP), possibly in a cell and disease dependent manner (13, 18–22). Accordingly, SIRT2 plays a role in obesity, type 2 diabetes and other metabolic disorders (18). The picture is not clear regarding inflammatory processes. SIRT2 deficiency has been reported to stimulate, inhibit and have no effect on the activation NF-κB p65 and MAPKs, the expression of cytokines and the development of inflammatory and autoimmune diseases (13, 23–32).
SIRT3 is expressed ubiquitously and its expression increases upon caloric restriction and other stress conditions. SIRT3 is the main mitochondrial deacetylase and a major regulator of cell metabolism. SIRT3 promotes tricarboxylic acid cycle and electron transport chain, ketogenesis, fatty acid oxidation, brown adipose tissue thermogenesis and urea cycle (33–37). SIRT3 inhibits oxidative stress by activating isocitrate dehydrogenase 2 (IDH2) and superoxide dismutase 2 (SOD2) (38–40). Through the regulation of metabolism and redox homeostasis, SIRT3 protects from age-associated metabolic, cardiovascular and neurodegenerative diseases. SIRT3 also counteracts the development of inflammation-related disorders, although some studies suggest that SIRT3 does not impact on inflammatory responses (41–46). Finally, SIRT3 was shown to drive both pro-tumorigenic and tumor-suppressive effects (47).
HDACs may act in concert or compensate each other as suggested by the role played by SIRT1, HDAC5, HDAC6, and HDAC9 in dampening regulatory T cells (Tregs) and by SIRT1, SIRT3, and SIRT6 in regulating metabolic adaptation to inflammation (48–51). As a consequence, deficiency in several sirtuins might amplify or reveal phenotypes undetectable in single knockouts. Indeed, dual deletion of SIRT3 and SIRT5 showed some impact on antimicrobial host defense mechanisms not seen in - SIRT3 and SIRT5 single deficient mice (43, 52, 53). SIRT2 and SIRT3 do not seem to share targets, but they both impact on ROS detoxification at different levels. SIRT2 regulates through FOXO1 the transcription of genes encoding for ROS detoxifying enzymes while SIRT3 regulates the activity of the enzymes (38–40). Thus, the absence of SIRT2 or SIRT3 could be compensated by an increased activity of the other sirtuin. To challenge our assumption, we generated a SIRT2/3 double deficient mouse line. We show that the double deletion of SIRT2 and SIRT3 impacts on some metabolic and immune parameters not observed in single knockouts. Importantly from a translational perspective, SIRT2/3 deficient mice were protected from endotoxemia. This information is valuable considering that inhibitors targeting multiple sirtuins are developed for clinical purposes.
Materials and Methods
Ethics Statement
Animal experiments were approved by the Service des Affaires Vétérinaires, Direction Générale de l'Agriculture, de la Viticulture et des Affaires Vétérinaires (DGAV), état de Vaud (Epalinges, Switzerland) under authorizations 876.9 and 877.9 and performed according to Swiss and ARRIVE guidelines.
Mice
SIRT2−/− and SIRT3−/− C57BL/6J mice have been described (54, 55). SIRT3−/− females were crossed with SIRT2−/− males to obtain 53 female and 47 male SIRT2/3+/− mice. SIRT2/3+/− mice were crossed to obtain 312 F2 mice. We identified 7 female and 3 male double knockout mice that were used to establish the SIRT2/3−/− mouse line. For genotyping purposes, DNA was extracted and analyzed by PCR using the Mouse Direct PCR Kit (Bimake, Houston, TX), primers pairs (Supplementary Information) and a QuantStudio™ 12K Flex system (Life Technologies, Carlsbad, CA). Mice used in this study were 7–14-week old, housed under specific pathogen-free conditions and exempt of mouse hepatitis virus and murine norovirus.
Cells and Reagents
Bone marrow (BM) cells were cultured for 7 days in RPMI 1640 (Life Technologies, Carlsbad, CA) supplemented with 1% penicillin-streptomycin (Invitrogen, Carlsbad CA), 10% heat inactivated fetal bovine serum (FBS; Biochrom GmbH, Berlin, Germany) and 50 U/ml macrophage colony-stimulating factor (M-CSF; ImmunoTools, Friesoythe, Germany) to obtain BM derived macrophages (BMDMs) (56). BMDMs were seeded in 96-well or 24-well plates (2 × 10⁵ or 1 × 10⁶ cells/well) without M-CSF for stimulation and phagocytosis/killing experiments, respectively. Peritoneal cells were obtained through a peritoneal lavage performed using 5 ml ice-cold RPMI (57). Cells were enumerated and seeded in 96-well plates (2 × 10⁵ cells/well) in RPMI containing 1% penicillin-streptomycin and 10% FBS. BMDMs and peritoneal cells were stimulated with ultrapure LPS from Salmonella minnesota (List Biological Laboratories, Campbell, CA), Pam3CSK4 (EMC microcollections, Tübingen, Germany), and CpG A 1585 (Microsynth, Balgach, Switzerland).
RNA Analyses
RNA was extracted with the RNeasy kit (Qiagen, Hilden, Germany) and reverse transcribed with the QuantiTect reverse transcription kit (Qiagen). Real-time PCR was performed using primers (Supplementary Information) and KAPA SYBR Green Fast (Kapa Biosystems, Wilmington, MA) as described (58). Reactions were run on a QuantStudio™ 12K Flex system (Life Technologies). Gene expression was normalized to actin expression.
Western Blot Analyses
Proteins were extracted, submitted to PAGE and transferred to nitrocellulose membranes as described (59). Membranes were incubated with primary antibodies against β-actin (4967, Cell Signaling, Danvers, MA), NF-κB p65 (8242, Cell Signaling) p44/42 MAPK (ERK1/2; 9102, Cell Signaling), phospho-p44/42 (ERK1/2; 9101, Cell Signaling), p38 MAPK (9102, Cell Signaling), phosho-p38 MAPK (9211, Cell Signaling), SIRT2 (ab67299; Abcam, Cambridge, United Kingdom), SIRT3 (5490; Cell Signaling), α-tubulin (T5168; Sigma-Aldrich, Darmstadt, Germany), and HRP-coupled secondary antibodies (31430 and 31460; Invitrogen). Blots were revealed with the enhanced chemiluminescence Western blotting system (Advansta, San Jose, CA). Images were recorded with the Fusion Fx system (Viber Lourmat, Collégien, France). Full length blots are presented in Supplementary Figure 1.
Flow Cytometry
Single cell suspensions were incubated with Fc blocker, stained with antibodies listed in Supplementary Information and fixed with 2% paraformaldehyde. Data were acquired with an Attune Nxt flow cytometer (ThermoFisher, Waltham, MA) and analyzed using FlowJo 10.2 (FlowJo LLC, Ashland, OR). Gating strategies are presented in Supplementary Figure 2 and in Heinonen et al. (52).
Metabolic Activity
Four × 104 BMDMs per well were plated in Seahorse XFe96 plates. Glycolytic activity, mitochondrial respiration and mitochondrial flexibility were analyzed using Seahorse Glycolysis Stress and Mito Fuel Flex Test kits (Agilent, Santa Clara, CA) as recommended by the manufacturer. Two × 104 BMDMs were plated in 96-well plates and grown in RPMI (Sigma-Aldrich) with 5 mM glucose. Glucose and lactate were measured with the Glucose-Glo and Lactate-Glo kits (J6021 and J5021, Promega, Madison, WI) and luminescence was recorded with a Synergy plate reader (BioTek, Winooski, VT).
Cytokine Measurements
Cytokines and chemokines were measured in cell supernatant and plasma by ELISA (IL-6 and TNF: R&D systems, Minneapolis, MN; IL-10: Mabtech, Nacka Strand, Sweden) or by Luminex (Mouse Custom ProcartaPlex 17-plex: ENA-78/CXCL5, G-CSF, IFNγ, IL-1α, IL-1β, IL-3, IL-6, IL-10, IL-12p40, IL-17A, IL-18, IP-10/CXCL10, KC/CXCL1, MCP-1/CCL2, MIP-1α/CCL3, MIP-2/CXCL2, TNF) (Invitrogen) and recorded with a bioplex 200 (Bio-Rad, Hercules, CA) (60).
Phagocytosis and Killing Assay
E. coli O18 (E. coli) was grown in brain heart infusion broth (Oxoid Limited, Hampshire, United Kingdom) and washed in 0.9% NaCl (61). BMDMs were incubated with Fluoresbrite® Yellow Green Microspheres (Polysciences Inc., Warrington, PA, USA) or live E. coli at a bead or bacteria-to-cell ratio of 10:1 for 1 h to quantify phagocytosis and for 6 h to quantify killing as described (62).
In vivo Models
SIRT2/3+/+ and SIRT2/3−/− male mice (n = 8–10 per group) were challenged intraperitoneally with 10 mg/kg LPS from E. coli O111:B4. Blood was collected 0, 1, 3, and 7 days post-challenge to quantify cytokines by Luminex, analyze cell populations by flow cytometry, and perform whole blood assays as described (63). Body weight loss, severity score and survival were monitored at least twice daily. The severity score was graded from 0 to 6 based on animal motility and aspect. Two to three operators performed animal follow-up (64).
Statistical Analyses
Graphics represent data obtained from individual mice (dots), or box with min to max whiskers. Data from different groups were analyzed for normal distribution and homogeneity of variances and compared with the appropriate parametric (two-tailed unpaired Student's t-test) or non-parametric (two-tailed Mann-Whitney test) statistical test. For gravity score, area under the curve was used for analysis. Survival was analyzed using the Kaplan-Meier method. P-values were two-sided, and P < 0.05 was considered to indicate statistical significance. *P ≤ 0.05; **P ≤ 0.01; ***P ≤ 0.005. Analyses were performed using PRISM 8.0.1 (GraphPad Software, San Diego, CA).
Results
SIRT2/3−/− Mice Develop Without Abnormalities
SIRT2−/− and SIRT3−/− mice were crossed to generate a F2 population (see Materials and Methods). Among 312 F2 mice, we identified 10 double knockouts that were used to establish the SIRT2/3−/− mouse line. The truncation of the Sirt2 and Sirt3 genes and the absence of SIRT2 and SIRT3 protein expression were confirmed by PCR (Figure 1A) and Western blotting (Figure 1B). The size of litters (Figure 1C) and the female/male sex ratio of litters (Figure 1D) were similar in the SIRT2/3+/+, SIRT2−/−, SIRT3−/−, and SIR2/3−/− mouse lines. The weight of adult female and male mice were comparable among mouse lines (Figure 1E). Mouse development was normal, and no macroscopic abnormalities were detected upon autopsy. The expression levels of Sirt1, 4, 5, and 7 mRNA were not affected while the expression of Sirt6 mRNA was increased 1.5-fold in SIRT2/3−/− BMDMs (Figure 1F).
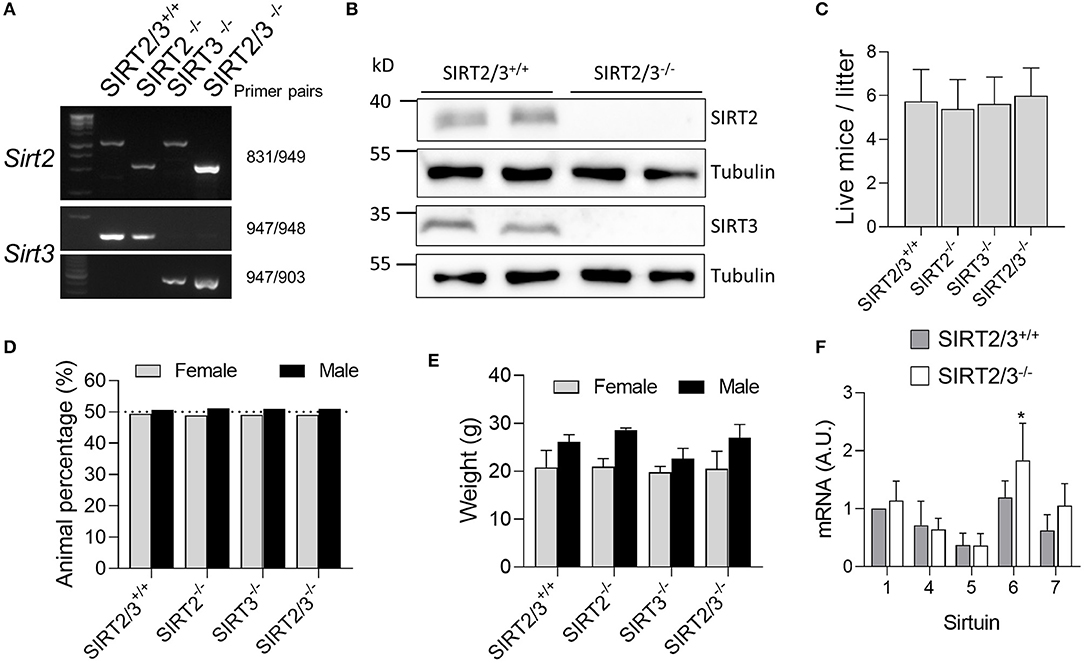
Figure 1. Establishment of a SIRT2/3−/− mouse line. (A) Genotyping of SIRT2/3+/+, SIRT2−/−, SIRT3−/−, and SIRT2/3−/− mice. Genomic DNA was amplified by PCR using the primer pairs specified on the right. Reaction mixtures were electrophoresed through agarose gels before imaging. (B) Western blot analysis of SIRT2, SIRT3 and tubulin expression in SIRT2/3+/+ and SIRT2/3−/− BMDMs (Full blots are presented in Supplementary Figure 1). (C,D) Number of individuals (C) and female/male distribution (D) of SIRT2/3+/+, SIRT2−/−, SIRT3−/− and SIRT2/3−/− litters. (E) Weight of SIRT2/3+/+, SIRT2−/−, SIRT3−/−, and SIRT2/3−/− adult female and male mice. (F) mRNA expression of SIRT1 and SIRT4-7 in SIRT2/3−/− BMDMs were quantified by RT-qPCR and normalized to actin mRNA. Data are mean ± SD of eight mice analyzed in triplicate. *P < 0.05.
SIRT2/3−/− Mice Have Minor Alterations of Leukocyte Subpopulations
SIRT2 and SIRT3 are expressed by all major immune cell subpopulations (13, 43) but their role in the development of myeloid cells is unknown. We quantified leukocyte populations in primary and secondary lymphoid organs, blood and peritoneum of SIRT2/3+/+, SIRT2−/−, SIRT3−/−, and SIRT2/3−/− mice. In the bone marrow, the number of CD45+ cells was similar in all mouse lines (Table 1). The frequency of T cells, conventional DCs (cDCs), plasmacytoid DCs (pDCs) and granulocytes was not affected in knockout mouse lines. The proportion of Ly6Clow (alternative) monocytes was slightly reduced (<10%) in SIRT2/3−/− mice, as it was in SIRT2−/− and SIRT3−/− mice. In contrast, the frequency of B cells was 30% higher in SIRT2/3−/− mice. In the thymus, SIRT2/3−/− mice expressed normal proportions and absolute numbers of CD4/CD8 double negative (DN) thymocytes, DN1-DN4 thymocytes, and CD4 and CD8 single positive thymocytes and 4% less CD4+ CD8+ double positive thymocytes (Table 2). The spleen of SIRT2/3+/+, SIRT2−/−, SIRT3−/−, and SIRT2/3−/− mice contained comparable populations of CD4+ and CD8+ T cells and monocytes (Table 3). However, the spleen of SIRT2/3−/− mice contained 19% more naïve CD4+ T cells and 11% more B cells, as seen in the bone marrow, but 17% less CD11c+ DCs and 39% less Ly6G+ granulocytes (Table 3). Taken all together, SIRT2/3 deficiency had no dramatic impact on leukocyte development.
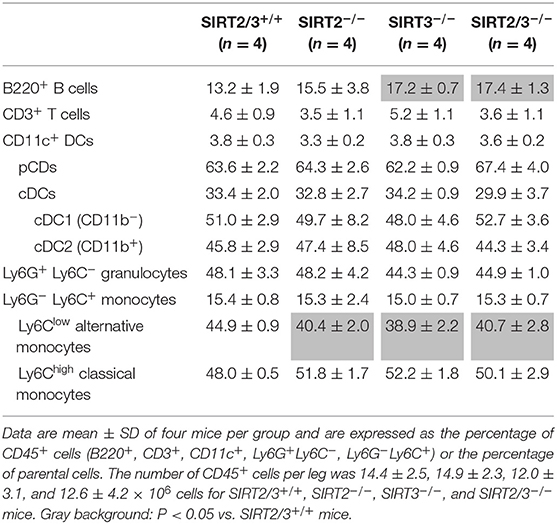
Table 1. Bone marrow cell subsets.
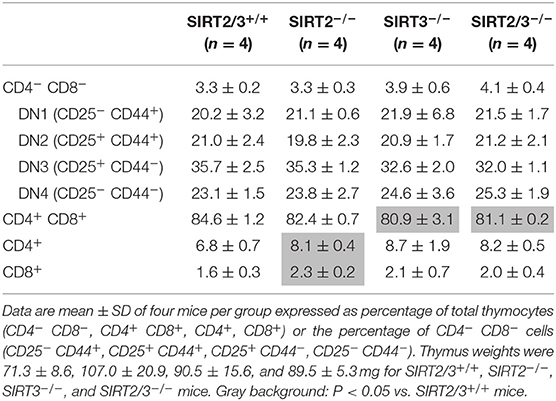
Table 2. Thymic cell subsets.
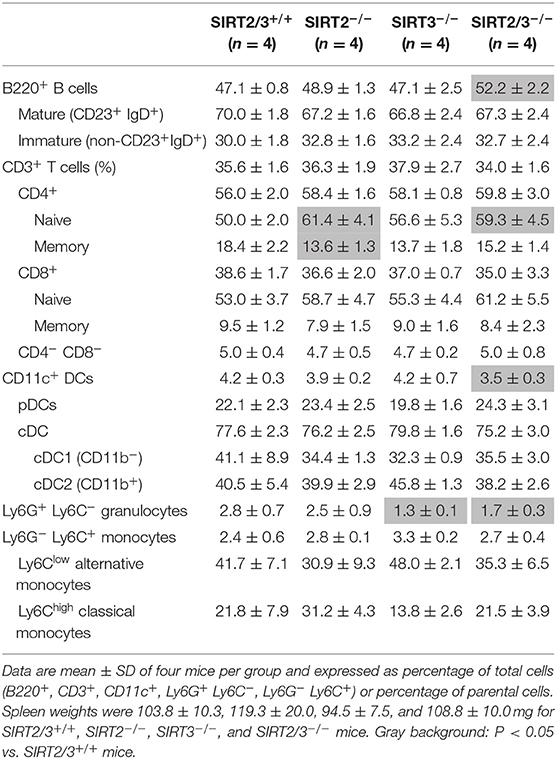
Table 3. Splenic cell subsets.
Blood leukocytes play a key role in sensing MAMPs/DAMPs and are quickly recruited to inflamed tissues. The number of leukocytes and the frequencies of B cells, T cells, PMNs, monocytes and NK cells were similar in SIRT2/3+/+, SIRT2−/−, SIRT3−/−, and SIRT2/3−/− mice (Figures 2A,B), although we could observe an increased frequency of B cells and decreased frequency of PMNs in the blood of SIRT2/3−/− mice. The egress of PMNs from the bone marrow follows a circadian rhythm, a process that is modulated by sirtuins (65). Aged neutrophils express increased levels of CD11b (66). CD11b mean fluorescence intensity (MFI) of SIRT2/3+/+ and SIRT2/3−/− PMNs was alike (Figure 2C), suggesting that SIRT2 and SIRT3 do no impact on PMNs release from the bone marrow. The frequency of Ly6Clow, Ly6Cint, and Ly6Chigh monocyte subpopulations were similar in all mouse lines (Figure 2D). Hence, the reduced number of Ly6Clow monocytes in the bone marrow of knockout mice (Table 1) had no perceptible impact on blood monocytes. CD62L, a homing receptor for secondary lymphoid organs, is expressed by NK cells at steady-state (67). CD62L MFI was 1.7- to 2-fold higher in NK cells from SIRT2/3−/− mice (Figure 2E).
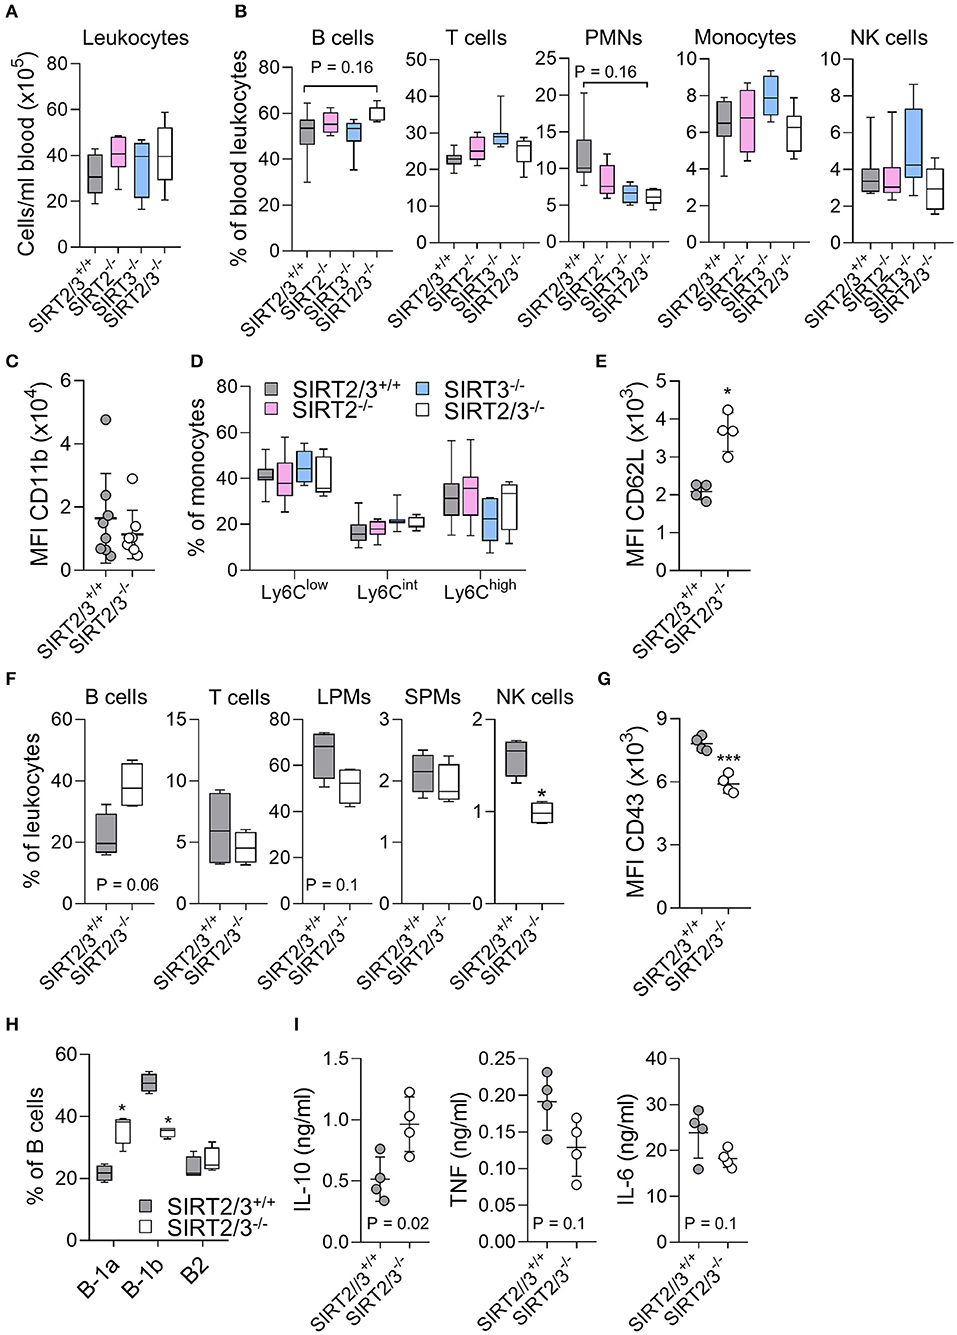
Figure 2. SIRT2/3−/− mice have minor alterations of blood and peritoneal leukocyte subpopulations. (A–E) Absolute number of CD45+ leukocytes (A) and percentages of CD19+ B cells, CD3+ T cells, Ly6G+ PMNs, CD11b+Ly6G− monocytes and NK1.1+ NK cells (B) in peripheral blood of SIRT2/3+/+, SIRT2−/−, SIRT3−/−, and SIRT2/3−/− mice. (C) Mean fluorescence intensity (MFI) of CD11b expressed by SIRT2/3+/+ and SIRT2/3−/− PMNs. (D) Percentage of Ly6C low, intermediate and high expressing monocytes. (E) MFI of CD62L expressed by blood SIRT2/3+/+ and SIRT2/3−/− NK cells. (F) Percentage of B cells, T cells, large peritoneal macrophages (LPMs), small peritoneal macrophages (SPMs) and NK cells in the peritoneal cavity of SIRT2/3+/+ and SIRT2/3−/− mice. (G) MFI of CD43 expressed by peritoneal SIRT2/3+/+ and SIRT2/3−/− NK cells. (H) Percentage of B-1a (CD23− CD5+), B-1b (CD23− CD5−) and B-2 (CD23+) cells among B cells. (I) Peritoneal cells were exposed for 24 h to 10 ng/ml LPS. The concentrations of TNF, IL-6 and IL-10 in cell culture supernatants were measured by ELISA. Data were obtained from eight (A–D) or four (E–I) mice per group. Each dot represents one mouse. *P < 0.05; ***P < 0.005. Gating strategies are presented in Supplementary Figure 3 and in Heinonen et al. (52).
The peritoneal cavity of mice contains mainly B cells, T cells, macrophages and NK cells (68). Peritoneal macrophages are divided into large peritoneal macrophages (LPMs) and small peritoneal macrophages (SPMs). LPMs are self-renewing macrophages with homeostatic functions and represent the main macrophage population (90% of all macrophages) expressed at baseline in the peritoneum. SPMs derived from blood inflammatory monocytes quickly exceed LPMs upon infection or inflammation (69). The peritoneal cavity of SIRT2/3−/− mice contained 1.7-fold less NK cells, while the other leukocyte subpopulations were not statistically significantly different (Figure 2F). Beside a reduced number of NK cells, the MFI of the activation marker CD43 expressed by NK cells was 1.3-fold lower in SIRT2/3−/− mice (Figure 2G). Similar to what was observed in the bone marrow and spleen, there was 1.8-fold more B cells in the peritoneum of SIRT2/3−/− mice (Figure 2F). B cells are divided into B1 (B-1a and B-1b) cells producing natural antibodies and B2 cells (70). Interestingly, the peritoneal cavity of SIRT2/3−/− mice contained proportionally more B-1a cells and less B-1b cells than the one of SIRT2/3+/+ mice (Figure 2H). This resulted in 3.3-fold more B-1a cells, 1.4-fold more B-1b cells and subnormal number of B2 cells in SIRT2/3−/− mice (SIRT2/3+/+ vs. SIRT2/3−/−: 0.9 ± 0.2 vs. 3.0 ± 0.5 × 10⁵ B-1a cells, 2.1 ± 0.8 vs. 3.0 ± 0.6 × 10⁵ B-1b cells, 0.8 ± 0.4 vs. 1.9 ± 1.2 × 10⁵ B-2 cells, P = 0.007, 0.05, and 0.08). To substantiate the relevance of this observation, we quantified IL-10, TNF and IL-6 production by peritoneal cells stimulated ex vivo for 24 h with 10 ng/ml LPS (Figure 2I). SIRT2/3−/− peritoneal cells produced more IL-10 and less TNF and IL-6 than SIRT2/3+/+ peritoneal cells (P < 0.02 for IL-10). These results were in line with the fact that B-1 cells, and particularly B-1a cells, are considered to produce high levels of IL-10 at baseline and upon microbial stimulation (70–72). The proportion of LPMs was slightly reduced in the peritoneal cavity of SIRT2/3−/− mice (Figure 2F). Overall, SIRT2/3 deficiency resulted in minor organ-specific alterations of the main leukocyte subpopulations, apart from an increased, functionally relevant, number of B-1a cells in the peritoneum.
SIRT2/3 Deficiency Enhances Cytokine Secretion, Phagocytosis, and Killing by Macrophages
Previous studies demonstrated that the deletion of SIRT2 and SIRT3 had no consequence on the expression of PRRs and microbial product-induced cytokine production by immune cells including BMDMs (13, 43). To test if SIRT2/3 deletion influenced cytokine production, BMDMs were exposed to LPS, Pam3CSK4, and CpG (i.e., agonists of TLR4, TLR1/2, and TLR9, respectively) for 24 h before measuring the concentrations of TNF, IL-6 and IL-10 in cell culture supernatants (Figure 3A). SIRT2/3−/− BMDMs produced significantly more TNF in response to LPS and CpG, more IL-6 in response to LPS, Pam3CSK4 and CpG, and more IL-10 in response to CpG. To test whether an increased intracellular signaling was associated with increased cytokine production, we quantified by Western blotting the phosphorylation of ERK1/2 and p38 MAPKs and the nuclear translocation of NF-κB p65 in BMDMs exposed to LPS for 0, 10, 30, and 60 min (Figure 3B). SIRT2/3 double deletion resulted in higher NF-κB p65 nuclear content at baseline and increased phosphorylation of ERK1/2 after 30 min of stimulation. p38 was not differentially phosphorylated in SIRT2/3+/+ and SIRT2/3−/− BMDMs. In line with the increased intracellular signaling and cytokine production, the expression level of TLR1, TLR2, TLR4, and TLR9 mRNA was increased in SIRT2/3−/− BMDMs when compared to SIRT2/3+/+ BMDMs (Figure 3C).
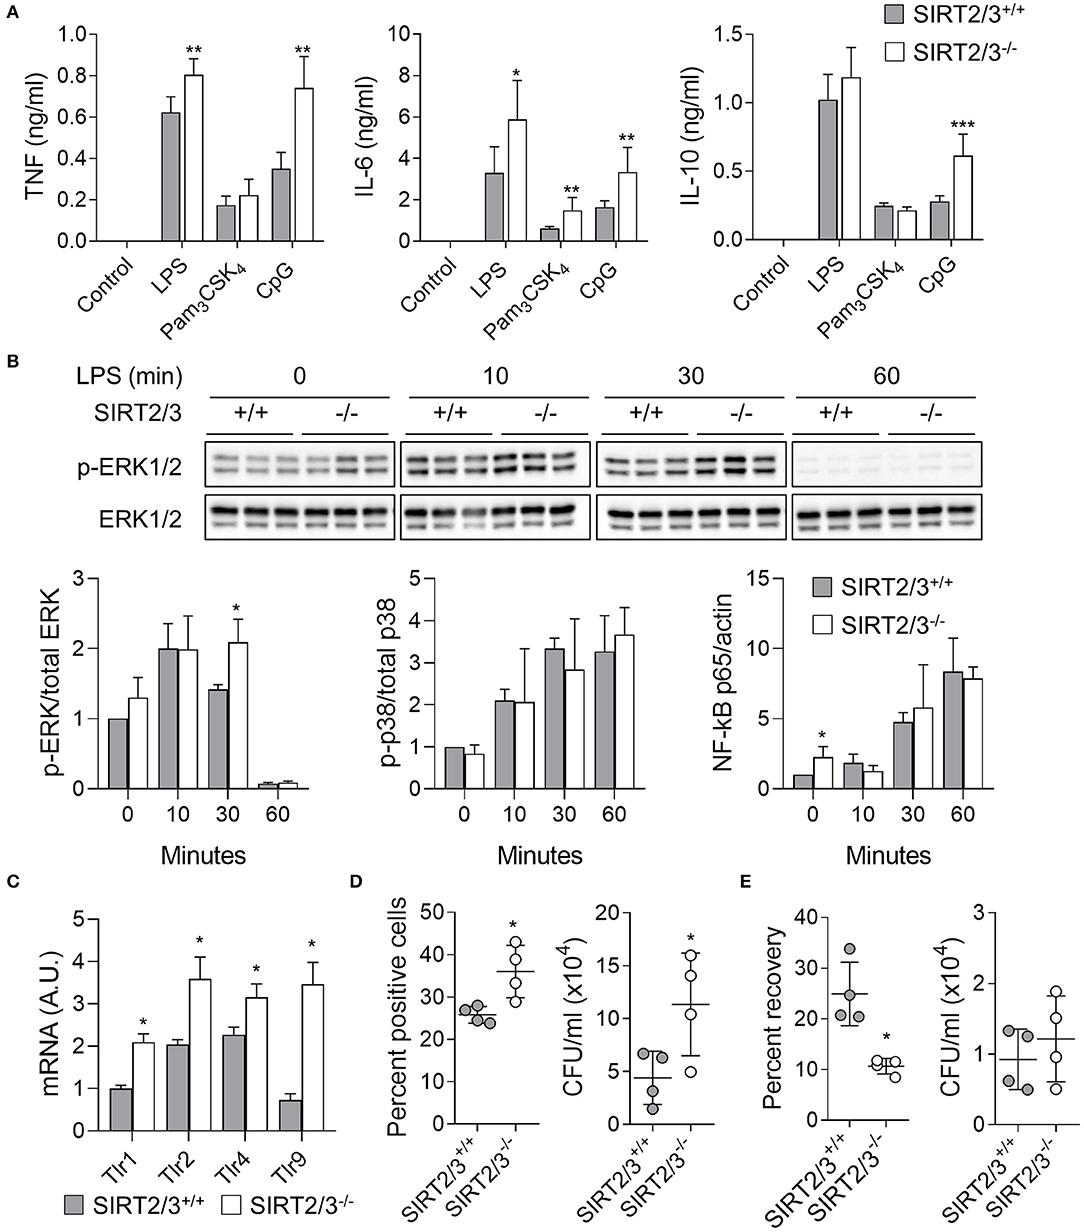
Figure 3. SIRT2/3 deficiency increases cytokine secretion, phagocytosis and killing by macrophages. (A) BMDMs were exposed to LPS (10 ng/ml), Pam3CSK4 (100 ng/ml), and CpG (1 μg/ml) for 24 h. The concentrations of TNF, IL-6, and IL-10 in cell culture supernatants were measured by ELISA. (B) BMDMs were exposed for 0, 10, 30, and 60 min to 10 ng/ml LPS. Phosphorylation of ERK1/2 and p38, and nuclear translocation of NF-κB p65 were measured by Western blotting. Representative blots are presented for ERK1/2 phosphorylation (Full blots are available in Supplementary Figure 1). Quantitative data are means ± SD of three mice. (C) Tlr1, Tlr2, Tlr4, and Tlr9 mRNA levels in BMDMs were quantified by RT-qPCR and normalized to actin mRNA levels. Data are mean ± SD of four mice analyzed in triplicate. (D) Phagocytosis by BMDMs exposed for 1 h to fluorescent beads (left) and live E. coli (right) at a bead or bacteria-to-cell ratio of 10:1. Data were analyzed by flow cytometry and colony enumeration, respectively. (E) Killing of E. coli by BMDMs. The percentage of recovery (left) was calculated by dividing the number of bacteria recovered after 6 h by the number of bacteria recovered after 1 h. Absolute counts are presented on the right. Data are mean ± SD of four mice analyzed in triplicate. Each dot represents a mouse. *P < 0.05; **P < 0.01; ***P < 0.005.
Since SIRT2 deficiency promoted phagocytosis (13), we compared the phagocytic activity over a period of 1 h of SIRT2/3+/+ and SIRT2/3−/− BMDMs. The analysis by flow cytometry of BMDMs incubated with fluorescent beads showed a 1.4-fold higher proportion of SIRT2/3−/− BMDMs having phagocytosed beads (P = 0.03; Figure 3D, left panel). To better reflect infectious conditions, BMDMs were exposed to live E. coli, and intracellular bacteria were quantified by plating cell lysates followed by the enumeration of colonies. SIRT2/3−/− BMDMs ingested 2.6-fold more E. coli (SIRT2/3+/+ vs. SIRT2/3−/− BMDMs: 4.4 ± 2.5 vs. 11.3 ± 4.8 × 10⁴ E. coli, P = 0.03; Figure 3D, right panel). The increased phagocytic activity of SIRT2/3−/− BMDMs was independent from an increased expression of the phagocytic receptors integrin αM/Itgam (CD11b), Itgβ1/Itgb1 (CD29), Itgβ2/Itgb2 (CD18), Itgα5/Itga5 (CD49e), and ItgαX/Itgax (CD11c) (Supplementary Figure 2A). Since a main function of phagocytes is to kill invading microorganisms, we tested the killing of E. coli by BMDMs following 6 h of incubation. SIRT2/3−/− BMDMs showed around 2-fold more efficient killing capacity when compared to SIRT2/3+/+ BMDMs as demonstrated by a reduced percentage recovery of ingested bacteria by SIRT2/3−/− BMDMs (SIRT2/3+/+ vs. SIRT2/3−/− BMDMs: 25 ± 6 vs. 11 ± 2% recovery of ingested E. coli, P = 0.03; Figure 3E, left panel), and similar total numbers of bacteria in SIRT2/3+/+ and SIRT2/3−/− BMDMs (9.3 vs. 1.2 × 10⁴ total E. coli, P = 0.5; Figure 3E, right panel).
SIRT2/3 Deficiency Alters Macrophage Metabolism
Macrophages acquire energy mainly through oxidative metabolism under steady-state and switch to glycolysis upon activation (73, 74). Since SIRT2/3 deficiency increased the cytokine response of BMDMs, though both proinflammatory and anti-inflammatory cytokines, we assumed that their glycolytic parameters were affected. The metabolic parameters of SIRT2/3+/+ and SIRT2/3−/− BMDMs were measured using the Seahorse technology. Unexpectedly, SIRT2/3−/− BMDMs displayed reduced glycolysis, glycolytic capacity and glycolytic reserve (Figure 4A). In line with this observation, SIRT2/3−/− BMDMs expressed slightly reduced mRNA levels of Solute carrier family 2, member 1 also known as Glucose transporter 1 (Glut1) while the mRNA levels of Hypoxia inducible factor 1α (Hif1a) were slightly increased (1.6-fold, Figure 4B). To assess whether the lower glycolysis of SIRT2/3−/− BMDMs was compensated by an increased metabolism of other sources of energy, we assessed the dependency (i.e., the necessity for a fuel to meet metabolic demand) and the flexibility (i.e., the ability to increase the usage of fuel when access to other energy sources is inhibited) of BMDMs toward glucose, fatty acids (FA) and glutamine. SIRT2/3+/+ and SIRT2/3−/− BMDMs were equally dependent and flexible toward glucose (Figure 4C). However, SIRT2/3−/− BMDMs were less dependent than SIRT2/3+/+ BMDMs toward FA and glutamine, but were more flexible than SIRT2/3+/+ BMDMs toward FA (Figure 4C). FA are metabolized in the mitochondria through FA oxidation (FAO). FAO is controlled by the rate-limiting enzyme Carnitine palmoyltransferase I (Cpt1) that facilitates FA transport to the mitochondria (74). SIRT2/3−/− BMDMs expressed higher levels of Cpt1 mRNA when compared to SIRT2/3+/+ BMDMs, but lower levels of mRNA encoding for carrier protein and enzymes involved in cholesterol synthesis FA binding protein 4 (Fabp4), 3-Hydroxy-3-methylglutaryl-coenzyme A reductase (Hmgcr), Mevalonate decarboxylase (Mvd), and Squalene epoxidase (Sqle) (Figure 4D). Therefore, SIRT2/3 deficiency possibly favored FAO over cholesterol synthesis.
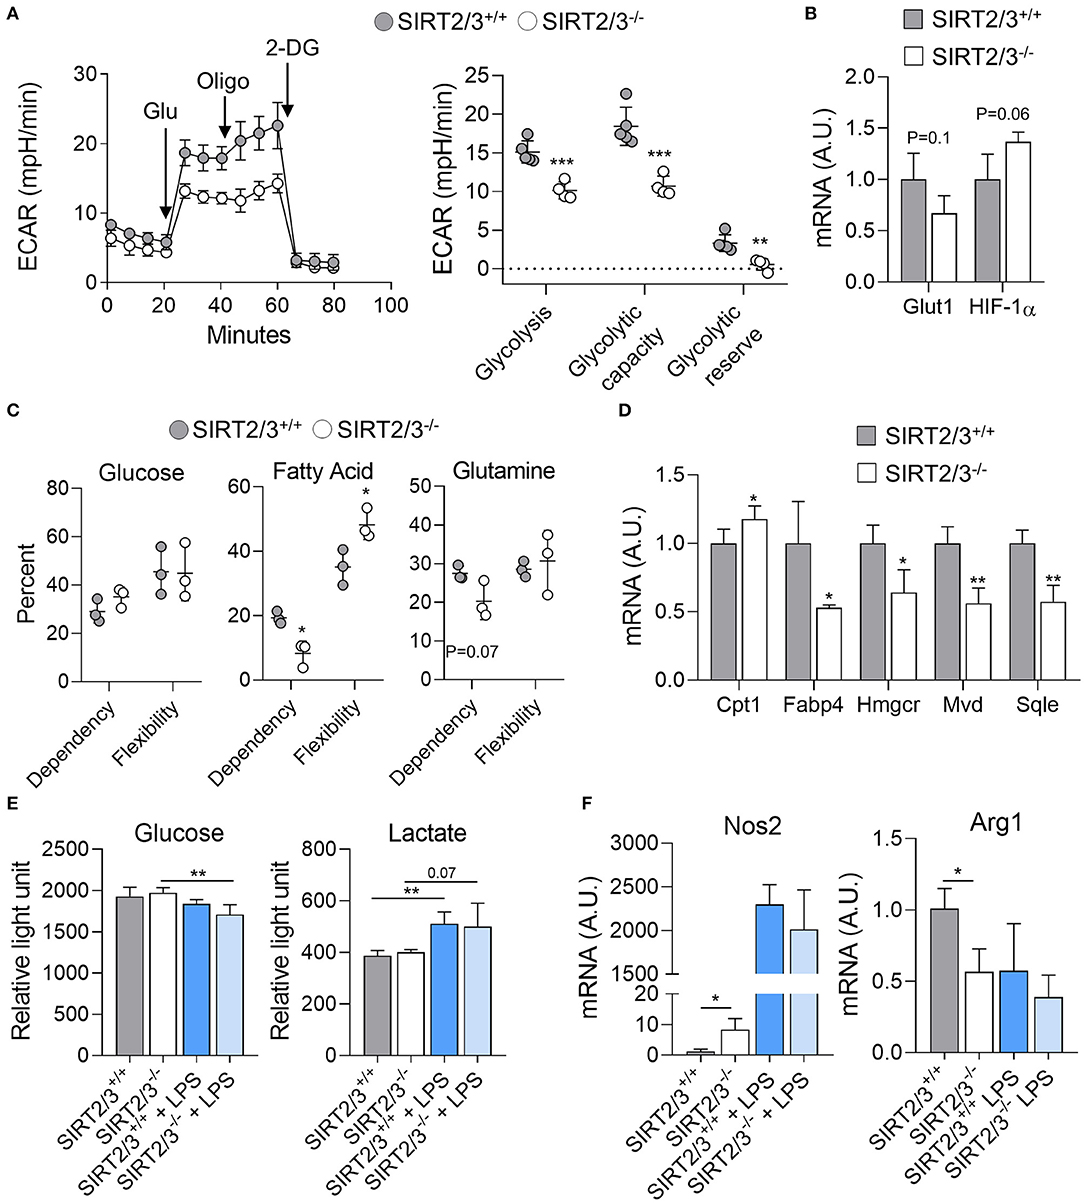
Figure 4. SIRT2/3 deficiency alters macrophage metabolism. (A) The extracellular acidification rate (ECAR) of SIRT2/3+/+ and SIRT2/3−/− BMDMs was measured using the Seahorse technology (left) and used to calculate the glycolysis, glycolytic capacity and glycolytic reserve (right). Glu, glucose; Oligo, oligomycin; 2-DG, 2-deoxyglucose. (B) Glut1 and Hif1a mRNA levels in BMDMs were quantified by RT-qPCR and normalized to actin mRNA levels. (C) Dependency and flexibility of SIRT2/3+/+ and SIRT2/3−/− BMDMs toward glucose, fatty acids (FA) and glutamine. (D) Cpt1, Fabp4, Hmgcr, Mvd and Sqle mRNA levels in BMDMs were quantified by RT-qPCR and normalized to actin mRNA levels. (E) Glucose consumption and lactate production by SIRT2/3+/+ and SIRT2/3−/− BMDMs left unstimulated or stimulated for 8 h (glucose) or 24 h (lactate) with 10 ng/ml LPS. Glucose and lactate were detected using a luminescence-based assay. (F) Nos2 and Arg1 were quantified by RT-qPCR and normalized to actin mRNA levels. Data are means ± SD of 3–5 mice analyzed in triplicate. *P < 0.05; **P < 0.01; ***P < 0.005.
LPS stimulation induces macrophage polarization toward a classical, M1, phenotype which is linked to a metabolic shift from oxidative phosphorylation to glycolysis (73, 74). Thus, we measured the consumption of glucose and the production of lactate upon LPS stimulation. Glucose concentration in medium decreased when BMDMs were exposed for 8 h to LPS, with a slightly superior effect observed with SIRT2/3−/− BMDMs (Control vs. LPS: P = 0.2 and 0.008 for SIRT2/3+/+ and SIRT2/3−/− BMDMs; Figure 4E). In line with a metabolic shift, the levels of lactate increased in the medium of LPS-simulated BMDMs (Figure 4E). Overall, glucose consumption and lactate production were not different between SIRT2/3+/+ and SIRT2/3−/− BMDMs. Although these results were unanticipated considering ECAR measurements, they could also reflect the small increase in the production of both proinflammatory and anti-inflammatory cytokines by double knockout BMDMs exposed to LPS. Finally, we questioned whether SIRT2/3−/− altered macrophage polarization by measuring the mRNA expression levels of Nitric oxide synthase 2 (Nos2) and Arginase 1 (Arg1) as markers of M1 and M2 phenotypes, respectively. SIRT2/3−/− macrophages expressed higher levels of Nos2 and lower levels of Arg1 at baseline, but similar levels of both mRNAs after stimulation with LPS (Figure 4F).
SIRT2/3−/− Mice Are Protected From Endotoxic Shock
Acute inflammation induced by LPS is characterized by an early anabolic glycolytic phase followed by a catabolic adaptation phase involving FAO (50). SIRT2−/− and SIRT3−/− mice were shown to behave like wild-type mice in models of endotoxemia (13, 43). Yet, considering that SIRT2/3−/− BMDMs stimulated with microbial products produced more proinflammatory and anti-inflammatory cytokines, and that the peritoneum of SIRT2/3−/− mice contained more anti-inflammatory B-1a cells and less activated NK cells, we hypothesized that SIRT2/3 deficiency may protect mice from acute inflammation. A model of endotoxic shock was developed by challenging mice intraperitoneally with 10 mg/kg LPS. While 93% of SIRT2/3−/− mice survived endotoxemia, only 58% of SIRT2/3+/+ mice did (P = 0.004; Figure 5A). In agreement, SIRT2/3−/− mice showed lower severity scores than SIRT2/3+/+ mice (Figure 5B), but there was no noticeable differential effect on mouse weight (Figure 5C). Depletion of macrophages by clodronate liposomes injected i.p. (90% depletion, n = 4; P < 0.001) did not modify the survival profiles (P = 0.6), suggesting a minor impact of macrophages in our model. To assess the immune status of endotoxemic mice, blood was collected 1 day post-challenge to quantify cytokines (Figure 5D) and leukocyte subpopulations (Figure 5E). Nine out of the fourteen detectable cytokines measured by Luminex (IFNγ, IL-6, IL-10, IL-12p40, IL-17A, IL-18, KC/CXCL1, MIP-2/CXCL2, IP-10/CXCL10) were present at significantly lower concentrations in the blood of SIRT2/3−/− mice. Endotoxemia was associated with a strong reduction of all blood leukocyte subpopulations (Figure 5E). Finally, we questioned whether SIRT2/3 deletion would affect endotoxin tolerance as reported for other sirtuins (24, 75–77). To address that question, blood was collected from mice challenged 0, 1, 3, and 7 days earlier with LPS. Blood was used to quantify leukocytes and to measure TNF and IL-10 response upon ex vivo exposure for 6 h to 10 ng/ml LPS or 10 μM CpG. At baseline, the blood of SIRT2/3−/− mice contained slightly more leukocytes (Figure 5F) and produced more TNF and IL-10 in response to LPS and CpG stimulation (Figure 5G). Confirming the induction of endotoxin tolerance, TNF production induced by LPS and CpG was decreased while IL-10 production induced by LPS was enhanced when comparing the reactivity of blood from SIRT2/3+/+ and SIRT2/3−/− mice challenged 1 day earlier with LPS with that of untouched mice (Figure 5G). The production of TNF and IL-10 returned roughly to those measured under baseline conditions using blood collected from mice challenged 1 week earlier with LPS. Overall, SIRT2/3 double deletion did not seem to affect the induction of endotoxin tolerance.
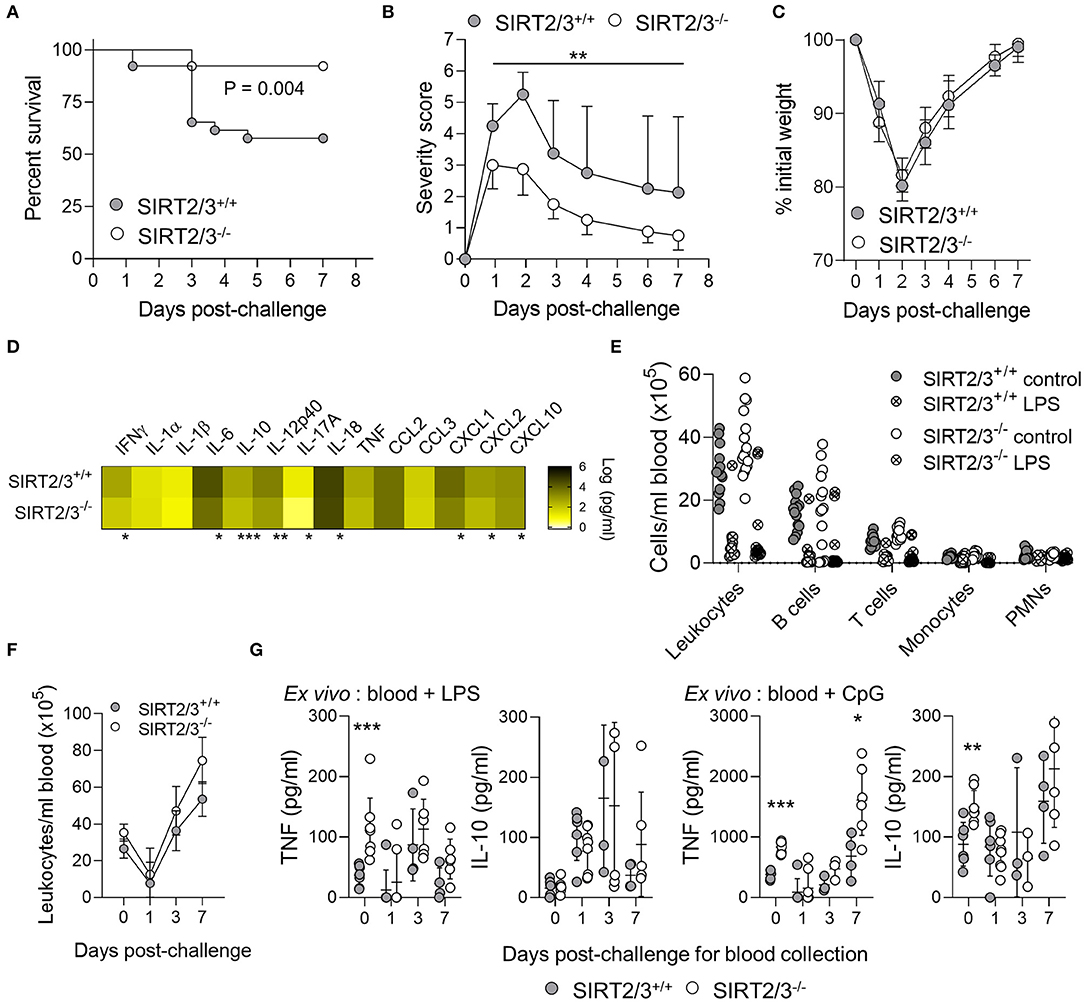
Figure 5. SIRT2/3−/− mice are protected from endotoxic shock. Mice were challenged with 10 mg/kg LPS i.p. Survival (A), severity score (B), and weight loss (C) were recorded daily. Data are mean ± SD (B,C). (D–G) Blood was collected 0, 1, 3, and 7 days post-challenge to quantify the concentrations of cytokines by Luminex (D, at day 1 post-challenge) and leukocytes by flow cytometry (E,F, at day 1 post-challenge in E). Blood collected 0, 1, 3, and 7 days post-LPS challenge was stimulated ex vivo for 6 h with 10 ng/ml LPS and 10 μM CpG. TNF and IL-10 concentrations were measured by ELISA (G). TNF and IL-10 concentrations in blood cultured for 6 h without stimulation were below the detection limit (not depicted on the graphs). Data were obtained from 26 (A), 7–8 (B,C,F,G), 4 (D), and 14–16 (E) mice per group. *P < 0.05; **P < 0.01; ***P < 0.005.
Discussion
Sirtuins share structural and functional features and shuttle between cellular compartments. Hence they may compensate the absence of one sirtuin in single knockout mice. Here, we described a germinal SIRT2/3 double deficient mouse line. We elected to delete SIRT2 and SIRT3 because SIRT2 is the overall most expressed sirtuin and SIRT3 the predominant mitochondrial sirtuin in myeloid cells (13, 43). The new SIRT2/3−/− mouse line developed normally without apparent defects. Yet, SIRT2/3 deficiency altered to some extent the frequency of immune cells in several immune compartments and the metabolism and functions of macrophages. Importantly, SIRT2/3−/− mice were protected from endotoxemia, contrary to SIRT2−/− and SIRT3−/− mice that behaved like wild-type mice (13, 43). Altogether, these data suggest a subtle, concerted role for SIRT2 and SIRT3 to be considered when developing drugs targeting multiple sirtuins.
Additive or synergistic effects between SIRT2 and SIRT3 could be anticipated since, for example, both SIRT2 and SIRT3 impact on ROS detoxification albeit through different transcriptional and post-transcriptional mechanisms, and both have been reported to dampen inflammatory responses (13, 23–31, 38, 39, 41–44). However, most of the effects observed here were rather slight. The most consistent effect of SIRT2/3 deficiency on immune cell distribution was on B cells that were increased slightly in the bone marrow, the spleen, the blood and more strongly in the peritoneum. Whether these variations impact on the development of plasma cells and humoral responses will be addressed in future studies. An impact on the levels of natural antibodies might be expected since B-1a cells are main producers of natural polyreactive IgM antibodies biased toward bacterial and self-antigens (70). Considering that B-1 B cells cooperate to protect from pneumococcal diseases through the generation of anti-streptococcal natural antibodies by B-1a cells and the generation of acquired anticapsule response by B-1b cells (78), it will be interesting to test whether SIRT2/3−/− mice are resistant to Streptococcus pneumoniae pneumonia (79).
The bone marrow of SIRT3−/− mice, but not SIRT2−/− mice, contained more B cells. Up to now, the role of sirtuins in B cell biology has been mainly studied using B cell lymphoma giving rise to contrasting observations. Overexpression of SIRT1 and SIRT2 promoted the survival of chronic lymphocytic leukemia (CLL) B cells and correlated with poor outcome in patients with CLL (80, 81). On the contrary, SIRT3 acts as a tumor suppressor since reduced SIRT3 expression was associated with B cell proliferation and worsening of patients with B cell malignancies (82). However, sirtuins may have a differential impact on malignant cells and primary cells.
Additional leukocyte subsets were affected in SIRT2/3−/− mice, however with small organ specific effects, for example a reduced proportion of alternative monocytes in the bone marrow and spleen, of PMNs in the blood and spleen and of DCs in the spleen. In general, these effects were observed in one of the two parental mouse lines (SIRT2−/− or SIRT3−/− mice), indicative of dominant effects of the knockouts. A more robust effect was observed on NK cells. The expression of sirtuins in NK cells has not been reported, but the fact that caloric restriction modulated NK cell phenotype suggested that sirtuins may impact on NK cell development or functions (83). NK cells from the blood of SIRT2−/−, SIRT3−/−, and SIRT2/3−/− mice showed increased expression of the homing receptor CD62L, while the peritoneum of SIRT2/3−/− mice contained less NK cells with reduced expression of CD43. CD43 is a maturation marker of NK cells, and reduced CD43 expression reflects decreased IFNγ production by NK cells (84). Thus, in the peritoneum, SIRT2/3−/− NK cells potentially display a reduced inflammatory profile. It will be interesting to assess the functional consequences of SIRT2/3 deficiency on NK cell-mediated immunity, for instance in models of viral infections induced by murine cytomegalovirus (MCMV), lymphocytic choriomeningitis virus (LCMV) or influenza virus during which NK cells play a protective role. Whether SIRT2/3 deficiency affects NK cell antitumor cell cytotoxicity and has a role in graft-vs-host-disease would be additional interesting areas of investigations.
We previously reported that SIRT2−/− and SIRT3−/− BMDMs produced normal levels of a large panel of cytokines (13, 43). Conversely, SIRT2/3−/− BMDMs produced increased levels of both proinflammatory (TNF, IL-6) and anti-inflammatory (IL-10) cytokines when compared to control BMDMs. A plausible mechanism underlying augmented cytokine response was the increased activation of ERK1/2 and NF-κB p65 intracellular signaling in SIRT2/3−/− BMDMs. Like SIRT2−/− BMDMs (13), SIRT2/3−/− BMDMs phagocytosed better inert beads and live bacteria than control BMDMs. Moreover, they killed ingested E. coli to a higher rate. Of note, divergent observations have been reported in the literature, with SIRT2 and SIRT3 associated with both anti-inflammatory and proinflammatory activities also in macrophages (13, 23–31, 41–44). As an example of a possible antagonism between SIRT2 and SIRT3, silencing SIRT2 reduced NF-κB activation and induced macrophage alternative (anti-inflammatory) activation (85) while SIRT3 upregulation reduced macrophage inflammatory responses (86). This dichotomy might explain the mixed phenotype of SIRT2/3−/− BMDMs which displayed characteristics of classically and alternatively activated macrophages.
Sirtuins are intrinsically linked to cell metabolism. The deletion of SIRT2 and SIRT3 stimulated HIF-1α expression and activity, thereby promoting Glut1 expression, glucose uptake and tumor growth (87, 88). In line, Hif1a mRNA levels were increased 1.6-fold in SIRT2/3−/− BMDMs. However, this increase did not translate into an increase of glucose metabolism since Glut1 expression and glycolytic parameters, measured using the Seahorse technology, were all reduced in SIRT2/3−/− BMDMs. This was surprising since inflammatory cytokine response is normally supported by glycolysis. Yet one has to take into account that SIRT2/3−/− BMDMs were not purely “proinflammatory” since they increased IL-10 production, which in alternatively activated macrophages is fueled by oxidative phosphorylation (73). Nonetheless, glucose consumption and lactate production measured by luminescent assays were not affected in SIRT2/3−/− BMDMs. Differences in the time point analyzed, plastic support and medium used for cell culture in relation with the technology used may have affected metabolic measurements. Overall, dual deletion of SIRT2 and SIRT3 may have disrupted metabolic control in BMDMs. A possible explanation for our observations is that post-translational mechanisms destabilized HIF-1α and impaired its transcriptional activity in SIRT2/3−/− BMDMs. Attractive mediators could be SIRT6 and SIRT7 which expression was enhanced to some extent in SIRT2/3−/− BMDMs. Indeed, SIRT6 functions as a co-repressor of HIF-1α, and SIRT7 inhibits the activity of HIF-1α through a mechanism independent of proteasomal or lysosomal degradation of HIF-1α (89, 90). SIRT2/3−/− BMDMs were less dependent on FA and glutamine but more flexible toward FA, indicating that both glycolysis and FA metabolism were altered in SIRT2/3−/− BMDMs. The expression of genes essential for the cholesterol synthesis pathway was decreased in SIRT2/3−/− BMDMs, signifying that SIRT2/3 deficiency influenced lipid metabolism of macrophages by favoring FAO over cholesterol synthesis. Although counterintuitive at first glance, a similar antagonism between FAO and cholesterol synthesis has been observed in macrophages deficient in carnitine palmitoyltransferase 1 and 2 (CPT1, CPT2) (91).
Metabolic adaptation shapes immune cell functions and influences the acute phase and the resolution phase of inflammation that are fueled predominantly by glycolysis and oxidative phosphorylation, respectively (92, 93). Indeed, mice treated with 2-deoxyglucose to block glycolysis or with the sirtuin inhibitor cambinol were protected from endotoxemia (94, 95). Going well along with a reduced glycolytic activity of macrophages in vitro, SIRT2/3−/− mice had a strong survival advantage during endotoxemia, which was associated with reduced blood levels of cytokines. Even so, SIRT2/3 double deletion did not seem to affect endotoxin tolerance as reported for SIRT1, SIRT4, and SIRT5 (24, 75–77). Interestingly, SIRT6, together with SIRT1, coordinated the switch from glucose to FAO during the acute inflammatory response (50), and transcriptional activation of SIRT6 via FOXO3a inhibited the Warburg effect in glioblastoma cells (96). Consequently, the increased expression of SIRT6 in SIRT2/3−/− macrophages may favor FAO and contribute to dampen the cytokine storm involved in the pathological process of endotoxemia. An additional possibility is about a role played by B-1a cells, which were around 3-times more numerous in the peritoneum of SIRT2/3−/− mice. Indeed, B-1a cells are an important source of IL-10 and may circumvent local cytokine burst in response to LPS challenge. Further, B-1a cells were shown to protect mice from experimental sepsis (97, 98). Finally, peritoneal NK cells in SIRT2/3−/− mice were not only less, but also likely less activated as pinpointed by a reduced expression of CD43. As a consequence, the NK compartment potentially produced reduced levels of IFNγ which was shown to strongly potentiate TNF production and mortality during experimental endotoxemia (84, 99, 100). Altogether, several factors likely contributed to reduce systemic inflammatory parameters, morbidity and mortality of SIRT2/3−/− endotoxemic mice.
Overall, we report that SIRT2/3 dual deletion revealed a phenotype not observed in single deficient mice, indicating that sirtuins act in concert or compensate each other for certain immune functions. Considering the link between SIRT2 and SIRT3, metabolism and age-associated dysfunctions, it will be of great interest to investigate the impact of SIRT2/3 deficiency in the pathogenesis of metabolic, oncologic, neurodegenerative and chronic inflammatory disorders. Importantly from a translational perspective, SIRT2/3−/− mice were protected from endotoxemia. Thus, inhibitors targeting multiple sirtuins developed for clinical purposes may be useful to treat inflammatory diseases.
Data Availability Statement
All datasets generated for this study are included in the article/Supplementary Material.
Ethics Statement
The animal study was reviewed and approved by Service des Affaires Vétérinaires, Direction Générale de l'Agriculture, de la Viticulture et des Affaires Vétérinaires (DGAV), état de Vaud (Epalinges, Switzerland) under authorizations 876.9 and 877.9.
Author Contributions
TH, EC, ER, JR, and DL performed the in vitro experiments. TH, EC, and DL performed the in vivo experiments. TH, EC, and TR conceived the project and designed the experiments. TH and TR wrote the paper. All the authors revised the paper.
Funding
TR was supported by the Swiss National Science Foundation (SNSF, grant numbers 145014, 149511, and 173123) and received an interdisciplinary grant from the Faculty of Biology and Medicine of the University of Lausanne (Switzerland). TH received a scholarship from the Société Académique Vaudoise (Lausanne, Switzerland). ER received a scholarship from the Swiss-European Mobility Programme (SEMP).
Conflict of Interest
The authors declare that the research was conducted in the absence of any commercial or financial relationships that could be construed as a potential conflict of interest.
Acknowledgments
We thank Yoann Müller, Frédéric Droux, and Giovanni Zanchi for technical help.
Supplementary Material
The Supplementary Material for this article can be found online at: https://www.frontiersin.org/articles/10.3389/fimmu.2019.02713/full#supplementary-material
Supplementary Figure 1. Full blots used to create Figure 1.
Supplementary Figure 2. mRNA expression levels of phagocytic receptors by resting BMDMs. ItgaM, Itgb1, Itgb2, Itga5, and ItgaX mRNA levels were quantified by RT-qPCR and normalized to actin mRNA levels. Data are mean ± SD of four mice analyzed in triplicate.
Supplementary Figure 3. Gating strategies for flow cytometry analyses.
References
1. Broz P, Monack DM. Newly described pattern recognition receptors team up against intracellular pathogens. Nat Rev Immunol. (2013) 13:551–65. doi: 10.1038/nri3479
2. Savva A, Roger T. Targeting toll-like receptors: promising therapeutic strategies for the management of sepsis-associated pathology and infectious diseases. Front Immunol. (2013) 4:387. doi: 10.3389/fimmu.2013.00387
3. Ciarlo E, Savva A, Roger T. Epigenetics in sepsis: targeting histone deacetylases. Int J Antimicrob Agents. (2013) 42:S8–12. doi: 10.1016/j.ijantimicag.2013.04.004
4. Cohen J, Vincent JL, Adhikari NK, Machado FR, Angus DC, Calandra T, et al. Sepsis: a roadmap for future research. Lancet Infect Dis. (2015) 15:581–614. doi: 10.1016/S1473-3099(15)70112-X
5. Hotchkiss RS, Moldawer LL, Opal SM, Reinhart K, Turnbull IR, Vincent JL. Sepsis and septic shock. Nat Rev Dis Primers. (2016) 2:16045. doi: 10.1038/nrdp.2016.45
6. van der Poll T, van de Veerdonk FL, Scicluna BP, Netea MG. The immunopathology of sepsis and potential therapeutic targets. Nat Rev Immunol. (2017) 17:407–20. doi: 10.1038/nri.2017.36
7. Kaufmann SHE, Dorhoi A, Hotchkiss RS, Bartenschlager R. Host-directed therapies for bacterial and viral infections. Nat Rev Drug Discov. (2018) 17:35–56. doi: 10.1038/nrd.2017.162
8. Venet F, Monneret G. Advances in the understanding and treatment of sepsis-induced immunosuppression. Nat Rev Nephrol. (2018) 14:121–37. doi: 10.1038/nrneph.2017.165
9. Houtkooper RH, Pirinen E, Auwerx J. Sirtuins as regulators of metabolism and healthspan. Nat Rev Mol Cell Biol. (2012) 13:225–38. doi: 10.1038/nrm3293
10. Kupis W, Palyga J, Tomal E, Niewiadomska E. The role of sirtuins in cellular homeostasis. J Physiol Biochem. (2016) 72:371–80. doi: 10.1007/s13105-016-0492-6
11. Bheda P, Jing H, Wolberger C, Lin H. The substrate specificity of sirtuins. Annu Rev Biochem. (2016) 85:405–29. doi: 10.1146/annurev-biochem-060815-014537
12. Sidorova-Darmos E, Wither RG, Shulyakova N, Fisher C, Ratnam M, Aarts M, et al. Differential expression of sirtuin family members in the developing, adult, and aged rat brain. Front Aging Neurosci. (2014) 6:333. doi: 10.3389/fnagi.2014.00333
13. Ciarlo E, Heinonen T, Theroude C, Herderschee J, Mombelli M, Lugrin J, et al. Sirtuin 2 deficiency increases bacterial phagocytosis by macrophages and protects from chronic staphylococcal infection. Front Immunol. (2017) 8:1037. doi: 10.3389/fimmu.2017.01037
14. North BJ, Marshall BL, Borra MT, Denu JM, Verdin E. The human Sir2 ortholog, SIRT2, is an NAD+-dependent tubulin deacetylase. Mol Cell. (2003) 11:437–44. doi: 10.1016/S1097-2765(03)00038-8
15. Dryden SC, Nahhas FA, Nowak JE, Goustin AS, Tainsky MA. Role for human SIRT2 NAD-dependent deacetylase activity in control of mitotic exit in the cell cycle. Mol Cell Biol. (2003) 23:3173–85. doi: 10.1128/MCB.23.9.3173-3185.2003
16. Donmez G, Outeiro TF. SIRT1 and SIRT2: emerging targets in neurodegeneration. EMBO Mol Med. (2013) 5:344–52. doi: 10.1002/emmm.201302451
17. Kozako T, Suzuki T, Yoshimitsu M, Arima N, Honda S, Soeda S. Anticancer agents targeted to sirtuins. Molecules. (2014) 19:20295–313. doi: 10.3390/molecules191220295
18. Gomes P, Fleming Outeiro T, Cavadas C. Emerging role of sirtuin 2 in the regulation of mammalian metabolism. Trends Pharmacol Sci. (2015) 36:756–68. doi: 10.1016/j.tips.2015.08.001
19. Jing E, Gesta S, Kahn CR. SIRT2 regulates adipocyte differentiation through FoxO1 acetylation/deacetylation. Cell Metab. (2007) 6:105–14. doi: 10.1016/j.cmet.2007.07.003
20. Xu SN, Wang TS, Li X, Wang YP. SIRT2 activates G6PD to enhance NADPH production and promote leukaemia cell proliferation. Sci Rep. (2016) 6:32734. doi: 10.1038/srep32734
21. Wang F, Nguyen M, Qin FX, Tong Q. SIRT2 deacetylates FOXO3a in response to oxidative stress and caloric restriction. Aging Cell. (2007) 6:505–14. doi: 10.1111/j.1474-9726.2007.00304.x
22. Cha Y, Han MJ, Cha HJ, Zoldan J, Burkart A, Jung JH, et al. Metabolic control of primed human pluripotent stem cell fate and function by the miR-200c-SIRT2 axis. Nat Cell Biol. (2017) 19:445–56. doi: 10.1038/ncb3517
23. Rothgiesser KM, Erener S, Waibel S, Luscher B, Hottiger MO. SIRT2 regulates NF-kappaB dependent gene expression through deacetylation of p65 Lys310. J Cell Sci. (2010) 123:4251–8. doi: 10.1242/jcs.073783
24. Qin K, Han C, Zhang H, Li T, Li N, Cao X. NAD(+) dependent deacetylase Sirtuin 5 rescues the innate inflammatory response of endotoxin tolerant macrophages by promoting acetylation of p65. J Autoimmun. (2017) 81:120–9. doi: 10.1016/j.jaut.2017.04.006
25. Pais TF, Szego EM, Marques O, Miller-Fleming L, Antas P, Guerreiro P, et al. The NAD-dependent deacetylase sirtuin 2 is a suppressor of microglial activation and brain inflammation. EMBO J. (2013) 32:2603–16. doi: 10.1038/emboj.2013.200
26. Zhang W, Liu D, Ren J, Zhou P, Han X. Overexpression of Sirtuin2 prevents high glucose-induced vascular endothelial cell injury by regulating the p53 and NF-kappaB signaling pathways. Biotechnol Lett. (2018) 40:271–8. doi: 10.1007/s10529-017-2487-y
27. Jung YJ, Lee AS, Nguyen-Thanh T, Kim D, Kang KP, Lee S, et al. SIRT2 regulates LPS-induced renal tubular CXCL2 and CCL2 expression. J Am Soc Nephrol. (2015) 26:1549–60. doi: 10.1681/ASN.2014030226
28. Wang J, Koh HW, Zhou L, Bae UJ, Lee HS, Bang IH, et al. Sirtuin 2 aggravates postischemic liver injury by deacetylating mitogen-activated protein kinase phosphatase-1. Hepatology. (2017) 65:225–36. doi: 10.1002/hep.28777
29. Krey L, Luhder F, Kusch K, Czech-Zechmeister B, Konnecke B, Outeiro TF, et al. Knockout of silent information regulator 2 (SIRT2) preserves neurological function after experimental stroke in mice. J Cereb Blood Flow Metab. (2015) 35:2080–8. doi: 10.1038/jcbfm.2015.178
30. Cardoso F, Castro F, Moreira-Teixeira L, Sousa J, Torrado E, Silvestre R, et al. Myeloid sirtuin 2 expression does not impact long-term Mycobacterium tuberculosis control. PLoS ONE. (2015) 10:e0131904. doi: 10.1371/journal.pone.0131904
31. Lin J, Sun B, Jiang C, Hong H, Zheng Y. Sirt2 suppresses inflammatory responses in collagen-induced arthritis. Biochem Biophys Res Commun. (2013) 441:897–903. doi: 10.1016/j.bbrc.2013.10.153
32. Wang X, Buechler NL, Long DL, Furdui CM, Yoza BK, McCall CE, et al. Cysteine thiol oxidation on SIRT2 regulates inflammation in obese mice with sepsis. Inflammation. (2019) 42:156–69. doi: 10.1007/s10753-018-0881-9
33. Ahn BH, Kim HS, Song S, Lee IH, Liu J, Vassilopoulos A, et al. A role for the mitochondrial deacetylase Sirt3 in regulating energy homeostasis. Proc Natl Acad Sci USA. (2008) 105:14447–52. doi: 10.1073/pnas.0803790105
34. Hirschey MD, Shimazu T, Goetzman E, Jing E, Schwer B, Lombard DB, et al. SIRT3 regulates mitochondrial fatty-acid oxidation by reversible enzyme deacetylation. Nature. (2010) 464:121–5. doi: 10.1038/nature08778
35. Hebert AS, Dittenhafer-Reed KE, Yu W, Bailey DJ, Selen ES, Boersma MD, et al. Calorie restriction and SIRT3 trigger global reprogramming of the mitochondrial protein acetylome. Mol Cell. (2013) 49:186–99. doi: 10.1016/j.molcel.2012.10.024
36. Finley LW, Haas W, Desquiret-Dumas V, Wallace DC, Procaccio V, Gygi SP, et al. Succinate dehydrogenase is a direct target of sirtuin 3 deacetylase activity. PLoS ONE. (2011) 6:e23295. doi: 10.1371/journal.pone.0023295
37. Hirschey MD, Shimazu T, Jing E, Grueter CA, Collins AM, Aouizerat B, et al. SIRT3 deficiency and mitochondrial protein hyperacetylation accelerate the development of the metabolic syndrome. Mol Cell. (2011) 44:177–90. doi: 10.1016/j.molcel.2011.07.019
38. Someya S, Yu W, Hallows WC, Xu J, Vann JM, Leeuwenburgh C, et al. Sirt3 mediates reduction of oxidative damage and prevention of age-related hearing loss under caloric restriction. Cell. (2010) 143:802–12. doi: 10.1016/j.cell.2010.10.002
39. Tao R, Coleman MC, Pennington JD, Ozden O, Park SH, Jiang H, et al. Sirt3-mediated deacetylation of evolutionarily conserved lysine 122 regulates MnSOD activity in response to stress. Mol Cell. (2010) 40:893–904. doi: 10.1016/j.molcel.2010.12.013
40. Traba J, Geiger SS, Kwarteng-Siaw M, Han K, Ra OH, Siegel RM, et al. Prolonged fasting suppresses mitochondrial NLRP3 inflammasome assembly and activation via SIRT3-mediated activation of superoxide dismutase 2. J Biol Chem. (2017) 292:12153–64. doi: 10.1074/jbc.M117.791715
41. Tyagi A, Nguyen CU, Chong T, Michel CR, Fritz KS, Reisdorph N, et al. SIRT3 deficiency-induced mitochondrial dysfunction and inflammasome formation in the brain. Sci Rep. (2018) 8:17547. doi: 10.1038/s41598-018-35890-7
42. Kurundkar D, Kurundkar AR, Bone NB, Becker EJ Jr, Liu W, Chacko B, et al. SIRT3 diminishes inflammation and mitigates endotoxin-induced acute lung injury. JCI Insight. (2019) 4:120722. doi: 10.1172/jci.insight.120722
43. Ciarlo E, Heinonen T, Lugrin J, Acha-Orbea H, Le Roy D, Auwerx J, et al. Sirtuin 3 deficiency does not alter host defenses against bacterial and fungal infections. Sci Rep. (2017) 7:3853. doi: 10.1038/s41598-017-04263-x
44. Hayashi H, Cherpokova D, Martinod K, Witsch T, Wong SL, Gallant M, et al. Sirt3 deficiency does not affect venous thrombosis or NETosis despite mild elevation of intracellular ROS in platelets and neutrophils in mice. PLoS ONE. (2017) 12:e0188341. doi: 10.1371/journal.pone.0188341
45. Zeng H, He X, Tuo QH, Liao DF, Zhang GQ, Chen JX. LPS causes pericyte loss and microvascular dysfunction via disruption of Sirt3/angiopoietins/Tie-2 and HIF-2alpha/Notch3 pathways. Sci Rep. (2016) 6:20931. doi: 10.1038/srep20931
46. Koentges C, Cimolai MC, Pfeil K, Wolf D, Marchini T, Tarkhnishvili A, et al. Impaired SIRT3 activity mediates cardiac dysfunction in endotoxemia by calpain-dependent disruption of ATP synthesis. J Mol Cell Cardiol. (2019) 133:138–47. doi: 10.1016/j.yjmcc.2019.06.008
47. Chen Y, Fu LL, Wen X, Wang XY, Liu J, Cheng Y, et al. Sirtuin-3 (SIRT3), a therapeutic target with oncogenic and tumor-suppressive function in cancer. Cell Death Dis. (2014) 5:e1047. doi: 10.1038/cddis.2014.14
48. Beier UH, Wang L, Han R, Akimova T, Liu Y, Hancock WW. Histone deacetylases 6 and 9 and sirtuin-1 control Foxp3+ regulatory T cell function through shared and isoform-specific mechanisms. Sci Signal. (2012) 5:ra45. doi: 10.1126/scisignal.2002873
49. Xiao H, Jiao J, Wang L, O'Brien S, Newick K, Wang LC, et al. HDAC5 controls the functions of Foxp3(+) T-regulatory and CD8(+) T cells. Int J Cancer. (2016) 138:2477–86. doi: 10.1002/ijc.29979
50. Liu TF, Vachharajani VT, Yoza BK, McCall CE. NAD+-dependent sirtuin 1 and 6 proteins coordinate a switch from glucose to fatty acid oxidation during the acute inflammatory response. J Biol Chem. (2012) 287:25758–69. doi: 10.1074/jbc.M112.362343
51. Liu TF, Vachharajani V, Millet P, Bharadwaj MS, Molina AJ, McCall CE. Sequential actions of SIRT1-RELB-SIRT3 coordinate nuclear-mitochondrial communication during immunometabolic adaptation to acute inflammation and sepsis. J Biol Chem. (2015) 290:396–408. doi: 10.1074/jbc.M114.566349
52. Heinonen T, Ciarlo E, Le Roy D, Roger T. Impact of the dual deletion of the mitochondrial sirtuins SIRT3 and SIRT5 on anti-microbial host defenses. Front Immunol. (2019) 10:2341. doi: 10.3389/fimmu.2019.02341
53. Heinonen T, Ciarlo E, Theroude C, Pelekanou A, Herderschee J, Le Roy D, et al. Sirtuin 5 deficiency does not compromise innate immune responses to bacterial infections. Front Immunol. (2018) 9:2675. doi: 10.3389/fimmu.2018.02675
54. Lo Sasso G, Menzies KJ, Mottis A, Piersigilli A, Perino A, Yamamoto H, et al. SIRT2 deficiency modulates macrophage polarization and susceptibility to experimental colitis. PLoS ONE. (2014) 9:e103573. doi: 10.1371/journal.pone.0103573
55. Fernandez-Marcos PJ, Jeninga EH, Canto C, Harach T, de Boer VC, Andreux P, et al. Muscle or liver-specific Sirt3 deficiency induces hyperacetylation of mitochondrial proteins without affecting global metabolic homeostasis. Sci Rep. (2012) 2:425. doi: 10.1038/srep00425
56. Ciarlo E, Roger T. Screening the impact of sirtuin inhibitors on inflammatory and innate immune responses of macrophages and in a mouse model of endotoxic shock. Methods Mol Biol. (2016) 1436:313–34. doi: 10.1007/978-1-4939-3667-0_21
57. Balamurugan K, Sharan S, Klarmann KD, Zhang Y, Coppola V, Summers GH, et al. FBXW7alpha attenuates inflammatory signalling by downregulating C/EBPdelta and its target gene Tlr4. Nat Commun. (2013) 4:1662. doi: 10.1038/ncomms2677
58. Ciarlo E, Heinonen T, Herderschee J, Fenwick C, Mombelli M, Le Roy D, et al. Impact of the microbial derived short chain fatty acid propionate on host susceptibility to bacterial and fungal infections in vivo. Sci Rep. (2016) 6:37944. doi: 10.1038/srep37944
59. Giannoni E, Guignard L, Knaup Reymond M, Perreau M, Roth-Kleiner M, Calandra T, et al. Estradiol and progesterone strongly inhibit the innate immune response of mononuclear cells in newborns. Infect Immun. (2011) 79:2690–8. doi: 10.1128/IAI.00076-11
60. Vacher G, Ciarlo E, Savova-Bianchi D, Le Roy D, Hantier G, Niculita-Hirzel H, et al. Innate immune sensing of Fusarium culmorum by mouse dendritic cells. J Toxicol Environ Health A. (2015) 78:871–85. doi: 10.1080/15287394.2015.1051201
61. Roger T, Lugrin J, Le Roy D, Goy G, Mombelli M, Koessler T, et al. Histone deacetylase inhibitors impair innate immune responses to Toll-like receptor agonists and to infection. Blood. (2011) 117:1205–17. doi: 10.1182/blood-2010-05-284711
62. Mombelli M, Lugrin J, Rubino I, Chanson AL, Giddey M, Calandra T, et al. Histone deacetylase inhibitors impair antibacterial defenses of macrophages. J Infect Dis. (2011) 204:1367–74. doi: 10.1093/infdis/jir553
63. Roger T, Froidevaux C, Le Roy D, Reymond MK, Chanson AL, Mauri D, et al. Protection from lethal gram-negative bacterial sepsis by targeting Toll-like receptor 4. Proc Natl Acad Sci USA. (2009) 106:2348–52. doi: 10.1073/pnas.0808146106
64. Roger T, Delaloye J, Chanson AL, Giddey M, Le Roy D, Calandra T. Macrophage migration inhibitory factor deficiency is associated with impaired killing of gram-negative bacteria by macrophages and increased susceptibility to Klebsiella pneumoniae sepsis. J Infect Dis. (2013) 207:331–9. doi: 10.1093/infdis/jis673
65. Masri S, Sassone-Corsi P. Sirtuins and the circadian clock: bridging chromatin and metabolism. Sci Signal. (2014) 7:re6. doi: 10.1126/scisignal.2005685
66. Uhl B, Vadlau Y, Zuchtriegel G, Nekolla K, Sharaf K, Gaertner F, et al. Aged neutrophils contribute to the first line of defense in the acute inflammatory response. Blood. (2016) 128:2327–37. doi: 10.1182/blood-2016-05-718999
67. Rabacal W, Pabbisetty SK, Hoek KL, Cendron D, Guo Y, Maseda D, et al. Transcription factor KLF2 regulates homeostatic NK cell proliferation and survival. Proc Natl Acad Sci USA. (2016) 113:5370–5. doi: 10.1073/pnas.1521491113
68. Ray A, Dittel BN. Isolation of mouse peritoneal cavity cells. J Vis Exp. (2010) 35:1488. doi: 10.3791/1488
69. Ghosn EE, Cassado AA, Govoni GR, Fukuhara T, Yang Y, Monack DM, et al. Two physically, functionally, and developmentally distinct peritoneal macrophage subsets. Proc Natl Acad Sci USA. (2010) 107:2568–73. doi: 10.1073/pnas.0915000107
70. Aziz M, Holodick NE, Rothstein TL, Wang P. The role of B-1 cells in inflammation. Immunol Res. (2015) 63:153–66. doi: 10.1007/s12026-015-8708-3
71. O'Garra A, Chang R, Go N, Hastings R, Haughton G, Howard M. Ly-1 B (B-1) cells are the main source of B cell-derived interleukin 10. Eur J Immunol. (1992) 22:711–7. doi: 10.1002/eji.1830220314
72. Sindhava V, Woodman ME, Stevenson B, Bondada S. Interleukin-10 mediated autoregulation of murine B-1 B-cells and its role in Borrelia hermsii infection. PLoS ONE. (2010) 5:e11445. doi: 10.1371/journal.pone.0011445
73. O'Neill LA, Pearce EJ. Immunometabolism governs dendritic cell and macrophage function. J Exp Med. (2016) 213:15–23. doi: 10.1084/jem.20151570
74. Diskin C, Palsson-McDermott EM. Metabolic modulation in macrophage effector function. Front Immunol. (2018) 9:270. doi: 10.3389/fimmu.2018.00270
75. Liu TF, Yoza BK, El Gazzar M, Vachharajani VT, McCall CE. NAD+-dependent SIRT1 deacetylase participates in epigenetic reprogramming during endotoxin tolerance. J Biol Chem. (2011) 286:9856–64. doi: 10.1074/jbc.M110.196790
76. Tao J, Zhang J, Ling Y, McCall CE, Liu TF. Mitochondrial sirtuin 4 resolves immune tolerance in monocytes by rebalancing glycolysis and glucose oxidation homeostasis. Front Immunol. (2018) 9:419. doi: 10.3389/fimmu.2018.00419
77. Vachharajani VT, Liu T, Brown CM, Wang X, Buechler NL, Wells JD, et al. SIRT1 inhibition during the hypoinflammatory phenotype of sepsis enhances immunity and improves outcome. J Leukoc Biol. (2014) 96:785–96. doi: 10.1189/jlb.3MA0114-034RR
78. Haas KM, Poe JC, Steeber DA, Tedder TF. B-1a and B-1b cells exhibit distinct developmental requirements and have unique functional roles in innate and adaptive immunity to S. pneumoniae. Immunity. (2005) 23:7–18. doi: 10.1016/j.immuni.2005.04.011
79. Savva A, Brouwer MC, Roger T, Valls Seron M, Le Roy D, Ferwerda B, et al. Functional polymorphisms of macrophage migration inhibitory factor as predictors of morbidity and mortality of pneumococcal meningitis. Proc Natl Acad Sci USA. (2016) 113:3597–602. doi: 10.1073/pnas.1520727113
80. Dal Bo M, D'Agaro T, Gobessi S, Zucchetto A, Dereani S, Rossi D, et al. The SIRT1/TP53 axis is activated upon B-cell receptor triggering via miR-132 up-regulation in chronic lymphocytic leukemia cells. Oncotarget. (2015) 6:19102–17. doi: 10.18632/oncotarget.3905
81. Bhalla S, Gordon LI. Functional characterization of NAD dependent de-acetylases SIRT1 and SIRT2 in B-cell chronic lymphocytic leukemia (CLL). Cancer Biol Ther. (2016) 17:300–9. doi: 10.1080/15384047.2016.1139246
82. Yu W, Denu RA, Krautkramer KA, Grindle KM, Yang DT, Asimakopoulos F, et al. Loss of SIRT3 provides growth advantage for B cell malignancies. J Biol Chem. (2016) 291:3268–79. doi: 10.1074/jbc.M115.702076
83. Clinthorne JF, Beli E, Duriancik DM, Gardner EM. NK cell maturation and function in C57BL/6 mice are altered by caloric restriction. J Immunol. (2013) 190:712–22. doi: 10.4049/jimmunol.1201837
84. Kim S, Iizuka K, Kang HS, Dokun A, French AR, Greco S, et al. In vivo developmental stages in murine natural killer cell maturation. Nat Immunol. (2002) 3:523–8. doi: 10.1038/ni796
85. Lee AS, Jung YJ, Kim D, Nguyen-Thanh T, Kang KP, Lee S, et al. SIRT2 ameliorates lipopolysaccharide-induced inflammation in macrophages. Biochem Biophys Res Commun. (2014) 450:1363–9. doi: 10.1016/j.bbrc.2014.06.135
86. Xu H, Hertzel AV, Steen KA, Bernlohr DA. Loss of fatty acid binding protein 4/aP2 reduces macrophage inflammation through activation of SIRT3. Mol Endocrinol. (2016) 30:325–34. doi: 10.1210/me.2015-1301
87. Seo KS, Park JH, Heo JY, Jing K, Han J, Min KN, et al. SIRT2 regulates tumour hypoxia response by promoting HIF-1alpha hydroxylation. Oncogene. (2015) 34:1354–62. doi: 10.1038/onc.2014.76
88. Bell EL, Emerling BM, Ricoult SJ, Guarente L. SirT3 suppresses hypoxia inducible factor 1alpha and tumor growth by inhibiting mitochondrial ROS production. Oncogene. (2011) 30:2986–96. doi: 10.1038/onc.2011.37
89. Zhong L, D'Urso A, Toiber D, Sebastian C, Henry RE, Vadysirisack DD, et al. The histone deacetylase Sirt6 regulates glucose homeostasis via Hif1alpha. Cell. (2010) 140:280–93. doi: 10.1016/j.cell.2009.12.041
90. Hubbi ME, Hu H, Kshitiz Gilkes DM, Semenza GL. Sirtuin-7 inhibits the activity of hypoxia-inducible factors. J Biol Chem. (2013) 288:20768–75. doi: 10.1074/jbc.M113.476903
91. Nomura M, Liu J, Yu ZX, Yamazaki T, Yan Y, Kawagishi H, et al. Macrophage fatty acid oxidation inhibits atherosclerosis progression. J Mol Cell Cardiol. (2019) 127:270–6. doi: 10.1016/j.yjmcc.2019.01.003
92. Cheng SC, Scicluna BP, Arts RJ, Gresnigt MS, Lachmandas E, Giamarellos-Bourboulis EJ, et al. Broad defects in the energy metabolism of leukocytes underlie immunoparalysis in sepsis. Nat Immunol. (2016) 17:406–13. doi: 10.1038/ni.3398
93. Korner A, Schlegel M, Theurer J, Frohnmeyer H, Adolph M, Heijink M, et al. Resolution of inflammation and sepsis survival are improved by dietary Omega-3 fatty acids. Cell Death Differ. (2018) 25:421–31. doi: 10.1038/cdd.2017.177
94. Wang A, Huen SC, Luan HH, Yu S, Zhang C, Gallezot J. D, et al. Opposing effects of fasting metabolism on tissue tolerance in bacterial and viral inflammation. Cell. (2016) 166:1512–25 e12. doi: 10.1016/j.cell.2016.07.026
95. Lugrin J, Ciarlo E, Santos A, Grandmaison G, dos Santos I, Le Roy D, et al. The sirtuin inhibitor cambinol impairs MAPK signaling, inhibits inflammatory and innate immune responses and protects from septic shock. Biochim Biophys Acta. (2013) 1833:1498–510. doi: 10.1016/j.bbamcr.2013.03.004
96. Dong Z, Zhong X, Lei Q, Chen F, Cui H. Transcriptional activation of SIRT6 via FKHRL1/FOXO3a inhibits the warburg effect in glioblastoma cells. Cell Signal. (2019) 60:100–13. doi: 10.1016/j.cellsig.2019.04.009
97. Aziz M, Holodick NE, Rothstein TL, Wang P. B-1a cells protect mice from sepsis: critical role of CREB. J Immunol. (2017) 199:750–60. doi: 10.4049/jimmunol.1602056
98. Aziz M, Ode Y, Zhou M, Ochani M, Holodick NE, Rothstein TL, et al. B-1a cells protect mice from sepsis-induced acute lung injury. Mol Med. (2018) 24:26. doi: 10.1186/s10020-018-0029-2
99. Heinzel FP. The role of IFN-gamma in the pathology of experimental endotoxemia. J Immunol. (1990) 145:2920–4.
Keywords: sirtuins, innate immunity, macrophage, sepsis, cytokine, inflammation, metabolism, endotoxemia
Citation: Heinonen T, Ciarlo E, Rigoni E, Regina J, Le Roy D and Roger T (2019) Dual Deletion of the Sirtuins SIRT2 and SIRT3 Impacts on Metabolism and Inflammatory Responses of Macrophages and Protects From Endotoxemia. Front. Immunol. 10:2713. doi: 10.3389/fimmu.2019.02713
Received: 30 July 2019; Accepted: 05 November 2019;
Published: 26 November 2019.
Edited by:
Liwu Li, Virginia Tech, United StatesReviewed by:
Tie Fu Liu, Fudan University, ChinaDeepika Sharma, University of Chicago, United States
Copyright © 2019 Heinonen, Ciarlo, Rigoni, Regina, Le Roy and Roger. This is an open-access article distributed under the terms of the Creative Commons Attribution License (CC BY). The use, distribution or reproduction in other forums is permitted, provided the original author(s) and the copyright owner(s) are credited and that the original publication in this journal is cited, in accordance with accepted academic practice. No use, distribution or reproduction is permitted which does not comply with these terms.
*Correspondence: Thierry Roger, dGhpZXJyeS5yb2dlckBjaHV2LmNo
†ORCID: Thierry Roger orcid.org/0000-0002-9358-0109