Abstract
Obstructive sleep apnea syndrome (OSAS) is considered a low-grade chronic inflammatory disease. Interleukin-6 (IL-6) is one of the most significant inflammatory markers and an excellent proxy for the inflammatory/immune system. The present meta-analysis and meta-regression aimed at comparing plasma and serum levels of IL-6 between individuals (children and adults) with OSAS and healthy controls. Four databases, PubMed/Medline, Scopus, Cochrane Library, and Web of Science, were comprehensively searched to retrieve articles published up to December, 2019, with no further restrictions. RevMan 5.3 software was used to calculate the crude mean difference (MD) and 95% confidence interval (CI). The results of funnel plots and meta-regression were analyzed by the CMA 2.0 software. Sixty-three studies (57 with adults; six with children) were included in the present meta-analysis. For adults, 37 studies reported significantly higher serum IL-6 levels and 20 reported significantly higher plasma IL-6 levels for those with OSAS than for healthy controls [pooled MD of 2.89 pg/ml (P < 0.00001) and pooled MD of 2.89 pg/ml (P < 0.00001), respectively]. The pooled analysis of serum and plasma IL-6 levels in children with OSAS compared with controls revealed that only the MD of plasma IL-6 levels was significant (MD = 0.84 pg/ml, P = 0.004). Results of the meta-regression showed that greater age was associated with higher serum IL-6 levels. Egger's test revealed a publication bias across the studies for serum and plasma IL-6 levels (P = 0.00044 and P = 0.01445, respectively). In summary, the meta-analysis and meta-regression confirmed that, compared to healthy controls, individuals with OSAS (children and adults) had higher serum/plasma IL-6 levels.
Introduction
Obstructive sleep apnea syndrome (OSAS) is a complex and multifactorial disease that includes upper airway obstruction, chronic intermittent hypoxia, and sleep fragmentation (1). This disease is associated with insulin resistance (2), obesity (3), and metabolic syndrome (4), and is a major risk factor for type II diabetes (5). OSAS is also associated with cardiovascular disease (6). One study found that the prevalence rate for moderate to severe OSAS was 23.4% in female individuals, 49.7% in male individuals, and 70% in individuals with obesity (7). Additionally, OSAS adds to the development of nonalcoholic fatty liver disease (8).
In both children and adults with OSAS, the upregulation has been observed of prototypic inflammatory cytokines such as interleukin-6 (IL-6), and this in turn increased the nuclear factor κB (NFκB) pathway activation (9). For these reasons, OSAS is considered a low-grade chronic inflammatory disease (10). Repetitive hypoxia and reoxygenation during OSAS lead to and trigger anti-inflammatory cascades (11). Inflammatory markers such as IL-6 trigger and enhance vascular inflammation (12) and contribute to OSAS-related cardiovascular morbidity (13). Indeed, IL-6 is a multifunctional cytokine with several biological activities such as the proliferation of T lymphocytes, the differentiation of B lymphocytes, and the stimulation of immunoglobulin secretion (14). Remarkably, along with other bone resorption agents, IL-6 activates bone resorption (15).
Two previous meta-analyses (9, 16) have examined blood IL-6 levels in individuals with OSAS and combined the results of serum and plasma blood IL-6 levels. Their results illustrated an elevated level of this cytokine in individuals with OSAS when compared to controls. In these meta-analyses with 35 studies in 2015 (16) and 15 studies in 2013 (9), the standard mean difference (MD) was used to analyze the data while there were no subgroup analyses based on ethnicity or number of participants. In addition, the meta-regressions performed in these two analyses (9, 16) evaluated the correlations between age, body mass index (BMI), apnea–hypopnea index (AHI) and IL-6 levels, while the more recent of the two (16) just included ethnicity in a subgroup analysis, but exclusively in the meta-regression. Additionally, the earlier meta-analysis (9) did not include children. To address the limitations of these previous meta-analyses, we separately analyzed the results for plasma and serum levels of IL-6 in adults and children with OSAS across 63 studies using MD. We also examined the correlations of age, BMI, AHI, publication year, and number of participants with IL-6 level based on a meta-regression. Last, unlike the two previous meta-analyses, we ran subgroup analyses for ethnicity, number of participants, BMI, age, and AHI.
Materials and Methods
The review process followed the guidelines in the Preferred Reporting Items for Systematic Reviews and Meta-Analyses (PRISMA) statement (17).
Search Strategy
Four databases, PubMed/Medline, Scopus, Cochrane Library, and Web of Science, were comprehensively searched by one author (MS) to retrieve articles published up to 1st December, 2019, with no restrictions. The searched terms were (“sleep apnea” or “obstructive sleep apnea” or “obstructive sleep apnea syndrome” or “OSA” or “OSAS”) and (“interleukin-6” or “IL-6” or “interleukin 6”) and (“plasma” or “blood” or “serum”). We also manually searched for references (original and review articles) related to these topics.
Eligibility Criteria
Inclusion criteria were the following: (1) studies assessing the association between plasma or serum IL-6 levels and OSAS with case–control design without age, sex, or BMI restrictions; (2) OSAS was defined as AHI > 5 events/h in adults, and AHI > 1 events/h in children; (3) OSAS was diagnosed with polysomnography; (4) individuals with OSAS and controls had no other systematic diseases such as diabetes, neurological disorders such as multiple sclerosis, or neurodegenerative disorders such as Alzheimer's; (5) studies reporting pretreatment morning serum and/or plasma levels of IL-6 (around 6–10 am); (6) studies reporting sufficient data to calculate the MD and 95% confidence interval (CI) in individuals with OSAS and controls; and (7) studies with more than 10 cases included as individuals with OSAS and controls.
Exclusion criteria were the following: (1) studies with irrelevant or insufficient data or without clinical data; (2) review articles, conference papers, and book chapters; (3) studies without a control group; (4) studies reporting controls with AHI > 5 events/h in adults, and AHI > 1 events/h in children; and (5) studies reporting data overlapping with other studies.
Study Selection
Two authors (MMI and ME) independently read the titles and abstracts of the retrieved studies. Then, these two authors selected the relevant studies, while another author (MS) retrieved the full texts of the articles and excluded several full texts for the following reasons: two were meta-analyses; five were reviews; two were letter to editor studies; 25 had no control condition, or the control group was selected as AHI > 5 events/h in adults and AHI > 1 events/h in children; one had <10 cases included in both groups; six had no relevant data; one had duplicated data with another study; two did not report baseline IL-6 levels; one reported polymorphisms of IL-6; one reported high sensitivity IL-6 levels; three did not report morning level of IL-6; and one reported the level of IL-6 in exhaled breath condensate. Where two studies had overlapping data, we selected the study with the more recent publication year.
Data Extraction
Two authors (SB and MS) independently extracted the data from each study included in the meta-analysis. If there was a disagreement between the two authors, a third author (MMI) helped to reach a final decision. The data extracted for the meta-analysis included basic information including the first author, publication year, country of study, ethnicity of participants, age, BMI, and AHI of both groups, and mean and standard deviation (SD) of IL-6 levels in plasma and serum. Since some studies considered patients with mild OSAS (AHI, 1–5 events/h) as a control group condition, and since we had used this protocol for other studies, reporting the quality of studies as for usual case–control studies did not seem to be reasonable.
Quality Assessment
One author (MS) assessed the quality of the studies included in the meta-analysis using the Newcastle–Ottawa Scale (NOS); the total possible score for each study was 9 (18).
Statistical Analyses
The data were analyzed by one author. Review Manager 5.3 software (RevMan 5.3) was used to calculate the crude MD and 95% CI, which evaluated the significance of the pooled MD by Z test. Heterogeneity was assessed across the studies using both Cochran Q (19) and I2 metrics with scores ranging from 0 to 100% (20). In addition, in case of values of Pheterogeneity (Ph < 0.1) and I2 > 50%, this indicated a significant heterogeneity, and in this case, analysis of the random effect model was performed to evaluate the pooled MD and 95% CI values. Otherwise, we used the analysis by the fixed effect model.
The results of Begg's and Egger's tests were analyzed by the Comprehensive Meta-Analysis version 2.0 software (CMA 2.0). Begg's funnel plot shows the standard error (SE) of the log (MD), and the precision of each study is plotted against its log (MD) (21). Egger's test shows the linear regression between the precision of the studies and the standardized effect (22). Subgroup analyses were performed based on ethnicity, AHI, BMI, and sample size. Sensitivity analyses, namely, the “cumulative analysis” and “one study removed,” were used to estimate the consistency/stability of the results. A P value (two-tailed) of < 0.05 was taken to indicate a significant difference. Meta-regression is a quantitative method used in meta-analyses to estimate the impact of moderator variables on study effect size. The trim-and-fill method was used to estimate potentially missing studies due to publication bias in the funnel plot and to adjust the overall effect estimate (23).
Some studies reported the values for IL-6 in standard errors (SE); SEs were transformed into standard deviations (SD), (SE = SD/√N; N = number of individuals). Some studies reported median and interquartile values, which were transformed into mean and SD (24). The IL-6 levels in the serum and plasma were reported in picograms per milliliter (pg/ml). Participants with BMI >30 kg/m2 were considered obese (25).
Results
Search Results
A total of 892 records were identified in the four electronic databases. Figure 1 sets out the literature selection of these studies. After excluding duplications and irrelevant records, 113 full-text articles met the eligibility criteria. After evaluating the full texts, 50 articles were excluded as mentioned in Study Selection. At the end, 63 studies were included in the present meta-analysis (12, 26–87).
Figure 1
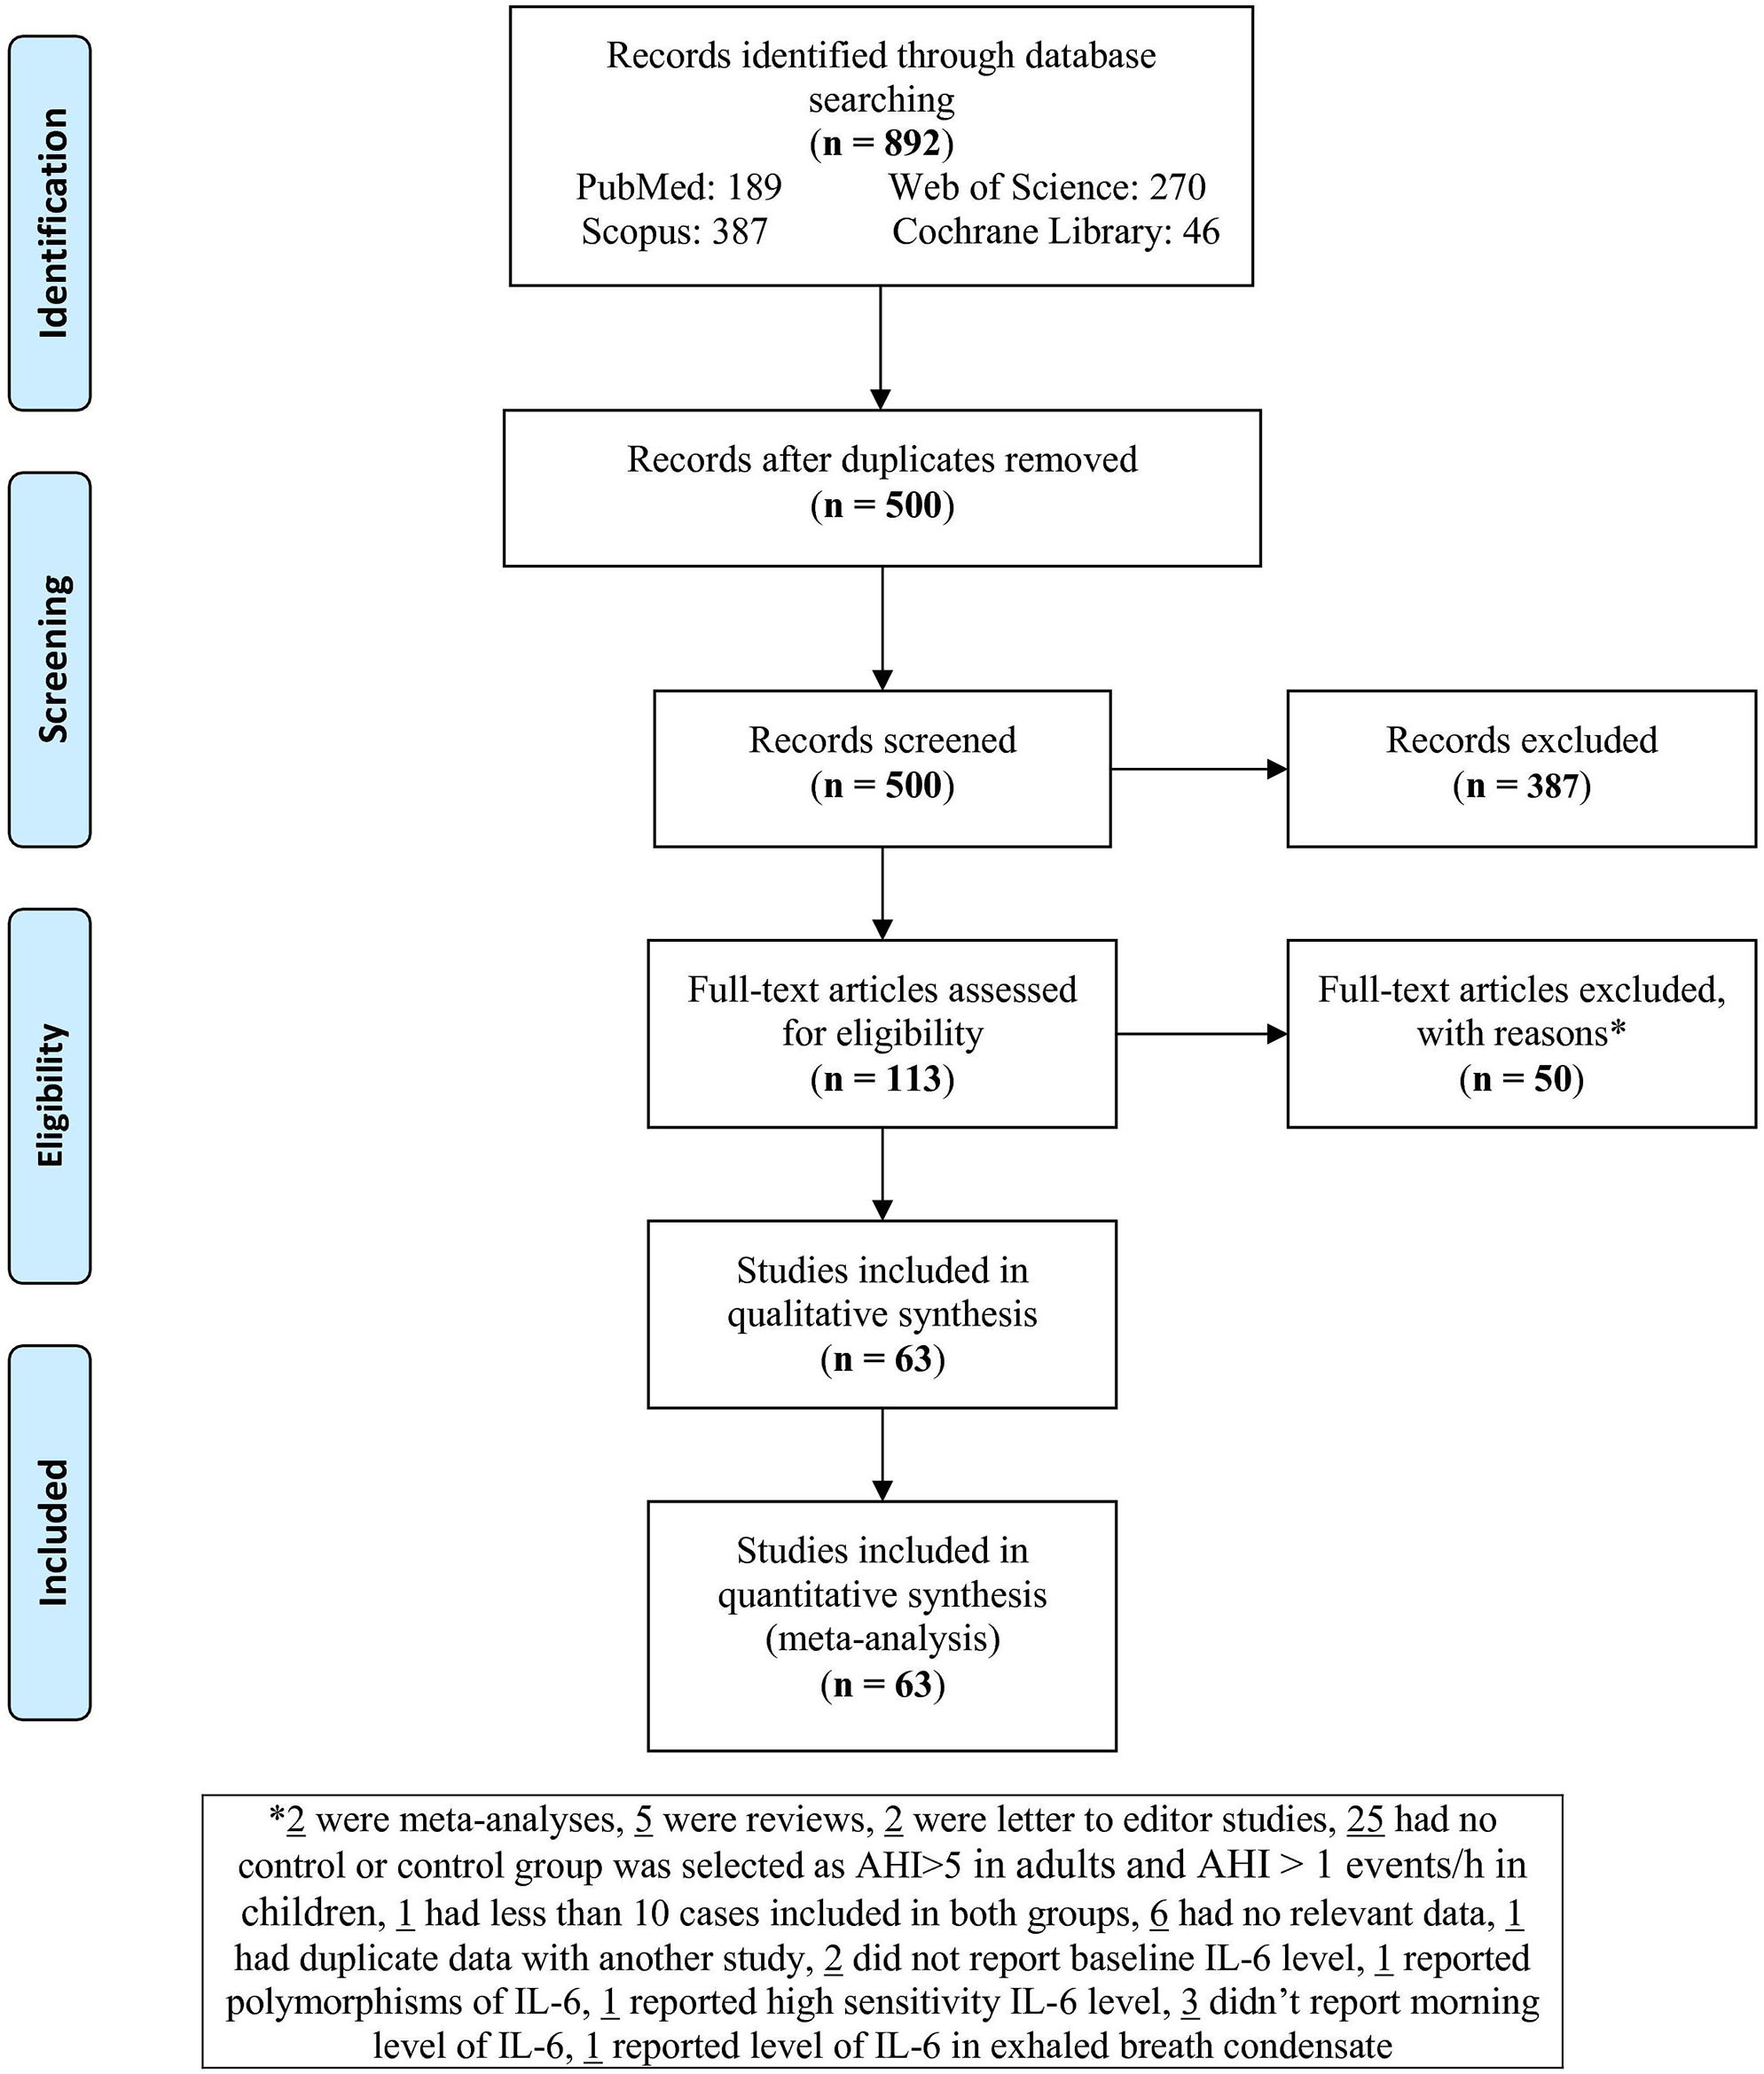
Flowchart of the study.
Basic Characteristics of the Studies
As shown in Table 1, of the 63 studies retained for analysis, 14 were conducted in China (27, 39, 46, 50, 51, 54, 55, 58, 65, 73, 77, 81, 82, 86), eight in the USA (26, 28, 34, 38, 56, 76, 78, 83), six in Greece (37, 43, 47, 49, 58, 64), six in Japan (29–31, 41, 42, 44), six in Turkey (12, 57, 62, 67, 68, 70), three in Italy (59, 63, 87), 3 in Brazil (45, 53, 72), three in Spain (36, 60, 71), two in Sweden (66, 84), two in India (79, 85), one in Ireland (32), one in Germany (35), one in Thailand (40), one in Finland (48), one in Canada (52), one in the UK (74), one in Croatia (80), one in Australia (33), one in Taiwan (69), and one in Belgium (75). With regard to ethnicity, 28 studies were performed with Caucasians (12, 32, 35–37, 43, 47–49, 57, 59–64, 66–68, 70, 71, 74, 75, 79, 80, 84, 85, 87), 22 with Asians (27, 29–31, 39–42, 44, 46, 50, 51, 54, 55, 58, 65, 69, 73, 77, 81, 82, 86), and 13 with mixed ethnicities (26, 28, 33, 34, 38, 45, 52, 53, 56, 72, 76, 78, 83). Of the 63 studies, 40 reported IL-6 levels in serum (12, 28, 30–34, 37, 39, 40, 44, 46, 47, 49–57, 62, 63, 65–68, 70, 72–77, 79, 81, 82, 85, 87), and 23 reported IL-6 levels in plasma (26, 27, 29, 35, 36, 38, 41–43, 45, 48, 55, 58–61, 64, 69, 71, 78, 80, 83, 84). Six studies included children (33, 38, 39, 60, 69, 75). Other characteristics of individuals with OSAS and controls (number of cases, age, BMI, and AHI) are shown in Figure 1.
Table 1
| First author, year | Country | Ethnicity | No. of OSAS/control | OSAS patients | Controls | Sample | ||||
|---|---|---|---|---|---|---|---|---|---|---|
| Age (years) | BMI (kg/m2) | AHI (events/h) | Age (years) | BMI (kg/m2) | AHI (events/h) | |||||
| ADULTS | ||||||||||
| Vgontzas, 1997 (26) | USA | Mixed | 12/10 | 40.9 ± 2.2 | 40.5 ± 3.2 | 63.7 ± 10.3 | 24.1 ± 0.8 | 24.6 ± 0.7 | 0 ± 0 | Plasma |
| Huiguo, 2000 (27) | China | Asian | 22/16 | 47.4 ± 13.6 | 27.6 ± 3.3 | 44.0 ± 21.0 | 47.6 ± 14.7 | 23.1 ± 3 | 4.29 ± 2.16 | Plasma |
| Roytblat, 2000 (28) | USA | Mixed | 11/12 | 39.5 ± 5.0 | 38.3 ± 8.0 | ≥5 | 32.8 ± 8.2 | 21.0 ± 5.3 | <5 | Serum |
| Teramoto, 2003 (29) | Japan | Asian | 40/40 | Adult | NR | ≥5 | Adult | NR | <5 | Plasma |
| Yokoe, 2003 (30) | Japan | Asian | 26/14 | 52.5 ± 5.7 | 28.4 ± 3.5 | 33.7 ± 24.5 | 48.8 ± 3.0 | 27.6 ± 0.5 | 2.8 ± 0.2 | Serum |
| Ciftci, 2004 (12) | Turkey | Caucasian | 43/22 | 49.6 ± 9.1 | 31.9 ± 4.1 | 33.2 ± 5.0 | 47.2 ± 10.3 | 31.03 ± 3.1 | 1.55 ± 0.96 | Serum |
| Imagawa, 2004 (31) | Japan | Asian | 117/46 | Adult | 27.7 ± 4.4 | ≥5 | Adult | 22.9 ± 2.9 | <5 | Serum |
| Ryan, 2006 (32) | Ireland | Caucasian | 66/30 | 42.5 ± 8.5 | 32.5 ± 4.8 | 35.0 ± 13.9 | 41 ± 8 | 30.7 ± 3.1 | 1.2 ± 1.0 | Serum |
| de la Peña Bravo, 2007 (34) | USA | Mixed | 50/20 | 51.7 ± 1.9 | 33.2 ± 1.7 | 51.3 ± 4.2 | 47.4 ± 1.2 | 28.4 ± 0.6 | 2.5 ± 0.5 | Serum |
| Harsch, 2007 ((35) | Germany | Caucasian | 19/20 | 59.0 ± 2.0 | 34.4 ± 1.4 | ≥5 | 53.0 ± 2.0 | 31.6 ± 1.0 | <5 | Plasma |
| Arias, 2008 (36) | Spain | Caucasian | 30/15 | 52.0 ± 13.0 | 30.5 ± 4.0 | 43.8 ± 27.0 | 48.0 ± 10.0 | 28.7 ± 4.7 | 3.7 ± 3.3 | Plasma |
| Constantinidis, 2008 (37) | Greece | Caucasian | 24/27 | 45.1 ± 8.2 | ≥25 | 23.3 ± 3.6 | 45.1 ± 8.2 | ≥25 | 3.5 ± 0.4 | Serum |
| Li, 2008 (40) | Thailand | Asian | 68/22 | 45.5 ± 11.3 | 27.7 ± 4.6 | 31.4 ± 28.6 | 43 ± 9 | 23.3 ± 2.0 | 2.9 ± 1.3 | Serum |
| Takahashi, 2008 (41) | Japan | Asian | 41/12 | 49.8 ± 10 | 29.4 ± 4.2 | ≥5 | 46.7 ± 11.2 | 25.7 ± 4.1 | <5 | Plasma |
| Tomiyama, 2008 (42) | Japan | Asian | 50/15 | 51.4 ± 13.0 | 26.9 ± 4.2 | 42.7 ± 27.9 | 53.0 ± 10.0 | 24.3 ± 2.5 | <5 | Plasma |
| Vgontzas, 2008 (43) | Greece | Caucasian | 16/28 | 48.1 ± 5.6 | 37.5 ± 4.7 | 53.3 ± 7.0 | 48.1 ± 10.6 | 30.8 ± 5.2 | 2.1 ± 0.8 | Plasma |
| Yamamoto, 2008 (44) | Japan | Asian | 31/10 | 49.0 ± 2.0 | 28.0 ± 1.0 | ≥5 | 46.0 ± 6.0 | 27.0 ± 2.0 | <5 | Serum |
| Carneiro, 2009 (45) | Brazil | Mixed | 16/13 | 40.1 ± 2.8 | 46.9 ± 2.0 | 65.7 ± 9.9 | 38.8 ± 3.3 | 42.8 ± 1.3 | 3.2 ± 0.5 | Plasma |
| Li, 2009 (46) | China | Asian | 68/22 | 45.3 ± 11.1 | 20.7 ± 10.1 | 38.9 ± 26.5 | 43.0 ± 93.0 | 23.3 ± 2.0 | 2.9 ± 1.3 | Serum |
| Thomopoulos, 2009 (47) | Greece | Caucasian | 62/70 | 48.1 ± 7.6 | 31.9 ± 4.9 | 31.6 ± 2.0 | 48.1 ± 3.9 | 32.1 ± 3.0 | 0.4 ± 4.0 | Serum |
| Sahlman, 2010 (48) | Finland | Caucasian | 84/40 | 50.4 ± 9.3 | 32.5 ± 3.3 | 9.6 ± 2.9 | 45.6 ± 11.5 | 31.5 ± 3.5 | 1.9 ± 1.4 | Plasma |
| Steiropoulos, 2010 (49) | Greece | Caucasian | 38/23 | 45.5 ± 10.5 | 36.4 ± 7.4 | 61.0 ± 27.0 | 43.7 ± 6.7 | 34.5 ± 3.7 | 5.3 ± 3.2 | Serum |
| Ye, 2010 (50) | China | Asian | 127/52 | 45.3 ± 11.4 | 26.2 ± 3.7 | 36.5 ± 25.7 | 45.0 ± 10.0 | 26.0 ± 3.2 | 2.0 ± 1.4 | Serum |
| Liu, 2011(51) | China | Asian | 78/20 | 45.2 ± 7.3 | 27.9 ± 3.1 | 46.3 ± 9.2 | 43.5 ± 8.3 | 26.1 ± 2.4 | <5 | Serum |
| Fornadi, 2012 (52) | Canada | Mixed | 25/75 | 54.0 ± 12.0 | 29.0 ± 5.0 | ≥5 | 50.0 ± 13.0 | 26.0 ± 5.0 | <5 | Serum |
| Medeiros, 2012 (53) | Brazil | Mixed | 50/15 | 62.3 ± 7.8 | 25.5 ± 4.0 | ≥5 | 62.50 ± 8.4 | 25.8 ± 4.0 | <5 | Serum |
| Qian, 2012 (54) | China | Asian | 70/40 | 45.8 ± 8.2 | 28.9 ± 2.3 | ≥5 | 46.3 ± 8.1 | 24.1 ± 2.3 | <5 | Serum |
| Ye, 2012 (55) | China | Asian | 44/20 | 46.43 ± 18.22 | 28.2 ± 5.34 | 40.41 ± 20.68 | 45.80 ± 23.01 | 26.90 ± 4.25 | 2.26 ± 1.30 | Plasma |
| Hargens, 2013 (56) | USA | Mixed | 12/33 | 22.8 ± 0.8 | 32.4 ± 1.0 | 25.4 ± 5.4 | 21.9 ± 0.6 | 29.3 ± 0.5 | 2.1 ± 0.3 | Serum |
| Kurt, 2013 (57) | Turkey | Caucasian | 48/37 | 48.3 ± 12.3 | NR | ≥5 | 43.1 ± 14.1 | NR | <5 | Serum |
| Yang, 2013 (58) | China | Asian | 50/25 | 53.5 ± 6.9 | 27.4 ± 2.9 | 24.5 ± 15.9 | 53.0 ± 7.0 | 26.27 ± 1.9 | 3.0 ± 1.0 | Plasma |
| Ciccone, 2014 (59) | Italy | Caucasian | 80/40 | 52.8 ± 10.6 | 28.6 ± 3.0 | 33.9 ± 21 | 52.3 ± 10.5 | 28.2 ± 2.7 | 2.1 ± 1.1 | Plasma |
| Kritikou, 2014 (61) | Greece | Caucasian | 38/39 | 55.7 ± 6.6 | 28.7 ± 3.3 | 37.5 ± 21.0 | 53.8 ± 6.2 | 27.3 ± 3.5 | 2.3 ± 1.9 | Plasma |
| Unuvar Dogan, 2014 (62) | Turkey | Caucasian | 33/24 | 45.3 ± 8.5 | 31.0 ± 1.7 | 47.2 ± 23.2 | 40.5 ± 9.5 | 30.7 ± 1.5 | 3.6 ± 1.8 | Serum |
| De, 2015 (63) | Italy | Caucasian | 26/24 | 41.8 ± 7.4 | 33.0 ± 5.2 | 26.15 ± 12.1 | 43.7 ± 8.2 | 30.8 ± 4.3 | 1.65 ± 0.9 | Serum |
| Gaines, 2015 (64) | Greece | Caucasian | 82/38 | 54.9 ± 5.8 | 29.2 ± 3.3 | 22.6 ± 15.0 | 54.2 ± 5.8 | 27.6 ± 3.7 | 2.0 ± 15.0 | Plasma |
| Hui, 2015 (65) | China | Asian | 35/20 | 47.6 ± 6.6 | 27.3 ± 4.4 | ≥5 | 25.1 ± 5.3 | 40.5 ± 4.9 | <5 | Serum |
| Ulasli, 2015 (67) | Turkey | Caucasian | 62/20 | 51.7 ± 10.2 | 32.4 ± 5.6 | 26.5 ± 18.5 | 45.3 ± 14 | 30.4 ± 8 | 2.2 ± 0.93 | Serum |
| Thunstrom, 2015 (66) | Sweden | Caucasian | 344/95 | 61.9 ± 9.2 | 28.9 ± 4.0 | 29.7 ± 14.6 | 61.4 ± 9.5 | 25.2 ± 2.5 | 3.1 ± 1.3 | Serum |
| Dogan, 2016 (68) | Turkey | Caucasian | 39/12 | 40.7 ± 10.75 | 29.26 ± 4.12 | ≥5 | 40.0 ± 11.7 | 27.29 ± 2.93 | <5 | Serum |
| Nizam, 2016 (70) | Turkey | Caucasian | 39/13 | 47.3 ± 10.4 | 33.2 ± 56.4 | 45.6 ± 20.7 | 43.23 ± 9.08 | 31.71 ± 4.56 | 2.64 ± 1.82 | Serum |
| Vicente, 2016 (71) | Spain | Caucasian | 89/26 | 45.33 ± 14.81 | 30.03 ± 5.04 | 28 ± 23.70 | 45 ± 11.11 | 28.7 ± 4.37 | 1.9 ± 2.7 | Plasma |
| Hirotsu, 2017 (72) | Brazil | Mixed | 339/682 | 50.8 ± 13.2 | 29.6 ± 5.8 | 19.3 ± 9.44 | 38.2 ± 12.7 | 25.4 ± 3.8 | 2.5 ± 10.4 | Serum |
| Kong, 2017 (73) | China | Asian | 82/30 | 45.6 ± 8.8 | 27.7 ± 4.6 | ≥5 | 45.7 ± 6.6 | 27.6 ± 3.6 | <5 | Serum |
| Thorn, 2017 (74) | UK | Caucasian | 16/14 | 59 ± 13 | 32.7 ± 4.0 | 30 ± 18 | 58 ± 7 | 30.6 ± 2.7 | <5 | Serum |
| Weingarten, 2017 (76) | USA | Mixed | 11/8 | 38.7 ± 10.5 | 47.3 ± 14.8 | 25.1 ± 17.8 | 33.6 ± 5.1 | 25.5 ± 10.9 | 1.8 ± 1.0 | Serum |
| Zhang, 2017 (77) | China | Asian | 50/52 | 79.4 | NR | ≥5 | 77.1 | NR | <5 | Serum |
| Al-Terki, 2018 (78) | USA | Mixed | 52/22 | 40.3 ± 1.6 | 29.5 ± 0.7 | 22.9 ± 17.9 | 39.6 ± 2.2 | 28.5 ± 0.9 | 2.5 ± 1.6 | Plasma |
| Bhatt, 2018 (79) | India | Caucasian | 171/69 | 44.6 ± 9.1 | 33.1 ± 7.6 | ≥5 | 40.0 ± 9.8 | 30.1 ± 8.4 | <5 | Serum |
| Bozic, 2018 (80) | Croatia | Caucasian | 50/25 | 53.0 ± 11.9 | 28.9 ± 2.7 | 35.0 ± 11.0 | 52.5 ± 10.2 | 27.8 ± 2.2 | <5 | Plasma |
| Kong, 2018 (81) | China | Asian | 50/40 | 54.34 ± 14.38 | 26.86 ± 3.12 | 37.34 ± 19.02 | 50.42 ± 8.35 | 22.26 ± 3.54 | 3.31 ± 1.09 | Serum |
| Lu, 2018 (82) | China | Asian | 35/22 | 48.63 ± 1.80 | 28.21 ± 0.51 | ≥5 | 49.04 ± 2.27 | 26.01 ± 0.65 | <5 | Serum |
| Motamedi, 2018 (83) | USA | Mixed | 50/24 | 34.9 ± 8.0 | 30.8 ± 4.2 | 18.4 ± 13.1 | 30.9 ± 7.77 | 28.6 ± 3.81 | 2.12 ± 1.3 | Plasma |
| Sundbom, 2018 (84) | Sweden | Caucasian | 109/224 | 55.6 ± 8.8 | 28.2 ± 4.8 | 25.4 ± 2.1 | 47.7 ± 11.3 | 25.4 ± 4.1 | 3.7 ± 0.6 | Plasma |
| Bhatt, 2019 (85) | India | Caucasian | 47/25 | 44.2 ± 9.1 | 32.5 ± 6.9 | 13.5 ± 6.4 | 28.5 ± 8.6 | 41 ± 8.5 | 2.3 ± 1.1 | Serum |
| Tang, 2019 (86) | China | Asian | 120/127 | 48.88 ± 9.76 | 26.86 ± 3.12 | 39.00 ± 18.38 | 47.37 ± 9.12 | 22.46 ± 3.29 | 3.31 ± 1.09 | Serum |
| Galati, 2020 (87) | Italy | Caucasian | 45/30 | 53.9 ± 11.6 | 28 ± 2.2 | ≥5 | 55 ± 5.8 | 26.3 ± 1.8 | <5 | Serum |
| CHILDREN | ||||||||||
| Tam, 2006 (33) | Australia | Mixed | 44/69 | 7.3 ± 3.7 | 19.4 ± 5.5 | 5.3 ± 6.5 | 7.6 ± 4.0 | 17.9 ± 3.9 | 0 ± 0 | Serum |
| Gozal, 2008 (38) | USA | Mixed | 20/20 | 6.5 ± 0.6 | 17.3 ± 0.6 | ≥5 | 6.4 ± 0.7 | 17.1 ± 0.5 | 0 ± 0 | Plasma |
| Li, 2008 (39) | China | Asian | 47/95 | 11.1 ± 1.27 | NR | 14.1 ± 8.0 | 10.7 ± 1.3 | NR | 0.7 ± 0.6 | Serum |
| Gileles-Hillel, 2014 (60) | Spain | Caucasian | 75/129 | 10.4 ± 2.8 | 28.0 ± 4.6 | 14.2 ± 9.0 | 11.0 ± 2.4 | 27.9 ± 4.1 | 0.6 ± 0.6 | Plasma |
| Huang, 2016 (69) | Taiwan | Asian | 47/32 | 7.84 ± 0.56 | 16.95 ± 0.47 | 9.13 ± 1.67 | 7.02 ± 0.65 | 16.55 ± 0.58 | 0.37 ± 0.06 | Plasma |
| Van Eyck, 2017 (75) | Belgium | Caucasian | 53/111 | 11.5 ± 2.75 | NR | 20.53 ± 15.98 | 12 ± 2.75 | NR | 0.72 ± 0.47 | Serum |
Characteristics of studies included in the meta-analysis (n = 63).
NR, not reported; OSAS, obstructive sleep apnea syndrome; AHI, apnea–hypopnea index; BMI, body mass index.
Meta-Analysis
Serum IL-6 Levels in Individuals With Obstructive Sleep Apnea Syndrome
Thirty-nine studies of serum IL-6 levels in adults included 2,558 individuals with OSAS and 1,897 controls (Figure 2). The pooled analysis of individuals with OSAS compared to controls yielded an MD of 2.89 pg/ml [95% CI: 2.54, 3.23; P < 0.00001; I2 = 99% (Ph < 0.00001)]. Thus, serum levels of IL-6 were significantly higher in individuals with OSAS than in controls.
Figure 2
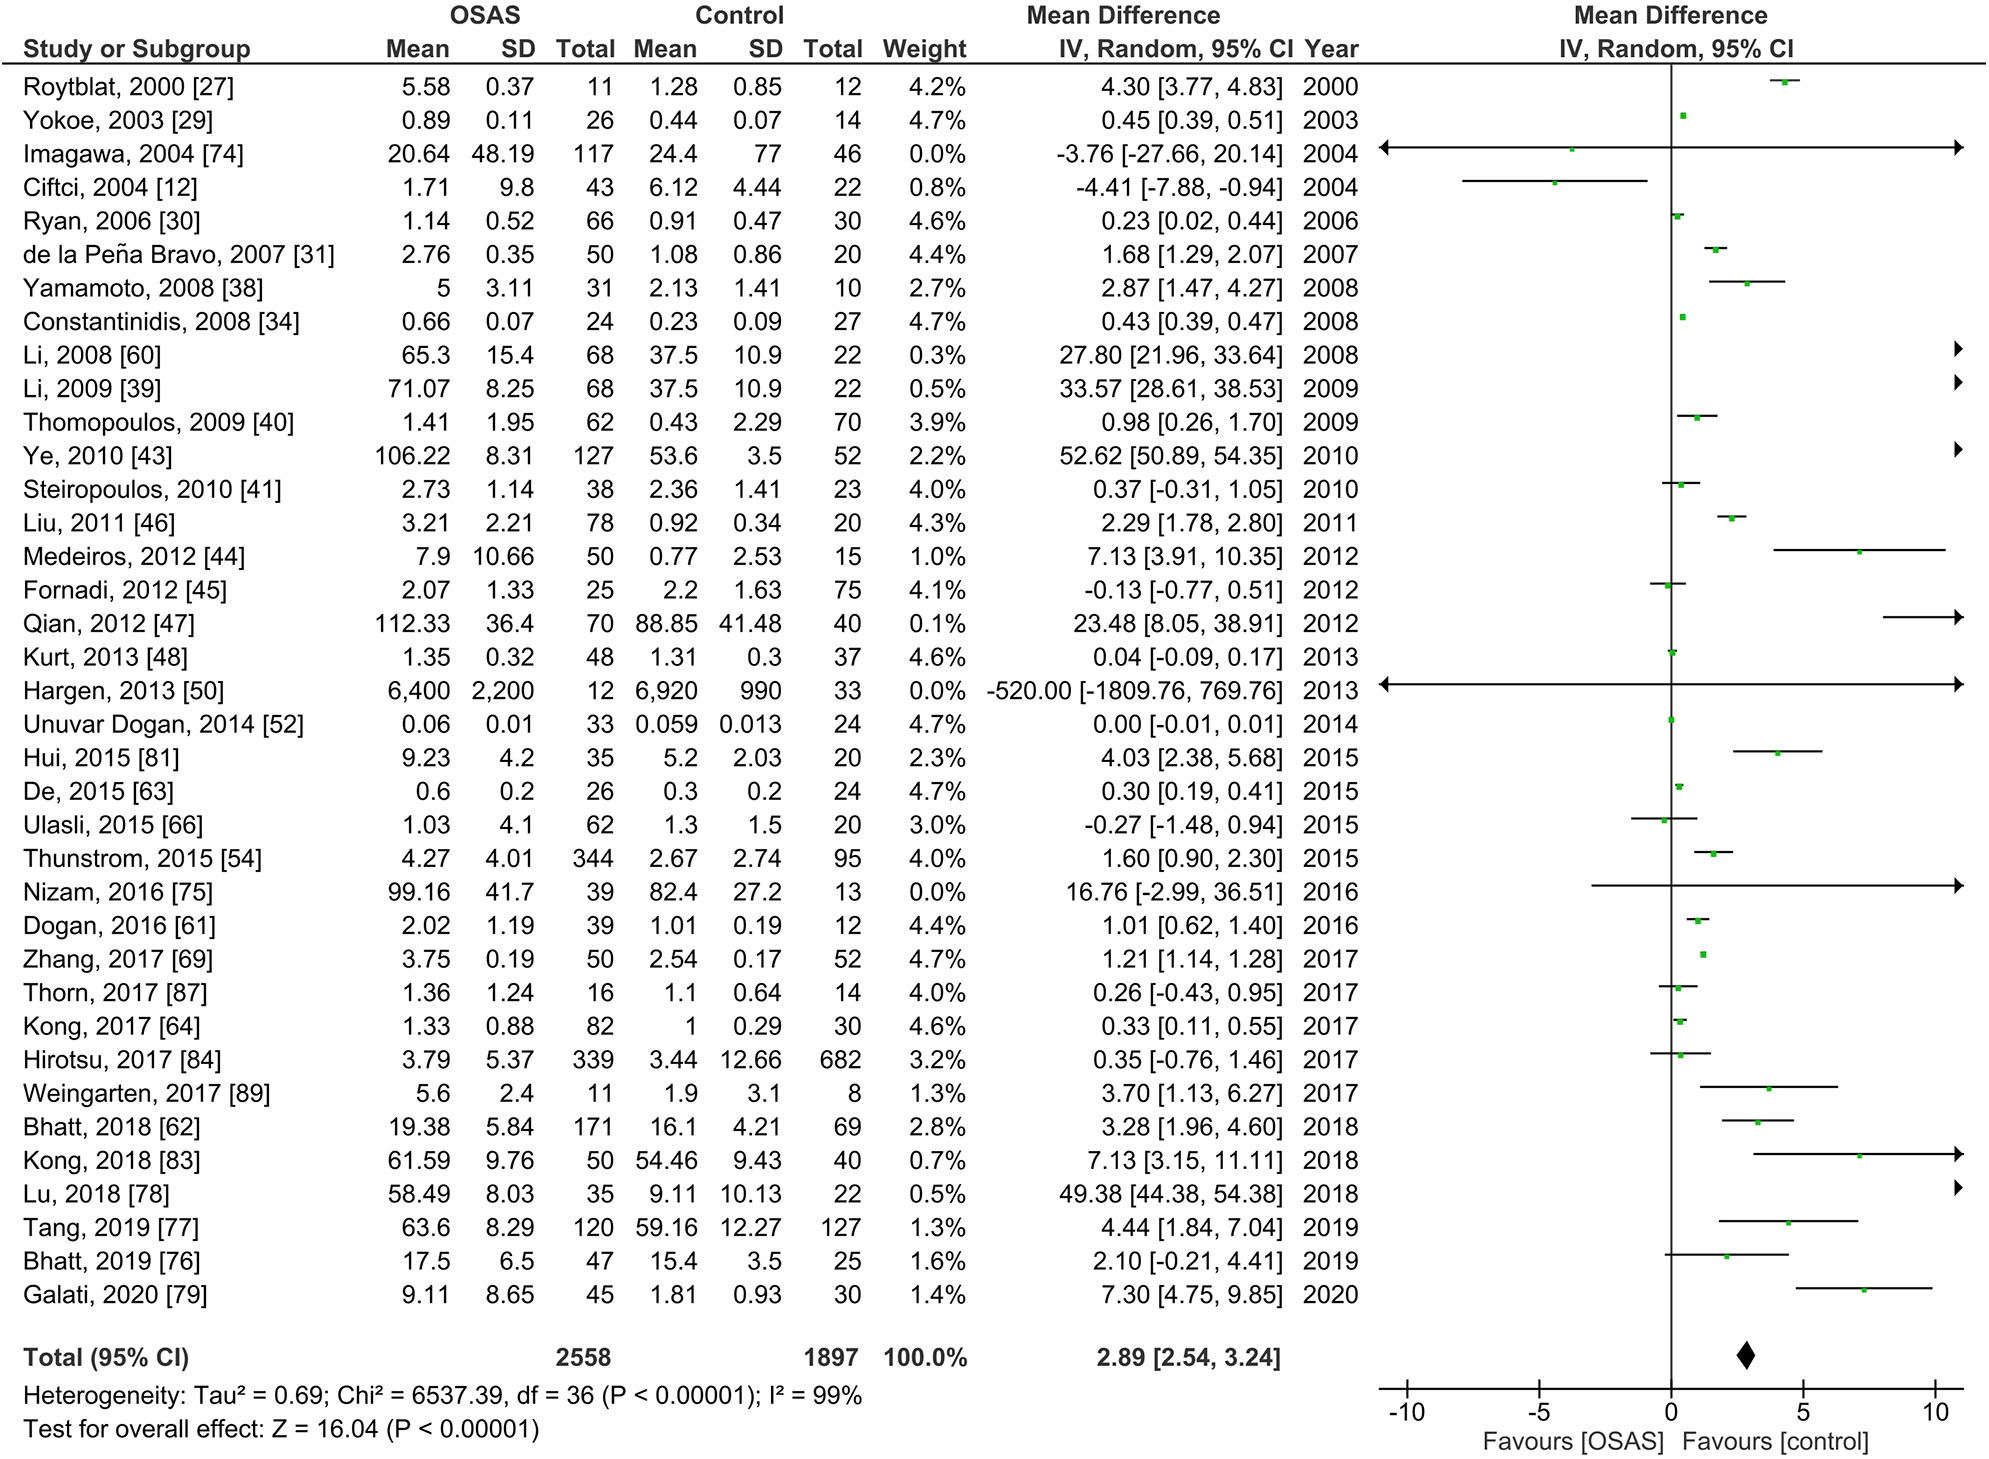
Forest plot of random-effects analysis of serum interleukin-6 levels in adults. The diamond shape indicates the pooled mean difference (MD). Each black box represents a point estimate of each study and also gives a representation of the study size (the bigger the box, the more participants in the study). A horizontal line representing the 95% confidence intervals (CIs) of the study result, with each end of the line representing the boundaries of CI. SD, standard deviation; OSAS, obstructive sleep apnea syndrome.
Plasma IL-6 Levels in Individuals With Obstructive Sleep Apnea Syndrome
Figure 3 shows the results of 22 studies reporting plasma IL-6 levels adults; plasma IL-6 levels of 974 individuals with OSAS were compared to the levels of 692 controls. The pooled analysis comparing these two groups showed that the MD was 2.89 pg/ml [95% CI: 1.94, 3.85; P < 0.00001; I2 = 99% (Ph < 0.00001)]. Thus, plasma IL-6 levels of individuals with OSAS were significantly higher than those of controls.
Figure 3
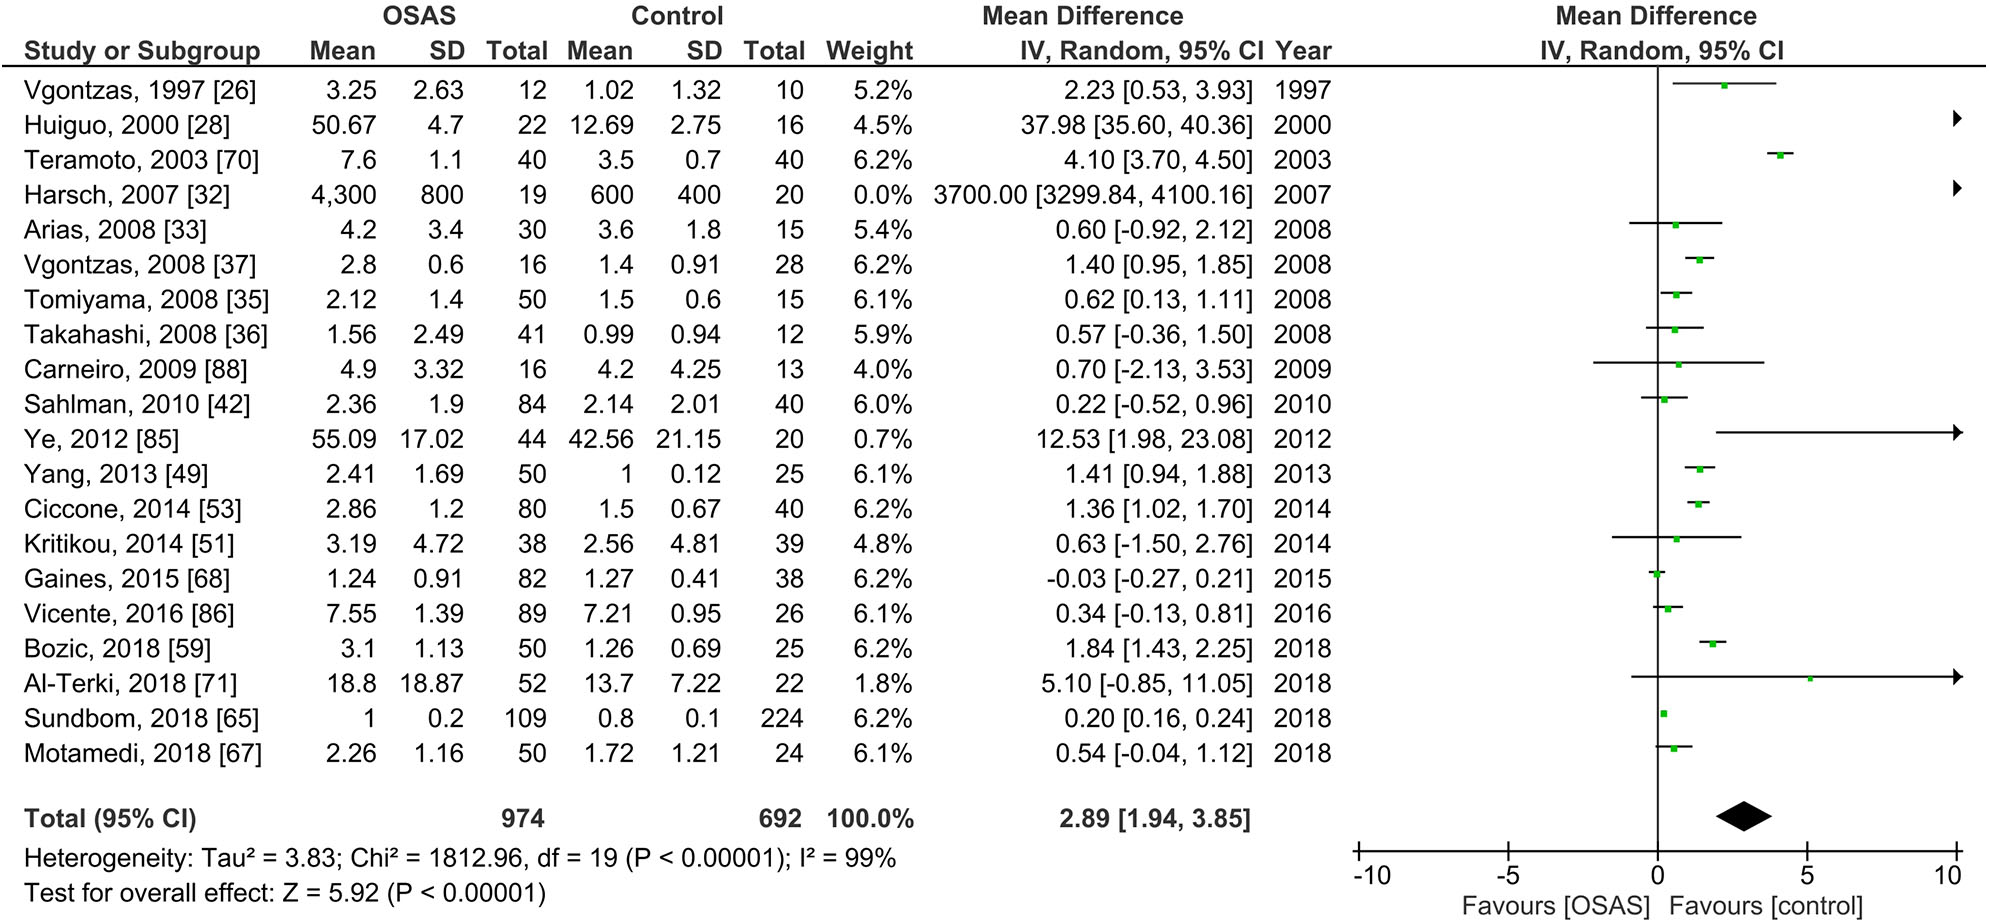
Forest plot of random-effects analysis of plasma interleukin-6 levels in adults. The diamond shape indicates the pooled mean difference (MD). Each black box represents a point estimate of each study and also gives a representation of the study size (the bigger the box, the more participants in the study). A horizontal line representing the 95% confidence intervals (CIs) of the study result, with each end of the line representing the boundaries of CI. SD, standard deviation; OSAS, obstructive sleep apnea syndrome.
Serum IL-6 Levels in Children With Obstructive Sleep Apnea Syndrome
Figure 4 illustrates the results of three studies on serum IL-6 levels of 144 children with OSAS compared to 274 controls. The pooled analysis of the comparison between these groups revealed that the MD was −0.20 pg/ml [95% CI: −0.82, 0.42; P = 0.52; I2 = 83% (Ph = 0.01)]. Thus, serum IL-6 levels did not significantly differ between children with OSAS and controls.
Figure 4
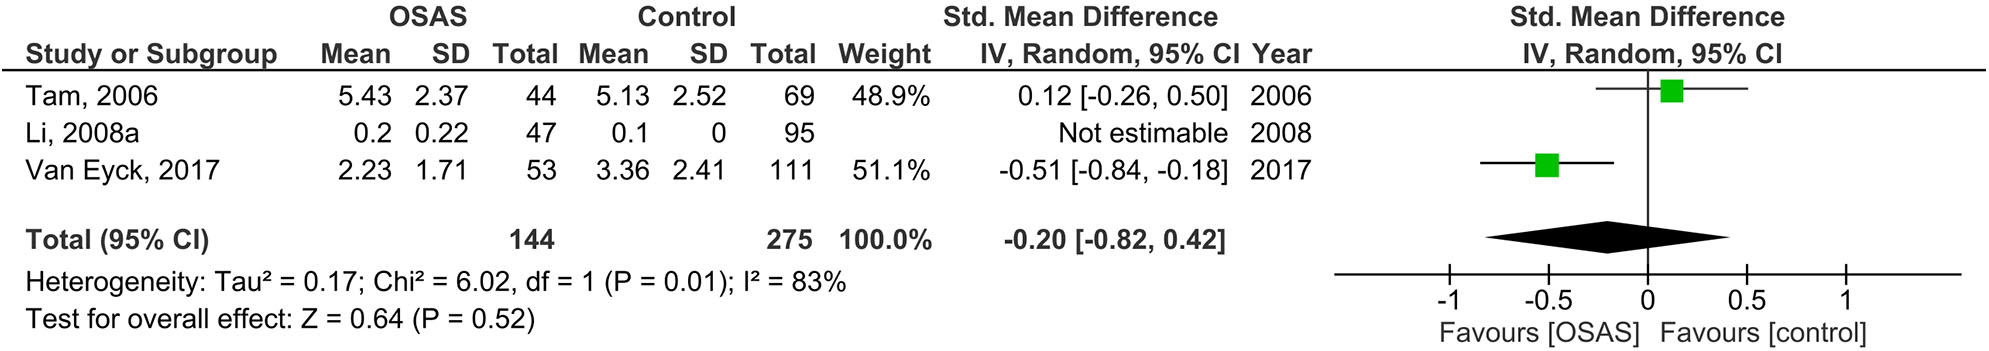
Forest plot of random-effects analysis of serum interleukin-6 levels in children. The diamond shape indicates the pooled mean difference (MD). Each black box represents a point estimate of each study and also gives a representation of the study size (the bigger the box, the more participants in the study). A horizontal line representing the 95% confidence intervals (CIs) of the study result, with each end of the line representing the boundaries of CI. SD, standard deviation; OSAS, obstructive sleep apnea syndrome.
Plasma IL-6 Levels in Pediatric Participants With Obstructive Sleep Apnea Syndrome
Five studies of plasma IL-6 levels in children included 142 children with OSAS and 181 controls (see Figure 5). The pooled analysis in this case revealed that the MD was 0.84 pg/ml [95% CI: 0.27, 1.41; P = 0.004; I2 = 72% (Ph = 0.03)]. The plasma IL-6 levels of children with OSAS were thus significantly higher than those of the controls.
Figure 5
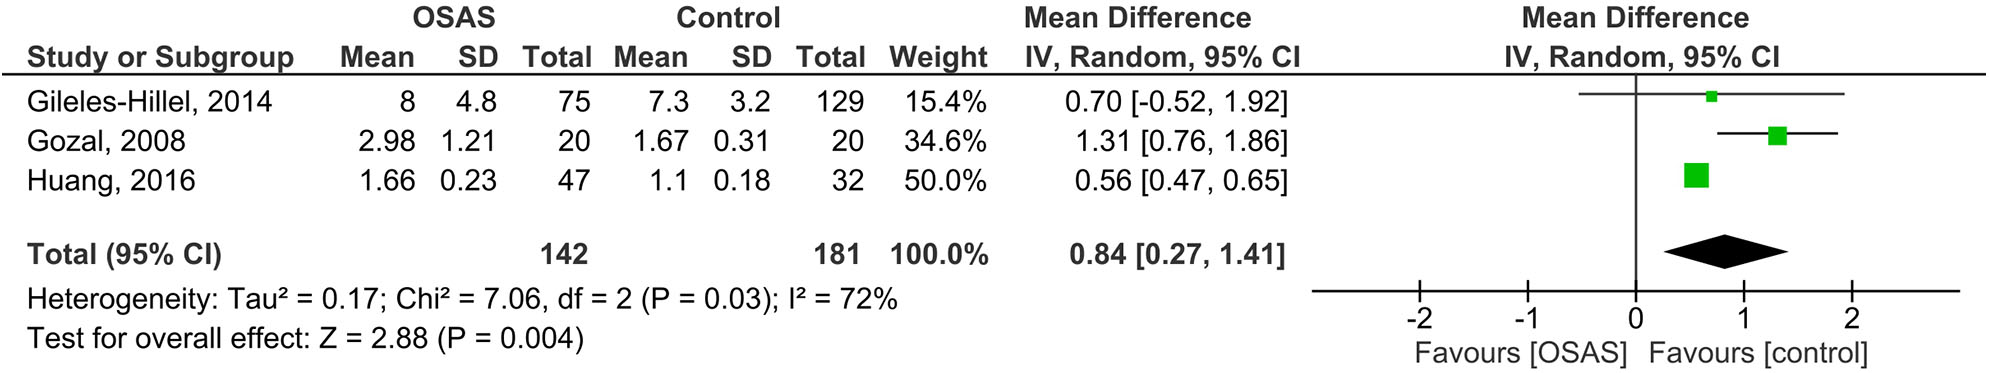
Forest plot of random-effects analysis of plasma interleukin-6 levels in children. The diamond shape indicates the pooled mean difference (MD). Each black box represents a point estimate of each study and also gives a representation of the study size (the bigger the box, the more participants in the study). A horizontal line representing the 95% confidence intervals (CIs) of the study result, with each end of the line representing the boundaries of CI. SD, standard deviation; OSAS, obstructive sleep apnea syndrome.
Subgroup Analysis of Serum IL-6 Levels
Ethnicity
Subgroup analyses of serum IL-6 levels in adults are reported in Table 2. The pooled analysis showed that for those with OSAS, serum IL-6 levels in Caucasian (MD = 0.51 pg/ml, P < 0.00001), Asian (MD = 11.52 pg/ml, P < 0.00001) and mixed (MD = 2.49 pg/ml, P = 0.004) ethnicities were significantly higher than the serum IL-6 levels of the respective controls.
Table 2
| Subgroup analysis of serum level (n) | MD (95% CI), P-value, I2 (%), Ph | Subgroup analysis of plasma level (n) | MD (95% CI), P-value, I2 (%), Ph |
|---|---|---|---|
| Overall (37) | 2.89 (2.54, 3.24), <0.00001, 99, <0.00001 | Overall (20) | 2.89 (1.94, 3.85), <0.00001, 99, <0.00001 |
| Ethnicity | Ethnicity | ||
| Caucasian (16) | 0.51 (0.29, 0.73), <0.00001, 97, <0.00001 | Caucasian (10) | 0.75 (−0.06, 1.57), 0.07, 98,<0.00001 |
| Asian (14) | 11.52 (10.20, 12.83), <0.00001, 100, <0.00001 | Asian (6) | 8.93 (4.87, 12.99), <0.0001, 100, <0.00001 |
| Mixed (7) | 2.49 (0.80, 4.17), 0.004, 96, <0.00001 | Mixed (4) | 0.75 (0.21, 1.29), 0.006, 45, 0.14 |
| Mean BMI of OSAS patients, kg/m2 | Mean BMI of OSAS patients, kg/m2 | ||
| >30 (15) | 1.07 (0.63, 1.50), <0.00001, 97, <0.00001 | >30 (8) | 0.96 (−1.16, 3.07), 0.38, 98, <0.00001 |
| ≤ 30 (19) | 10.59 (8.64, 12.53), <0.00001, 100, <0.00001 | ≤ 30 (11) | 4.20 (2.95, 5.46), <0.00001, 99, <0.00001 |
| Mean BMI of controls, kg/m2 | Mean BMI of controls, kg/m2 | ||
| >30 (12) | 0.47 (0.19, 0.76), 0.001, 89, <0.00001 | >30 (4) | 1.69 (−4.61, 8.00), 0.60, 99, <0.00001 |
| ≤ 30 (22) | 9.55 (7.85, 11.25), <0.00001, 100, <0.00001 | ≤ 30 (15) | 3.05 (2.096, 4.01), <0.00001, 99, <0.00001 |
| Total number of participants | Total number of participants | ||
| >100 (9) | 9.52 (2.94, 16.11), 0.005, 100, <0.00001 | >100 (5) | 0.42 (0.00, 0.84), 0.05, 92, <0.00001 |
| ≤ 100 (28) | 1.43 (1.14, 1.71), <0.00001, 99, <0.00001 | ≤ 100 (15) | 4.56 (2.51, 6.61), <0.0001, 99, <0.00001 |
| Mean AHI of OSAS patients, events/h | Mean AHI of OSAS patients, events/h | ||
| >30 (14) | 6.13 (5.31, 6.95), <0.00001, 100, <0.00001 | >30 (9) | 5.87 (3.37, 8.37), <0.00001, 99, <0.00001 |
| ≤ 30 (10) | 1.93 (1.20, 2.66), <0.00001, 98, <0.000101 | ≤ 30 (7) | 0.43 (0.10, 0.75), 0.01, 82, <0.00001 |
Subgroup analysis for serum and plasma levels of inteleukin-6 in adults.
BMI, body mass index; CI, confidence interval; OSAS, obstructive sleep apnea syndrome; MD, mean difference; Ph, Pheterogeneity.
Bold numbers show statistically significant value (P < 0.05).
Body Mass Index
Compared to healthy controls, the pooled MD of serum IL-6 levels of individuals with OSAS was significantly higher irrespective of their BMI: mean BMI > 30 (MD = 1.07 pg/ml, P < 0.00001); mean BMI ≤ 30 kg/m2 (MD = 10.59 pg/ml, P < 0.00001).
Compared to OSAS individuals with mean BMI > 30 kg/m2, OSAS individuals with BMI ≤ 30 kg/m2 had the pooled MD in serum IL-6 levels 9.9 times higher than controls.
Serum IL-6 levels were higher in participants with OSAS, irrespective of whether the BMI of controls was >30 (pooled MD of serum IL-6 levels was 0.47 pg/ml, P = 0.001), or ≤ 30 kg/m2 (pooled MD of serum IL-6 levels was 9.55 pg/ml, P < 0.00001). For participants with OSAS, serum IL-6 levels were 20.3 times higher in controls with a BMI <30 kg/m2 when compared to controls with a mean BMI > 30 kg/m2.
Sample Sizes
With regard to the number of participants in each study, those with more than 100 cases across OSAS and control groups had a pooled MD of serum IL-6 levels of 9.52 pg/ml (P = 0.005); the studies with ≤ 100 cases across the two groups had pooled MD of 1.43 pg/ml (P < 0.00001). In other words, serum IL-6 levels in studies with more than 100 cases were 6.6 times higher than the levels of studies including ≤ 100 cases across OSAS and control groups.
Apnea–Hypopnea Index
Studies with a mean AHI > 30 events/h in participants with OSAS showed that the pooled MD of their serum IL-6 levels was 6.13 pg/ml (P < 0.00001), compared to controls. Studies including participants with OSAS with a mean AHI ≤ 30 events/h showed that the pooled MD between OSAS individuals and controls was 1.93 pg/ml (P < 0.00001). Thus, serum IL-6 levels in studies with mean AHI > 30 events/h in participants with OSAS were 3.2 times higher than serum IL-6 levels in studies including OSAS patients with mean AHI ≤ 30 events/h.
Subgroup Analysis of Plasma IL-6 Levels
Ethnicity
The subgroup analysis of the pooled MD for plasma IL-6 levels in Asian (MD = 8.93 pg/ml, P = 0.0001) and mixed ethnicity (MD = 0.75 pg/ml, P = 0.006) participants with OSAS showed significant differences with the respective controls. The result showed that plasma IL-6 levels of Asians were 11.9 times higher than the plasma IL-6 levels of those of mixed ethnicity with OSAS. Plasma IL-6 levels of Asians did not statistically significantly differ from the plasma level of a Caucasian ethnicity.
Body Mass Index
In studies including participants with a mean BMI ≤ 30 kg/m2, the pooled MD comparing plasma IL-6 levels in participants with OSAS with plasma IL-6 levels of controls was significant (MD = 4.20 pg/ml, P < 0.00001). The pooled MD was also significant for plasma IL-6 levels in studies including a mean BMI of controls ≤ 30 (MD = 3.05 pg/ml, P < 0.00001). In contrast, there was no significant difference between participants with or without OSAS when the BMI of OSAS patients >30 kg/m2.
Sample Size
The pooled MD for plasma IL-6 levels in studies where the total number of participants ≤ 100 was significant (MD = 4.56 pg/ml, P < 0.0001); plasma IL-6 levels in those with OSAS was significantly higher than controls. In contrast, there was no significant difference between participants with OSAS and controls in the studies where the total number of participants >100.
Apnea–Hypopnea Index
Compared to controls, for participants with OSAS, the plasma IL-6 levels were significantly higher in studies where mean AHI of OSAS participants >30 events/h (MD = 5.87 pg/ml, P < 0.00001) but lower in studies where the AHI ≤ 30 events/h (MD = 0.43 pg/ml, P = 0.01). The MD in plasma IL-6 levels in studies where mean AHI of OSAS participants >30 events/h was 13.6 times greater than in studies where this mean AHI ≤ 30 events/h.
Serum IL-6 Levels in Adult Caucasians
Body Mass Index
In a further subgroup analysis, the pooled MD comparing serum and plasma IL-6 levels in OSAS adult Caucasians and controls was investigated (Table 3). The pooled MDs in those studies with OSAS participants with a mean BMI > 30 kg/m2 (MD = 0.35 pg/ml, P = 0.008) and those where the BMI ≤ 30 kg/m2 (MD = 2.54 pg/ml, P = 0.002) were significant when compared to controls' serum IL-6 levels. This pattern was independent of controls' BMI, whether higher or lower than 30 kg/m2. Thus, serum IL-6 level in studies where OSAS participants and controls had a BMI ≤ 30 kg/m2 was 7.3 times higher than serum IL-6 level in studies where OSAS participants and controls had a BMI > 30 kg/m2.
Table 3
| Subgroup analysis of serum level (n) | MD (95% CI), P-value, I2 (%), Ph | Subgroup analysis of plasma level (n) | MD (95% CI), P-value, I2 (%), Ph |
|---|---|---|---|
| Overall (16) | 0.51 (0.29, 0.73), <0.00001, 97, <0.00001 | Overall (10) | 0.75 (−0.06, 1.57), 0.07, 98, <0.00001 |
| Mean BMI of OSAS patients, kg/m2 | Mean BMI of OSAS patients, kg/m2 | ||
| >30 (11) | 0.35 (0.09, 0.62), 0.008, 87, <0.00001 | >30 (5) | 0.46 (0.01, 0.91), 0.05, 92, <0.00001 |
| ≤ 30 (3) | 2.54 (0.90, 4.19), 0.002, 92, <0.00001 | ≤ 30 (5) | 0.89 (0.27, 1.50), 0.005, 96, <0.00001 |
| Mean BMI of controls, kg/m2 | Mean BMI of controls, kg/m2 | ||
| >30 (11) | 0.35 (0.09, 0.62), 0.008, 87, <0.00001 | >30 (3) | 2.26 (−5.67, 10.20), 0.58, 99, <0.00001 |
| ≤ 30 (3) | 2.54 (0.90, 4.19), 0.002, 92, <0.00001 | ≤ 30 (7) | 0.71 (0.19, 1.23), 0.007, 95, <0.00001 |
| Total number of participants | Total number of participants | ||
| >100 (3) | 1.81 (0.75, 2.87), 0.0008, 78, 0.01 | >100 (4) | 0.56 (−0.28, 1.41), 0.19, 93, <0.00001 |
| ≤ 100 (13) | 0.34 (0.11, 0.56), 0.003, 97, <0.00001 | ≤ 100 (6) | 1.14 (−1.72, 4.00), 0.44, 99, <0.00001 |
| Mean AHI of OSAS patients, events/h | Mean AHI of OSAS patients, events/h | ||
| >30 (6) | 0.23 (−0.11, 0.57), 0.18, 77, 0.0006 | >30 (5) | 1.48 (1.26, 1.70), <0.00001, 26, 0.25 |
| ≤ 30 (6) | 0.61 (0.33, 0.88), <0.0001, 88, <0.0001 | ≤ 30 (4) | 0.19 (0.16, 0.23), <0.00001, 24, 0.27 |
Subgroup analysis for serum and plasma levels of inteleukin-6 in adult Caucasians.
BMI, body mass index; CI, confidence interval; OSAS, obstructive sleep apnea syndrome; MD, mean difference; Ph, Pheterogeneity.
Bold numbers show statistically significant value (P < 0.05).
Sample Sizes
With regard to studies of Caucasians, in those studies with more than 100 cases with or without OSAS, the pooled MD for serum IL-6 level was 1.81 pg/ml (P = 0.0008). In the studies with ≤ 100 cases with or without OSAS, the pooled MD for serum IL-6 level was 0.34 pg/ml (P < 0.003). In other words, serum IL-6 levels in studies with sample sizes >100 were higher than the levels in studies with sample sizes ≤ 100.
Apnea–Hypopnea Index
For Caucasian samples, the studies with a mean AHI ≤ 30 events/h in participants with OSAS showed that the pooled MD of serum IL-6 levels was 0.61 pg/mL (P < 0.0001). However, serum IL-6 levels did not differ between OSAS participants and controls where AHI was >30 events/h.
Plasma IL-6 Levels in Adult Caucasians
Body Mass Index
The pooled MD was significant for plasma IL-6 levels in studies with Caucasian participants with OSAS and with a mean BMI ≤ 30 kg/m2 (MD = 0.89 pg/ml, P = 0.005) were compared with controls, but there was no significant difference in those studies where the OSAS participants had a mean BMI > 30 kg/m2.
Sample Size
The pooled MD of plasma IL-6 levels was independent of sample size (samples smaller or larger than 100 per group).
Apnea–Hypopnea Index
The pooled MD for plasma IL-6 levels was significantly higher (7.8 times) in Caucasians with OSAS and a mean AHI > 30 events/h (MD = 1.48 pg/ml; P = 0.002) when compared to those with OSAS and a mean AHI ≤ 30 events/h (MD = 0.19 pg/ml; P < 0.00001).
Serum Levels of IL-6 in Adult Asian Participants With and Without OSAS
A subgroup analysis for serum IL-6 levels in adult Asians is reported in Table 4. There were significant differences between individuals with OSAS and controls for those studies reporting for the OSAS group a mean BMI ≤ 30 kg/m2 (MD = 11.52 pg/ml, P < 0.00001), a mean BMI of controls >30 kg/m2 (MD = 4.03 pg/ml, P < 0.00001), a mean BMI of controls ≤ 30 kg/m2 (MD = 12.30 pg/ml, P < 0.00001), a total sample size ≤ 100 (MD = 4.85 pg/ml, P < 0.00001), and mean AHI of OSAS individuals >30 events/h (MD = 18.16 pg/ml, P < 0.0001).
Table 4
| Subgroup analysis of serum level (n) | MD (95% CI), P-value, I2 (%), Ph |
|---|---|
| Overall (14) | 11.52 (10.20, 12.83), <0.00001, 100, <0.00001 |
| Mean BMI of OSAS patients, kg/m 2 | |
| >30 (0) | NA |
| ≤ 30 (14) | 11.52 (10.20, 12.83), <0.00001, 100, <0.00001 |
| Mean BMI of controls, kg/m 2 | |
| >30 (1) | 4.03 (2.38, 5.68), <0.00001 |
| ≤ 30 (13) | 12.30 (10.92, 13.68), <0.00001, 100, <0.00001 |
| Total number of participants | |
| >100 (5) | 15.86 (−11.58, 43.30), 0.26, 100, <0.00001 |
| ≤ 100 (9) | 4.85 (3.96, 5.74), <0.00001, 99, <0.00001 |
| Mean AHI of OSAS patients, events/h | |
| >30 (7) | 18.16 (10.17, 26.15), <0.0001, 100, <0.00001 |
| ≤ 30 (0) | NA |
Subgroup analysis for serum level of inteleukin-6 in adult Asians.
BMI, body mass index; CI, confidence interval; OSAS, obstructive sleep apnea syndrome; MD, mean difference; NA, not available; Ph, Pheterogeneity.
Bold numbers show statistically significant value (P < 0.05).
Mean BMI of OSAS Patients >30 kg/m2
Table 5 reports the subgroup analysis for serum and plasma IL-6 levels in adults where the mean BMI of those with OSAS > 30 kg/m2.
Table 5
| Subgroup analysis of serum level (n) | MD (95% CI), P-value, I2 (%), Ph | Subgroup analysis of plasma level (n) | MD (95% CI), P-value, I2 (%), Ph |
|---|---|---|---|
| Overall (15) | 1.07 (0.63, 1.50), <0.00001, 97, <0.00001 | Overall (8) | 0.96 (−1.16, 3.07), 0.38, 98, <0.00001 |
| Mean BMI of controls, kg/m2 | Mean BMI of controls, kg/m2 | ||
| >30 (11) | 0.35 (0.09, 0.62), 0.008, 87, <0.00001 | >30 (4) | 1.69 (−4.61, 8.00), 0.60, 99, <0.00001 |
| ≤ 30 (4) | 3.16 (1.00, 5.32), 0.004, 95, <0.00001 | ≤ 30 (4) | 0.50 (0.16, 0.85), 0.004, 33, 0.21 |
| Total number of participants | Total number of participants | ||
| >100 (2) | 2.06 (−0.19, 4.31), 0.07, 89, 0.003 | >100 (2) | 0.31 (−0.09, 0.70), 0.13, 0, 0.79 |
| ≤ 100 (13) | 0.93 (0.47, 1.39), <0.0001, 97, <0.00001 | ≤ 100 (6) | 1.41 (−2.29, 5.11), 0.45, 99, <0.00001 |
| Mean AHI of OSAS patients, events/h | Mean AHI of OSAS patients, events/h | ||
| >30 (6) | 0.23 (−0.11, 0.57), 0.18, 77, 0.0006 | >30 (4) | 1.38 (0.96, 1.79), <0.00001, 0, 0.53 |
| ≤ 30 (5) | 0.89 (−0.28, 2.05), 0.14, 62, 0.03 | ≤ 30 (3) | 0.38 (0.05, 0.71), 0.02, 0, 0.78 |
Subgroup analysis for serum and plasma levels of inteleukin-6 in adults where mean BMI of OSAS patients >30 kg/m2.
BMI, body mass index; CI, confidence interval; OSAS, obstructive sleep apnea syndrome; MD, mean difference; Ph, Pheterogeneity.
Bold numbers show statistically significant value (P < 0.05).
In participants with OSAS, serum IL-6 levels were significantly higher when the mean BMI of controls was ≤ 30 (MD = 3.16 pg/ml, P = 0.004); likewise, serum IL-6 levels were lower where the mean BMI of controls was >30 (MD = 0.35 pg/ml, P = 0.008), and where the total sample size was ≤ 100 (MD = 0.93 pg/ml, P < 0.0001).
Furthermore, among those with OSAS, mean plasma IL-6 levels were significantly higher in studies where the mean BMI of controls ≤ 30 kg/m2 (MD = 0.50 pg/ml, P = 0.004), in studies where the mean AHI of individuals with OSAS > 30 events/h (MD = 1.38 pg/ml, P < 0.00001), and those where the mean AHI of individuals with OSAS ≤ 30 events/h (MD = 0.38 pg/ml, P = 0.02).
Mean BMI of OSAS Patients ≤ 30 kg/m2
The subgroup analysis for serum and plasma levels of IL-6 of adults where the mean BMI of individuals with OSAS ≤ 30 kg/m2 is reported in Table 6.
Table 6
| Subgroup analysis of serum level (n) | MD (95% CI), P-value, I2 (%), Ph | Subgroup analysis of plasma level (n) | MD (95% CI), P-value, I2 (%), Ph |
|---|---|---|---|
| Overall (19) | 10.59 (8.64, 12.53), <0.00001, 100, <0.00001 | Overall (11) | 4.20 (2.95, 5.46), <0.00001, 99, <0.00001 |
| Mean BMI of controls, kg/m2 | Mean BMI of controls, kg/m2 | ||
| >30 (1) | 4.03 (2.38, 5.68), <0.00001 | >30 (0) | NA |
| ≤ 30 (18) | 11.02 (9.01, 13.04), <0.00001, 100, <0.00001 | ≤ 30 (11) | 4.10 (2.86, 5.34), <0.00001, 99, <0.00001 |
| Total number of participants | Total number of participants | ||
| >100 (7) | 11.92 (2.31, 21.52), 0.02, 100, <0.00001 | >100 (3) | 0.49 (−0.08, 1.06), 0.09, 96, <0.00001 |
| ≤ 100 (12) | 8.59 (6.89, 10.29), <0.00001, 99, <0.00001 | ≤ 100 (8) | 7.06 (3.68, 10.44), <0.0001, 99, <0.00001 |
| Mean AHI of OSAS patients, events/h | Mean AHI of OSAS patients, events/h | ||
| >30 (7) | 18.16 (10.17, 26.15), <0.00001, 100, <0.00001 | >30 (6) | 8.48 (4.75, 12.21), <0.00001, 99, <0.00001 |
| ≤ 30 (2) | 1.05 (−0.16, 2.27), 0.09, 71, 0.06 | ≤ 30 (4) | 0.16 (−0.16, 0.48), 0.32, 68, 0.02 |
Subgroup analysis for serum and plasma levels of inteleukin-6 in adults where mean BMI of OSAS patients ≤ 30 kg/m2.
BMI, body mass index; CI, confidence interval; OSAS, obstructive sleep apnea syndrome; MD, mean difference; NA, not available; Ph, Pheterogeneity.
Bold numbers for statistically significant values (P < 0.05).
There was significantly higher levels of serum IL-6 in individuals with OSAS, both when controls had BMIs lower than 30 kg/m2 (MD = 11.02 pg/ml, P < 0.00001) and when this was higher than 30 kg/m2 (MD = 4.03 pg/ml, P < 0.00001), when overall sample size was both <100 (MD = 8.59 pg/ml, P < 0.00001) and >100 (MD = 11.92 pg/ml, P = 0.02), and when the mean AHI of individuals with OSAS was higher than 30 (MD = 18.16 pg/ml, P < 0.00001).
Under the following conditions, plasma levels of IL-6 were significantly higher: the mean BMI of controls was ≤ 30 kg/m2 (MD = 4.10 pg/ml, P < 0.00001), total sample size was ≤ 100 (MD = 7.06 pg/ml, P < 0.0001), and mean AHI of individuals with OSAS was ≤ 30 events/h (MD = 8.48 pg/ml, P < 0.00001).
Meta-Regression
The results of meta-regression showed that with greater age, serum IL-6 levels were significantly higher. The publication year, the mean BMI, the mean AHI, and number of participants had no independent significant effects on serum or plasma IL-6 levels (Table 7).
Table 7
| Year of publication | R | Adjusted R2 | P | Mean age of OSAS patients | R | Adjusted R2 | P | Mean age of controls | R | Adjusted R2 | P |
|---|---|---|---|---|---|---|---|---|---|---|---|
| Serum | 0.001 | −0.029 | 0.995 | Serum | 0.479 | 0.207 | 0.03 | Serum | 0.385 | 0.123 | 0.022 |
| Plasma | 0.124 | −0.034 | 0.582 | Plasma | 0.377 | 0.092 | 0.112 | Plasma | 0.204 | −0.018 | 0.417 |
| Mean BMI of OSAS patients | R | Adjusted R2 | P | Mean BMI of controls | R | Adjusted R2 | P | Mean AHI of OSAS patients | R | Adjusted R2 | P |
| Serum | 0.119 | −0.017 | 0.504 | Serum | 0.089 | −0.023 | 0.615 | Serum | 0.188 | −0.011 | 0.391 |
| Plasma | 0.143 | −0.031 | 0.538 | Plasma | 0.168 | −0.032 | 0.504 | Plasma | 0.169 | −0.036 | 0.517 |
| Number of participants | R | Adjusted R2 | P | ||||||||
| Serum | 0.062 | −0.025 | 0.717 | ||||||||
| Plasma | 0.159 | −0.029 | 0.504 |
Meta-regression analysis of variables predicting serum and plasma levels of inteleukin-6 comparing obstructive sleep apnea syndrome with controls.
R, correlation coefficient. Bold numbers for statistically significant values (P < 0.05).
Quality Assessment
The quality scores of the studies included in the meta-analysis are reported in Table 8.
Table 8
| The first author, year | Selection | Comparability | Exposure | Total points |
|---|---|---|---|---|
| ADULTS | ||||
| Vgontzas, 1997 (26) | *** | – | *** | 6 |
| Huiguo, 2000 (27) | *** | ** | *** | 8 |
| Roytblat, 2000 (28) | *** | * | *** | 7 |
| Teramoto, 2003 (29) | ** | – | *** | 5 |
| Yokoe, 2003 (30) | *** | ** | *** | 8 |
| Ciftci, 2004 (12) | *** | ** | *** | 8 |
| Imagawa, 2004 (31) | *** | * | *** | 7 |
| Ryan, 2006 (32) | *** | ** | *** | 8 |
| de la Peña Bravo, 2007 (34) | *** | ** | *** | 8 |
| Harsch, 2007 (35) | *** | ** | *** | 8 |
| Arias, 2008 (36) | *** | ** | *** | 8 |
| Constantinidis, 2008 (37) | *** | * | *** | 7 |
| Li, 2008 (40) | **** | ** | *** | 9 |
| Takahashi, 2008 (41) | *** | ** | *** | 8 |
| Tomiyama, 2008 (42) | *** | ** | *** | 8 |
| Vgontzas, 2008 (43) | *** | ** | *** | 8 |
| Yamamoto, 2008 (44) | *** | ** | *** | 8 |
| Carneiro, 2009 (45) | *** | ** | *** | 8 |
| Li, 2009 (46) | *** | ** | *** | 8 |
| Thomopoulos, 2009 (47) | *** | ** | *** | 8 |
| Sahlman, 2010 (48) | *** | ** | *** | 8 |
| Steiropoulos, 2010 (49) | *** | ** | *** | 8 |
| Ye, 2010 (50) | **** | ** | *** | 9 |
| Liu, 2011(51) | *** | ** | *** | 8 |
| Fornadi, 2012 (52) | *** | ** | *** | 8 |
| Medeiros, 2012 (53) | *** | ** | *** | 8 |
| Qian, 2012 (54) | *** | ** | *** | 8 |
| Ye, 2012 (55) | *** | ** | *** | 8 |
| Hargens, 2013 (56) | *** | ** | *** | 8 |
| Kurt, 2013 (57) | *** | * | *** | 7 |
| Yang, 2013 (58) | *** | ** | *** | 8 |
| Ciccone, 2014 (59) | *** | ** | *** | 8 |
| Kritikou, 2014 (61) | *** | ** | *** | 8 |
| Unuvar Dogan, 2014 (62) | *** | ** | *** | 8 |
| De, 2015 (63) | *** | ** | *** | 8 |
| Gaines, 2015 (64) | *** | ** | *** | 8 |
| Hui, 2015 (65) | ** | - | *** | 5 |
| Ulasli, 2015 (67) | *** | ** | *** | 8 |
| Thunstrom, 2015 (66) | **** | ** | *** | 9 |
| Dogan, 2016 (68) | *** | ** | *** | 8 |
| Nizam, 2016 (70) | *** | ** | *** | 8 |
| Vicente, 2016 (71) | *** | ** | *** | 8 |
| Hirotsu, 2017 (72) | **** | ** | *** | 9 |
| Kong, 2017 (73) | *** | ** | *** | 8 |
| Thorn, 2017 (74) | *** | ** | *** | 8 |
| Weingarten, 2017 (76) | *** | ** | *** | 8 |
| Zhang, 2017 (77) | *** | * | *** | 7 |
| Al-Terki, 2018 (78) | *** | ** | *** | 8 |
| Bhatt, 2018 (79) | *** | ** | *** | 8 |
| Bozic, 2018 (80) | *** | ** | *** | 8 |
| Kong, 2018 (81) | *** | ** | *** | 8 |
| Lu, 2018 (82) | *** | ** | *** | 8 |
| Motamedi, 2018 (83) | **** | ** | *** | 9 |
| Sundbom, 2018 (84) | **** | ** | *** | 9 |
| Bhatt, 2019 (85) | *** | * | *** | 7 |
| Tang, 2019 (86) | *** | ** | *** | 8 |
| Galati, 2020 (87) | **** | ** | *** | 8 |
| CHILDREN | ||||
| Tam, 2006 (33) | **** | ** | *** | 9 |
| Gozal, 2008 (38) | **** | ** | *** | 9 |
| Li, 2008 (39) | *** | * | *** | 7 |
| Gileles-Hillel, 2014 (60) | *** | ** | *** | 8 |
| Huang, 2016 (69) | *** | * | *** | 7 |
| Van Eyck, 2017 (75) | *** | * | *** | 7 |
Quality assessment scores of the studies involved in the meta-analysis.
Each asterisk denotes 1 point.
Sensitivity Analysis
The “cumulative analysis” and the “one study removed” as two sensitivity analyses confirmed the stability of the results. In addition, excluding studies with outlier data did not affect the pooled analysis of serum (MD = 2.89 pg/ml, P < 0.00001) or plasma (MD = 2.78 pg/ml, P < 0.00001) IL-6 levels (Table 9).
Table 9
| First author, year | Sample | Reason for removing | MD (95% CI) | Z | P value | I 2 | P h |
|---|---|---|---|---|---|---|---|
| Hargens, 2013 | Serum | Outlier data | 2.89 (2.54, 3.24) | 16.04 | <0.00001 | 99% | <0.00001 |
| Harsch, 2007 | Plasma | Outlier data | 2.78 (1.91, 3.66) | 6.24 | <0.00001 | 99% | <0.00001 |
Sensitivity analysis on the results of serum and plasma levels in adults.
Publication Bias
The funnel plots of the analysis of serum and plasma IL-6 levels are shown in Figure 6, and Table 10 gives the results of the trim-and-fill method on bias.
Figure 6
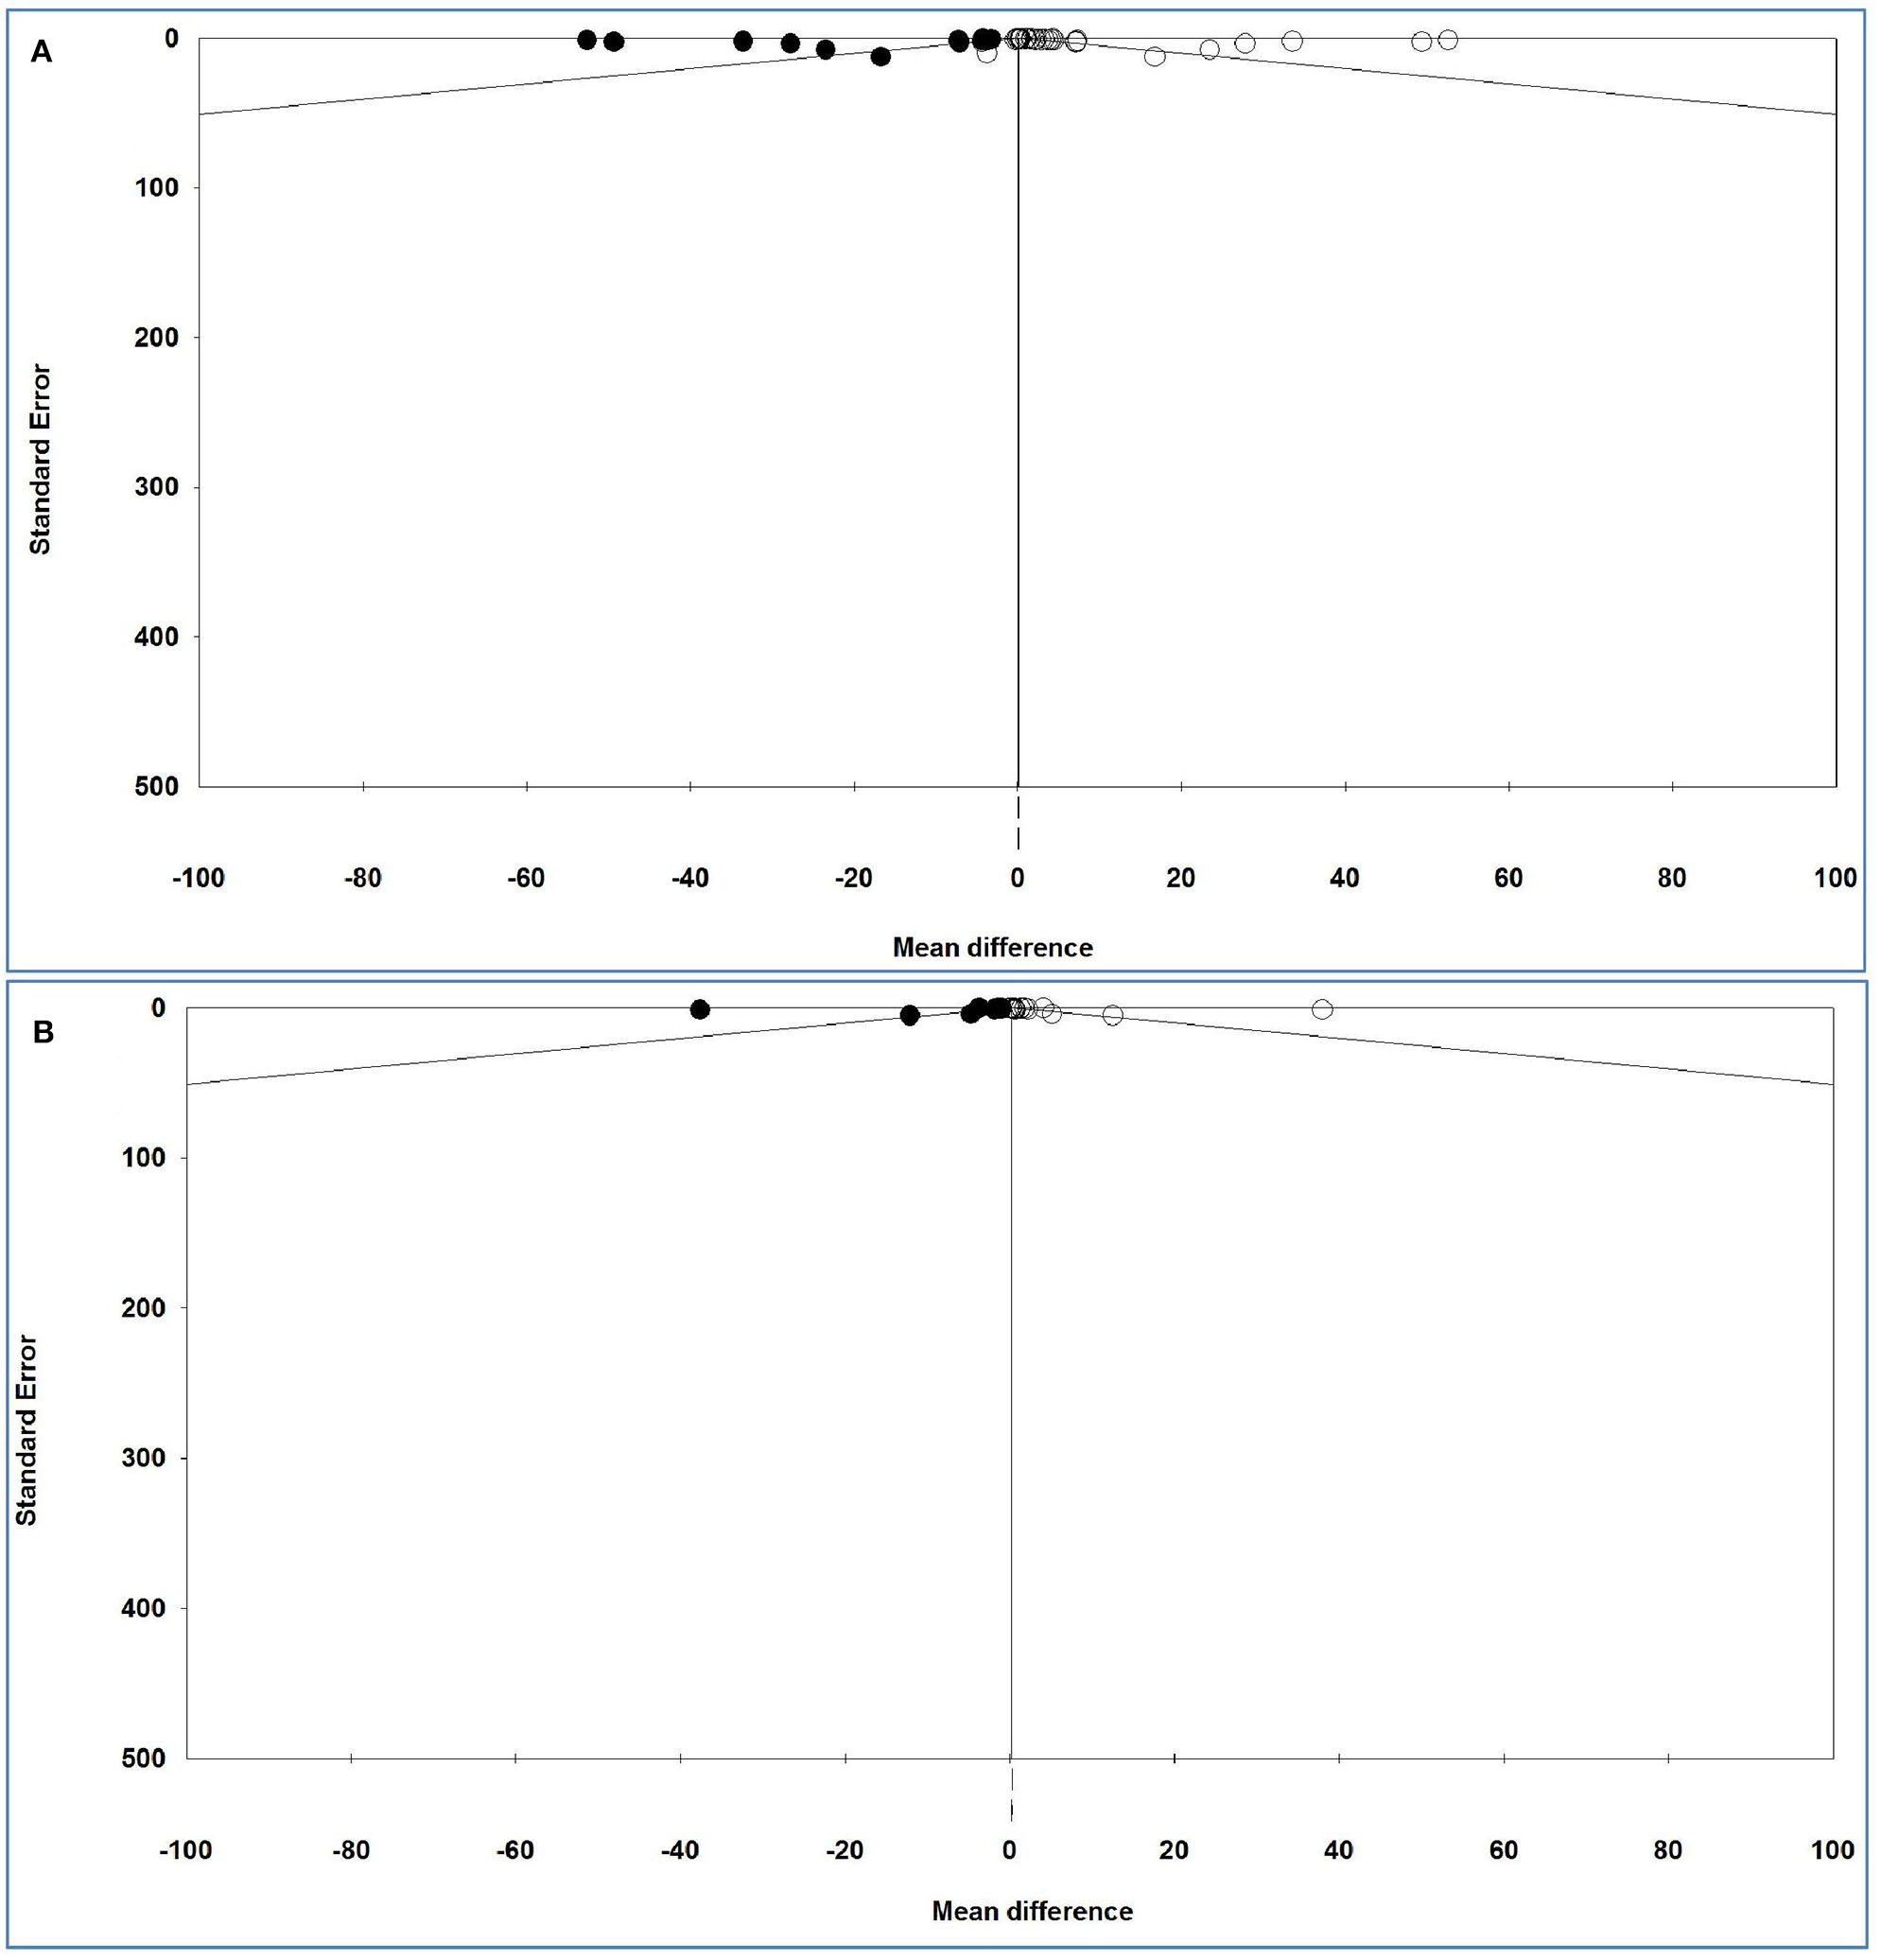
Funnel plot of analysis of interleukin-6 levels in adult participants on (A) serum and (B) plasma in adult participants. Open circles represent observed studies. Black circles represent imputed studies. Open diamonds represent the pooled effects from the original studies. Black diamonds represent the pooled effects incorporating the imputed studies.
Table 10
| Sample | Value | Studies trimmed | Fixed effects | Random effects | Q value | ||||
|---|---|---|---|---|---|---|---|---|---|
| Point estimate | Lower limit | Upper limit | Point estimate | Lower limit | Upper limit | ||||
| Serum | Observed | – | 0.02403 | 0.01818 | 0.02988 | 2.41151 | 2.07576 | 2.74726 | 4,869.43934 |
| Adjusted | 14 | 0.02287 | 0.01702 | 0.02872 | 0.45786 | 0.08567 | 0.83005 | 7,858.53130 | |
| Plasma | Observed | – | 0.25196 | 0.22049 | 0.28343 | 2.94160 | 1.87192 | 4.01128 | 1,640.40890 |
| Adjusted | 10 | 0.20025 | 0.116914 | 0.23136 | 0.28995 | −0.73377 | 1.31366 | 3,295.78126 | |
The results of trim-and-fill method.
For serum and plasma IL-6 levels, Egger's test (P = 0.00044 and P = 0.01445, respectively) revealed a publication bias, but Begg's test (P = 0.44811 and P = 0.55922, respectively) indicated no bias either between or across the studies.
For serum IL-6 levels and 14 imputed studies, under the fixed-effects model, the point estimate and pseudo 95% CI for the combined studies is 0.024 (0.018, 0.030); using the trim–fill method, the imputed point estimate is 0.023 (0.017, 0.029). In addition, under the random-effects model, the point estimate and 95% CI for the combined studies is 2.411 (2.076, 2.747); using the trim–fill method, the imputed point estimate is 0.458 (0.086, 0.830).
For plasma IL-6 levels and 10 imputed studies, under the fixed-effects model, the point estimate and 95% CI for the combined studies is 0.252 (0.220, 0.283), and using trim–fill method, the imputed point estimate is 0.200 (0.117, 0.231). In addition, under the random-effects model, the point estimate and pseudo 95% CI for the combined studies is 2.941 (1.872, 4.011); using the trim–fill method, the imputed point estimate is 0.290 (−0.734, 1.314).
The overall effect sizes for serum and plasma IL-6 levels reported in the forest plot appears valid, with a trivial publication bias effect based on a fixed-effects model, because the observed estimates were similar to the adjusted estimates. In contrast, the overall effect sizes on serum and plasma IL-6 levels reported in the forest plot appeared invalid, with a significant publication bias effect based on random-effects model, because the observed estimates were substantially different to the adjusted estimates.
Discussion
The present meta-analysis with 63 studies evaluated serum IL-6 levels (37 studies of adults and three of children) and plasma IL-6 levels (20 studies of adults and three of children) comparing individuals with OSAS to controls. The analysis showed that plasma and serum IL-6 levels of adults with OSAS were significantly higher than the corresponding levels of control. For children with OSAS, plasma IL-6 levels but not serum IL-6 levels were significantly higher than those of controls. The present conclusions have clinical importance because an elevated IL-6 level can be a risk factor for the development of cardiovascular diseases in adults with OSAS (88). These conclusions also have practical importance because, in addition to routine checks on sleep and sleep-disordered breathing, both children and adults with OSAS need a thorough monitoring of their immune systems.
One study (89) has shown that OSAS can alter the secretory levels of several hormones. However, vascular and systemic inflammation is the main pathogenesis of OSAS-related cardiac metabolic processes via activation of inflammatory pathways (90). Nadeem et al. (9) concluded, in their meta-analysis of 14 studies, that adults with OSAS had higher serum levels of IL-6 than healthy controls. Zhong et al. (16) similarly concluded from their meta-analysis that both children (four studies) and adults with OSAS (31 studies) had significantly higher serum IL-6 levels than controls. Although the exact mechanism of the OSAS-induced impact on levels of IL-6 is not known, both sleep deprivation and hypoxemia are believed to be important causative factors (32).
IL-6 is the cytokine with the most clearly documented effects on nonimmunological tissues and has been termed a pleiotropic or “endocrine” cytokine (91). In healthy individuals, inflammatory cytokines such as IL-6 are involved in the regulation of physiological sleep associated with the circadian secretion pattern (92). A good night's sleep and a good sense of well-being on the following day can be associated with reduced IL-6 secretion (93), whereas increased secretion of this cytokine can cause excessive daytime sleepiness (EDS) and fatigue (26, 94). In this respect, we note that EDS is a principal complaint of patients with sleep disorders (95) and is one of the most important physiological consequences of OSAS (96). In a similar vein, a meta-analysis of studies measuring the IL-6 level of patients with major depression found that these levels were significantly higher than in controls (97).
Furthermore, previous studies (26, 94) have confirmed that serum IL-6 levels are positively correlated with higher BMI scores as a proxy for obesity. Roytblat et al. (28) evaluated serum IL-6 levels of individuals with obesity, individuals with OSAS, and healthy controls. They found that IL-6 levels were 34-fold higher in individuals with obesity hypoventilation than in controls, and 8-fold higher in individuals with OSAS. In addition, serum cytokine levels were higher in all individuals with obesity. To explain these results, it appears that oxidative stress, inflammation, and sympathetic activation as proxies for pathophysiological mechanisms known to be present in individuals with OSAS also occur in individuals with obesity (98). The correlations between the levels of cytokines, apnea, and obesity are unclear (63). In our meta-analysis, based on subgroup analyses, the serum and plasma IL-6 levels in obese participants with OSAS were very much lower than in nonobese OSAS participants. However, some studies (26, 63, 68, 99) have reported a positive and significant correlation between BMI and IL-6 levels in OSAS cases, although other studies (12, 51) failed to find any significant correlation. Therefore, the higher MD of IL-6 levels in nonobese OSAS samples found in the present analysis may possibly indicate that BMI by itself does not affect IL-6 levels in OSAS patients but that there are other confounding factors influencing the serum and plasma IL-6 levels.
Next, several studies (26, 30, 66, 83) have shown that individuals with severe OSAS have higher mean plasma/serum IL-6 levels than either those with mild OSAS or controls. Furthermore, higher serum IL-6 levels have been found to be significantly correlated with higher AHI in individuals with OSAS (r = 0.33, P = 0.03) (12). Our subgroup analysis similarly showed that serum and plasma levels of IL-6 of individuals with an AHI > 30 events/h was higher than the levels of individuals with an AHI ≤ 30 events/h; this was the case in particular for participants with a mean BMI ≤ 30 kg/m2 and of Asian background. It follows that Asians with AHI > 30 events/h and BMI ≤ 30 kg/m2 are at the greatest risk of having high serum IL-6 levels. The data available from the studies included in our analysis are insufficient to clarify the meaning of the patterns of results observed and in particular cannot shed any direct light on the underlying physiological mechanisms. It follows that future studies should investigate the extent to which ethnicity and its genetic make-up might be associated with vulnerability.
Despite the novelty of the findings, the following limitations should be considered. First, in none of the studies were results adjusted to reflect possible confounding factors such as obesity, smoking, or alcohol consumption. Second, the results of the funnel plots showed a publication bias across the studies; it follows that a systematic bias in data presentation cannot be ruled out. Third, the studies with small sample sizes (<100) had insufficient power to detect associations. Fourth, there was a high level of heterogeneity among studies with respect to some analyses. Fifth, studies reported different cutoff values for AHI, making comparisons between the studies difficult. Sixth, in some studies, level of IL-6 was treated as a secondary outcome.
In contrast, the strengths of the meta-analysis were as follows. First, the meta-regression revealed that age could have a confounding effect on serum results. Second, there were sufficient studies to allow for subgroup analysis. Third, sensitivity analysis confirmed the stability of results. Fourth, studies published in languages other than English were included in the meta-analysis.
Conclusions
The results of the present meta-analysis showed higher levels of IL-6 in individuals with OSAS to be related to the severity of the disease. Furthermore, age has an impact on the associations between OSAS and IL-6 levels. Future studies might investigate the extent to which interventions to address OSAS (e.g., using CPAP devices) impact positively on IL-6 levels and possibly also on weight regulation.
Practice Points
-
Both children and adults with OSAS need careful monitoring of their immune system, as plasma and serum IL-6 concentrations are higher than in healthy counterparts.
-
This statement holds particularly true for older individuals with OSAS and with higher BMI scores.
-
Individuals with OSAS are at particular risk of suffering from other illnesses related to an impaired immune system.
Research Agenda
-
In individuals with OSAS and receiving CPAP treatment, IL-6 concentrations should be assessed before and after the CPAP treatment as an indicator of a normalized psychophysiological recovery.
-
In individuals with OSAS and tonsillectomy, IL-6 concentrations should be assessed before and after the surgical intervention as an indicator of a normalized psychophysiological recovery.
-
In individuals with OSAS and receiving appropriate treatment, IL-6 concentrations should be associated with possible changes in academic performance and social behavior.
-
In overweight individuals with OSAS, assessment of the family system (overweight/obese parents or siblings) might explain why OSAS could persist in an undetected fashion.
-
Retrospective chart records should calculate the extent to which OSAS and a deteriorated immune system might be associated with DALYS (disability-adjusted life years).
Statements
Data availability statement
All datasets generated for this study are included in the article.
Author contributions
All authors contributed to the article and approved the submitted version.
Funding
This work was performed in partial fulfillment of the requirements for a doctorate degree in General Dentistry (ME), in the Faculty of Dentistry, Kermanshah University of Medical Sciences, Kermanshah, Iran. This study was funded by the Research Council of Kermanshah University of Medical Sciences (Grant Number 980708).
Acknowledgments
We thank Nick Emler (University of Surrey, Surrey, UK) for proofreading the manuscript.
Conflict of interest
The authors declare that the research was conducted in the absence of any commercial or financial relationships that could be construed as a potential conflict of interest.
- AHI
apnea–hypopnea index
- BMI
body mass index
- CI
confidence interval
- CPAP
continuous positive air pressure
- DALYS
disability-adjusted life years
- EDS
excessive daytime sleepiness
- IL-6
interleukin-6
- MD
mean difference
- NFκB
nuclear factor κB
- NOS
Newcastle–Ottawa Scale
- OSAS
obstructive sleep apnea syndrome
- PRISMA
Preferred Reporting Items for Systematic Reviews and Meta-analyses
- SD
standard deviation.
Abbreviations
References
1.
Dempsey JA Veasey SC Morgan BJ O'Donnell CP . Pathophysiology of sleep apnea. Physiol Rev. (2010) 90:47–112. 10.1152/physrev.00043.2008
2.
Ip MS Lam B Ng MM Lam WK Tsang KW Lam KS . Obstructive sleep apnea is independently associated with insulin resistance. Am J Respir Crit Care Med. (2002) 165:670–6. 10.1164/ajrccm.165.5.2103001
3.
Modena DAO Cazzo E Cândido EC Baltieri L da Silveira LJB de Almeida AMN et al . Obstructive sleep apnea syndrome among obese individuals: a cross-sectional study. Rev Assoc Med Bras. (2017) 63:862–8. 10.1590/1806-9282.63.10.862
4.
Castaneda A Jauregui-Maldonado E Ratnani I Varon J Surani S . Correlation between metabolic syndrome and sleep apnea. World J Diabetes. (2018) 9:66. 10.4239/wjd.v9.i4.66
5.
Rajan P Greenberg H . Obstructive sleep apnea as a risk factor for type 2 diabetes mellitus. Nat Sci Sleep. (2015) 7:113. 10.2147/NSS.S90835
6.
Yacoub M Youssef I Salifu MO McFarlane SI . Cardiovascular disease risk in obstructive sleep apnea: an update. J Sleep Disord Therapy. (2017) 7:283. 10.4172/2167-0277.1000283
7.
Heinzer R Vat S Marques-Vidal P Marti-Soler H Andries D Tobback N et al . Prevalence of sleep-disordered breathing in the general population: the hypnolaus study. Lancet Respir Med. (2015) 3:310–8. 10.1016/S2213-2600(15)00043-0
8.
Minoguchi K Yokoe T Tanaka A Ohta S Hirano T Yoshino G et al . Association between lipid peroxidation and inflammation in obstructive sleep apnoea. Eur Res J. (2006) 28:378–85. 10.1183/09031936.06.00084905
9.
Nadeem R Molnar J Madbouly EM Nida M Aggarwal S Sajid H et al . Serum inflammatory markers in obstructive sleep apnea: a meta-analysis. J Clin Sleep Med. (2013) 9:1003–12. 10.5664/jcsm.3070
10.
Kheirandish-Gozal L Gozal D . Obstructive sleep apnea and inflammation: proof of concept based on two illustrative cytokines. Int J Mol Sci. (2019) 20:459. 10.3390/ijms20030459
11.
McCord JM . The evolution of free radicals and oxidative stress. Am J Med. (2000) 108:652–9. 10.1016/S0002-9343(00)00412-5
12.
Ciftci TU Kokturk O Bukan N Bilgihan A . The relationship between serum cytokine levels with obesity and obstructive sleep apnea syndrome. Cytokine. (2004) 28:87–91. 10.1016/j.cyto.2004.07.003
13.
Kasasbeh E Chi DS Krishnaswamy G . Inflammatory aspects of sleep apnea and their cardiovascular consequences. South Med J Birmingh Alabama. (2006) 99:58. 10.1097/01.smj.0000197705.99639.50
14.
Hirano T Akira S Taga T Kishimoto T . Biological and clinical aspects of interleukin 6. Immunol Today. (1990) 11:443–9. 10.1016/0167-5699(90)90173-7
15.
Ishimi Y Miyaura C Jin CH Akatsu T Abe E Nakamura Y et al . Il-6 is produced by osteoblasts and induces bone resorption. J Immunol. (1990) 145:3297–303.
16.
Zhong A Xiong X Shi M Xu H . Roles of interleukin (Il)-6 gene polymorphisms, serum Il-6 levels, and treatment in obstructive sleep apnea: a meta-analysis. Sleep Breath. (2016) 20:719–31. 10.1007/s11325-015-1288-6
17.
Moher D Shamseer L Clarke M Ghersi D Liberati A Petticrew M et al . Preferred reporting items for systematic review and meta-analysis protocols (Prisma-P) 2015 statement. Syst Rev. (2015) 4:1. 10.1186/2046-4053-4-1
18.
Wells G Shea B O'Connell D Peterson J Welch V Losos M et al . The Newcastle–Ottawa Scale (Nos) for Assessing the Quality of Non-Randomized Studies in Meta-Analysis Web Site (2018). Available online at: http://www.ohri.ca/programs/clinical_epidemiology/oxford.asp (accessed September 07, 2018).
19.
Zintzaras E Hadjigeorgiou GM . The role of G196a polymorphism in the brain-derived neurotrophic factor gene in the cause of parkinson's disease: a meta-analysis. J Human Genet. (2005) 50:560–6. 10.1007/s10038-005-0295-z
20.
Higgins JP Thompson SG . Quantifying heterogeneity in a meta-analysis. Stat Med. (2002) 21:1539–58. 10.1002/sim.1186
21.
Begg CB Mazumdar M . Operating characteristics of a rank correlation test for publication bias. Biometrics. (1994) 50:1088–101. 10.2307/2533446
22.
Egger M Smith GD Schneider M Minder C . Bias in meta-analysis detected by a simple, graphical test. BMJ. (1997) 315:629–34. 10.1136/bmj.315.7109.629
23.
Duval S Tweedie R . Trim and fill: a simple funnel-plot–based method of testing and adjusting for publication bias in meta-analysis. Biometrics. (2000) 56:455–63. 10.1111/j.0006-341X.2000.00455.x
24.
Wan X Wang W Liu J Tong T . Estimating the sample mean and standard deviation from the sample size, median, range and/or interquartile range. BMC Med Res Methodol. (2014) 14:135. 10.1186/1471-2288-14-135
25.
Ghiciuc CM Dima-Cozma LC Bercea RM Lupusoru CE Mihaescu T Cozma S et al . Imbalance in the diurnal salivary testosterone/cortisol ratio in men with severe obstructive sleep apnea: an observational study. Braz J Otorhinolaryngol. (2016) 82:529–35. 10.1016/j.bjorl.2015.09.004
26.
Vgontzas AN Papanicolaou DA Bixler EO Kales A Tyson K Chrousos GP . Elevation of plasma cytokines in disorders of excessive daytime sleepiness: role of sleep disturbance and obesity. J Clin Endocrinol Metab. (1997) 82:1313–6. 10.1210/jcem.82.5.3950
27.
Huiguo L Jin L Shengdao X Guanxin S Zhenxiang Z Yongjian X . The change of interleukin-6 and tumor necrosis factor in patients with obstructive sleep apnea syndrome. J Tongji Med Univ. (2000) 20:200–2. 10.1007/BF02886988
28.
Roytblat L Rachinsky M Fisher A Greemberg L Shapira Y Douvdevani A et al . Raised interleukin-6 levels in obese patients. Obes Res. (2000) 8:673–5. 10.1038/oby.2000.86
29.
Teramoto S Yamamoto H Ouchi Y . Increased C-reactive protein and increased plasma interleukin-6 may synergistically affect the progression of coronary atherosclerosis in obstructive sleep apnea syndrome. Circulation. (2003) 107:e40. 10.1161/01.CIR.0000053956.46188.5F
30.
Yokoe T Minoguchi K Matsuo H Oda N Minoguchi H Yoshino G et al . Elevated levels of C-reactive protein and interleukin-6 in patients with obstructive sleep apnea syndrome are decreased by nasal continuous positive airway pressure. Circulation. (2003) 107:1129–34. 10.1161/01.CIR.0000052627.99976.18
31.
Imagawa S Yamaguchi Y Ogawa K Obara N Suzuki N Yamamoto M et al . Interleukin-6 and tumor necrosis factor-α in patients with obstructive sleep apnea-hypopnea syndrome. Respiration. (2004) 71:24–9. 10.1159/000075645
32.
Ryan S Taylor CT McNicholas WT . Predictors of elevated nuclear factor-?b–dependent genes in obstructive sleep apnea syndrome. Am J Respir Crit Care Med. (2006) 174:824–30. 10.1164/rccm.200601-066OC
33.
Tam CS Wong M McBain R Bailey S Waters KA . Inflammatory measures in children with obstructive sleep apnoea. J Paediatr Child Health. (2006) 42:277–82. 10.1111/j.1440-1754.2006.00854.x
34.
de M Serpero LD Barceló A Barbé F Agustí A Gozal D . Inflammatory proteins in patients with obstructive sleep apnea with and without daytime sleepiness. Sleep Breathing. (2007) 11:177–85. 10.1007/s11325-007-0100-7
35.
Harsch I Bergmann T Koebnick C Wiedmann R Ruderich F Hahn E et al . Adiponectin, resistin and subclinical inflammation-the metabolic burden in launois bensaude syndrome, a rare form of obesity. J Physiol Pharmacol. (2007) 58:65−76.
36.
Arias M García-Río F Alonso-Fernández A Hernanz A Hidalgo R Martínez-Mateo V et al . Cpap decreases plasma levels of soluble tumour necrosis factor-α receptor 1 in obstructive sleep apnoea. Eur Respir J. (2008) 32:1009–15. 10.1183/09031936.00007008
37.
Constantinidis J Ereliadis S Angouridakis N Konstantinidis I Vital V Angouridaki C . Cytokine changes after surgical treatment of obstructive sleep apnoea syndrome. Eur Arch Oto Rhino Laryngol. (2008) 265:1275–9. 10.1007/s00405-008-0627-7
38.
Gozal D Serpero LD Capdevila OS Kheirandish-Gozal L . Systemic inflammation in non-obese children with obstructive sleep apnea. Sleep Med. (2008) 9:254–9. 10.1016/j.sleep.2007.04.013
39.
Li AM Lam HS Chan M So HK Ng SK Chan I et al . Inflammatory cytokines and childhood obstructive sleep apnoea. Ann Acad Med Singapore. (2008) 37:649–54.
40.
Li Y Chongsuvivatwong V Geater A Liu A . Are biomarker levels a good follow-up tool for evaluating obstructive sleep apnea syndrome treatments?. Respiration. (2008) 76:317–23. 10.1159/000119542
41.
Takahashi K-I Chin K Nakamura H Morita S Sumi K Oga T et al . Plasma thioredoxin, a novel oxidative stress marker, in patients with obstructive sleep apnea before and after nasal continuous positive airway pressure. Antioxidants Redox Signal. (2008) 10:715–26. 10.1089/ars.2007.1949
42.
Tomiyama H Okazaki R Inoue D Ochiai H Shiina K Takata Y et al . Link between obstructive sleep apnea and increased bone resorption in men. Osteopor Int. (2008) 19:1185–92. 10.1007/s00198-007-0556-0
43.
Vgontzas A Zoumakis E Bixler E Lin HM Collins B Basta M et al . Selective effects of Cpap on sleep apnoea-associated manifestations. Eur J Clin Investig. (2008) 38:585–95. 10.1111/j.1365-2362.2008.01984.x
44.
Yamamoto Y Fujiuchi S Hiramatsu M Nishigaki Y Takeda A Fujita Y et al . Resistin is closely related to systemic inflammation in obstructive sleep apnea. Respiration. (2008) 76:377–85. 10.1159/000141866
45.
Carneiro G Togeiro SM Ribeiro-Filho FF Truksinas E Ribeiro AB Zanella MT et al . Continuous positive airway pressure therapy improves hypoadiponectinemia in severe obese men with obstructive sleep apnea without changes in insulin resistance. Metab Syndr Relat Disord. (2009) 7:537–42. 10.1089/met.2009.0019
46.
Li Y Chongsuvivatwong V Geater A Liu A . Exhaled breath condensate cytokine level as a diagnostic tool for obstructive sleep apnea syndrome. Sleep Med. (2009) 10:95–103. 10.1016/j.sleep.2007.11.013
47.
Thomopoulos C Tsioufis C Dimitriadis K Tsiachris D Tousoulis D Manolis A et al . Obstructive sleep apnoea syndrome is associated with enhanced sub-clinical inflammation and asymmetric dimethyl-arginine levels in hypertensives. J Human Hypertens. (2009) 23:65–7. 10.1038/jhh.2008.101
48.
Sahlman J Miettinen K Peuhkurinen K SEPPÄ J Peltonen M Herder C et al . The activation of the inflammatory cytokines in overweight patients with mild obstructive sleep apnoea. J Sleep Res. (2010) 19:341–8. 10.1111/j.1365-2869.2009.00787.x
49.
Steiropoulos P Papanas N Nena E Antoniadou M Serasli E Papoti S et al . Inflammatory markers in middle-aged obese subjects: does obstructive sleep apnea syndrome play a role?Mediat Inflamm. (2010) 2010:675320. 10.1155/2010/675320
50.
Ye L Ma G-H Chen L Li M Liu J-L Yang K et al . Quantification of circulating cell-free DNA in the serum of patients with obstructive sleep apnea–hypopnea syndrome. Lung. (2010) 188:469–74. 10.1007/s00408-010-9253-4
51.
Liu Z Xu Y Hua Q Wang Y Liu R Yang Z . Additive effects of obstructive sleep apnea syndrome and hypertension on inflammatory reaction. Afr J Biotechnol. (2011) 10:11738.
52.
Fornadi K Lindner A Czira ME Szentkiralyi A Lazar AS Zoller R et al . Lack of association between objectively assessed sleep disorders and inflammatory markers among kidney transplant recipients. Int Urol Nephrol. (2012) 44:607–17. 10.1007/s11255-011-0095-7
53.
Medeiros C De Bruin V Andrade G Coutinho W de Castro-Silva C De Bruin P . Obstructive sleep apnea and biomarkers of inflammation in ischemic stroke. Acta Neurol Scand. (2012) 126:17–22. 10.1111/j.1600-0404.2011.01589.x
54.
Qian X Yin T Li T Kang C Guo R Sun B et al . High levels of inflammation and insulin resistance in obstructive sleep apnea patients with hypertension. Inflammation. (2012) 35:1507–11. 10.1007/s10753-012-9464-3
55.
Ye J Liu H Zhang G Li P Wang Z Huang S et al . The Treg/Th17 imbalance in patients with obstructive sleep apnoea syndrome. Mediat Inflamm. (2012) 2012:815308. 10.1155/2012/815308
56.
Hargens TA Guill SG Kaleth AS Nickols-Richardson SM Miller LE Zedalis D et al . Insulin resistance and adipose-derived hormones in young men with untreated obstructive sleep apnea. Sleep Breathing. (2013) 17:403–9. 10.1007/s11325-012-0708-0
57.
Kurt OK Tosun M Talay F . Serum cardiotrophin-1 and Il-6 levels in patients with obstructive sleep apnea syndrome. Inflammation. (2013) 36:1344–7. 10.1007/s10753-013-9673-4
58.
Yang D Liu Z Luo Q . Plasma ghrelin and pro-inflammatory markers in patients with obstructive sleep apnea and stable coronary heart disease. Med Sci Monit. (2013) 19:251. 10.12659/MSM.883874
59.
Ciccone MM Scicchitano P Zito A Cortese F Boninfante B Falcone VA et al . Correlation between inflammatory markers of atherosclerosis and carotid intima-media thickness in obstructive sleep apnea. Molecules. (2014) 19:1651–62. 10.3390/molecules19021651
60.
Gileles-Hillel A Alonso-Álvarez ML Kheirandish-Gozal L Peris E Cordero-Guevara JA Terán-Santos J et al . Inflammatory markers and obstructive sleep apnea in obese children: the nanos study. Mediat Inflamm. (2014) 2014:605280. 10.1155/2014/605280
61.
Kritikou I Basta M Vgontzas AN Pejovic S Liao D Tsaoussoglou M et al . Sleep apnoea, sleepiness, inflammation and insulin resistance in middle-aged males and females. Eur Respir J. (2014) 43:145–55. 10.1183/09031936.00126712
62.
Ünüvar Dogan F Yosunkaya S Kuzu Okur H Can Ü . relationships between obstructive sleep apnea syndrome, continuous positive airway pressure treatment, inflammatory cytokines. Sleep Disord. (2014) 2014:518920. 10.1155/2014/518920
63.
De SS Cambi J Tatti P Bellussi L Passali D . Changes in ghrelin, leptin and pro-inflammatory cytokines after therapy in obstructive sleep apnea syndrome (osas) patients. Polish Otolaryngol. (2015) 69:1–8. 10.5604/00306657.1147029
64.
Gaines J Vgontzas AN Fernandez-Mendoza J Kritikou I Basta M Bixler EO . Gender differences in the association of sleep apnea and inflammation. Brain Behav Immunity. (2015) 47:211–7. 10.1016/j.bbi.2014.11.013
65.
Hui P Jia S Ma W Zhao L Wang J Wei X et al . The changes and significance of Il-6 levels in patients with osahs associated type 2 diabetes mellites. J Clin Otorhinolaryngol Head Neck Surg. (2015) 29:1726−8.
66.
Thunström E Glantz H Fu M Yucel-Lindberg T Petzold M Lindberg K et al . Increased inflammatory activity in nonobese patients with coronary artery disease and obstructive sleep apnea. Sleep. (2015) 38:463–71. 10.5665/sleep.4510
67.
Ulasli SS Sariaydin M Gunay E Halici B Celik S Koyuncu T et al . Effects of nondipping pattern on systemic inflammation in obstructive sleep apnea. Sleep Breathing. (2015) 19:1185–90. 10.1007/s11325-015-1135-9
68.
Dogan D Ocal N Aydogan M Tasci C Arslan Y Tapan S et al . Assessment of the role of serum ischemia-modified albumin in obstructive sleep apnea in comparison with interleukin-6. Postgrad Med. (2016) 128:603–8. 10.1080/00325481.2016.1203237
69.
Huang Y-S Guilleminault C Hwang F-M Cheng C Lin C-H Li H-Y et al . Inflammatory cytokines in pediatric obstructive sleep apnea. Medicine. (2016) 95:e4944. 10.1097/MD.0000000000004944
70.
Nizam N Basoglu O Tasbakan M Lappin D Buduneli N . Is there an association between obstructive sleep apnea syndrome and periodontal inflammation?Clin Oral Investig. (2016) 20:659–68. 10.1007/s00784-015-1544-y
71.
Vicente E Marin JM Carrizo SJ Osuna CS González R Marin-Oto M et al . Upper airway and systemic inflammation in obstructive sleep apnoea. Eur Respir J. (2016) 48:1108–17. 10.1183/13993003.00234-2016
72.
Hirotsu C Albuquerque RG Nogueira H Hachul H Bittencourt L Tufik S et al . The relationship between sleep apnea, metabolic dysfunction and inflammation: the gender influence. Brain Behav Immunity. (2017) 59:211–8. 10.1016/j.bbi.2016.09.005
73.
Kong D Qin Z Wang W Kang J . Effect of obstructive sleep apnea on carotid artery intima media thickness related to inflammation. Clin Investig Med. (2017) 40:E25–33. 10.25011/cim.v40i1.28051
74.
Thorn C Knight B Pastel E McCulloch L Patel B Shore A et al . Adipose tissue is influenced by hypoxia of obstructive sleep apnea syndrome independent of obesity. Diab Metab. (2017) 43:240–7. 10.1016/j.diabet.2016.12.002
75.
Van Eyck A Van Hoorenbeeck K De Winter BY Van Gaal L De Backer W Verhulst SL . Sleep-disordered breathing, systemic adipokine secretion, and metabolic dysregulation in overweight and obese children and adolescents. Sleep Med. (2017) 30:52–6. 10.1016/j.sleep.2015.11.014
76.
Weingarten JA Bellner L Peterson SJ Zaw M Chadha P Singh SP et al . The association of Nov/Ccn3 with obstructive sleep apnea (osa): preliminary evidence of a novel biomarker in osa. Horm Mol Biol Clin Investig. (2017) 31. 10.1515/hmbci-2017-0029
77.
Zhang Z Wang C . Immune status of children with obstructive sleep apnea/hypopnea syndrome. Pak J Med Sci. (2017) 33:195. 10.12669/pjms.331.11959
78.
Al-Terki A Abu-Farha M AlKhairi I Cherian PT Sriraman D Shyamsundar A et al . Increased level of angiopoietin like proteins 4 and 8 in people with sleep apnea. Front Endocrinol. (2018) 9:651. 10.3389/fendo.2018.00651
79.
Bhatt SP Guleria R Vikram NK Nandhan S Singh Y Gupta A . Association of inflammatory genes in obstructive sleep apnea and non alcoholic fatty liver disease in Asian Indians residing in North India. PLoS ONE. (2018) 13:e0199599. 10.1371/journal.pone.0199599
80.
Bozic J Borovac JA Galic T Kurir TT Supe-Domic D Dogas Z . Adropin and inflammation biomarker levels in male patients with obstructive sleep apnea: a link with glucose metabolism and sleep parameters. J Clin Sleep Med. (2018) 14:1109–18. 10.5664/jcsm.7204
81.
Kong Y Li Z Tang T Wu H Liu J Gu L et al . The level of lipopolysaccharide-binding protein is elevated in adult patients with obstructive sleep apnea. BMC Pulm Med. (2018) 18:90. 10.1186/s12890-018-0647-z
82.
Lu D Abulimiti A Wu T Abudureyim A Li N . Pulmonary surfactant-associated proteins and inflammatory factors in obstructive sleep apnea. Sleep Breathing. (2018) 22:99–107. 10.1007/s11325-017-1536-z
83.
Motamedi V Kanefsky R Matsangas P Mithani S Jeromin A Brock MS et al . Elevated tau and interleukin-6 concentrations in adults with obstructive sleep apnea. Sleep Med. (2018) 43:71–6. 10.1016/j.sleep.2017.11.1121
84.
Sundbom F Janson C Malinovschi A Lindberg E . Effects of coexisting asthma and obstructive sleep apnea on sleep architecture, oxygen saturation, and systemic inflammation in women. J Clin Sleep Med. (2018) 14:253–9. 10.5664/jcsm.6946
85.
Bhatt SP Guleria R Vikram NK Gupta A . Non-alcoholic fatty liver disease is an independent risk factor for inflammation in obstructive sleep apnea syndrome in obese Asian Indians. Sleep Breathing. (2019) 23:171–8. 10.1007/s11325-018-1678-7
86.
Tang T Huang Q Liu J Zhou X Du J Wu H et al . Oxidative stress does not contribute to the release of proinflammatory cytokines through activating the nod-like receptor protein 3 inflammasome in patients with obstructive sleep apnoea. Sleep Breathing. (2019) 23:535–42. 10.1007/s11325-018-1726-3
87.
Galati D Zanotta S Canora A Polistina GE Nicoletta C Ghinassi G et al . Severe depletion of peripheral blood dendritic cell subsets in obstructive sleep apnea patients: a new link with cancer?Cytokine. (2020) 125:154831. 10.1016/j.cyto.2019.154831
88.
Shah NA Yaggi HK Concato J Mohsenin V . Obstructive sleep apnea as a risk factor for coronary events or cardiovascular death. Sleep Breathing. (2010) 14:131–6. 10.1007/s11325-009-0298-7
89.
Lanfranco F Gianotti L Pivetti S Navone F Rossetto R Tassone F et al . Obese patients with obstructive sleep apnoea syndrome show a peculiar alteration of the corticotroph but not of the thyrotroph and lactotroph function. Clin Endocrinol. (2004) 60:41–8. 10.1111/j.1365-2265.2004.01938.x
90.
Arnaud C Poulain L Lévy P Dematteis M . Inflammation contributes to the atherogenic role of intermittent hypoxia in apolipoprotein-E knock out mice. Atherosclerosis. (2011) 219:425–31. 10.1016/j.atherosclerosis.2011.07.122
91.
Papanicolaou DA . Interleukin-6: the endocrine cytokine. J Clin Endocrinol Metab. (2000) 85:1331–3. 10.1210/jcem.85.3.6582
92.
Opp M Kapas L Toth L . Cytokine involvement in the regulation of sleep. Proc Soc Exp Biol Med. (1992) 201:16–27. 10.3181/00379727-201-43474
93.
Vgontzas AN Papanicolaou DA Bixler EO Lotsikas A Zachman K Kales A et al . Circadian interleukin-6 secretion and quantity and depth of sleep. J Clin Endocrinol Metab. (1999) 84:2603–7. 10.1210/jcem.84.8.5894
94.
Vgontzas AN Papanicolaou DA Bixler EO Hopper K Lotsikas A Lin H-M et al . Sleep apnea and daytime sleepiness and fatigue: relation to visceral obesity, insulin resistance, and hypercytokinemia. J Clin Endocrinol Metab. (2000) 85:1151–8. 10.1210/jcem.85.3.6484
95.
Bixler EO Vgontzas AN Lin H-M Calhoun SL Vela-Bueno A Kales A . Excessive daytime sleepiness in a general population sample: the role of sleep apnea, age, obesity, diabetes, and depression. J Clin Endocrinol Metab. (2005) 90:4510–5. 10.1210/jc.2005-0035
96.
Trakada G Chrousos GP Pejovic S Vgontzas AN . Sleep apnea and its association with the stress system, inflammation, insulin resistance and visceral obesity. Sleep Med Clin. (2007) 2:251–61. 10.1016/j.jsmc.2007.04.003
97.
Dowlati Y Herrmann N Swardfager W Liu H Sham L Reim EK et al . A meta-analysis of cytokines in major depression. Biol Psychiatry. (2010) 67:446–57. 10.1016/j.biopsych.2009.09.033
98.
Alam I Lewis K Stephens J Baxter J . Obesity, metabolic syndrome and sleep apnoea: all pro-inflammatory states. Obes Rev. (2007) 8:119–27. 10.1111/j.1467-789X.2006.00269.x
99.
Chu L Li Q . The evaluation of adenotonsillectomy on Tnf-? and Il-6 levels in obese children with obstructive sleep apnea. Int J Pediatr Otorhinolaryngol. (2013) 77:690–4. 10.1016/j.ijporl.2013.01.019
Summary
Keywords
obstructive sleep apnea syndrome, interleukin-6, serum, plasma, meta-analysis, pediatric and adult individuals
Citation
Imani MM, Sadeghi M, Khazaie H, Emami M, Sadeghi Bahmani D and Brand S (2020) Evaluation of Serum and Plasma Interleukin-6 Levels in Obstructive Sleep Apnea Syndrome: A Meta-Analysis and Meta-Regression. Front. Immunol. 11:1343. doi: 10.3389/fimmu.2020.01343
Received
20 March 2020
Accepted
27 May 2020
Published
21 July 2020
Volume
11 - 2020
Edited by
Manuela Mengozzi, Brighton and Sussex Medical School, United Kingdom
Reviewed by
Jose David Abdullatif, University of Argentine Social Museum, Argentina; Soroush Zaghi, The Breathe Institute, United States
Updates
Copyright
© 2020 Imani, Sadeghi, Khazaie, Emami, Sadeghi Bahmani and Brand.
This is an open-access article distributed under the terms of the Creative Commons Attribution License (CC BY). The use, distribution or reproduction in other forums is permitted, provided the original author(s) and the copyright owner(s) are credited and that the original publication in this journal is cited, in accordance with accepted academic practice. No use, distribution or reproduction is permitted which does not comply with these terms.
*Correspondence: Serge Brand serge.brand@upk.ch
This article was submitted to Inflammation, a section of the journal Frontiers in Immunology
Disclaimer
All claims expressed in this article are solely those of the authors and do not necessarily represent those of their affiliated organizations, or those of the publisher, the editors and the reviewers. Any product that may be evaluated in this article or claim that may be made by its manufacturer is not guaranteed or endorsed by the publisher.