 Violena Pietrobon
 Alessandra Cesano
 Francesco Marincola
 Jakob Nikolas Kather
- 1Refuge Biotechnologies, Inc., Menlo Park, CA, United States
- 2Essa Pharmaceuticals, Inc.South San Francisco, CA, United States
- 3Medical Oncology, National Center for Tumor Diseases (NCT), University Hospital Heidelberg, Heidelberg, Germany
- 4Department of Medicine III, University Hospital RWTH Aachen, Aachen, Germany
In recent years, cancer immunotherapy experienced remarkable developments and it is nowadays considered a promising therapeutic frontier against many types of cancer, especially hematological malignancies. However, in most types of solid tumors, immunotherapy efficacy is modest, partly because of the limited accessibility of lymphocytes to the tumor core. This immune exclusion is mediated by a variety of physical, functional and dynamic barriers, which play a role in shaping the immune infiltrate in the tumor microenvironment. At present there is no unified and integrated understanding about the role played by different postulated models of immune exclusion in human solid tumors. Systematically mapping immune landscapes or “topographies” in cancers of different histology is of pivotal importance to characterize spatial and temporal distribution of lymphocytes in the tumor microenvironment, providing insights into mechanisms of immune exclusion. Spatially mapping immune cells also provides quantitative information, which could be informative in clinical settings, for example for the discovery of new biomarkers that could guide the design of patient-specific immunotherapies. In this review, we aim to summarize current standard and next generation approaches to define Cancer Immune Topographies based on published studies and propose future perspectives.
Introduction to Cancer Immune Topographies
Cancer Immunotherapy in Hematological and Solid Tumors
The first application of immunotherapy was reported in 1891, when Dr. William B. Coley saved a patient with inoperable multiple advanced tumors by infecting him with streptococcal bacteria. The immune reaction produced caused shrinkage of the malignant tumor. However, the advent of radiation and chemotherapy resulted in a dismissal of Coley’s approach. This changed in the last decades leading in 2013 editors of the Science magazine to elect cancer immunotherapy as the “Breakthrough of the Year.” In 2018, the Nobel Prize in physiology or medicine was awarded to two cancer immunotherapy researchers, J. P. Allison and T. Honjo, for their discovery of immune checkpoints (1). Today, cancer immunotherapy is considered a promising therapeutic strategy against a variety of hematological and solid malignancies (2–4). Immune checkpoint inhibitors and chimeric antigen receptor (CAR) T-cells can induce durable remissions in many cancers and are clinically accepted as standard treatments for several cancers.
Significant clinical responses have been observed in hematological malignancies, using CAR-T-cells engineered to recognize CD19 molecules on B-cells (2, 5, 6). Treatments with checkpoint blocking antibodies have also been approved by the FDA for melanoma, lung cancer, breast cancer, kidney cancer and many other solid tumor types (7–15). Despite this progress, only a limited subset of patients responds favorably to the treatment and some tumors, such as prostate cancer and most gastrointestinal malignancies, have been proven to be particularly resistant to checkpoint inhibition, particularly when used as single agent (16–19). In general, solid tumors present various challenges to the applicability of immunotherapy, including the selection of the antigen to target, the infiltration of T-lymphocytes into the tumor core and the highly immunosuppressive tumor microenvironment (TME), which are all hallmarks of solid tumors (20). Solid tumors are heterogeneous ecosystems and they can contain different immunological niches in different regions of the same lesion. Systematic documentations of this phenomenon are scarce with the exception of a recent study which used computational image analysis inspired by geospatial data to quantify the heterogeneity of topographies in lung cancer (21). In some types of cancer, such as colorectal cancer (CRC), specific Immune phenotypes are linked to specific genotypes. For example, highly immune-infiltrated tumors are associated with hypermutation, which are mostly due to specific genetic features such as microsatellite instability or mutations in POLD1 or POLE genes in CRC (22).
Immune Topographies in Solid Tumors: Hot, Cold, and Immune Excluded Tumors
For decades, the gold standard method for diagnosing and subtyping almost any type of solid tumor has been visual examination of histopathology slides of tumor tissue. These slides are unspecifically stained with hematoxylin and eosin (H&E) which allows pathologists to discern cellular and subcellular structures. In spite of the technological progress in molecular biology assays, subjective evaluation of histopathology slides remains the backbone of solid tumor diagnostics. Although H&E staining dyes do not selectively bind to specific cell types, the visual characteristics of different cells allow a reproducible classification of cells into tumor cells, lymphoid immune cells, granulocytes, fibroblasts and other groups of cells in the tumor microenvironment. In particular, tumor-associated lymphocytes (including tumor-infiltrating and peritumoral lymphocytes) can be easily spotted due to their unique size, morphology and staining characteristics. Historically, the presence of such lymphocytes in or around tumor tissue has been regarded as an epiphenomenon of malignant tumor growth. However, mounting evidence supports the notion that the presence of these lymphocytes reflects an adaptive anti-tumor immune response by the host immune system and is a prognostic biomarker as well as a predictive biomarker of response to immunotherapy (23).
Systematic analyses of the distribution of lymphocytes in histopathology specimen have allowed to classify solid tumors according to three distinct Immune Topographies (24): a) Hot tumors, infiltrated by lymphocytes, i.e. lymphocytes are mixed with tumor cells in the tumor core (Figure 1A); b) Cold tumors, characterized by an absence of lymphocytes, i.e. almost no lymphocytes can be seen on histological slides (Figure 1B); c) Immune-excluded tumors characterized by an abundance of lymphocytes at the invasive edge of the tumor, but few to no lymphocytes in the tumor core (Figure 1C).
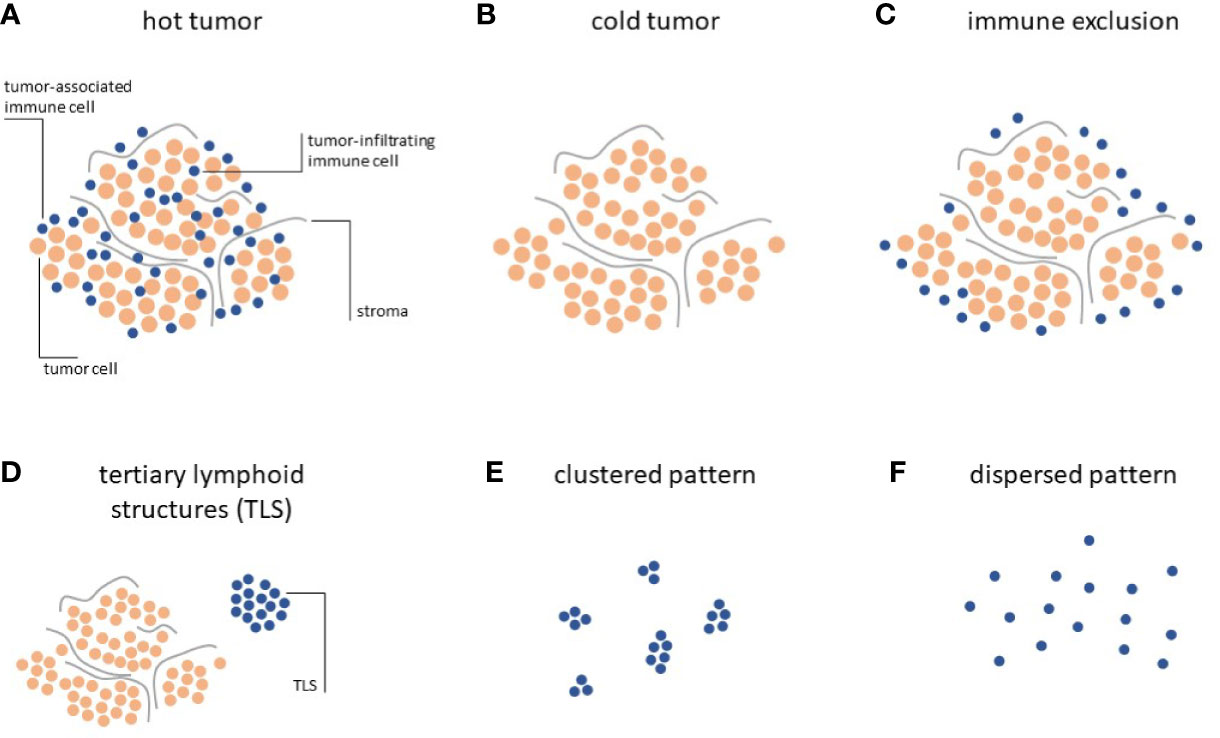
Figure 1 Immune topographies of cancer. (A–C) First-order immune topographies. (D–F) Second-order immune topographies.
Hot tumors present a homogeneous infiltration of T lymphocytes together with the accumulation of pro-inflammatory cytokines, and usually respond better to immunotherapy (25). Immune excluded tumors embody a unique ecosystem, differing from hot tumors, as they display gradients of T-cell exclusion (26). Such gradients are specific to each tumor environment and not present in cold tumors, where T-cells are completely absent. This trichotomy can be detected across most solid tumors and is directly associated with clinical outcome and response to immunotherapy (24, 27–30).
However, few published studies have systematically quantified the trichotomous Immune Topography in solid tumors beyond histopathological description (24). At present, there is only a limited understanding about how cellular mechanisms of immune exclusion may relate to each other in shaping this peculiar phenotype in human cancers, either through converging biological pathways or from a causative standpoint. Compelling data collected through high-throughput analysis would shed light on the spatial and temporal dynamics in which such determinants are involved, allowing for the creation of a harmonized ‘Theory of Everything’ (31, 32). Moreover, mapping the spatial distribution of immune cells in solid tumors also provides quantitative information potentially informative in clinical settings, allowing for the design of combinatorial approaches aimed at improving immunotherapy efficacy.
Tertiary Lymphoid Structures and Other Second-Order Topographies
Hot, cold and immune-excluded tumors are among the most striking patterns that can be observed in histopathology images. However, in addition to this trichotomy, immune cells in cancer tissue can form additional patterns which have been quantified and linked to biologically and/or clinically meaningful endpoints. These “second-order” Immune Topographies do not rely on pre-defined compartments within the tumor and around the tumor. For example, one such pattern of lymphoid cells observable in histopathology images of cancer is a tertiary lymphoid structure (TLS, Figure 1D). These structures are composed of lymphocyte conglomerates organized to resemble lymph node germinal centers and can be observed outside of (33) or within (34) the tumor tissue. The presence and number of these TLS is positively correlated to survival (35) and immunotherapy response (36) in a number of cancer types. However, systematic analyses of association with TLS count and other types of Immune Topographies are still lacking. In summary, it is still not entirely clear how different Immune Topography patterns are correlated to one another and, collectively, to clinical outcome. Large-scale studies in thousands of patients treated with immunotherapy and annotated with clinical outcomes are needed to validate and reconcile these findings in the future. Another approach was recently described by Saltz and coworkers by an unbiased, computational approach to cluster tumors according to their spatial patterns of lymphocyte infiltration (37). In particular, this approach considered the notion of clustered (Figure 1E) and dispersed (Figure 1F) lymphocyte infiltration and the authors could demonstrate a link between the observed lymphocyte patterns and patient survival, the ultimate clinically relevant end point. However, this large-scale analysis was limited to a single multicenter dataset, the Cancer Genome Atlas (TCGA), which might suffer from batch effects and other sourcing bias (38).
In this review, we aim to summarize the current knowledge in standard and next generation techniques to define Cancer Immune Topographies, including the performed studies, outcomes and future perspectives.
Biological Mechanisms of Immune Topographies
Barriers to an Effective Immune Response in Solid Tumors
Determinants of immune exclusion can be classified into three groups: physical, functional or dynamic barriers. Physical barriers represent a category where T-cells do not come in direct contact with cancer cells, due to mechanical separations. Therefore, activation of the immune effector gene signature is not observed (30). However, T lymphocytes can also engage with cancer cells, but functional determinants block their migration, expansion, function and/or survival within the tumor core. Functional barriers consist of constitutive metabolic interactions among immune cells, cancer cells and cells in the TME. Finally, dynamic barriers include functional barriers, which may be induced only when a contact between T-cells and cancer cells occurs, preventing further infiltration, activation and/or survival of immune cells. Dynamic barriers may not be present in baseline conditions (39–41). Here, we will give a brief overview of these determinants, as it is beyond the scope of this review to describe them in more detail.
Physical Barriers
Physical barriers include the remodeling of the extracellular matrix (ECM), cancer cell coating factors and changes in vascular accessibility (Table 1). In tumor tissues, the most frequent alteration of the ECM includes increased collagen deposition and a rearrangement of its geometry; this leads to cancer-associated fibrosis and possibly to a physical barrier to T-cell penetration (115–120). A variety of chemokines are responsible for this process, which requires the activation of recruited and resident fibroblasts, myofibroblasts, cancer-associated fibroblasts (CAFs) and cancer-associated mesenchymal stem cells (42–44, 121–123). CAFs have also been shown to be responsible for the biosynthesis of CXCL12, which binds and shields cancer cells (64–66).
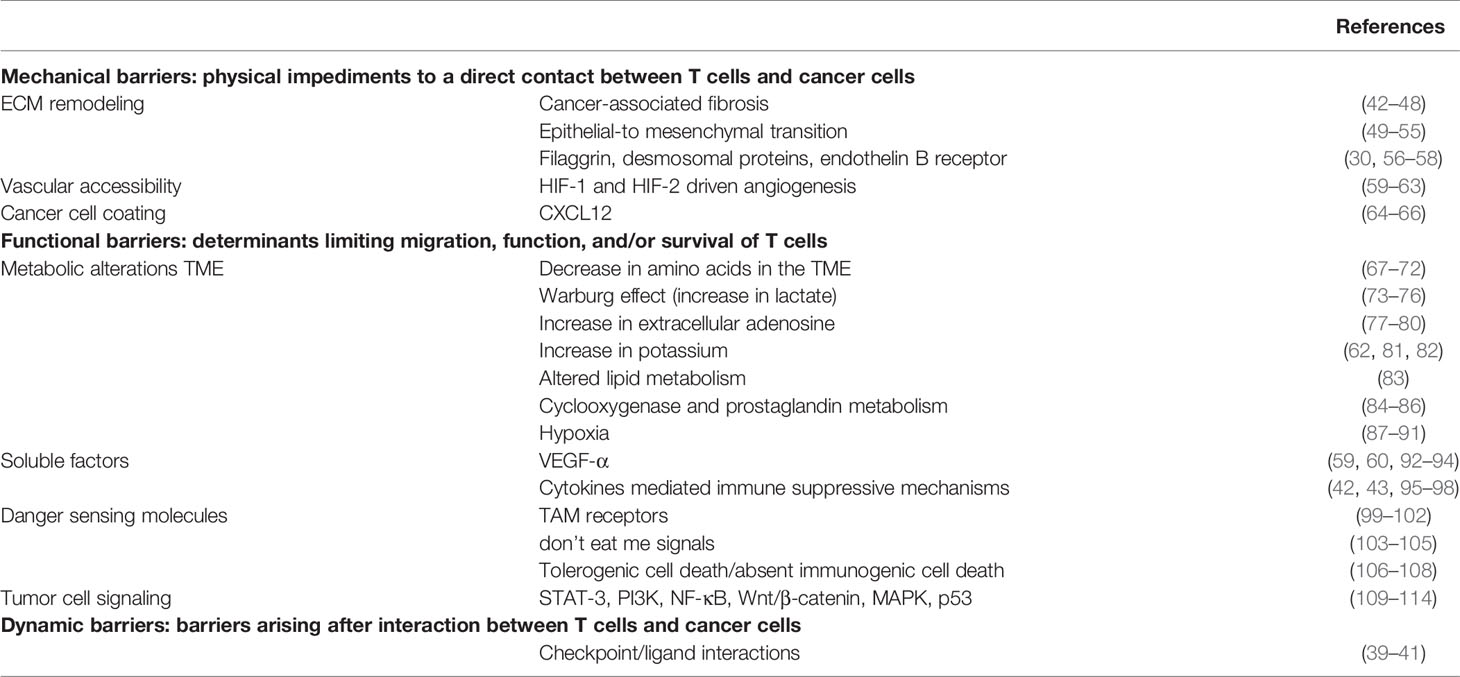
Table 1 Determinants of immune exclusion.
Another mechanism involved in the physical exclusion of T-cells may be related to tumor angiogenesis. As cellular proliferation outgrows blood supply, most solid tumors experience hypoxic conditions (124). In hypoxia, genes involved in angiogenesis are upregulated, including the vascular endothelial growth factor family (VEGF) (125, 126). Tumor angiogenesis often produces blood vessels with aberrant morphology and this could result in T-cell exclusion (87, 88, 127). Additionally, VEGF not only plays a prominent role in mediating T-cells infiltration into tumors, but also in regulating their function (59, 60, 92).
Functional Barriers
Functional barriers consist in metabolic alterations of the TME, immune suppressive soluble factors, danger sensing molecules and tumor cell-intrinsic signaling (Table 1). Cancer cell metabolism often leads to the reshaping of TME conditions, depleting it of amino acids (i.e. glutamine), which are essential for proper T-cell function (67, 128–133). Moreover, TME often presents increased concentration of lactate, due to the shift toward glycolytic metabolism of cancer cells (Warburg effect) and increased concentration of ions and other immune suppressive components, such as extracellular adenosine (134–137). Therefore, low pH, low glucose and reduced amino acid presence in the TME collectively lead to T-cell dysfunction.
T-Cell Signaling
A complex signaling network is responsible for the impaired function of T-cells, leading to lymphocytes that are exhausted, anergic, senescent or presenting stem features. Stem-cell-like T-cells possess the ability to proliferate and persist, but they are unable to mature (81, 138). Recent evidence showed that an overabundance of potassium in the TME triggers suppression of T-cell effector function, while preserving stemness (138). This happens through metabolic remodeling as a result of caloric restriction and a T-cell starvation.
Interestingly T-cell stemness can also enhance the effectiveness of immunotherapy: the generation of CD19-specific CAR-modified CD8+ memory stem cells led to long-lasting antitumor response and increased T-cell fitness, in a human acute lymphoblastic leukemia xenograft model (82, 139, 140).
A variety of chemokines have been implicated in the recruitment of T-cells into the tumor nest. In immune excluded tumors, it is possible that gradients of chemokines exist from the periphery to the center. However, additional repulsive mechanisms may limit the propulsion of T-cells, counterbalancing and overpowering attractive signals and reducing the chemo-attractive infiltration. In addition, stressed or dying cancer cells may inhibit proinflammatory signals, thereby affecting the efficiency of the immune response (Table 1) (141–143).
Dynamic Barriers in the Tumor Microenvironment
Finally, dynamic barriers represent a category of impediments absent in baseline conditions, but which arise as a consequence of the interaction between T-cells and cancer cells. This hints to a dynamic crosstalk between the two, at early stages. An example is the inducible activation of PDL-1 triggered by the production of IFN-γ by T-cells (Table 1) (39–41).
It is unclear if a predominant biology is responsible for most immune excluded cases or if an indiscriminate contribution of factors could better explain this complex phenomenon. Moreover, at present studies have not investigated if a correlation exists between immune exclusion mechanisms and tumor type or stage.
How to Quantify Immune Topographies
In Vivo and Ex Vivo Approaches
Over the years, studies have demonstrated the existence of a plethora of determinants playing a role in the immune excluded phenotype. Modern high-throughput techniques allow us to create pan-cancer Immune Topographies, characterizing spatial and temporal distribution of T-cells in the TME (24). Mapping ex vivo immune cells and correlating such distributions with determinants of immune exclusion and morphological parameters, would provide mechanistic insights into the dynamic organization of factors responsible for this phenomenon. It is possible that specific determinants of immune exclusion could correlate with some tumor types or with the tumor stage, rather than appearing randomly and chaotically.
In vivo studies offer information to design effective personalized combinatorial immunotherapies and clinical monitoring. Finally, it may be possible to integrate the data obtained from in vivo and ex vivo techniques, for the different determinants of immune exclusion. Such a comprehensive analysis might lead to the understanding of a common biology at the basis of the immune excluded phenotype.
Histology Images
Histopathology images are a versatile and well established method to analyze the tumor microenvironment and Immune Topographies in solid tumors. Histological specimens are routinely generated from preclinical tumor models and are available for almost any patient with a solid tumor in the clinic. The standard staining method for histopathology slides is hematoxylin and eosin (H&E) which allows for a rough classification of cells in the TME. By visually looking at histopathology slides or digitized whole slide images, pathologists can quantify patterns of antitumor immune response.
Although hot, cold and immune-excluded Immune Topographies can be visually determined just by looking at H&E stained histopathology slides, two methods have enabled a more quantitative description of these topographies: Immunohistochemistry and computer-based analysis.
Immunohistochemistry and Multiplex Imaging Techniques
Immunohistochemistry (IHC) methods can be used to selectively label certain immune cell subtypes in histology images, allowing for a more nuanced definition of Immune Topographies. IHC uses antibodies which are directly or indirectly coupled to certain dyes, allowing it to highlight markers specific to certain cell types. For example, cytotoxic lymphocytes are defined by a presence of the CD8 protein on their cell membrane. IHC methods have recently inspired a whole range of more sophisticated multiplex methods, allowing to characterize the expression of multiple proteins in one image. Multiplex fluorescence imaging (144), multiplex brightfield imaging (145) are among the most widely used methods to deeply characterize tumor-associated immune cells in a spatially resolved way. However, these methods are much more expensive, time-consuming and complex than H&E staining and usually require access to specialized and costly equipment. Thus, the advantages of these deeper methods need to be balanced against the simplicity of classical H&E histopathology, which allows for a broader characterization of thousands of patient samples in larger cohorts. Accordingly, most studies which have analyzed H&E histopathology images include a much higher number of patients than studies adopting more specialized methods.
Hypoxia-Associated Proteins
As previously mentioned, hypoxia is a key player in the immune excluded phenotype. Hypoxia is responsible for a dramatic reshaping of cellular transcriptional programs, through the activity of specific transcription factors called Hypoxia Inducible Factor 1 and 2 (HIF-1 and HIF-2). These proteins are responsible for the upregulation of a subset of genes essential to ensure adaptation, survival and proliferation in hypoxic conditions (146–148). Common hypoxic markers used in IHC include: CAIX, VEGF-A, EPO, GLUT-1 and GLUT-3, osteopontin, BNIP3, PDK1, LDHA, and LOX (149–153). These proteins are transcriptionally induced by HIF-transcription factors. HIF-1 can also be directly assessed in IHC, but correct sample handling is essential. The half-life of HIF-1 at 20% oxygen is approximately 5 min while other markers (i.e. VEGF-A and CAIX) are more stable (147, 154–156). Therefore, it is crucial to select the most appropriate proteins to test, based on sample processing procedures. Exogenously administered compounds can also be used to detect hypoxic regions in IHC. A nitroimidazole molecule called pimonidazole and a pentafluorinated derivative of the 2-nitroimidazole etanidazole, called EF5, are the most widely used (157–159). These non-toxic compounds are administered from a few hours to 48 h prior to biopsy and immunochemical detection is then performed. Pimonidazole directly correlates with the severity of hypoxia, and IHC has been successfully used to assess tumor hypoxia in patients with cervical carcinoma, prostate cancer and head and neck carcinoma (150, 157, 160). EF5 is also routinely employed to detect gradients of hypoxia as shown in studies on patients with head and neck tumors and uterine cervix cancer (161, 162). EF5 has also been used to detect hypoxia in atherosclerotic plaques in mice and in xenograft models of human colorectal carcinoma and sarcoma (163, 164).
Digital Pathology Approaches
Digital pathology, i.e. computer-based processing of digitized histopathology slides, has been used to automatically detect and count tumor-associated immune cells. Such approaches can be used to automate detection of Immune Topographies and to establish quantitative thresholds for classification of a given sample in either class. In the early days of digital pathology, the sheer size of scanned whole slide images (WSI) has been an obstacle for many researchers to analyze such data. Nowadays, however, more widespread availability of digital slide scanners, cheaper storage media and the emergence of easily usable open source software such as QuPath (165) enables almost any researcher at academic institutions to use computer-based approaches for quantitative analysis of pathology slides. These quantitative analyses can be performed with H&E stained images, single-immunostained images or multiplex images. One way of quantifying hot-cold-excluded topographies by means of digital pathology is with the “Immunoscore” (166), which has been extensively validated in large-scale studies (28). While the original “Immunoscore” protocol relies on proprietary software marketed by a commercial entity, the underlying principle can be re-built based on publicly available information (167).
Deep Learning-Based Image Analysis
Medical image data, and particularly digitized histopathology slides contain a large amount of information which is not entirely used. In particular, human observers, who visually analyze histopathology slides cannot objectively and quantitatively extract all relevant information. Deep learning is a method from the realm of artificial intelligence, which in recent years has revolutionized computer-based image analysis in non-medical and medical domains alike. Specifically, when applied to digital whole slide histology images, deep learning can extract biologically and clinically relevant information. In particular, immune-related features can be extracted from histopathology images. For example, gene expression signatures of cancer-infiltrating immune cells can be detected solely from H&E images in multiple types of solid tumors (168, 169).
Genome Sequencing Technologies
A comprehensive mechanistic insight regarding the correlation of functional, physical and dynamic barriers with morphological parameters in human cancer could be achieved thanks to last advances in high throughput analysis. These techniques are laying the foundation for a pan-cancer comprehension of the complexity of factors orchestrating the immune response in the TME. Recent studies profiled the TME of several cancer types including lung cancer, hepatocellular carcinoma, medulloblastoma, melanoma, head and neck cancer, pancreatic cancer and glioma (170–176).
Current developments in automated, multiplexed platforms to detect biomarkers and the increasing number of spatially resolved profiles of transcripts and metabolic products, could be important to provide an integrated landscape of molecular determinants driving the phenomenon of immune exclusion. Obtaining correlations between markers of different types of barriers, degree of immune infiltration/activity and tumor type/stage would allow us to investigate if one or multiple pathways are prevalent in human cancer or if these pathways just overlap indiscriminately. Such information, accumulated in a large cohort of human cancers, would be pivotal to improve diagnostic strategies and to predict the response to treatments.
Transcriptional profiling of “immune-mediated, tissue-specific destruction (TSD)” events led to the creation of an immune signature called immunologic constant of rejection (ICR) (31, 177–179). ICR is a 20-gene signature and characterizes a convergent pathway leading to TSD, also called immune rejection. Such signature can be observed in a variety of immune events: tumor regression, autoimmunity, clearance of pathogens and allograft rejection (179). ICR expression was correlated with a better prognosis in breast cancer patients and was validated as a prognostic predictive parameter in a pan-cancer cohort of patients treated with an anti-CTLA4 immune checkpoint inhibitor (109, 180, 181). The tumor inflammation signature (TIS) is considered as another immune predictive biomarker and it is an 18-gene signature (182, 183). TIS has been shown to be enriched in patients responding to anti-PD1 treatment and the expression patterns were conserved among tumor types (182).
Bioinformatics studies have been performed during the years, to investigate immune signatures in different types of tumors. These analyses rely on data from public cancer databases and provide a coarse evaluation of T lymphocytes functional status in bulk tumor samples. Computational deconvolution analysis on bulk RNA-seq data can be used to infer infiltrating cell types. Such analysis is limited by the existence of specific gene signatures, relative to cell types (184–187). However, no spatial or temporal resolution can be obtained from bulk bioinformatic studies. In order to achieve more detailed information about T-cell populations within the tumor mass and their functional state, single-cell techniques were developed and experienced tremendous progress in the past few years.
Single-Cell RNA Sequencing
Single-cell RNA sequencing (scRNA-seq) allows the investigation of the expression of hundreds of genes in a single experiment, enabling systematic identification of cell populations in a tissue. This technique provides insights into tumor heterogeneity and it has been used to assess both abundance and functional state of tumor associated cell types (188–193). ScRNA-seq has been increasingly employed due to a reduction in costs (sequencing and cell isolation) and improvement in throughput.
The most common scRNA-seq technologies rely on microfluidic devices which use patterned microwells for single-cell isolation or aqueous droplets in a continuous oil phase. Once isolated, cells are lysed and a whole transcriptome approach can be performed (i.e. Smart-seq2, MATQ-seq, SUPeR-seq) (194–196). Alternatively 3’-end or 5’-end sequencing technologies are available (i.e. Drop-seq, CEL-seq, Seq-Well, MARS-seq, Chromium, Quartz-seq, DroNC-seq, STRT-seq, etc.) (197–206). These two categories present different transcript coverage and each protocol has specific features, benefits and drawbacks.
Unfortunately, single-cell techniques require monodisperse cells, leading to loss of spatial information during cell isolation. Moreover, tumor solid biopsies could lead to biases and failure to identify the whole transcriptional profile or the truthful tumor-associated cell infiltration landscape. This can be due to the sampling location and to the fact that, only a small fraction of cells from the biopsy, can be sequenced (207–209). LCM microdissection is a method of sample dissection which consents the preservation of spatial information and partially rescues the technical limitation mentioned above. Cells from the region of interest are collected using laser pressure catapulting or through a near-IR laser, after being microscopically identified (210–212). Experimental or computational spatial reconstruction can also be obtained via immunohistochemistry, laser scanning microscopy, fluorescent in situ RNA sequencing (FISSEQ) or with anchor genes, through single molecule fluorescence in situ hybridization (smFISH) (213–217).
Single cell analysis allowed the investigation of the heterogeneity of tumor cells and tumor-infiltrating immune cells in breast cancer, clear cell renal cell carcinoma, colorectal, glioblastoma multiforme, melanoma, liver, ovary, non-small-cell lung carcinoma, nasopharyngeal cancer, squamous cell carcinoma of the head and neck and gastric cancer (168, 188–192, 218–222). The immune cells prevalently identified in most of these tumors were T lymphocytes; however myeloid cells, B cells and natural killer cells were also present at lower frequencies.
Immune cell subtypes were transcriptionally characterized, and their ontogeny was mapped, together with cell trafficking to different tissues or tumors (223). Clonotype expansion and migration was monitored by barcoding V(D)J recombination at the T-cell receptors (TCR) and B cell receptors (BCR) loci (224–226). V(D)J recombination occurs during T and B cell maturation, resulting in the diverse repertoire of TCR and BCR present in the lymphocyte population. Gene expression signature of T-cell clusters reflects a specific functional status and such diversity is crucial in clinical settings, to predict immunotherapy response. Indeed, T-cell populations with lower exhaustion levels were associated with a better prognosis in a variety of different cancer types (227–229). A study on gastric cancer reported that the interferon regulatory factor-8 transcription factor (IRF-8) was downregulated in CD8+ tumor infiltrating lymphocytes (TILs), leading to an exhausted phenotype. Patients with lower IRF-8 levels in CD8+ lymphocytes tended to have worse prognosis (230). A recent publication showed that, in early-stage triple-negative breast cancer, among CD8+ TILs, tissue resident memory cells display high expression of cytotoxic molecules, inhibitory checkpoint and genes associated with proliferation. This study suggests that T-cell exhaustion is a gradual process (231, 232). In clear cell renal cell carcinoma, PD-1 was found widely expressed in both CD8+ and CD4+ T-cell populations, while other inhibitory molecules were present only in a subset of PD-1 positive T-cells (189). Studies on the functional state of T-cells were also performed in melanoma and non-small-cell lung carcinoma patients, allowing the characterization of dysfunctional T-cells in the TME (191, 233). Xiao et al. (222) developed a computational pipeline to investigate the metabolic landscape of the tumor, at single cell resolution. They analyzed metabolic gene expression profiles of more than 9000 single cells from melanoma and squamous cell carcinoma of the head and neck. Metabolic pathways in tumor cells were found to generally be more plastic and, interestingly, glycolysis and oxidative phosphorylation both correlated with hypoxia at the single cell level. Metabolic features of immune cells were also identified and found to be altered. Characterizing the metabolic landscape in the tumor core could provide insights into the organization and prevalence of functional barriers.
Interactions among cells play a central role in shaping the TME altering cell metabolism, immune response and creating barriers to lymphocytes infiltration or activity (234, 235). Despite the study of cell interactions using single cell approaches is at early stages, a new publicly available repository of curated receptors, ligands and their interactions is available. CellPhoneDB (www.cellphonedb.org) takes into account the subunit architecture of both ligands and receptors and, coupled to scRNA-seq data, is a powerful tool to infer cell-cell communication networks (236, 237). Recently, scRNA-seq coupled to CellPhoneDB has been used to reveal interactions between Th2 and mesenchymal cells, in asthmatic human donors (238). ProximID is another strategy to create a cellular network based on scRNA-seq data. ProximID can be used to discover new niches interactions in different tissues, via microdissection of small interacting cell clusters and inference of the cell types present in the dissected entity through scRNA-seq. Boisset et al. (239) used ProximID to study mouse bone marrow and found specific interactions between megakaryocytes and mature neutrophils and between plasma cells and myeloblasts and/or promyelocytes. Moreover, they identified stem cell interactions in small intestine crypts.
Single cell analysis is not confined to the investigation of the transcriptome and, recently, the combination of multiple measurements (DNA, RNA, proteins) has been suggested as a comprehensive strategy to understand the TME complexity (223, 240). Innovative techniques such as G&T-seq and DR-seq allow to sequence both DNA and RNA, from single cells (241, 242). Genomic DNA and full-length mRNA are captured and physically divided before amplification and library preparation. These techniques, despite allowing for the comparison of gene expression data and corresponding genomic data in the same cell, increase the risk of sample loss or contamination and present a moderate reduction in coverage distribution.
Another combination of multi-omics techniques, which provides information about the transcriptional status of cells, consists of coupling ATAC-seq with RNA-seq. ATAC-seq can be considered a technique to assess genome-wide chromatin accessibility (243–245) and it relies on a genetically engineered hyperactive Tn5 transposase (246). Such transposase allows fragmentation of chromatin and integration of NGS adapters into open chromatin regions (247, 248). ATAC-seq coupled with RNA-seq was used to identify potential gene regulatory regions in glucagon-secreting α-cells and insulin-secreting β-cells (249) and to unravel disruptions of transcriptional regulations and gene expression in lung cancers (250).
Quantification of proteins and mRNAs simultaneously in individual cells can be obtained through different methodologies: Cellular Indexing of Transcriptomes and Epitopes by Sequencing (CITE-seq), RNA Expression and Protein Sequencing (REAP-seq) and Antibody sequencing (Ab-seq) (251–254). The workflow includes the creation of a pool of barcoded antibodies againsT-cell surface proteins of interest. Then, cells bind to barcoded antibodies and are encapsulated within a droplet, as single cells. Finally, the scRNA-seq libraries are prepared and sequenced. Such an approach overcomes the lack of correlation that sometimes is found between mRNA and protein levels, providing a more accurate characterization of the cellular phenotype.
The integration of different layers of information could be pivotal to provide insights into signaling networks regulating the immune excluded phenotype. However, as mentioned before, a primary drawback of single cell techniques is the loss of spatial information, which occurs during sample processing. In order to create systematic Immune Topographies, it is of crucial importance to characterize spatial and temporal distribution of lymphocytes in the TME. Therefore, technologies permitting simultaneous transcriptional assessment and preservation of tumor morphology or restoration of spatial information are preferable.
Spatial Transcriptomic Methodologies
New spatial transcriptomic (ST) methodologies exploit spatially barcoded oligo-deoxythymidine microarrays, allowing for unbiased mapping of transcripts (Figure 2) (255). ST has been performed to investigate prostate cancer, gingival tissue, breast cancer, pancreatic ductal adenocarcinoma, melanoma, adult human heart tissue, mouse, human and mouse spinal cord tissue and mouse olfactory bulb (221, 256–262). ST does not provide a high resolution as each area resolves the transcriptome of 10-200 cells (~ 100 µm), depending on the tissue context.
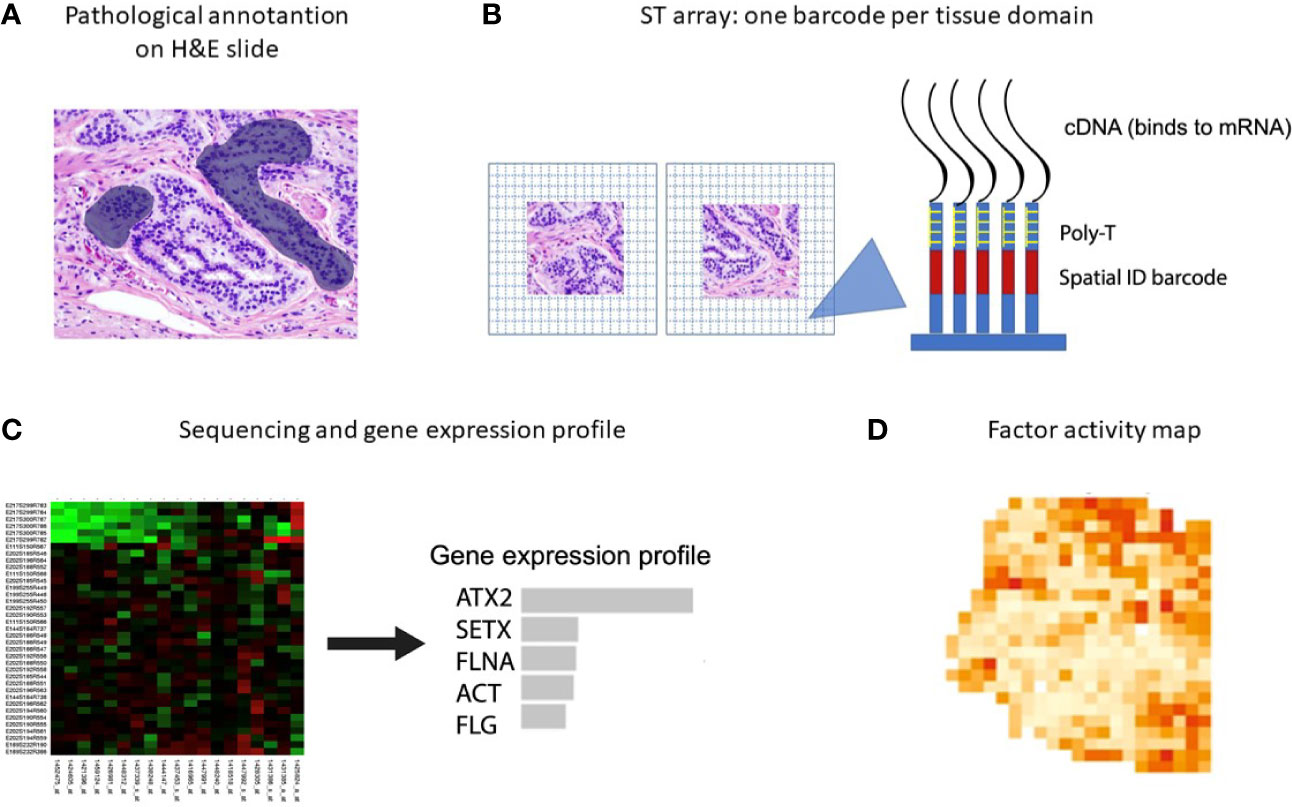
Figure 2 Spatial transcriptomics workflow including the downstream analysis. (A) Histological tumor sections are annotated by a pathologist and sections of interest are stained with hematoxylin and eosin before permeabilization. (B) The sections are placed on glass slides containing RT-primers arrayed as spots that correspond to tissues domains. The RT-primers at each spot have a unique spatial ID barcode, which is sequenced along with the transcript to enable trace-back to a specific tissue domain. (C, D) After sequencing, gene expression profiles and factor activity maps are created.
Moncada et al. combined microarray-based ST with scRNA-Seq generated from the same sample, to identify enrichments of specific cell types and subpopulations across spatially-defined regions of pancreatic tumors (221). Berglund et al. assessed the transcriptomes of nearly 6,750 tissue regions through ST from a patient with prostate cancer. They extracted different expression profiles for stroma, immune cells, and cancer cells (Figure 3) (257). Another example is Thrane et al., who applied the ST technology to melanoma lymph node biopsies. The transcriptomes of over 2,200 tissue domains was sequenced, revealing a detailed landscape of melanoma metastases (259). Nanostring technologies recently developed a high-plex panel to be used with the GeoMx™ Digital Spatial Profiler (DSP). This panel includes more than 1,400 genes to spatial profile tumor and immune pathways, including checkpoint inhibitors, intrinsic cancer cell pathways and predictive markers (263).
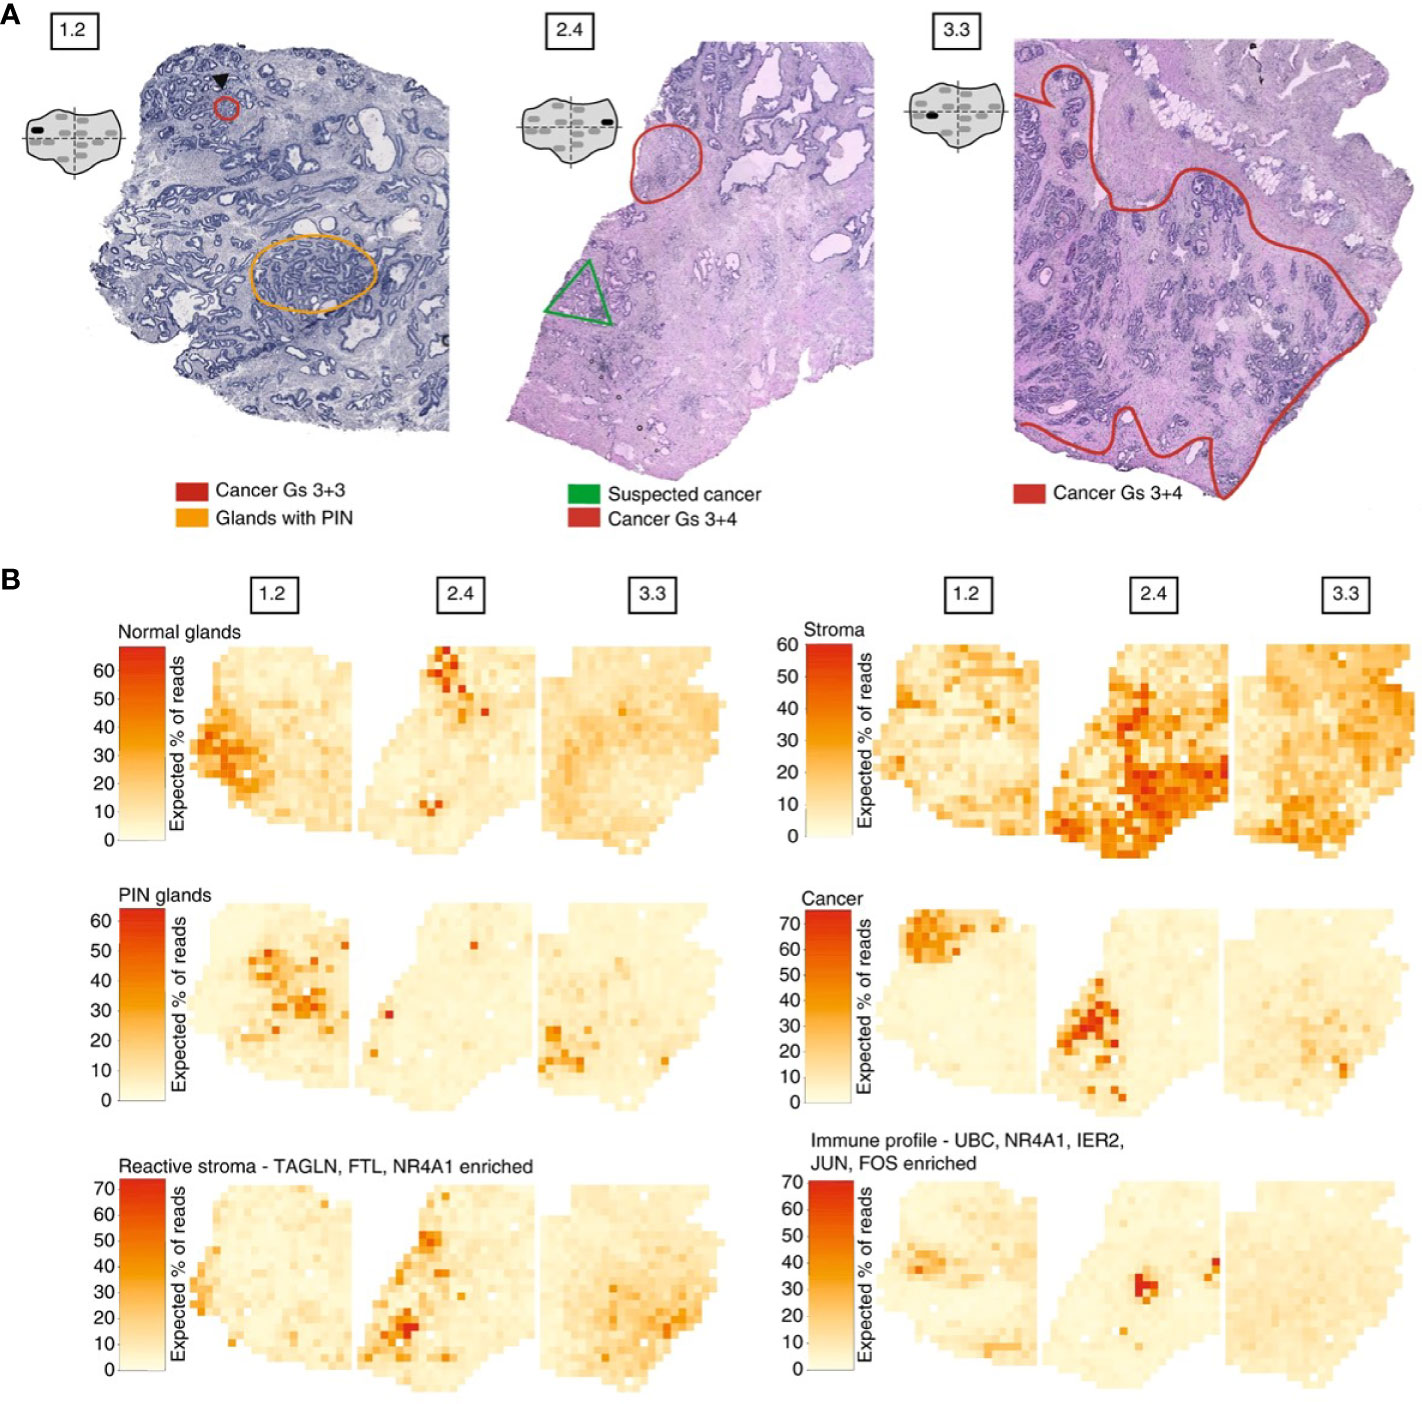
Figure 3 Example of spatial transcriptomic analysis on three prostate cancer biopsies: histology and gene expression factors (257). (A) Annotated brightfield images of tissue sections of interest, stained with hematoxylin and eosin. (B) Factor activity maps for morphological features (normal glands, PIN glands, stroma and cancer cells) and for inflamed regions (reactive stroma, immune profile).
ST protocols usually achieve a quite low resolution, however an implementation of this technique called Slide-seq can spatially resolve maps of histological sections at 10 µm resolution (264). Slide-seq substitutes the barcoded oligo-deoxythymidine with DNA-barcoded beads, harboring probes to trap the RNA. This technique was performed to map individual cell types, physically and functionally, in brain cryosections.
Other spatial techniques of interest include fluorescence in situ hybridization (FISH), NICHE-seq technology and spatially-resolved transcript amplicon readout mapping (STARmap). FISH allows to achieve a highly multiplexed single-molecule visualization of transcripts. In particular, multiplexed error-robust single-molecule fluorescent in situ hybridization (MERFISH) enables RNA imaging of individual cells using physically imprinted error-robust barcodes for individual RNA species. Subsequent rounds of imaging allow to measure these barcodes (265–269). Xia et al. (266) measured RNA species from ∼10,000 genes in different subcellular compartments. He also observed transcriptionally distincT-cell states and revealed spatial patterning, in U-2 OS cultured cells.
NICHE-seq technology allowed isolation and sorting of immune cells from a visually selected niche in model animals, expressing a photoactivatable green fluorescent protein (215, 270). ScRNA-seq was performed on sorted cells. This technique preserves the cell states and allows the investigation of the TME influence on immune cells. NICHE-seq was performed to identify T and B cells in mouse lymph nodes and spleens, after virus infection (215). It also revealed niche-specific expression programs and changes in immune localization, in melanoma and naïve inguinal lymph nodes in mouse models (Figure 4). However, due to the two-photon laser scanning microscopy which is required to perform this technique, application of NICHE-seq is currently limited to preclinical research.
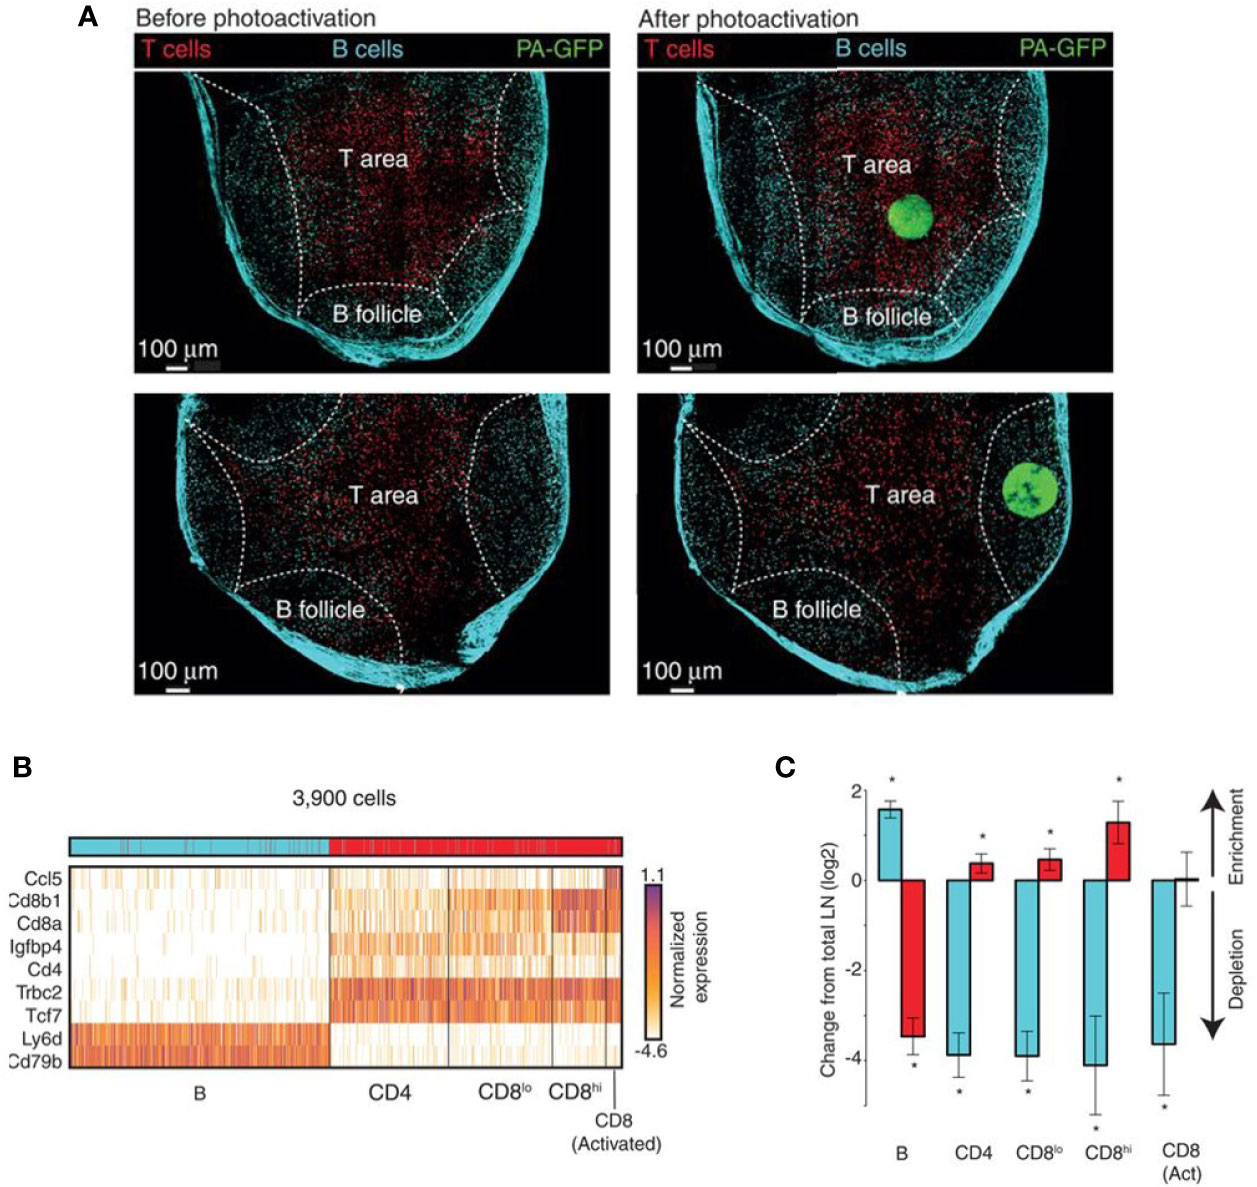
Figure 4 Example of NICHE-seq, assessing the cellular composition of defined niches (215). (A) Two-photon laser scanning microscopy (TPLSM) images of naïve inguinal lymph nodes from PA-GFP host mice before and after photoactivation (green). In red, adoptively transferred cells and cyan marks the T-cell area and the B follicles, respectively. (B) Expression profile from photoactivated B follicles (cyan) or T-cell areas (red). (C) Relative enrichment of different T-cell types [(B), CD4, CD8low, CD8high and CD8 Activated] in each subregion. *p < 0.05.
Three-dimensional distribution of transcripts in mouse model was achieved via STARmap. This technique integrates hydrogel-tissue chemistry, targeted signal amplification, and in situ sequencing (271, 272). STARmap was used to map 160 to 1,020 genes in 3D-intact tissue from brain mice. It successfully revealed molecularly defined gradient distribution and clustering of neuron subtypes (271).
Emerging Technologies for Multiplexed Molecular Profiling of the TME
The development of targeted therapies that may be efficacious in reprogramming the host immune response to recognize and eliminate tumor cells requires accurate identification of the various inflammatory cells and the special relationships between them within the TME. While currently established techniques enable routinely interrogation for up to two protein markers and evaluate their expression by visual examination, there is a growing need to reliably query many more targets (including both proteins and mRNAs) simultaneously in a given tissue specimen, in order to more precisely characterize the TME within and between tumors. Three new technologies (i.e not based on IHC or IF platforms) aimed at achieving these goals, including multiplexed ion beam imaging (MIBI), codetection by indexing (CODEX) and digital special profiling (DSP) are discussed below.
Multiplexed Ion Beam Imaging (MIBI) is a new technology platform, based on the CYTOF technique that preceded it, with the capability to detect and visualize a large number of protein in situ using secondary mass spectrometry to image antibodies tagged with isotopically pure elemental reporters (273). In contrast to standard multiplexed IHC protocols, sample preparation involves one-step, rather than sequential, application of a cocktail of elementally tagged antibodies (274). Samples are subsequently subjected to a rasterized oxygen duoplasmatron primary ion beam which liberates the lanthanide adducts of the bound antibodies as secondary ions and recorded by a TOF-MS. For each physical pixel in the analyzed tissue a mass spectrum is recorded and reflects the abundance of the queried antigens in that location. Recent publications (275) showed that the high-parameter capability, sensitivity and resolution of MIBI are well suited to understanding the complex tumor immune landscape including the spatial relationships of immune and tumor cells and expression of immunoregulatory proteins.
Co-Detection by Indexing (CODEX) is another novel technology for highly multiparametric in situ analysis of protein expression using tissue sections. One of the benefits of this technique is its use of a standard fluorescence microscope rather than an ion bean coupled to a mass spectrometer. But unlike the other platforms, published reports involving CODEX have only utilized frozen tissue cut onto glass slides rather than formalin fixed, paraffin embedded (FFPE) tissue sections. Like the other multiplexing methods, multiple antibodies are applied to a single tissue section for visualization simultaneously; however, the antibodies are tagged with unique DNA oligonucleotides, rather than fluorophores or rare metal elements and then crosslinked to their cellular targets. The process typically involves a single step of immunostaining with up to 40 antibodies each label with a distinct oligonucleotide tag. Visualization of a tissue-bound antibody requires specific PCR-based extension of each antibody bound oligo followed by annealing to a complementary strand of DNA coupled with specific fluorophore. This process is totally automated. However, since the analysis typically involves imaging two to five DNA tagged antibodies at the time a complete analysis of a single tissue requires approximately 30 h to image a 1 cm2 at 400 nm resolution. At the end of the multicycle rendering protocol each group of antibodies is visualized at a known predefined cycle of the indexing protocol and the multiplexed image is reconstructed (276).
The above mentioned techniques all use antibody-based methods to detect antibody-protein complexes in a tissue section. By contrast, digital special profiling (DSP) is a technology platform which allows, in a non-destructive manner, to profile multiple proteins and RNA from a wide variety of samples types including FFPE tissue sections (263, 277). Briefly, the method uses antibodies or mRNA probes coupled with UV photocleavable oligo tags for the digital detection of specific proteins and transcripts, respectively. After probe hybridization to slide-mounted tissue, UV light exposure is used to liberate the oligo-tags within a small predefined region of interest (ROI) (278–280). The probes are then automatically collected and quantified on a standard nCounter systems (for up to 800-plex profiling or mRNAs or proteins) or sequenced on NGS platform (potentially for unlimited multiplexing) and counts are mapped back to the tissue location, thus producing a spatially resolved digital profile of analyte (protein or mRNA) abundance within each ROI (278–280). Since the UV light is projected into the sample using two digital micromirror devices containing one-million semi-conductor-based micromirrors, a complete flexibility in the pattern of light utilized for high-plex digital profiling of the tissue can be reached. This mechanism results in diverse, automatically configurable, ROI profiles including 1) tumor only; 2) tumor microenvironment only; 3) unique cell types and rare cell features; 4) spatial gradient around cell features; 5) simple hand-selected geometric areas or a combination of the above methods (277). Furthermore the technology does not destroy the sample thus allowing for multiple profiling cycles of the same tissue section or subsequent DNA sequencing of the same section.
Reports of application of this technology to immuno-oncology clinical trial samples are emerging (278, 279). Immuno-oncology clinical trial samples examined using DSP have already provided key insights into the mechanism of action of combination therapy in melanoma (278, 279). While such sophisticated approaches to tissue evaluation of biomarkers hold tremendous promise they are nonetheless in their infancy and therefore come with one or more caveats at this time including costs, lack of standardization across labs, time and labor intensive protocols and lack of widespread availability.
In Vivo Imaging and Functional Imaging
In vivo imaging of T-cell distribution could be a powerful strategy to provide dynamic and spatial information regarding immune exclusion in tumors, during preclinical studies and in a clinical setting. Non-invasive cell tracking would allow us to monitor and quantify cellular delivery and effectiveness of immunotherapeutic approaches. A robust technique would also allow the selection of an appropriate dosing regimen. Over the years, significant developments in imaging immune cells were made and a variety of techniques is currently available for preclinical or clinical use.
Optical detection includes fluorescence or bioluminescence imaging and is mainly performed in preclinical settings, due to its limited depth of penetration. However, numerous whole-body techniques are routinely used in health care and can also be a valid tool to monitor immune cell kinetics: positron emission tomography (PET), single photon emission computed tomography (SPECT), computed tomography (CT) and magnetic resonance imaging (MRI). These techniques require in-vitro or in-vivo labeling of T-cells (281). During in-vitro labeling, cells are harvested, processed, and then infused back into the model organism or patient. Labeling procedures can be classified into two types: direct and indirect (282). Direct labeling is easy to perform and radiotracers, MRI-based contrast agents or fluorophores are internalized by the immune cells. This technique does not allow long term monitoring of cells as mitotic events result in the dilution of the signal. Tracer uptake, retention capacity and changes in cellular features, due to the internalization of the probe, are further drawbacks of direct labeling (281, 283).
Indirect labeling requires genetic modification via stable transfection of cells with a reporter gene such as luciferases or fluorescent proteins, which do not require an additional tracer. Other reporter genes such as sodium iodide symporter (NIS), or herpes simplex virus–thymidine kinase (HSV-TK), require further probes for imaging. This approach is preferred for long term imaging because the reporter gene is inherited, but genetic manipulation raises safety concerns (284–287).
In vivo labeling occurs directly in the organism and requires the injection of radiolabeled antibodies into the body, to target immune cells. A two-step approach has also been developed, where bispecific antibodies, containing a binding domain for the epitope and one for the tracer, are injected into the organism. Labeled probes are then injected, in order to bind the previously administered antibody. This method allows the use of safer isotopes, with a faster radioactive decay (281, 282).
Optical Detection Techniques
Intravital microscopy includes a variety of approaches that allow one to distinguish individual cells from tissues and, therefore, investigate immune cell kinetics in vivo (288, 289). Optical probes allow for repeated scanning of tissues, providing a spatial and temporal dimension to cellular interactions. For example, intravital microscopy enabled visualization of the dynamic interactions between cancer cells and immune cells in the TME (290). It has also been used to decipher the behavior of B-cells and T-cells in germinal centers of lymph nodes (291).
Currently, the two main tools for intravital microscopy are the confocal microscope and the multiphoton microscope. Despite their potential for high-resolution and low phototoxicity, optical detection techniques are used exclusively in preclinical studies because of their low penetration depth (1–2 mm) and risk of photobleaching. Confocal microscopes have reduced costs but increased autofluorescence and scattering, therefore the imaging depth is in the range of 20 to 50 µm (289, 292). Tavri et al. (293) used fluorescence microscopy to track fluorophore-labeled, tumor-targeted natural killer cells to human prostate cancer xenografts.
In contrast, multilaser scanning microscopy uses tunable titanium-sapphire lasers that operate in the near infrared range (NIR), allowing for superior tissue penetration (200 – 300 µm). Increased imaging depths (500 µm) can also be obtained in brain and cleared tissues (294, 295). Two-photon laser scanning microscopy (TPLSM) requires simultaneous excitation by two photons with longer wavelengths than the emitted light. This particular type of excitation suppresses the background noise and reduces photobleaching. Moreover, using NIR for excitation also minimizes scattering in the tissue (296–298).
TPLSM was used to visualize the effects of anti-CD19 CAR-T treatment on intracranial primary central nervous system lymphoma (PCNSL), in the same animal over weeks (291). CAR-T-cells infiltrated the tumor inducing regression of PCNSL and increased long term survival. Multiphoton intravital microscopy was also used in lymph nodes, to show import dynamics of the nuclear factor of activated T-cells (NFAT) in the cells. A fluorescently labeled NFAT reporter was used in combination with the nuclear marker histone protein histone 2B (H2B) (299). Stoll et al. (300) developed a protocol for extended four-dimensional confocal imaging of T-cells and dendritic cells, reporting dynamic visualization of antigen-specific T-cells interacting with dendritic cells within intact explanted mouse lymph nodes. Two-photon laser microscopy was also performed to investigate the dynamic behavior of individual T-cells within intact lymph nodes (301, 302) (Figure 5). Finally, Bousso et al. (303), performed real-time analysis of the cellular contacts made by developing thymocytes undergoing positive selection in a three-dimensional thymic organ culture.
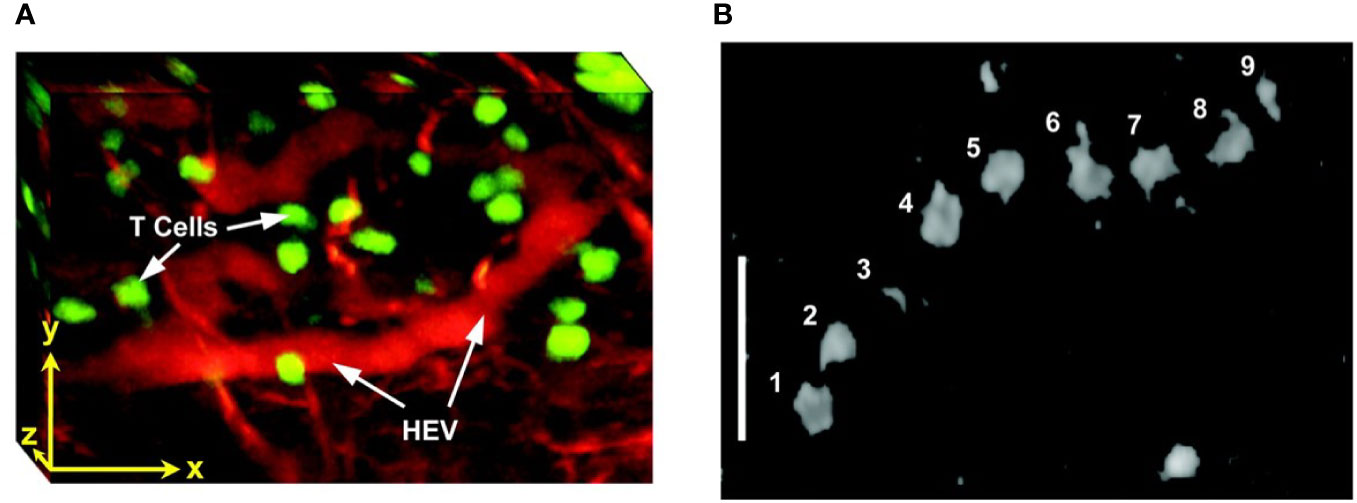
Figure 5 Intravital two photon imaging of naïve T-cells in lymph nodes (302). (A) 3D reconstruction representing 85 x 120 x 75 μm of the T-cell area. Fluorescently labeled T-cells (green) are observed in the proximity of presumptive high endothelial venules (red), identified by i.v. injection of tetramethylrhodamine dextran. Scale bar 30 μm in all axes. (B) Video-rate imaging of a T-cell flowing in a small vessel within a T-cell region of the node. Image is a superposition of nine consecutive video frames and shows progression of a single labeled T-cell traveling at about 0.03 cm/s within a blood vessel. Scale bar 25 μm. Copyright (2003) National Academy of Sciences, U.S.A.
Bioluminescence (BLI) enables long-term cell tracking, through reporter enzymes such as firefly luciferase, renilla luciferase or bacterial luciferase (304, 305). BLI has higher sensitivity than fluorescence imaging due to the absence of autofluorescence generated by excitation light. BLI and multilaser scanning microscopy were successfully adopted to investigate small populations of T-cells: less than 10.000 cells in live animals (306). Chewning et al. (307) created a novel transgenic mouse model for in vivo tracking of CD4+ T-cells, using a human CD2 mini-gene to direct luciferase expression specifically to T-cell compartments. Kim et al., used BLI to show that tumor-specific T-cells upregulate IL-2 expression in hypoxic conditions in a model of human B cell lymphoma (308). BLI was also used to track migration of immune cells to sites of inflammation (306, 309).
Cerenkov luminescence imaging (CLI) is based on the detection of visible photons emitted by Cerenkov radiation. Cerenkov luminescence is emitted when a charged particle traverses a dielectric medium with a velocity greater than the phase velocity of light in the medium (310–312). CLI has been performed to optically monitor the biodistribution of 32P-ATP labeled T lymphocytes, in small rodents, in vivo (313, 314). Results were comparable to those obtained with radioluminescence imaging and T-cell localization in the tumor mass was definitively confirmed by flow cytometry (313).
Clinically Applicable Detection Techniques
Digital Histopathology
Histopathology slides are available for almost any patient with a solid tumor, but immune topographies are currently not assessed in clinical routine. While subjective visual examination of tissue slides can be used to roughly quantify, computer-based approaches are ultimately much more scalable and objective. In several countries, digitization efforts for routine histopathology are underway (315). Once this digital infrastructure is established, development and refinement of histopathology-based Immune Topography biomarkers could be accelerated and in turn, clinical rollout of these biomarkers would be markedly facilitated.
Magnetic Resonance Imaging
MRI is a routinely used, non-invasive diagnostic technique that provides soft tissue contrast with high anatomical resolution. It is considered safer than PET, as it does not use ionizing radiation. Drawbacks of MRI include high instrumentation costs and relatively low sensitivity (316, 317).
MRI can complement PET imaging, co-registering soft-tissue anatomy and multimodal imaging for T-cell tracking is becoming more common. Multimodal imaging allows different imaging methods to be combined simultaneously, providing a multi-layered and complete information regarding the dynamics of immune cells (281, 318, 319).
Standard MRI is based on the detection of signals emitted by protons (1H) that are part of the water present in human tissues. Due to the molecular composition of tissue, absorption of a specific electromagnetic impulse generates signals of different intensities. In addition to 1H, MRI can be performed on other isotopes such as 31P, 15N, 13C, 23Na and 19F (317, 320). In some cases these methods are considered less efficient because of the low abundance of these chemical elements in vivo, leading to poor signal intensity. 19F MRI is gaining more interest as a tool to investigate cell behavior, driven by advances in MRI technology and scan protocols. Indeed, 19F MRI provides images with high signal-to-noise ratio and current 1H MRI instruments require minimal hardware upgrades to acquire 19F-based images (321, 322). However, 19F MRI has a detection limit of approximately 103 – 105 cells per voxel in vivo (323).
Magnetic nanoparticles (i.e. iron oxides, gadolinium and manganese chelates) can label cells by entering the cytoplasm, binding to the membrane or to reporter proteins. Labeled immune cells have been used to monitor cell interactions in vivo and to dissect immunological processes in deep tissue areas. One of the most extensively used nanoparticles in the study of T lymphocytes behavior is superparamagnetic iron oxide (SPIO) (324, 325). The long-term recruitment of cytotoxic T-cells to tumors was studied using a dextran coated SPIO particle, derivatized with a peptide sequence from the HIV-tat protein (326). Wu et al. have developed negatively charged superparamagnetic iron oxide (PAsp‐PCL/SPIO) nanoclusters to monitor the migration of dendritic cells into lymphoid tissues in vivo and correlated this with immunotherapy results in mice (327). Tremblay et al., used CD8+ cytotoxic T-cells, regulatory T-cells and myeloid derived suppressor cells labeled with SPIO particles, to monitor the efficacy of DepoVax in mice implanted with HPV-based cervical cancer (328).
Cell labeling probes, based on perfluorocarbon nanoemulsions paired with 19F MRI detection, have also been widely used to monitor immune cells. Fluorine-dense perfluorocarbon (PFC) nanoemulsions display hydrophobic and lipophobic characteristics and have been engineered to be endocytosed, even by non-phagocytic cells in culture (329). Commonly used PFC include perfluoropolyether (PFPE), perfluoro-15-crown-5-ether (PCE) and perfluorooctyl bromide (PFOB) (323, 330). Despite a lack of evidence supporting the exocytosis or degradation of PFCs, once internalized in the cells, mitotic events lead to the dilution of the signal limiting long- term studies. Nanoparticles are usually cleared by the reticuloendothelial system, in particular from the Kupffer cells in the liver (331, 332).
Chapelin et al. used 19F MRI to monitor CAR-T biodistribution and immunotherapy efficacy on immunocompromised mice bearing subcutaneous human U87 glioblastomas (333). Another example includes the study performed by Gonzales et al., whereby T-cells were labeled with PFC in vitro and their distribution detected by 19F MRI in vivo, in melanoma-bearing mice (334). A clinical trial was performed in 2014 to investigate the use of a PFC nanoemulsion in the detection of immunotherapeutic dendritic cells delivered to colorectal adenocarcinoma patients. Composite 19F/1H overlay images were created and showed that, despite the lack of treatment efficacy, 19F MRI enabled visualization of injected cells in patients using a clinical scanner within acceptable scan times (335).
Immuno-PET
Immuno-PET is a sensitive and non-invasive method used to investigate immune cell interactions in clinical settings, allowing quantification of T-cell dynamics. Indeed, immuno-PET can quantify viability and retention of T-cells in the primary tumor mass and secondary lesions, which may provide insights into immunotherapy efficacy. Clinical imaging could be used to monitor steps of T-cell proliferation, trafficking and infiltration and give insights into mechanistic aspects of the process and effectiveness of induced T-cell response. Although PET and SPECT possess excellent signal-to-noise ratio and unlimited depth penetration, they provide limited anatomical information (336, 337).
Immuno-PET combines antibody specificity against immune cells with PET, which uses radioactive tracers to visualize human tissues. Antibodies recognizing specific features of immune cells are coupled with radioactive isotopes such as 11C, 18F, 68Ga, 44Sc, 64Cu, 89Zr, 124I. Radionuclides need to be covalently bound to the antibody and remain kinetically and thermodynamically stable, in order to obtain good quality images. Therefore, their chemical properties and half-lives are fundamental parameters to consider when designing a study (338, 339).
Using monoclonal antibodies in immuno-PET produces images of optimal quality but, due to their size (~150 kDa), it can take up to a week to reach the imaging site after injection (Figure 6) (340, 341). Due to slower circulation and clearance times, radionuclides with longer half-lives are required for the labeling of monoclonal antibodies (89Zr, 124I). Although radionuclides can provide information over long periods of time, they constitute a biohazard as patients are exposed to higher radiation doses. Moreover, the size of monoclonal antibodies exceeds the clearance cut-off value of glomerular filtration (60 kDa), therefore their clearance occurs in the liver, thus precluding its imaging. Smaller molecules have been developed over the years (minibodies, diabodies, single-chain variable region fragments, nanobodies, affibodies), which still retain the specificity of the antibodies and have more desirable pharmacokinetic properties and deeper tissue penetration (Figure 6).
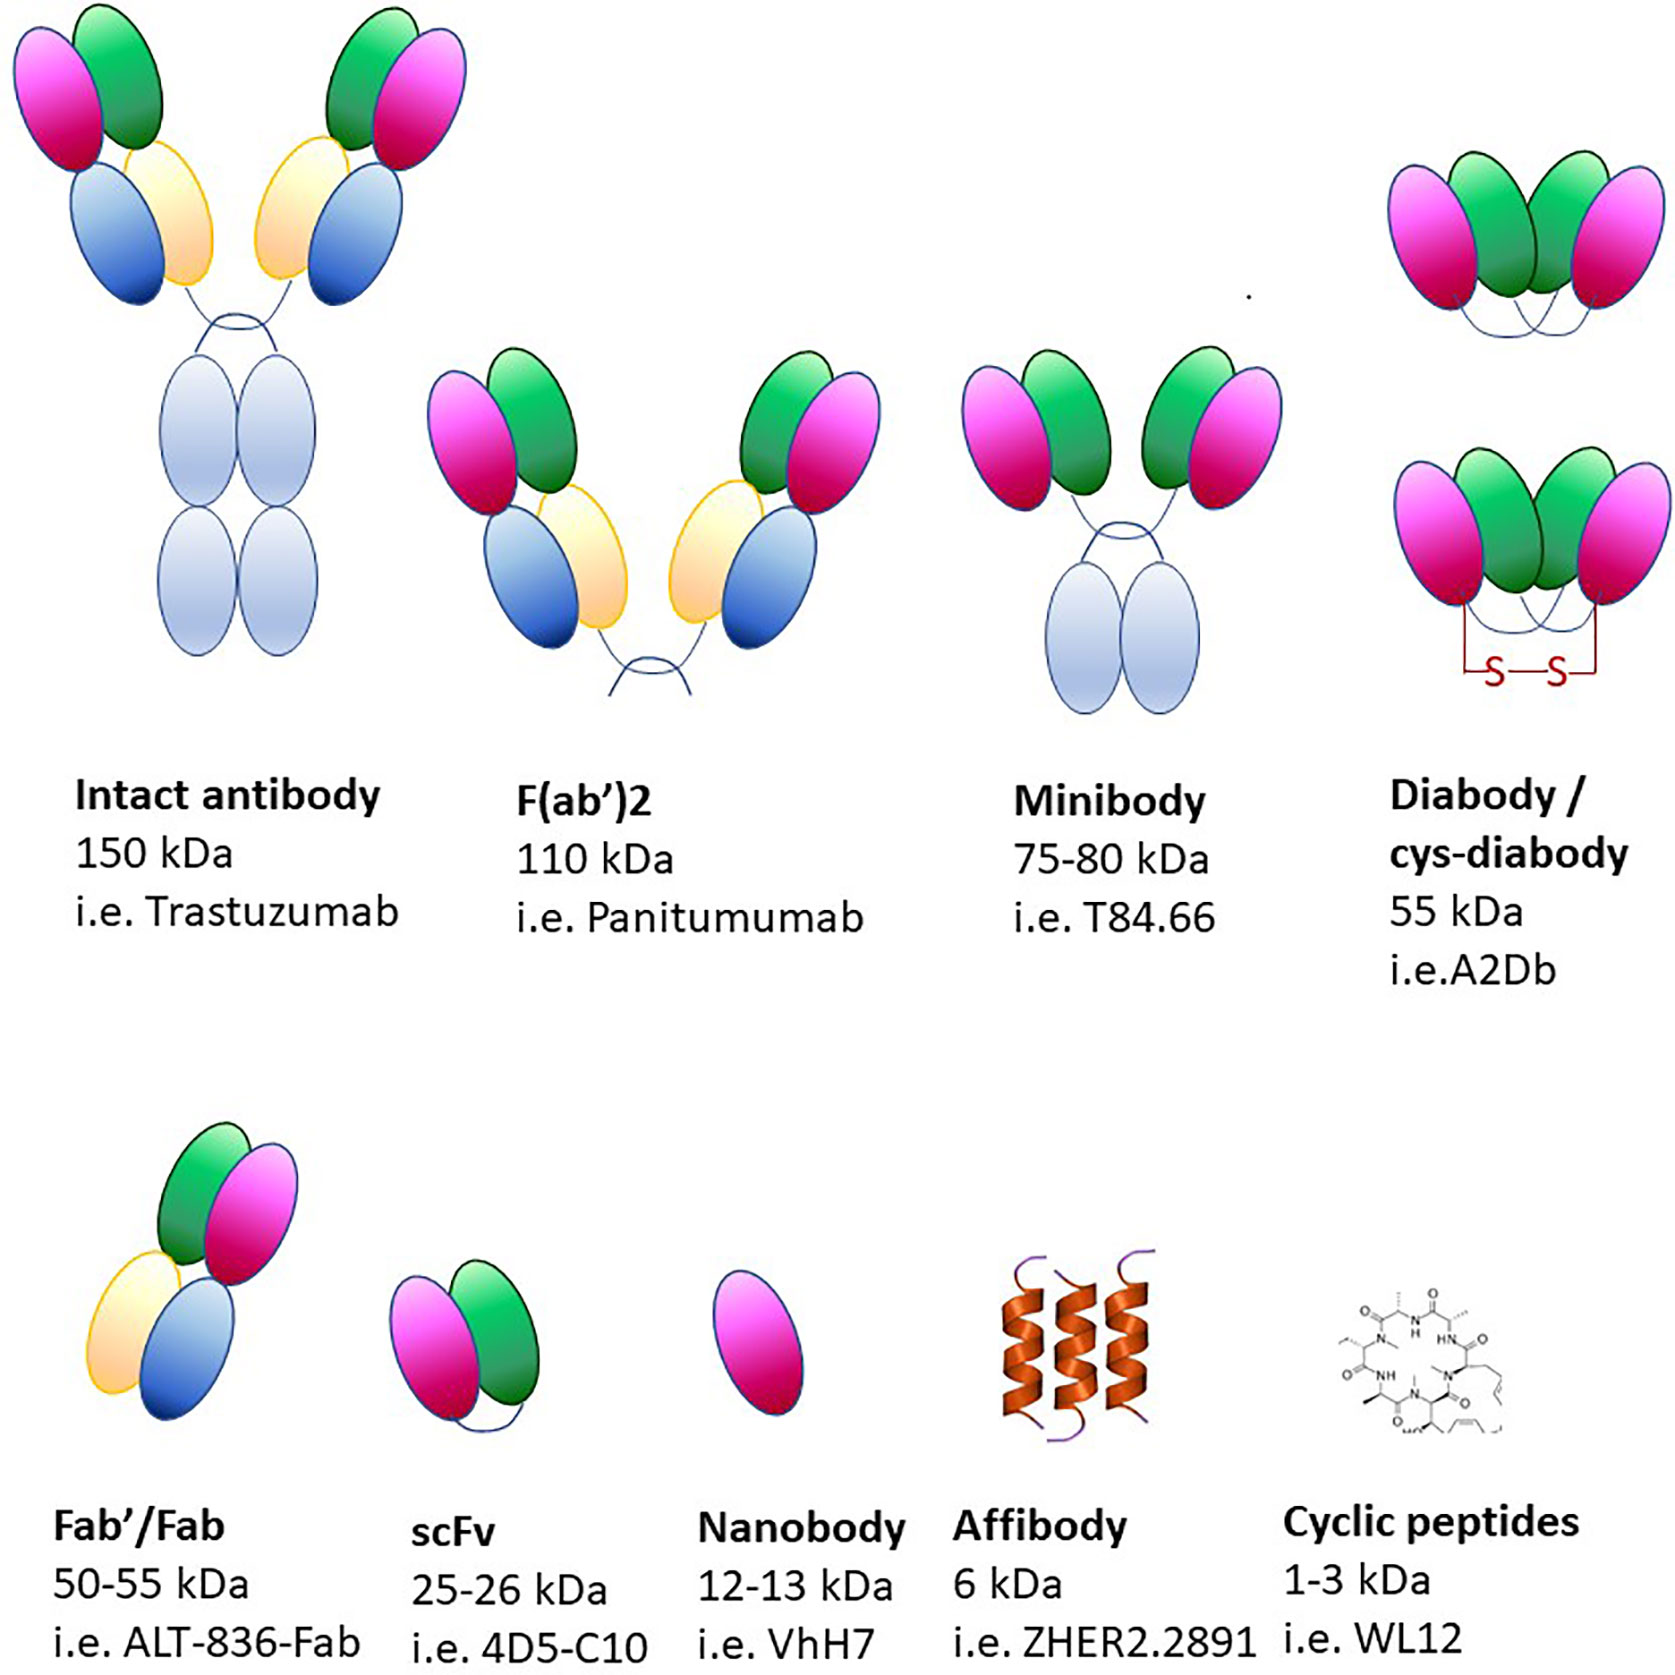
Figure 6 Protein-based scaffolds for targeting cell antigens in vivo.
Adverse reactions to non-human antibodies are rare but they comport a safety risk for the patient, therefore it is pivotal to ensure that tracking antibodies have minimal pharmacological or toxicological effects. To minimize the risk of adverse reactions, antibodies of camelids, cartilaginous fish or human are often used (342, 343). Camelid antibodies are significantly smaller than standard antibodies and only consist of IgG heavy chains (344). Smaller antibodies can be conjugated with shorter-lived nuclides such as 18F, 64Cu, 44Sc and 68Ga. Antibody fragments contain only the targeting and binding components with their sizes ranging from 7 to 100 kDa. Another category includes affibodies, which are constituted of three alpha helices (~6–7 kDa) resulting in high contrast PET images that can be obtained within hours of their administration (339, 345, 346).
Diabodies labeled with 89Zr or 64Cu were used in specific targeting of CD4+ and CD8+ receptors resulting in targeting of T lymphocytes in vivo (347, 348). Tavare et al. showed that engineered anti-CD8+ minibodies were applicable for immuno-PET imaging of endogenous CD8+ T-cells in a murine model system (349). Nanobodies were also used to investigate the distribution of intratumoral CD8+ T-cells and CD11b+ myeloid cells in a colorectal mouse adenocarcinoma model. Response to anti-PD-1 treatment was assessed and showed the difference in CD8+ and CD11b+ cells infiltration, in responding and non responding tumors. Only the tumors that were completely infiltrated by CD8+ T-cells went into full remission (350). Larimer et al., synthesized an anti-CD3 imaging agent labeled with 89Zr, to predict tumor response to anti-CTLA-4 treatment in a murine tumor xenograft model of colon cancer. Higher presence of CD3+ TILs, revealed by an increased uptake of the radiotracer, correlated with responsive tumors (351).
Reporter genes provide another strategy to target antibodies for immuno-PET. Reporter genes are transfected or transduced into cultured cells and they encode for a protein specifically targeted by the radiolabeled tracker. While genetic manipulation is considered a biohazard, modern gene-editing technologies have developed safe harbor locations and reduced the risk of mutagenesis. Reporter genes have been used to monitor cell-based immunotherapies in preclinical and clinical studies (338, 352, 353). In a study with glioblastoma patients, cytotoxic T lymphocytes (CTLs) were engineered to express the herpes simplex virus type 1 thymidine kinase (HSV1-tk) alongside a glioblastoma-targeting interleukin-13 zetakine (353, 354). Immuno-PET coupled to MRI provided information regarding the locations of CTLs in the glioblastomas together with detailed anatomical context (353). The expression of a foreign protein can be recognized by a patient’s immune system, causing adverse reactions. To avoid an immune response against the foreign reporter protein, endogenous human reporters have been designed. However, these probes trade off immunogenicity for reduced contrast. The sodium iodide symporter (NIS) is considered one of the most promising reporters for preclinical and clinical studies (284, 355, 356). Endogenous expression of NIS is confined primarily to salivary and lacrimal glands, lactating mammary glands, the thyroid and stomach. NIS probes have been used to monitor immune cells, viral vectors, oncolytic viruses, tumor cells and cellular therapies by PET and SPECT in both animal models and patients (284).
Antibodies engineered for use in immuno-PET can target a variety of epitopes on T lymphocytes. When naïve T-cells are activated, several cell surface markers are upregulated. However, expression of these markers does not imply, per se, cytotoxic effector functions. Metabolic activity is modified in active T-cells including glycolysis and the upregulation of nucleic acid metabolism. Therefore, specific enzymes involved in the metabolic pathways constitute good tracking candidates. Finally, the T-cell effector function can also be targeted (318, 338).
Surface markers used for activated T-cells include interleukin-2 receptor (IL-2R), OX40 (CD134), TCR complex and co-receptors CD3, CD4, and CD8. Activated T lymphocytes present high levels of IL-2R on their surface and several studies investigated the distribution of such immune cells via IL-2 labeling, with PET and SPECT.
For example, in primary melanoma [99mTc]Tc-HYNIC-IL-2 accumulation was observed at metastases. 18F-labeled IL-2 was developed as a PET tracer and its uptake was shown to increase upon tumor treatment (357, 358). Clinical trial NCT02922283, completed in February 2020, aimed to study the biodistribution and kinetics of the tracer 18F-FB-IL2 in patients with metastatic melanoma. Results have not yet been published. The activation marker OX40 has also been targeted and imaged with PET using a specific 64Cu-conjugated murine antibody (359). Humanized OX40 agonist monoclonal antibodies are currently being tested in early phase clinical trials.
T-cell receptors (TCR) present a constant membrane turnover that leads to internalization and accumulation of the anti-TCR probe. Studies have tracked human T-cells using 89Zr labeled anti-mouse TCR. A highly sensitive imaging approach was proposed by Klar et al., targeting the TCR2.5D6 on T-cells, which recognize a peptide expressed on leukemia cells (360). T-cell co-receptor CD3 was targeted to monitor anti-CTLA-4 treatment in colon cancer xenograft mouse models. Anti-CD3 antibody labeled with 89Zr was used to quantify T-cell infiltration revealing that tumor regression correlated with high levels of infiltration (351). Anti-CD4 and anti-CD8 labeled with 89Zr or 64Cu have been used to monitor T-cells in mice and human (361–364). Moreover, anti-CD8 minibodies are currently under investigation in clinical trials (NCT03107663, NCT03802123, NCT03610061).
Cell surface markers may present different expression patterns during the progression of the disease therefore, to obtain more comprehensive information, multiple markers should be tested concomitantly.
Metabolic changes during T lymphocyte activation can be monitored with labeled probes including amino acids, hormones, sugars or nucleosides (Table 2). As previously mentioned, activated T-cells switch to glycolytic metabolism and upregulate the intake of substrates.
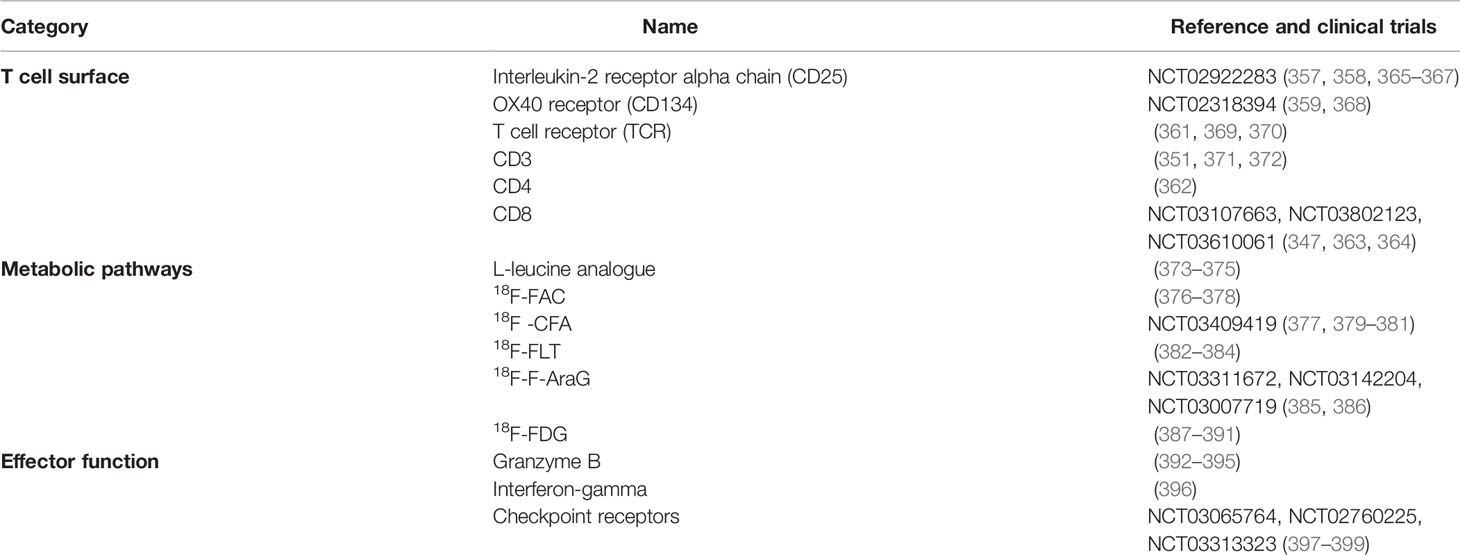
Table 2 Markers for T-cells imaging.
Fluciclovine 18F-FACBC, an analog of L-leucine, is a radiolabeled amino acid that is imported into activated T-cells due to upregulation of the amino acid transporter ASCT2 and LAT-1 (373–375, 400, 401). Labeled substrates for enzymes involved in the deoxyrubonucleoside salvage pathway have been developed such as 18F-FAC, 18F -CFA, 18F-FLT, and 18F-F-AraG (318).
18F-FAC is a labeled deoxycytidine analog, with high-affinity for the enzyme deoxycytidine kinase (dCK). This tracer is being investigated in an early phase clinical trial (NCT03409419), that is recruiting patients with metastatic melanoma and who are undergoing TIM-3 targeted immunotherapy. 18F-CFA is also a substrate for dCK and is studied as a potential cancer biomarker for treatment stratification and monitoring. 18F-FLT is a thymidine analog that is trapped intracellularly due to its phosphorylation by thymidine kinase 1. It is used to monitor T-cell activation and cancer cell proliferation in medical practice (376, 379, 382, 383).
Arabinosyl guanine is a molecule with specific toxicity to T lymphoblastoid cells and T-cells. AraG prodrug has been used in patients with T-cell acute lymphoblastic leukemia and T-cell lymphoblastic lymphoma (402). Engineered AraG leads to the development of a 18F-F-AraG probe that is retained by primary T-cells and it is a substrate for deoxyguanosine kinase. Such a tracker could provide information about T-cell dynamics in the TME and other pathologies involving the immune system (337, 385). A clinical trial to assess 18F-F-AraG biodistribution in cancer patients who are expected to undergo immunotherapy or radiation therapy is currently recruiting (NCT03142204). A recent study demonstrated that 18F-F-AraG PET imaging could be used to report immune activation in vivo, in mice with rheumatoid arthritis (403).
Finally, the metabolic tracer 18F-FDG measures the rate of glycolysis in active T lymphocytes, due to the upregulation of the glucose transporters GLUT isotypes. However, tumor cells also present increased rates of glycolysis, therefore imaging can lead to false positive signals (338, 387, 388). The increase in substrate uptake is similar between cancer cells and T-cells, therefore metabolic radiotracers often lead to difficulties in image interpretation.
In order to specifically monitor active T lymphocytes, probes targeting their effector functions have been developed (Table 2). For example, granzyme B, released by CD8+ T-cells and natural killer cells, is considered one of the main mechanisms through which T-cells mediate cancer cell death (404). A recent study tested the probe [68Ga]Ga-NOTA-GZP that targets murine or human granzyme expression. Imaging made it possible to differentiate responders from non-responders, within immunotherapy-treated mice (392). The human probe showed high specificity in human samples, revealing a candidate predictive biomarker for cancer immunotherapy (392). Interferon-gamma (IFN-γ) is a pleiotropic molecule implicated in immune surveillance, playing a role in pro-apoptotic and antitumor mechanisms. However, evidence points to a protumorigenic role for IFN-γ in downregulating major histocompatibility complexes and upregulating checkpoint inhibitors. Although clinical trials assessing the efficacy of anti-cancer therapies based on IFN-γ reported limited success, IFN-γ-mediated response is still correlated with a positive patient prognosis (405). Gibson et al., used an 89Zr-labeled anti-IFNγ probe to predict immunotherapy response after HER2/neu vaccination in mouse mammary tumors. Immuno-PET demonstrated that IFN-γ levels in situ, after vaccination, were inversely correlated with tumor growth rate (396). Therefore, targeting soluble cytokines by immuno-PET could be an interesting strategy to quantify immune response directly in situ and predict the response to immunotherapy.
Outlook
A Comprehensive Biological Theory of Immune Phenotypes in Solid Tumors
A current major challenge in immunotherapy is the increase of its therapeutic potential in solid tumors. Preclinical research demonstrated the existence of a variety of determinants that play a role in shaping the TME, affecting immunotherapy response. The dynamics and distribution of these factors probably change during time and may also vary according to tumor type.
Further studies are required to understand the spatial and temporal distribution of mechanisms involved in the immune exclusion phenomenon and their interdence. Modern techniques allow high-throughput analysis of immune cell distribution ex vivo and in vivo. It would be interesting to correlate tumor stages with degree of immune infiltration and determinants of immune exclusion, in a pan-cancer investigation. This correlation would provide information on the mechanism(s) of immune exclusion, allowing to integrate the different determinants into a unified ‘Theory of Everything.’ Moreover, a comprehensive analysis would also provide insights into approaches that should be adopted in order to improve the efficiency of immunotherapy and the rationale for innovative translational combinatorial treatments.
Clinical Translation of Immune Topographies
Ultimately, scientific insight into Immune Topographies in solid tumors could lead to a benefit of cancer patients. In particular, determining Immune Topographies at baseline (before starting a systemic treatment such as immunotherapy or chemotherapy) could inform physicians about the chances of treatment response. Thus, Immune Topographies could help to choose one of several available treatment options for a given patient. In addition, dynamically observing Immune Topographies during treatment might enable oncologists to adjust treatment accordingly. Compared to other biomarkers in oncology, Immune Topographies are intuitively understandable, linked to biological processes of demonstrated relevance and are comparatively easy to measure. However, clinical implementation will depend on larger-scale retrospective analysis and prospective clinical trials evaluating the utility of Immune Topographies for managing cancer treatment.
Author Contributions
All authors contributed equally. All authors contributed to the article and approved the submitted version.
Conflict of Interest
VP and FM were employed by the company Refuge Biotechnologies. AC was employed by ESSA Pharmaceuticals.
The remaining author declares that the research was conducted in the absence of any commercial or financial relationships that could be construed as a potential conflict of interest.
References
1. Guo ZS. The 2018 Nobel Prize in medicine goes to cancer immunotherapy (editorial for BMC cancer). BMC Cancer (2018) 18:1086. doi: 10.1186/s12885-018-5020-3
2. Maude SL, Frey N, Shaw PA, Aplenc R, Barrett DM, Bunin NJ, et al. Chimeric antigen receptor T cells for sustained remissions in leukemia. N Engl J Med (2014) 371:1507–17. doi: 10.1056/NEJMoa1407222
3. Fournier C, Martin F, Zitvogel L, Kroemer G, Galluzzi L, Apetoh L. Trial Watch: Adoptively transferred cells for anticancer immunotherapy. Oncoimmunology (2017) 6:e1363139. doi: 10.1080/2162402X.2017.1363139
4. Ma S, Li X, Wang X, Cheng L, Li Z, Zhang C, et al. Current Progress in CAR-T Cell Therapy for Solid Tumors. Int J Biol Sci (2019) 15:2548–60. doi: 10.7150/ijbs.34213
5. Brentjens RJ, Rivière I, Park JH, Davila ML, Wang X, Stefanski J, et al. Safety and persistence of adoptively transferred autologous CD19-targeted T cells in patients with relapsed or chemotherapy refractory B-cell leukemias. Blood (2011) 118:4817–28. doi: 10.1182/blood-2011-04-348540
6. Turtle CJ, Hanafi L-A, Berger C, Gooley TA, Cherian S, Hudecek M, et al. CD19 CAR-T cells of defined CD4+:CD8+ composition in adult B cell ALL patients. J Clin Invest (2016) 126:2123–38. doi: 10.1172/JCI85309
7. Louis CU, Savoldo B, Dotti G, Pule M, Yvon E, Myers GD, et al. Antitumor activity and long-term fate of chimeric antigen receptor-positive T cells in patients with neuroblastoma. Blood (2011) 118:6050–6. doi: 10.1182/blood-2011-05-354449
8. Ahmed N, Brawley VS, Hegde M, Robertson C, Ghazi A, Gerken C, et al. Human Epidermal Growth Factor Receptor 2 (HER2) -Specific Chimeric Antigen Receptor-Modified T Cells for the Immunotherapy of HER2-Positive Sarcoma. J Clin Oncol (2015) 33:1688–96. doi: 10.1200/JCO.2014.58.0225
9. Hodi FS, O’Day SJ, McDermott DF, Weber RW, Sosman JA, Haanen JB, et al. Improved survival with ipilimumab in patients with metastatic melanoma. N Engl J Med (2010) 363:711–23. doi: 10.1056/NEJMoa1003466
10. Rizvi NA, Hellmann MD, Snyder A, Kvistborg P, Makarov V, Havel JJ, et al. Cancer immunology. Mutational landscape determines sensitivity to PD-1 blockade in non-small cell lung cancer. Science (2015) 348:124–8. doi: 10.1126/science.aaa1348
11. Ansell SM, Lesokhin AM, Borrello I, Halwani A, Scott EC, Gutierrez M, et al. PD-1 blockade with nivolumab in relapsed or refractory Hodgkin’s lymphoma. N Engl J Med (2015) 372:311–9. doi: 10.1056/NEJMoa1411087
12. Brahmer JR, Tykodi SS, Chow LQM, Hwu W-J, Topalian SL, Hwu P, et al. Safety and activity of anti-PD-L1 antibody in patients with advanced cancer. N Engl J Med (2012) 366:2455–65. doi: 10.1056/NEJMoa1200694
13. Chow LQM, Haddad R, Gupta S, Mahipal A, Mehra R, Tahara M, et al. Antitumor Activity of Pembrolizumab in Biomarker-Unselected Patients With Recurrent and/or Metastatic Head and Neck Squamous Cell Carcinoma: Results From the Phase Ib KEYNOTE-012 Expansion Cohort. J Clin Oncol (2016) 34:3838–45. doi: 10.1200/JCO.2016.68.1478
14. Powles T, Eder JP, Fine GD, Braiteh FS, Loriot Y, Cruz C, et al. MPDL3280A (anti-PD-L1) treatment leads to clinical activity in metastatic bladder cancer. Nature (2014) 515:558–62. doi: 10.1038/nature13904
15. Feng K, Guo Y, Dai H, Wang Y, Li X, Jia H, et al. Chimeric antigen receptor-modified T cells for the immunotherapy of patients with EGFR-expressing advanced relapsed/refractory non-small cell lung cancer. Sci China Life Sci (2016) 59:468–79. doi: 10.1007/s11427-016-5023-8
16. Barrueto L, Caminero F, Cash L, Makris C, Lamichhane P, Deshmukh RR. Resistance to Checkpoint Inhibition in Cancer Immunotherapy. Transl Oncol (2020) 13:100738. doi: 10.1016/j.tranon.2019.12.010
17. Cha H-R, Lee JH, Ponnazhagan S. Revisiting Immunotherapy: A Focus on Prostate Cancer. Cancer Res (2020) 80:1615–23. doi: 10.1158/0008-5472.CAN-19-2948
18. Riedl JM, Stotz M, Gerger A. Role of immune checkpoint inhibitors in gastrointestinal cancer treatment. Memo Magazine Eur Med Oncol (2019) 12:71–6. doi: 10.1007/s12254-019-0470-0
19. Shah AB, Sommerer KR, Almhanna K. Immune checkpoint inhibitors in gastrointestinal malignancies: what can we learn from experience with other tumors? Transl Gastroenterol Hepatol (2019) 4:73. doi: 10.21037/tgh.2019.09.04
20. Hegde PS, Chen DS. Top 10 Challenges in Cancer Immunotherapy. Immunity (2020) 52:17–35. doi: 10.1016/j.immuni.2019.12.011
21. AbdulJabbar K, Raza SEA, Rosenthal R, Jamal-Hanjani M, Veeriah S, Akarca A, et al. Geospatial immune variability illuminates differential evolution of lung adenocarcinoma. Nat Med (2020) 26:1054–62. doi: 10.1038/s41591-020-0900-x
22. Kather JN, Halama N, Jaeger D. Genomics and emerging biomarkers for immunotherapy of colorectal cancer. Semin Cancer Biol (2018) 52:189–97. doi: 10.1016/j.semcancer.2018.02.010
23. Fridman WH, Pagès F, Sautès-Fridman C, Galon J. The immune contexture in human tumours: impact on clinical outcome. Nat Rev Cancer (2012) 12:298–306. doi: 10.1038/nrc3245
24. Kather JN, Suarez-Carmona M, Charoentong P, Weis C-A, Hirsch D, Bankhead P, et al. Topography of cancer-associated immune cells in human solid tumors. eLife (2018) 7:e36967. doi: 10.7554/elife.36967
25. Galon J, Costes A, Sanchez-Cabo F, Kirilovsky A, Mlecnik B, Lagorce-Pagès C, et al. Type, density, and location of immune cells within human colorectal tumors predict clinical outcome. Science (2006) 313:1960–4. doi: 10.1126/science.1129139
26. Pai SI, Cesano A, Marincola FM. The Paradox of Cancer Immune Exclusion: Immune Oncology Next Frontier. Cancer Treat Res (2020) 180:173–95. doi: 10.1007/978-3-030-38862-1_6
27. Erdag G, Schaefer JT, Smolkin ME, Deacon DH, Shea SM, Dengel LT, et al. Immunotype and immunohistologic characteristics of tumor-infiltrating immune cells are associated with clinical outcome in metastatic melanoma. Cancer Res (2012) 72:1070–80. doi: 10.1158/0008-5472.CAN-11-3218
28. Pagès F, Mlecnik B, Marliot F, Bindea G, Ou F-S, Bifulco C, et al. International validation of the consensus Immunoscore for the classification of colon cancer: a prognostic and accuracy study. Lancet (2018) 391:2128–39. doi: 10.1016/S0140-6736(18)30789-X
29. Tsujikawa T, Kumar S, Borkar RN, Azimi V, Thibault G, Chang YH, et al. Quantitative Multiplex Immunohistochemistry Reveals Myeloid-Inflamed Tumor-Immune Complexity Associated with Poor Prognosis. Cell Rep (2017) 19:203–17. doi: 10.1016/j.celrep.2017.03.037
30. Salerno EP, Bedognetti D, Mauldin IS, Deacon DH, Shea SM, Pinczewski J, et al. Human melanomas and ovarian cancers overexpressing mechanical barrier molecule genes lack immune signatures and have increased patient mortality risk. Oncoimmunology (2016) 5:e1240857. doi: 10.1080/2162402X.2016.1240857
31. Turan T, Kannan D, Patel M, Matthew Barnes J, Tanlimco SG, Lu R, et al. Immune oncology, immune responsiveness and the theory of everything. J Immunother Cancer (2018) 6:50. doi: 10.1186/s40425-018-0355-5
32. Bedognetti D, Ceccarelli M, Galluzzi L, Lu R, Palucka K, Samayoa J, et al. Toward a comprehensive view of cancer immune responsiveness: a synopsis from the SITC workshop. J Immunother Cancer (2019) 7:131. doi: 10.1186/s40425-019-0602-4
33. Maoz A, Dennis M, Greenson JK. The Crohn’s-Like Lymphoid Reaction to Colorectal Cancer-Tertiary Lymphoid Structures With Immunologic and Potentially Therapeutic Relevance in Colorectal Cancer. Front Immunol (2019) 10:1884. doi: 10.3389/fimmu.2019.01884
34. Calderaro J, Petitprez F, Becht E, Laurent A, Hirsch TZ, Rousseau B, et al. Intra-tumoral tertiary lymphoid structures are associated with a low risk of early recurrence of hepatocellular carcinoma. J Hepatol (2019) 70:58–65. doi: 10.1016/j.jhep.2018.09.003
35. Goc J, Fridman W-H, Sautès-Fridman C, Dieu-Nosjean M-C. Characteristics of tertiary lymphoid structures in primary cancers. Oncoimmunology (2013) 2:e26836. doi: 10.4161/onci.26836
36. Helmink BA, Reddy SM, Gao J, Zhang S, Basar R, Thakur R, et al. B cells and tertiary lymphoid structures promote immunotherapy response. Nature (2020) 577:549–55. doi: 10.1038/s41586-019-1922-8
37. Saltz J, Gupta R, Hou L, Kurc T, Singh P, Nguyen V, et al. Spatial Organization and Molecular Correlation of Tumor-Infiltrating Lymphocytes Using Deep Learning on Pathology Images. Cell Rep (2018) 23:181–193.e7. doi: 10.1016/j.celrep.2018.03.086
38. Lauss M, Visne I, Kriegner A, Ringnér M, Jönsson G, Höglund M. Monitoring of technical variation in quantitative high-throughput datasets. Cancer Inform (2013) 12:193–201. doi: 10.4137/CIN.S12862
39. Mattox AK, Lee J, Westra WH, Pierce RH, Ghossein R, Faquin WC, et al. PD-1 Expression in Head and Neck Squamous Cell Carcinomas Derives Primarily from Functionally Anergic CD4+ TILs in the Presence of PD-L1+ TAMs. Cancer Res (2017) 77:6365–74. doi: 10.1158/0008-5472.CAN-16-3453
40. Lyford-Pike S, Peng S, Young GD, Taube JM, Westra WH, Akpeng B, et al. Evidence for a role of the PD-1:PD-L1 pathway in immune resistance of HPV-associated head and neck squamous cell carcinoma. Cancer Res (2013) 73:1733–41. doi: 10.1158/0008-5472.CAN-12-2384
41. Garris CS, Arlauckas SP, Kohler RH, Trefny MP, Garren S, Piot C, et al. Successful Anti-PD-1 Cancer Immunotherapy Requires T Cell-Dendritic Cell Crosstalk Involving the Cytokines IFN-γ and IL-12. Immunity (2018) 49:1148–1161.e7. doi: 10.1016/j.immuni.2018.09.024
42. Mariathasan S, Turley SJ, Nickles D, Castiglioni A, Yuen K, Wang Y, et al. TGFβ attenuates tumour response to PD-L1 blockade by contributing to exclusion of T cells. Nature (2018) 554:544–8. doi: 10.1038/nature25501
43. Caja L, Dituri F, Mancarella S, Caballero-Diaz D, Moustakas A, Giannelli G, et al. TGF-β and the Tissue Microenvironment: Relevance in Fibrosis and Cancer. Int J Mol Sci (2018) 19(5):1294. doi: 10.3390/ijms19051294
44. de Araújo Farias V, Carrillo-Gálvez AB, Martín F, Anderson P. TGF-β and mesenchymal stromal cells in regenerative medicine, autoimmunity and cancer. Cytokine Growth Factor Rev (2018) 43:25–37. doi: 10.1016/j.cytogfr.2018.06.002
45. Jiang H, Hegde S, DeNardo DG. Tumor-associated fibrosis as a regulator of tumor immunity and response to immunotherapy. Cancer Immunol Immunother (2017) 66:1037–48. doi: 10.1007/s00262-017-2003-1
46. Harryvan TJ, Verdegaal EME, Hardwick JCH, Hawinkels LJAC, van der Burg SH. Targeting of the Cancer-Associated Fibroblast-T-Cell Axis in Solid Malignancies. J Clin Med Res (2019) 8(11):1989. doi: 10.3390/jcm8111989
47. Monteran L, Erez N. The Dark Side of Fibroblasts: Cancer-Associated Fibroblasts as Mediators of Immunosuppression in the Tumor Microenvironment. Front Immunol (2019) 10:1835. doi: 10.3389/fimmu.2019.01835
48. Chandler C, Liu T, Buckanovich R, Coffman LG. The double edge sword of fibrosis in cancer. Transl Res (2019) 209:55–67. doi: 10.1016/j.trsl.2019.02.006
49. Fintha A, Gasparics Á, Rosivall L, Sebe A. Therapeutic Targeting of Fibrotic Epithelial-Mesenchymal Transition-An Outstanding Challenge. Front Pharmacol (2019) 10:388. doi: 10.3389/fphar.2019.00388
50. Runyan RB, Savagner P. Epithelial-mesenchymal transition and plasticity in the developmental basis of cancer and fibrosis. Dev Dyn (2018) 247:330–1. doi: 10.1002/dvdy.24620
51. Gonzalez DM, Medici D. Signaling mechanisms of the epithelial-mesenchymal transition. Sci Signal (2014) 7:re8. doi: 10.1126/scisignal.2005189
52. Kurata T, Fushida S, Kinoshita J, Oyama K, Yamaguchi T, Okazaki M, et al. Low-dose eribulin mesylate exerts antitumor effects in gastric cancer by inhibiting fibrosis via the suppression of epithelial-mesenchymal transition and acts synergistically with 5-fluorouracil. Cancer Manag Res (2018) 10:2729–42. doi: 10.2147/CMAR.S167846
53. Katsuno Y, Lamouille S, Derynck R. TGF-β signaling and epithelial-mesenchymal transition in cancer progression. Curr Opin Oncol (2013) 25:76–84. doi: 10.1097/CCO.0b013e32835b6371
54. Chae YK, Chang S, Ko T, Anker J, Agte S, Iams W, et al. Epithelial-mesenchymal transition (EMT) signature is inversely associated with T-cell infiltration in non-small cell lung cancer (NSCLC). Sci Rep (2018) 8:2918. doi: 10.1038/s41598-018-21061-1
55. Galsky MD, Wang L, Saci A, Szabo PM, Gong Y, Zhu J. Epithelial-mesenchymal transition (EMT), T cell infiltration, and outcomes with nivolumab (nivo) in urothelial cancer (UC). Ann Oncol (2017) 28:v297. doi: 10.1093/annonc/mdx371.005
56. Kandalaft LE, Facciabene A, Buckanovich RJ, Coukos G. Endothelin B receptor, a new target in cancer immune therapy. Clin Cancer Res (2009) 15:4521–8. doi: 10.1158/1078-0432.CCR-08-0543
57. Coffman L, Mooney C, Lim J, Bai S, Silva I, Gong Y, et al. Endothelin receptor-A is required for the recruitment of antitumor T cells and modulates chemotherapy induction of cancer stem cells. Cancer Biol Ther (2013) 14:184–92. doi: 10.4161/cbt.22959
58. Buckanovich RJ, Facciabene A, Kim S, Benencia F, Sasaroli D, Balint K, et al. Endothelin B receptor mediates the endothelial barrier to T cell homing to tumors and disables immune therapy. Nat Med (2008) 14:28–36. doi: 10.1038/nm1699
59. Yang J, Yan J, Liu B. Targeting VEGF/VEGFR to Modulate Antitumor Immunity. Front Immunol (2018) 9:978. doi: 10.3389/fimmu.2018.00978
60. Li Y-L, Zhao H, Ren X-B. Relationship of VEGF/VEGFR with immune and cancer cells: staggering or forward? Cancer Biol Med (2016) 13:206–14. doi: 10.20892/j.issn.2095-3941.2015.0070
61. Zidlik V, Brychtova S, Uvirova M, Ziak D, Dvorackova J. The changes of angiogenesis and immune cell infiltration in the intra- and peri-tumoral melanoma microenvironment. Int J Mol Sci (2015) 16:7876–89. doi: 10.3390/ijms16047876
62. Lanitis E, Irving M, Coukos G. Targeting the tumor vasculature to enhance T cell activity. Curr Opin Immunol (2015) 33:55–63. doi: 10.1016/j.coi.2015.01.011
63. Schaaf MB, Garg AD, Agostinis P. Defining the role of the tumor vasculature in antitumor immunity and immunotherapy. Cell Death Dis (2018) 9:115. doi: 10.1038/s41419-017-0061-0
64. Scotton CJ, Wilson JL, Scott K, Stamp G, Wilbanks GD, Fricker S, et al. Multiple actions of the chemokine CXCL12 on epithelial tumor cells in human ovarian cancer. Cancer Res (2002) 62:5930–8.
65. Liang JJ, Zhu S, Bruggeman R, Zaino RJ, Evans DB, Fleming JB, et al. High levels of expression of human stromal cell-derived factor-1 are associated with worse prognosis in patients with stage II pancreatic ductal adenocarcinoma. Cancer Epidemiol Biomarkers Prev (2010) 19:2598–604. doi: 10.1158/1055-9965.EPI-10-0405
66. Akishima-Fukasawa Y, Nakanishi Y, Ino Y, Moriya Y, Kanai Y, Hirohashi S. Prognostic significance of CXCL12 expression in patients with colorectal carcinoma. Am J Clin Pathol (2009) 132:202–10; quiz 307. doi: 10.1309/AJCPK35VZJEWCUTL
67. Platten M, Wick W, Van den Eynde BJ. Tryptophan catabolism in cancer: beyond IDO and tryptophan depletion. Cancer Res (2012) 72:5435–40. doi: 10.1158/0008-5472.CAN-12-0569
68. Fultang L, Vardon A, De Santo C, Mussai F. Molecular basis and current strategies of therapeutic arginine depletion for cancer. Int J Cancer (2016) 139:501–9. doi: 10.1002/ijc.30051
69. Kremer JC, Prudner BC, Lange SES, Bean GR, Schultze MB, Brashears CB, et al. Arginine Deprivation Inhibits the Warburg Effect and Upregulates Glutamine Anaplerosis and Serine Biosynthesis in ASS1-Deficient Cancers. Cell Rep (2017) 18:991–1004. doi: 10.1016/j.celrep.2016.12.077
70. Wei J, Raynor J, Nguyen T-LM, Chi H. Nutrient and Metabolic Sensing in T Cell Responses. Front Immunol (2017) 8:247. doi: 10.3389/fimmu.2017.00247
71. Mondanelli G, Ugel S, Grohmann U, Bronte V. The immune regulation in cancer by the amino acid metabolizing enzymes ARG and IDO. Curr Opin Pharmacol (2017) 35:30–9. doi: 10.1016/j.coph.2017.05.002
72. Johnson MO, Wolf MM, Madden MZ, Andrejeva G, Sugiura A, Contreras DC, et al. Distinct Regulation of Th17 and Th1 Cell Differentiation by Glutaminase-Dependent Metabolism. Cell (2018) 175:1780–1795.e19. doi: 10.1016/j.cell.2018.10.001
73. Schwartz L, Supuran CT, Alfarouk KO. The Warburg Effect and the Hallmarks of Cancer. Anticancer Agents Med Chem (2017) 17:164–70. doi: 10.2174/1871520616666161031143301
74. Morrot A, da Fonseca LM, Salustiano EJ, Gentile LB, Conde L, Filardy AA, et al. Metabolic Symbiosis and Immunomodulation: How Tumor Cell-Derived Lactate May Disturb Innate and Adaptive Immune Responses. Front Oncol (2018) 8:81. doi: 10.3389/fonc.2018.00081
75. Cascone T, McKenzie JA, Mbofung RM, Punt S, Wang Z, Xu C, et al. Increased Tumor Glycolysis Characterizes Immune Resistance to Adoptive T Cell Therapy. Cell Metab (2018) 27:977–987.e4. doi: 10.1016/j.cmet.2018.02.024
76. Brand A, Singer K, Koehl GE, Kolitzus M, Schoenhammer G, Thiel A, et al. LDHA-Associated Lactic Acid Production Blunts Tumor Immunosurveillance by T and NK Cells. Cell Metab (2016) 24:657–71. doi: 10.1016/j.cmet.2016.08.011
77. Mastelic-Gavillet B, Navarro Rodrigo B, Décombaz L, Wang H, Ercolano G, Ahmed R, et al. Adenosine mediates functional and metabolic suppression of peripheral and tumor-infiltrating CD8+ T cells. J Immunother Cancer (2019) 7:257. doi: 10.1186/s40425-019-0719-5
78. Vigano S, Alatzoglou D, Irving M, Ménétrier-Caux C, Caux C, Romero P, et al. Targeting Adenosine in Cancer Immunotherapy to Enhance T-Cell Function. Front Immunol (2019) 10:925. doi: 10.3389/fimmu.2019.00925
79. Arab S, Hadjati J. Adenosine Blockage in Tumor Microenvironment and Improvement of Cancer Immunotherapy. Immune Netw (2019) 19:e23. doi: 10.4110/in.2019.19.e23
80. Muller-Haegele S, Muller L, Whiteside TL. Immunoregulatory activity of adenosine and its role in human cancer progression. Expert Rev Clin Immunol (2014) 10:897–914. doi: 10.1586/1744666X.2014.915739
81. Ong ST, Ng AS, Ng XR, Zhuang Z, Wong BHS, Prasannan P, et al. Extracellular K+ Dampens T Cell Functions: Implications for Immune Suppression in the Tumor Microenvironment. Bioelectricity (2019) 1:169–79. doi: 10.1089/bioe.2019.0016
82. Crespo J, Sun H, Welling TH, Tian Z, Zou W. T cell anergy, exhaustion, senescence, and stemness in the tumor microenvironment. Curr Opin Immunol (2013) 25:214–21. doi: 10.1016/j.coi.2012.12.003
83. Iwamoto H, Abe M, Yang Y, Cui D, Seki T, Nakamura M, et al. Cancer Lipid Metabolism Confers Antiangiogenic Drug Resistance. Cell Metab (2018) 28:104–17.e5. doi: 10.1016/j.cmet.2018.05.005
84. Zelenay S, van der Veen AG, Böttcher JP, Snelgrove KJ, Rogers N, Acton SE, et al. Cyclooxygenase-Dependent Tumor Growth through Evasion of Immunity. Cell (2015) 162:1257–70. doi: 10.1016/j.cell.2015.08.015
85. Wang D, DuBois RN. Role of prostanoids in gastrointestinal cancer. J Clin Invest (2018) 128:2732–42. doi: 10.1172/JCI97953
86. Yang L, Yamagata N, Yadav R, Brandon S, Courtney RL, Morrow JD, et al. Cancer-associated immunodeficiency and dendritic cell abnormalities mediated by the prostaglandin EP2 receptor. J Clin Invest (2003) 111:727–35. doi: 10.1172/JCI16492
87. Hatfield SM, Kjaergaard J, Lukashev D, Schreiber TH, Belikoff B, Abbott R, et al. Immunological mechanisms of the antitumor effects of supplemental oxygenation. Sci Transl Med (2015) 7:277ra30. doi: 10.1126/scitranslmed.aaa1260
88. Daniel SK, Sullivan KM, Labadie KP, Pillarisetty VG. Hypoxia as a barrier to immunotherapy in pancreatic adenocarcinoma. Clin Transl Med (2019) 8:10. doi: 10.1186/s40169-019-0226-9
89. Hatfield SM, Sitkovsky M. A2A adenosine receptor antagonists to weaken the hypoxia-HIF-1α driven immunosuppression and improve immunotherapies of cancer. Curr Opin Pharmacol (2016) 29:90–6. doi: 10.1016/j.coph.2016.06.009
90. Hatfield SM, Kjaergaard J, Lukashev D, Belikoff B, Schreiber TH, Sethumadhavan S, et al. Systemic oxygenation weakens the hypoxia and hypoxia inducible factor 1α-dependent and extracellular adenosine-mediated tumor protection. J Mol Med (2014) 92:1283–92. doi: 10.1007/s00109-014-1189-3
91. Bartrons R, Caro J. Hypoxia, glucose metabolism and the Warburg’s effect. J Bioenerg Biomembr (2007) 39:223–9. doi: 10.1007/s10863-007-9080-3
92. Lapeyre-Prost A, Terme M, Pernot S, Pointet A-L, Voron T, Tartour E, et al. Immunomodulatory Activity of VEGF in Cancer. Int Rev Cell Mol Biol (2017) 330:295–342. doi: 10.1016/bs.ircmb.2016.09.007
93. Guo P, Fang Q, Tao H-Q, Schafer CA, Fenton BM, Ding I, et al. Overexpression of vascular endothelial growth factor by MCF-7 breast cancer cells promotes estrogen-independent tumor growth in vivo. Cancer Res (2003) 63:4684–91. doi: 10.1038/sj.bjc.6601539
94. Gabrilovich DI, Chen HL, Girgis KR, Cunningham HT, Meny GM, Nadaf S, et al. Production of vascular endothelial growth factor by human tumors inhibits the functional maturation of dendritic cells. Nat Med (1996) 2:1096–103. doi: 10.1038/nm1096-1096
95. Feig C, Jones JO, Kraman M, Wells RJB, Deonarine A, Chan DS, et al. Targeting CXCL12 from FAP-expressing carcinoma-associated fibroblasts synergizes with anti-PD-L1 immunotherapy in pancreatic cancer. Proc Natl Acad Sci USA (2013) 110:20212–7. doi: 10.1073/pnas.1320318110
96. Wang E, Uccellini L, Marincola FM. A genetic inference on cancer immune responsiveness. Oncoimmunology (2012) 1:520–5. doi: 10.4161/onci.19531
97. Fu S, Zhang N, Yopp AC, Chen D, Mao M, Chen D, et al. TGF-beta induces Foxp3 + T-regulatory cells from CD4 + CD25 - precursors. Am J Transpl (2004) 4:1614–27. doi: 10.1111/j.1600-6143.2004.00566.x
98. Dahmani A, Delisle J-S. TGF-β in T Cell Biology: Implications for Cancer Immunotherapy. Cancers (2018) 10(6):194. doi: 10.3390/cancers10060194
99. Aguilera TA, Giaccia AJ. Molecular Pathways: Oncologic Pathways and Their Role in T-cell Exclusion and Immune Evasion-A New Role for the AXL Receptor Tyrosine Kinase. Clin Cancer Res (2017) 23:2928–33. doi: 10.1158/1078-0432.CCR-17-0189
100. Akalu YT, Rothlin CV, Ghosh S. TAM receptor tyrosine kinases as emerging targets of innate immune checkpoint blockade for cancer therapy. Immunol Rev (2017) 276:165–77. doi: 10.1111/imr.12522
101. Crittenden MR, Baird J, Friedman D, Savage T, Uhde L, Alice A, et al. Mertk on tumor macrophages is a therapeutic target to prevent tumor recurrence following radiation therapy. Oncotarget (2016) 7:78653–66. doi: 10.18632/oncotarget.11823
102. Zhang B, Fang L, Wu H-M, Ding P-S, Xu K, Liu R-Y. Mer receptor tyrosine kinase negatively regulates lipoteichoic acid-induced inflammatory response via PI3K/Akt and SOCS3. Mol Immunol (2016) 76:98–107. doi: 10.1016/j.molimm.2016.06.016
103. Matlung HL, Szilagyi K, Barclay NA, van den Berg TK. The CD47-SIRPα signaling axis as an innate immune checkpoint in cancer. Immunol Rev (2017) 276:145–64. doi: 10.1111/imr.12527
104. Ring NG, Herndler-Brandstetter D, Weiskopf K, Shan L, Volkmer J-P, George BM, et al. Anti-SIRPα antibody immunotherapy enhances neutrophil and macrophage antitumor activity. Proc Natl Acad Sci USA (2017) 114:E10578–85. doi: 10.1073/pnas.1710877114
105. Weiskopf K. Cancer immunotherapy targeting the CD47/SIRPα axis. Eur J Cancer (2017) 76:100–9. doi: 10.1016/j.ejca.2017.02.013
106. Galluzzi L, Vitale I, Aaronson SA, Abrams JM, Adam D, Agostinis P, et al. Molecular mechanisms of cell death: recommendations of the Nomenclature Committee on Cell Death 2018. Cell Death Differ (2018) 25:486–541. doi: 10.1038/s41418-018-0102-y
107. Galluzzi L, Buqué A, Kepp O, Zitvogel L, Kroemer G. Reply: Immunosuppressive cell death in cancer. Nat Rev Immunol (2017) 17(2):97–111. doi: 10.1038/nri.2017.48
108. Green DR, Ferguson T, Zitvogel L, Kroemer G. Immunogenic and tolerogenic cell death. Nat Rev Immunol (2009) 9:353–63. doi: 10.1038/nri2545
109. Hendrickx W, Simeone I, Anjum S, Mokrab Y, Bertucci F, Finetti P, et al. Identification of genetic determinants of breast cancer immune phenotypes by integrative genome-scale analysis. Oncoimmunology (2017) 6:e1253654. doi: 10.1080/2162402X.2016.1253654
110. Luke JJ, Bao R, Sweis RF, Spranger S, Gajewski TF. WNT/β-catenin Pathway Activation Correlates with Immune Exclusion across Human Cancers. Clin Cancer Res (2019) 25:3074–83. doi: 10.1158/1078-0432.CCR-18-1942
111. Spranger S, Bao R, Gajewski TF. Melanoma-intrinsic β-catenin signalling prevents anti-tumour immunity. Nature (2015) 523:231–5. doi: 10.1038/nature14404
112. Dangaj D, Barras D, Coukos G. Tumor Landscapes: β-Catenin Drives Immune Desertification. Clin Cancer Res (2019) 25(10):2943–5. doi: 10.1158/1078-0432.CCR-19-0188
113. Ahn R, Sabourin V, Bolt AM, Hébert S, Totten S, De Jay N, et al. The Shc1 adaptor simultaneously balances Stat1 and Stat3 activity to promote breast cancer immune suppression. Nat Commun (2017) 8:14638. doi: 10.1038/ncomms14638
114. Kaneda MM, Messer KS, Ralainirina N, Li H, Leem CJ, Gorjestani S, et al. PI3Kγ is a molecular switch that controls immune suppression. Nature (2016) 539:437–42. doi: 10.1038/nature19834
115. Shapiro FD, Eyre DR. Collagen polymorphism in extracellular matrix of human osteosarcoma. J Natl Cancer Inst (1982) 69:1009–16.
116. Zhu GG, Risteli L, Mäkinen M, Risteli J, Kauppila A, Stenbäck F. Immunohistochemical study of type I collagen and type I pN-collagen in benign and malignant ovarian neoplasms. Cancer (1995) 75:1010–7. doi: 10.1002/1097-0142(19950215)75:4<1010::AID-CNCR2820750417>3.0.CO;2-O
117. Kauppila S, Stenbäck F, Risteli J, Jukkola A, Risteli L, Aberrant type I. and type III collagen gene expression in human breast cancer in vivo. J Pathol (1998) 186:262–8. doi: 10.1002/(SICI)1096-9896(1998110)186:3<262::AID-PATH191>3.0.CO;2-3
118. Huijbers IJ, Iravani M, Popov S, Robertson D, Al-Sarraj S, Jones C, et al. A role for fibrillar collagen deposition and the collagen internalization receptor endo180 in glioma invasion. PloS One (2010) 5:e9808. doi: 10.1371/journal.pone.0009808
119. Hasebe T, Tsuda H, Tsubono Y, Imoto S, Mukai K. Fibrotic focus in invasive ductal carcinoma of the breast: a histopathological prognostic parameter for tumor recurrence and tumor death within three years after the initial operation. Jpn J Cancer Res (1997) 88:590–9. doi: 10.1111/j.1349-7006.1997.tb00423.x
120. Salmon H, Franciszkiewicz K, Damotte D, Dieu-Nosjean M-C, Validire P, Trautmann A, et al. Matrix architecture defines the preferential localization and migration of T cells into the stroma of human lung tumors. J Clin Invest (2012) 122:899–910. doi: 10.1172/JCI45817
121. Moreau HD, Piel M, Voituriez R, Lennon-Duménil A-M. Integrating Physical and Molecular Insights on Immune Cell Migration. Trends Immunol (2018) 39:632–43. doi: 10.1016/j.it.2018.04.007
122. Berraondo P, Sanmamed MF, Ochoa MC, Etxeberria I, Aznar MA, Pérez-Gracia JL, et al. Cytokines in clinical cancer immunotherapy. Br J Cancer (2019) 120:6–15. doi: 10.1038/s41416-018-0328-y
123. Borthwick LA, Wynn TA, Fisher AJ. Cytokine mediated tissue fibrosis. Biochim Biophys Acta (2013) 1832:1049–60. doi: 10.1016/j.bbadis.2012.09.014
124. Chaplin DJ, Olive PL, Durand RE. Intermittent blood flow in a murine tumor: radiobiological effects. Cancer Res (1987) 47:597–601.
125. Schito L, Rey S, Tafani M, Zhang H, Wong CC-L, Russo A, et al. Hypoxia-inducible factor 1-dependent expression of platelet-derived growth factor B promotes lymphatic metastasis of hypoxic breast cancer cells. Proc Natl Acad Sci USA (2012) 109:E2707–16. doi: 10.1073/pnas.1214019109
126. Krock BL, Skuli N, Simon MC. Hypoxia-induced angiogenesis: good and evil. Genes Cancer (2011) 2:1117–33. doi: 10.1177/1947601911423654
127. Calcinotto A, Grioni M, Jachetti E, Curnis F, Mondino A, Parmiani G, et al. Targeting TNF-α to neoangiogenic vessels enhances lymphocyte infiltration in tumors and increases the therapeutic potential of immunotherapy. J Immunol (2012) 188:2687–94. doi: 10.4049/jimmunol.1101877
128. Rodríguez PC, Ochoa AC. Arginine regulation by myeloid derived suppressor cells and tolerance in cancer: mechanisms and therapeutic perspectives. Immunol Rev (2008) 222:180–91. doi: 10.1111/j.1600-065X.2008.00608.x
129. Rodriguez PC, Ernstoff MS, Hernandez C, Atkins M, Zabaleta J, Sierra R, et al. Arginase I-producing myeloid-derived suppressor cells in renal cell carcinoma are a subpopulation of activated granulocytes. Cancer Res (2009) 69:1553–60. doi: 10.1158/0008-5472.CAN-08-1921
130. Ziani L, Chouaib S, Thiery J. Alteration of the Antitumor Immune Response by Cancer-Associated Fibroblasts. Front Immunol (2018) 9:414. doi: 10.3389/fimmu.2018.00414
131. Sener Z, Cederkvist FH, Volchenkov R, Holen HL, Skålhegg BS. T Helper Cell Activation and Expansion Is Sensitive to Glutaminase Inhibition under Both Hypoxic and Normoxic Conditions. PloS One (2016) 11:e0160291. doi: 10.1371/journal.pone.0160291
132. Yin Z, Bai L, Li W, Zeng T, Tian H, Cui J. Targeting T cell metabolism in the tumor microenvironment: an anti-cancer therapeutic strategy. J Exp Clin Cancer Res (2019) 38:403. doi: 10.1186/s13046-019-1409-3
133. Patel CH, Powell JD. Targeting T cell metabolism to regulate T cell activation, differentiation and function in disease. Curr Opin Immunol (2017) 46:82–8. doi: 10.1016/j.coi.2017.04.006
134. Takubo K, Nagamatsu G, Kobayashi CI, Nakamura-Ishizu A, Kobayashi H, Ikeda E, et al. Regulation of glycolysis by Pdk functions as a metabolic checkpoint for cell cycle quiescence in hematopoietic stem cells. Cell Stem Cell (2013) 12:49–61. doi: 10.1016/j.stem.2012.10.011
135. Liberti MV, Locasale JW. The Warburg Effect: How Does it Benefit Cancer Cells? Trends Biochem Sci (2016) 41:211–8. doi: 10.1016/j.tibs.2015.12.001
136. DeBerardinis RJ, Chandel NS. We need to talk about the Warburg effect. Nat Metab (2020) 2:127–9. doi: 10.1038/s42255-020-0172-2
137. Wehbi VL, Taskén K. Molecular Mechanisms for cAMP-Mediated Immunoregulation in T cells - Role of Anchored Protein Kinase A Signaling Units. Front Immunol (2016) 7:222. doi: 10.3389/fimmu.2016.00222
138. Vodnala SK, Eil R, Kishton RJ, Sukumar M, Yamamoto TN, Ha N-H, et al. T cell stemness and dysfunction in tumors are triggered by a common mechanism. Science (2019) 363(6434):eaau0135. doi: 10.1126/science.aau0135
139. Held W, Siddiqui I, Schaeuble K, Speiser DE. Intratumoral CD8+ T cells with stem cell-like properties: Implications for cancer immunotherapy. Sci Transl Med (2019) 11(515):eaay6863. doi: 10.1126/scitranslmed.aay6863
140. Sabatino M, Hu J, Sommariva M, Gautam S, Fellowes V, Hocker JD, et al. Generation of clinical-grade CD19-specific CAR-modified CD8+ memory stem cells for the treatment of human B-cell malignancies. Blood (2016) 128:519–28. doi: 10.1182/blood-2015-11-683847
141. Vilgelm AE, Richmond A. Chemokines Modulate Immune Surveillance in Tumorigenesis, Metastasis, and Response to Immunotherapy. Front Immunol (2019) 10:333. doi: 10.3389/fimmu.2019.00333
142. Yam AO, Chtanova T. The Ins and Outs of Chemokine-Mediated Immune Cell Trafficking in Skin Cancer. Front Immunol (2019) 10:386. doi: 10.3389/fimmu.2019.00386
143. Chow MT, Luster AD. Chemokines in cancer. Cancer Immunol Res (2014) 2:1125–31. doi: 10.1158/2326-6066.CIR-14-0160
144. Rashid R, Gaglia G, Chen Y-A, Lin J-R, Du Z, Maliga Z, et al. Highly multiplexed immunofluorescence images and single-cell data of immune markers in tonsil and lung cancer. Sci Data (2019) 6:323. doi: 10.1038/s41597-019-0332-y
145. Hofman P, Badoual C, Henderson F, Berland L, Hamila M, Long-Mira E, et al. Multiplexed Immunohistochemistry for Molecular and Immune Profiling in Lung Cancer—Just About Ready for Prime-Time? Cancers (2019) 11:283. doi: 10.3390/cancers11030283
146. Semenza GL. Defining the role of hypoxia-inducible factor 1 in cancer biology and therapeutics. Oncogene (2010) 29:625–34. doi: 10.1038/onc.2009.441
147. Wang GL, Jiang BH, Rue EA, Semenza GL. Hypoxia-inducible factor 1 is a basic-helix-loop-helix-PAS heterodimer regulated by cellular O2 tension. Proc Natl Acad Sci USA (1995) 92:5510–4. doi: 10.1073/pnas.92.12.5510
148. Semenza GL. Hypoxia-inducible factors in physiology and medicine. Cell (2012) 148:399–408. doi: 10.1016/j.cell.2012.01.021
149. Zaidi M, Fu F, Cojocari D, McKee TD, Wouters BG. Quantitative Visualization of Hypoxia and Proliferation Gradients Within Histological Tissue Sections. Front Bioeng Biotechnol (2019) 7:397. doi: 10.3389/fbioe.2019.00397
150. Russell J, Carlin S, Burke SA, Wen B, Yang KM, Ling CC. Immunohistochemical detection of changes in tumor hypoxia. Int J Radiat Oncol Biol Phys (2009) 73:1177–86. doi: 10.1016/j.ijrobp.2008.12.004
151. Meier V, Guscetti F, Roos M, Ohlerth S, Pruschy M, Rohrer Bley C. Hypoxia-Related Marker GLUT-1, CAIX, Proliferative Index and Microvessel Density in Canine Oral Malignant Neoplasia. PloS One (2016) 11:e0149993. doi: 10.1371/journal.pone.0149993
152. Pinato DJ, Ramachandran R, Toussi STK, Vergine M, Ngo N, Sharma R, et al. Immunohistochemical markers of the hypoxic response can identify malignancy in phaeochromocytomas and paragangliomas and optimize the detection of tumours with VHL germline mutations. Br J Cancer (2013) 108:429–37. doi: 10.1038/bjc.2012.538
153. Moon EJ, Brizel DM, Chi J-TA, Dewhirst MW. The potential role of intrinsic hypoxia markers as prognostic variables in cancer. Antioxid Redox Signal (2007) 9:1237–94. doi: 10.1089/ars.2007.1623
154. Wang GL, Semenza GL. Characterization of hypoxia-inducible factor 1 and regulation of DNA binding activity by hypoxia. J Biol Chem (1993) 268:21513–8.
155. Moroz E, Carlin S, Dyomina K, Burke S, Thaler HT, Blasberg R, et al. Real-time imaging of HIF-1alpha stabilization and degradation. PloS One (2009) 4:e5077. doi: 10.1371/journal.pone.0005077
156. Rafajová M, Zatovicová M, Kettmann R, Pastorek J, Pastoreková S. Induction by hypoxia combined with low glucose or low bicarbonate and high posttranslational stability upon reoxygenation contribute to carbonic anhydrase IX expression in cancer cells. Int J Oncol (2004) 24:995–1004. doi: 10.3892/ijo.24.4.995
157. Koch CJ, Evans SM. Optimizing hypoxia detection and treatment strategies. Semin Nucl Med (2015) 45:163–76. doi: 10.1053/j.semnuclmed.2014.10.004
158. Aguilera KY, Brekken RA. Hypoxia Studies with Pimonidazole in vivo. Bio Protoc (2014) 4(19):e1254. doi: 10.21769/bioprotoc.1254
159. Ragnum HB, Vlatkovic L, Lie AK, Axcrona K, Julin CH, Frikstad KM, et al. The tumour hypoxia marker pimonidazole reflects a transcriptional programme associated with aggressive prostate cancer. Br J Cancer (2015) 112:382–90. doi: 10.1038/bjc.2014.604
160. Varia MA, Calkins-Adams DP, Rinker LH, Kennedy AS, Novotny DB, Fowler WC Jr, et al. Pimonidazole: a novel hypoxia marker for complementary study of tumor hypoxia and cell proliferation in cervical carcinoma. Gynecol Oncol (1998) 71:270–7. doi: 10.1006/gyno.1998.5163
161. Evans SM, Hahn S, Pook DR, Jenkins WT, Chalian AA, Zhang P, et al. Detection of hypoxia in human squamous cell carcinoma by EF5 binding. Cancer Res (2000) 60:2018–24. doi: 10.1158/0008-5472.can-03-2424
162. Evans SM, Judy KD, Dunphy I, Jenkins WT, Nelson PT, Collins R, et al. Comparative measurements of hypoxia in human brain tumors using needle electrodes and EF5 binding. Cancer Res (2004) 64:1886–92. doi: 10.1158/0008-5472.CAN-03-2424
163. Silvola JMU, Saraste A, Forsback S, Laine VJO, Saukko P, Heinonen SE, et al. Detection of hypoxia by [18F]EF5 in atherosclerotic plaques in mice. Arterioscler Thromb Vasc Biol (2011) 31:1011–5. doi: 10.1161/ATVBAHA.110.221440
164. Nordsmark M, Alsner J, Keller J, Nielsen OS, Jensen OM, Horsman MR, et al. Hypoxia in human soft tissue sarcomas: adverse impact on survival and no association with p53 mutations. Br J Cancer (2001) 84:1070–5. doi: 10.1054/bjoc.2001.1728
165. Bankhead P, Loughrey MB, Fernández JA, Dombrowski Y, McArt DG, Dunne PD, et al. QuPath: Open source software for digital pathology image analysis. Sci Rep (2017) 7:16878. doi: 10.1038/s41598-017-17204-5
166. Mlecnik B, Bindea G, Angell HK, Maby P, Angelova M, Tougeron D, et al. Integrative Analyses of Colorectal Cancer Show Immunoscore Is a Stronger Predictor of Patient Survival Than Microsatellite Instability. Immunity (2016) 44:698–711. doi: 10.1016/j.immuni.2016.02.025
167. Kwak Y, Koh J, Kim D-W, Kang S-B, Kim WH, Lee HS. Immunoscore encompassing CD3+ and CD8+ T cell densities in distant metastasis is a robust prognostic marker for advanced colorectal cancer. Oncotarget (2016) 7:81778–90. doi: 10.18632/oncotarget.13207
168. Fu Y, Jung AW, Torne RV, Gonzalez S, Vöhringer H, Shmatko A, et al. Pan-cancer computational histopathology reveals mutations, tumor composition and prognosis. Nat Cancer (2020) 1:800–10. doi: 10.1101/813543
169. Kather JN, Heij LR, Grabsch HI, Loeffler C, Echle A, Muti HS, et al. Pan-cancer image-based detection of clinically actionable genetic alterations. Nat Cancer (2020) 1:789–99. doi: 10.1038/s43018-020-00149-6
170. Venteicher AS, Tirosh I, Hebert C, Yizhak K, Neftel C, Filbin MG, et al. Decoupling genetics, lineages, and microenvironment in IDH-mutant gliomas by single-cell RNA-seq. Science (2017) 355(6332):eaai8478. doi: 10.1126/science.aai8478
171. Puram SV, Tirosh I, Parikh AS, Patel AP, Yizhak K, Gillespie S, et al. Single-Cell Transcriptomic Analysis of Primary and Metastatic Tumor Ecosystems in Head and Neck Cancer. Cell (2017) 171:1611–1624.e24. doi: 10.1016/j.cell.2017.10.044
172. Tirosh I, Izar B, Prakadan SM, Wadsworth MH2, Treacy D, Trombetta JJ, et al. Dissecting the multicellular ecosystem of metastatic melanoma by single-cell RNA-seq. Science (2016) 352:189–96. doi: 10.1126/science.aad0501
173. Aizarani N, Saviano A, Sagar, Mailly L, Durand S, Herman JS, et al. A human liver cell atlas reveals heterogeneity and epithelial progenitors. Nature (2019) 572:199–204. doi: 10.1038/s41586-019-1373-2
174. Lambrechts D, Wauters E, Boeckx B, Aibar S, Nittner D, Burton O, et al. Phenotype molding of stromal cells in the lung tumor microenvironment. Nat Med (2018) 24:1277–89. doi: 10.1038/s41591-018-0096-5
175. Hovestadt V, Smith KS, Bihannic L, Filbin MG, Shaw ML, Baumgartner A, et al. Resolving medulloblastoma cellular architecture by single-cell genomics. Nature (2019) 572:74–9. doi: 10.1038/s41586-019-1434-6
176. Peng J, Sun B-F, Chen C-Y, Zhou J-Y, Chen Y-S, Chen H, et al. Single-cell RNA-seq highlights intra-tumoral heterogeneity and malignant progression in pancreatic ductal adenocarcinoma. Cell Res (2019) 29:725–38. doi: 10.1038/s41422-019-0195-y
177. Bertucci F, Finetti P, Simeone I, Hendrickx W, Wang E, Marincola FM, et al. The immunologic constant of rejection classification refines the prognostic value of conventional prognostic signatures in breast cancer. Br J Cancer (2018) 119:1383–91. doi: 10.1038/s41416-018-0309-1
178. Roelands J, Kuppen PJK, Vermeulen L, Maccalli C, Decock J, Wang E, et al. Immunogenomic Classification of Colorectal Cancer and Therapeutic Implications. Int J Mol Sci (2017) 18(10):2229. doi: 10.3390/ijms18102229
179. Wang E, Worschech A, Marincola FM. The immunologic constant of rejection. Trends Immunol (2008) 29:256–62. doi: 10.1016/j.it.2008.03.002
180. Bedognetti D, Hendrickx W, Marincola FM, Miller LD. Prognostic and predictive immune gene signatures in breast cancer. Curr Opin Oncol (2015) 27:433–44. doi: 10.1097/CCO.0000000000000234
181. Roelands J, Hendrickx W, Zoppoli G, Mall R, Saad M, Halliwill K, et al. Oncogenic states dictate the prognostic and predictive connotations of intratumoral immune response. J Immunother Cancer (2020) 8:e000617 doi: 10.1136/jitc-2020-000617
182. Damotte D, Arrondeau J, Boudou-rouquette P, Lupo A, Biton J, Ouakrim H, et al. Abstract 4546: The tumor inflammation signature is predictive of anti-PD1 treatment benefit in the CERTIM pan-cancer cohort. Cancer Res (2018) 78:4546–6. doi: 10.1158/1538-7445.AM2018-4546
183. Damotte D, Warren S, Arrondeau J, Boudou-Rouquette P, Mansuet-Lupo A, Biton J, et al. The tumor inflammation signature (TIS) is associated with anti-PD-1 treatment benefit in the CERTIM pan-cancer cohort. J Transl Med (2019) 17:357. doi: 10.1186/s12967-019-2100-3
184. Sturm G, Finotello F, Petitprez F, Zhang JD, Baumbach J, Fridman WH, et al. Comprehensive evaluation of transcriptome-based cell-type quantification methods for immuno-oncology. Bioinformatics (2019) 35:i436–45. doi: 10.1093/bioinformatics/btz363
185. Finotello F, Trajanoski Z. Quantifying tumor-infiltrating immune cells from transcriptomics data. Cancer Immunol Immunother (2018) 67:1031–40. doi: 10.1007/s00262-018-2150-z
186. Schelker M, Feau S, Du J, Ranu N, Klipp E, MacBeath G, et al. Estimation of immune cell content in tumour tissue using single-cell RNA-seq data. Nat Commun (2017) 8:2032. doi: 10.1038/s41467-017-02289-3
187. Kang K, Meng Q, Shats I, Umbach DM, Li M, Li Y, et al. CDSeq: A novel complete deconvolution method for dissecting heterogeneous samples using gene expression data. PloS Comput Biol (2019) 15:e1007510. doi: 10.1371/journal.pcbi.1007510
188. Goswami S, Walle T, Cornish AE, Basu S, Anandhan S, Fernandez I, et al. Immune profiling of human tumors identifies CD73 as a combinatorial target in glioblastoma. Nat Med (2020) 26:39–46. doi: 10.1038/s41591-019-0694-x
189. Chevrier S, Levine JH, Zanotelli VRT, Silina K, Schulz D, Bacac M, et al. An Immune Atlas of Clear Cell Renal Cell Carcinoma. Cell (2017) 169:736–749.e18. doi: 10.1016/j.cell.2017.04.016
190. Wagner J, Rapsomaniki MA, Chevrier S, Anzeneder T, Langwieder C, Dykgers A, et al. A Single-Cell Atlas of the Tumor and Immune Ecosystem of Human Breast Cancer. Cell (2019) 177:1330–45.e18. doi: 10.1016/j.cell.2019.03.005
191. Guo X, Zhang Y, Zheng L, Zheng C, Song J, Zhang Q, et al. Global characterization of T cells in non-small-cell lung cancer by single-cell sequencing. Nat Med (2018) 24:978–85. doi: 10.1038/s41591-018-0045-3
192. Zheng C, Zheng L, Yoo J-K, Guo H, Zhang Y, Guo X, et al. Landscape of Infiltrating T Cells in Liver Cancer Revealed by Single-Cell Sequencing. Cell (2017) 169:1342–1356.e16. doi: 10.1016/j.cell.2017.05.035
193. Lee H-O, Park W-Y. Single-cell RNA-Seq unveils tumor microenvironment. BMB Rep (2017) 50:283–4. doi: 10.5483/BMBRep.2017.50.6.086
194. Picelli S, Faridani OR, Björklund AK, Winberg G, Sagasser S, Sandberg R. Full-length RNA-seq from single cells using Smart-seq2. Nat Protoc (2014) 9:171–81. doi: 10.1038/nprot.2014.006
195. Fan X, Zhang X, Wu X, Guo H, Hu Y, Tang F, et al. Single-cell RNA-seq transcriptome analysis of linear and circular RNAs in mouse preimplantation embryos. Genome Biol (2015) 16:148. doi: 10.1186/s13059-015-0706-1
196. Sheng K, Cao W, Niu Y, Deng Q, Zong C. Effective detection of variation in single-cell transcriptomes using MATQ-seq. Nat Methods (2017) 14:267–70. doi: 10.1038/nmeth.4145
197. Macosko EZ, Basu A, Satija R, Nemesh J, Shekhar K, Goldman M, et al. Highly Parallel Genome-wide Expression Profiling of Individual Cells Using Nanoliter Droplets. Cell (2015) 161:1202–14. doi: 10.1016/j.cell.2015.05.002
198. Hashimshony T, Senderovich N, Avital G, Klochendler A, de Leeuw Y, Anavy L, et al. CEL-Seq2: sensitive highly-multiplexed single-cell RNA-Seq. Genome Biol (2016) 17:77. doi: 10.1186/s13059-016-0938-8
199. Gierahn TM, Wadsworth MH2, Hughes TK, Bryson BD, Butler A, Satija R, et al. Seq-Well: portable, low-cost RNA sequencing of single cells at high throughput. Nat Methods (2017) 14:395–8. doi: 10.1038/nmeth.4179
200. Jaitin DA, Kenigsberg E, Keren-Shaul H, Elefant N, Paul F, Zaretsky I, et al. Massively parallel single-cell RNA-seq for marker-free decomposition of tissues into cell types. Science (2014) 343:776–9. doi: 10.1126/science.1247651
201. Sasagawa Y, Nikaido I, Hayashi T, Danno H, Uno KD, Imai T, et al. Quartz-Seq: a highly reproducible and sensitive single-cell RNA sequencing method, reveals non-genetic gene-expression heterogeneity. Genome Biol (2013) 14:R31. doi: 10.1186/gb-2013-14-4-r31
202. Sasagawa Y, Danno H, Takada H, Ebisawa M, Tanaka K, Hayashi T, et al. Quartz-Seq2: a high-throughput single-cell RNA-sequencing method that effectively uses limited sequence reads. Genome Biol (2018) 19:29. doi: 10.1186/s13059-018-1407-3
203. Habib N, Avraham-Davidi I, Basu A, Burks T, Shekhar K, Hofree M, et al. Massively parallel single-nucleus RNA-seq with DroNc-seq. Nat Methods (2017) 14:955–8. doi: 10.1038/nmeth.4407
204. Natarajan KN. Single-Cell Tagged Reverse Transcription (STRT-Seq). Methods Mol Biol (2019) 1979:133–53. doi: 10.1007/978-1-4939-9240-9_9
205. Hochgerner H, Lönnerberg P, Hodge R, Mikes J, Heskol A, Hubschle H, et al. STRT-seq-2i: dual-index 5’ single cell and nucleus RNA-seq on an addressable microwell array. Sci Rep (2017) 7:16327. doi: 10.1038/s41598-017-16546-4
206. Zheng GXY, Terry JM, Belgrader P, Ryvkin P, Bent ZW, Wilson R, et al. Massively parallel digital transcriptional profiling of single cells. Nat Commun (2017) 8:14049. doi: 10.1038/ncomms14049
207. Lähnemann D, Köster J, Szczurek E, McCarthy DJ, Hicks SC, Robinson MD, et al. Eleven grand challenges in single-cell data science. Genome Biol (2020) 21:31. doi: 10.1186/s13059-020-1926-6
208. Esteve-Codina A. Chapter Four - RNA-Seq Data Analysis, Applications and Challenges. In: Jaumot J, Bedia C, Tauler R, editors. Comprehensive Analytical Chemistry. Netherlands: Elsevier (2018). p. 71–106.
209. Han Y, Gao S, Muegge K, Zhang W, Zhou B. Advanced Applications of RNA Sequencing and Challenges. Bioinform Biol Insights (2015) 9:29–46. doi: 10.4137/BBI.S28991
210. Civita P, Franceschi S, Aretini P, Ortenzi V, Menicagli M, Lessi F, et al. Laser Capture Microdissection and RNA-Seq Analysis: High Sensitivity Approaches to Explain Histopathological Heterogeneity in Human Glioblastoma FFPE Archived Tissues. Front Oncol (2019) 9:482. doi: 10.3389/fonc.2019.00482
211. Nichterwitz S, Benitez JA, Hoogstraaten R, Deng Q, Hedlund E. LCM-Seq: A Method for Spatial Transcriptomic Profiling Using Laser Capture Microdissection Coupled with PolyA-Based RNA Sequencing. Methods Mol Biol (2018) 1649:95–110. doi: 10.1007/978-1-4939-7213-5_6
212. Chen J, Suo S, Tam PP, Han J-DJ, Peng G, Jing N. Spatial transcriptomic analysis of cryosectioned tissue samples with Geo-seq. Nat Protoc (2017) 12:566–80. doi: 10.1038/nprot.2017.003
213. Janiszewska M, Liu L, Almendro V, Kuang Y, Paweletz C, Sakr RA, et al. In situ single-cell analysis identifies heterogeneity for PIK3CA mutation and HER2 amplification in HER2-positive breast cancer. Nat Genet (2015) 47:1212–9. doi: 10.1038/ng.3391
214. Halpern KB, Shenhav R, Matcovitch-Natan O, Toth B, Lemze D, Golan M, et al. Single-cell spatial reconstruction reveals global division of labour in the mammalian liver. Nature (2017) 542:352–6. doi: 10.1038/nature21065
215. Medaglia C, Giladi A, Stoler-Barak L, De Giovanni M, Salame TM, Biram A, et al. Spatial reconstruction of immune niches by combining photoactivatable reporters and scRNA-seq. Science (2017) 358:1622–6. doi: 10.1126/science.aao4277
216. Satija R, Farrell JA, Gennert D, Schier AF, Regev A. Spatial reconstruction of single-cell gene expression data. Nat Biotechnol (2015) 33:495–502. doi: 10.1038/nbt.3192
217. Ren X, Kang B, Zhang Z. Understanding tumor ecosystems by single-cell sequencing: promises and limitations. Genome Biol (2018) 19:211. doi: 10.1186/s13059-018-1593-z
218. Zhao J, Guo C, Xiong F, Yu J, Ge J, Wang H, et al. Single cell RNA-seq reveals the landscape of tumor and infiltrating immune cells in nasopharyngeal carcinoma. Cancer Lett (2020) 477:131–43. doi: 10.1016/j.canlet.2020.02.010
219. Qian J, Olbrecht S, Boeckx B, Vos H, Laoui D, Etlioglu E, et al. A pan-cancer blueprint of the heterogeneous tumor microenvironment revealed by single-cell profiling. Cell Res (2020) 30:745–62. doi: 10.1038/s41422-020-0355-0
220. Sathe A, Grimes S, Lau BT, Chen J, Suarez C, Huang R, et al. Single cell genomic characterization reveals the cellular reprogramming of the gastric tumor microenvironment. Clin Cancer Res (2020) 26(11):2640–53. doi: 10.1158/1078-0432.CCR-19-3231
221. Moncada R, Barkley D, Wagner F, Chiodin M, Devlin JC, Baron M, et al. Integrating microarray-based spatial transcriptomics and single-cell RNA-seq reveals tissue architecture in pancreatic ductal adenocarcinomas. Nat Biotechnol (2020) 38:333–42. doi: 10.1038/s41587-019-0392-8
222. Xiao Z, Dai Z, Locasale JW. Metabolic landscape of the tumor microenvironment at single cell resolution. Nat Commun (2019) 10:3763. doi: 10.1038/s41467-019-11738-0
223. Gomes T, Teichmann SA, Talavera-López C. Immunology Driven by Large-Scale Single-Cell Sequencing. Trends Immunol (2019) 40:1011–21. doi: 10.1016/j.it.2019.09.004
224. Singh M, Al-Eryani G, Carswell S, Ferguson JM, Blackburn J, Barton K, et al. High-throughput targeted long-read single cell sequencing reveals the clonal and transcriptional landscape of lymphocytes. Nat Commun (2019) 10:3120. doi: 10.1038/s41467-019-11049-4
225. Simon JS, Botero S, Simon SM. Sequencing the peripheral blood B and T cell repertoire - Quantifying robustness and limitations. J Immunol Methods (2018) 463:137–47. doi: 10.1016/j.jim.2018.10.003
226. De Simone M, Rossetti G, Pagani M. Single Cell T Cell Receptor Sequencing: Techniques and Future Challenges. Front Immunol (2018) 9:1638. doi: 10.3389/fimmu.2018.01638
227. Cui J-H, Lin K-R, Yuan S-H, Jin Y-B, Chen X-P, Su X-K, et al. TCR Repertoire as a Novel Indicator for Immune Monitoring and Prognosis Assessment of Patients With Cervical Cancer. Front Immunol (2018) 9:2729. doi: 10.3389/fimmu.2018.02729
228. Aversa I, Malanga D, Fiume G, Palmieri C. Molecular T-Cell Repertoire Analysis as Source of Prognostic and Predictive Biomarkers for Checkpoint Blockade Immunotherapy. Int J Mol Sci (2020) 21(7):2378. doi: 10.3390/ijms21072378
229. van der Leun AM, Thommen DS, Schumacher TN. CD8+ T cell states in human cancer: insights from single-cell analysis. Nat Rev Cancer (2020) 20:218–32. doi: 10.1038/s41568-019-0235-4
230. Fu K, Hui B, Wang Q, Lu C, Shi W, Zhang Z, et al. Single-cell RNA sequencing of immune cells in gastric cancer patients. Aging (2020) 12:2747–63. doi: 10.18632/aging.102774
231. Li H, van der Leun AM, Yofe I, Lubling Y, Gelbard-Solodkin D, van Akkooi ACJ, et al. Dysfunctional CD8 T Cells Form a Proliferative, Dynamically Regulated Compartment within Human Melanoma. Cell (2019) 176:775–789.e18. doi: 10.1016/j.cell.2018.11.043
232. Savas P, Virassamy B, Ye C, Salim A, Mintoff CP, Caramia F, et al. Single-cell profiling of breast cancer T cells reveals a tissue-resident memory subset associated with improved prognosis. Nat Med (2018) 24:986–93. doi: 10.1038/s41591-018-0078-7
233. Heppt MV, Steeb T, Schlager JG, Rosumeck S, Dressler C, Ruzicka T, et al. Immune checkpoint blockade for unresectable or metastatic uveal melanoma: A systematic review. Cancer Treat Rev (2017) 60:44–52. doi: 10.1016/j.ctrv.2017.08.009
234. Aibar S, González-Blas CB, Moerman T, Huynh-Thu VA, Imrichova H, Hulselmans G, et al. SCENIC: single-cell regulatory network inference and clustering. Nat Methods (2017) 14:1083–6. doi: 10.1038/nmeth.4463
235. Papili Gao N, Ud-Dean SMM, Gandrillon O, Gunawan R. SINCERITIES: inferring gene regulatory networks from time-stamped single cell transcriptional expression profiles. Bioinformatics (2018) 34:258–66. doi: 10.1093/bioinformatics/btx575
236. Efremova M, Vento-Tormo M, Teichmann SA, Vento-Tormo R. CellPhoneDB v2.0: Inferring cell-cell communication from combined expression of multi-subunit receptor-ligand complexes. Nat Protoc (2020) 15:1484–506. doi: 10.1038/s41596-020-0292-x
237. Cabello-Aguilar S, Alame M, Kon-Sun-Tack F, Fau C, Lacroix M, Colinge J. SingleCellSignalR: inference of intercellular networks from single-cell transcriptomics. Nucleic Acids Res (2020) 48:e55. doi: 10.1093/nar/gkaa183
238. Vieira Braga FA, Kar G, Berg M, Carpaij OA, Polanski K, Simon LM, et al. A cellular census of human lungs identifies novel cell states in health and in asthma. Nat Med (2019) 25:1153–63. doi: 10.1038/s41591-019-0468-5
239. Boisset J-C, Vivié J, Grün D, Muraro MJ, Lyubimova A, van Oudenaarden A. Mapping the physical network of cellular interactions. Nat Methods (2018) 15:547–53. doi: 10.1038/s41592-018-0009-z
240. Argelaguet R, Velten B, Arnol D, Dietrich S, Zenz T, Marioni JC, et al. Multi-Omics Factor Analysis-a framework for unsupervised integration of multi-omics data sets. Mol Syst Biol (2018) 14:e8124. doi: 10.15252/msb.20178124
241. Macaulay IC, Haerty W, Kumar P, Li YI, Hu TX, Teng MJ, et al. G&T-seq: parallel sequencing of single-cell genomes and transcriptomes. Nat Methods (2015) 12:519–22. doi: 10.1038/nmeth.3370
242. Dey SS, Kester L, Spanjaard B, Bienko M, van Oudenaarden A. Integrated genome and transcriptome sequencing of the same cell. Nat Biotechnol (2015) 33:285–9. doi: 10.1038/nbt.3129
243. Yan F, Powell DR, Curtis DJ, Wong NC. From reads to insight: a hitchhiker’s guide to ATAC-seq data analysis. Genome Biol (2020) 21:22. doi: 10.1186/s13059-020-1929-3
244. Buenrostro JD, Wu B, Chang HY, Greenleaf WJ. ATAC-seq: A Method for Assaying Chromatin Accessibility Genome-Wide. Curr Protoc Mol Biol (2015) 109:21.29.1–21.29.9. doi: 10.1002/0471142727.mb2129s109
245. Halstead MM, Kern C, Saelao P, Chanthavixay G, Wang Y, Delany ME, et al. Systematic alteration of ATAC-seq for profiling open chromatin in cryopreserved nuclei preparations from livestock tissues. Sci Rep (2020) 10:5230. doi: 10.1038/s41598-020-61678-9
246. Buenrostro JD, Giresi PG, Zaba LC, Chang HY, Greenleaf WJ. Transposition of native chromatin for fast and sensitive epigenomic profiling of open chromatin, DNA-binding proteins and nucleosome position. Nat Methods (2013) 10:1213–8. doi: 10.1038/nmeth.2688
247. Reznikoff WS. Transposon Tn5. Annu Rev Genet (2008) 42:269–86. doi: 10.1146/annurev.genet.42.110807.091656
248. Adey A, Morrison HG, Asan, Xun X, Kitzman JO, Turner EH, et al. Rapid, low-input, low-bias construction of shotgun fragment libraries by high-density in vitro transposition. Genome Biol (2010) 11:R119. doi: 10.1186/gb-2010-11-12-r119
249. Ackermann AM, Wang Z, Schug J, Naji A, Kaestner KH. Integration of ATAC-seq and RNA-seq identifies human alpha cell and beta cell signature genes. Mol Metab (2016) 5:233–44. doi: 10.1016/j.molmet.2016.01.002
250. Suzuki A, Onodera K, Matsui K, Seki M, Esumi H, Soga T, et al. Characterization of cancer omics and drug perturbations in panels of lung cancer cells. Sci Rep (2019) 9:19529. doi: 10.1038/s41598-019-55692-9
251. Stoeckius M, Hafemeister C, Stephenson W, Houck-Loomis B, Chattopadhyay PK, Swerdlow H, et al. Simultaneous epitope and transcriptome measurement in single cells. Nat Methods (2017) 14:865–8. doi: 10.1038/nmeth.4380
252. Peterson VM, Zhang KX, Kumar N, Wong J, Li L, Wilson DC, et al. Multiplexed quantification of proteins and transcripts in single cells. Nat Biotechnol (2017) 35:936–9. doi: 10.1038/nbt.3973
253. Shahi P, Kim SC, Haliburton JR, Gartner ZJ, Abate AR. Abseq: Ultrahigh-throughput single cell protein profiling with droplet microfluidic barcoding. Sci Rep (2017) 7:44447. doi: 10.1038/srep44447
254. Martin J, Christina Fan H, Shum E. Oligo-conjugated antibodies (Ab-seq) and massively parallel single cell sequencing reveal the high parameter correlation of protein and mRNA expression in individual immune cells. J Immunol (2018) 200:120.33–3.
255. Saiselet M, Rodrigues-Vitória J, Tourneur A, Craciun L, Spinette A, Larsimont D, et al. Transcriptional output, cell types densities and normalization in spatial transcriptomics. J Mol Cell Biol (2020) mjaa028. doi: 10.1093/jmcb/mjaa028
256. Asp M, Salmén F, Ståhl PL, Vickovic S, Felldin U, Löfling M, et al. Spatial detection of fetal marker genes expressed at low level in adult human heart tissue. Sci Rep (2017) 7:12941. doi: 10.1038/s41598-017-13462-5
257. Berglund E, Maaskola J, Schultz N, Friedrich S, Marklund M, Bergenstråhle J, et al. Spatial maps of prostate cancer transcriptomes reveal an unexplored landscape of heterogeneity. Nat Commun (2018) 9:2419. doi: 10.1038/s41467-018-04724-5
258. Ståhl PL, Salmén F, Vickovic S, Lundmark A, Navarro JF, Magnusson J, et al. Visualization and analysis of gene expression in tissue sections by spatial transcriptomics. Science (2016) 353:78–82. doi: 10.1126/science.aaf2403
259. Thrane K, Eriksson H, Maaskola J, Hansson J, Lundeberg J. Spatially Resolved Transcriptomics Enables Dissection of Genetic Heterogeneity in Stage III Cutaneous Malignant Melanoma. Cancer Res (2018) 78:5970–9. doi: 10.1158/0008-5472.CAN-18-0747
260. Maniatis S, Äijö T, Vickovic S, Braine C, Kang K, Mollbrink A, et al. Spatiotemporal dynamics of molecular pathology in amyotrophic lateral sclerosis. Science (2019) 364:89–93. doi: 10.1126/science.aav9776
261. Delile J, Rayon T, Melchionda M, Edwards A, Briscoe J, Sagner A. Single cell transcriptomics reveals spatial and temporal dynamics of gene expression in the developing mouse spinal cord. Development (2019) 146:dev173807. doi: 10.1242/dev.173807
262. Mohenska M, Tan NM, Tokolyi A, Furtado MB, Costa MW, Perry AJ, et al. 3D-Cardiomics: A spatial transcriptional atlas of the mammalian heart. bioRxiv (2019) 792002. doi: 10.1101/792002
263. Van TM, Blank CU. A user’s perspective on GeoMxTM digital spatial profiling. Immuno-Oncol Technol (2019) 1:11–8. doi: 10.1016/j.iotech.2019.05.001
264. Rodriques SG, Stickels RR, Goeva A, Martin CA, Murray E, Vanderburg CR, et al. Slide-seq: A scalable technology for measuring genome-wide expression at high spatial resolution. Science (2019) 363:1463–7. doi: 10.1126/science.aaw1219
265. Xia C, Babcock HP, Moffitt JR, Zhuang X. Multiplexed detection of RNA using MERFISH and branched DNA amplification. Sci Rep (2019) 9:7721. doi: 10.1038/s41598-019-43943-8
266. Xia C, Fan J, Emanuel G, Hao J, Zhuang X. Spatial transcriptome profiling by MERFISH reveals subcellular RNA compartmentalization and cell cycle-dependent gene expression. Proc Natl Acad Sci USA (2019) 116:19490–9. doi: 10.1073/pnas.1912459116
267. Wang G, Moffitt JR, Zhuang X. Multiplexed imaging of high-density libraries of RNAs with MERFISH and expansion microscopy. Sci Rep (2018) 8:4847. doi: 10.1038/s41598-018-22297-7
268. Chen KH, Boettiger AN, Moffitt JR, Wang S, Zhuang X. RNA imaging. Spatially resolved, highly multiplexed RNA profiling in single cells. Science (2015) 348:aaa6090. doi: 10.1126/science.aaa6090
269. Moffitt JR, Zhuang X. Chapter One - RNA Imaging with Multiplexed Error-Robust Fluorescence In Situ Hybridization (MERFISH). In: Filonov GS, Jaffrey SR, editors. Methods in Enzymology. Netherlands: Elsevier (2016). p. 1–49.
271. Wang X, Allen WE, Wright MA, Sylwestrak EL, Samusik N, Vesuna S, et al. Three-dimensional intact-tissue sequencing of single-cell transcriptional states. Science (2018) 361(6400):eaat5691. doi: 10.1126/science.aat5691
272. Koch L. Transcriptomics in intact tissues. Nature reviews. Genetics (2018) 19:593. doi: 10.1038/s41576-018-0045-7
273. Keren L, Bosse M, Thompson S, Risom T, Vijayaragavan K, McCaffrey E, et al. MIBI-TOF: A multiplexed imaging platform relates cellular phenotypes and tissue structure. Sci Adv (2019) 5:eaax5851. doi: 10.1126/sciadv.aax5851
274. Angelo M, Bendall SC, Finck R, Hale MB, Hitzman C, Borowsky AD, et al. Multiplexed ion beam imaging of human breast tumors. Nat Med (2014) 20:436–42. doi: 10.1038/nm.3488
275. Ptacek J, Locke D, Finck R, Cvijic M-E, Li Z, Tarolli JG, et al. Multiplexed ion beam imaging (MIBI) for characterization of the tumor microenvironment across tumor types. Lab Invest (2020) 100:1111–23. doi: 10.1038/s41374-020-0417-4
276. Goltsev Y, Samusik N, Kennedy-Darling J, Bhate S, Hale M, Vazquez G, et al. Deep Profiling of Mouse Splenic Architecture with CODEX Multiplexed Imaging. Cell (2018) 174:968–81.e15. doi: 10.1016/j.cell.2018.07.010
277. Beechem JM. High-Plex Spatially Resolved RNA and Protein Detection Using Digital Spatial Profiling: A Technology Designed for Immuno-oncology Biomarker Discovery and Translational Research. Methods Mol Biol (2020) 2055:563–83. doi: 10.1007/978-1-4939-9773-2_25
278. Amaria RN, Reddy SM, Tawbi HA, Davies MA, Ross MI, Glitza IC, et al. Neoadjuvant immune checkpoint blockade in high-risk resectable melanoma. Nat Med (2018) 24:1649–54. doi: 10.1038/s41591-018-0197-1
279. Blank CU, Rozeman EA, Fanchi LF, Sikorska K, van de Wiel B, Kvistborg P, et al. Neoadjuvant versus adjuvant ipilimumab plus nivolumab in macroscopic stage III melanoma. Nat Med (2018) 24:1655–61. doi: 10.1038/s41591-018-0198-0
280. Merritt CR, Ong GT, Church S, Barker K, Geiss G, Hoang M, et al. High multiplex, digital spatial profiling of proteins and RNA in fixed tissue using genomic detection methods. Cold Spring Harbor Laboratory (2019) p:559021. doi: 10.1101/559021
281. Perrin J, Capitao M, Mougin-Degraef M, Guérard F, Faivre-Chauvet A, Rbah-Vidal L, et al. Cell Tracking in Cancer Immunotherapy. Front Med (2020) 7:34. doi: 10.3389/fmed.2020.00034
282. Youn H, Hong K-J. In vivo non invasive molecular imaging for immune cell tracking in small animals. Immune Netw (2012) 12:223–9. doi: 10.4110/in.2012.12.6.223
283. Liu Z, Li Z. Molecular imaging in tracking tumor-specific cytotoxic T lymphocytes (CTLs). Theranostics (2014) 4:990–1001. doi: 10.7150/thno.9268
284. Penheiter AR, Russell SJ, Carlson SK. The sodium iodide symporter (NIS) as an imaging reporter for gene, viral, and cell-based therapies. Curr Gene Ther (2012) 12:33–47. doi: 10.2174/156652312799789235
285. Ponomarev V, Doubrovin M, Serganova I, Beresten T, Vider J, Shavrin A, et al. Cytoplasmically retargeted HSV1-tk/GFP reporter gene mutants for optimization of noninvasive molecular-genetic imaging. Neoplasia (2003) 5:245–54. doi: 10.1016/S1476-5586(03)80056-8
286. Serganova I, Blasberg RG. Molecular Imaging with Reporter Genes: Has Its Promise Been Delivered? J Nucl Med (2019) 60:1665–81. doi: 10.2967/jnumed.118.220004
287. Muñoz-Álvarez KA, Altomonte J, Laitinen I, Ziegler S, Steiger K, Esposito I, et al. PET imaging of oncolytic VSV expressing the mutant HSV-1 thymidine kinase transgene in a preclinical HCC rat model. Mol Ther (2015) 23:728–36. doi: 10.1038/mt.2015.12
288. Sumen C, Mempel TR, Mazo IB, von Andrian UH. Intravital microscopy: visualizing immunity in context. Immunity (2004) 21:315–29. doi: 10.1016/j.immuni.2004.08.006
289. Pittet MJ, Garris CS, Arlauckas SP, Weissleder R. Recording the wild lives of immune cells. Sci Immunol (2018) 3(27):eaaq0491. doi: 10.1126/sciimmunol.aaq0491
290. Torcellan T, Stolp J, Chtanova T. In Vivo Imaging Sheds Light on Immune Cell Migration and Function in Cancer. Front Immunol (2017) 8:309. doi: 10.3389/fimmu.2017.00309
291. Mulazzani M, Fräßle SP, von Mücke-Heim I, Langer S, Zhou X, Ishikawa-Ankerhold H, et al. Long-term in vivo microscopy of CAR T cell dynamics during eradication of CNS lymphoma in mice. Proc Natl Acad Sci USA (2019) 116:24275–84. doi: 10.1073/pnas.1903854116
292. Evans TA, Barkauskas DS, Silver J. Intravital imaging of immune cells and their interactions with other cell types in the spinal cord: Experiments with multicolored moving cells. Exp Neurol (2019) 320:112972. doi: 10.1016/j.expneurol.2019.112972
293. Tavri S, Jha P, Meier R, Henning TD, Müller T, Hostetter D, et al. Optical imaging of cellular immunotherapy against prostate cancer. Mol Imag (2009) 8:15–26. doi: 10.2310/7290.2009.00002
294. Wang F, Wan H, Ma Z, Zhong Y, Sun Q, Tian Y, et al. Light-sheet microscopy in the near-infrared II window. Nat Methods (2019) 16:545–52. doi: 10.1038/s41592-019-0398-7
295. Dzhagalov IL, Melichar HJ, Ross JO, Herzmark P, Robey EA. Two-photon imaging of the immune system. Curr Protoc Cytom (2012) Chapter 12:Unit12.26. doi: 10.1002/0471142956.cy1226s60
296. Denk W, Strickler JH, Webb WW. Two-photon laser scanning fluorescence microscopy. Science (1990) 248:73–6. doi: 10.1126/science.2321027
297. Tsai PS, Kleinfeld D. In Vivo Two-Photon Laser Scanning Microscopy with Concurrent Plasma-Mediated Ablation Principles and Hardware Realization. In: Frostig RD, editor. In Vivo Optical Imaging of Brain Function. Boca Raton (FL: CRC Press/Taylor & Francis (2016).
298. Nimmerjahn A, Theer P, Helmchen F. Two-Photon Laser Scanning Microscopy. In: Braun M, Gilch P, Zinth W, editors. Ultrashort Laser Pulses in Biology and Medicine. Berlin, Heidelberg: Springer Berlin Heidelberg (2008). p. 29–51.
299. Lodygin D, Odoardi F, Schläger C, Körner H, Kitz A, Nosov M, et al. A combination of fluorescent NFAT and H2B sensors uncovers dynamics of T cell activation in real time during CNS autoimmunity. Nat Med (2013) 19:784–90. doi: 10.1038/nm.3182
300. Stoll S, Delon J, Brotz TM, Germain RN. Dynamic imaging of T cell-dendritic cell interactions in lymph nodes. Science (2002) 296:1873–6. doi: 10.1126/science.1071065
301. Bousso P, Robey EA. Dynamic behavior of T cells and thymocytes in lymphoid organs as revealed by two-photon microscopy. Immunity (2004) 21:349–55. doi: 10.1016/j.immuni.2004.08.005
302. Miller MJ, Wei SH, Cahalan MD, Parker I. Autonomous T cell trafficking examined in vivo with intravital two-photon microscopy. Proc Natl Acad Sci USA (2003) 100:2604–9. doi: 10.1073/pnas.2628040100
303. Bousso P, Bhakta NR, Lewis RS, Robey E. Dynamics of thymocyte-stromal cell interactions visualized by two-photon microscopy. Science (2002) 296:1876–80. doi: 10.1126/science.1070945
304. Kim JE, Kalimuthu S, Ahn B-C. In vivo cell tracking with bioluminescence imaging. Nucl Med Mol Imag (2015) 49:3–10. doi: 10.1007/s13139-014-0309-x
305. Sadikot RT, Blackwell TS. Bioluminescence imaging. Proc Am Thorac Soc (2005) 2:537–40, 511–2. doi: 10.1513/pats.200507-067DS
306. Rabinovich BA, Ye Y, Etto T, Chen JQ, Levitsky HI, Overwijk WW, et al. Visualizing fewer than 10 mouse T cells with an enhanced firefly luciferase in immunocompetent mouse models of cancer. Proc Natl Acad Sci USA (2008) 105:14342–6. doi: 10.1073/pnas.0804105105
307. Chewning JH, Dugger KJ, Chaudhuri TR, Zinn KR, Weaver CT. Bioluminescence-based visualization of CD4 T cell dynamics using a T lineage-specific luciferase transgenic model1. BMC Immunol (2009) 10:44. doi: 10.1186/1471-2172-10-44
308. Kim H, Peng G, Hicks JM, Weiss HL, Van Meir EG, Brenner MK, et al. Engineering human tumor-specific cytotoxic T cells to function in a hypoxic environment. Mol Ther (2008) 16:599–606. doi: 10.1038/sj.mt.6300391
309. Costa GL, Sandora MR, Nakajima A, Nguyen EV, Taylor-Edwards C, Slavin AJ, et al. Adoptive immunotherapy of experimental autoimmune encephalomyelitis via T cell delivery of the IL-12 p40 subunit. J Immunol (2001) 167:2379–87. doi: 10.4049/jimmunol.167.4.2379
310. Ciarrocchi E, Belcari N. Cerenkov luminescence imaging: physics principles and potential applications in biomedical sciences. EJNMMI Phys (2017) 4:14. doi: 10.1186/s40658-017-0181-8
311. Mitchell GS, Gill RK, Boucher DL, Li C, Cherry SR. In vivo Cerenkov luminescence imaging: a new tool for molecular imaging. Philos Trans A Math Phys Eng Sci (2011) 369:4605–19. doi: 10.1098/rsta.2011.0271
312. Desvaux E, Courteau A, Bellaye P-S, Guillemin M, Drouet C, Walker P, et al. Cherenkov luminescence imaging is a fast and relevant preclinical tool to assess tumour hypoxia in vivo. EJNMMI Res (2018) 8:111. doi: 10.1186/s13550-018-0464-7
313. Boschi F, De Sanctis F, Ugel S, Spinelli AE. T-cell tracking using Cerenkov and radioluminescence imaging. J Biophotonics (2018) 11:e201800093. doi: 10.1002/jbio.201800093
314. Tian L, Wang Y, Sun L, Xu J, Chao Y, Yang K, et al. Cerenkov Luminescence-Induced NO Release from 32P-Labeled ZnFe(CN)5NO Nanosheets to Enhance Radioisotope-Immunotherapy. Matter (2019) 1:1061–76. doi: 10.1016/j.matt.2019.07.007
315. Kather JN, Calderaro J. Development of AI-based pathology biomarkers in gastrointestinal and liver cancer. Nat Rev Gastroenterol Hepatol (2020) 17:591–2. doi: 10.1038/s41575-020-0343-3
316. Chapelin F, Capitini CM, Ahrens ET. Fluorine-19 MRI for detection and quantification of immune cell therapy for cancer. J Immunother Cancer (2018) 6:105. doi: 10.1186/s40425-018-0416-9
318. Krekorian M, Fruhwirth GO, Srinivas M, Figdor CG, Heskamp S, Witney TH, et al. Imaging of T-cells and their responses during anti-cancer immunotherapy. Theranostics (2019) 9:7924–47. doi: 10.7150/thno.37924
319. Srinivas M, Melero I, Kaempgen E, Figdor CG, de Vries IJM. Cell tracking using multimodal imaging. Contrast Media Mol Imag (2013) 8:432–8. doi: 10.1002/cmmi.1561
320. Ulmer S, Backens M, Ahlhelm FJ. Basic Principles and Clinical Applications of Magnetic Resonance Spectroscopy in Neuroradiology. J Comput Assist Tomogr (2016) 40:1–13. doi: 10.1097/RCT.0000000000000322
321. Tanifum EA, Patel C, Liaw ME, Pautler RG, Annapragada AV. Hydrophilic fluorinated molecules for spectral 19F MRI. Sci Rep (2018) 8:2889. doi: 10.1038/s41598-018-21178-3
322. Schmieder AH, Caruthers SD, Keupp J, Wickline SA, Lanza GM. Recent Advances in 19Fluorine Magnetic Resonance Imaging with Perfluorocarbon Emulsions. Engineering (2015) 1:475–89. doi: 10.15302/J-ENG-2015103
323. Ahrens ET, Bulte JWM. Tracking immune cells in vivo using magnetic resonance imaging. Nat Rev Immunol (2013) 13:755–63. doi: 10.1038/nri3531
324. Rad AM, Arbab AS, Iskander ASM, Jiang Q, Soltanian-Zadeh H. Quantification of superparamagnetic iron oxide (SPIO)-labeled cells using MRI. J Magn Reson Imag (2007) 26:366–74. doi: 10.1002/jmri.20978
325. Wang Y-XJ, Xuan S, Port M, Idee J-M. Recent advances in superparamagnetic iron oxide nanoparticles for cellular imaging and targeted therapy research. Curr Pharm Des (2013) 19:6575–93. doi: 10.2174/1381612811319370003
326. Kircher MF, Allport JR, Graves EE, Love V, Josephson L, Lichtman AH, et al. In vivo high resolution three-dimensional imaging of antigen-specific cytotoxic T-lymphocyte trafficking to tumors. Cancer Res (2003) 63:6838–46.
327. Wu C, Xu Y, Yang L, Wu J, Zhu W, Li D, et al. Negatively Charged Magnetite Nanoparticle Clusters as Efficient MRI Probes for Dendritic Cell Labeling and In Vivo Tracking. Adv Funct Mater (2015) 25:3581–91. doi: 10.1002/adfm.201501031
328. Tremblay M-L, Davis C, Bowen CV, Stanley O, Parsons C, Weir G, et al. Using MRI cell tracking to monitor immune cell recruitment in response to a peptide-based cancer vaccine. Magn Reson Med (2018) 80:304–16. doi: 10.1002/mrm.27018
329. Janjic JM, Srinivas M, Kadayakkara DKK, Ahrens ET. Self-delivering nanoemulsions for dual fluorine-19 MRI and fluorescence detection. J Am Chem Soc (2008) 130:2832–41. doi: 10.1021/ja077388j
330. Janjic JM, Ahrens ET. Fluorine-containing nanoemulsions for MRI cell tracking. Wiley Interdiscip Rev Nanomed Nanobiotechnol (2009) 1:492–501. doi: 10.1002/wnan.35
331. Neuberger T, Schöpf B, Hofmann H, Hofmann M, von Rechenberg B. Superparamagnetic nanoparticles for biomedical applications: Possibilities and limitations of a new drug delivery system. J Magn Magn Mater (2005) 293:483–96. doi: 10.1016/j.jmmm.2005.01.064
332. Liu L, Hitchens TK, Ye Q, Wu Y, Barbe B, Prior DE, et al. Decreased reticuloendothelial system clearance and increased blood half-life and immune cell labeling for nano- and micron-sized superparamagnetic iron-oxide particles upon pre-treatment with Intralipid. Biochim Biophys Acta (2013) 1830:3447–53. doi: 10.1016/j.bbagen.2013.01.021
333. Chapelin F, Gao S, Okada H, Weber TG, Messer K, Ahrens ET. Fluorine-19 nuclear magnetic resonance of chimeric antigen receptor T cell biodistribution in murine cancer model. Sci Rep (2017) 7:17748. doi: 10.1038/s41598-017-17669-4
334. Gonzales C, Yoshihara HAI, Dilek N, Leignadier J, Irving M, Mieville P, et al. In-Vivo Detection and Tracking of T Cells in Various Organs in a Melanoma Tumor Model by 19F-Fluorine MRS/MRI. PloS One (2016) 11:e0164557. doi: 10.1371/journal.pone.0164557
335. Ahrens ET, Helfer BM, O’Hanlon CF, Schirda C. Clinical cell therapy imaging using a perfluorocarbon tracer and fluorine-19 MRI. Magn Reson Med (2014) 72:1696–701. doi: 10.1002/mrm.25454
336. Wei W, Rosenkrans ZT, Liu J, Huang G, Luo Q-Y, Cai W. ImmunoPET: Concept, Design, and Applications. Chem Rev (2020) 120:3787–851. doi: 10.1021/acs.chemrev.9b00738
337. Wei W, Jiang D, Ehlerding EB, Luo Q, Cai W. Noninvasive PET Imaging of T cells. Trends Cancer Res (2018) 4:359–73. doi: 10.1016/j.trecan.2018.03.009
338. McCracken MN, Tavaré R, Witte ON, Wu AM. Advances in PET Detection of the Antitumor T Cell Response. Adv Immunol (2016) 131:187–231. doi: 10.1016/bs.ai.2016.02.004
339. Fu R, Carroll L, Yahioglu G, Aboagye EO, Miller PW. Antibody Fragment and Affibody ImmunoPET Imaging Agents: Radiolabelling Strategies and Applications. ChemMedChem (2018) 13:2466–78. doi: 10.1002/cmdc.201800624
341. Reddy S, Robinson MK. Immuno-positron emission tomography in cancer models. Semin Nucl Med (2010) 40:182–9. doi: 10.1053/j.semnuclmed.2009.12.004
342. Harmsen MM, De Haard HJ. Properties, production, and applications of camelid single-domain antibody fragments. Appl Microbiol Biotechnol (2007) 77:13–22. doi: 10.1007/s00253-007-1142-2
343. Yu X, Xu Q, Wu Y, Jiang H, Wei W, Zulipikaer A, et al. Nanobodies derived from Camelids represent versatile biomolecules for biomedical applications. Biomater Sci (2020) 8:3559–73. doi: 10.1039/D0BM00574F
344. Arbabi-Ghahroudi M. Camelid Single-Domain Antibodies: Historical Perspective and Future Outlook. Front Immunol (2017) 8:1589. doi: 10.3389/fimmu.2017.01589
345. Olafsen T, Wu AM. Antibody vectors for imaging. Semin Nucl Med (2010) 40:167–81. doi: 10.1053/j.semnuclmed.2009.12.005
346. Löfblom J, Feldwisch J, Tolmachev V, Carlsson J, Ståhl S, Frejd FY. Affibody molecules: engineered proteins for therapeutic, diagnostic and biotechnological applications. FEBS Lett (2010) 584:2670–80. doi: 10.1016/j.febslet.2010.04.014
347. Seo JW, Tavaré R, Mahakian LM, Silvestrini MT, Tam S, Ingham ES, et al. CD8+ T-Cell Density Imaging with 64Cu-Labeled Cys-Diabody Informs Immunotherapy Protocols. Clin Cancer Res (2018) 24:4976–87. doi: 10.1158/1078-0432.CCR-18-0261
348. Tavaré R, McCracken MN, Zettlitz KA, Salazar FB, Olafsen T, Witte ON, et al. Immuno-PET of Murine T Cell Reconstitution Postadoptive Stem Cell Transplantation Using Anti-CD4 and Anti-CD8 Cys-Diabodies. J Nucl Med (2015) 56:1258–64. doi: 10.2967/jnumed.114.153338
349. Tavaré R, McCracken MN, Zettlitz KA, Knowles SM, Salazar FB, Olafsen T, et al. Engineered antibody fragments for immuno-PET imaging of endogenous CD8+ T cells in vivo. Proc Natl Acad Sci USA (2014) 111:1108–13. doi: 10.1073/pnas.1316922111
350. Rashidian M, LaFleur MW, Verschoor VL, Dongre A, Zhang Y, Nguyen TH, et al. Immuno-PET identifies the myeloid compartment as a key contributor to the outcome of the antitumor response under PD-1 blockade. Proc Natl Acad Sci USA (2019) 116:16971–80. doi: 10.1073/pnas.1905005116
351. Larimer BM, Wehrenberg-Klee E, Caraballo A, Mahmood U. Quantitative CD3 PET Imaging Predicts Tumor Growth Response to Anti-CTLA-4 Therapy. J Nucl Med (2016) 57:1607–11. doi: 10.2967/jnumed.116.173930
352. Mall S, Yusufi N, Wagner R, Klar R, Bianchi H, Steiger K, et al. Immuno-PET Imaging of Engineered Human T Cells in Tumors. Cancer Res (2016) 76:4113–23. doi: 10.1158/0008-5472.CAN-15-2784
353. Keu KV, Witney TH, Yaghoubi S, Rosenberg J, Kurien A, Magnusson R, et al. Reporter gene imaging of targeted T cell immunotherapy in recurrent glioma. Sci Transl Med (2017) 9(373):eaag2196. doi: 10.1126/scitranslmed.aag2196
354. Brown CE, Badie B, Barish ME, Weng L, Ostberg JR, Chang W-C, et al. Bioactivity and Safety of IL13Rα2-Redirected Chimeric Antigen Receptor CD8+ T Cells in Patients with Recurrent Glioblastoma. Clin Cancer Res (2015) 21:4062–72. doi: 10.1158/1078-0432.CCR-15-0428
355. Ravera S, Reyna-Neyra A, Ferrandino G, Amzel LM, Carrasco N. The Sodium/Iodide Symporter (NIS): Molecular Physiology and Preclinical and Clinical Applications. Annu Rev Physiol (2017) 79:261–89. doi: 10.1146/annurev-physiol-022516-034125
356. Chefer S, Seidel J, Cockrell AS, Yount B, Solomon J, Hagen KR, et al. The Human Sodium Iodide Symporter as a Reporter Gene for Studying Middle East Respiratory Syndrome Coronavirus Pathogenesis. mSphere (2018) 3(6):e00540–18. doi: 10.1128/mSphere.00540-18
357. Markovic SN, Galli F, Suman VJ, Nevala WK, Paulsen AM, Hung JC, et al. Non-invasive visualization of tumor infiltrating lymphocytes in patients with metastatic melanoma undergoing immune checkpoint inhibitor therapy: a pilot study. Oncotarget (2018) 9:30268–78. doi: 10.18632/oncotarget.25666
358. Shaker MA, Younes HM. Interleukin-2: evaluation of routes of administration and current delivery systems in cancer therapy. J Pharm Sci (2009) 98:2268–98. doi: 10.1002/jps.21596
359. Alam IS, Mayer AT, Sagiv-Barfi I, Wang K, Vermesh O, Czerwinski DK, et al. Imaging activated T cells predicts response to cancer vaccines. J Clin Invest (2018) 128:2569–80. doi: 10.1172/JCI98509
360. Klar R, Schober S, Rami M, Mall S, Merl J, Hauck SM, et al. Therapeutic targeting of naturally presented myeloperoxidase-derived HLA peptide ligands on myeloid leukemia cells by TCR-transgenic T cells. Leukemia (2014) 28:2355–66. doi: 10.1038/leu.2014.131
361. Griessinger CM, Maurer A, Kesenheimer C, Kehlbach R, Reischl G, Ehrlichmann W, et al. 64Cu antibody-targeting of the T-cell receptor and subsequent internalization enables in vivo tracking of lymphocytes by PET. Proc Natl Acad Sci USA (2015) 112:1161–6. doi: 10.1073/pnas.1418391112
362. Freise AC, Zettlitz KA, Salazar FB, Lu X, Tavaré R, Wu AM. ImmunoPET Imaging of Murine CD4+ T Cells Using Anti-CD4 Cys-Diabody: Effects of Protein Dose on T Cell Function and Imaging. Mol Imaging Biol (2017) 19:599–609. doi: 10.1007/s11307-016-1032-z
363. Tavaré R, Escuin-Ordinas H, Mok S, McCracken MN, Zettlitz KA, Salazar FB, et al. An Effective Immuno-PET Imaging Method to Monitor CD8-Dependent Responses to Immunotherapy. Cancer Res (2016) 76:73–82. doi: 10.1158/0008-5472.CAN-15-1707
364. Pandit-Taskar N, Postow MA, Hellmann MD, Harding JJ, Barker CA, O’Donoghue JA, et al. First-in-Humans Imaging with 89Zr-Df-IAB22M2C Anti-CD8 Minibody in Patients with Solid Malignancies: Preliminary Pharmacokinetics, Biodistribution, and Lesion Targeting. J Nucl Med (2020) 61:512–9. doi: 10.2967/jnumed.119.229781
365. Hartimath SV, Draghiciu O, van de Wall S, Manuelli V, Dierckx RAJO, Nijman HW, et al. Noninvasive monitoring of cancer therapy induced activated T cells using [18F]FB-IL-2 PET imaging. Oncoimmunology (2017) 6:e1248014. doi: 10.1080/2162402X.2016.1248014
366. van der Veen EL, Antunes IF, Maarsingh P, Hessels-Scheper J, Zijlma R, Boersma HH, et al. Clinical-grade N-(4-[18F]fluorobenzoyl)-interleukin-2 for PET imaging of activated T-cells in humans. EJNMMI Radiopharm Chem (2019) 4:15. doi: 10.1186/s41181-019-0062-7
367. Di Gialleonardo V, Signore A, Glaudemans AWJM, Dierckx RAJO. De Vries EFJ. N-(4-18F-fluorobenzoyl)interleukin-2 for PET of human-activated T lymphocytes. J Nucl Med (2012) 53:679–86. doi: 10.2967/jnumed.111.091306
368. Litjens NHR, Huisman M, van den Dorpel M, Betjes MGH. Impaired immune responses and antigen-specific memory CD4+ T cells in hemodialysis patients. J Am Soc Nephrol (2008) 19:1483–90. doi: 10.1681/ASN.2007090971
369. Man F, Lim L, Volpe A, Gabizon A, Shmeeda H, Draper B, et al. In Vivo PET Tracking of 89Zr-Labeled Vγ9Vδ2 T Cells to Mouse Xenograft Breast Tumors Activated with Liposomal Alendronate. Mol Ther (2019) 27:219–29. doi: 10.1016/j.ymthe.2018.10.006
370. Yusufi N, Mall S, Bianchi H de O, Steiger K, Reder S, Klar R, et al. In-depth Characterization of a TCR-specific Tracer for Sensitive Detection of Tumor-directed Transgenic T Cells by Immuno-PET. Theranostics (2017) 7:2402–16. doi: 10.7150/thno.17994
371. Waaijer SJ, Giesen D, Ishiguro T, Sano Y, Sugaya N, Schröder CP, et al. Preclinical PET imaging of bispecific antibody ERY974 targeting CD3 and glypican 3 reveals that tumor uptake correlates to T cell infiltrate. J Immunother Cancer (2020) 8(1):e000548. doi: 10.1136/jitc-2020-000548
372. Suurs FV, Lorenczewski G, Stienen S, Friedrich M, de Vries EGE, De Groot DJA, et al. Biodistribution of a CD3/EpCAM bispecific T-cell engager is driven by the CD3 arm. J Nucl Med (2020) 61(11):1594–601. doi: 10.2967/jnumed.120.241877
373. Kanagawa M, Doi Y, Oka S, Kobayashi R, Nakata N, Toyama M, et al. Comparison of trans-1-amino-3-[18F]fluorocyclobutanecarboxylic acid (anti-[18F]FACBC) accumulation in lymph node prostate cancer metastasis and lymphadenitis in rats. Nucl Med Biol (2014) 41:545–51. doi: 10.1016/j.nucmedbio.2014.04.004
374. Oka S, Okudaira H, Ono M, Schuster DM, Goodman MM, Kawai K, et al. Differences in transport mechanisms of trans-1-amino-3-[18F]fluorocyclobutanecarboxylic acid in inflammation, prostate cancer, and glioma cells: comparison with L-[methyl-11C]methionine and 2-deoxy-2-[18F]fluoro-D-glucose. Mol Imaging Biol (2014) 16:322–9. doi: 10.1007/s11307-013-0693-0
375. Nye JA, Schuster DM, Yu W, Camp VM, Goodman MM, Votaw JR. Biodistribution and radiation dosimetry of the synthetic nonmetabolized amino acid analogue anti-18F-FACBC in humans. J Nucl Med (2007) 48:1017–20. doi: 10.2967/jnumed.107.040097
376. Radu CG, Shu CJ, Nair-Gill E, Shelly SM, Barrio JR, Satyamurthy N, et al. Molecular imaging of lymphoid organs and immune activation by positron emission tomography with a new [18F]-labeled 2’-deoxycytidine analog. Nat Med (2008) 14:783–8. doi: 10.1038/nm1724
377. Antonios JP, Soto H, Everson RG, Moughon DL, Wang AC, Orpilla J, et al. Detection of immune responses after immunotherapy in glioblastoma using PET and MRI. Proc Natl Acad Sci USA (2017) 114:10220–5. doi: 10.1073/pnas.1706689114
378. Salas JR, Chen BY, Wong A, Cheng D, Van Arnam JS, Witte ON, et al. 18F-FAC PET Selectively Images Liver-Infiltrating CD4 and CD8 T Cells in a Mouse Model of Autoimmune Hepatitis. J Nucl Med (2018) 59:1616–23. doi: 10.2967/jnumed.118.210328
379. Kim W, Le TM, Wei L, Poddar S, Bazzy J, Wang X, et al. [18F]CFA as a clinically translatable probe for PET imaging of deoxycytidine kinase activity. Proc Natl Acad Sci U S A (2016) 113:4027–32. doi: 10.1073/pnas.1524212113
380. Figdor CG, de Vries IJM, Lesterhuis WJ, Melief CJM. Dendritic cell immunotherapy: mapping the way. Nat Med (2004) 10:475–80. doi: 10.1038/nm1039
381. Palucka K, Banchereau J. Dendritic-cell-based therapeutic cancer vaccines. Immunity (2013) 39:38–48. doi: 10.1016/j.immuni.2013.07.004
382. Ribas A, Benz MR, Allen-Auerbach MS, Radu C, Chmielowski B, Seja E, et al. Imaging of CTLA4 blockade-induced cell replication with (18)F-FLT PET in patients with advanced melanoma treated with tremelimumab. J Nucl Med (2010) 51:340–6. doi: 10.2967/jnumed.109.070946
383. Aarntzen EHJG, Srinivas M, De Wilt JHW, Jacobs JFM, Lesterhuis WJ, Windhorst AD, et al. Early identification of antigen-specific immune responses in vivo by [18F]-labeled 3’-fluoro-3’-deoxy-thymidine ([18F]FLT) PET imaging. Proc Natl Acad Sci USA (2011) 108:18396–9. doi: 10.1073/pnas.1113045108
384. Been LB, Suurmeijer AJH, Cobben DCP, Jager PL, Hoekstra HJ, Elsinga PH. [18F]FLT-PET in oncology: current status and opportunities. Eur J Nucl Med Mol Imag (2004) 31:1659–72. doi: 10.1007/s00259-004-1687-6
385. Ronald JA, Kim B-S, Gowrishankar G, Namavari M, Alam IS, D’Souza A, et al. A PET Imaging Strategy to Visualize Activated T Cells in Acute Graft-versus-Host Disease Elicited by Allogenic Hematopoietic Cell Transplant. Cancer Res (2017) 77:2893–902. doi: 10.1158/0008-5472.CAN-16-2953
386. Colevas AD, Bedi N, Chang S, Nieves UYM, Chatterjee S, Davidzon GA, et al. A study to evaluate immunological response to PD-1 inhibition in squamous cell carcinoma of the head and neck (SCCHN) using novel PET imaging with [18F]F-AraG. J Clin Orthod (2018) 36:6050–0. doi: 10.1200/JCO.2018.36.15_suppl.6050
387. Ito K, Teng R, Schöder H, Humm JL, Ni A, Michaud L, et al. 18F-FDG PET/CT for Monitoring of Ipilimumab Therapy in Patients with Metastatic Melanoma. J Nucl Med (2019) 60:335–41. doi: 10.2967/jnumed.118.213652
388. Kaira K, Higuchi T, Naruse I, Arisaka Y, Tokue A, Altan B, et al. Metabolic activity by 18F-FDG-PET/CT is predictive of early response after nivolumab in previously treated NSCLC. Eur J Nucl Med Mol Imag (2018) 45:56–66. doi: 10.1007/s00259-017-3806-1
389. Aide N, Hicks RJ, Le Tourneau C, Lheureux S, Fanti S, Lopci E. FDG PET/CT for assessing tumour response to immunotherapy : Report on the EANM symposium on immune modulation and recent review of the literature. Eur J Nucl Med Mol Imag (2019) 46:238–50. doi: 10.1007/s00259-018-4171-4
390. Mekki A, Dercle L, Lichtenstein P, Marabelle A, Michot J-M, Lambotte O, et al. Detection of immune-related adverse events by medical imaging in patients treated with anti-programmed cell death 1. Eur J Cancer (2018) 96:91–104. doi: 10.1016/j.ejca.2018.03.006
391. Grabner A, Kentrup D, Edemir B, Sirin Y, Pavenstädt H, Schlatter E, et al. PET with 18F-FDG-labeled T lymphocytes for diagnosis of acute rat renal allograft rejection. J Nucl Med (2013) 54:1147–53. doi: 10.2967/jnumed.112.109231
392. Larimer BM, Wehrenberg-Klee E, Dubois F, Mehta A, Kalomeris T, Flaherty K, et al. Granzyme B PET Imaging as a Predictive Biomarker of Immunotherapy Response. Cancer Res (2017) 77:2318–27. doi: 10.1158/0008-5472.CAN-16-3346
393. LaSalle T, Austin EE, Rigney G, Wehrenberg-Klee E, Nesti S, Larimer B, et al. Granzyme B PET imaging of immune-mediated tumor killing as a tool for understanding immunotherapy response. J Immunother Cancer (2020) 8(1):e000291. doi: 10.1136/jitc-2019-000291
394. Larimer BM, Bloch E, Nesti S, Austin EE, Wehrenberg-Klee E, Boland G, et al. The Effectiveness of Checkpoint Inhibitor Combinations and Administration Timing Can Be Measured by Granzyme B PET Imaging. Clin Cancer Res (2019) 25:1196–205. doi: 10.1158/1078-0432.CCR-18-2407
395. Konishi M, Erdem SS, Weissleder R, Lichtman AH, McCarthy JR, Libby P. Imaging Granzyme B Activity Assesses Immune-Mediated Myocarditis. Circ Res (2015) 117:502–12. doi: 10.1161/CIRCRESAHA.115.306364
396. Gibson HM, McKnight BN, Malysa A, Dyson G, Wiesend WN, McCarthy CE, et al. IFNγ PET Imaging as a Predictive Tool for Monitoring Response to Tumor Immunotherapy. Cancer Res (2018) 78:5706–17. doi: 10.1158/0008-5472.CAN-18-0253
397. Natarajan A, Mayer AT, Xu L, Reeves RE, Gano J, Gambhir SS. Novel Radiotracer for ImmunoPET Imaging of PD-1 Checkpoint Expression on Tumor Infiltrating Lymphocytes. Bioconjug Chem (2015) 26:2062–9. doi: 10.1021/acs.bioconjchem.5b00318
398. Niemeijer AN, Leung D, Huisman MC, Bahce I, Hoekstra OS, van Dongen GAMS, et al. Whole body PD-1 and PD-L1 positron emission tomography in patients with non-small-cell lung cancer. Nat Commun (2018) 9:4664. doi: 10.1038/s41467-018-07131-y
399. Higashikawa K, Yagi K, Watanabe K, Kamino S, Ueda M, Hiromura M, et al. 64Cu-DOTA-anti-CTLA-4 mAb enabled PET visualization of CTLA-4 on the T-cell infiltrating tumor tissues. PloS One (2014) 9:e109866. doi: 10.1371/journal.pone.0109866
400. Saarinen I, Jambor I, Kim M, Kuisma A, Kemppainen J, Merisaari H, et al. Correlation between 18F-1-amino-3-fluorocyclobutane-1-carboxylic acid (18F-fluciclovine) uptake and expression of alanine-serine-cysteine-transporter 2 (ASCT2) and L-type amino acid transporter 1 (LAT1) in primary prostate cancer. EJNMMI Res (2019) 9:50. doi: 10.1186/s13550-019-0518-5
401. Häfliger P, Charles R-P. The L-Type Amino Acid Transporter LAT1-An Emerging Target in Cancer. Int J Mol Sci (2019) 20(10):2428. doi: 10.3390/ijms20102428
402. Cooper TM. Role of nelarabine in the treatment of T-cell acute lymphoblastic leukemia and T-cell lymphoblastic lymphoma. Ther Clin Risk Manage (2007) 3:1135–41.
403. Franc BL, Goth S, MacKenzie J, Li X, Blecha J, Lam T, et al. In Vivo PET Imaging of the Activated Immune Environment in a Small Animal Model of Inflammatory Arthritis. Mol Imag (2017) 16:1536012117712638. doi: 10.1177/1536012117712638
404. Yang J, Pemberton A, Morrison WI, Connelley T. Granzyme B Is an Essential Mediator in CD8+ T Cell Killing of Theileria parva-Infected Cells. Infect Immun (2019) 87(1):e00386–18. doi: 10.1128/IAI.00386-18
Keywords: immune topography, solid tumors, immune exclusion, imaging techniques, deep learning, single-cell analysis
Citation: Pietrobon V, Cesano A, Marincola F and Kather JN (2021) Next Generation Imaging Techniques to Define Immune Topographies in Solid Tumors. Front. Immunol. 11:604967. doi: 10.3389/fimmu.2020.604967
Received: 10 September 2020; Accepted: 03 December 2020;
Published: 27 January 2021.
Edited by:
Carlo Bifulco, Providence Portland Medical Center, United StatesReviewed by:
Xuyao Zhang, Fudan University, ChinaBrian Piening, Earle A. Chiles Research Institute, United States
Copyright © 2021 Pietrobon, Cesano, Marincola and Kather. This is an open-access article distributed under the terms of the Creative Commons Attribution License (CC BY). The use, distribution or reproduction in other forums is permitted, provided the original author(s) and the copyright owner(s) are credited and that the original publication in this journal is cited, in accordance with accepted academic practice. No use, distribution or reproduction is permitted which does not comply with these terms.
*Correspondence: Violena Pietrobon, dmlvbGVuYXBpZXRyb2JvbkBnbWFpbC5jb20=; Jakob Nikolas Kather, amFrb2Iua2F0aGVyQGdtYWlsLmNvbQ==