 Darci Phillips1,2
 Christian M. Schürch1,3
 Michael S. Khodadoust4Youn H. Kim2,4
 Garry P. Nolan1
 Sizun Jiang1*
- 1Department of Pathology, Stanford University School of Medicine, Stanford, CA, United States
- 2Department of Dermatology, Stanford University School of Medicine, Stanford, CA, United States
- 3Department of Pathology and Neuropathology, University Hospital and Comprehensive Cancer Center Tübingen, Tübingen, Germany
- 4Division of Oncology, Stanford University School of Medicine, Stanford, CA, United States
Immunotherapies are revolutionizing cancer treatment by boosting the natural ability of the immune system. In addition to antibodies against traditional checkpoint molecules or their ligands (i.e., CTLA-4, PD-1, and PD-L1), therapies targeting molecules such as ICOS, IDO-1, LAG-3, OX40, TIM-3, and VISTA are currently in clinical trials. To better inform clinical care and the design of therapeutic combination strategies, the co-expression of immunoregulatory proteins on individual immune cells within the tumor microenvironment must be robustly characterized. Highly multiplexed tissue imaging platforms, such as CO-Detection by indEXing (CODEX), are primed to meet this need by enabling >50 markers to be simultaneously analyzed in single-cells on formalin-fixed paraffin-embedded (FFPE) tissue sections. Assembly and validation of antibody panels is particularly challenging, with respect to the specificity of antigen detection and robustness of signal over background. Herein, we report the design, development, optimization, and application of a 56-marker CODEX antibody panel to eight cutaneous T cell lymphoma (CTCL) patient samples. This panel is comprised of structural, tumor, and immune cell markers, including eight immunoregulatory proteins that are approved or currently undergoing clinical trials as immunotherapy targets. Here we provide a resource to enable extensive high-dimensional, spatially resolved characterization of the tissue microenvironment across tumor types and imaging modalities. This framework provides researchers with a readily applicable blueprint to study tumor immunology, tissue architecture, and enable mechanistic insights into immunotherapeutic targets.
Introduction
Immunotherapies work through the blockage or stimulation of immunoregulatory proteins to enhance the body’s innate ability to target and destroy tumor cells. CTLA-4, PD-1, and PD-L1 are the most widely studied inhibitory checkpoint molecules, and drugs targeting these proteins have revolutionized treatment for numerous solid and hematological malignancies (1). Unfortunately, only about 20% of patients derive long-lasting benefits from current immunotherapies (2). Novel therapies targeting inhibitory (e.g., IDO-1, LAG-3, TIGIT, TIM-3, VISTA) and stimulatory (e.g., ICOS, GITR, OX40, 4-IBB) proteins within the tumor microenvironment (TME) are under active investigation (3–7). Clinical trials are also underway to combine these novel pre-clinical treatments with established anti-CTLA-4 (i.e., ipilimumab) and anti-PD-1 (i.e., pembrolizumab and nivolumab) therapies for greater effect (7–13). This expanding list of targets underscores the urgent need to characterize the expression of immunoregulatory proteins, in the native context of individual cells within the TME, to drive immunotherapy selection for cancer patients (14).
Clinical staining of immunoregulatory proteins is routinely performed with conventional one- or two-color immunohistochemistry (IHC). Studying more than two markers either requires a careful selection of primary antibodies (i.e., raised in different species to prevent cross-reactivity with the secondary antibodies) or the use of consecutive tissue sections, which is problematic for studying samples with low tissue availability and makes it extremely difficult to co-localize markers at the single-cell level. Therefore, conventional IHC drastically limits accurate classification of both cell-type and function (e.g., reactive PD-1+ CD4+ T cells versus immunosuppressive PD-1+ FOXP3+ CD4+ T cells). This in turn limits a comprehensive understanding of the TME and the factors underlying immunotherapy responsiveness.
The emergence of multiplexed tissue imaging has enabled researchers to overcome these challenges and to further our understanding of cancer immunotherapy. Recent work exemplifies how multiplexed IHC (mIHC) is superior to single-plex PD-L1 IHC, tumor mutational burden, or gene expression profiling for predicting response to PD-1/PD-L1 blockade therapies across 10 different solid tumors (15). CO-Detection by indEXing (CODEX), a commercialized and accessible multiplexed tissue imaging platform (Akoya Biosciences, Menlo Park, California, USA), uses oligonucleotide-conjugated antibodies and sequential fluorescent reporters, to detect up to 60 markers simultaneously in a single tissue section at resolutions that resolve individual cells. As such, CODEX generates detailed information on the distribution of different cellular phenotypes, while maintaining the morphological context of healthy and diseased tissues (16). Since the CODEX method was first described in 2018 (17), this technology has been successfully adapted for use in FFPE tissues (16, 18) and applied to immunophenotype solid (16) and hematological (19) malignancies. Establishment of a companion computational framework has been crucial for processing raw CODEX imaging data, mapping cellular interactions, and analyzing cellular neighborhoods (16–21). These studies have accelerated the discovery of new immune cell subsets (16, 17) and biomarkers (19), and correlated spatial organization with cancer prognosis (16) and immunotherapeutic outcomes (19).
A fundamental aspect of the CODEX methodology relies upon a well-designed and validated antibody panel. Combining up to 60 markers in a single experiment requires that all antibodies to stain robustly under the same antigen retrieval condition, and that antibody performance is optimized by the imaging order. Herein, we describe the establishment of a 56-marker panel to analyze FFPE cutaneous T cell lymphoma (CTCL) tissues by CODEX. This panel comprises immune, tumor, and structural (e.g., epithelial, stromal, vascular) markers. It also includes eight immunoregulatory proteins—ICOS, IDO-1, LAG-3, PD-1, PD-L1, OX40, Tim-3, and VISTA—to simultaneously phenotype, localize, and quantify these functional molecules on individual cells within the TME, adding important insights to the field of cancer immunotherapy. This work serves as a blueprint for customizing CODEX antibody panels and provides researchers and clinicians with a working antibody panel for high-dimensional characterization of the TME, with broad adaptability to different malignancies of interest or alternative imaging platforms, such as Imaging Mass Cytometry (IMC) (22–24), Multiplexed Ion Beam Imaging (MIBI) (25–28), and tissue-based cyclic immunofluorescence (t-CyCIF) (29).
Methods
Tissue Material
Skin tumor samples were obtained from CTCL patients treated at Stanford University. Written informed consent was obtained from all patients. The use of their tissues for this research was fully anonymized and approved by the Stanford University IRB Administrative Panels on Human Subjects in Medical Research (HSR 46894). FFPE histology blocks were generated according to standard pathology procedures (30). A tissue microarray was then created from eight CTCL specimens (Supplementary Table 1). Tissue microarray cores were 0.6 mm in diameter and acquired from the most heavily tumor-infiltrated area of the biopsy. The tissue microarray was sectioned at 4-µm thickness and mounted onto Vectabond™-treated (Vector Laboratories, Burlingame, CA, USA; #SP-1800) square glass coverslips (Electron Microscopy Sciences, Hatfield, PA, USA; #72204-01), as previously described (16, 19).
Antibodies and DNA Oligonucleotide Conjugation
Commercially available purified, carrier-free monoclonal and polyclonal anti-human antibodies (Table 1) were conjugated to maleimide-modified short DNA oligonucleotides [TriLink Biotechnologies, San Diego, CA, USA; for detailed oligonucleotide sequences see (16)] at a 2:1 weight/weight ratio of oligonucleotide to antibody, as previously described (16, 18, 19). Conjugated antibodies were subsequently stored at 4°C, where they remained stable for at least 1 year. Conjugated antibodies were titrated and validated under the supervision of a board-certified pathologist (C.M.S.) and confirmed with an online database (The Human Protein Atlas; www.proteinatlas.org) (31).
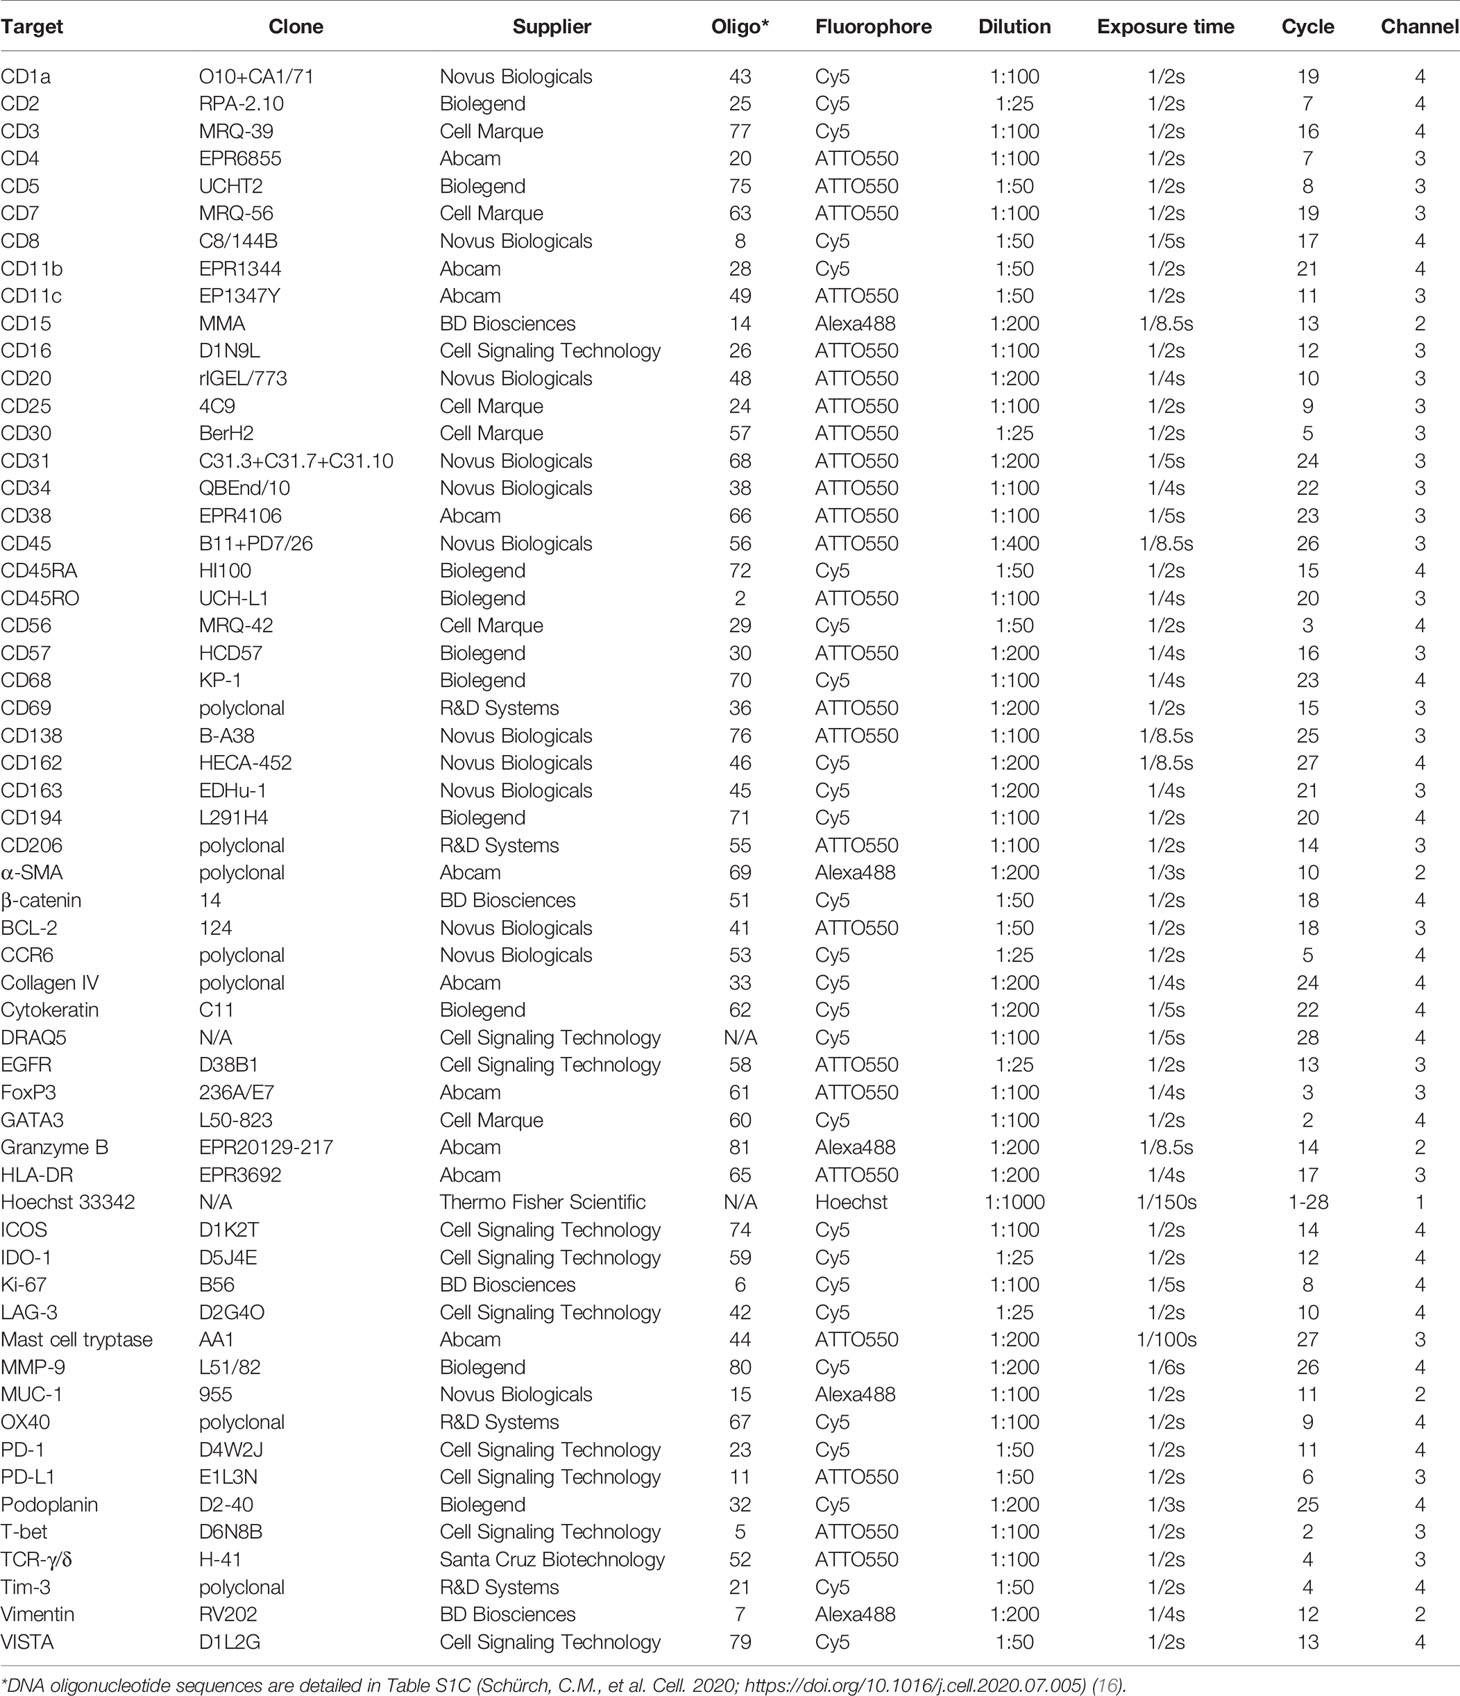
Table 1 Marker panel (56 antibodies and 2 nuclear stains) for CODEX.
CODEX Multiplexed Tissue Staining and Image Acquisition
CODEX staining and imaging were performed as previously described (16, 18, 19). Briefly, the coverslip containing the tissue section was baked at 70°C for 1 hour, deparaffinized in xylene, rehydrated in ethanol, and washed in ddH2O before performing heat-induced epitope retrieval with Dako target antigen retrieval solution, pH 9 (Agilent Technologies, Santa Clara, CA, USA; #S236784-2) at 97°C for 10 min on a LabVison PT Module (Thermo Fisher Scientific, #A80400012). The coverslip was subsequently blocked using blocking buffer [S2 buffer containing B1 (1:20), B2 (1:20), B3 (1:20), and BC4 (1:15)] and stained with the 56-marker antibody panel (Table 1) to a volume of 100 µl overnight at 4°C. After fixation with 1.6% paraformaldehyde, 100% methanol, and BS3 (Thermo Fisher Scientific, Waltham, MA, USA; #21580), the coverslip was mounted onto a custom-made acrylic plate (Bayview Plastic Solutions, Fremont, CA, USA). Imaging of the CODEX multicycle experiment was performed using an inverted fluorescence microscope (Keyence, Osaka, Japan; model BZ-X710) equipped with a CFI Plan Apo λ 20x/0.75 objective (Nikon, Tokyo, Japan), a microfluidics instrument (Akoya Biosciences, Menlo Park, CA, USA), and CODEX driver software (Akoya Biosciences, Menlo Park, CA, USA). Light exposure times and the order of markers per cycle are outlined in Table 1. The Hoechst nuclear stain (Thermo Fisher Scientific; #62249) was acquired in each cycle and DRAQ5 nuclear stain (Cell Signaling Technology, Danvers, MA, USA; #4084L) was acquired in the final cycle. After completion of the multi-cycle reaction, manual hematoxylin and eosin (H&E) staining was performed according to standard pathology procedures (30), and the tissue microarray was re-imaged in brightfield mode.
Processing and Analysis of CODEX Data
Raw TIFF image files were processed using the CODEX Toolkit, as previously described (18, 19). Briefly, after the data was uploaded, cell segmentation was performed using DRAQ5 nuclear stain. Antibody expression was quantified at the single-cell level and this data was cleaned by gating using CellEngine (https://cellengine.com). This yielded a total of 25,456 cells across the eight tissue microarray cores. The resultant FCS files were imported into the VorteX clustering software (20) and subjected to unsupervised X-shift clustering, with the following 30 parameters: CD1a, CD3, CD4, CD7, CD8, CD11c, CD15, CD20, CD25, CD30, CD31, CD34, CD38, CD45, CD56, CD68, CD138, CD163, CD206, α-smooth muscle actin, cell size, cytokeratin, FoxP3, HLA-DR, Ki-67, mast cell tryptase, PD-1, PD-L1, podoplanin, and vimentin. Cell morphology and size were used to further refine clusters manually and those with similar features were merged, resulting in 18 cell-types. As all specimens did not contain epithelium, and in turn Langerhans cells, clusters with CD11c+ dendritic cells and Langerhans cells were merged and classified as antigen presenting cells (APC). This led to 17 cell-types (Figure 2A). The expression frequencies of ICOS, IDO-1, LAG-3, PD-1, PD-L1, OX40, Tim-3, and VISTA were determined for CD4+ T cells, CD8+ T cells, Tregs, M1 macrophages, M2 macrophages, and tumor cells by manual gating in CellEngine (https://cellengine.com).
Visualizing CODEX Data
Seven-color overlay images with select markers were created in ImageJ (https://imagej.net/). Simulated brightfield IHC images were generated from CODEX fluorescence data using an ImageJ macro (https://bitbucket.org/davemason/makehdab/src/master/). Voronoi diagrams of assigned cell-types were created in Python, with slight modifications to previously described scripts (https://github.com/nolanlab/NeighborhoodCoordination/) (16).
Results
Here, we describe the development, optimization, and application of a 56-marker antibody panel to characterize the composition, spatial organization, and functional immune status of the TME in FFPE tumors by CODEX (Table 1). Marker selection was based on 1) in-house testing of antibody performance in IHC and FFPE-CODEX (16, 18, 19), 2) IHC experience in clinical pathology laboratories, 3) commercially available fluorophore-conjugated antibodies that either in their conjugated or unconjugated forms work in IHC, 4) IHC and FFPE multiplexed tissue imaging publications, and 5) online databases like The Human Protein Atlas (www.proteinatlas.org) (31). Notably, 51 of the 56 antibodies in this panel have been used in other multiplexed imaging studies (Supplementary Table 2) (16, 18, 23, 24, 26–29). These 51 antibodies were studied in different tissues (e.g., tonsil, breast cancer, colon cancer, pancreatic cancer, squamous cell carcinoma, etc.), using different modalities (i.e., CODEX, MIBI, IMC, t-CyCIF), and by different research groups (i.e., in different countries, by different operators), which emphasizes the reproducibility of these markers and satisfies an orthogonal strategy for antibody validation (32). The key contribution of the current study is therefore the presentation of a robust, working 56-marker panel focused on immunophenotyping and immunoregulation. Interested researchers can easily purchase, conjugate, and titrate the antibodies shown in Table 1 as a starting point for their own multiplexed tissue imaging panels.
All antibodies were conjugated to unique maleimide-modified DNA oligonucleotides (with lengths between 10-19 nucleotides), added to tissues that were subjected to high pH (pH 9) antigen retrieval buffer, incubated overnight at 4°C, and tested/titrated in CODEX single-staining experiments. Antibody testing was performed using tonsil (Supplementary Figure 1) and a tissue microarray with 16 healthy and 54 cancerous tissues (16, 18) to ensure the inclusion of appropriate positive and negative controls. Conjugated antibodies were stained at a dilution between 1:25 and 1:200 and visually evaluated for subcellular localization (e.g., nucleus, cytoplasm, membrane), cell-type (e.g., immune, tumor, or stromal cells), signal intensity, dynamic range, and signal-to-noise ratio.
After determining the optimal conditions for each conjugated antibody by CODEX single-staining, a 56-marker multicycle experiment was performed on a CTCL tissue microarray compiled from eight patients (Supplementary Figures 2 and 3A, B). All antibodies performed as expected when imaged during the CODEX multicycle experiment (Supplementary Figure 4), including the seven polyclonal antibodies used in this panel, which showed consistent staining intensity, appropriate spatial expression patterns, and no anomalous cross-reactivity. Importantly, the reproducibility of antibody staining is high within a single CODEX multicycle experiment for a given tissue region (16, 18, 21), between patient samples (Supplementary Figure 5) as well as across experiments processed in parallel (19). For all CODEX experiments, the first cycle is a “blank” cycle (i.e., no fluorescent oligonucleotides are added). This is critical for assigning cell-types from imaging data, which consists of subtracting background fluorescence signals that arise from auto-fluorescence and non-specific antibody binding (measured from the “blank” cycle), segmenting the image to identify individual cells, and integrating the staining intensity of all markers on each cell to identify cell-types.
The 56-marker panel consists of structural, tumor, and immune markers as well as antibodies against proteins that reflect functional cellular states and immune regulation. A representative seven-color overlay image shows structural, lymphoid, myeloid, and tumor cell markers in a CTCL tissue microarray core (Figure 1). Seven-color overlay images for all tissue microarray cores are shown in Supplementary Figure 3C.
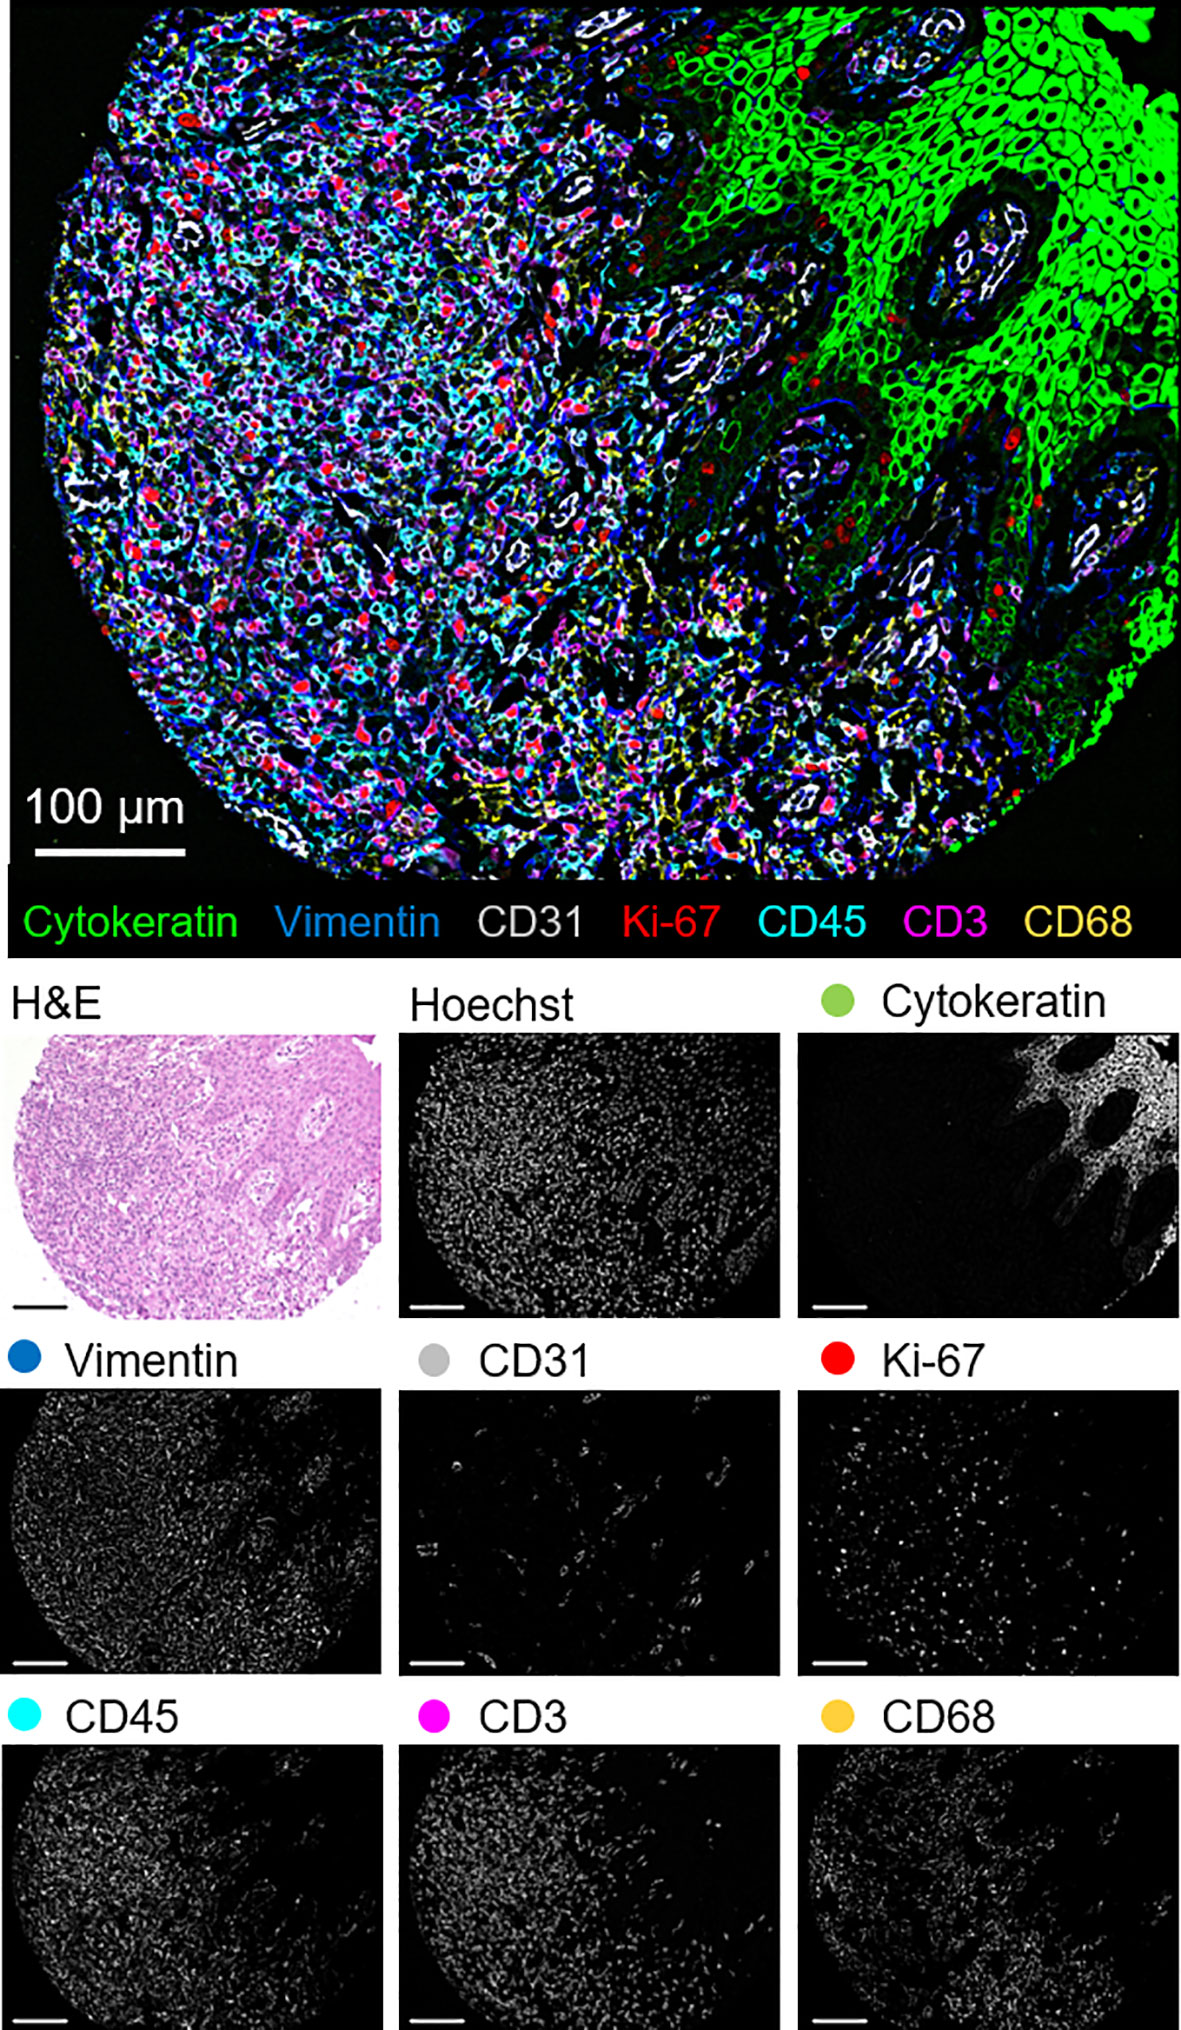
Figure 1 Detection of structural, lymphoid, myeloid, and tumor markers by CODEX in a single CTCL tissue microarray core (patient 6). Seven-color overlay image with cytokeratin (epithelium; green), vimentin (stroma; blue), CD31 (vasculature; gray), Ki-67 (proliferation; red), CD45 (leukocytes; cyan), CD3 (T cells; magenta), and CD68 (macrophages; yellow). Below panels show H&E, Hoechst (nuclear), and individual marker stainings. Scale bars, 100 µm.
This panel enables extensive immunophenotyping: 33 of the 56 antibodies recognize antigens specific for T cells, B cells, plasma cells, NK cells, macrophages, dendritic cells, Langerhans cells, granulocytes, and mast cells. In fact, 11 of the 17 identified cell-types were immune specific, where dendritic cells and Langerhans cells were merged and classified as APCs (Figure 2A). The immune cell-types include APCs, B cells, CD4+ T cells, CD8+ T cells, granulocytes, M1 macrophages, M2 macrophages, mast cells, NK cells, plasma cells, and Tregs. The frequency of immune cell subsets across all patients identified populations with high (APCs, 18%; CD4+ T cells, 18%; CD8+ T cells, 20%; M2 macrophages, 18%; Tregs, 10%), medium (B cells, 4%; M1 macrophages, 7%), and low abundance (NK cells, 2%; granulocytes, 1%; mast cells, 1%; plasma cells, 1%) (Figure 2B). Voronoi diagrams (i.e., cell position plots) were used to generate a map of immune cell-type positions (Figure 2C). These maps reveal substantial spatial heterogeneity between patients, suggesting dynamic and variable effects of immune surveillance within the TME.
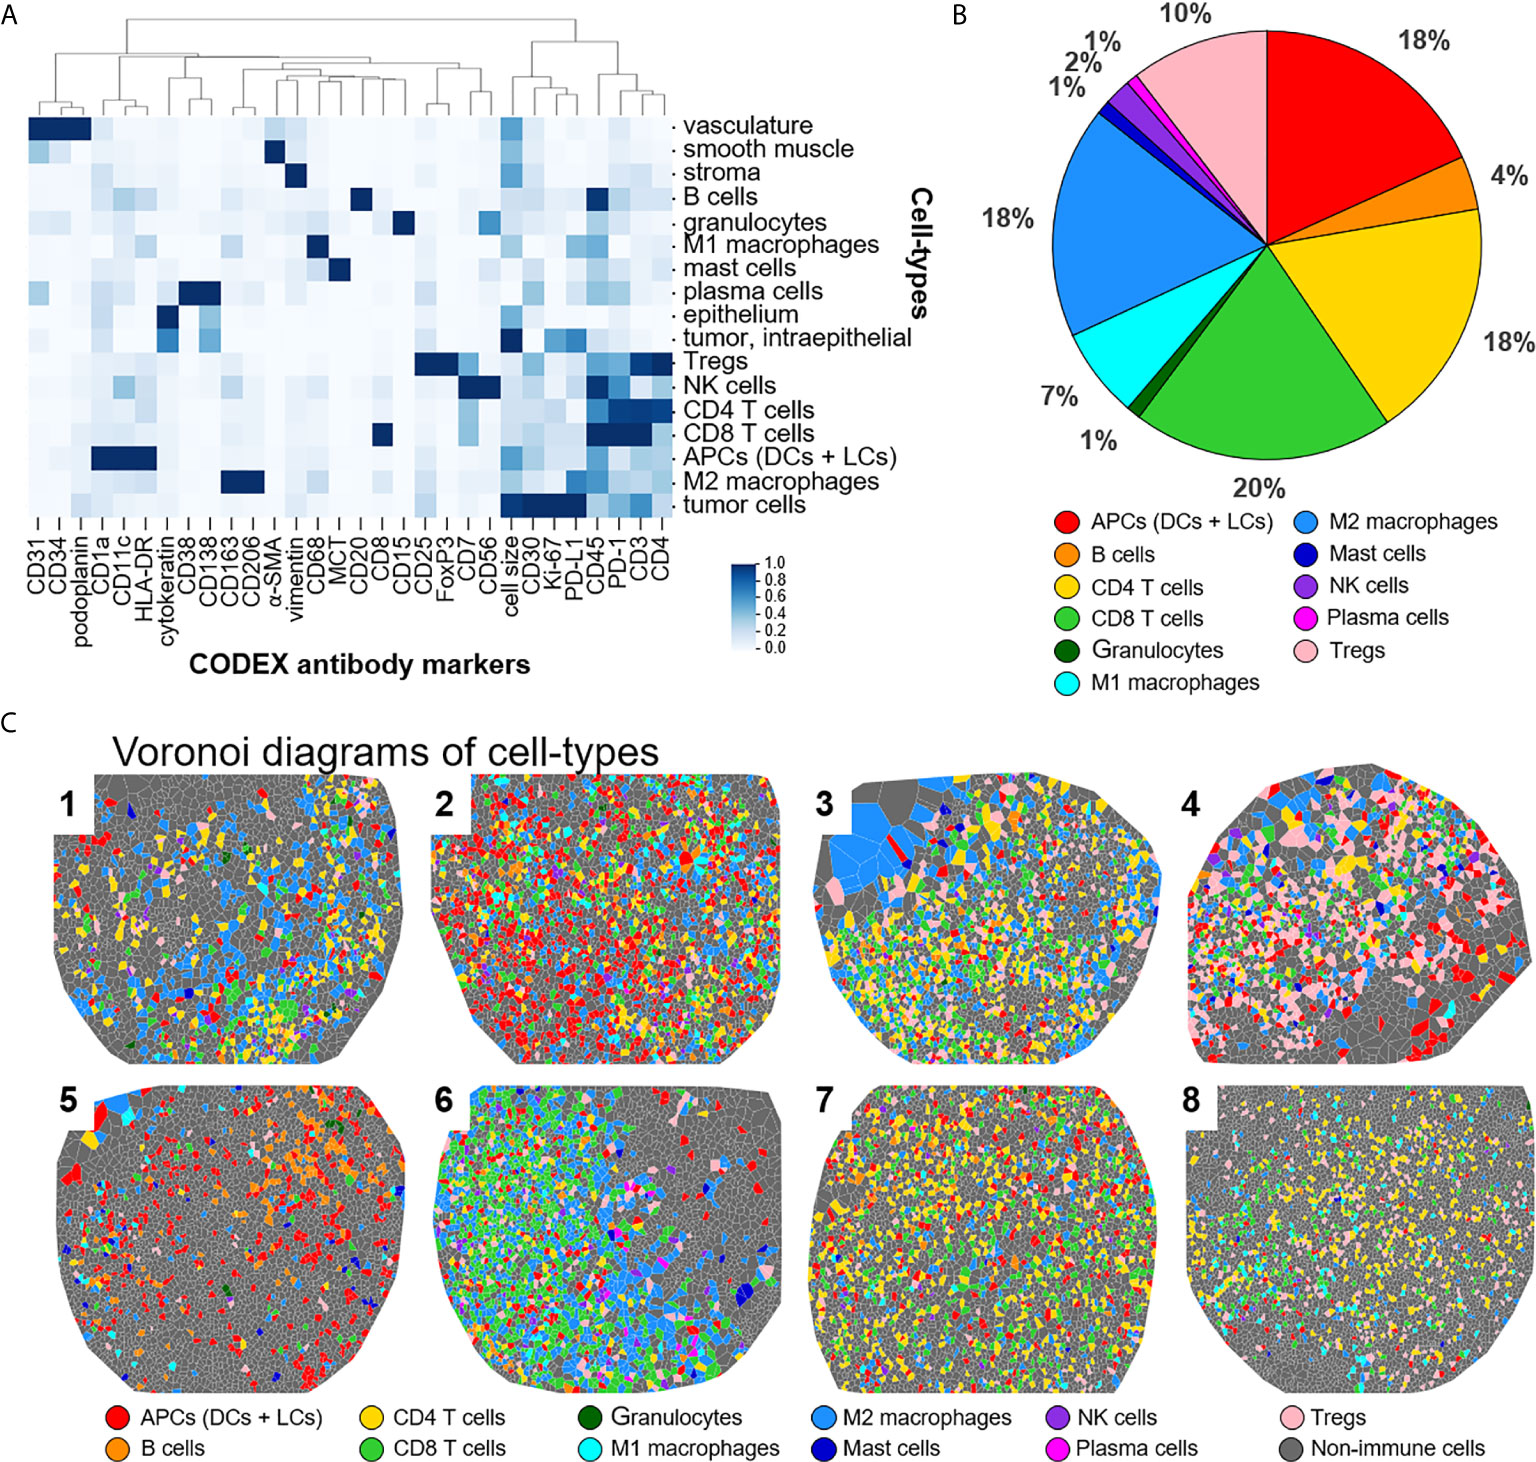
Figure 2 Detecting cell-types by CODEX. (A) Heatmap of CODEX-identified cell-types clusters by protein expression; antigen presenting cells (APCs) include dendritic cells (DCs) and Langerhans cells (LCs). (B) Immune cell composition in all patients. (C) Voronoi diagrams mapping cell-type positions, colored according to the legend.
The identification of immune cell-types has historically been based on the presence or absence of cluster of differentiation (CD) proteins, other cell surface markers, and lineage-specific transcription factors. Distinguishing cell-types in high dimensional tissue imaging data can be challenging due to 1) lateral marker spillover of cells adjacent to each other, 2) variable staining intensity of lineage-specific proteins across cell-types, and 3) simultaneously integration of lineage-specific marker expression patterns. Using higher-order unsupervised X-shift clustering (20) and manual refinement based on cell size and morphology, we were able to confidently stratify immune cell-types, even when they were bordering other lineage-specific immune cells (Figure 3). Two representative H&E-stained samples from the same tissue section, with six zoomed-in Voronoi diagrams representing the cell-types identified, are shown in Figures 3A, B. The major immune cell-types, stratified by lymphoid and myeloid lineages, are shown as Voronoi cell-type representations, 20x fluorescence images, and simulated brightfield images, which recreate the staining pattern that would be observed by conventional IHC using chromogenic methods (Figure 3C, top to bottom). Together, these data demonstrate the capability of this well-designed and titrated panel to effectively enumerate major immune cell-types and visualize their location within the overall TME architecture.
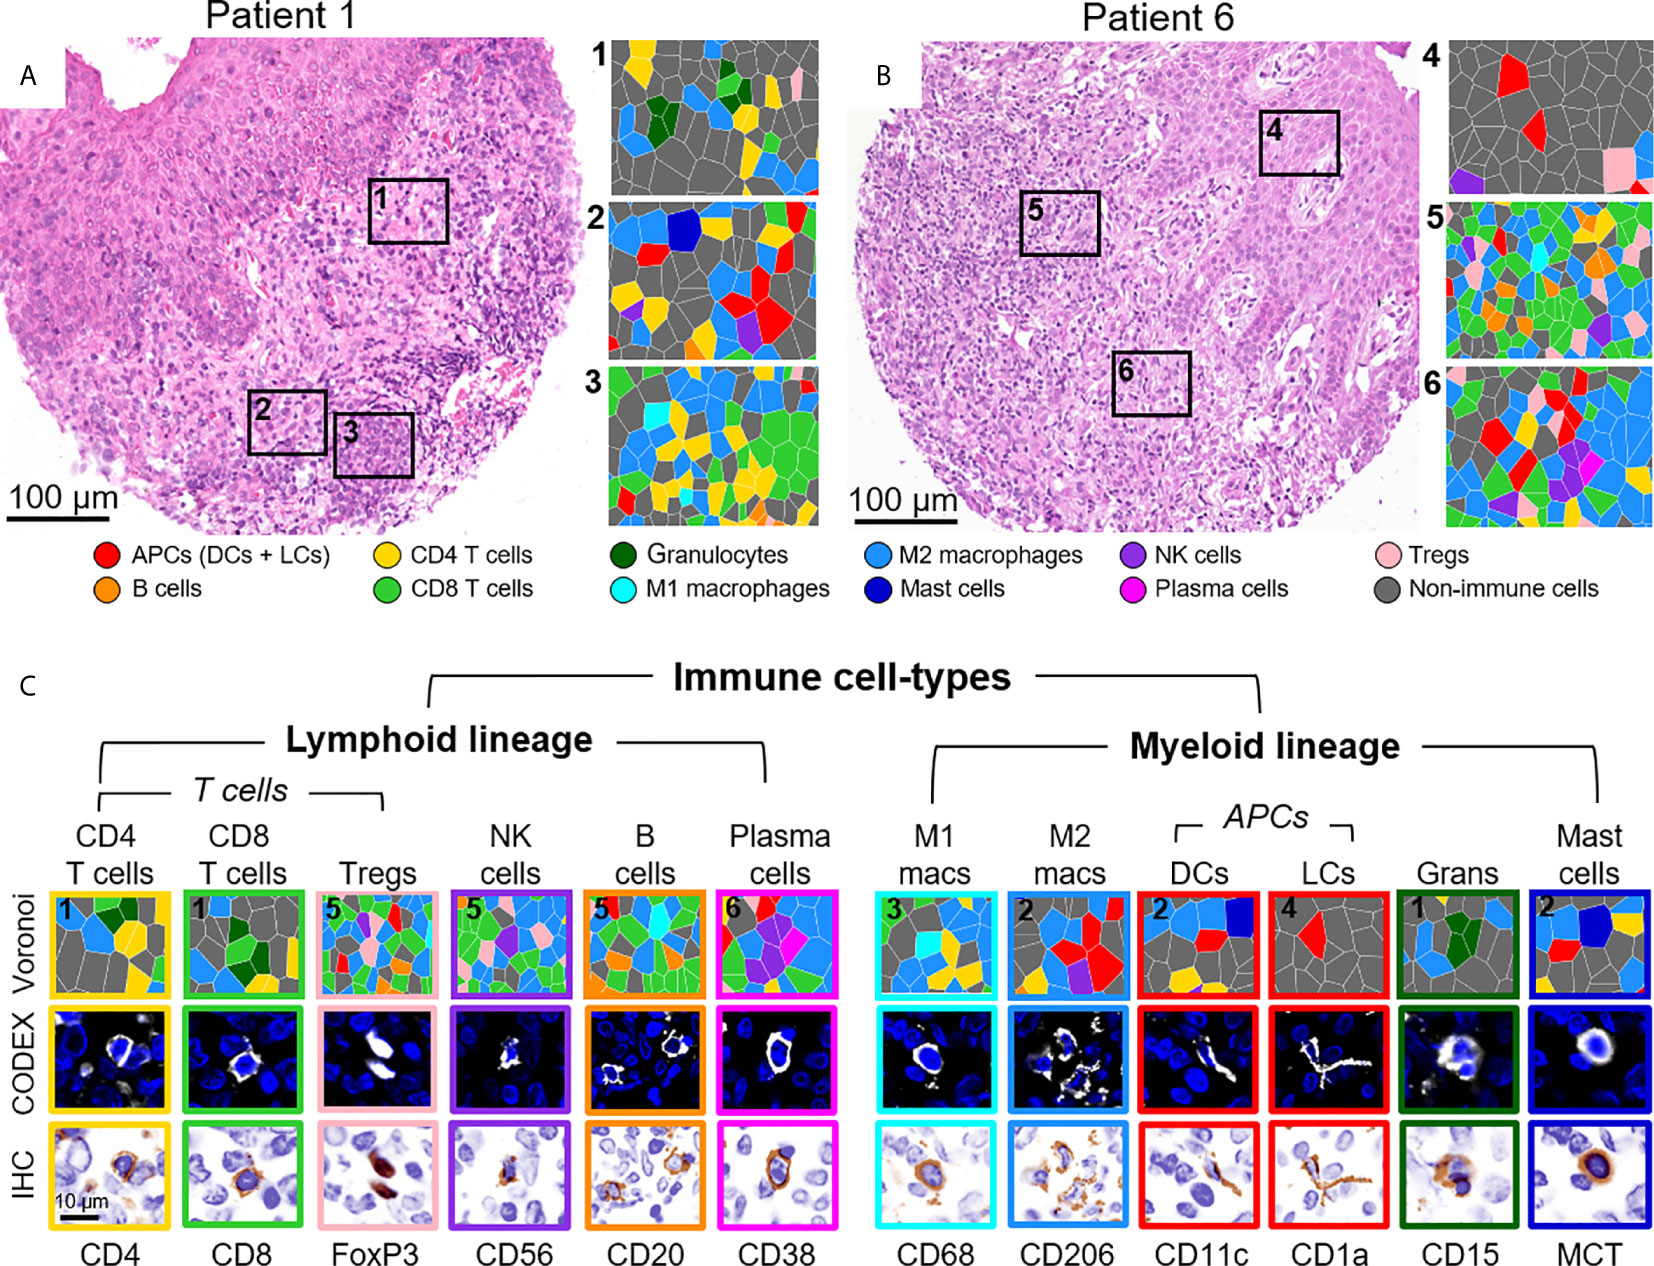
Figure 3 Visualizing immune cell-types by CODEX. (A, B) H&E stainings for two different CTCL patients and corresponding Voronoi diagrams from 6 select regions; see Figure 2B for full Voronoi diagram. (C) Major immune cell-types separated by lineage and shown as: 1) a zoomed-in region from one the six selected Voronoi diagrams, color-coded as in (A, B) (top panel), 2) a CODEX fluorescent image with Hoechst nuclear stain (blue) and the marker of interest (white) (middle panel), and 3) a simulated brightfield IHC image for the marker of interest (bottom panel). Scale bars: (A, B) 100 µm, (C) 10 µm.
In addition to phenotypic stratification, we leveraged upon the high multiplexing capabilities of CODEX to include functional markers, particularly immunoregulatory proteins that are essential for the study of cancer immunology and immunotherapy. Specifically, we focused on eight functional immune molecules that are the targets of approved or in trial immunotherapies: ICOS, IDO-1, LAG-3, OX40, PD-1, PD-L1, TIM-3, and VISTA (Figure 4A) (2, 33–37). Representative examples of the staining pattern of these markers on T cells, macrophages, and tumor cells are shown (Figure 4A). Protein expression comparisons of immune and tumor cells reveal that PD-L1 was predominantly expressed on tumor cells, while ICOS, IDO-1, LAG-3, and OX40 were predominantly present on immune cells, and TIM-3 and VISTA were expressed on both tumor and immune cells in similar proportions (Figure 4B). The expression of each immunoregulatory protein varies across immune cell-types and individual patients (Figure 4C and Supplementary Figure 6), consistent with previous reports (26, 38–41). For example, PD-1 was strongly expressed on CD4+ T cells, ICOS on CD4+ T cells and Tregs, TIM-3 on M1 and M2 macrophages, and VISTA on M1 macrophages. These results demonstrate how simultaneous analysis of phenotypic and functional markers on single-cells, within their native spatial, tissue context, is a powerful approach for understanding the diverse landscape of functional immune molecules in cancer, and their roles in the immunotherapy responsiveness across patients.
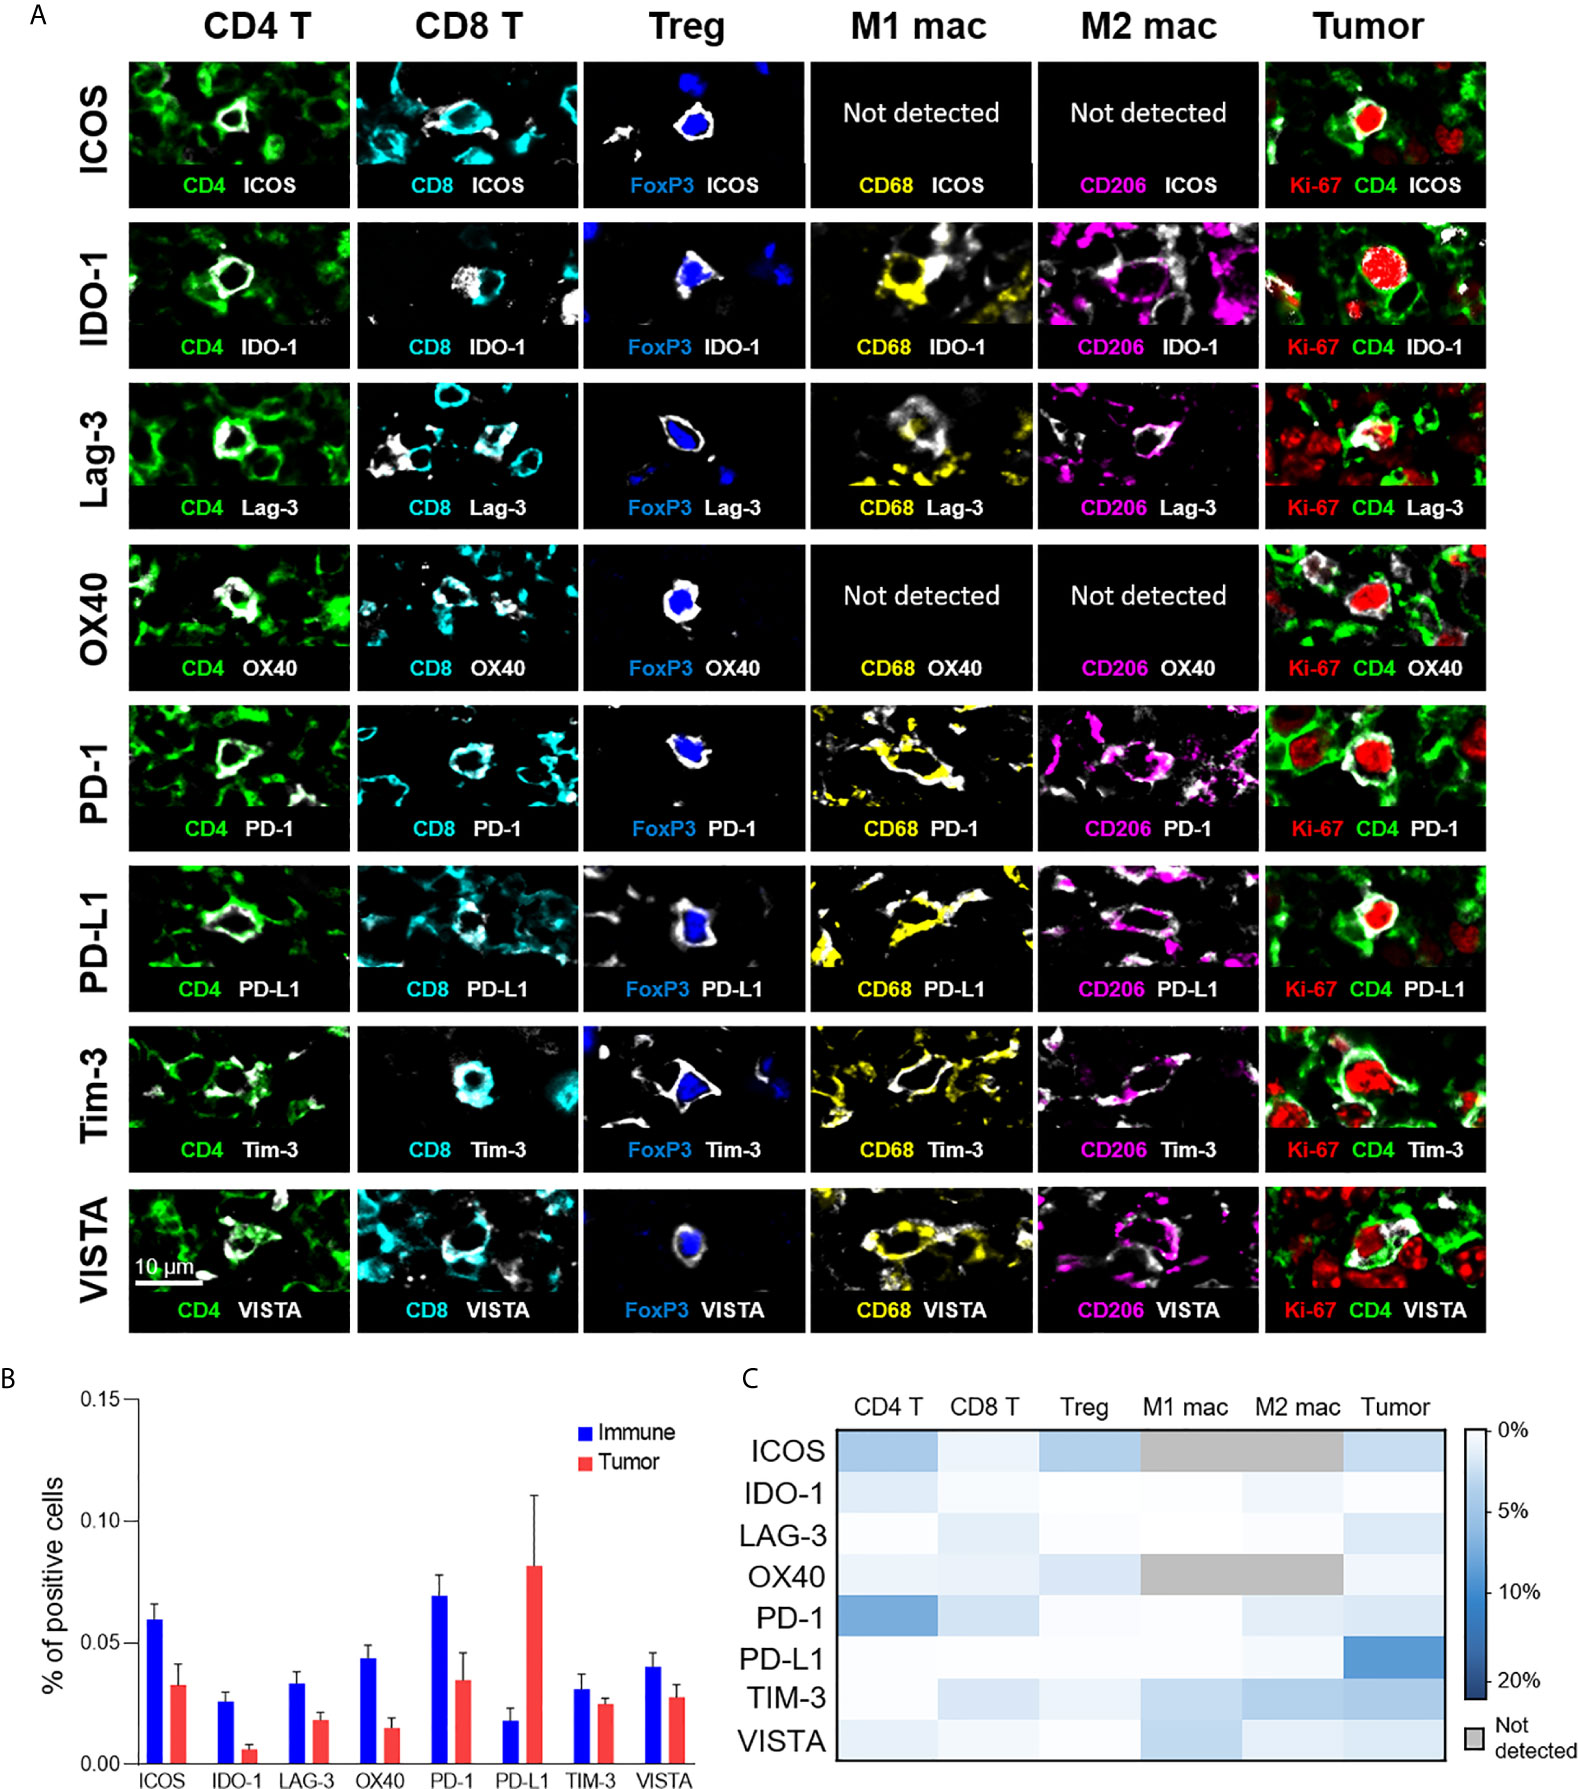
Figure 4 Expression of immunoregulatory proteins on different cell-types. (A) Color overlays of immune (CD4 – green; CD8 – cyan; FoxP3 – blue; CD68 – yellow; CD206 – magenta), tumor (Ki-67 – red; CD4 – green), and immunoregulatory proteins (ICOS, IDO-1, LAG-3, OX40, PD-1, PD-L1, TIM-3, VISTA – white). (B) Percentage of immune (T cells and macrophages) and tumor cells expressing immunoregulatory proteins; mean and standard error across patients. (C) Heatmap showing the mean percentage of immunoregulatory protein expression for the different T cell, macrophage, and tumor cell populations.
Discussion
Advancements in cancer immunotherapies require intimate knowledge of the orchestrated interaction and organization of cancer and immune cells. Multiplexed immunophenotyping approaches are essential in our efforts to identify predictive biomarkers of response and reveal insights into therapeutic mechanisms of action. Established, clinically accessible mIHC tissue imaging techniques are limited by the number of markers (≤ 7), while other multiparameter technologies (e.g., mass cytometry (CyTOF) and single-cell RNAseq) lack spatial context. The CODEX multiplexed tissue imaging method utilized in this study overcomes these limitations, and the 56-marker antibody panel established here enables extensive immunophenotyping of archival FFPE cancer specimens. Construction of a panel that captures structural markers, major immune cell-types and markers that inform cellular functional states (e.g., Ki-67 for proliferation and granzyme B for cytotoxicity), including immunoregulatory proteins, is paramount towards this goal. This work presents a blueprint for providing novel insights into the spatial organization and functional status of the TME, which are critical for advancing the field of cancer immunotherapy.
An important prerequisite for the study of FFPE tissues is the need for antigen retrieval, which involves the reversal of crosslinks formed during formalin fixation, to make epitopes accessible for antibody binding. Antigen retrieval involves boiling tissues in a specified pH buffer (ranging from pH 3 to 10) and detergents. Since the pH can greatly influence antibody binding (24, 42) and the entire CODEX antibody panel is stained simultaneously on a single tissue section, all antibodies must be optimized to perform with the same antigen retrieval protocol. The panel described here is optimized for antigen retrieval at pH 9, followed by antibody staining at 4°C overnight. In total, we conjugated 59 antibodies for implementation in this panel. 56 antibodies eventually passed our quality control assessment and were deemed as successfully conjugated and validated in FFPE human tissues, translating to a 94.9% success rate (i.e., 56/59 antibodies). The three antibodies that did not pass our assessment were TCR-α/β (clones G-11, T10B9), CTLA-4 (clones 2188A, BN13, L3D10), and TIGIT (clone TG1), likely owing to alteration of the antibody structure during the partial reduction step of the CODEX conjugation, the high pH antigen retrieval condition, aberrant oligonucleotide-antigen interactions, and/or low signal intensity.
Establishment a CODEX antibody panel, as described here, involves several considerations. First, antibodies must perform as expected when they intermixed with other antibodies. When combined, some antibodies may generate unexpected staining patterns not observed individually, due to aberrant cross-reactivity between antigens and/or oligonucleotides (43, 44). Second, multiple overlapping markers must be used to accurately classify cell-types. For instance, in this panel, Tregs were defined by co-expression of FoxP3, CD25, CD3, CD4, and CD45 (and lack of co-expression of non-lineage specific markers). This ability to visually inspect the spatial expression pattern of antibodies and cross-validate them against lineage-specific markers is a unique capability of highly multiplexed tissue imaging and an important milestone of antibody validation. Third, the multicycle panel order must be carefully considered. Importantly, after 10 cycles of iterative washing, hybridization, and stripping, we observe a slight decrease in signal strength of nuclear markers (16). Thus, antibodies that target nuclear markers and other low abundance proteins were placed in earlier cycles. As marker intensity and tissue morphology is not otherwise degraded during a multicycle (16, 18), the other markers were distributed to balance the panel across the fluorescent channels (i.e., Alexa488, ATTO550, and Alexa647). Fourth, to prevent fluorescent channel bleed through that could obscure a weaker signal, care must be taken to avoid combining within one cycle antibodies that stain different epitopes on the same cells at drastically different levels of intensity. For example, in this panel the helper T cell markers CD4 (strong staining) and CD5 (weak staining) were placed in different cycles. Finally, markers with low abundance, weak signal, and/or high background—generally this includes immunoregulatory proteins—should be imaged with the Alexa647 channel to overcome low signal-to-noise ratios, often from high tissue autofluorescence. As signal amplification is currently absent in CODEX, when further enhancement of the signal intensity is needed—herein for LAG-3—a reporter oligonucleotide with fluorescent tags on both the 3’ and 5’ ends should be used. A benefit of CODEX antibody panels is that they are customizable, allowing new tumor, immune, signaling, and drug target markers to be added as needed. Additionally, antibodies included in previously described CODEX panels (16, 18, 19) are compatible with the current panel and can be incorporated in the future as more unique oligonucleotides are validated and disclosed.
Immunotherapy is achieved through disruption of specific cell-to-cell interactions, resulting in activation of tumor surveillance by the native immune system. While such treatments are increasingly first-line for numerous cancers, not all patients derive benefit. The success or failure of immunotherapy likely depends on the balance between the expression of the drug-targeted immunoregulatory protein on immune and tumor cells as well as their location within the TME (19, 45–47). Multiplexed imaging studies utilizing 20-60 markers are generally required to achieve novel biomarker discovery studies (16, 19, 23, 26, 48). The 56-marker panel described here enables rigorous immunophenotyping and incorporates eight high value immunomodulatory proteins—ICOS, IDO-1, LAG-3, OX40, PD-1, PD-L1, TIM-3, and VISTA—that will empower further work into a better mechanistic understanding of immunotherapeutic responses (2, 33–37). This study also identified major differences in immunoregulatory protein expression between cell-types in CTCL, consistent with that previously observed with other tumor types (40). For example, PD-1 and ICOS were strongly expressed on CD4+ T cells, whereas TIM-3 and VISTA were strongly expressed on macrophages. Furthermore, immunoregulatory protein expression was highly variable across CTCL patients, in line with previous reports (40, 49); some patients had high expression of numerous markers whereas others had low expression of all markers. This degree of heterogeneity highlights the importance of analyzing functional immune molecules in individual patients and larger patient cohorts. Additionally, since the tissue microarray cores were obtained from only one area of the skin tumor biopsy, it is pertinent to incorporate several tissue microarray cores from the same sample or the whole tumor section to account for intra-tumor heterogeneity (50–53).
In summary, we developed, optimized, and applied a 56-marker antibody panel to analyze FFPE tumors by CODEX, exemplified by its application to CTCL. This panel allows the composition, location, and cellular state (e.g., proliferation or cytotoxicity) of TME components to be assessed relative to the expression of trial-targeted immunoregulatory proteins on immune and tumor cells. Since the CODEX antibody conjugation method is similar to that of other multiplexed imaging platforms, it is likely that the panel described here will be compatible with MIBI (25, 26), IMC (22), imaging cycler microscopy (ICM) (54), DNA exchange imaging (DEI) (55), MultiOmyx (MxIF) (56), and t-CyCIF (29). In our laboratory, we have had general success in antibody clone transfer between the CODEX and MIBI platforms. In fact, 22 of 56 antibodies included in this CODEX panel have been utilized in prior MIBI studies (26–28). While slight modifications to the antibody dilutions may be required when applying this panel across platforms (i.e., to account for small alterations in signal-to-noise ratios stemming from the mode of antibody detection: oligonucleotides in CODEX versus metals in MIBI and IMC), working knowledge of this panel will save considerable time, effort, and resources for researchers interested in studying the TME and immunotherapy responsiveness with multiplexed tissue imaging approaches. Ultimately, this panel allows for high-dimensional, spatially resolved characterization of the TME and offers unprecedented insights into tumor immunology, tissue architecture, the discovery of immunotherapy biomarkers, and potential applications beyond.
Data Availability Statement
The raw data supporting the conclusions of this article will be made available by the authors, without reservation.
Ethics Statement
The studies involving human participants were reviewed and approved by Stanford University IRB Administrative Panels on Human Subjects in Medical Research (HSR 46894). Since fully de-identified, this work was not considered human subjects research. The patients/participants provided their written informed consent to participate in this study.
Author Contributions
DP initiated the study, conjugated antibodies, performed experiments, created figures and tables, and wrote the manuscript. CMS validated antibody stainings and revised the manuscript. MSK and YHK obtained clinical samples, provided clinical data, and revised the manuscript. GPN supervised the study and revised the manuscript. SJ initiated/supervised the study, performed computational analysis, created figures, and wrote the manuscript. All authors contributed to the article and approved the submitted version.
Funding
This work was supported by the National Institutes of Health (NIH) 2U19AI057229-16 (GN), 5P01HL10879707 (GN), 5R01GM10983604 (GN), 5R33CA18365403 (GN), 5U01AI101984-07 (GN), 5UH2AR06767604 (GN), 5R01CA19665703 (GN), 5U54CA20997103 (GN), 5F99CA212231-02 (GN), 1F32CA233203-01 (GN), 5U01AI140498-02 (GN), 1U54HG010426-01 (GN), 5U19AI100627-07 (GN), 1R01HL120724-01A1 (GN), R33CA183692 (GN), R01HL128173-04 (GN), 5P01AI131374-02 (GN), 5UG3DK114937-02 (GN), 1U19AI135976-01 (GN), IDIQ17X149 (GN), 1U2CCA233238-01 (GN), 1U2CCA233195-01 (GN), F32CA233203 (DP), T32AR007422 (DP), The Bill and Melinda Gates Foundation OPP1113682 (GN) and INV-002704 (SJ and GN), The Cancer Research Institute (GN), The Parker Institute for Cancer Immunotherapy (GN), The Rachford & Carlotta A. Harris Endowed Chair (GN), and The Beckman Center for Molecular and Genetic Medicine (DP, CS, YK, and GN). DP was also supported by a Stanford Dean’s Fellowship and a Stanford Cancer Institute Fellowship. CS was supported by an Advanced Postdoc Mobility Fellowship from the Swiss National Science Foundation (P300PB_171189 and P400PM_183915) and an International Award for Research in Leukemia from the Lady Tata Memorial Trust, London, UK. SJ was supported by the Leukemia & Lymphoma Society Career Development Program and the Stanford Dean’s Fellowship.
Conflict of Interest
GPN is a co-founder and stockholder of Akoya Biosciences, Inc. and an inventor on patent US9909167. CMS is a scientific advisor to Enable Medicine, LLC.
The remaining authors declare that the research was conducted in the absence of any commercial or financial relationships that could be construed as a potential conflict of interest.
Acknowledgments
We thank all members of the Nolan laboratory for helpful discussions and especially Angelica Trejo, Sarah Black, and Gustavo Vasquez (Department of Pathology) for excellent technical assistance. We also thank Eric Hong and Carol Bruce (Division of Oncology) for clinical administrative support.
Supplementary Material
The Supplementary Material for this article can be found online at: https://www.frontiersin.org/articles/10.3389/fimmu.2021.687673/full#supplementary-material
Supplementary Figure 1 | Single-staining validations for the major immune cell-types around a germinal center in tonsil tissue. Four color images of APCs (specifically DCs), B cells, CD4+ T cells, CD8+ T cells, granulocytes, M1 macrophages, M2 macrophages, mast cells, NK cells, plasma cells, and Tregs are shown, with the key marker for the cell-type of interest (cyan), an positive control (red), negative control (green), and DRAQ5 nuclear marker (blue). Scale bars, 100 µm.
Supplementary Figure 2 | Experimental workflow for CODEX. Clinical tissue specimens are stained using the 56-marker panel of antibodies conjugated to unique DNA oligonucleotides. A multicycle experiment is performed, with iterative cycles of hybridization of corresponding fluorescent oligonucleotides, imaging, and chemical stripping of fluorescent oligonucleotides. This results in a 58-dimensional image depicting protein expression for the 56 antibodies and 2 nuclear markers (Hoechst and DRAQ5), which can be used to generate 7-color overlay images and for subsequent analysis.
Supplementary Figure 3 | Tissue microarray of eight CTCL tumor samples. (A) H&E staining, (B) Hoechst (nuclear) staining, and (C) seven-color overlay images of cytokeratin (green), vimentin (blue) CD31 (gray), Ki-67 (red), CD45 (cyan), CD3 (magenta), and CD68 (yellow). Scale bars, 100 µm.
Supplementary Figure 4 | CTCL tissue stained with a 56-marker CODEX antibody panel. A single tissue region with epithelium (top left in each image) and dermis (remainder of image) is depicted in false gray color for each antibody. H&E and Hoechst (nuclear) stainings are also shown. Scale bar, 100 µm.
Supplementary Figure 5 | Quantification of marker expression level. The distribution of expression is plotted for each of the 56 antibodies and DRAQ5 per patient sample. The black dot represents the median expression and the black lines represent the standard deviation.
Supplementary Figure 6 | Expression of immunoregulatory proteins in T cells, macrophages, and tumor cells. (A–E) Percentage of marker-positive (A) CD4 T cells, (B) CD8 T cells, (C) Tregs, (D) M1 macrophages, (E) M2 macrophages as a percentage of all immune cells. (F) Percentage of marker-positive tumor cells as a percentage of all tumor cells. Marker expression is shown individually for the 8 CTCL patients. Gray boxes indicate that the marker is not detected in that cell-type.
References
1. Darvin P, Toor SM, Sasidharan Nair V, Elkord E. Immune Checkpoint Inhibitors: Recent Progress and Potential Biomarkers. Exp Mol Med (2018) 50(12):1–11. doi: 10.1038/s12276-018-0191-1
2. Sharma P, Allison JP. The Future of Immune Checkpoint Therapy. Science (2015) 348(6230):56–61. doi: 10.1126/science.aaa8172
3. Xin Yu J, Hubbard-Lucey VM, Tang J. Immuno-Oncology Drug Development Goes Global. Nat Rev Drug Discov (2019) 18(12):899–900. doi: 10.1038/d41573-019-00167-9
4. Marin-Acevedo JA, Dholaria B, Soyano AE, Knutson KL, Chumsri S, Lou Y. Next Generation of Immune Checkpoint Therapy in Cancer: New Developments and Challenges. J Hematol Oncol (2018) 11(1):39. doi: 10.1186/s13045-018-0582-8
5. Liu M, Wang X, Wang L, Ma X, Gong Z, Zhang S, et al. Targeting the IDO1 Pathway in Cancer: From Bench to Bedside. J Hematol Oncol (2018) 11(1):100. doi: 10.1186/s13045-018-0644-y
6. Qin S, Xu L, Yi M, Yu S, Wu K, Luo S. Novel Immune Checkpoint Targets: Moving Beyond PD-1 and CTLA-4. Mol Cancer (2019) 18(1):155. doi: 10.1186/s12943-019-1091-2
7. Mazzarella L, Morganti S, Marra A, Trapani D, Tini G, Pelicci P, et al. Master Protocols in Immuno-Oncology: do Novel Drugs Deserve Novel Designs? J Immunother Cancer (2020) 8(1):e000475. doi: 10.1136/jitc-2019-000475
8. Aspeslagh S, Postel-Vinay S, Rusakiewicz S, Soria JC, Zitvogel L, Marabelle A. Rationale for anti-OX40 Cancer Immunotherapy. Eur J Cancer (2016) 52:50–66. doi: 10.1016/j.ejca.2015.08.021
9. Schmidt C. The Benefits of Immunotherapy Combinations. Nature (2017) 552(7685):S67–S9. doi: 10.1038/d41586-017-08702-7
10. Swart M, Verbrugge I, Beltman JB. Combination Approaches With Immune-Checkpoint Blockade in Cancer Therapy. Front Oncol (2016) 6:233. doi: 10.3389/fonc.2016.00233
11. Yu C, Liu X, Yang J, Zhang M, Jin H, Ma X, et al. Combination of Immunotherapy With Targeted Therapy: Theory and Practice in Metastatic Melanoma. Front Immunol (2019) 10:990. doi: 10.3389/fimmu.2019.00990
12. Patel SA, Minn AJ. Combination Cancer Therapy With Immune Checkpoint Blockade: Mechanisms and Strategies. Immunity (2018) 48(3):417–33. doi: 10.1016/j.immuni.2018.03.007
13. Schmidt EV, Chisamore MJ, Chaney MF, Maradeo ME, Anderson J, Baltus GA, et al. Assessment of Clinical Activity of PD-1 Checkpoint Inhibitor Combination Therapies Reported in Clinical Trials. JAMA Netw Open (2020) 3(2):e1920833. doi: 10.1001/jamanetworkopen.2019.20833
14. Havel JJ, Chowell D, Chan TA. The Evolving Landscape of Biomarkers for Checkpoint Inhibitor Immunotherapy. Nat Rev Cancer (2019) 19(3):133–50. doi: 10.1038/s41568-019-0116-x
15. Lu S, Stein JE, Rimm DL, Wang DW, Bell JM, Johnson DB, et al. Comparison of Biomarker Modalities for Predicting Response to PD-1/PD-L1 Checkpoint Blockade: A Systematic Review and Meta-Analysis. JAMA Oncol (2019) 5:1195–204. doi: 10.1001/jamaoncol.2019.1549
16. Schurch CM, Bhate SS, Barlow GL, Phillips DJ, Noti L, Zlobec I, et al. Coordinated Cellular Neighborhoods Orchestrate Antitumoral Immunity at the Colorectal Cancer Invasive Front. Cell (2020) 182(5):1341–59.e19. doi: 10.1016/j.cell.2020.07.005
17. Goltsev Y, Samusik N, Kennedy-Darling J, Bhate S, Hale M, Vazquez G, et al. Deep Profiling of Mouse Splenic Architecture With CODEX Multiplexed Imaging. Cell (2018) 174(4):968–81.e15. doi: 10.1016/j.cell.2018.07.010
18. Black S, Philliips D, Hickey JW, Kennedy-Darling J, Venkataraaman VG, Samusik N, et al. CODEX Multiplexed Tissue Imaging With DNA-Conjugated Antibodies. Nat Protoc (2021).
19. Phillips D, Matusiak M, Gutierrez BR, Bhate SS, Barlow GL, Jiang S, et al. Immune Cell Topography Predicts Response to PD-1 Blockade in Cutaneous T Cell Lymphoma. medRxiv (2020). doi: 10.1101/2020.12.06.20244913
20. Samusik N, Good Z, Spitzer MH, Davis KL, Nolan GP. Automated Mapping of Phenotype Space With Single-Cell Data. Nat Methods (2016) 13(6):493–6. doi: 10.1038/nmeth.3863
21. Kennedy-Darling J, Bhate SS, Hickey JW, Black S, Barlow GL, Vazquez G, et al. Highly Multiplexed Tissue Imaging Using Repeated Oligonucleotide Exchange Reaction. Eur J Immunol (2021) 51:1262–77. doi: 10.1002/eji.202048891
22. Giesen C, Wang HA, Schapiro D, Zivanovic N, Jacobs A, Hattendorf B, et al. Highly Multiplexed Imaging of Tumor Tissues With Subcellular Resolution by Mass Cytometry. Nat Methods (2014) 11(4):417–22. doi: 10.1038/nmeth.2869
23. Jackson HW, Fischer JR, Zanotelli VRT, Ali HR, Mechera R, Soysal SD, et al. The Single-Cell Pathology Landscape of Breast Cancer. Nature (2020) 578(7796):615–20. doi: 10.1038/s41586-019-1876-x
24. Ijsselsteijn ME, van der Breggen R, Farina Sarasqueta A, Koning F, de Miranda N. A 40-Marker Panel for High Dimensional Characterization of Cancer Immune Microenvironments by Imaging Mass Cytometry. Front Immunol (2019) 10:2534. doi: 10.3389/fimmu.2019.02534
25. Angelo M, Bendall SC, Finck R, Hale MB, Hitzman C, Borowsky AD, et al. Multiplexed Ion Beam Imaging of Human Breast Tumors. Nat Med (2014) 20(4):436–42. doi: 10.1038/nm.3488
26. Keren L, Bosse M, Marquez D, Angoshtari R, Jain S, Varma S, et al. A Structured Tumor-Immune Microenvironment in Triple Negative Breast Cancer Revealed by Multiplexed Ion Beam Imaging. Cell (2018) 174(6):1373–87.e19. doi: 10.1016/j.cell.2018.08.039
27. Keren L, Bosse M, Thompson S, Risom T, Vijayaragavan K, McCaffrey E, et al. MIBI-TOF: A Multiplexed Imaging Platform Relates Cellular Phenotypes and Tissue Structure. Sci Adv (2019) 5(10):eaax5851. doi: 10.1126/sciadv.aax5851
28. Ji AL, Rubin AJ, Thrane K, Jiang S, Reynolds DL, Meyers RM, et al. Multimodal Analysis of Composition and Spatial Architecture in Human Squamous Cell Carcinoma. Cell (2020) 182(6):1661–2. doi: 10.1016/j.cell.2020.08.043
29. Lin JR, Izar B, Wang S, Yapp C, Mei S, Shah PM, et al. Highly Multiplexed Immunofluorescence Imaging of Human Tissues and Tumors Using t-CyCIF and Conventional Optical Microscopes. Elife (2018) 7:e31657. doi: 10.7554/eLife.31657
30. Goldblum JR, Lamps LW, McKenney JK, Myers JL, Ackerman LV, Rosai J. Rosai and Ackerman’s Surgical Pathology. Eleventh edition Vol. 2 volumes. Philadelphia, PA: Elsevier (2018). xiv, 2142 pages.
31. Uhlen M, Oksvold P, Fagerberg L, Lundberg E, Jonasson K, Forsberg M, et al. Towards a Knowledge-Based Human Protein Atlas. Nat Biotechnol (2010) 28(12):1248–50. doi: 10.1038/nbt1210-1248
32. Uhlen M, Bandrowski A, Carr S, Edwards A, Ellenberg J, Lundberg E, et al. A Proposal for Validation of Antibodies. Nat Methods (2016) 13(10):823–7. doi: 10.1038/nmeth.3995
33. Andrews LP, Marciscano AE, Drake CG, Vignali DA. LAG3 (CD223) as a Cancer Immunotherapy Target. Immunol Rev (2017) 276(1):80–96. doi: 10.1111/imr.12519
34. Kwa MJ, Adams S. Checkpoint Inhibitors in Triple-Negative Breast Cancer (TNBC): Where to Go From Here. Cancer (2018) 124(10):2086–103. doi: 10.1002/cncr.31272
35. Marshall HT, Djamgoz MBA. Immuno-Oncology: Emerging Targets and Combination Therapies. Front Oncol (2018) 8:315. doi: 10.3389/fonc.2018.00315
36. Murciano-Goroff YR, Warner AB, Wolchok JD. The Future of Cancer Immunotherapy: Microenvironment-Targeting Combinations. Cell Res (2020) 30(6):507–19. doi: 10.1038/s41422-020-0337-2
37. Liebler DC, Holzer TR, Haragan A, Morrison RD, O’Neill Reising L, Ackermann BL, et al. Analysis of Immune Checkpoint Drug Targets and Tumor Proteotypes in Non-Small Cell Lung Cancer. Sci Rep (2020) 10(1):9805. doi: 10.1038/s41598-020-66902-0
38. Herbst RS, Soria JC, Kowanetz M, Fine GD, Hamid O, Gordon MS, et al. Predictive Correlates of Response to the Anti-PD-L1 Antibody MPDL3280A in Cancer Patients. Nature (2014) 515(7528):563–7. doi: 10.1038/nature14011
39. Tu L, Guan R, Yang H, Zhou Y, Hong W, Ma L, et al. Assessment of the Expression of the Immune Checkpoint Molecules PD-1, CTLA4, TIM-3 and LAG-3 Across Different Cancers in Relation to Treatment Response, Tumor-Infiltrating Immune Cells and Survival. Int J Cancer (2020) 147(2):423–39. doi: 10.1002/ijc.32785
40. Gorris MAJ, Halilovic A, Rabold K, van Duffelen A, Wickramasinghe IN, Verweij D, et al. Eight-Color Multiplex Immunohistochemistry for Simultaneous Detection of Multiple Immune Checkpoint Molecules Within the Tumor Microenvironment. J Immunol (2018) 200(1):347–54. doi: 10.4049/jimmunol.1701262
41. Li X, Wang R, Fan P, Yao X, Qin L, Peng Y, et al. A Comprehensive Analysis of Key Immune Checkpoint Receptors on Tumor-Infiltrating T Cells From Multiple Types of Cancer. Front Oncol (2019) 9:1066. doi: 10.3389/fonc.2019.01066
42. Shi SR, Shi Y, Taylor CR. Antigen Retrieval Immunohistochemistry: Review and Future Prospects in Research and Diagnosis Over Two Decades. J Histochem Cytochem (2011) 59(1):13–32. doi: 10.1369/jhc.2010.957191
43. Ellington AA, Kullo IJ, Bailey KR, Klee GG. Antibody-Based Protein Multiplex Platforms: Technical and Operational Challenges. Clin Chem (2010) 56(2):186–93. doi: 10.1373/clinchem.2009.127514
44. Wang W, Lilyestrom WG, Hu ZY, Scherer TM. Cluster Size and Quinary Structure Determine the Rheological Effects of Antibody Self-Association At High Concentrations. J Phys Chem B (2018) 122(7):2138–54. doi: 10.1021/acs.jpcb.7b10728
45. Blank CU, Haanen JB, Ribas A, Schumacher TN. Cancer Immunology. The “Cancer Immunogram”. Science (2016) 352(6286):658–60. doi: 10.1126/science.aaf2834
46. Tumeh PC, Harview CL, Yearley JH, Shintaku IP, Taylor EJ, Robert L, et al. PD-1 Blockade Induces Responses by Inhibiting Adaptive Immune Resistance. Nature (2014) 515(7528):568–71. doi: 10.1038/nature13954
47. Gnjatic S, Bronte V, Brunet LR, Butler MO, Disis ML, Galon J, et al. Identifying Baseline Immune-Related Biomarkers to Predict Clinical Outcome of Immunotherapy. J Immunother Cancer (2017) 5:44. doi: 10.1186/s40425-017-0243-4
48. Chevrier S, Levine JH, Zanotelli VRT, Silina K, Schulz D, Bacac M, et al. An Immune Atlas of Clear Cell Renal Cell Carcinoma. Cell (2017) 169(4):736–49.e18. doi: 10.1016/j.cell.2017.04.016
49. Wang JB, Li P, Liu XL, Zheng QL, Ma YB, Zhao YJ, et al. An Immune Checkpoint Score System for Prognostic Evaluation and Adjuvant Chemotherapy Selection in Gastric Cancer. Nat Commun (2020) 11(1):6352. doi: 10.1038/s41467-020-20260-7
50. Boddupalli CS, Bar N, Kadaveru K, Krauthammer M, Pornputtapong N, Mai Z, et al. Interlesional Diversity of T Cell Receptors in Melanoma With Immune Checkpoints Enriched in Tissue-Resident Memory T Cells. JCI Insight (2016) 1(21):e88955. doi: 10.1172/jci.insight.88955
51. Madore J, Vilain RE, Menzies AM, Kakavand H, Wilmott JS, Hyman J, et al. PD-L1 Expression in Melanoma Shows Marked Heterogeneity Within and Between Patients: Implications for Anti-PD-1/PD-L1 Clinical Trials. Pigment Cell Melanoma Res (2015) 28(3):245–53. doi: 10.1111/pcmr.12340
52. Mansfield AS, Murphy SJ, Peikert T, Yi ES, Vasmatzis G, Wigle DA, et al. Heterogeneity of Programmed Cell Death Ligand 1 Expression in Multifocal Lung Cancer. Clin Cancer Res (2016) 22(9):2177–82. doi: 10.1158/1078-0432.CCR-15-2246
53. Wei Y, Zhao Q, Gao Z, Lao XM, Lin WM, Chen DP, et al. The Local Immune Landscape Determines Tumor PD-L1 Heterogeneity and Sensitivity to Therapy. J Clin Invest (2019) 129(8):3347–60. doi: 10.1172/JCI127726
54. Schubert W, Bonnekoh B, Pommer AJ, Philipsen L, Bockelmann R, Malykh Y, et al. Analyzing Proteome Topology and Function by Automated Multidimensional Fluorescence Microscopy. Nat Biotechnol (2006) 24(10):1270–8. doi: 10.1038/nbt1250
55. Wang Y, Woehrstein JB, Donoghue N, Dai M, Avendano MS, Schackmann RCJ, et al. Rapid Sequential in Situ Multiplexing With DNA Exchange Imaging in Neuronal Cells and Tissues. Nano Lett (2017) 17(10):6131–9. doi: 10.1021/acs.nanolett.7b02716
Keywords: immunotherapy, CODEX multiplexed tissue imaging, immunophenotyping, immunoregulatory proteins, tumor microenvironment, cancer immunity, lymphoma
Citation: Phillips D, Schürch CM, Khodadoust MS, Kim YH, Nolan GP and Jiang S (2021) Highly Multiplexed Phenotyping of Immunoregulatory Proteins in the Tumor Microenvironment by CODEX Tissue Imaging. Front. Immunol. 12:687673. doi: 10.3389/fimmu.2021.687673
Received: 29 March 2021; Accepted: 27 April 2021;
Published: 19 May 2021.
Edited by:
Pedro Berraondo, Cima Universidad de Navarra, SpainReviewed by:
Carlos E. De Andrea, University of Navarra, SpainJon Zugazagoitia, Independent Researcher, Madrid, Spain
Copyright © 2021 Phillips, Schürch, Khodadoust, Kim, Nolan and Jiang. This is an open-access article distributed under the terms of the Creative Commons Attribution License (CC BY). The use, distribution or reproduction in other forums is permitted, provided the original author(s) and the copyright owner(s) are credited and that the original publication in this journal is cited, in accordance with accepted academic practice. No use, distribution or reproduction is permitted which does not comply with these terms.
*Correspondence: Sizun Jiang, c2l6dW5qQHN0YW5mb3JkLmVkdQ==