 Tarmo Äijö1
 Dimitris Theofilatos1
 Meng Cheng1,2
 Matthew D. Smith1
 Yue Xiong1†Albert S. Baldwin1
 Ageliki Tsagaratou1,3,4*
- 1Lineberger Comprehensive Cancer Center, University of North Carolina at Chapel Hill, Chapel Hill, NC, United States
- 2Curriculum in Genetics and Molecular Biology, University of North Carolina at Chapel Hill, Chapel Hill, NC, United States
- 3Department of Genetics, University of North Carolina at Chapel Hill, Chapel Hill, NC, United States
- 4Department of Microbiology and Immunology, University of North Carolina at Chapel Hill, Chapel Hill, NC, United States
TET proteins mediate DNA demethylation by oxidizing 5-methylcytosine to 5-hydroxymethylcytosine (5hmC) and other oxidative derivatives. We have previously demonstrated a dynamic enrichment of 5hmC during T and invariant natural killer T cell lineage specification. Here, we investigate shared signatures in gene expression of Tet2/3 DKO CD4 single positive (SP) and iNKT cells in the thymus. We discover that TET proteins exert a fundamental role in regulating the expression of the lineage specifying factor Th-POK, which is encoded by Zbtb7b. We demonstrate that TET proteins mediate DNA demethylation - surrounding a proximal enhancer, critical for the intensity of Th-POK expression. In addition, TET proteins drive the DNA demethylation of site A at the Zbtb7b locus to facilitate GATA3 binding. GATA3 induces Th-POK expression in CD4 SP cells. Finally, by introducing a novel mouse model that lacks TET3 and expresses full length, catalytically inactive TET2, we establish a causal link between TET2 catalytic activity and lineage specification of both conventional and unconventional T cells.
Introduction
The TET family of proteins consists of three members: TET1, TET2 and TET3 that are Fe2+ and O2 dependent deoxygenases, with the enzymatic capacity to oxidize 5-methylcytosine (5mC) to 5-hydroxymethylcytosine (5hmC) (1) and downstream additional oxidized modified cytosines (oxi-mCs), 5-formylcytosine (5fC) and 5-carboxylcytosine (5caC) (2). Notably, TET proteins mediate active DNA demethylation and promote gene expression (3). In addition, all the above oxi-mCs can also exist as stable epigenetic marks, that can affect the binding and the activity of transcription factors that preferentially recognize specific modified or unmodified states of cytosine (4–7). TET1 and TET3 share a CXXC DNA binding domain, whereas TET2 lacks a DNA binding domain, and thus cannot directly bind to the DNA (3). Interestingly, loss of TET proteins in various cell types did not reveal a global gain of DNA methylation (8–10). Instead, TET proteins regulate DNA demethylation in a focal manner, mainly at genomic loci that control cell specific genes (8, 11). The precise recruitment of TET proteins to these loci is mediated via interaction with transcription factors (11–15). We have previously demonstrated that 5hmC exhibits a dynamic intragenic distribution during T cell lineage specification (16) in the thymus as well as during T helper cell lineage choice (16, 17). Moreover, 5hmC enrichment correlates with high gene expression of T cell specific genes and is frequently detected in active enhancers (16). Paradoxically, concomitant deletion of both TET2 and TET3, which are most highly expressed in T cells, in the double positive (DP) cell stage demonstrated that TET proteins are dispensable for CD4 cell lineage specification (8). Similar findings were reported for simultaneous deletion of TET1 and TET3 (18).
T cell development in the thymus is a tightly regulated, highly complex process (19). DP cells that react strongly against antigens are eliminated by negative selection, whereas DP cells which react below an optimal threshold to antigens are eliminated by a process known as death by neglect (19, 20). Thus, 90% of DP cells are eliminated and only those that demonstrate optimal reaction against antigens are positively selected, signaled to survive and further differentiate to give rise to single positive (SP) CD4 and CD8 cells (21). Specifically, DP thymocytes that are positively selected through major histocompatibility complex (MHC) class II antigen presentation give rise to CD4 cells, whereas the DP cells that recognize peptides through MHC class I molecules give rise to CD8 SP cells (20). GATA3 is required for the CD4 lineage specification (22, 23), and induces Th-POK expression, which is indispensable for CD4 differentiation and maturation (24). Th-POK is the specifying factor of the CD4 lineage (25, 26), consists of four zinc fingers and a BTB domain (bric-a-brac, tram-track, broad complex) and belongs to the large Zinc finger and BTB domain containing (ZBTB) family of proteins (26). Deletion of Th-POK results in redirection of MHC class II restricted CD4 cells to CD8 cells, whereas overexpression of Th-POK impair CD8 differentiation and redirects MHC class I restricted thymocytes to differentiate towards the CD4 lineage (25, 26). Recently, the precise binding sites of Th-POK have been revealed (27) which indicate that Th-POK can bind to the DNA of CD4 as well as CD8 specific genes, such as Cd4, Runx3, Cd40lg and Zbtb7b, which encodes Th-POK (27). Mature CD4 cells will migrate from the thymus to peripheral organs. Based on the cytokine milieu and environmental cues naïve CD4 cells will give rise to helper lineages that express distinct lineage specifying factors and secrete specific cytokines (28, 29).
DP thymocytes that are selected through the CD1d MHC class I like molecule give rise to invariant natural killer T (iNKT) cells, a unique subset of innate-like T cells (30). iNKT precursor cells rapidly upregulate the ZBTB transcription factor promyelocytic lymphocyte zinc finger (PLZF), which endows them with effector properties (31, 32). They express an invariant Va14 chain and a limited number of Vβ chains and they recognize lipids (30). Thymic iNKTs exhibit an antigen experienced phenotype that endows them with the capacity to potently secrete large quantities of cytokines, including those that are typically secreted by helper T cells (33, 34). Specifically, iNKT cells that upregulate GATA3 acquire phenotypical characteristics reminiscent of the T helper 2 (Th2) cells, secrete interleukin 4 (IL-4) and are characterized as NKT2 cells (35). Thymic iNKT cells that express RORγt and secrete IL-17 are known as NKT17 cells (35). Finally, an additional iNKT subset in the thymus has been described that upregulates T-bet, potently secretes IFNγ and is known as NKT1 subset (35). Notably, NKT1 cells maintain the capacity to also secrete IL-4 (36).
The transcriptional circuitries that shape conventional and unconventional T cell identity and lineage specification as well as lineage integrity (37–42) have been extensively studied. The individual contribution of the transcription factors that regulate lineage commitment and maintenance has been dissected in detail, by generating mouse models that specifically lack the expression of the factor of interest at distinct stages of T cell development and differentiation. Recent studies have indicated a critical role for epigenetic regulators in the process of T cell and iNKT cell development (42–44). However, the precise epigenetic mechanisms that regulate the optimal expression and function of transcription factors to orchestrate the process of thymic lineage specification have not been elucidated.
Deciphering the roles of TET proteins and 5hmC in shaping T and iNKT cell lineage fate and maturation is of paramount importance. Proper maturation and lineage specification ensure optimal immune response against pathogens as well as tumor cells (36, 45). In this study, we seek to understand how TET proteins, and in particular TET2 and TET3, which are most highly expressed in T cells (46, 47), impact the gene expression program of CD4 SP cells. Then, we identify shared signatures among Tet2/3 DKO iNKT cells and CD4 SP cells in the thymus. We reveal that concomitant loss of TET2 and TET3 reduces significantly Th-POK expression due to increased DNA methylation in the Zbtb7b locus in both iNKT cells and CD4 SP cells, revealing a conserved role of TET2 and TET3. Specifically, we identify gain of methylation at the proximal enhancer and at site A, where GATA3 binds to regulate Th-POK expression. Finally, we ask if the observed defects in iNKT and T cell lineage specification are exclusively regulated by TET2 catalytic dependent activity or if TET2 exerts additional, catalytic independent roles. We were inspired to pursue this question by our previous findings that TET3 deficiency is sufficient to increase NKT17 frequency, but did not result in the striking expansion that we observed for the Tet2/3 DKO iNKT cells (8). Recent studies suggested that TET2 can impact lymphoid cells in a catalytic independent manner (48). Moreover, TET2 has been reported to regulate inflammatory phenotypes in macrophages by mechanisms that are not related to its enzymatic activity (49). Here, we introduce a novel mouse model that lacks TET3 and expresses full length TET2, which is catalytically inactive due to a point mutation that compromises iron binding. Our data establish a fundamental role of the catalytic activity of TET2 that in cooperation with TET3 shapes conventional and unconventional lineage specification in the thymus.
Methods
Mice
All mice were bred and maintained under specific pathogen-free conditions at University of North Carolina (UNC) Genetic Medicine building, in a facility managed by the Division of Comparative Medicine at UNC Chapel Hill. The experimental procedures were approved by the UNC Institutional Animal Care and Use Committee. C57BL/6 (B6) (stock number: 000664) and B6.SJL-CD45.1 (stock number: 002014) were initially purchased from Jackson Laboratories and were bred and maintained in our facility. Tet2-/- mice (mentioned Tet2 KO hereafter) (46) were initially generated by the Rao lab and were purchased from Jackson laboratory (stock number: 023359). Tet3flx/flx (50) mice were generated in the Rao lab (and are currently available from Jackson laboratory, stock number: 031015). Tet3flx/flx CD4Cre (mentioned Tet3 KO hereafter) (8) mice and Tet2-/-Tet3flx/flx CD4Cre (mentioned Tet2/3 DKO hereafter) (8) mice have been previously described. Tet2H1795R mice (referred to as Tet2CD hereafter) were designed and generated by MC, MS, YX and ASB at the UNC Animal Models Core (51). For the immune-phenotyping experiments both male and female mice were used. For genome-wide sequencing experiments, we used sex and age-matched mice. When feasible, both male and female mice were used as indicated in the specific methods sections. The control and the TET mutant mice were analyzed between 21-30 days old, during this time the mice were healthy (8). The genotypes of the mutant mice were validated by PCR genotyping. Genomic DNA was isolated using Phire Animal Tissue Direct PCR kit (Thermo scientific, cat no F-140WH), based on the manufacturer’s guidelines. PCR amplification of DNA fragments was performed using the Phire DNA polymerase (Thermo scientific) and specific primers using Biorad T100 or Biorad C1000 Touch thermocyclers. PCR products were run in a 3% agarose gel and were visualized using SYBR safe (Invitrogen, Thermo Scientific) staining using an Axygen Gel documentation system. For the Tet2CD mice, DNA was isolated as described above and amplified using Phusion High Fidelity DNA polymerase (NEB). The sequence of the primers used for the amplification is:
Tet2-H1795R-F: GTGCTTCCAGGGTTTAATCATG
Tet2-H1795R-R: GTCTGATCCATTCTTTCCGCA
PCR products were submitted for purification and sequencing at Eton Bioscience. The sequence of the primer used for sequencing was Tet2-H1795R-Seq: GCAGCAGTCAGGAGAAGCAG. Sequencing results were analyzed to distinguish heterozygotes from homozygotes.
Flow cytometry
Staining of thymocytes, was performed directly ex vivo. Briefly, mice were euthanized and thymi were harvested. Single-cell suspensions were prepared by dissociating the organs using a 70 um cell strainer (Falcon). For surface stainings, cells were stained in FACS buffer (PBS containing 2% FBS). Dead cells were excluded by using fixable viability dye (eBioscience). To perform multiparameter Flow cytometry, antibodies were used conjugated with fluorophores: Anti-mouse CD4AF488 (clone: RM4-5), anti-mouse CD8BV650 (clone: 53-6.7), anti-mouse TCR-βPERCP/Cy5.5 (clone:H57-597), CD44PERCP/Cy5.5 (clone: IM7) were all from Biolegend. The antibodies were used in a dilution 1:200. aGalactosyl-ceramide loaded tetramer conjugated with PE or BV421 was obtained from NIH tetramer Core and was used for stainings in a dilution 1:400. For intracellular staining, cells were washed three times with FACS buffer and were fixed and permeabilized using the Foxp3 transcription factor staining kit (eBioscience) according to the manufacturer’s instructions. The fixation step was performed overnight. Antibody for transcription factor Th-POKAlexa647 (clone: T43-94) was purchased from BD Pharmingen and was diluted in 1X Permeabilization buffer (diluting the 10X permeabilization buffer available in the Foxp3 transcription factor staining kit) in a dilution 1:20 according to the instructions. PLZFA647 (clone: R17-809), RORγt (clone: Q31-378) conjugated either with CFP594 or BV421 and GATA3 (clone: L50-823) conjugated with PE were all from BD Pharmingen. PLZF and RORγt were diluted in 1X Permeabilization buffer in a dilution 1:100. GATA3PE was diluted in 1X Permeabilization buffer in a dilution 1:5 (as recommended by the manufacturer). EOMESEF660 (clone: Dan11mag) was purchased from eBioscience and was used in a dilution 1:100.
Samples were analyzed by Flow Cytometry using a BD LSRFortessa analyzer (BD Biosciences) or a Novocyte 3005 (ACEA, Agilent). Data were acquired using BD FACSDiva software or NovoExpress (Agilent) software respectively. The data were analyzed and FACS plots were generated using FlowJo (Treestar).
Cell enrichment & flow cytometry activated sorting
Total thymocytes were depleted of CD24hi cells by staining with biotinylated mouse anti-CD24 (clone:M1/69) purchased from Biolegend. Unwanted cells were depleted by binding to mouse streptavidin magnetic beads (anti-mouse Rapidspheres, cat no 19860, Stemcell Technologies) according to the manufacturer’s instructions. Enriched cells were stained with viability dye (eBioscience) to distinguish live from dead cells. Cells were stained with aGalactosyl-Ceramide loaded tetramer (conjugated with PE, obtained from NIH tetramer core), TCRβ (clone:H57-597) conjugated with PERCP/Cy5.5 (Biolegend), anti-mouse CD4AF488 (clone:RM4-5), CD8 (clone:53-6.7) conjugated with Brilliant Violet 650 or APC. For the thymic differentiation related studies, live CD4+, CD8-, TCRβ+, tetramer- cells were sorted and used in downstream applications. The purity of the samples after sorting was >98%. The cells were sorted using an Aria Sorter (Becton Dickinson).
RNA sequencing
Live, CD24low enriched cells CD4+, TCRβ+, aGalCerCd1d tetramer-, CD8- cells were sorted in a purity higher than 98%. RNA was isolated using the micro RNeasy plus kit (Qiagen). RNA was quantified using HS RNA kit (Invitrogen) in a Qubit 4 Fluorometer (Invitrogen). RNA integrity was assessed in a Bionalyzer (Agilent) using RNA 6000 pico kit (Agilent, cat no: 5067-1513). The RNA that was used for downstream steps had a RIN value of 9 or higher. Libraries were prepared using the SMARTseq kit v4 Ultra Low Input RNA kit for sequencing (Clontech, cat no: 634888) and Nextera XT (Illumina). Sequencing was performed using Hiseq 4000 (Illumina), at the UNC High Throughput Sequencing Facility. 3 male control (wild type) and 2 male Tet2/3 DKO mice were used.
Template capture hybridization sequencing (CATCH-seq)
In order to analyze cytosine methylation status of Zbtb7b locus in control (wild type) and Tet2/3 mutant CD4 SP cells, DNA was isolated from FACS sorted CD4 SP cells using PureLink genomic DNA mini kit (Invitrogen). DNA was isolated following the manufacturer’s instructions and was eluted in 50 ul molecular biology grade water. A minimum of 1.1 ug of DNA was provided to Biodynami (Huntsville, Alabama) for bisulfite conversion, capture, library preparation and next generation sequencing. Biodynami NGS DNA Library Prepkit (cat no 30023) was used and methylated adapters were utilized. Bisulfite conversion was performed with the Epitect Bisulfite kit (Qiagen, catalogue number 59104). For the capture of the mm10 chromosome 3: 89,373,714-89,397,292 a Biodynami Custom Capture kit was developed and used. Sequencing of the generated, barcoded libraries was performed using HiSeq X platform and PE 2x150 reads.
CUT&RUN
For the CUT&RUN experiments, we used the CUTANA™ ChIC/CUT&RUN Kit (Epicypher, cat no: 14-1048) according to the manufacturer’s instructions with some modifications. Specifically, cells were collected in a V-bottom 96 well plate for handling as previously described (52). We omitted the use of Concanavalin-A (ConA) – coated beads, since ConA is a T cell mitogen. The starting material for each experiment was 500,000 CD4 SP sorted cells. Additionally, the incubation with the antibodies (0.5 ug) was performed at 4°C for 1h. The antibodies used for these experiments are: GATA3 (clone: D13C9) XP from Cell Signaling Technology (CST cat no: 5852) and IgG (Epicypher, cat no: 13-0042).
CUT&RUN libraries were prepared as previously described (53) with modifications (54). Briefly, 3 ng DNA (corresponding to small fractions of DNA) were used for library preparation utilizing NEBNext Ultra II DNA Library Prep Kit (NEB, cat no: E7645). The DNA was end-repaired at 20°C for 30 minutes, followed by an incubation at 50°C for 60 minutes. The adaptor was diluted to 1:12.5 for adaptor ligation and added to the end-repaired products, followed by an incubation at 20°C for 15 minutes. Then, the USER enzyme was added to the ligation mixture and the samples were incubated at 37°C for 15 minutes. To clean up the adaptor-ligated DNA, 1.75 volume of AMPure XP beads (Beckman) was added to the ligation reaction. The adaptor-ligated fragments were amplified using the following PCR conditions: 98°C for 45 sec, 12 cycles of 98°C for 15 seconds, 60°C for 10 seconds and a final extension step: 65°C for 5 minutes. For the PCR amplification, we used the NEBNext Multiplex Oligos for Illumina (Dual Index Primers Set2, NEB, cat no: E7780S). After amplification, libraries were purified with 1.0x volume of AMPure XP beads (Beckman). The DNA concentration was measured using the double stranded (ds) DNA High Sensitivity (HS) assay in a Qubit 4 Fluorometer (Invitrogen). The quality control and the size of the library was determined using High Sensitivity (HS) D1000 Screen Tape assay (Agilent, cat no: 5067-5584), including HS D1000 screen tape and HS D1000 reagents (such as HS D1000 sample buffer and HS D1000 ladder, Agilent, cat no: 5067-5585), in a Tapestation 4150 (Agilent). Libraries were sequenced using Illumina NovaSeq 6000 platform and 50bp PE reads at the Duke Center for Genomic and Computation Biology, of the Duke University Sequencing and Genomic Technologies.
Purification of proteins
Total thymocytes were isolated from WT, Tet2/3 DKO, Tet2CD Tet3 KO, Tet2 KO, Tet2CD and Tet3 KO mice. We used both male and female mice. To separate nuclear extracts from cytoplasmic extracts, we used the NE-PER nuclear and cytoplasmic extraction kit (Thermo Scientific, cat no:78833) according to the manufacturer’s instructions. For the purification of protein extracts from sorted CD4 SP cells, isolated from WT and Tet2CD Tet3 KO mice, we utilized the radioimmunoprecipitation assay (RIPA) buffer. Briefly, FACS sorted CD4 SP cells were washed with ice-cold 1X PBS and then lysed to RIPA buffer (1.0% Igepal CA-630, 0.5% Sodium Deoxycholate, 0.1% SDS, 150mM NaCl, 2mM EDTA, 25mM Tris-HCL pH 7.4) supplemented with protease inhibitors. After a 30 minutes rotation at 4°C, the cell lysates were centrifuged at 10.000g for 10min (at 4°C) and subsequently the supernatant containing the protein extracts was collected. To determine the protein concentration, we used the qubit protein assay kit (Q33211, Invitrogen) and the micro BCA protein assay kit (Pierce, cat no: 23235). Samples were measured in a Qubit 4 fluorometer (Invitrogen) or a Synergy 5 microplate reader (BioTek) respectively. Protein extracts were stored at -80°C.
Immunoblotting
Prior to immunoblotting, the extracts were diluted in 4xLaemli buffer (Biorad, Cat No: 1610747), containing 10% β-mercaptoethanol, and boiled for 10 minutes. Then, the protein samples were loaded onto 4-20% Mini-PROTEAN TGX Precast Protein Gels (Biorad, cat no: 4568094), subjected to SDS-PAGE electrophoresis, and transferred to PVDF membranes by utilizing the Trans-Blot Turbo Transfer System (Biorad) according to manufacturer’s guidelines. Membranes were blocked with 5% non-fat milk (Biorad) in PBS supplemented with 0.1% Tween (Sigma) and then incubated with primary antibodies against TET2 (dilution 1:1000, CST, cat no: 36449), TET3 (dilution 1:1000, CST, cat no: 99980), Histone H3 (for nuclear extracts, dilution 1:5.000, Sigma, cat no: H0164) and GAPDH (for whole cell extracts, dilution 1:20.000, Sigma, clone: G8795). The HRP-conjugated anti-rabbit (dilution 1:2000, Biorad, cat no: 172-1019) and anti-mouse (dilution 1:3000, Biorad, cat no: 172-1011) secondary antibodies were used. Signals were detected by Pierce ECL Western blotting substrate (Thermo Scientific, cat no: 32209) and proteins were visualized using a ChemiDoc MP imaging system (Biorad). To quantify the Western Blot bands, we used the Image Lab Software (BioRad), while the protein levels of H3 (for nuclear extracts of total thymocytes) or GAPDH (for whole cell extracts of sorted CD4 SP cells) were used for normalization.
RNA isolation and quantitative PCR
Total RNA was isolated from thymocytes from WT, Tet2 KO, Tet2CD and Tet2CD Tet3 KO mice using the RNeasy Plus Mini Kit (Qiagen, cat no:74134) according to the manufacturer’s instructions. Both male and female mice were used. cDNA was synthesized using the iScript Reverse Transcription SuperMix (Biorad, cat no:1708840). qPCR was performed using the iTaq Universal SYBR Green Supermix (Biorad, cat no: 172-5121) on a CFX96 Real-Time System (Biorad). The expression of the target genes was normalized to the expression of Gapdh. The relative gene expression levels were determined by the comparative Ct method (ΔΔCt method) according to the CFX Maestro software (Biorad).
Data statistical analysis
Data were analyzed using Prism software (Graphpad). Unpaired student’s t test was applied as indicated. In each figure legend, the indicated p-values are described. Data are mean ± s.e.m. In the graphs, each dot represents a mouse. Unless otherwise indicated the p-value was not statistically significant (p > 0.05). Differences were considered significant when p < 0.05 (∗); < 0.01 (∗∗); < 0.001 (∗∗∗); < 0.0001 (∗∗∗∗).
For each experiment, sufficient number of mice was used, to ensure adequate power for our findings. For the phenotyping experiments, mice from different litters and of different sex were evaluated, with reproducible results.
Graph design
The graph in Supplementary Figure 1 was designed using Biorender.
RNA-seq data analysis
Adapter trimming and quality filtering of the sequencing libraries was done using fastp (0.21.0) (55) with the default parameters. The sequencing libraries were mapped against mm10 and the GRCm38.100 transcriptome using STAR (2.7.5a) (56) with the following parameter values: –quantMode GeneCounts. The differential expression analysis was done using DESeq2 (57) based on the read counts per gene produced by STAR. The used threshold for adjusted p-value was 0.01.
ChIP-seq data analysis
The sequencing libraries were mapped against mm10 using Bowtie 2 (2.4.1) (58) using the default parameters. Reads with identical sequences were filtered and only one was retained for subsequent analysis. The coverage tracks were generated from the samples obtained by pooling the biological replicates using HOMER (4.10) (-norm 1e6) (59).
CMS-seq data analysis
The CMS-IP and input reads were mapped against mm10 using Bismark (0.22.3) (60). The mapping was done using the Bowtie 2 (2.4.1) (58) backend in the paired-end mode with the following parameter values: -I 0 -X 600 -N 0. The coverage tracks were generated using HOMER (4.10) (makeBigWig.pl -norm 1e6) (59).
ATAC-seq data analysis
Adapter trimming and quality filtering of the sequencing libraries was done using fastp (0.21.0) (55) with the default parameters. The sequencing libraries were mapped against mm10 using Bowtie 2 (2.4.1) (–very-sensitive -X 2000) (58). Mitochondrial reads were removed after alignment. Additional filtering was done using samtools (1.12) (61) using the following parameter values: -q 30 -h -b -F 1804 -f 2. Reads with identical sequences were filtered and only one was retained for subsequent analysis. The coverage tracks were generated from the samples obtained by pooling the biological replicates using HOMER (4.10) (makeBigWig.pl -norm 1e6) (59).
CATCH-seq (bisulfite) data analysis
Adapter trimming and quality filtering of the sequencing libraries was done using trim galore (0.6.2) (–paired) [DOI: 10.5281/zenodo.5127899]. The sequencing libraries were mapped against mm10 using Bismark (0.22.3) (60). The mapping was done using the Bowtie 2 (2.4.1) (58) backend in the paired-end mode with the following parameter values: –non_directional. The counts of converted and unconverted cytosines in CpG context were extracted using bismark_methylation_extractor (–bedGraph –counts) (60).
CUT&RUN data analysis
Adapter trimming and quality filtering of the sequencing libraries was done using fastp (0.21.0) (55) with the default parameters. The sequencing libraries were mapped against mm10 using Bowtie 2 (2.4.1) (–very-sensitive -X 2000) (58). Mitochondrial reads were removed after alignment. Additional filtering was done using samtools (1.12) (61) using the following parameter values: -q 30 -h -b -F 1804 -f 2. Reads with identical sequences were filtered and only one was retained for subsequent analysis. The coverage tracks were generated from the samples obtained by pooling the biological replicates using HOMER (4.10) (makeBigWig.pl -norm 1e6) (59). The peaks were identified from the pooled samples against controls using HOMER (4.10) (findPeaks -style factor). The coverage at the transcription sites was quantified using HOMER (4.10) (annotatePeaks.pl tss mm10 -size 1000 -hist 5 -ghist) (59). The coverage at the peak sites was quantified using HOMER (4.10) (annotatePeaks.pl peaks.txt mm10 -size 1000 -hist 5 -ghist) (59).
Annotation of regulatory sites across Zbtb7b locus
To annotate the distal enhancer and proximal enhancer of Zbtb7b locus we utilized sequences of primers described in (62) and we mapped these to the mm10 reference genome (proximal enhancer is chr3:89,385,456-89,385,868 and distal enhancer is chr3: 89,395,980-89,396,394). To annotate site A, where GATA3 has been previously reported to bind, we utilized the sequences described in (24) and mapped them to the mm10 reference genome (chr3:89,382,182-89,382,343).
Data availability
RNA-seq, CUT&RUN and CATCH-seq datasets have been deposited in the Gene Expression Omnibus (GEO) public repository under the following accession numbers: SuperSeries: GSE206450, RNA-seq data: GSE190230, CUT&RUN: GSE190228, CATCH-seq: GSE190227.
We have not generated unique or novel codes for data analysis for this manuscript. We have provided a detailed data analysis section.
Most of the biological tools (mouse strains) are available at Jackson laboratories and we have provided the relevant stock numbers. The Tet2CD mice are a new strain (51). Requests regarding the Tet2CD mice should be addressed to Dr. Baldwin (YWxiZXJ0X2JhbGR3aW5AbWVkLnVuYy5lZHU=). Any other requests should be addressed to Dr. Ageliki Tsagaratou (YWdlbGlraV90c2FnYXJhdG91QG1lZC51bmMuZWR1).
Overview of data sets
Main
Altered gene expression program in Tet2/3 DKO CD4 SP cells
We and others have previously reported that 5hmC is highly enriched in thymic CD4 SP cells (8, 46). In addition, Tet2 and Tet3 expression is increased as DP cells are positively selected to give rise to CD4 SP and CD8 SP cells (8) (source: Immunological Genome Project, ImmGen, Figure 1A). In addition, we utilized publicly available datasets (27) to investigate the expression of Tet genes during the process of CD4 cell lineage maturation. We discovered that Tet1, Tet2 and Tet3 become upregulated as CD4 immature SP cells become mature CD4 SP cells (Supplementary Figure 1A). In particular, Tet3 shows the biggest increase (Supplementary Figure 1A). Interestingly, the lineage specifying transcription factor Th-POK binds to all three genes Tet1, Tet2 and Tet3 as revealed by chromatin immunoprecipitation followed by sequencing (ChIP-seq) for ThPOK in CD4 SP cells (Supplementary Figures 1B–D), ChIP-seq data were used from the study by (27). Specifically, Th-POK binds in the gene body of Tet1, the promoter of Tet2 and is recruited in the promoter and intragenically in Tet3 (Supplementary Figures 1B–D). Collectively, these findings suggest that TET proteins play a role in regulating gene expression during CD4 SP cell maturation.
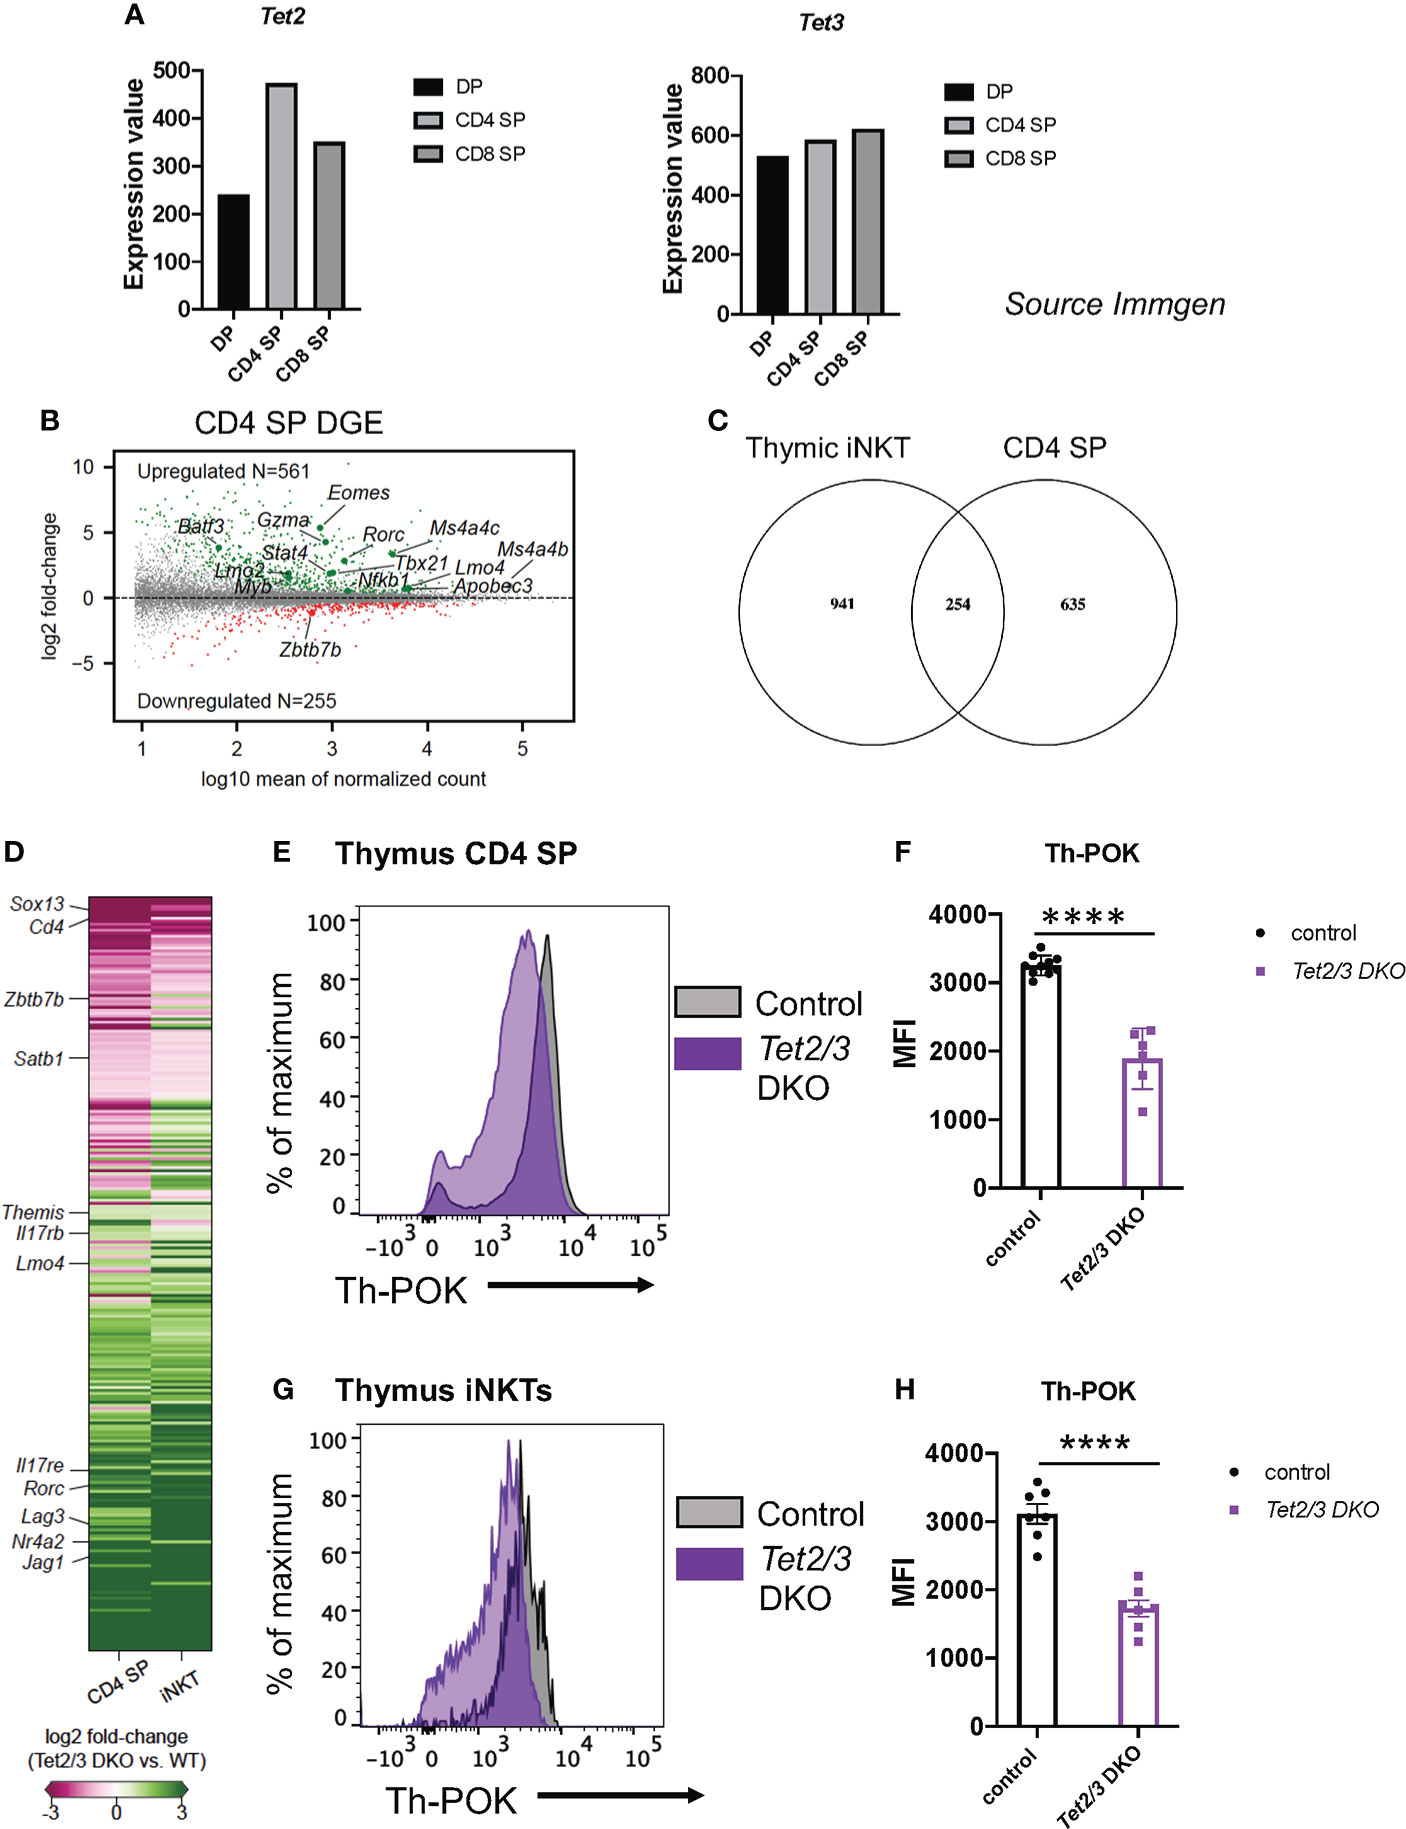
Figure 1 Tet2 and Tet3 are upregulated during T cell lineage specification and are required for optimal Th-POK expression. (A) Gene expression of Tet2 (left) and Tet3 (right) in DP cells, CD4 SP cells and CD8 cells. (Source: Immunological Genome project, Immgen). (B) MA plot depicting log2 fold-change of gene expression in Tet2/3 DKO CD4 SP cells compared to control (wild type) CD4 SP cells. 561 were identified to be upregulated (padj < 0.01, in green) in Tet2/3 DKO SP cells, whereas 255 were downregulated (padj < 0.01, in red). Genes of interest are indicated. n=3 male control (wild type) and 2 male Tet2/3 DKO mice were used. (C) Venn diagram indicating the intersecting genes that are differentially expressed in Tet2/3 DKO iNKT cells compared to wild type iNKT cells (8) and Tet2/3 DKO CD4 SP cells compared to wild type CD4 SP cells. (D) Heatmap indicating the log2 fold-change of the overlapping genes identified in (C). The scale for evaluating differential gene expression is depicted. (E) Representative histogram comparing the protein expression levels of Th-POK in wild type (gray) and Tet2/3 DKO (purple) CD4 SP cells evaluated by flow cytometry. (F) Median Fluorescence Intensity (MFI) of Th-POK expression in CD4 SP cells as evaluated in (E). Each dot represents a mouse. WT n=10 (in black), Tet2/3 DKO n=6 (in purple). For each genotype male and female mice were analyzed with comparable findings. (G) Representative histogram comparing the protein expression levels of Th-POK in wild type (gray) and Tet2/3 DKO (purple) iNKT cells evaluated by flow cytometry. (H) Median Fluorescence Intensity (MFI) of Th-POK expression in iNKT cells as evaluated in (G). Each dot represents a mouse. WT n=7 (in black), Tet2/3 DKO n=7 (in purple). For each genotype male and female mice were analyzed with comparable findings. 5 independent experiments were performed. **** (p < 0.001), unpaired t test. Horizontal lines indicate the mean (s.e.m.).
We set out to discover the impact of loss of TET2 and TET3 on the gene expression program of CD4 SP cells (16). To this end, we performed low input gene expression analysis (SMART-seq) (63) as previously described (8) in highly pure, sorted CD4 SP cells (Supplementary Figure 2). Our comparative analysis confirmed that indeed the control, wild type CD4 SP cells were more similar to each other compared to Tet2/3 DKO CD4 SP cells (Supplementary Figure 3). We discovered 816 differentially expressed genes (DEG) when comparing Tet2/3 DKO CD4 SP cells to their wild type counterparts (Figure 1B). Among these 816 DEG, 255 were downregulated in Tet2/3 DKO CD4 SP cells, while the majority (561) where upregulated in Tet2/3 DKO CD4 SP cells (Figure 1B). This unbiased analysis identified that genes encoding lineage specifying factors were differentially expressed in Tet2/3 DKO CD4 SP cells.. For instance, Rorc and Tbx21, that encode for RAR-related orphan nuclear receptor RORγt and T-bet, respectively, were among the upregulated genes in Tet2/3 DKO CD4 SP cells. Zbtb7b, the gene that encodes for the lineage specifying transcription factor Th-POK, was among the downregulated genes (Figure 1B). It has been previously reported that deletion of Th-POK can result in redirection of CD4 SP cells to CD8 SP cells (24). However, we did not observe an increase of Runx3 gene expression in Tet2/3 DKO CD4 SP cells in our bulk RNA-seq data. Moreover, we did not detect a decrease of Tet2/3 DKO CD4 SP cells (8), that would suggest that CD4 cells are redirected to CD8 SP cells. Instead, the increase of Tet2/3 DKO CD8 SP cells that we have previously demonstrated (8) is attributed to the increase of iNKT cells that results in the emergence of innate-like CD8 cells (8). Interestingly, among the upregulated genes in Tet2/3 DKO CD4 SP cells was Eomes (Figure 1B), as well as Gzma which encodes granzyme a. Notably, we also observed upregulation of genes that are normally expressed in precursor stages such as Myb, Lmo2 and Lmo4 (Figure 1B). These findings suggest that TET2 and TET3 regulate gene expression in the CD4 SP cells.
Identifying conserved roles for TET proteins in regulating gene expression among conventional and unconventional T cells
Thymic iNKT cells express key lineage specifying factors which are also expressed by CD4 cells. We have previously identified that TET proteins regulate iNKT cell lineage specification (8). Thus, we interrogated whether there is a shared signature among iNKT cells and CD4 SP cells that could reveal common target genes regulated by TET proteins in conventional and unconventional T cells. To this end, we compared 1195 DEG in Tet2/3 DKO iNKT cells (from our previous study (8)) and 889 DEG in Tet2/3 DKO CD4 SP cells (identified in the present study) and we discovered 254 commonly DEG among the compared groups (Figure 1C). Among the downregulated genes, we identified Cd4, Zbtb7b and Satb1 (Figure 1D). We also found that among the shared upregulated genes was Rorc, which encodes the lineage specifying factor RORγt. In addition, we identified genes that encode proteins involved in T cell receptor (TCR) signaling such as Lag3, Nr4a2, Themis and the gene Jag1, that encodes the Notch ligand JAG1.
TET proteins regulate Th-POK expression in CD4 SP and iNKT cells
5hmC is highly enriched in the gene body of Zbtb7b, which encodes the lineage specifying transcription factor Th-POK, specifically in the CD4 SP cells when the expression of this factor is initiated (16). To evaluate if loss of TET proteins and 5hmC could impact Th-POK protein expression, we assessed Th-POK protein levels by flow cytometry in CD4 SP cells isolated from control or Tet2/3 DKO mice. Our analysis demonstrated that Th-POK expression, evaluated by median fluorescence intensity, was reproducibly and significantly decreased in CD4 SP cells that lack concomitantly TET2 and TET3 (Figure 1E, F). Collectively, our data suggest that both TET2 and TET3 exert an instrumental role in regulating the magnitude of Th-POK expression in thymic CD4 SP cells. We have previously identified that Zbtb7b expression is significantly reduced in thymic iNKTs (8). Thus, we evaluated by flow cytometry Th-POK protein levels in total iNKT cells (Figures 1G, H). Our analysis reveals that Tet2/3 DKO iNKT cells also show reduced expression of Th-POK (Figures 1G, H). Thus, TET2 and TET3 regulate Th-POK expression in both CD4 SP and iNKT cells.
TET proteins control DNA demethylation across Zbtb7b locus in CD4 SP and iNKT cells
We then asked if loss of TET proteins would impact the cytosine methylation levels across the Zbtb7b locus in CD4 SP cells. To address this, we performed clone adapted template capture hybridization sequencing (CATCH-seq) (64) coupled with bisulfite sequencing to interrogate cytosine methylation status across the Zbtb7b locus in CD4 SP cells. We extended our analysis to include a region approximately 3.0 kb upstream of exon 1a that contains the Zbtb7b silencer (65) and the upstream enhancer (66), located adjacent to and upstream of the silencer. This distal enhancer regulates the initiation of Zbtb7b expression. Deletion of this distal enhancer results in redirection of MHC class II positively selected cells towards the CD8 lineage (62, 65). In addition, there is a proximal enhancer, located around 3.6 kb downstream of exon 1a of Zbtb7b (66), that is not required for initiating the expression of Th-POK after positive selection, but is instrumental in the maintenance of expression of Th-POK (65, 67).
Comparison of CpG methylation in control and Tet2/3 DKO CD4 SP cells revealed a gain of intragenic methylation across the Zbtb7b locus upon impaired TET expression (Figures 2A, B). A summary of the data is depicted in Figure 2A. All 4 biological replicates from the control (wild type) mice and the 3 biological replicates from Tet2/3 DKO mice are indicated (Figure 2B). We did not observe increased cytosine methylation upstream of exon 1a, in the silencer and the upstream enhancer (Figures 2A, B), consistent with the fact that Th-POK is expressed in Tet2/3 DKO CD4 SP cells. Strikingly, we observed a gain of methylation in various CpGs downstream of exon 1b (Figures 2A, B), surrounding the proximal enhancer, that may compromise the optimal activation of the proximal enhancer. Suboptimal activation of the proximal enhancer may impact expression of Th-POK and result in CD4 SP cells that cannot sustain high levels of Th-POK, consistent with the reduced protein expression of Th-POK in Tet2/3 DKO CD4 SP cells (depicted in Figures 1E, F).
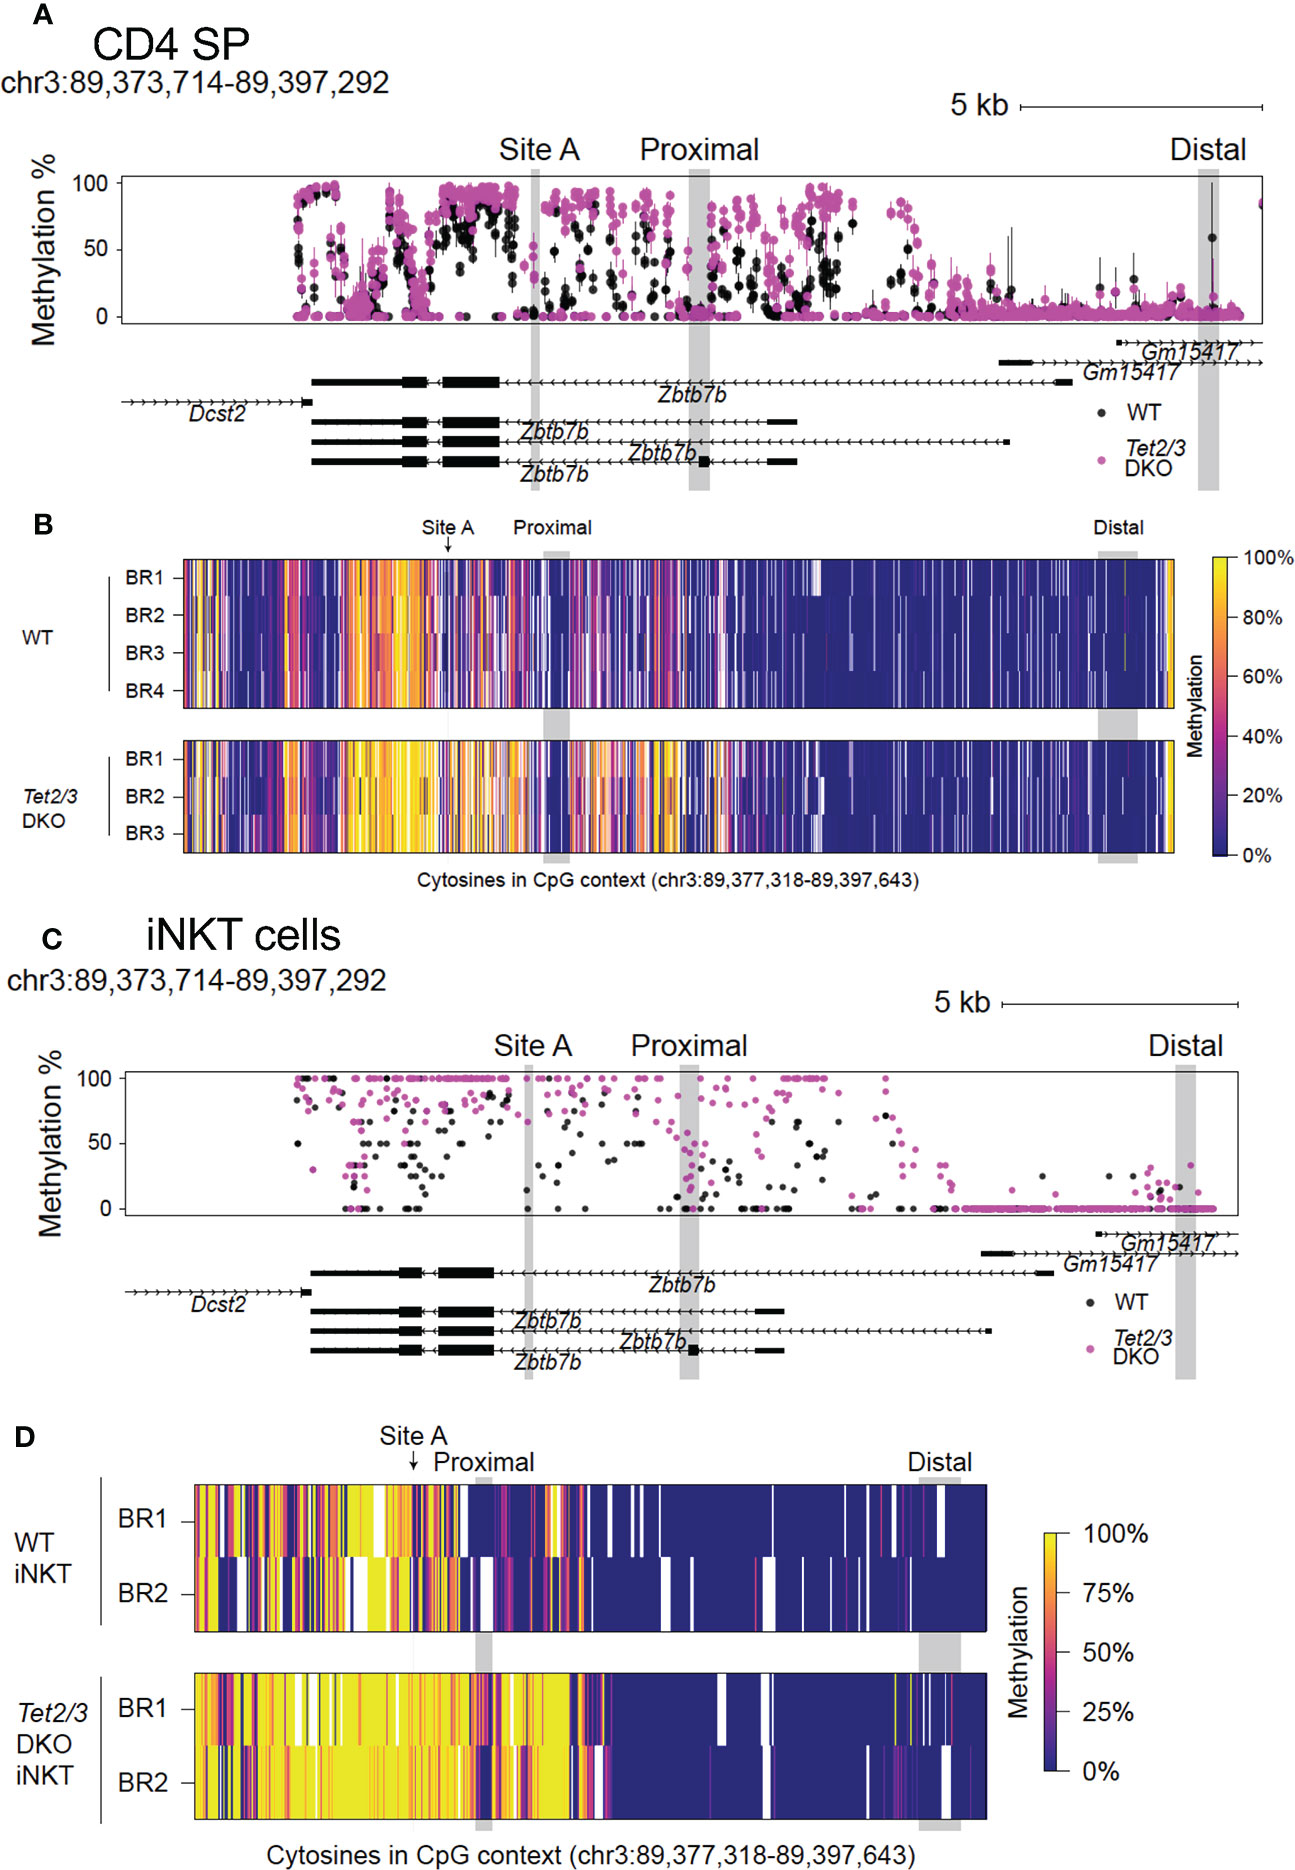
Figure 2 Conserved role of TET2 and TET3 in regulating DNA demethylation across the Zbtb7b locus in CD4 SP and iNKT cells in the thymus. (A) Evaluating the methylation status of cytosines in CpG context as determined by bisulfite conversion and CATCH-seq at the Zbtb7b locus (mouse reference genome mm10, chromosome 3: 89,373,714-89,397,292) in CD4 SP cells isolated from control (wild type) cells (in black) and Tet2/3 DKO mice (in magenta). The points show means and the lines show the minimums and maximums. Site A where GATA3 is binding is highlighted in gray. Note the gain of cytosine methylation in Tet2/3 DKO across Zbtb7b locus, including at site (A). DNA isolated from n=4 control (shown in black) and n=3 Tet2/3 DKO CD4 SP (depicted in magenta) biological replicates was evaluated. (B) Heatmap depicting the methylation status of cytosines in CpG context in the Zbtb7b locus and the upstream genomic region including Zbtb7b silencer and distal enhancer (reference genome mm10, chromosome 3: 89,373,714-89,397,292) evaluated by CATCH-seq of bisulfite treated DNA from control (wild type) (n=4 biological replicates) and Tet2/3 DKO (n=3) CD4 SP cells. Each individual biological replicate is depicted as BR. The scale for evaluating methylation enrichment is shown. (C) Methylation status of cytosines in CpG context evaluated by bisulfite conversion followed by whole genome bisulfite sequencing [WGBS, data obtained from (8)] at the Zbtb7b locus (mouse reference genome mm10, chromosome 3: 89,373,714-89,397,292) in iNKT cells isolated from control (wild type) cells (in black) and Tet2/3 DKO mice (in magenta). (D) Heatmap depicting the methylation status of cytosines in CpG context in the Zbtb7b locus and the upstream genomic region including Zbtb7b silencer and distal enhancer (reference genome mm10, chromosome 3: 89,373,714-89,397,292) evaluated by WGBS of bisulfite treated DNA from control (wild type, shown in black) (n=2 biological replicates) and Tet2/3 DKO (shown in magenta) (n=2 biological replicates) iNKT cells. Each individual biological replicate is depicted as BR. The data for this analysis were obtained from (8). The scale for evaluating methylation enrichment is shown. The distal enhancer, the proximal enhancer and the site A are indicated.
In addition, we evaluated the methylation status at site A, which is located in the gene body of Zbtb7b gene and which has been previously reported to be a target for GATA3 (24). Our analysis revealed increased methylation of cytosines in the CpG context at this site in the Tet2/3 DKO CD4 SP cells compared to the wild type CD4 SP cells that were devoid of methylation in this site (Figures 2A).
To evaluate whether TET2 and TET3 exert a conserved role in regulating Th-POK expression by regulating DNA demethylation across other lineages, we used our published whole genome bisulfite sequencing (WGBS) datasets (8), that assessed DNA methylation at single nucleotide resolution across the genome of wild type and Tet2/3 DKO sorted iNKT cells (Figures 2C, D). Our analysis demonstrated a similar gain of cytosine methylation in Tet2/3 DKO iNKT cells (Figures 2C, D) compared to Tet2/3 DKO CD4 SP cells (Figures 2A, B). Specifically, we identified gain of methylation surrounding the proximal enhancer and site A.
Gain of intragenic methylation and decreased binding of GATA3 at the Zbtb7b locus
5hmC enrichment, which was assessed by cytosine-5-methylenesulfonate immunoprecipitation followed by sequencing (CMS-seq) (16), partially overlaps with chromatin accessible regions, identified by mining publicly available datasets of assay for transposase accessible chromatin with high throughput sequencing (ATAC-seq) (68) datasets (27), across the Zbtb7b gene body (Figure 3). Expression of Zbtb7b is further regulated by binding of Th-POK across the Zbtb7b gene body and the Zbtb7b silencer, as assessed by publicly available ChIP-seq datasets (27) in a feedback, autoregulatory loop as previously described (69). Th-POK binding did not appear to overlap with 5hmC enrichment, (Figure 3). An additional regulatory mechanism of Th-POK expression by TET proteins is to impact the binding of transcription factors that determine Th-POK expression by modulating the CpG methylation status (70). It has been reported that cytosine modification status can affect the binding of transcription factors across the DNA (70). For instance, the vast majority of transcription factors cannot bind to methylated cytosines, however pioneer transcription factors have been reported to recognize and bind to 5mC. In addition, oxi-mCs can be specifically recognized by transcription factors (4) and thus their absence can inhibit transcription factor binding. GATA3 is known to induce Th-POK expression in CD4 SP cells (24) and is necessary for CD4 lineage commitment. GATA3 is known to bind to the Zbtb7b locus upstream of exon 2, in chromatin accessible region, at site A (24) (Figure 3). Interestingly, in this region we discover a gain of CpG methylation upon Tet2/3 deletion. Thus, we tested GATA3 binding in control and Tet2/3 DKO CD4 SP cells using Cleavage Under Targets and Release Using Nuclease (CUT&RUN) (71). Our data revealed that GATA3 binds strongly to the Zbtb7b locus in wild type CD4 SP cells (3 biological replicates were evaluated), however there is a significant reduction of GATA3 binding in Tet2/3 DKO CD4 SP cells (2 biological replicates were used) (Figure 3). These data suggest that GATA3 binds accessible intragenic regions in control CD4 SP cells (Figure 3). Gain of methylation upon TET2/3 loss presumably compromise the efficiency of GATA3 binding in the Zbtb7b locus and might contribute to the subsequent reduced expression of Th-POK in CD4 SP cells (Figure 3, Figures 1E, F).
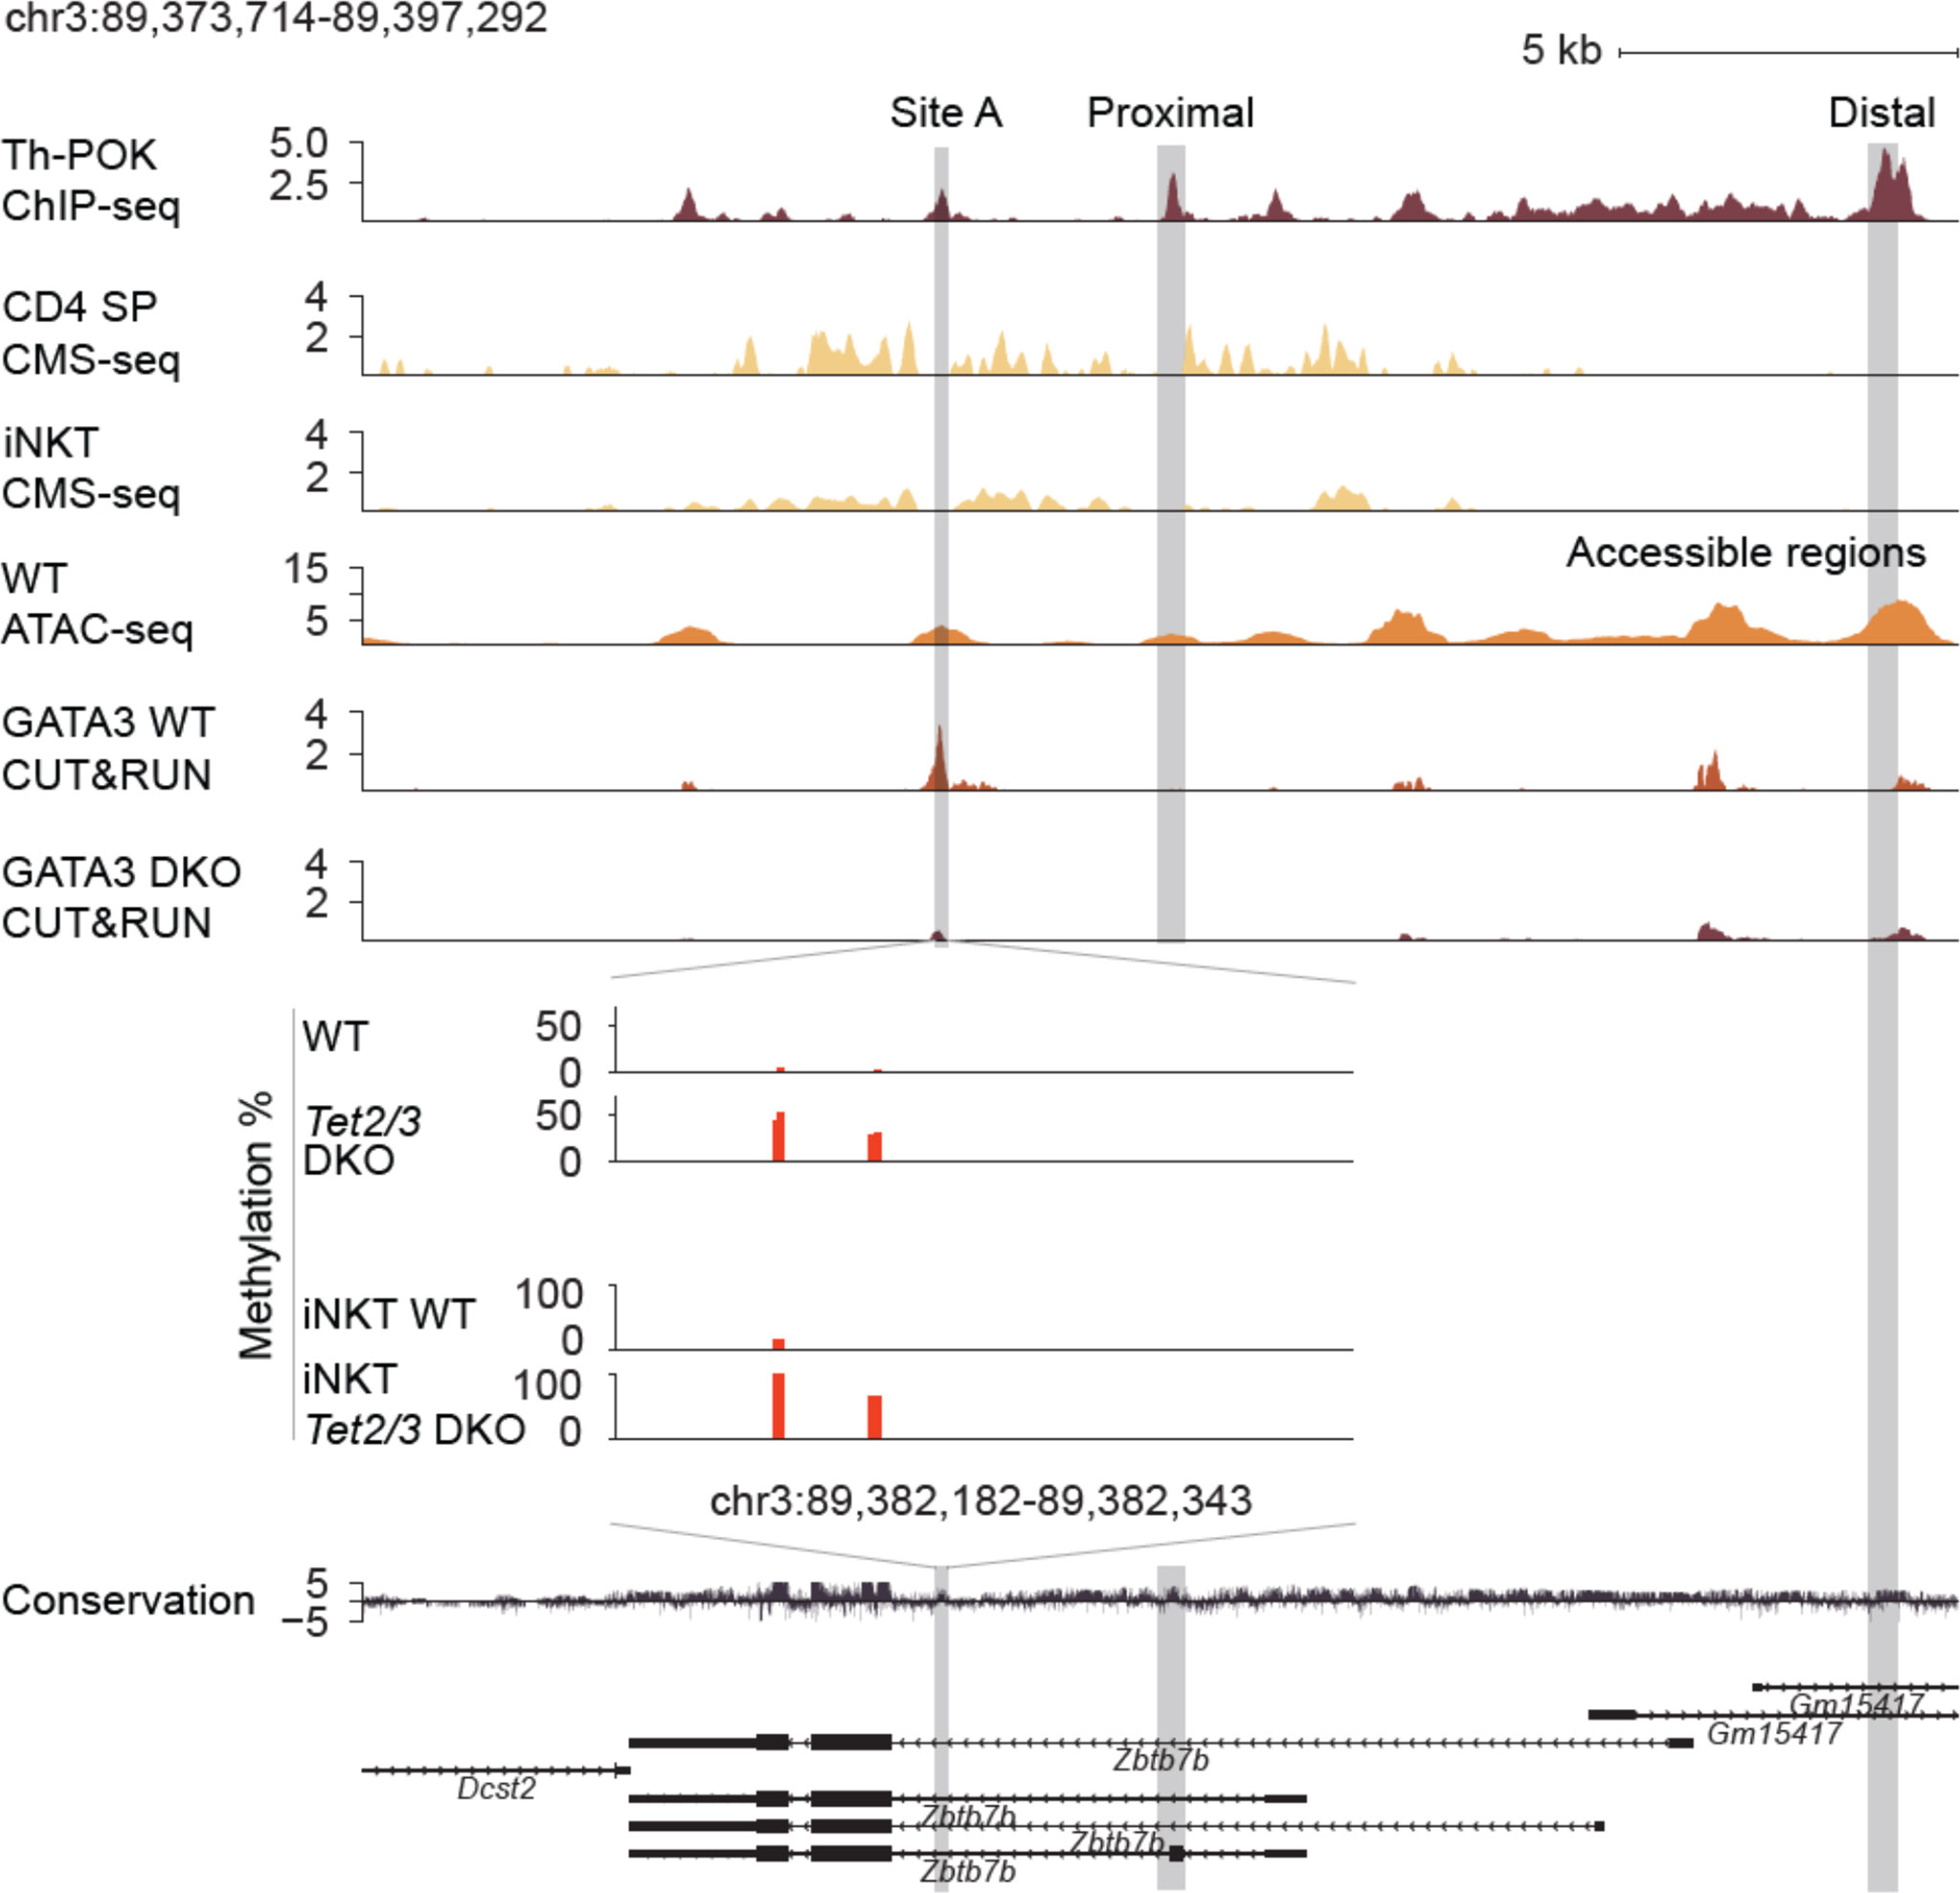
Figure 3 Reduced binding of GATA3 and gain of methylation across the Zbtb7b locus in the absence of TET2 and TET3. Genome browser snapshot of transcriptional and epigenetic regulation (evaluated by chromatin accessibility, hydroxymethylation and methylation status) of the Zbtb7b locus. Th-POK binding [evaluated by Th-POK ChIP-seq, data obtained from (27)], 5hmC distribution [evaluated by CMS-IP seq, (16)] in the Zbtb7b locus in control CD4 SP cells. GATA3 binding (evaluated by CUT&RUN, present study) is assessed in control (n=3 biological replicates) and Tet2/3 DKO (n=2 biological replicates) CD4 SP cells. Site A is a previously identified GATA3 binding site (evaluated by ChIP) (65) that overlaps with one of the identified peaks by CUT&RUN (present study) in WT CD4 SP cells. The binding of GATA3 in site A is significantly reduced in Tet2/3 DKO CD4 SP cells. Zoom in site A and evaluation of the methylation status by CATCH-seq. Higher level of methylation as indicated by red bars is observed in Tet2/3 DKO CD4 SP. The arrows indicate the direction of transcription. Similar gain of methylation at site A is shown in Tet2/3 DKO iNKT cells compared to wild type iNKT cells that are devoid of cytosine methylation in CpG context at site A. The distal enhancer, the proximal enhancer and the site A are indicated.
Notably, we have previously reported that 5hmC is significantly enriched across the gene body of GATA3 in thymocytes as well as in Th2 cells (16). Similar detailed findings have been recently reported regarding 5hmC enrichment across Gata3 during in vitro Th2 polarization (72). Gata3 mRNA expression was not significantly reduced in Tet2/3 DKO CD4 SP cells, however there was a clear trend for reduced expression (Supplementary Figure 4A). We then examined protein expression levels of GATA3 in CD4 SP cells from control and Tet2/3 DKO mice by flow cytometry. This analysis confirmed a reproducible and significant trend of reduced expression of GATA3 in Tet2/3 DKO CD4 SP cells (Supplementary Figures 4B, C). Thus, the significant reduction of GATA3 binding at site A that we identify in Tet2/3 DKO CD4 SP cells could be the cumulative effect of increased methylation at the site and reduced expression of GATA3.
TET2 that lacks enzymatic activity fails to restore iNKT cell expansion in the thymus in the concomitant absence of TET3
Notably, TET2 has been suggested to exert additional, non-catalytic roles in regulating gene expression in hematopoietic populations (48, 49, 73) and potentially in controlling the proliferation of iNKTs (8). To assess if TET2 might play a catalytic independent role in regulating conventional and unconventional T cell lineage specification, we used Tet2CD mice (Figure 4A) that express full length TET2 protein with point mutations, which compromise iron binding and thus render TET2 catalytically inactive (51). We confirmed the point mutations by Sanger sequencing (Figure 4B). In addition, we confirmed that thymocytes isolated from the Tet2CD express TET2 both at the RNA level by quantitative PCR (Figure 4C) and at the protein level (Figures 4D, E, original western blots available in Supplementary Figure 5A). Thymic development was not affected in Tet2CD mice (Supplementary Figure 6), suggesting that TET2 full length protein that is catalytically inactive does not exert a dominant negative effect by preventing recruitment of wild type TET3 to its target genes.
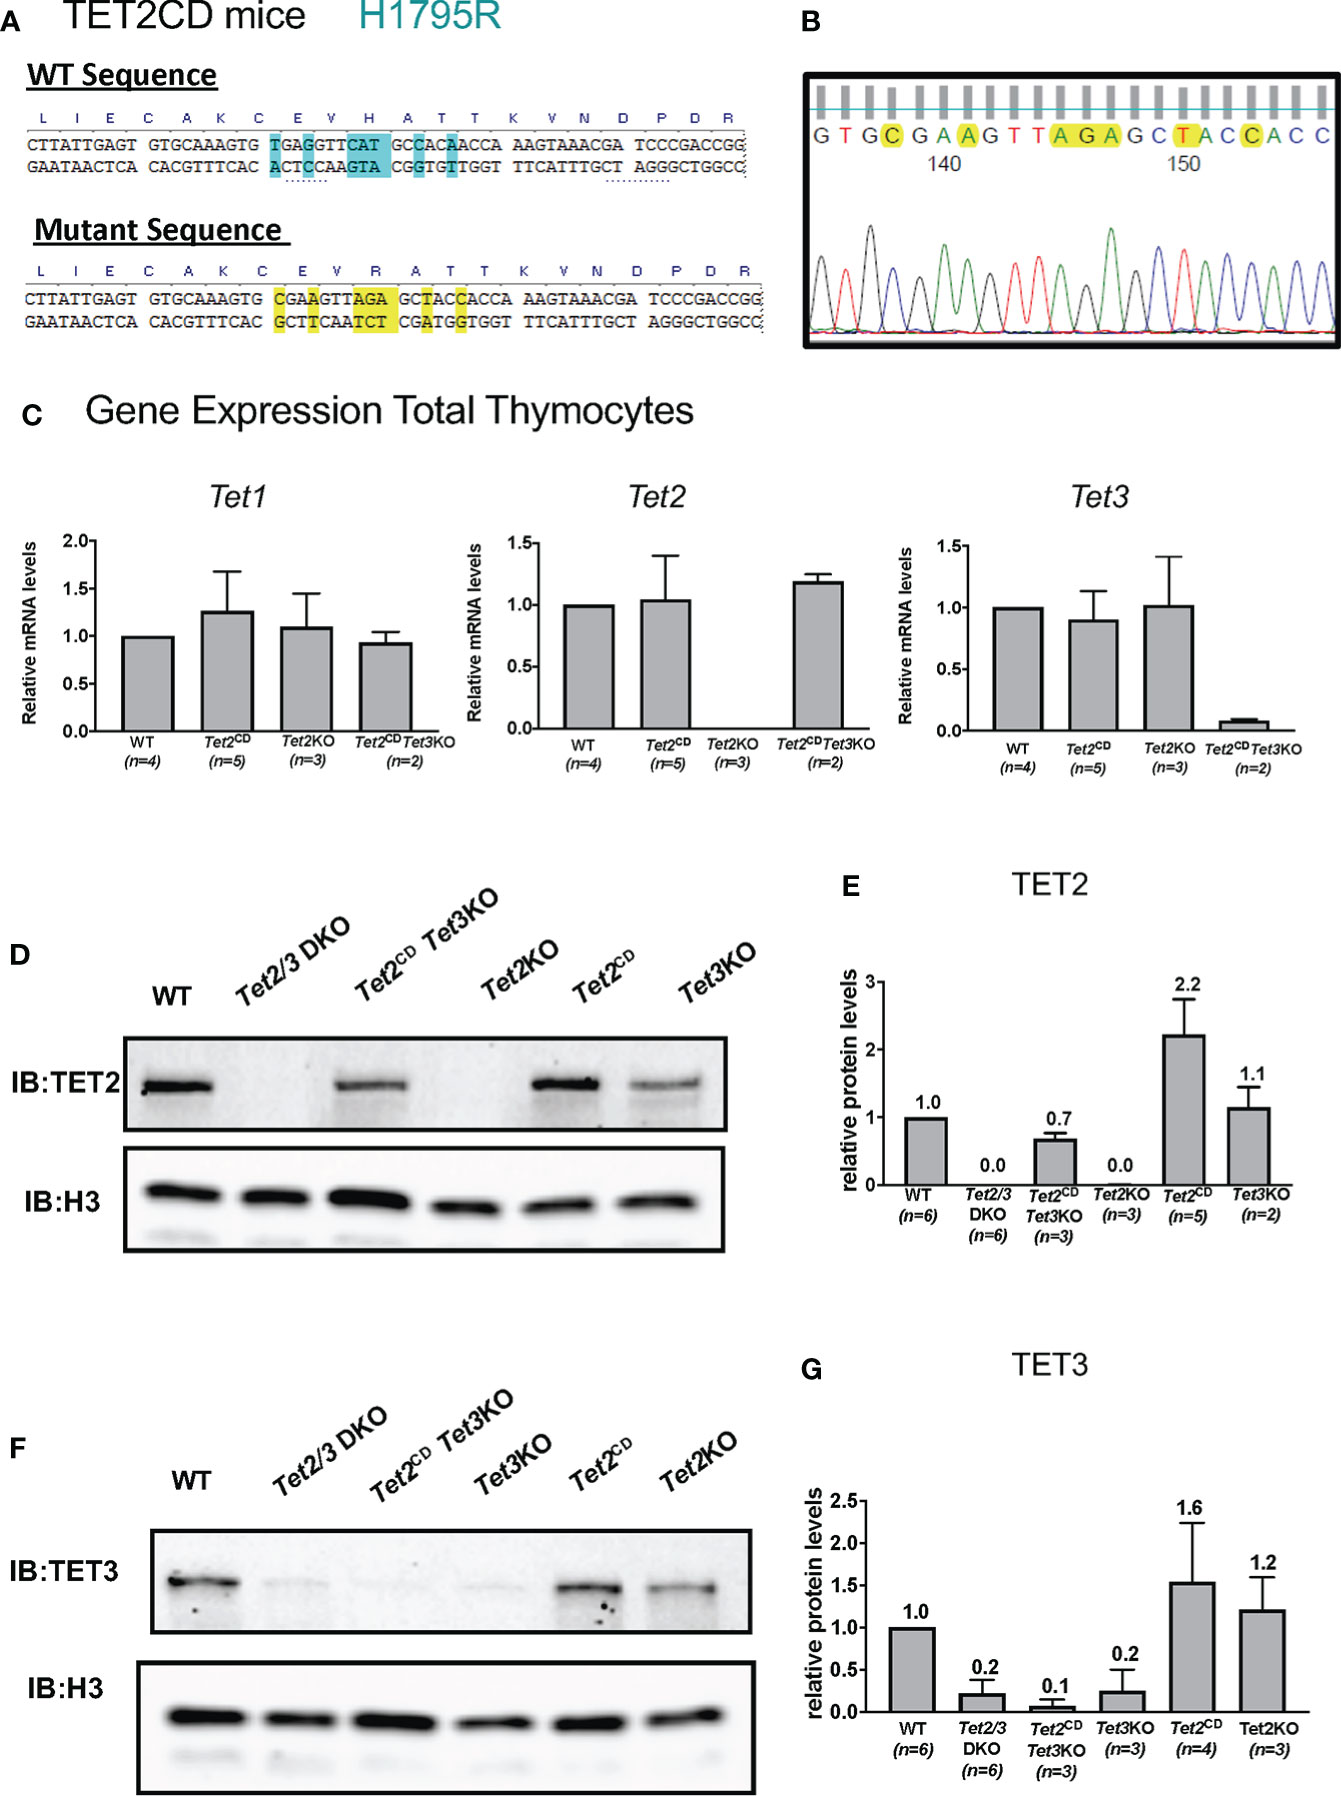
Figure 4 Characterization of Tet2 Catalytic Dead (Tet2CD) Tet2CD Tet3flx/flx CD4Cre (Tet2CD Tet3 KO) mice. (A) Depicting the point mutations that result in H1795R catalytic dead TET2 mice. The substitution of histidine (H) with arginine (R) compromises the ability to bind Fe2+ that is critical for the catalytic activity of TET2. (B) Sanger sequencing of genomic DNA indicating the mutations at the TET2 catalytic domain. (C) Gene expression evaluation by real time PCR for Tet1, Tet2 and Tet3 in total thymocytes isolated by control (WT), Tet2CD Tet3 KO, Tet2CD and Tet2 KO. Data from one representative experiment are shown. The total number of evaluated mice is indicated. (D) Western blot depicting TET2 expression in nuclear extracts from total thymocytes isolated from control (WT), Tet2/3 DKO, Tet2CD Tet3 KO, Tet2 KO, Tet2CD and Tet3 KO. Histone 3 (H3) was used as loading control. Data from one representative experiment are shown. (E) Quantification of western blots showing expression of TET2. The number of mice evaluated for each genotype is shown in parenthesis. Control (WT) n=6, Tet2/3 DKO n=6, Tet2CD Tet3 KO n=3, Tet2 KO n=3, Tet2CD n=2 and Tet3 KO n=2. (F) Western blot depicting TET3 expression in nuclear extracts from total thymocytes isolated from control (WT), Tet2/3 DKO, Tet2CD Tet3 KO, Tet3 KO, Tet2CD and Tet2 KO. Histone 3 (H3) was used as loading control. (G) Quantification of western blots showing expression of TET3. The number of mice evaluated for each genotype is shown in parenthesis. control (WT) n=6, Tet2/3 DKO n=6, Tet2CD Tet3 KO n=3, Tet3 KO n=3, Tet2CD n=4 and Tet2 KO n=3.
To investigate whether TET2 catalytically inactive protein has shared redundant functions with TET3 in regulating thymic T cell and iNKT cell development, we generated Tet2CD Tet3flx/flx CD4Cre (Tet2CD Tet3 KO) mice. The goal was to dissect whether TET2 could exert non-catalytic roles in regulating Th-POK expression in collaboration with TET3. Our analysis showed that Tet2CD Tet3 KO mice developed similar, aggressive phenotype with Tet2/3 DKO mice and exhibited splenomegaly and lymphadenopathy. Thus, we focused our analysis in young mice (21-28 days old) that appeared normal. First, we evaluated the gene expression of Tet1, Tet2 and Tet3 by real time PCR using RNA isolated from wild type, Tet2CD, Tet2 KO and Tet2CD Tet3 KO total thymocytes. While Tet2CD Tet3 KO thymocytes do not express Tet3, they do express Tet1 and Tet2 (Figure 4C).
Next, we assessed the protein expression levels of TET2 and TET3. Our data confirm that thymocytes isolated from Tet2CD Tet3 KO mice express TET2 but do not express TET3. In addition, we included as controls thymocytes isolated from wild type, Tet2/3 DKO mice, Tet2 KO, Tet2CD and Tet3 KO mice (Figures 4D–G, original, unprocessed western blots available in Supplementary Figure 5A). Moreover, as CD4 SP cells express higher levels of TET2 compared to DP cells [Figure 1A and (8, 46)], we evaluated TET2 protein expression levels specifically at CD4 SP cells that were isolated by FACS sorting from control and Tet2CD Tet3 KO mice. Our analysis confirmed that CD4 SP cells isolated from Tet2CD Tet3 KO mice express TET2 protein at comparable levels to wild type CD4 SP cells (Supplementary Figure 7, original western blots available in Supplementary Figure 5B).
Enzymatic activity of TET2 is required for iNKT cell lineage expansion and specification
We have previously established a fundamental role for both TET2 and TET3, working in a cooperative fashion, in regulating iNKT cell expansion and lineage specification (8). However, when we investigated DNA methylation in Tet2/3 DKO iNKT cells we discovered a limited number of differentially methylated regions revealing a focal role of TET proteins in regulating DNA demethylation (8). Tet3 KO mice showed iNKT cell lineage skewing but the frequency and numbers of iNKT cells were normal in these mice (8). However, abundancy and lineage specification of iNKT cells was normal in Tet2 KO mice (8). Interestingly, it has been reported that TET2 exerts catalytic independent roles to regulate lymphoid proliferation (48). Thus, an open question was if TET2 could exert additional, catalytic independent roles to regulate iNKT cell proliferation. We isolated thymocytes from control, Tet2/3 DKO and Tet2CD Tet3 KO mice and performed staining with a tetramer of the MHC class I CD1d that is loaded with a-Galactosylceramide (aGal-Cer), a lipid that iNKT cells can recognize and bind, and TCRβ. Cells that were positive for aGalCer-CD1d and expressed intermediate levels of TCRβ were identified as iNKT cells (Figure 5A). Our analysis revealed that iNKT cells exhibit a dramatic expansion in Tet2CD Tet3 KO iNKT mice, similar to the Tet2/3 DKO iNKT cell expansion that we have previously reported (8) (Figure 5A). This increase of the percentage of iNKT cells in the thymus was reproducible and significant (Figure 5B) and it was also observed at the level of numbers of cells (Figure 5C).
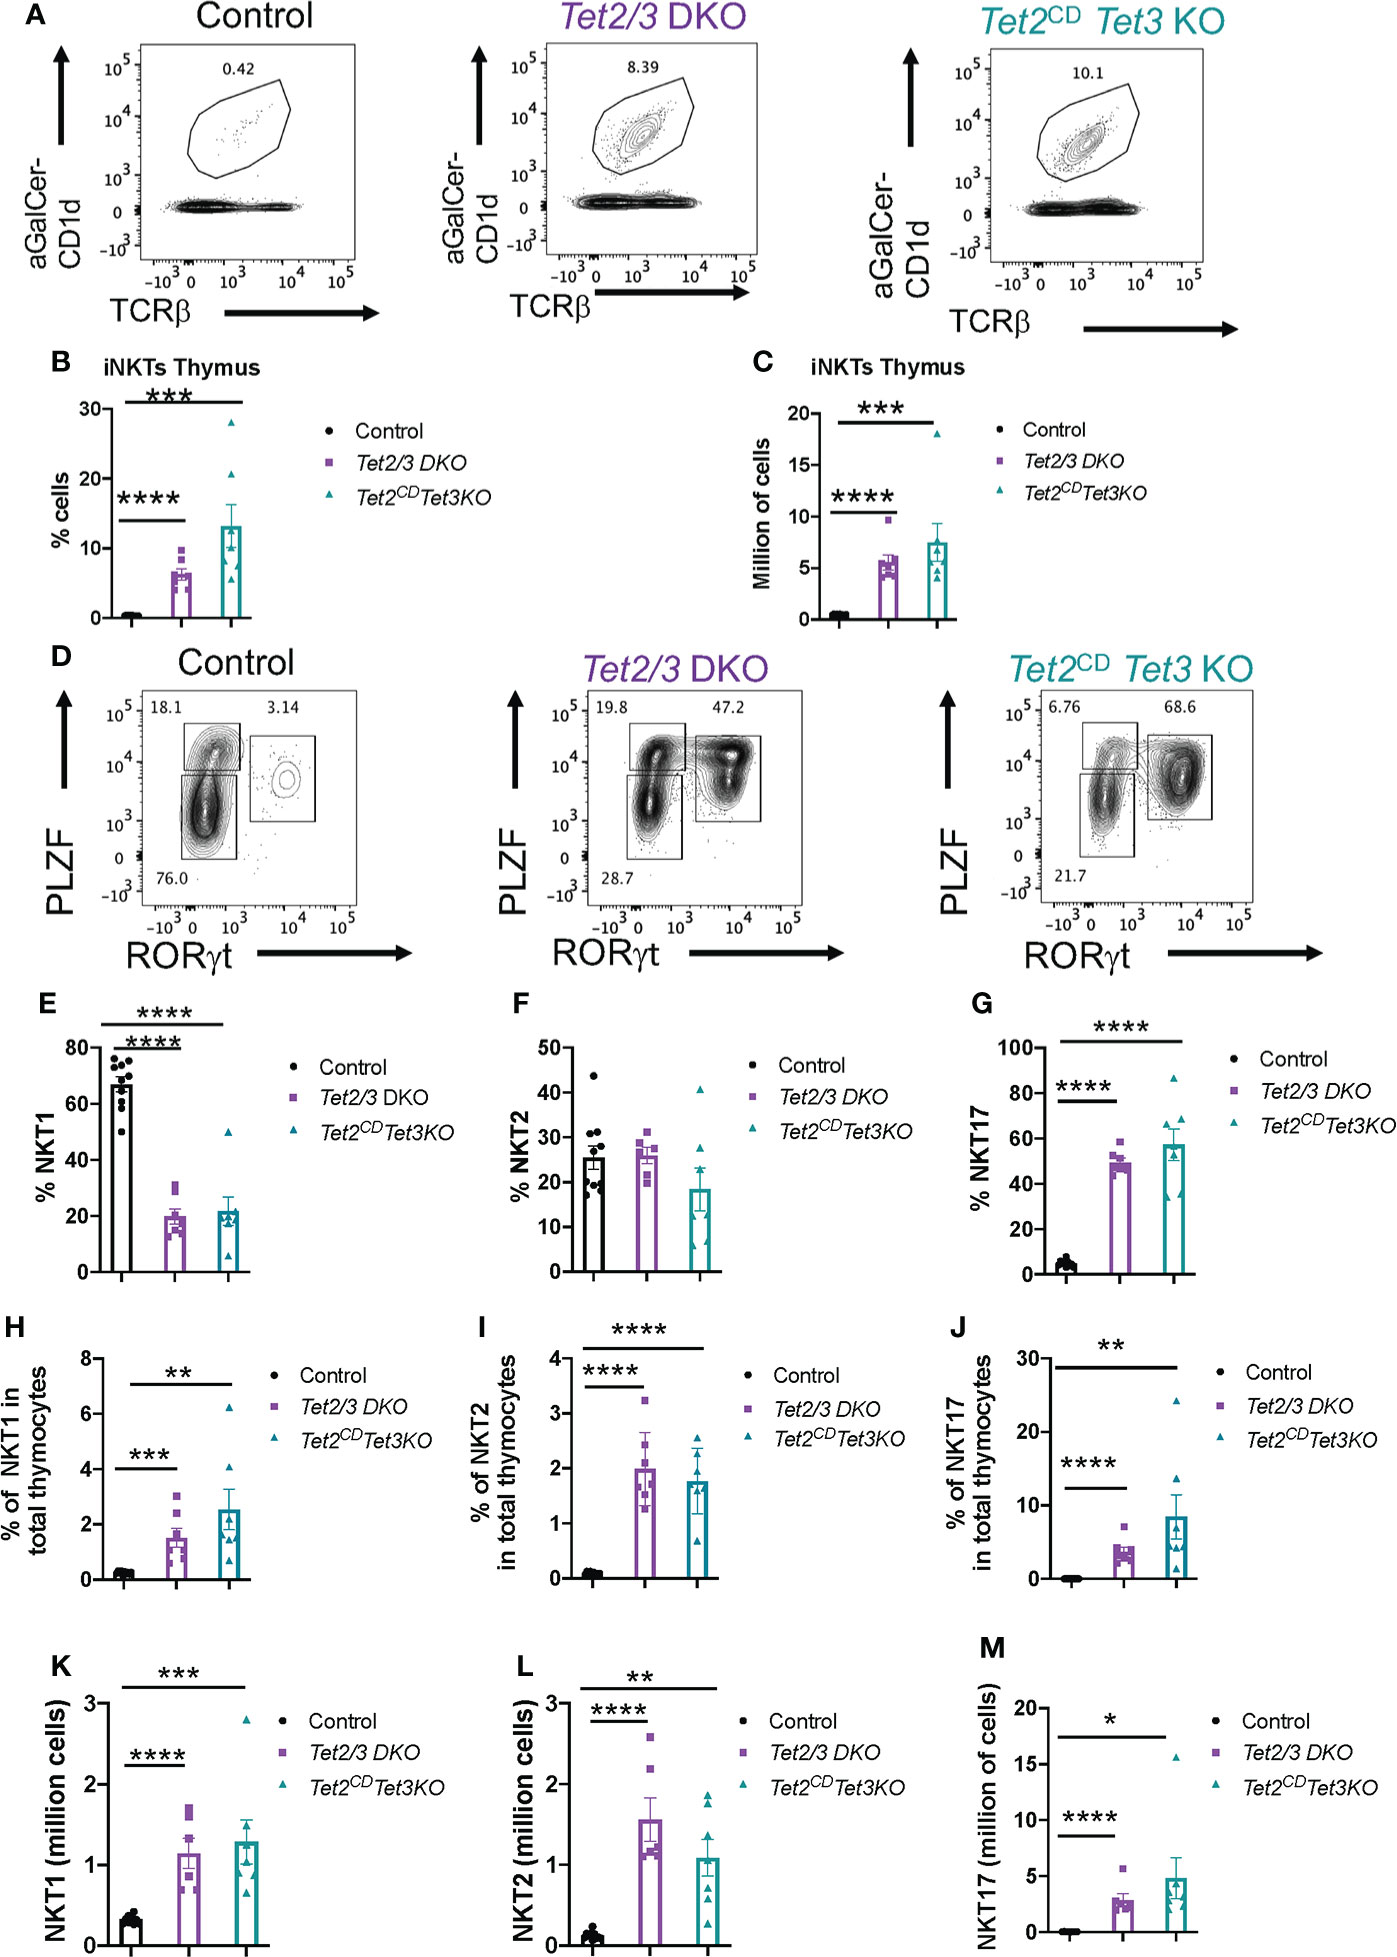
Figure 5 Tet2CD Tet3 KO iNKT cells show expansion and NKT17 cell lineage skewing. (A) Representative flow cytometry plots evaluating aGalactosylseramide (aGalCer) loaded CD1d tetramer binding and TCRβ expression in thymocytes isolated from control, Tet2/3 DKO and Tet2CD Tet3 KO mice. The aGalCer-CD1d tetramer+ TCRβ+ cells are iNKT cells. (B) Percentage of iNKT cells (identified as described in (A) in the thymus isolated from control (in black), Tet2/3 DKO (in purple), Tet2CD Tet3 KO (in cyan) mice. (C) Number of iNKT cells in the thymus of control (in black), Tet2/3 DKO (in purple), Tet2CD Tet3 KO (in cyan) mice. (D) Representative flow cytometry plots evaluating the expression of transcription factors PLZF and RORγt in thymus isolated from control, Tet2/3 DKO and Tet2CD Tet3 KO mice. PLZFlow RORγt negative cells are NKT1, PLZF high RORγt negative are NKT2 and PLZF intermediate RORγt positive cells are NKT17 cells. (E) Percentage of NKT1 cells, (F) NKT2 and (G) NKT17 cells among total iNKT cells in the thymus isolated from control (in black), Tet2/3 DKO (in purple), Tet2CD Tet3 KO (in cyan) mice. (H) Percentage of NKT1 cells, (I) NKT2 cells and (J) NKT17 cells among total thymocytes isolated from control (in black), Tet2/3 DKO (in purple), Tet2CD Tet3 KO (in cyan) mice. (K) Number of NKT1, (L) NKT2 and (M) NKT17 cells in the thymus isolated from control (in black), Tet2/3 DKO (in purple), Tet2CD Tet3 KO (in cyan) mice. For B, C, E-M: Each dot represents a mouse. 5 independent experiments were performed. Male and female mice for each genotype were analyzed. Control n=10, Tet2/3 DKO n=6, Tet2CD Tet3 KO n=7 **** (p < 0.0001),*** (p < 0.001), ** (p < 0.01), * (p < 0.05) unpaired t test. Unless otherwise indicated the difference is not statistically significant. Horizontal lines indicate the mean (s.e.m.).
Next, we asked whether iNKT cell lineage specification was affected in the thymus of Tet2CD Tet3 KO mice in comparison to wild type and Tet2/3 DKO mice. To this end we performed a flow cytometry experiment to investigate the expression of key lineage specifying transcription factors in iNKT cells (Figure 5D). Specifically, we focused on the protein expression levels of the iNKT cell lineage specifying factor PLZF and the NKT17 cell lineage specifying factor RORγt. Our analysis confirmed that in thymic iNKT cells isolated from wild type mice the vast majority of the cells expressed low levels of PLZF and they did not express RORγt (Figure 5D), consistent with the prevalence of NKT1 subset in the thymus of C57/BL6 mice. However, in sharp contrast to the control iNKTs, the Tet2CD Tet3 KO iNKT cells exhibit a striking upregulation of the NKT17 subset that is characterized by RORγt expression and intermediate levels of PLZF expression (Figure 5D). The NKT17 subset in the thymus isolated from control mice is the least frequent (Figure 5D). We also investigated the representation of the PLZF high, RORγt negative subset that represents NKT2 cells (Figure 5D). Overall, our analysis revealed that Tet2CD Tet3 KO iNKT subsets were comparable in percentage and numbers to the Tet2/3 DKO iNKT cells (Figures 5D–M). The experimental results showed a significant increase in frequency of NKT17 cells and a decrease in the frequency of NKT1 cells compared to control mice (Figures 5D–G). Notably, the frequency of iNKT cells in the thymus was strikingly higher in the mutant mice compared to the control. Thus, we proceeded to analyze the frequency of iNKT subsets among total thymocytes (Figures 5H–J). This approach reveals that the NKT2 population is significantly upregulated in both Tet2/3 DKO and Tet2CD Tet3 KO mice compared to control mice (Figures 5H–J). In addition, the mutant mice exhibited a significant increase in absolute numbers of all the three iNKT subsets (NKT1, NKT2 and NKT17) (Figures 5K–M). Collectively, our results establish an instrumental role of the enzymatic activity of TET2 that, in cooperation with TET3, regulates iNKT cell expansion and differentiation.
Development of innate like CD8 cells in the thymus of Tet2CDTet3 KO mice
We further evaluated thymic development in Tet2CD Tet3 KO mice. Increased numbers of iNKT cells and secretion of cytokine IL-4 results in the emergence of a thymic population of unconventional CD8 SP cells with memory characteristics (74). These innate like CD8 SP cells upregulate CD44 and express the T-box transcription factor Eomesodermin (EOMES) (75, 76). We observed an increase in the percentage of CD8 SP cells in the thymus of Tet2CD Tet3 KO mice, that was reminiscent of the increased CD8 SP representation in the thymus of Tet2/3 DKO mice (Figures 6A, B). This increase was reproducible and significant both in terms of frequency (evaluated as percentage of cells) and in absolute numbers (Figures 6A–C). To assess if the expanded Tet2CD Tet3 KO CD8 SP cells had features of activated, innate like cells (8) we evaluated by flow cytometry the expression of the transcription factor EOMES. Our data confirmed that Tet2CD Tet3 KO CD8 SP cells upregulate EOMES at comparable levels to Tet2/3 DKO CD8 SP cells (Figures 6D, E). On the other hand, control CD8 SP cells did not express EOMES (Figures 6D, E). Similarly, Tet2CD Tet3 KO CD8 SP cells show increased levels of CD44 expression, an additional hallmark of activated, memory like CD8 cells (Figures 6F, G). Overall, as a result of iNKT cell expansion in the thymus of Tet2CD Tet3 KO mice, we identify the emergence of memory CD8 SP cells consistent with the observed phenotype in Tet2/3 DKO mice.
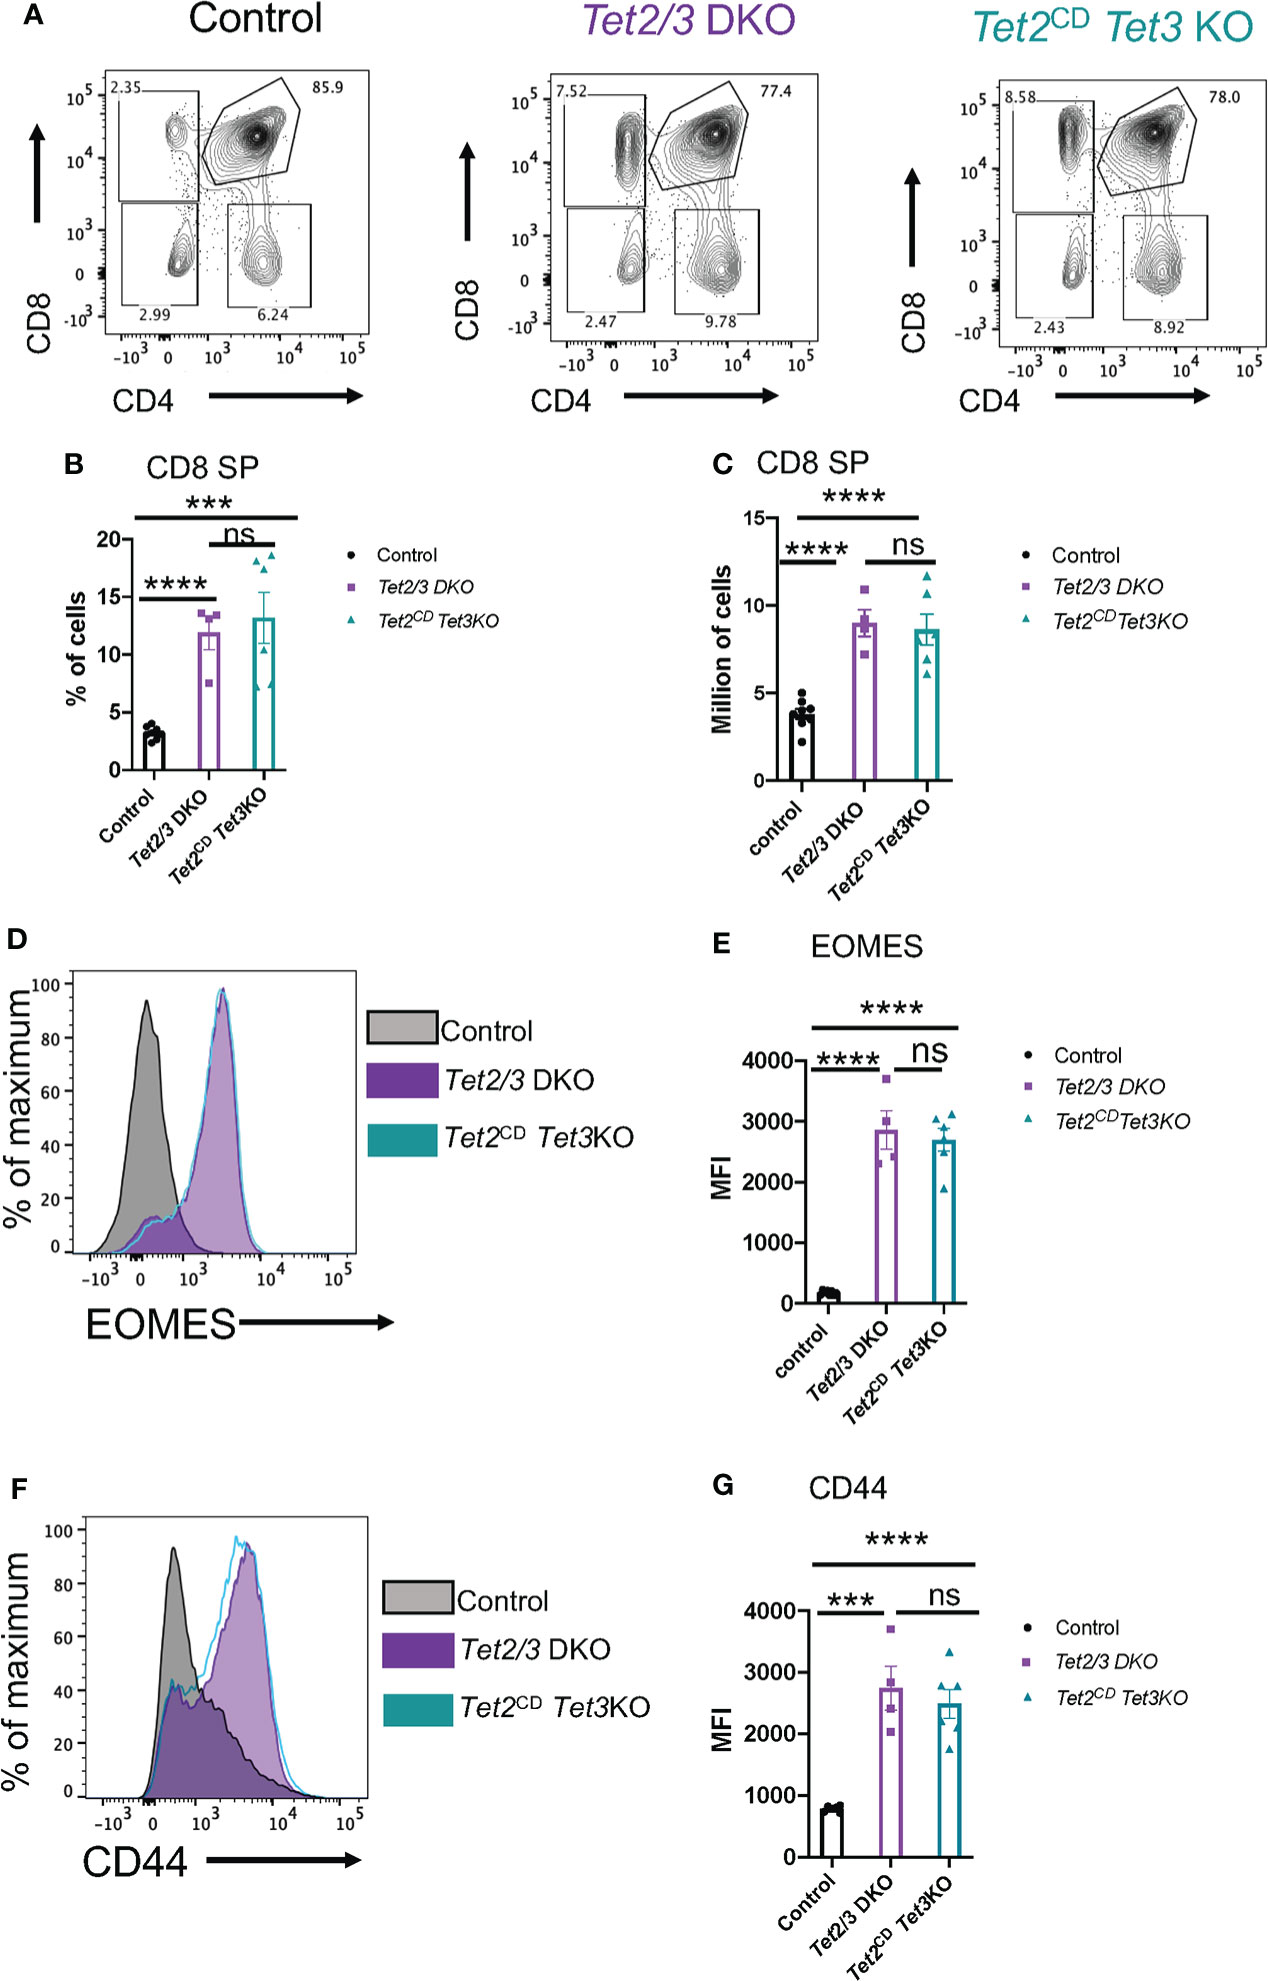
Figure 6 Tet2CD Tet3 KO CD8 SP cells exhibit innate like characteristics. (A) Representative flow cytometry plots evaluating CD4 and CD8 expression in the surface of thymocytes (excluding iNKT cells) isolated from control (wild type), Tet2/3 DKO and Tet2CD Tet3 KO mice. (B) Percentage of CD8 SP cells (determined as described in A) in the thymus isolated from control (in black), Tet2/3 DKO (in purple), Tet2CD Tet3 KO (in cyan) mice. (C) Number of CD8 SP cells in the thymus of control (in black), Tet2/3 DKO (in purple), Tet2CD Tet3 KO (in cyan) mice. (D) Representative histograms evaluating the expression of the transcription factor EOMES in CD8 SP cells. Gray is indicating control cells, purple Tet2/3 DKO and cyan Tet2CD Tet3 KO. (E) Median fluorescence intensity (MFI) of EOMES expression in control (in black), Tet2/3 DKO (in purple) and Tet2CD Tet3 KO (in cyan) CD8 SP cells. (F) Representative histograms evaluating the expression of CD44 in CD8 SP cells. Gray is indicating control cells, purple Tet2/3 DKO and cyan Tet2CD Tet3 KO. (G) Median fluorescence intensity (MFI) of CD44 expression in control (in black), Tet2/3 DKO (in purple) and Tet2CD Tet3 KO (in cyan) CD8 SP cells. For (B, C, E, G): Each dot represents a mouse. 4 independent experiments were performed. Male and female mice for each genotype were analyzed. Control n=8, Tet2/3 DKO n = 4, Tet2CD Tet3 KO n = 6 **** (p < 0.0001),*** (p < 0.001), ns, non-significant, unpaired t test. Horizontal lines indicate the mean (s.e.m.).
TET2 catalytic activity is required for optimal Th-POK expression in CD4 SP and iNKT cells
Next, we asked if expression of full length TET2 protein with compromised enzymatic activity could restore the expression of Th-POK in CD4 SP cells that lacked TET3. To this end, we performed a flow cytometry experiment to interrogate the expression levels of this transcription factor (Figure 7A). Our analysis revealed that Th-POK expression could not be restored in the presence of TET2CD upon simultaneous deletion of TET3. Instead, expression levels of Th-POK were consistently reduced in both Tet2/3 DKO and Tet2CD Tet3 KO CD4 SP cells compared to CD4 SP cells isolated from thymus of wild type mice (Figures 7A, B). Furthermore, we confirm that Th-POK expression is significantly reduced in Tet2/3 DKO and Tet2CD Tet3 KO iNKT cells (Figures 7C, D). Thus, we establish a critical role for TET2 enzymatic activity that, in cooperation with TET3, regulate the magnitude of Th-POK expression in CD4 SP and iNKT cells,
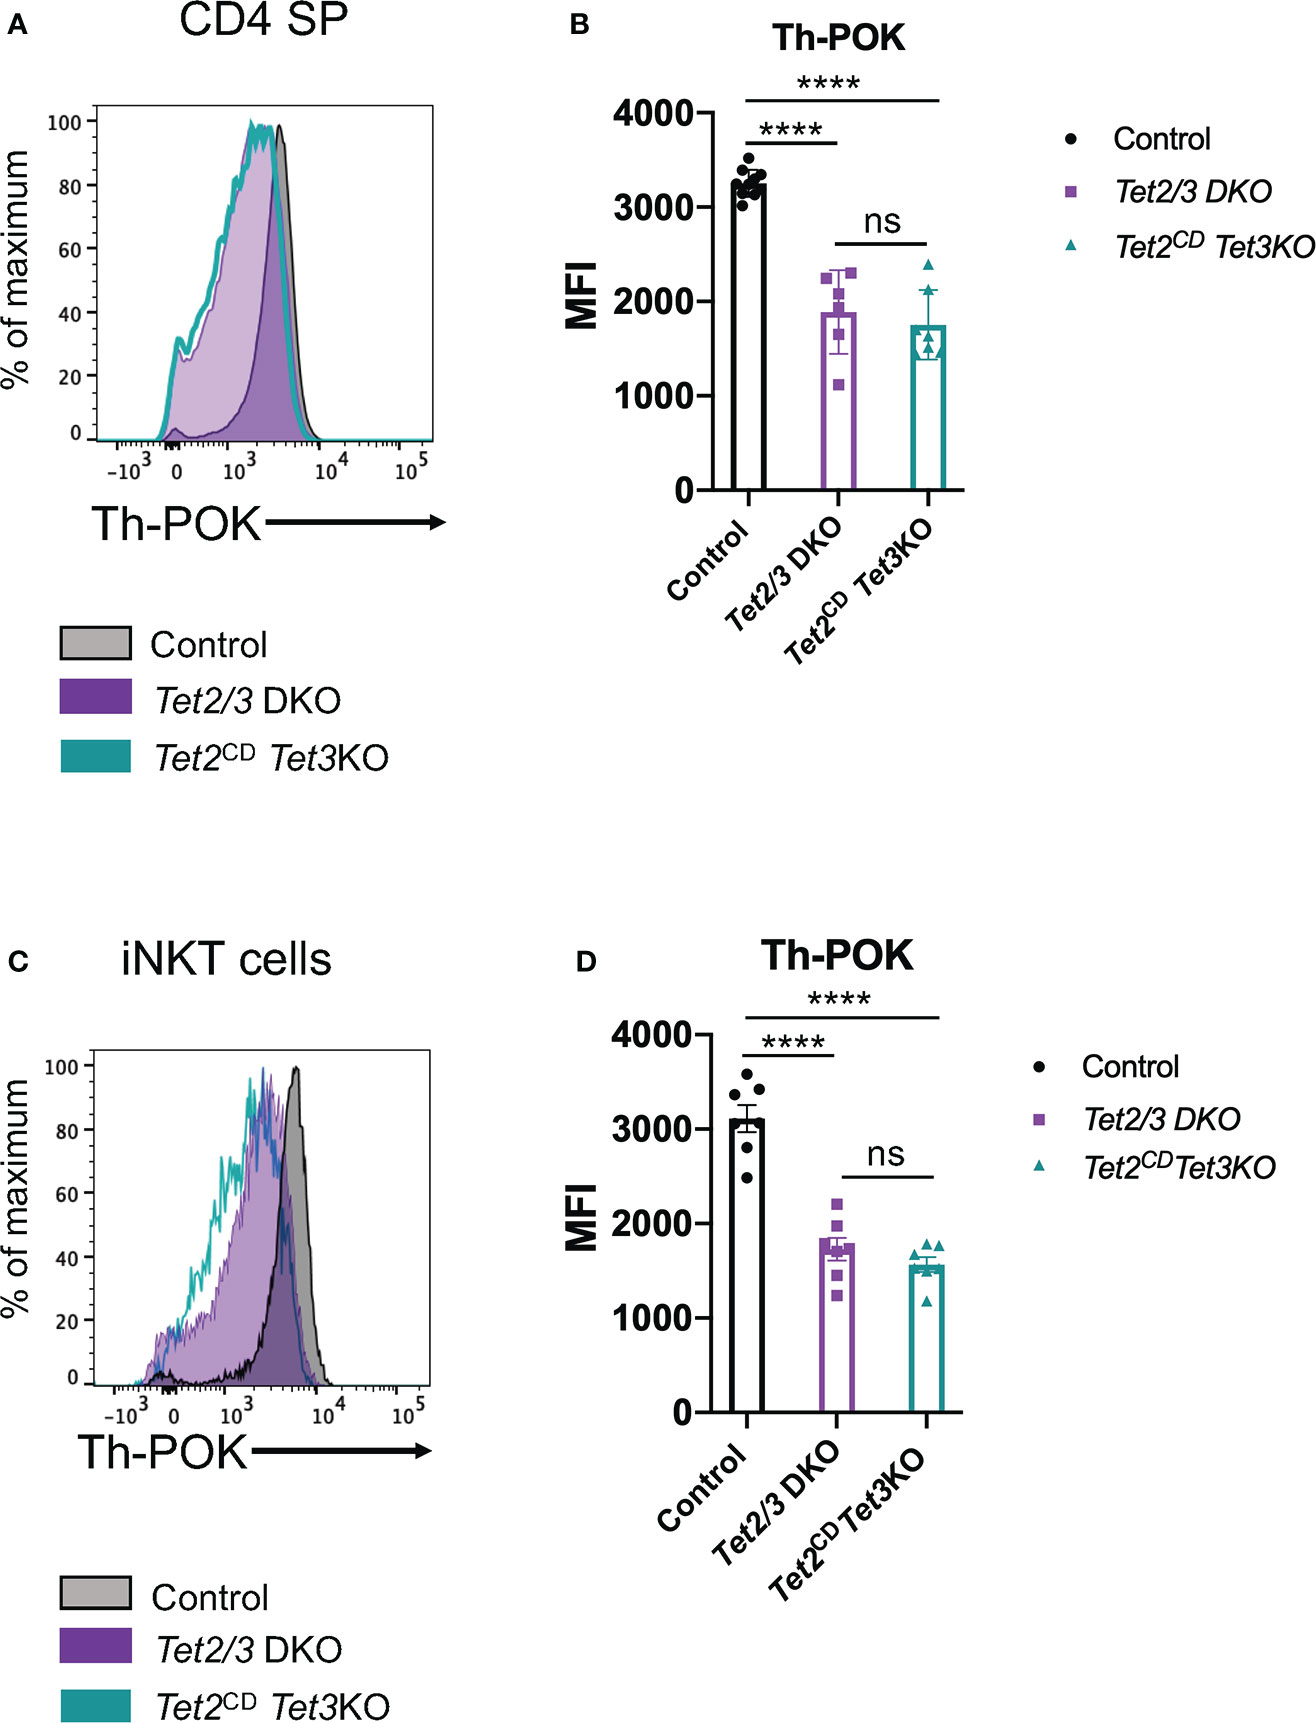
Figure 7 TET2 catalytic activity is required to fine tune Th-POK expression in cooperation with TET3 in CD4 SP cells and iNKT cells. (A) Representative histogram depicting Th-POK expression, assessed by flow cytometry, in control (black), Tet2/3 DKO (purple), Tet2CD Tet3 KO (cyan) in CD4 SP cells. (B) Median fluorescence intensity (MFI) of Th-POK expression in control (in black), Tet2/3 DKO (in purple) and Tet2CD Tet3 KO (in cyan) CD4 SP cells. Each dot represents a mouse. 5 independent experiments were performed. Male and female mice for each genotype were analyzed. Control n=10, Tet2/3 DKO n=6, Tet2CD Tet3 KO n=7 **** (p < 0.0001), ns: non-significant, unpaired t test. Horizontal lines indicate the mean (s.e.m.). (C) Representative histogram depicting Th-POK expression, assessed by flow cytometry, in control (black), Tet2/3 DKO (purple), Tet2CD Tet3 KO (cyan) in iNKT cells. (D) Median fluorescence intensity (MFI) of Th-POK expression in control (in black), Tet2/3 DKO (in purple) and Tet2CD Tet3 KO (in cyan) iNKT cells. Each dot represents a mouse. 5 independent experiments were performed. Male and female mice for each genotype were analyzed. Control n=7, Tet2/3 DKO n = 7, Tet2CD Tet3 KO n = 7 **** (p < 0.0001), ns, non-significant, unpaired t test. Horizontal lines indicate the mean (s.e.m.).
Discussion
Our data suggest a multifaceted role of TET proteins and 5hmC in thymic T cell lineage specification. In this study, we establish a critical role of TET proteins in regulating gene expression in the CD4 lineage. First, we demonstrate that TET2 and TET3 shape gene expression in CD4 SP and iNKT cells (Figure 1). TET proteins act to regulate DNA demethylation at the Zbtb7b locus (Figure 2) affecting the intensity of expression of the lineage specifying transcription factor Th-POK in both CD4 and iNKT cells (Figure 1). Our findings suggest that TET2 and TET3 are not required for the initial expression of Th-POK that is regulated through the distal enhancer. Instead, TET proteins and their enzymatic activity are instrumental for maintaining the optimal expression of Th-POK. These findings enforce the discoveries that TET proteins through their enzymatic activity set the stage for maintenance of stable gene expression of the transcription factor FOXP3, that shapes the identity of regulatory T cells (77–81). In addition, it has been reported that TET proteins can demethylate an enhancer that is required for the stable expression of CD4 during in vitro culture and expansion (18), as well as in vivo (82), providing an additional example where TET mediated DNA demethylation of a locus is critical for stable gene expression and maintenance of cell identity. Thus, an emerging concept is that TET mediated DNA demethylation might be critical for the stability and the regulation of the magnitude of gene expression along the life-span of the cells.
Notably, how TET protein expression is regulated in CD4 cells has not been explored. In the present study, we also report that Tet genes are targets of Th-POK in thymic CD4 SP cells (Supplementary Figure 1). Thus, Th-POK might play regulatory roles to control TET protein expression during the process of CD4 SP cell lineage maturation. This could be at least partially due to TET protein mediated de-methylation of Zbtb7b locus and the maintenance of gene expression. In addition, oxi-mCs might play a role in the recruitment of Th-POK across the genome (4). Further studies are required to elucidate the precise role of Th-POK in regulating expression of TET proteins.
Moreover, our data establish an additional layer by which TET proteins regulate gene expression in the CD4 lineage by affecting both transcription factor expression and binding across the genome. Specifically, we demonstrate that GATA3 is less expressed in Tet2/3 DKO CD4 cells compared to control (wild type) cells. There is reduced binding of GATA3 at site A of Zbtb7b locus, that might contribute to the overall reduced Th-POK expression in Tet2/3 DKO cells. Our findings suggest redundant regulatory roles for TET2 and TET3 in fine tuning Th-POK expression and GATA3 expression and potentially binding in CD4 SP cells. Notably, TET2 has been suggested to exert additional, non-catalytic roles in regulating gene expression in hematopoietic populations (48) and potentially in controlling the proliferation of iNKTs (8). Our data demonstrate that both TET2 and TET3 exert an instrumental role to regulate DNA demethylation of Zbtb7b to regulate the magnitude of Th-POK expression and to permit the optimal binding of GATA3 in the Zbtb7b locus and across the genome of CD4 SP cells.
A critical question is to understand how TET proteins are recruited at the DNA to regulate DNA demethylation of their target genes in distinct T cell subsets (11). It is well established that TET2 cannot bind to the DNA as it lacks a CXXC DNA binding domain (3). In addition, while TET3 maintains a CXXC DNA binding domain, the focal DNA demethylation that has been observed for instance in Tet2/3 DKO iNKT cells (11) as well as in TET deficient hematopoietic stem cells (9) demonstrates a cell specific, targeted action of TET proteins. The cell specificity of TET mediated DNA demethylation can be attributed to transcription factors that interact with TET proteins and direct them to specific loci across the genome. Indeed, various interactions among TET proteins and transcription factors have been described (83), for instance during the process of B cell differentiation (15) and during reprogramming (13). In addition, inhibition of interaction of TET2 with Wilm’s tumor gene (WT1) has been reported to promote tumorigenesis (12). However, our knowledge regarding factors that can mediate recruitment of TET proteins to their target genes during thymic development remains limited. Intriguingly, GATA3 has been shown to interact with TET2 in the estrogen receptor (ER) complex through use of rapid immunoprecipitation mass spectrometry of endogenous proteins and this interaction was critical for 5hmC deposition at ER target genes (84). Thus, an additional layer of regulating GATA3-mediated transcriptional activation in CD4 cells might be through loss of TET2 (and potentially TET3) mediated DNA demethylation. In other words, GATA3 might still bind at a locus but the optimal demethylation and subsequent activation of the gene might be compromised. A similar hypothesis has been postulated for GATA3 and TET2 cooperation in Th2 cells for inducing IL-4 expression (72). Further studies are required to elucidate which are the transcription factors that mediate recruitment of TET proteins in the DNA at distinct lineages during the process of T cell lineage specification and commitment.
Notably, loss of TET proteins and their capacity to confer epigenetic regulation by DNA demethylation reduces expression or impairs the binding and subsequent function of various transcription factors. This is distinct than what has been observed upon deletion of a single, specific transcription factor that results in shutting down the gene expression network that this given factor orchestrates. For instance, loss of Th-POK blocks CD4 maturation and redirects cells to become CD8 cells. Instead, our findings showcase how epigenetic regulators, like TET proteins, fine tune gene expression, and thus impact simultaneously various fundamental transcription factors affecting broadly gene expression. Moreover, in thymic Tet2/3 DKO CD4 SP cells we report upregulation of cytotoxic genes such as Eomes and Gzma that might be due to downregulation of Th-POK (69). A gene that was found to be downregulated both in Tet2/3 DKO CD4 SP cells and Tet2/3 DKO iNKT cells was Cd4 (Figure 1). Importantly, we have also established an instrumental role of Th-POK downregulation in the observed lineage skewing of Tet2/3 DKO iNKT cells (8). Specifically, we demonstrated that expressing Th-POK in Tet2/3 DKO iNKT cells is sufficient to suppress aberrant RORγt upregulation in these cells (8). In addition, we identify upregulation of genes such as Myb and Lmo2, which characterize earlier developmental stages (Figure 1). Aberrant expression of precursor genes could result in hyperproliferation and ultimately malignant transformation of blood cells (11).
Indeed, TET proteins act as tumor suppressors and safeguard cells from aberrant proliferation. Specifically, TET2 has been frequently reported to be mutated in hematological malignancies (85), including angioimmunoblastic T cell lymphoma (AITL) (86–88) and peripheral T cell lymphoma, non-otherwise specified (PTCL-NOS) (89). It has been suggested that TET2 mutations are an early event during the process of malignant transformation and confer proliferative advantage to the mutant cells (85, 89). Importantly, loss of TET proteins in various innate and adaptive immune populations compromises the process of maturation and establishment of cell fate, resulting in uncontrolled proliferation (11, 90). However, the mechanisms by which TET proteins safeguard controlled proliferation and protect from the rise of hematological malignancies and inflammatory diseases remain poorly understood. While loss of catalytic activity of TET proteins is strongly associated with hematopoietic stem cell hyperproliferation and myeloid malignancies (12, 46, 91), it has been recently suggested that the enzymatic activity of TET2 might be dispensable for its tumor suppressive role at least in some lymphoid malignancies (48) as well as in the context of inflammation (49).
In our previous study regarding the in vivo role of TET proteins in regulating iNKT cell lineage specification and expansion we established that TET3 catalytic activity was important for the NKT17 lineage skewing and we hypothesized that TET2 might exert additional, enzymatic-independent roles to control iNKT expansion (8). In the present study, to follow up on this important question, we utilized mice that express full length TET2 that has impaired capacity to bind iron, a critical cofactor, required for enzymatic activity and cytosine oxidization (Figure 4). The thymic differentiation in the Tet2CD Tet3 KO mice was comparable to the Tet2/3 DKO mice. We identified iNKT cell lineage skewing and expansion (Figure 5) as well as emergence of innate like CD8 SP cells (Figure 6). We also confirmed that Th-POK expression is affected by TET2 and TET3 in a TET2 dependent catalytic manner (Figure 7). Collectively, our data provide a causative link between the catalytic dependent role of TET proteins and the establishment of thymic T cell lineage specification.
An emerging question is to understand what is the physiological impact of the observed changes in the lineage specification that occurs in the thymus upon concomitant deletion of TET2 and TET3. For instance, mouse models that lack specifically TET2 in T cells exhibit defects in immune response against viral infection (92). Similarly, loss of TET2 in innate lymphoid cells results in less efficient immune response against bacterial infection (93). Moreover, a critical role for TET mediated DNA demethylation has been established for the stability and the optimal suppressive function of regulatory T cells (77–81, 94, 95). Thus, to pursue further functional analysis in our system, the challenge is to overcome the multiple immunological issues related to TET2/3 loss in T cells; such as aberrant iNKT cell development and expansion (8), emergence of CD8 innate like T cells (8) and the well-established instability of the regulatory T cell lineage (77) that collectively result in an aggressive disease that causes accelerated death of the Tet2/3 DKO mice between 7 and 8 weeks old (8, 77). Establishing new mouse models, to delete Tet genes at various developmental stages and at specific T cell subsets will shed light on the precise biological roles of TET2 and TET3 in immune response and blood cancer development.
Data availability statement
The datasets presented in this study can be found in online repositories. The names of the repository/repositories and accession number(s) can be found in the article/Supplementary Material. The datasets generated in this study have been deposited in the Gene Expression Omnibus (GEO) public repository: SuperSeries: GSE206450.
Ethics statement
All the experiments conducted in this study were compliant with the ethical regulations approved by the UNC Institutional Animal Core and Use Committee (IACUC) and the protocol 20-013.
Author contributions
TÄ analyzed all the genome-wide sequencing datasets, generated the related figures, interpreted data and wrote the genome wide data analysis methods section. DT performed CUT&RUN experiments, western blot and real-time PCR experiments, assisted in primary cell isolation and mouse colony management and analyzed data. MC, MS and YX designed and generated the Tet2CD mice. ASB provided the Tet2CD mice, critically read and commented on the manuscript. AT conceived and supervised the study, designed, performed and analyzed experiments, secured funding and wrote the manuscript with input from all the authors. All authors agree to the content of the manuscript. All authors contributed to the article and approved the submitted version.
Funding
This work was supported by NIH grant (R35-GM138289), Supplement R35-GM138289-02S1 from National Institute of General Medicinal Sciences (NIGMS) (to AT), and UNC Lineberger Compehensive Cancer Center Startup funds (to AT) and NIH grant 5-R01CA163834 (to ASB). AT is a recipient of an IBM Chancellor’s Career Development Award. A.S.B. is the recipient of the NIH grant 5-R01CA163834.
Acknowledgments
We wish to thank Ms. Kayla Harrison (UNC DCM Colony Management Core) for excellent mouse colony management. We also wish to acknowledge Ms. Janet Dow, Mr. Roman Bandy and Ms. Ayrianna Woody of the UNC Flow Cytometry Core for their expert help with FACS sorting. Research reported in this publication and related to FACS sorting was supported in part by the North Carolina Biotech Center Institutional Support Grant 2012-IDG-1006. We thank the UNC High Throughput Sequencing core (HTSF) for sequencing. The above cores affiliated to UNC Lineberger Comprehensive Cancer Center are supported in part by P30 CA016086 Cancer Center Core Support Grant to the UNC Lineberger Comprehensive Cancer Center. The UNC Animal Models Core, and in particular, the expertise of Dale Cowley, for creating the Tet2H1795R (Tet2CD) knock-in mice using the CRISPR/Cas9 system. We thank the Duke University School of Medicine for the use of Sequencing and Genomic Technologies Shared Resource, which provided sequencing services. We gratefully acknowledge Professor Anjana Rao (La Jolla Institute for Allergy and Immunology) for the kind gift of Tet3flx/flx CD4Cre mice. We thank the NIH tetramer core for generously providing aGalactosyl-Ceramide loaded mouse CD1d tetramers.
Conflict of interest
The authors declare that the research was conducted in the absence of any commercial or financial relationships that could be construed as a potential conflict of interest.
Publisher’s note
All claims expressed in this article are solely those of the authors and do not necessarily represent those of their affiliated organizations, or those of the publisher, the editors and the reviewers. Any product that may be evaluated in this article, or claim that may be made by its manufacturer, is not guaranteed or endorsed by the publisher.
Supplementary material
The Supplementary Material for this article can be found online at: https://www.frontiersin.org/articles/10.3389/fimmu.2022.940995/full#supplementary-material
Supplementary Figure 1 | Tet2 and Tet3 are upregulated during CD4 SP cell maturation and are targets of Th-POK. (A) Gene expression [from (Chopp et al., 2020)] of TET proteins in wild type (WT, in pink) mature CD4 SP cells and WT immature CD4 SP cells (in yellow). Genome browser snapshots of Th-POK binding [by Th-POK ChIP-seq, (Chopp et al., 2020)] across the loci of Tet genes: (B) Tet1, (C) Tet2 and (D) Tet3. The arrows indicate the direction of transcription. (E) Schematic representation of CD4 SP cell maturation. The lineage specifying transcription factor Th-POK drives the maturation of CD4 SP immature to mature CD4 SP cells. During the process Tet1, Tet2 and mainly Tet3 are upregulated.
Supplementary Figure 2 | Sorting strategy and purity assessment of control (wild type) and Tet2/3 DKO CD4 SP cells. CD24hi cells were depleted by magnetic bead isolation and untouched CD24low cells were stained for TCRbPERCPCy5.5, aGalCerCd1dPE, CD4AF488 and CD8APC. Dead cells were excluded using a fixable viability dye. Live cells aGalCerCd1d-TCRb+ CD8-CD4+ were sorted. Cells were evaluated for purity post sorting. The same strategy was applied for both control and Tet2/3 DKO CD4 SP cells.
Supplementary Figure 3 | RNA-seq data comparison of thymic CD4 SP cells. Dissimilarity matrix of RNA-seq datasets of thymic CD4 SP cells. 3 biological replicates (BR) of control (wild type, WT) CD4 SP and 2 BR of Tet2/3 DKO RNA-seq samples.
Supplementary Figure 4 | Reduced Gata3 expression in CD4 SP cells. (A) Graph depicting Gata3 gene expression in WT (gray) and Tet2/3 DKO (purple) CD4 SP cells (RNA-seq data, generated in this study). While no statistically significant difference was detected, there was a trend for reduced gene expression. (B) Representative histogram comparing the protein expression levels of GATA3 in wild type (gray) and Tet2/3 DKO (purple) CD4 SP cells evaluated by flow cytometry. (C) Median Fluorescence Intensity (MFI) of GATA3 expression in CD4 SP cells as evaluated in (B). Each dot represents a mouse. WT n=7 (in black), Tet2/3 DKO n=6 (in purple). For each genotype male and female mice were analyzed with comparable findings. 3 independent experiments were performed. ** (p=0.0076), unpaired t test. Horizontal lines indicate the mean (s.e.m.).
Supplementary Figure 5 | (A) Unprocessed western blots related to Figures 4D, 4E. (B) Unprocessed western blots related to Supplementary Data Figure 7A. The markers are indicated.
Supplementary Figure 6 | Phenotypic characterization of thymic development in Tet2CD mice. (A) Plot summarizing the total number of thymocytes in control wild type (n=5) and Tet2CD mice (n=5). (B) Representative flow cytometry plots assessing aGalactosylseramide (aGalCer) loaded CD1d tetramer binding and TCRb expression in thymocytes isolated from control and Tet2CD mice. The aGalCer-CD1d tetramer+ TCRb+ cells are iNKT cells. (C) Frequency of thymic iNKT, identified as described in (B), in control (shown in black) and Tet2CD mice (depicted in light blue). (D) Absolute numbers of thymic iNKT cells in control (in black) and Tet2CD mice. (E) Representative flow cytometry plots evaluating CD4 and CD8 expression in the surface of thymocytes (excluding iNKT cells) isolated from control (wild type), and Tet2CD mice. (F) Frequency of thymic subsets identified based on CD4 and CD8 expression, as described in (E) in control (in black) and Tet2CD mice. Note that in the plot depicting frequency of DP cells the y axis shows values ranging from 80-86. 3 independent experiments were performed. Each dot represents a mouse.WT n=5 (in black), Tet2CD n=5 (in light blue). Horizontal lines indicate the mean (s.e.m.). No statistically significant difference was identified by unpaired t test.
Supplementary Figure 7 | Assessing TET2 expression in Tet2CDTet3 KO CD4 SP cells. (A) Western blot depicting TET2 expression in extracts from sorted CD4 SP cells isolated from control (WT), and Tet2CDTet3 KO mice. GAPDH was used as loading control. Data from one representative experiment out of 4 are shown. (B) Quantification of western blots showing expression of TET2. The number of mice evaluated for each genotype is shown in parenthesis. Control (WT) n=4 (2 male and 2 female), Tet2CDTet3 KO n=4 (2 male and 2 female).
References
1. Tahiliani M, Koh KP, Shen Y, Pastor WA, Bandukwala H, Brudno Y, et al. Conversion of 5-methylcytosine to 5-hydroxymethylcytosine in mammalian DNA by MLL partner TET1. Science (2009) 324:930–5. doi: 10.1126/science.1170116
2. Ito S, Shen L, Dai Q, Wu SC, Collins LB, Swenberg JA, et al. Tet proteins can convert 5-methylcytosine to 5-formylcytosine and 5-carboxylcytosine. Science (2011) 333:1300–3. doi: 10.1126/science.1210597
3. Pastor WA, Aravind L, Rao A. TETonic shift: biological roles of TET proteins in DNA demethylation and transcription. Nat Rev Mol Cell Biol (2013) 14:341–56. doi: 10.1038/nrm3589
4. Iurlaro M, Ficz G, Oxley D, Raiber EA, Bachman M, Booth MJ, et al. A screen for hydroxymethylcytosine and formylcytosine binding proteins suggests functions in transcription and chromatin regulation. Genome Biol (2013) 14:R119. doi: 10.1186/gb-2013-14-10-r119
5. Bachman M, Uribe-Lewis S, Yang X, Williams M, Murrell A, Balasubramanian S. 5-hydroxymethylcytosine is a predominantly stable DNA modification. Nat Chem (2014) 6:1049–55. doi: 10.1038/nchem.2064
6. Bachman M, Uribe-Lewis S, Yang X, Burgess HE, Iurlaro M, Reik W, et al. 5-formylcytosine can be a stable DNA modification in mammals. Nat Chem Biol (2015) 11:555–. doi: 10.1038/nchembio.1848
7. Spruijt CG, Gnerlich F, Smits AH, Pfaffeneder T, Jansen PW, Bauer C, et al. Dynamic readers for 5-(hydroxy)methylcytosine and its oxidized derivatives. Cell (2013) 152:1146–59. doi: 10.1016/j.cell.2013.02.004
8. Tsagaratou A, Gonzalez-Avalos E, Rautio S, Scott-Browne JP, Togher S, Pastor WA, et al. TET proteins regulate the lineage specification and TCR-mediated expansion of iNKT cells. Nat Immunol (2017) 18:45–53. doi: 10.1038/ni.3630
9. An J, Gonzalez-Avalos E, Chawla A, Jeong M, Lopez-Moyado IF, Li W, et al. Acute loss of TET function results in aggressive myeloid cancer in mice. Nat Commun (2015) 6:10071. doi: 10.1038/ncomms10071
10. Cimmino L, Dawlaty MM, Ndiaye-Lobry D, Yap YS, Bakogianni S, Yu Y, et al. TET1 is a tumor suppressor of hematopoietic malignancy. Nat Immunol (2015) 16:653–62. doi: 10.1038/ni.3148
11. Tsagaratou A. Deciphering the multifaceted roles of TET proteins in T-cell lineage specification and malignant transformation. Immunol Rev (2021) 300:22–36. doi: 10.1111/imr.12940
12. Wang Y, Xiao M, Chen X, Chen L, Xu Y, Lv L, et al. WT1 recruits TET2 to regulate its target gene expression and suppress leukemia cell proliferation. Mol Cell (2015) 57:662–73. doi: 10.1016/j.molcel.2014.12.023
13. Sardina JL, Collombet S, Tian TV, Gomez A, Di Stefano B, Berenguer C, et al. Transcription factors drive Tet2-mediated enhancer demethylation to reprogram cell fate. Cell Stem Cell (2018) 23:905–6. doi: 10.1016/j.stem.2018.11.001
14. Lio CJ, Shukla V, Samaniego-Castruita D, Gonzalez-Avalos E, Chakraborty A, Yue X, et al. TET enzymes augment activation-induced deaminase (AID) expression via 5-hydroxymethylcytosine modifications at the aicda superenhancer. Sci Immunol (2019) 4:1–14. doi: 10.1126/sciimmunol.aau7523
15. Lio CW, zhang J, Gonzalez-Avalos E, Hogan PG, Chang X, Rao A. Tet2 and Tet3 cooperate with b-lineage transcription factors to regulate DNA modification and chromatin accessibility. Elife (2016) 5:1–26. doi: 10.7554/eLife.18290
16. Tsagaratou A, Aijo T, Lio CW, Yue X, Huang Y, Jacobsen SE, et al. Dissecting the dynamic changes of 5-hydroxymethylcytosine in T-cell development and differentiation. Proc Natl Acad Sci USA (2014) 111:E3306–15. doi: 10.1073/pnas.1412327111
17. Ichiyama K, Chen T, Wang X, Yan X, Kim BS, Tanaka S, et al. The methylcytosine dioxygenase Tet2 promotes DNA demethylation and activation of cytokine gene expression in T cells. Immunity (2015) 42:613–26. doi: 10.1016/j.immuni.2015.03.005
18. Issuree PD, Day K, Au C, Raviram R, Zappile P, Skok JA, et al. Stage-specific epigenetic regulation of CD4 expression by coordinated enhancer elements during T cell development. Nat Commun (2018) 9:3594. doi: 10.1038/s41467-018-05834-w
19. Singer A, Adoro S, Park JH. Lineage fate and intense debate: myths, models and mechanisms of CD4- versus CD8-lineage choice. Nat Rev Immunol (2008) 8:788–801. doi: 10.1038/nri2416
20. Carpenter AC, Bosselut R. Decision checkpoints in the thymus. Nat Immunol (2010) 11:666–73. doi: 10.1038/ni.1887
21. Germain RN. T-Cell development and the CD4-CD8 lineage decision. Nat Rev Immunol (2002) 2:309–22. doi: 10.1038/nri798
22. Pai SY, Truitt ML, Ting CN, Leiden JM, Glimcher LH, Ho IC. Critical roles for transcription factor GATA-3 in thymocyte development. Immunity (2003) 19:863–75. doi: 10.1016/S1074-7613(03)00328-5
23. Hernandez-Hoyos G, Anderson MK, Wang C, Rothenberg EV, Alberola-Ila J. GATA-3 expression is controlled by TCR signals and regulates CD4/CD8 differentiation. Immunity (2003) 19:83–94. doi: 10.1016/S1074-7613(03)00176-6
24. Wang L, Wildt KF, Zhu J, Zhang X, Feigenbaum L, Tessarollo L, et al. Distinct functions for the transcription factors GATA-3 and ThPOK during intrathymic differentiation of CD4(+) T cells. Nat Immunol (2008) 9:1122–30. doi: 10.1038/ni.1647
25. He X, He X, Dave VP, Zhang Y, Hua X, Nicolas E, et al. The zinc finger transcription factor Th-POK regulates CD4 versus CD8 T-cell lineage commitment. Nature (2005) 433:826–33. doi: 10.1038/nature03338
26. Sun G, Liu X, Mercado P, Jenkinson SR, Kypriotou M, Feigenbaum L, et al. The zinc finger protein cKrox directs CD4 lineage differentiation during intrathymic T cell positive selection. Nat Immunol (2005) 6:373–81. doi: 10.1038/ni1183
27. Chopp LB, Gopalan V, Ciucci T, Ruchinskas A, Rae Z, Lagarde M, et al. An integrated epigenomic and transcriptomic map of mouse and human alphabeta T cell development. Immunity (2020) 53:1182–201.e8. doi: 10.1016/j.immuni.2020.10.024
28. Vahedi G., A, C. P., Hand TW, Laurence A, Kanno Y, O'shea JJ, Hirahara K. Helper T-cell identity and evolution of differential transcriptomes and epigenomes. Immunol Rev (2013) 252:24–40. doi: 10.1111/imr.12037
29. O'Shea JJ, Paul WE. Mechanisms underlying lineage commitment and plasticity of helper CD4+ T cells. Science (2010) 327:1098–102. doi: 10.1126/science.1178334
30. Bendelac A, Savage PB, Teyton L. The biology of NKT cells. Annu Rev Immunol (2007) 25:297–336. doi: 10.1146/annurev.immunol.25.022106.141711
31. Kovalovsky D, Uche OU, Eladad S, Hobbs RM, Yi W, Alonzo E, et al. The BTB-zinc finger transcriptional regulator PLZF controls the development of invariant natural killer T cell effector functions. Nat Immunol (2008) 9:1055–64. doi: 10.1038/ni.1641
32. Savage AK, Constantinides MG, Han J, Picard D, Martin E, Li B, et al. The transcription factor PLZF directs the effector program of the NKT cell lineage. Immunity (2008) 29:391–403. doi: 10.1016/j.immuni.2008.07.011
33. Engel I, Kronenberg M. Making memory at birth: understanding the differentiation of natural killer T cells. Curr Opin Immunol (2012) 24:184–90. doi: 10.1016/j.coi.2012.01.012
34. Wang H, Hogquist KA. How lipid-specific T cells become effectors: The differentiation of iNKT subsets. Front Immunol (2018) 9:1450. doi: 10.3389/fimmu.2018.01450
35. Lee YJ, Holzapfel KL, Zhu J, Jameson SC, Hogquist KA. Steady-state production of IL-4 modulates immunity in mouse strains and is determined by lineage diversity of iNKT cells. Nat Immunol (2013) 14:1146–54. doi: 10.1038/ni.2731
36. Crosby CM, Kronenberg M. Tissue-specific functions of invariant natural killer T cells. Nat Rev Immunol (2018) 18:559–74. doi: 10.1038/s41577-018-0034-2
37. Hosokawa H, Rothenberg EV. How transcription factors drive choice of the T cell fate. Nat Rev Immunol (2021) 21:162–76. doi: 10.1038/s41577-020-00426-6
38. Vacchio MS, Bosselut R. What happens in the thymus does not stay in the thymus: How T cells recycle the CD4+-CD8+ lineage commitment transcriptional circuitry to control their function. J Immunol (2016) 196:4848–56. doi: 10.4049/jimmunol.1600415
39. Spinner CA, Lazarevic V. Transcriptional regulation of adaptive and innate lymphoid lineage specification. Immunol Rev (2021) 300:65–81. doi: 10.1111/imr.12935
40. Constantinides MG, Bendelac A. Transcriptional regulation of the NKT cell lineage. Curr Opin Immunol (2013) 25:161–7. doi: 10.1016/j.coi.2013.01.003
41. Tsagaratou A. Unveiling the regulation of NKT17 cell differentiation and function. Mol Immunol (2019) 105:55–61. doi: 10.1016/j.molimm.2018.11.013
42. Verykokakis M, Kee BL. Transcriptional and epigenetic regulation of innate-like T lymphocyte development. Curr Opin Immunol (2018) 51:39–45. doi: 10.1016/j.coi.2018.01.006
43. Shapiro MJ, Shapiro VS. Chromatin-modifying enzymes in T cell development. Annu Rev Immunol (2020) 38:397–419. doi: 10.1146/annurev-immunol-092719-082622
44. Tsagaratou A. TET mediated epigenetic regulation of iNKT cell lineage fate choice and function. Mol Immunol (2018) 101:564–73. doi: 10.1016/j.molimm.2018.08.020
45. Waldman AD, Fritz JM, Lenardo MJ. A guide to cancer immunotherapy: from T cell basic science to clinical practice. Nat Rev Immunol (2020) 20:651–68. doi: 10.1038/s41577-020-0306-5
46. Ko M, Huang Y, Jankowska AM, Pape UJ, Tahiliani M, Bandukwala HS, et al. Impaired hydroxylation of 5-methylcytosine in myeloid cancers with mutant TET2. Nature (2010) 468:839–43. doi: 10.1038/nature09586
47. Tsagaratou A, Rao A. TET proteins and 5-methylcytosine oxidation in the immune system. Cold Spring Harb Symp Quant Biol (2013) 78:1–10. doi: 10.1101/sqb.2013.78.020248
48. Ito K, Lee J, Chrysanthou S, Zhao Y, Josephs K, Sato H, et al. Non-catalytic roles of Tet2 are essential to regulate hematopoietic stem and progenitor cell homeostasis. Cell Rep (2019) 28:, 2480–2490.e4. doi: 10.1016/j.celrep.2019.07.094
49. Zhang Q, Zhao K, Shen Q, Han Y, Gu Y, Li X, et al. Tet2 is required to resolve inflammation by recruiting Hdac2 to specifically repress IL-6. Nature (2015) 525:389–93. doi: 10.1038/nature15252
50. Ko M, An J, Pastor WA, Koralov SB, Rajewsky K, Rao A. TET proteins and 5-methylcytosine oxidation in hematological cancers. Immunol Rev (2015) 263:6–21. doi: 10.1111/imr.12239
51. Chen LL, Morcelle C, Cheng ZL, Chen X, Xu Y, Gao Y, et al. Itaconate inhibits TET DNA dioxygenases to dampen inflammatory responses. Nat Cell Biol (2022) 24:353–63. doi: 10.1038/s41556-022-00853-8
52. Pritykin Y, van der Veeken J, Pine AR, Zhong Y, Sahin M, Mazutis L, et al. A unified atlas of CD8 T cell dysfunctional states in cancer and infection. Mol Cell (2021) 81:2477–93.e10. doi: 10.1016/j.molcel.2021.03.045
53. Liu N, Hargreaves VV, Zhu Q, Kurland JV, Hong J, Kim W, et al. Direct promoter repression by BCL11A controls the fetal to adult hemoglobin switch. Cell (2018) 173:430–42.e17. doi: 10.1016/j.cell.2018.03.016
54. Liu N, Xu S, Yao Q, Zhu Q, Kai Y, Hsu JY, et al. Transcription factor competition at the gamma-globin promoters controls hemoglobin switching. Nat Genet (2021) 53:511–20. doi: 10.1038/s41588-021-00798-y
55. Chen S, Zhou Y, Chen Y, Gu J. Fastp: an ultra-fast all-in-one FASTQ preprocessor. Bioinformatics (2018) 34:i884–90. doi: 10.1093/bioinformatics/bty560
56. Dobin A, Davis CA, Schlesinger F, Drenkow J, Zaleski C, Jha S, et al. STAR: ultrafast universal RNA-seq aligner. Bioinformatics (2013) 29:15–21. doi: 10.1093/bioinformatics/bts635
57. Love MI, Huber W, Anders S. Moderated estimation of fold change and dispersion for RNA-seq data with DESeq2. Genome Biol (2014) 15:550. doi: 10.1186/s13059-014-0550-8
58. Langmead B, Salzberg SL. Fast gapped-read alignment with bowtie 2. Nat Methods (2012) 9:357–9. doi: 10.1038/nmeth.1923
59. Heinz S, Benner C, Spann N, Bertolino E, Lin YC, Laslo P, et al. Simple combinations of lineage-determining transcription factors prime cis-regulatory elements required for macrophage and b cell identities. Mol Cell (2010) 38:576–89. doi: 10.1016/j.molcel.2010.05.004
60. Krueger F, Andrews SR. Bismark: a flexible aligner and methylation caller for bisulfite-seq applications. Bioinformatics (2011) 27:1571–2. doi: 10.1093/bioinformatics/btr167
61. Li H, Handsaker B, Wysoker A, Fennell T, Ruan J, Homer N, et al. The sequence Alignment/Map format and SAMtools. Bioinformatics (2009) 25:2078–9. doi: 10.1093/bioinformatics/btp352
62. Setoguchi R, Tachibana M, Naoe Y, Muroi S, Akiyama K, Tezuka C, et al. Repression of the transcription factor Th-POK by runx complexes in cytotoxic T cell development. Science (2008) 319:822–5. doi: 10.1126/science.1151844
63. Picelli S, Faridani OR, Bjorklund AK, Winberg G, Sagasser S, Sandberg R. Full-length RNA-seq from single cells using smart-seq2. Nat Protoc (2014) 9:171–81. doi: 10.1038/nprot.2014.006
64. Day K, Song J, Absher D. Targeted sequencing of large genomic regions with CATCH-seq. PloS One (2014) 9:e111756. doi: 10.1371/journal.pone.0111756
65. He X, Park K, Wang H, He X, Zhang Y, Hua X, et al. CD4-CD8 lineage commitment is regulated by a silencer element at the ThPOK transcription-factor locus. Immunity (2008) 28:346–58. doi: 10.1016/j.immuni.2008.02.006
66. Muroi S, Tanaka H, Miyamoto C, Taniuchi I. Cutting edge: fine-tuning of thpok gene activation by an enhancer in close proximity to its own silencer. J Immunol (2013) 190:1397–401. doi: 10.4049/jimmunol.1203006
67. Collins A, Littman DR, Taniuchi I. RUNX proteins in transcription factor networks that regulate T-cell lineage choice. Nat Rev Immunol (2009) 9:106–15. doi: 10.1038/nri2489
68. Buenrostro JD, Giresi PG, Zaba LC, Chang HY, Greenleaf WJ. Transposition of native chromatin for fast and sensitive epigenomic profiling of open chromatin, DNA-binding proteins and nucleosome position. Nat Methods (2013) 10:1213–8. doi: 10.1038/nmeth.2688
69. Muroi S, Naoe Y, Miyamoto C, Akiyama K, Ikawa T, Masuda K, et al. Cascading suppression of transcriptional silencers by ThPOK seals helper T cell fate. Nat Immunol (2008) 9:1113–21. doi: 10.1038/ni.1650
70. Schubeler D. Function and information content of DNA methylation. Nature (2015) 517:321–6. doi: 10.1038/nature14192
71. Skene PJ, Henikoff S. An efficient targeted nuclease strategy for high-resolution mapping of DNA binding sites. Elife (2017) 6:1–35. doi: 10.7554/eLife.21856
72. Onodera A, Gonzalez-Avalos E, Lio CJ, Georges RO, Bellacosa A, Nakayama T, et al. Roles of TET and TDG in DNA demethylation in proliferating and non-proliferating immune cells. Genome Biol (2021) 22:186. doi: 10.1186/s13059-021-02384-1
73. Montagner S, Leoni C, Emming S, Della Chiara G, Balestrieri C, Barozzi I, et al. TET2 regulates mast cell differentiation and proliferation through catalytic and non-catalytic activities. Cell Rep (2016) 15:1566–79. doi: 10.1016/j.celrep.2016.04.044
74. Verykokakis M, Boos MD, Bendelac A, Kee BL. SAP protein-dependent natural killer T-like cells regulate the development of CD8(+) T cells with innate lymphocyte characteristics. Immunity (2010) 33:203–15. doi: 10.1016/j.immuni.2010.07.013
75. Atherly LO, Lucas JA, Felices M, Yin CC, Reiner SL, Berg LJ. The tec family tyrosine kinases itk and rlk regulate the development of conventional CD8+ T cells. Immunity (2006) 25:79–91. doi: 10.1016/j.immuni.2006.05.012
76. Broussard C, Fleischacker C, Horai R, Chetana M, Venegas AM, Sharp LL, et al. Altered development of CD8+ T cell lineages in mice deficient for the tec kinases itk and rlk. Immunity (2006) 25:93–104. doi: 10.1016/j.immuni.2006.05.011
77. Yue X, Trifari S, Aijo T, Tsagaratou A, Pastor WA, Zepeda-Martinez JA, et al. Control of Foxp3 stability through modulation of TET activity. J Exp Med (2016) 213:377–97. doi: 10.1084/jem.20151438
78. Nair VS, Song MH, Ko M, Oh KI. DNA Demethylation of the Foxp3 enhancer is maintained through modulation of ten-Eleven-Translocation and DNA methyltransferases. Mol Cells (2016) 39:888–97. doi: 10.14348/molcells.2016.0276
79. Yang R, Qu C, Zhou Y, Konkel JE, Shi S, Liu Y, et al. Hydrogen sulfide promotes Tet1- and Tet2-mediated Foxp3 demethylation to drive regulatory T cell differentiation and maintain immune homeostasis. Immunity (2015) 43:251–63. doi: 10.1016/j.immuni.2015.07.017
80. Yue X, Lio CJ, Samaniego-Castruita D, Li X, Rao A. Loss of TET2 and TET3 in regulatory T cells unleashes effector function. Nat Commun (2019) 10:2011. doi: 10.1038/s41467-019-09541-y
81. Nakatsukasa H, Oda M, Yin J, Chikuma S, Ito M, Koga-Iizuka M, et al. Loss of TET proteins in regulatory T cells promotes abnormal proliferation, Foxp3 destabilization and IL-17 expression. Int Immunol (2019) 31:335–47. doi: 10.1093/intimm/dxz008
82. Teghanemt A, Pulipati P, Misel-Wuchter K, Day K, Yorek MS, Yi R, et al. CD4 expression in effector T cells depends on DNA demethylation over a developmentally established stimulus-responsive element. Nat Commun (2022) 13:1477. doi: 10.1038/s41467-022-28914-4
83. Lazarenkov A, Sardina JL. Dissecting TET2 regulatory networks in blood differentiation and cancer. Cancers (Basel) (2022) 14:1–18. doi: 10.3390/cancers14030830
84. Broome R, Chernukhin I, Jamieson S, Kishore K, Papachristou EK, Mao SQ, et al. TET2 is a component of the estrogen receptor complex and controls 5mC to 5hmC conversion at estrogen receptor cis-regulatory regions. Cell Rep (2021) 34:108776. doi: 10.1016/j.celrep.2021.108776
85. Tsiouplis NJ, Bailey DW, Chiou LF, Wissink FJ, Tsagaratou A. TET-mediated epigenetic regulation in immune cell development and disease. Front Cell Dev Biol (2020) 8:623948. doi: 10.3389/fcell.2020.623948
86. Sakata-Yanagimoto M, Enami T, Yoshida K, Shiraishi Y, Ishii R, Miyake Y, et al. Somatic RHOA mutation in angioimmunoblastic T cell lymphoma. Nat Genet (2014) 46:171–5. doi: 10.1038/ng.2872
87. Quivoron C, Couronne L, Della Valle V, Lopez CK, Plo I, Wagner-Ballon O, et al. TET2 inactivation results in pleiotropic hematopoietic abnormalities in mouse and is a recurrent event during human lymphomagenesis. Cancer Cell (2011) 20:25–38. doi: 10.1016/j.ccr.2011.06.003
88. Palomero T, Couronne L, Khiabanian H, Kim MY, Ambesi-Impiombato A, Perez-Garcia A, et al. Recurrent mutations in epigenetic regulators, RHOA and FYN kinase in peripheral T cell lymphomas. Nat Genet (2014) 46:166–70. doi: 10.1038/ng.2873
89. Cortes JR, Palomero T. Biology and molecular pathogenesis of mature T-cell lymphomas. Cold Spring Harb Perspect Med (2020) 11(5):a035402. doi: 10.1101/cshperspect.a035402
90. Lio CJ, Rao A. TET enzymes and 5hmC in adaptive and innate immune systems. Front Immunol (2019) 10:210. doi: 10.3389/fimmu.2019.00210
91. Tulstrup M, Soerensen M, Hansen JW, Gillberg L, Needhamsen M, Kaastrup K, et al. TET2 mutations are associated with hypermethylation at key regulatory enhancers in normal and malignant hematopoiesis. Nat Commun (2021) 12:6061. doi: 10.1038/s41467-021-26093-2
92. Carty SA, Gohil M, Banks LB, Cotton RM, Johnson ME, Stelekati E, et al. The loss of TET2 promotes CD8(+) T cell memory differentiation. J Immunol (2018) 200:82–91. doi: 10.4049/jimmunol.1700559
93. Peng V, Xing X, Bando JK, Trsan T, DI Luccia B, Collins PL, et al. Whole-genome profiling of DNA methylation and hydroxymethylation identifies distinct regulatory programs among innate lymphocytes. Nat Immunol (2022) 23:619–31. doi: 10.1038/s41590-022-01164-8
94. Tsagaratou A, Lio CJ, Yue X, Rao A. TET methylcytosine oxidases in T cell and b cell development and function. Front Immunol (2017) 8:220. doi: 10.3389/fimmu.2017.00220
Keywords: TET proteins, Th-POK, DNA Methylation, 5hmC, lineage specification
Citation: Äijö T, Theofilatos D, Cheng M, Smith MD, Xiong Y, Baldwin AS and Tsagaratou A (2022) TET proteins regulate T cell and iNKT cell lineage specification in a TET2 catalytic dependent manner. Front. Immunol. 13:940995. doi: 10.3389/fimmu.2022.940995
Received: 10 May 2022; Accepted: 07 July 2022;
Published: 05 August 2022.
Edited by:
Mihalis Verykokakis, Alexander Fleming Biomedical Sciences Research Center, GreeceReviewed by:
Shannon Carty, University of Michigan, United StatesMartha Jordan, University of Pennsylvania, United States
Copyright © 2022 Äijö, Theofilatos, Cheng, Smith, Xiong, Baldwin and Tsagaratou. This is an open-access article distributed under the terms of the Creative Commons Attribution License (CC BY). The use, distribution or reproduction in other forums is permitted, provided the original author(s) and the copyright owner(s) are credited and that the original publication in this journal is cited, in accordance with accepted academic practice. No use, distribution or reproduction is permitted which does not comply with these terms.
*Correspondence: Ageliki Tsagaratou, YWdlbGlraV90c2FnYXJhdG91QG1lZC51bmMuZWR1
†Present address: Yue Xiong, Cullgen, San Diego, CA, United States