 Bart Van Wijmeersch1,2,3*
 Hans-Peter Hartung4,5,6
 Patrick Vermersch7
 Maura Pugliatti8,9
 Carlo Pozzilli10
 Nikolaos Grigoriadis11
 Mona Alkhawajah12
 Laura Airas13Ralf Linker14
 Celia Oreja-Guevara15,16
- 1Universitair Multiple Sclerosis (MS) Centrum, Hasselt-Pelt, Belgium
- 2Noorderhart, Revalidatie & Multiple Sclerosis (MS), Pelt, Belgium
- 3REVAL & BIOMED, Hasselt University, Hasselt, Belgium
- 4Department of Neurology, Medical Faculty, Heinrich-Heine-University Düsseldorf, Düsseldorf, Germany
- 5Brain and Mind Center, University of Sydney, Sydney, NSW, Australia
- 6Department of Neurology, Palacky University Olomouc, Olomouc, Czechia
- 7University Lille, Inserm U1172 LilNCog, Centre Hospitalier Universitaire (CHU) Lille, Fédératif Hospitalo-Universitaire (FHU) Precise, Lille, France
- 8Department of Neuroscience and Rehabilitation, University of Ferrara, Ferrara, Italy
- 9Unit of Clinical Neurology, San Anna University Hospital, Ferrara, Italy
- 10Department of Human Neuroscience, Sapienza University, Rome, Italy
- 11B’ Department of Neurology, Aristotle University of Thessaloniki, Thessaloniki, Greece
- 12Neuroscience Center, King Faisal Specialist Hospital and Research Center, Riyadh, Saudi Arabia
- 13Turku University Hospital and University of Turku, Turku, Finland
- 14Department of Neurology, University Hospital Regensburg, Regensburg, Germany
- 15Department of Neurology, Hospital Clínico San Carlos, Instituto de Investigación Sanitaria del Hospital Cliínico San Carlos (IDISSC), Madrid, Spain
- 16Department of Medicine, Faculty of Medicine, Universidad Complutense de Madrid, Madrid, Spain
The clinical course of multiple sclerosis (MS) is highly variable among patients, thus creating important challenges for the neurologist to appropriately treat and monitor patient progress. Despite some patients having apparently similar symptom severity at MS disease onset, their prognoses may differ greatly. To this end, we believe that a proactive disposition on the part of the neurologist to identify prognostic “red flags” early in the disease course can lead to much better long-term outcomes for the patient in terms of reduced disability and improved quality of life. Here, we present a prognosis tool in the form of a checklist of clinical, imaging and biomarker parameters which, based on consensus in the literature and on our own clinical experiences, we have established to be associated with poorer or improved clinical outcomes. The neurologist is encouraged to use this tool to identify the presence or absence of specific variables in individual patients at disease onset and thereby implement sufficiently effective treatment strategies that appropriately address the likely prognosis for each patient.
Introduction
Multiple sclerosis is a highly heterogeneous disease of the central nervous system (CNS) that affects over 2.8 million people worldwide (1). The disease course can vary markedly, with overt clinical and imaging activity (relapses, fatigue, cognitive impairment, brain/spinal cord lesions, etc.) seen in some people with MS compared to a relatively benign course in others. While MS neurologists have at their disposal a growing list of disease-modifying therapies (DMTs) with different modes of action, efficacies, routes of administration, and concomitant safety characteristics, treatment of the MS patient does not follow a one-size-fits-all approach.
When seeing a person with relapsing-remitting MS (RRMS) for the first time, the MS neurologist must address a fundamental question: “What is the nature of the disease activity and likely prognosis of the person with MS before me?” As the course of action taken by the neurologist at this point will likely prove pivotal to the long-term outcomes of this patient, the challenge here is for correct decisions to be taken concerning the DMT to be used and the treatment regimen (escalation versus induction) to be followed so that the best possible result for the patient is achieved. Local prescribing guidelines usually reserve higher efficacy DMTs for patients who have failed first-line treatments or who have ‘high disease activity’ as indicated by clinical (relapses) or imaging [magnetic resonance imaging (MRI) lesion activity] features. However, we propose that a much more proactive approach on the part of the neurologist is needed if patients’ long-term needs are to be fully addressed from the outset and if a level of care is to be provided that is over and above that of simply administering DMTs in order of efficacy as per local guidelines. Herein lies the difficulty for the busy neurologist, who might see hundreds of patients every month, to be fully cognizant of each patient’s treatment needs.
We propose that the correct approach to treating persons with MS is according to each person’s prognosis, and not solely on the basis of ‘clinical or imaging features’ at the initial MS diagnosis. A patient with a poor prognosis may not necessarily have ‘highly active disease’ but may exhibit numerous clinical disease characteristics that have been shown to be associated with poor long-term outcomes and indicating the need for a more effective treatment strategy to be implemented. Excellent reviews have been published outlining the scientific basis for the prognostic value of many clinical, imaging, biomarker, and related parameters in MS patients [see e.g (2).]. In the present paper, we attempt to integrate this information into a compact ‘prognosis tool,’ drawing as well on our own years of experience treating MS patients. Our objective is to provide neurologists with a practical ‘checklist’ guide to establishing the likely prognosis of patients based primarily on baseline clinical parameters that can also be reassessed at periodic follow-up visits. Though not an all-encompassing, scientifically validated tool, most of the items in the checklist can be assessed in a hospital/clinical setting and do not require complex imaging or advanced analytical techniques. Importantly, the guide will allow neurologists to identify ‘red flag’ parameters in the MS patient profile that are related to poorer long-term prognosis. The presence in a patient’s profile of any parameters indicating poor prognosis should be a warning sign to the neurologist that close attention needs to be paid to this patient and that treatment strategies – escalation from first- to second- and later-lines versus the immediate use of high efficacy induction therapies – require careful consideration and implementation in a timely manner. It must be emphasized that the decision to treat with high-efficacy DMTs should be based on patients with poor prognosis and on patients with active disease.
Methodology
The concepts and recommendations presented here by the authors were developed over the course of several meetings held by a panel of experts belonging to the ParadigMS Foundation, a private, non-profit entity whose primary endeavour is to provide educational materials to the MS medical community. Consecutive iterations of the prognosis tool were reviewed and revised until the present version was arrived at.
This practical guideline was developed by first considering objectives from the points of view of the neurologist and the patient, and then defining the most relevant and easily measurable parameters that impact on and signify prognosis.
Structure of the prognosis tool
Section I: The setting of objectives: Finding common ground between patients’ needs and neurologists’ treatment goals
The assumption here is that the patient sitting before the neurologist has a confirmed diagnosis of MS according to the Lublin classification (3). From this point onwards, every patient will likely have a different disease course and therefore a different prognosis. Based on the initial features of the disease, it is important for both the patient and the neurologist to clarify their expectations of the treatment approach to be followed. In this way, the treatment decision taken would need to reflect a common understanding of the objectives held by patient and neurologist; it is highly likely that these objectives will be different if the clinical reality held by the neurologist and the potentially idealistic notions of the patient are compared. For example, a certain DMT may provide symptom relief and improved quality of life, which would be highly desirable outcomes for the patient, and yet the presence of brain lesion activity on MRI scans may require a stronger DMT in the opinion of the neurologist, but one that has more pronounced side effects. For this reason, the MS patient and neurologist need to reach common ground concerning objectives that are acceptable to both.
Aside from the patient’s perspective, we believe that an appropriate starting objective for the neurologist prior to treatment initiation is NEDA (No Evidence of Disease Activity)-3 at 2 years. This is defined as no relapse activity, no new MRI lesions, and no disability progression after two years of treatment. Rotstein et al. (2015) (4) showed that NEDA-3 at 2 years had a positive predictive value of 78.3% for no progression (change in Expanded Disability Status Scale (EDSS) score ≤0.5) at 7 years. If the patient’s prognosis prior to treatment initiation on a certain DMT makes this objective seem unrealistic, then consideration should be given to starting the patient on a stronger therapy. Each follow-up visit made by the patient can be seen as an opportunity to reassess the patient’s disease status and determine if the treatment is working satisfactorily.
Section II: Defining parameters that impact on prognosis. Which ‘red flags’ must be paid attention to, and what parameters are included in the prognosis tool?
The achievement of objectives and justification of the treatment decision are highly dependent on the patient’s initial prognosis. It would be futile to start a patient on a low-efficacy DMT if the initial clinical profile suggests a poor prognosis. To this end, the patient’s initial prognosis needs to be well established.
Our prognosis tool consists of parameters categorised into five key areas: Demographic, Clinical, MRI, Biomarkers, and Evoked Potentials (EPs) /Optical Coherence Tomography (OCT). Some of these parameters have binary outcomes (two possible options to choose from), whereas others have ranges over which the prognostic weight can be distributed over several values.
Demographic factors impacting on prognosis
Responses to this section in the prognosis tool can be viewed in Table 1 (Section A). A PDF version of the table can be downloaded from the following website: https://paradigms.foundation/prognosis/
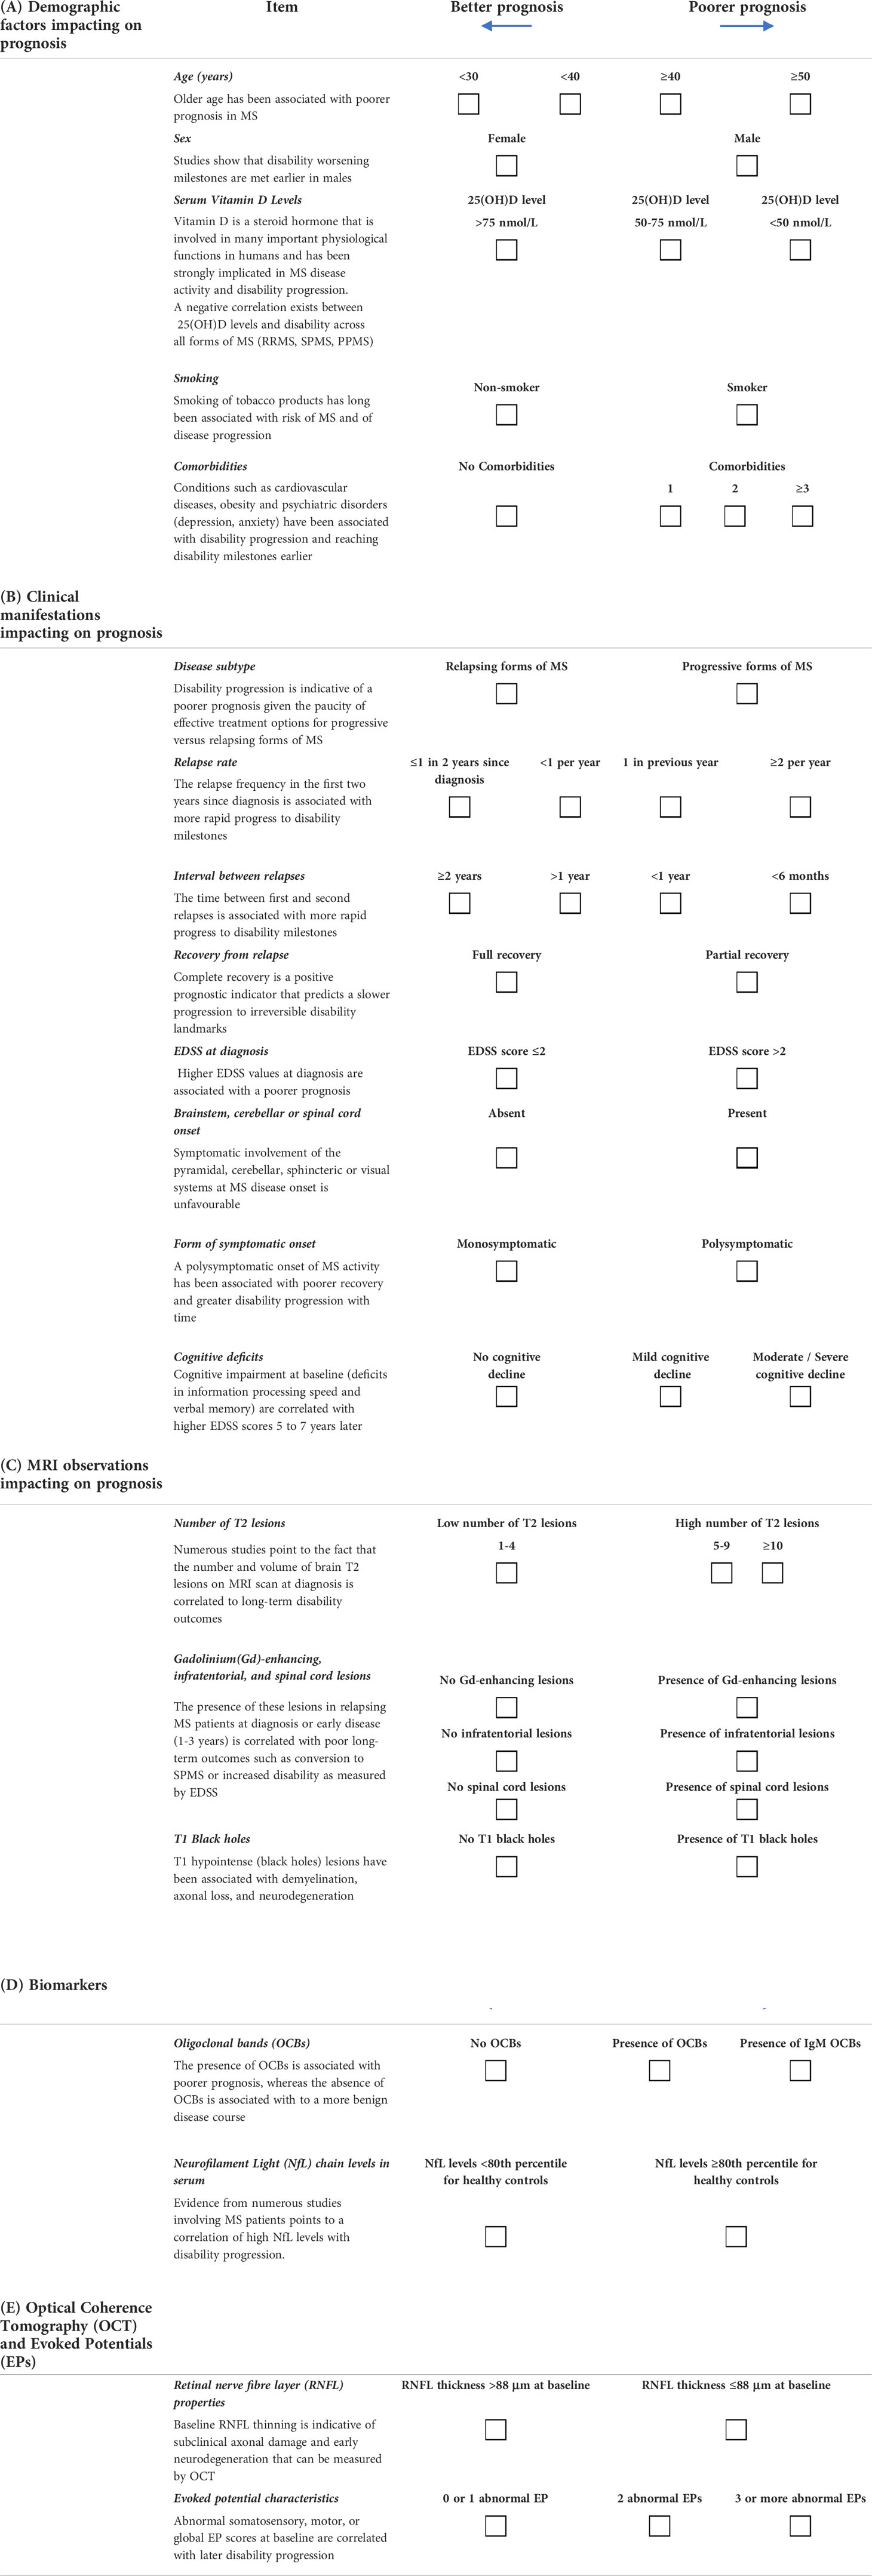
Table 1 Practical checklist for using personalized prognosis in MS.
Age
Older age has been associated with poorer prognosis in MS. For example, older individuals at onset had more rapid disability worsening (5–8), were at greater risk of converting to secondary progressive MS (SPMS) (8) and had a higher likelihood of incomplete or poorer recovery following relapse activity (9, 10). This is probably because older patients are likely to have had subclinical disease activity for a longer time, resulting in reduced ‘brain reserve’ or, in other words, a reduced capacity to compensate for neurodegenerative damage. In a population-based cohort study (6), the time for progression from MS diagnosis to SPMS was significantly reduced in patients with late onset MS disease (defined as ≥50 years). For these reasons, we consider older age to be associated with a poorer prognosis.
Scoring: Age brackets above and below 40 years indicating progressively poorer and better prognosis, respectively.
Sex
While the number of females affected by MS is proportionally much greater than that of males (3:1) (11), studies show that disability worsening milestones are met earlier in males (2, 12), and that MRI brain lesions (13) and cognitive impairment (14, 15) tend to be more severe.
For these reasons, we include the male gender as a risk factor for poorer prognosis.
Scoring: Binary outcome – Male/female.
Vitamin D levels
Vitamin D is a steroid hormone that is involved in many important physiological functions in humans and has been strongly implicated in MS disease activity and disability progression (2, 11, 16). Low Vitamin D levels (and of its metabolite 25(OH)D) early in the RRMS disease course have been associated higher relapse rates (17), higher MRI lesion activity, and an increase in the annualised change in EDSS (18). A meta-analysis of 14 studies showed primary progressive MS (PPMS) a significant negative correlation between 25(OH)D levels and disability across all forms of MS (RRMS, SPMS, PPMS) (19). As noted by Smolders et al. (2019) (20), the presence of low 25(OH)D levels early in the disease is indicative of a higher indicative of patients with a high risk of an active inflammatory disease course. Taken together, these findings suggest that Vitamin D levels could serve as an important biomarker for disease activity and should be assessed in the prognostic workup. Concerning the manner by which vitamin D levels could be incorporated into the prognosis tool, the BENEFIT trial (18) highlighted that serum 25(OH)D levels in the first 12 months in patients with clinically isolated syndrome (CIS) were predictive of disability outcomes at 5 years. In that study and others (18, 21, 22), a serum 25(OH)D concentration less than 50 nmol/L was considered to represent hypovitaminosis D, while 50-75 nmol/L was suggestive of Vitamin D insufficiency, and concentrations greater than 75 nmol/L indicative of normal levels.
Scoring: We suggest that a serum 25(OH)D concentration of <50 nmol/L may indicate a poorer prognostic outcome, while >50 nmol/L is preferred.
Smoking
The smoking of tobacco products has long been associated with an increased risk of MS and of disease progression. Smoking induces a proinflammatory environment that is linked to numerous manifestations of exacerbated outcomes in MS patients. These include greater brain lesion loads on MRI scans (23–27), as well as increased rates of clinical relapse (26, 28, 29), brain atrophy (24, 27, 30) and disability progression (16, 31, 32). Moreover, a poorer response to DMTs (26, 28) and a greater risk of associated comorbidities have been described in MS patients who smoke (26). While prognostic outcomes are considered to be negatively affected in people who smoke, this is a modifiable risk factor given that measures can be taken to reduce or stop the habit (26).
Scoring: Binary response, with ‘Smoker’ indicating a poorer prognosis versus ‘Non-smoker.’
Comorbidities
Conditions such as cardiovascular diseases (33), obesity (11, 16, 34, 35) and psychiatric disorders (depression, anxiety) have been associated with disability progression and reaching EDSS markers earlier (2). For the purposes of the prognosis tool, we are specifically interested here in comorbidities that may impact on MS disease course progression. As outlined by Magyari & Sorensen (2020) (36), several studies have addressed this point. For example, diabetes mellitus, hypertension, and chronic obstructive pulmonary disease impact 3-year outcomes related to walking speed, self-reported disability, and depression (37). On the other hand, in a Canadian study, migraine and hyperlipidemia were specifically associated with an increase in relapse activity over 2 years, as was the presence of three or more of any of the following: migraine, hypertension, diabetes mellitus, heart disease, hyperlipidemia, depression or anxiety (38). Other comorbidities associated with enhanced relapse activity or disability progression were vascular comorbidities, rheumatoid arthritis, anaemia, and autoimmune comorbidities (psoriasis, thyroid disease, and type 2 diabetes mellitus) (36). Comorbidities are included in the prognosis tool given their association, when present, with poorer long-term outcomes.
Scoring: A good prognosis is indicated by the absence of comorbidities. A poorer prognosis will result from the presence of 1, 2, ≥3 concomitant comorbidities of increasing weight contribution.
Clinical manifestations impacting on prognosis
Responses to this section in the prognosis tool can be viewed in Table 1 (Section B).
Disease subtype
As discussed above, most DMTs target inflammatory activity in MS, which is typically associated with relapsing forms of the disease and is therefore treatable to some extent. In contrast, a patient with PPMS at the initial consultation, or an RRMS patient who shows evidence of transition to SPMS on follow-up visits, is accruing irreversible disability, and at a faster rate (12, 39). Such progression is indicative of a poorer prognosis given the paucity of effective treatment options for smouldering disease or progressive forms of MS (40–42).
Scoring: Binary outcome – Relapsing (better prognosis)/Progressive (poorer prognosis).
Relapse rate, interval between first and second relapse, and recovery from first relapse
Scalfari et al. (2010) (43) showed that the relapse frequency in the first two years since diagnosis, along with the time between first and second relapses were both associated with more rapid progress to disability milestones. These two parameters are highly informative and easily measured, and thus included in the prognosis tool. A further relapse-related parameter is the level of recovery from a first relapse. Complete recovery is a positive prognostic indicator that predicts a slower progression to irreversible disability landmarks (44) and the presence of neurological reserve to compensate for damage (42, 45). In contrast, incomplete recovery is associated with faster disability progression (2, 44, 46, 47).
Scoring:
Relapse rate:
Better prognosis: Weighted values of ≤1 in two years since diagnosis and <1 per year
Poorer prognosis: 1 in previous year and ≥2 per year
Interval between relapses:
Better prognosis: weighted values of ≥2 years and >1 year
Poorer prognosis: weighted values of <1 year and <6 months
Recovery:
Better prognosis: fully recovery
Poorer prognosis: incomplete recovery
EDSS at diagnosis
In a recent, systematic review of prognosis prediction models for RRMS based on a sample of 30 studies, Brown et al. (2020) (48) showed that the single most frequently included predictor in prognostic models was baseline EDSS. In a study by Rudick et al. (2010) (49), it was shown that patients with a baseline EDSS score ≤2.0 were significantly less likely to progress to EDSS scores of 4.0, 5.0, 6.0, and 7.0 over an 8-year follow-up than those with a baseline EDSS score of >2.0. This fits with our general experience that higher EDSS values at diagnosis are associated with a poorer prognosis, thus supporting the inclusion of baseline EDSS as a component of the prognosis tool.
Scoring: EDSS score ≤2.0 (better prognosis); EDSS score >2.0 (poorer diagnosis).
Brainstem, cerebellar or spinal cord onset
A 2001 study by Amato and Ponziani (50) highlighted that symptomatic involvement of the pyramidal, cerebellar, sphincteric or visual systems at MS disease onset influences the long-term EDSS progression and is indicative of an unfavorable prognosis. In our prognosis tool, as clinically isolated syndrome patients with optic neuritis had a lower risk of disability progression (51), we have left ‘visual systems’ out of the list of parameters. In contrast, numerous studies have shown that ‘long tract’ signs (pyramidal, cerebellar) result in poorer outcomes, with these signs mostly influenced by infratentorial and spinal cord lesions (52–57).
Scoring: Binary (Yes/No) response to note the presence or absence of symptom onset involving the brainstem, cerebellar or spinal cord systems at MS diagnosis.
Form of symptomatic onset (monosymptomatic/polysymptomatic)
A polysymptomatic onset of MS activity has been associated with poorer recovery and greater disability progression with time (58–61). We consider this to be sufficiently well-described in the literature, is seen in our own clinical practice, and as it is relatively easily assessed it would be a useful parameter for inclusion in the prognosis tool.
Scoring: Binary outcome – Monosymptomatic/Polysymptomatic.
Cognitive deficit
It is well-recognised by patients, neurologists, and caregivers alike that cognitive decline in MS can be highly debilitating given its impact on social interactions, employment, and quality of life. Deloire et al. (2010) (62) showed that in a cohort of 45 MS patients, cognitive impairment at baseline (deficits in information processing speed and verbal memory) correlated with higher EDSS scores 5 and 7 years later. Cognitive impairment tests such as the Brief International Cognitive Assessment for Multiple Sclerosis (BICAMS), the Symbol Digit Modalities Test (SDMT), which assesses information processing speed, and the Selective Reminding Test (SRT), which tests verbal memory, are highly informative of disability worsening and may serve as an important component of the proposed prognosis tool. According to Oset et al. (2020) (63), the SDMT appears to be the most rapid test to perform and provides a highly informative means for assessing cognitive impairment early in MS. Moreover, a clinically meaningful change of 8 points in the SDMT has been reported, which would allow cognitive decline in follow-up visits to be assessed and quantified (64). For tests such as the BICAMS, values of 1.5 or 2 standard deviations below the control mean or below the 5th percentile of the control group are considered indicative of cognitive impairment (63).
Scoring: Better prognosis: No cognitive decline.
Poorer prognosis: 1. Mild cognitive decline; 2. Moderate/severe cognitive decline.
MRI observations impacting on prognosis
Responses to this section in the prognosis tool can be viewed in Table 1 (Section C).
The use of MRI to measure brain lesion activity is a commonly available diagnostic technique forming part of routine clinical practice at most major medical centres. Significant advances in instrument characteristics and protocols over the last 25 years has pushed MRI and other imaging modalities to the forefront of MS diagnosis, follow-up, and research.
Number of T2 lesions
Numerous studies point to the fact that the number and volume of brain T2 lesions on MRI scan at diagnosis, and their change early in the disease course, are correlated to long-term disability outcomes (65–73). Given that MRI forms part of the diagnostic workup for MS in most centres, the T2 lesion number at baseline should be a readily measurable parameter providing an important indication of likely prognosis.
Scoring: Better prognosis: ≤4 T2 lesions.
Poorer prognosis: (weighted) 5-9 T2 lesions; ≥10 T2 lesions
Gadolinium (Gd)-enhancing lesions, infratentorial lesions, and spinal cord lesions
In a recent study by Brownlee et al. (2019) (53), the presence of Gd-enhancing, spinal cord or infratentorial lesions in relapsing MS patients at diagnosis or early disease (1-3 years) was correlated with poorer long-term outcomes such as conversion to SPMS or increased disability as measured by EDSS. Other MRI studies have also shown correlations between the three lesion types at baseline and disability progression in the first 2-8 years thereafter (52–55), as well as correlations with disability for spinal cord (55–57) and Gd-enhancing lesions (55, 74) alone. Based on a similar premise to the above that these lesion types can be identified using standard MRI protocols, we consider that their incorporation into the prognosis tool offers yet another solid set of useful parameters for neurologists to assess long-term outcomes for their patients.
Scoring: Binary outcome: Absent (better prognosis); Present (poorer prognosis).
T1 black holes
T1 hypointense (black holes) lesions are the final MRI measure to be included in the prognosis tool. These lesions have been associated with demyelination, axonal loss, and neurodegeneration, and are therefore considered to be markers of irreversible clinical disability (75–77). A review of published papers carried out by Rocca et al. (2017) (77) highlighted an association between black holes and disability outcomes. To this end, we consider that the presence of black holes is a risk factor for disability progression and therefore of poorer prognosis, thus warranting inclusion of this measure in the prognosis tool. Ideally, brain atrophy and rates of annual brain volume loss will form part of the prognosis tool in the future; however, routine brain atrophy measurements in individuals have not yet become a clinical reality.
Scoring: Presence or absence of black holes. Binary answer: Yes/No.
Biomarkers
Responses to this section in the prognosis tool can be viewed in Table 1 (Section D).
Oligoclonal bands in the cerebrospinal fluid
In a recent review of studies that examined the prognostic value of immunoglobulin G (IgG) oligoclonal bands (OCBs) in the cerebrospinal fluid (CSF) of MS patients, Magliozzi and Cross (2020) (78) reported that most of these studies associated the presence of OCBs with poorer prognosis. In contrast, the absence of OCBs is correlated to a more benign disease course. Strong evidence of different clinical outcomes in the absence or presence of OCBs was provided by Dobson et al. (2013) (79), whose meta-analysis of 10 studies showed significantly poorer prognostic outcomes (EDSS milestones) in OCB-positive patients. The presence of immunoglobulin M (IgM) bands in particular has been associated with poorer prognostic outcomes (80–82). Given that OCBs can be routinely measured in the hospital scenario, we have included their measurement in the prognosis tool, particularly with respect to IgM OCBs if possible.
Scoring: IgG OCBs Binary: Absent (better prognosis); Present (poorer prognosis).
IgM OCBs: Even poorer prognosis than IgG OCBs when present.
Neurofilament light chain levels in CSF or serum
There is some disagreement in the literature over the exact clinical significance of the presence of neurofilament light chains (NfL) in the CSF or serum given that this biomarker, although a good indicator of neurodegeneration, is not specific to MS. However, the weight of evidence from numerous studies involving MS patients points to a correlation of high NfL levels with disability progression. For example, Disanto et al. (2017) (83) showed that serum NfL levels in MS patients that were higher than the 80th percentile in healthy controls indicated a considerably higher risk of increased EDSS. Likewise, Kuhle et al. (2019) (84) reported that high versus low serum NfL levels were associated with a greater risk of confirmed disability worsening at 2 years. The association with disease progression is more robust when composite measures involving NfL and MRI parameters are used (78, 85–88). As CSF and serum NfL levels are highly correlated (78, 83), prognostic testing with blood samples has become a clinical reality (84) and far less invasive than performing a lumbar puncture. Indeed, a recent study by Benkert et al. (2022) (89) showed that serum NfL percentiles and Z scores (established based on a control cohort with no evidence of CNS disease) may permit the identification of people with MS who are at risk of a poorer prognosis. Given that the clinical significance of NfL is somewhat contentious and techniques to assess their levels are not yet widely implemented in routine clinical practice, we suggest that this will be a biomarker to watch in the future. Scoring: NfL levels <80th percentile in healthy controls (better prognosis); NfL levels >80th percentile in healthy controls (poorer prognosis).
Optical coherence tomography and evoked potentials
Responses to this section in the prognosis tool can be viewed in Table 1 (Section E).
Retinal nerve fibre layer (RNFL) properties
Many studies have shown that OCT can be used to obtain valuable prognostic information about the MS patient. Baseline RNFL thinning is indicative of subclinical axonal damage and early neurodegeneration that can be measured by OCT. Oreja-Guevara et al. (2012) (90) showed that thinning of the RNFL is present from the earliest stages of the disease (clinically isolated syndrome), while Martinez-Lapiscina et al. (2016) (91) reported that patients with a peripapillary RNFL of ≤88 μm had double the risk of disability worsening after 1-3 years of follow-up, and a nearly 3-fold increased risk of disability worsening from 3-5 years of follow-up.
Scoring: Binary outcome: Presence or absence of an RNFL thickness ≤88 μm at baseline.
Evoked potential characteristics
Electrophysiological studies of MS patients via the use of EPs offer a relatively straightforward means to assess long-term prognosis. Leocani et al. (2006) (92) showed that abnormal somatosensory (SSEP), motor (MEP), and global (where the different abnormalities (latency, amplitude, form) of the distinct EPs are added together in one score) EP scores at baseline were highly correlated with disability progression at follow-up [30.5 ± 11.7 months (mean ± std dev)]. These observations provide insight into the prognostic value of performing EP tests at baseline in MS patients. More recently, Hardmeier et al. (2017) (93) described the value of using multimodal EPs (mmEPs) as a prognostic biomarker. Here, a combination of different EP modalities is used to provide a measure of functional alterations across different tracts of the CNS. This is important given the heterogeneity of MS and the fact that some tracts may be more affected than others and not necessarily identified using single EP modalities. To make the prognosis tool as practical as possible, we suggest that neurologists record as many types of EPs as are available to them, including visual EPs (VEPs), SSEPs, MEPs and to a lesser extent brainstem auditory EPs (BAEPs). The number of EPs showing latency, amplitude or morphological abnormalities should be counted, with the presence of 0 or 1 abnormal EP indicative of a better prognosis. In contrast, we feel that two abnormal EPs, and more particularly three or more abnormal EPs would suggest a poorer prognosis as per Pelayo et al. (2010) (94). Keep in mind that MEP and SSEP scores at first presentation were shown to correlate significantly with EDSS values after five years (95) and could therefore be expected to have the highest impact on prognosis.
Scoring: We suggest that ≤1 abnormal EP is associated with a better prognostic outcome, while two or ≥3 abnormal EPs would denote a progressively poorer outcome.
Discussion
We have presented here a prognosis tool which we believe should enable the MS neurologist to optimally profile newly diagnosed MS patients and to consequently define appropriate treatment strategies relevant to each patient’s disease status. DMT indications tend to be based on patients’ current disease status as evidenced by clinical and imaging findings. However, we contend that ‘disease activity’ at MS diagnosis and ‘poorer prognostic signs’ are not one and the same thing. A patient with a poor prognosis may not necessarily have ‘highly active disease’ at diagnosis, but may exhibit, as we have shown here, numerous other disease characteristics requiring a more proactive treatment approach. Such an approach demands a higher degree of vigilance by the neurologist that is guided by the severity of the prognostic factors defined here in the tool, enabling the MS neurologist to provide a level of care superior to that of simply administering DMTs in order of efficacy as per local prescribing guidelines. A key objective of this strategy is to stop or slow-down disability progression early in the disease in order to prevent transition to SPMS. It is well recognised that most currently available DMTs primarily address the peripherally-driven focal inflammatory component of MS typically seen in relapsing forms of the disease, with the expectation being that disability progression can be minimised if this activity can be controlled. The importance, therefore, of a proactive approach on the part of the neurologist to effectively control early focal inflammatory activity is crucial from the outset.
The inherent value of this prognosis tool lies in the fact that most, if not all of the parameters we have chosen for the tool can be measured using clinical, biochemical, and imaging procedures/techniques that now form part of standard practice in many parts of the world. Implementing these tests in the newly diagnosed MS patient should orientate the MS neurologist to the patient’s likely prognosis (if left untreated or inadequately treated), and to identify ‘red flags’ in the patient’s profile indicating the need for heightened vigilance and/or a more effective treatment approach.
While other authors have addressed in various ways the topic of the prognostic value of individual or grouped clinical and imaging parameters (see e.g (2, 7, 14, 16, 18, 35, 46, 48, 50, 51, 53, 60, 65, 66, 78, 92, 96–100), our aim here was to provide the MS neurologist with a tool in the form of a printable document that can be completed by the neurologist or their support staff. By providing a visually descriptive output, the document should orient the neurologist to the real prognosis for each patient, to treatment approaches that should be considered, and, where appropriate, to explain to patients why one treatment strategy might be a preferred option over another.
Our prognosis tool has some limitations that should be noted. For example, although backed by literature reports and many years of clinical experience on the part of the authors, the tool has not been scientifically validated. Moreover, while the parameters used will orient the neurologist to potentially poor or better prognostic outcomes in specific patients, the presented responses have not been weighted on the basis of their importance to overall prognosis. The validation and weighting aspects of the tool will form the basis of future work to be performed.
In summary, this MS prognosis tool brings together a considerable amount of data specific to each MS patient, thereby providing the MS neurologist with a comprehensive overview of each patient’s current and potential disease status in the future. The tool should also facilitate the development of personalised treatment approaches based on individualised prognostic evidence, enabling outcomes for MS patients to be optimised.
Author contributions
Development of the tool was led by BW, with input from all other authors at regular meetings. BW wrote the manuscript, with feedback on early versions provided by H-PH and CO-G. All authors contributed to manuscript revision and read and approved the submitted version.
Funding
Medical writing support for the preparation of this manuscript along with the payment of publishing fees were provided by the ParadigMS Foundation.
Acknowledgments
The creation and communication of educational materials by the ParadigMS Foundation is sponsored by Sanofi, Roche, and Merck.
Conflict of interest
The authors declare that the research was conducted in the absence of any commercial or financial relationships that could be construed as a potential conflict of interest.
Publisher’s note
All claims expressed in this article are solely those of the authors and do not necessarily represent those of their affiliated organizations, or those of the publisher, the editors and the reviewers. Any product that may be evaluated in this article, or claim that may be made by its manufacturer, is not guaranteed or endorsed by the publisher.
References
1. Multiple sclerosis international federation. atlas of MS. 3rd ed. London, UK: Multiple Sclerosis International Federation (2020) p. 1–37.
2. Rotstein D, Montalban X. Reaching an evidence-based prognosis for personalized treatment of multiple sclerosis. Nat Rev Neurol (2019) 15(5):287–300. doi: 10.1038/s41582-019-0170-8
3. Lublin FD, Reingold SC, Cohen JA, Cutter GR, Sørensen PS, Thompson AJ, et al. Defining the clinical course of multiple sclerosis: The 2013 revisions. Neurology (2014) 83(3):278–86. doi: 10.1212/WNL.0000000000000560
4. Rotstein DL, Healy BC, Malik MT, Chitnis T, Weiner HL. Evaluation of no evidence of disease activity in a 7-year longitudinal multiple sclerosis cohort. JAMA Neurol (2015) 72(2):152–8. doi: 10.1001/jamaneurol.2014.3537
5. Confavreux C, Vukusic S, Adeleine P. Early clinical predictors and progression of irreversible disability in multiple sclerosis: An amnesic process. Brain (2003) 126(Pt 4):770–82. doi: 10.1093/brain/awg081
6. Guillemin F, Baumann C, Epstein J, Kerschen P, Garot T, Mathey G, et al. Older age at multiple sclerosis onset is an independent factor of poor prognosis: A population-based cohort study. Neuroepidemiology (2017) 48(3-4):179–87. doi: 10.1159/000479516
7. Runmarker B, Andersen O. Prognostic factors in a multiple sclerosis incidence cohort with twenty-five years of follow-up. Brain (1993) 116(Pt 1):117–34. doi: 10.1093/brain/116.1.117
8. Scalfari A, Neuhaus A, Daumer M, Ebers GC, Muraro PA. Age and disability accumulation in multiple sclerosis. Neurology (2011) 77(13):1246–52. doi: 10.1212/WNL.0b013e318230a17d
9. Kalincik T, Buzzard K, Jokubaitis V, Trojano M, Duquette P, Izquierdo G, et al. Risk of relapse phenotype recurrence in multiple sclerosis. Mult Scler (2014) 20(11):1511–22. doi: 10.1177/1352458514528762
10. Conway BL, Zeydan B, Uygunoğlu U, Novotna M, Siva A, Pittock SJ, et al. Age is a critical determinant in recovery from multiple sclerosis relapses. Mult Scler (2019) 25(13):1754–63. doi: 10.1177/1352458518800815
11. Angeloni B, Bigi R, Bellucci G, Mechelli R, Ballerini C, Romano C, et al. A case of double standard: Sex differences in multiple sclerosis risk factors. Int J Mol Sci (2021) 22(7):3696. doi: 10.3390/ijms22073696
12. Leray E, Yaouanq J, Le Page E, Coustans M, Laplaud D, Oger J, et al. Evidence for a two-stage disability progression in multiple sclerosis. Brain (2010) 133(Pt 7):1900–13. doi: 10.1093/brain/awq076
13. Pozzilli C, Tomassini V, Marinelli F, Paolillo A, Gasperini C, Bastianello S. 'Gender gap' in multiple sclerosis: Magnetic resonance imaging evidence. Eur J Neurol (2003) 10(1):95–7. doi: 10.1046/j.1468-1331.2003.00519.x
14. Benedict RH, Zivadinov R. Risk factors for and management of cognitive dysfunction in multiple sclerosis. Nat Rev Neurol (2011) 7(6):332–42. doi: 10.1038/nrneurol.2011.61
15. Schoonheim MM, Popescu V, Rueda Lopes FC, Wiebenga OT, Vrenken H, Douw L, et al. Subcortical atrophy and cognition: Sex effects in multiple sclerosis. Neurology (2012) 79(17):1754–61. doi: 10.1212/WNL.0b013e3182703f46
16. Amato MP, Derfuss T, Hemmer B, Liblau R, Montalban X, Soelberg Sørensen P, et al. 2016 ECTRIMS focused workshop group. environmental modifiable risk factors for multiple sclerosis: Report from the 2016 ECTRIMS focused workshop. Mult Scler (2018) 24(5):590–603. doi: 10.1177/1352458516686847
17. Simpson S Jr, Taylor B, Blizzard L, Ponsonby AL, Pittas F, Tremlett H, et al. Higher 25-hydroxyvitamin d is associated with lower relapse risk in multiple sclerosis. Ann Neurol (2010) 68(2):193–203. doi: 10.1002/ana.22043
18. Ascherio A, Munger KL, White R, Köchert K, Simon KC, Polman CH, et al. Vitamin d as an early predictor of multiple sclerosis activity and progression. JAMA Neurol (2014) 71(3):306–14. doi: 10.1001/jamaneurol.2013.5993
19. Moosazadeh M, Nabinezhad-Male F, Afshari M, Nasehi MM, Shabani M, Kheradmand M, et al. Vitamin d status and disability among patients with multiple sclerosis: a systematic review and meta-analysis. AIMS Neurosci (2021) 8(2):239–53. doi: 10.3934/Neuroscience.2021013
20. Smolders J, Torkildsen Ø, Camu W, Holmøy T. An update on vitamin d and disease activity in multiple sclerosis. CNS Drugs (2019) 33(12):1187–99. doi: 10.1007/s40263-019-00674-8
21. Fitzgerald KC, Munger KL, Köchert K, Arnason BG, Comi G, Cook S, et al. Association of vitamin d levels with multiple sclerosis activity and progression in patients receiving interferon beta-1b. JAMA Neurol (2015) 72(12):1458–65. doi: 10.1001/jamaneurol.2015.2742
22. Virgilio E, Vecchio D, Crespi I, Barbero P, Caloni B, Naldi P, et al. Serum vitamin d as a marker of impaired information processing speed and early disability in multiple sclerosis patients. Brain Sci (2021) 11(11):1521. doi: 10.3390/brainsci11111521
23. Arikanoglu A, Shugaiv E, Tüzün E, Eraksoy M. Impact of cigarette smoking on conversion from clinically isolated syndrome to clinically definite multiple sclerosis. Int J Neurosci (2013) 123(7):476–9. doi: 10.3109/00207454.2013.764498
24. Healy BC, Ali EN, Guttmann CR, Chitnis T, Glanz BI, Buckle G, et al. Smoking and disease progression in multiple sclerosis. Arch Neurol (2009) 66(7):858–64. doi: 10.1001/archneurol.2009.122
25. Horakova D, Zivadinov R, Weinstock-Guttman B, Havrdova E, Qu J, Tamaño-Blanco M, et al. Environmental factors associated with disease progression after the first demyelinating event: results from the multi-center SET study. PloS One (2013) 8(1):e53996. doi: 10.1371/journal.pone.0053996
26. Rosso M, Chitnis T. Association between cigarette smoking and multiple sclerosis: A review. JAMA Neurol (2020) 77(2):245–53. doi: 10.1001/jamaneurol.2019.4271
27. Zivadinov R, Weinstock-Guttman B, Hashmi K, Abdelrahman N, Stosic M, Dwyer M, et al. Smoking is associated with increased lesion volumes and brain atrophy in multiple sclerosis. Neurology (2009) 73(7):504–10. doi: 10.1212/WNL.0b013e3181b2a706
28. Petersen ER, Oturai AB, Koch-Henriksen N, Magyari M, Sørensen PS, Sellebjerg F, et al. Smoking affects the interferon beta treatment response in multiple sclerosis. Neurology (2018) 90(7):e593–600. doi: 10.1212/WNL.0000000000004949
29. Weiland TJ, Hadgkiss EJ, Jelinek GA, Pereira NG, Marck CH, van der Meer DM. The association of alcohol consumption and smoking with quality of life, disability and disease activity in an international sample of people with multiple sclerosis. J Neurol Sci (2014) 336(1-2):211–9. doi: 10.1016/j.jns.2013.10.046
30. Kappus N, Weinstock-Guttman B, Hagemeier J, Kennedy C, Melia R, Carl E, et al. Cardiovascular risk factors are associated with increased lesion burden and brain atrophy in multiple sclerosis. J Neurol Neurosurg Psychiatry (2016) 87(2):181–7. doi: 10.1136/jnnp-2014-310051
31. Manouchehrinia A, Tench CR, Maxted J, Bibani RH, Britton J, Constantinescu CS. Tobacco smoking and disability progression in multiple sclerosis: United kingdom cohort study. Brain (2013) 136(Pt 7):2298–304. doi: 10.1093/brain/awt139
32. Heydarpour P, Manouchehrinia A, Beiki O, Mousavi SE, Abdolalizadeh A, Moradi-Lakeh M, et al. Smoking and worsening disability in multiple sclerosis: A meta-analysis. Acta Neurol Scand (2018) 138(1):62–9. doi: 10.1111/ane.12916
33. Moccia M, Lanzillo R, Palladino R, Maniscalco GT, De Rosa A, Russo C, et al. The framingham cardiovascular risk score in multiple sclerosis. Eur J Neurol (2015) 22(8):1176–83. doi: 10.1111/ene.12720
34. Mowry EM, Azevedo CJ, McCulloch CE, Okuda DT, Lincoln RR, Waubant E, et al. Body mass index, but not vitamin d status, is associated with brain volume change in MS. Neurology (2018) 91(24):e2256–64. doi: 10.1212/WNL.0000000000006644
35. Briggs FBS, Thompson NR, Conway DS. Prognostic factors of disability in relapsing remitting multiple sclerosis. Mult Scler Relat Disord (2019) 30:9–16. doi: 10.1016/j.msard.2019.01.045
36. Magyari M, Sorensen PS. Comorbidity in multiple sclerosis. Front Neurol (2020) 11:851. doi: 10.3389/fneur.2020.00851
37. Conway DS, Thompson NR, Cohen JA. Influence of hypertension, diabetes, hyperlipidemia, and obstructive lung disease on multiple sclerosis disease course. Mult Scler (2017) 23(2):277–85. doi: 10.1177/1352458516650512
38. Kowalec K, McKay KA, Patten SB, Fisk JD, Evans C, Tremlett H, et al. Comorbidity increases the risk of relapse in multiple sclerosis: A prospective study. Neurology (2017) 89(24):2455–61. doi: 10.1212/WNL.0000000000004716
39. Confavreux C, Vukusic S, Moreau T, Adeleine P. Relapses and progression of disability in multiple sclerosis. N Engl J Med (2000) 343(20):1430–8. doi: 10.1056/NEJM200011163432001
40. University of California, San Francisco MS-EPIC Team, Cree BAC, Hollenbach JA, Bove R, Kirkish G, Sacco S, et al. Silent progression in disease activity-free relapsing multiple sclerosis. Ann Neurol (2019) 85(5):653–66. doi: 10.1002/ana.25463
41. Kappos L, Wolinsky JS, Giovannoni G, Arnold DL, Wang Q, Bernasconi C, et al. Contribution of relapse-independent progression vs relapse-associated worsening to overall confirmed disability accumulation in typical relapsing multiple sclerosis in a pooled analysis of 2 randomized clinical trials. JAMA Neurol (2020) 77(9):1132–40. doi: 10.1001/jamaneurol.2020.1568
42. Giovannoni G, Popescu V, Wuerfel J, Hellwig K, Iacobaeus E, Jensen MB, et al. Smouldering multiple sclerosis: the 'real MS'. Ther Adv Neurol Disord (2022) 15:17562864211066751. doi: 10.1177/17562864211066751
43. Scalfari A, Neuhaus A, Degenhardt A, Rice GP, Muraro PA, Daumer M, et al. The natural history of multiple sclerosis: A geographically based study 10: relapses and long-term disability. Brain (2010) 133(Pt 7):1914–29. doi: 10.1093/brain/awq118
44. Confavreux C, Vukusic S, Adeleine P. Early clinical predictors and progression of irreversible disability in multiple sclerosis: An amnesic process. Brain (2003) 126(Pt 4):770–82. doi: 10.1093/brain/awg081
45. Dutta R, Trapp BD. Relapsing and progressive forms of multiple sclerosis: insights from pathology. Curr Opin Neurol (2014) 27(3):271–8. doi: 10.1097/WCO.0000000000000094
46. Langer-Gould A, Popat RA, Huang SM, Cobb K, Fontoura P, Gould MK, et al. Clinical and demographic predictors of long-term disability in patients with relapsing-remitting multiple sclerosis: a systematic review. Arch Neurol (2006) 63(12):1686–91. doi: 10.1001/archneur.63.12.1686
47. Novotna M, Paz Soldán MM, Abou Zeid N, Kale N, Tutuncu M, Crusan DJ, et al. Poor early relapse recovery affects onset of progressive disease course in multiple sclerosis. Neurology (2015) 85(8):722–9. doi: 10.1212/WNL.0000000000001856
48. Brown FS, Glasmacher SA, Kearns PKA, MacDougall N, Hunt D, Connick P, et al. Systematic review of prediction models in relapsing remitting multiple sclerosis. PloS One (2020) 15(5):e0233575. doi: 10.1371/journal.pone.0233575
49. Rudick RA, Lee JC, Cutter GR, Miller DM, Bourdette D, Weinstock-Guttman B, et al. Disability progression in a clinical trial of relapsing-remitting multiple sclerosis: Eight-year follow-up. Arch Neurol (2010) 67(11):1329–35. doi: 10.1001/archneurol.2010.150
50. Amato MP, Ponziani G. A prospective study on the prognosis of multiple sclerosis. Neurol Sci (2000) 21(4 Suppl 2):S831–8. doi: 10.1007/s100720070021
51. Tintore M, Rovira À, Río J, Otero-Romero S, Arrambide G, Tur C, et al. Defining high, medium and low impact prognostic factors for developing multiple sclerosis. Brain (2015) 138(Pt 7):1863–74. doi: 10.1093/brain/awv105
52. Tintore M, Rovira A, Arrambide G, Mitjana R, Río J, Auger C, et al. Brainstem lesions in clinically isolated syndromes. Neurology (2010) 75(21):1933–8. doi: 10.1212/WNL.0b013e3181feb26f
53. Brownlee WJ, Altmann DR, Prados F, Miszkiel KA, Eshaghi A, Gandini Wheeler-Kingshott CAM, et al. Early imaging predictors of long-term outcomes in relapse-onset multiple sclerosis. Brain (2019) 142(8):2276–87. doi: 10.1093/brain/awz156
54. Minneboo A, Barkhof F, Polman CH, Uitdehaag BM, Knol DL, Castelijns JA. Infratentorial lesions predict long-term disability in patients with initial findings suggestive of multiple sclerosis. Arch Neurol (2004) 61(2):217–21. doi: 10.1001/archneur.61.2.217
55. Swanton JK, Fernando KT, Dalton CM, Miszkiel KA, Altmann DR, Plant GT, et al. Early MRI in optic neuritis: The risk for disability. Neurology (2009) 72(6):542–50. doi: 10.1212/01.wnl.0000341935.41852.82
56. Brownlee WJ, Altmann DR, Alves Da Mota P, Swanton JK, Miszkiel KA, Wheeler-Kingshott CG, et al. Association of asymptomatic spinal cord lesions and atrophy with disability 5 years after a clinically isolated syndrome. Mult Scler (2017) 23(5):665–74. doi: 10.1177/1352458516663034
57. Arrambide G, Rovira A, Sastre-Garriga J, Tur C, Castilló J, Río J, et al. Spinal cord lesions: A modest contributor to diagnosis in clinically isolated syndromes but a relevant prognostic factor. Mult Scler (2018) 24(3):301–12. doi: 10.1177/1352458517697830
58. Kara F, Göl MF, Boz C. Determinants of disability development in patients with multiple sclerosis. Arq Neuropsiquiatr (2021) 79(6):489–96. doi: 10.1590/0004-282X-ANP-2020-0338
59. Sevim S. Relapses in multiple sclerosis: Definition, pathophysiology, features, imitators, and treatment. Turk J Neurol (2016) 22:99–108. doi: 10.4274/tnd.75318
60. Bsteh G, Ehling R, Lutterotti A, Hegen H, Di Pauli F, Auer M, et al. Long term clinical prognostic factors in relapsing-remitting multiple sclerosis: Insights from a 10-year observational study. PloS One (2016) 11(7):e0158978. doi: 10.1371/journal.pone.0158978
61. Leone MA, Bonissoni S, Collimedaglia L, Tesser F, Calzoni S, Stecco A, et al. Factors predicting incomplete recovery from relapses in multiple sclerosis: A prospective study. Mult Scler (2008) 14(4):485–93. doi: 10.1177/1352458507084650
62. Deloire M, Ruet A, Hamel D, Bonnet M, Brochet B. Early cognitive impairment in multiple sclerosis predicts disability outcome several years later. Mult Scler (2010) 16(5):581–7. doi: 10.1177/1352458510362819
63. Oset M, Stasiolek M, Matysiak M. Cognitive dysfunction in the early stages of multiple sclerosis-how much and how important? Curr Neurol Neurosci Rep (2020) 20(7):22. doi: 10.1007/s11910-020-01045-3
64. Jacques F, Schembri A, Paquette C. Single digit modality: What is a clinically significant change in multiple sclerosis patients. Neurology (2020) 94(15 Supplement):880.
65. O'Riordan JI, Thompson AJ, Kingsley DP, MacManus DG, Kendall BE, Rudge P, et al. The prognostic value of brain MRI in clinically isolated syndromes of the CNS. a 10-year follow-up. Brain (1998) 121(Pt 3):495–503. doi: 10.1093/brain/121.3.495
66. Fisniku LK, Brex PA, Altmann DR, Miszkiel KA, Benton CE, Lanyon R, et al. Disability and T2 MRI lesions: A 20-year follow-up of patients with relapse onset of multiple sclerosis. Brain (2008) 131(Pt 3):808–17. doi: 10.1093/brain/awm329
67. Uher T, Vaneckova M, Sobisek L, Tyblova M, Seidl Z, Krasensky J, et al. Combining clinical and magnetic resonance imaging markers enhances prediction of 12-year disability in multiple sclerosis. Mult Scler (2017) 23(1):51–61. doi: 10.1177/1352458516642314
68. Traboulsee A, Li DKB, Cascione M, Fang J, Dangond F, Miller A. Predictive value of early magnetic resonance imaging measures is differentially affected by the dose of interferon beta-1a given subcutaneously three times a week: An exploratory analysis of the PRISMS study. BMC Neurol (2018) 18(1):68. doi: 10.1186/s12883-018-1066-8
69. Popescu V, Agosta F, Hulst HE, Sluimer IC, Knol DL, Sormani MP, et al. Brain atrophy and lesion load predict long term disability in multiple sclerosis. J Neurol Neurosurg Psychiatry (2013) 84(10):1082–91. doi: 10.1136/jnnp-2012-304094
70. Kearney H, Rocca MA, Valsasina P, Balk L, Sastre-Garriga J, Reinhardt J, et al. Magnetic resonance imaging correlates of physical disability in relapse onset multiple sclerosis of long disease duration. Mult Scler (2014) 20(1):72–80. doi: 10.1177/1352458513492245
71. Morrissey SP, Miller DH, Kendall BE, Kingsley DP, Kelly MA, Francis DA, et al. The significance of brain magnetic resonance imaging abnormalities at presentation with clinically isolated syndromes suggestive of multiple sclerosis. A 5-year follow-up study. Brain (1993) 116(Pt 1):135–46. doi: 10.1093/brain/116.1.135
72. Brex PA, Ciccarelli O, O'Riordan JI, Sailer M, Thompson AJ, Miller DH. A longitudinal study of abnormalities on MRI and disability from multiple sclerosis. N Engl J Med (2002) 346(3):158–64. doi: 10.1056/NEJMoa011341
73. Tintoré M, Rovira A, Río J, Nos C, Grivé E, Téllez N, et al. Baseline MRI predicts future attacks and disability in clinically isolated syndromes. Neurology (2006) 67(6):968–72. doi: 10.1212/01.wnl.0000237354.10144.ec
74. Di Filippo M, Anderson VM, Altmann DR, Swanton JK, Plant GT, Thompson AJ, et al. Brain atrophy and lesion load measures over 1 year relate to clinical status after 6 years in patients with clinically isolated syndromes. J Neurol Neurosurg Psychiatry (2010) 81(2):204–8. doi: 10.1136/jnnp.2009.171769
75. Thaler C, Faizy TD, Sedlacik J, Holst B, Stürner K, Heesen C, et al. T1 recovery is predominantly found in black holes and is associated with clinical improvement in patients with multiple sclerosis. AJNR Am J Neuroradiol (2017) 38(2):264–9. doi: 10.3174/ajnr.A5004
76. Sahraian MA, Radue EW, Haller S, Kappos L. Black holes in multiple sclerosis: definition, evolution, and clinical correlations. Acta Neurol Scand (2010) 122(1):1–8. doi: 10.1111/j.1600-0404.2009.01221.x
77. Rocca MA, Comi G, Filippi M. The role of T1-weighted derived measures of neurodegeneration for assessing disability progression in multiple sclerosis. Front Neurol (2017) 8:433. doi: 10.3389/fneur.2017.00433
78. Magliozzi R, Cross AH. Can CSF biomarkers predict future MS disease activity and severity? Mult Scler (2020) 26(5):582–90. doi: 10.1177/1352458519871818
79. Dobson R, Ramagopalan S, Davis A, Giovannoni G. Cerebrospinal fluid oligoclonal bands in multiple sclerosis and clinically isolated syndromes: A meta-analysis of prevalence, prognosis and effect of latitude. J Neurol Neurosurg Psychiatry (2013) 84(8):909–14. doi: 10.1136/jnnp-2012-304695
80. Villar LM, Masjuan J, González-Porqué P, Plaza J, Sádaba MC, Roldán E, et al. Intrathecal IgM synthesis is a prognostic factor in multiple sclerosis. Ann Neurol (2003) 53(2):222–6. doi: 10.1002/ana.10441
81. Perini P, Ranzato F, Calabrese M, Battistin L, Gallo P. Intrathecal IgM production at clinical onset correlates with a more severe disease course in multiple sclerosis. J Neurol Neurosurg Psychiatry (2006) 77(8):953–5. doi: 10.1136/jnnp.2005.086116
82. Pfuhl C, Grittner U, Gieß RM, Scheel M, Behrens JR, Rasche L, et al. Intrathecal IgM production is a strong risk factor for early conversion to multiple sclerosis. Neurology (2019) 93(15):e1439–51. doi: 10.1212/WNL.0000000000008237
83. Disanto G, Barro C, Benkert P, Naegelin Y, Schädelin S, Giardiello A, et al. Serum neurofilament light: A biomarker of neuronal damage in multiple sclerosis. Ann Neurol (2017) 81(6):857–70. doi: 10.1002/ana.24954
84. Kuhle J, Kropshofer H, Haering DA, Kundu U, Meinert R, Barro C, et al. Blood neurofilament light chain as a biomarker of MS disease activity and treatment response. Neurology (2019) 92(10):e1007–15. doi: 10.1212/WNL.0000000000007032
85. Chitnis T, Gonzalez C, Healy BC, Saxena S, Rosso M, Barro C, et al. Neurofilament light chain serum levels correlate with 10-year MRI outcomes in multiple sclerosis. Ann Clin Transl Neurol (2018) 5(12):1478–91. doi: 10.1002/acn3.638
86. Häring DA, Kropshofer H, Kappos L, Cohen JA, Shah A, Meinert R, et al. Long-term prognostic value of longitudinal measurements of blood neurofilament levels. Neurol Neuroimmunol Neuroinflamm (2020) 7(5):e856. doi: 10.1212/NXI.0000000000000856
87. Bittner S, Steffen F, Uphaus T, Muthuraman M, Fleischer V, Salmen A, et al. Clinical implications of serum neurofilament in newly diagnosed MS patients: A longitudinal multicentre cohort study. EBioMedicine (2020) 56:102807. doi: 10.1016/j.ebiom.2020.102807
88. Ferreira-Atuesta C, Reyes S, Giovanonni G, Gnanapavan S. The evolution of neurofilament light chain in multiple sclerosis. Front Neurosci (2021) 15:642384. doi: 10.3389/fnins.2021.642384
89. Benkert P, Meier S, Schaedelin S, Manouchehrinia A, Yaldizli Ö, Maceski A, et al. Serum neurofilament light chain for individual prognostication of disease activity in people with multiple sclerosis: A retrospective modelling and validation study. Lancet Neurol (2022) 21(3):246–57. doi: 10.1016/S1474-4422(22)00009-6
90. Oreja-Guevara C, Noval S, Alvarez-Linera J, Gabaldón L, Manzano B, Chamorro B, et al. Clinically isolated syndromes suggestive of multiple sclerosis: An optical coherence tomography study. PloS One (2012) 7(3):e33907. doi: 10.1371/journal.pone.0033907
91. Martinez-Lapiscina EH, Arnow S, Wilson JA, Saidha S, Preiningerova JL, Oberwahrenbrock T, et al. Retinal thickness measured with optical coherence tomography and risk of disability worsening in multiple sclerosis: A cohort study. Lancet Neurol (2016) 15(6):574–84. doi: 10.1016/S1474-4422(16)00068-5
92. Leocani L, Rovaris M, Boneschi FM, Medaglini S, Rossi P, Martinelli V, et al. Multimodal evoked potentials to assess the evolution of multiple sclerosis: A longitudinal study. J Neurol Neurosurg Psychiatry (2006) 77(9):1030–5. doi: 10.1136/jnnp.2005.086280
93. Hardmeier M, Leocani L, Fuhr P. A new role for evoked potentials in MS? repurposing evoked potentials as biomarkers for clinical trials in MS. Mult Scler (2017) 23(10):1309–19. doi: 10.1177/1352458517707265
94. Pelayo R, Montalban X, Minoves T, Moncho D, Rio J, Nos C, et al. Do multimodal evoked potentials add information to MRI in clinically isolated syndromes? Mult Scler (2010) 16(1):55–61. doi: 10.1177/1352458509352666
95. Kallmann BA, Fackelmann S, Toyka KV, Rieckmann P, Reiners K. Early abnormalities of evoked potentials and future disability in patients with multiple sclerosis. Mult Scler (2006) 12(1):58–65. doi: 10.1191/135248506ms1244oa
96. Miller D, Barkhof F, Montalban X, Thompson A, Filippi M. Clinically isolated syndromes suggestive of multiple sclerosis, part I: Natural history, pathogenesis, diagnosis, and prognosis. Lancet Neurol (2005) 4(5):281–8. doi: 10.1016/S1474-4422(05)70071-5
97. Freedman MS, Selchen D, Arnold DL, Prat A, Banwell B, Yeung M, et al. Treatment optimization in MS: Canadian MS working group updated recommendations. Can J Neurol Sci (2013) 40(3):307–23. doi: 10.1017/s0317167100014244
98. Kalincik T, Manouchehrinia A, Sobisek L, Jokubaitis V, Spelman T, Horakova D, et al. Towards personalized therapy for multiple sclerosis: Prediction of individual treatment response. Brain (2017) 140(9):2426–43. doi: 10.1093/brain/awx185
99. Jokubaitis VG, Spelman T, Kalincik T, Lorscheider J, Havrdova E, Horakova D, et al. Predictors of long-term disability accrual in relapse-onset multiple sclerosis. Ann Neurol (2016) 80(1):89–100. doi: 10.1002/ana.24682
Keywords: multiple sclerosis, prognosis, clinical parameters, magnetic resonance imaging (MRI), biomarkers, treatment, optical coherence tomography, evoked potentials
Citation: Van Wijmeersch B, Hartung H-P, Vermersch P, Pugliatti M, Pozzilli C, Grigoriadis N, Alkhawajah M, Airas L, Linker R and Oreja-Guevara C (2022) Using personalized prognosis in the treatment of relapsing multiple sclerosis: A practical guide. Front. Immunol. 13:991291. doi: 10.3389/fimmu.2022.991291
Received: 11 July 2022; Accepted: 28 July 2022;
Published: 27 September 2022.
Edited by:
Letizia Leocani, San Raffaele Hospital (IRCCS), ItalyReviewed by:
Victor Rivera, Baylor College of Medicine, United StatesJorge Tolivia, University of Oviedo, Spain
Copyright © 2022 Van Wijmeersch, Hartung, Vermersch, Pugliatti, Pozzilli, Grigoriadis, Alkhawajah, Airas, Linker and Oreja-Guevara. This is an open-access article distributed under the terms of the Creative Commons Attribution License (CC BY). The use, distribution or reproduction in other forums is permitted, provided the original author(s) and the copyright owner(s) are credited and that the original publication in this journal is cited, in accordance with accepted academic practice. No use, distribution or reproduction is permitted which does not comply with these terms.
*Correspondence: Bart Van Wijmeersch, YmFydC52YW53aWptZWVyc2NoQHVoYXNzZWx0LmJl