 Mona Meng Wang1,2
 Saara A. Koskela1
 Arfa Mehmood1
 Miriam Langguth1
 Eleftheria Maranou1
 Carlos R. Figueiredo1,3*
- 1Medical Immune Oncology Research Group (MIORG), Institute of Biomedicine, Faculty of Medicine, University of Turku, Turku, Finland
- 2Singapore National Eye Centre and Singapore Eye Research Institute, Singapore, Singapore
- 3InFLAMES Research Flagship Center, University of Turku, Turku, Finland
Immune Checkpoint Therapies (ICT) have revolutionized the treatment of metastatic melanoma. However, only a subset of patients reaches complete responses. Deficient β2-microglobulin (β2M) expression impacts antigen presentation to T cells, leading to ICT resistance. Here, we investigate alternative β2M-correlated biomarkers that associate with ICT resistance. We shortlisted immune biomarkers interacting with human β2M using the STRING database. Next, we profiled the transcriptomic expression of these biomarkers in association with clinical and survival outcomes in the melanoma GDC-TCGA-SKCM dataset and a collection of publicly available metastatic melanoma cohorts treated with ICT (anti-PD1). Epigenetic control of identified biomarkers was interrogated using the Illumina Human Methylation 450 dataset from the melanoma GDC-TCGA-SKCM study. We show that β2M associates with CD1d, CD1b, and FCGRT at the protein level. Co-expression and correlation profile of B2M with CD1D, CD1B, and FCGRT dissociates in melanoma patients following B2M expression loss. Lower CD1D expression is typically found in patients with poor survival outcomes from the GDC-TCGA-SKCM dataset, in patients not responding to anti-PD1 immunotherapies, and in a resistant anti-PD1 pre-clinical model. Immune cell abundance study reveals that B2M and CD1D are both enriched in tumor cells and dendritic cells from patients responding to anti-PD1 immunotherapies. These patients also show increased levels of natural killer T (NKT) cell signatures in the tumor microenvironment (TME). Methylation reactions in the TME of melanoma impact the expression of B2M and SPI1, which controls CD1D expression. These findings suggest that epigenetic changes in the TME of melanoma may impact β2M and CD1d-mediated functions, such as antigen presentation for T cells and NKT cells. Our hypothesis is grounded in comprehensive bioinformatic analyses of a large transcriptomic dataset from four clinical cohorts and mouse models. It will benefit from further development using well-established functional immune assays to support understanding the molecular processes leading to epigenetic control of β2M and CD1d. This research line may lead to the rational development of new combinatorial treatments for metastatic melanoma patients that poorly respond to ICT.
1 Introduction
Immune checkpoint therapies (ICT) can improve cancer patient survival by reinforcing the effector capabilities of antitumor T cells. Unfortunately, many patients are resistant to ICT. An important resistance mechanism to ICT is the lack of infiltration of antitumor immune cells, such as T lymphocytes, and higher frequency of immune-suppressive cells, such as myeloid-derived suppressor cells (MDSCs) (1). For that reason, these tumors are classified as immunologically “cold” tumors. Cold tumors are poorly immunogenic and often don’t respond to ICT. Immunologically “hot” tumors, however, have higher infiltration of antitumor T lymphocytes and are often more responsive to ICT (1).
The absence of tumor-infiltrating lymphocytes (TILs) and the presence of MDSCs in the tumor microenvironment (TME) can be the consequence of low tumor mutational burden (TMB). However, low TMB does not always translate into poor immunogenicity, and tumor-dependent resistance mechanisms may repress the generation of antitumor T cells leading to a lack of TILs (1). Resistance mechanisms associated with a deficient antigen presentation strongly impact the generation and expansion of tumor-specific T-cells. These mechanisms may be innate to the patients (refractory patients) or acquired (relapsed patients) after initial treatment (2, 3).
Tumors with innate or acquired resistance to ICT often develop features of cold tumors, such as lack of tumor-specific antigens, immune suppression, and low immune cell infiltration (1, 4, 5), governed by different cellular and molecular processes, including those impacting antigen presentation. For instance, the major histocompatibility molecules of class I and II (MHC-I and II), including their subcomponents, such as β2-microglobulin (β2M), encoded by the B2M gene in the human (6, 7). Evidence of ICT resistance shows that deficient β2M expression impacts the cell surface distribution of MHC-I, which impedes antigen presentation to the infiltrating antitumor cytotoxic T lymphocytes (CTLs) (2, 8).
However, MHC-I/II are not the only molecules responsible for presenting tumor antigens by antigen-presenting cells (APCs), and β2M has been previously described to interact with other MHC family molecules, such as CD1d, CD1b, and the neonatal Fc receptor FcRn (FCGRT gene) (9–12). Notably, the MHC-I-like protein CD1d is constitutively expressed by tumor and dendritic cells (DCs), responsible for the presentation of non-peptide antigens, such as lipids and small metabolites, to natural killer T (NKT) cells (13, 14). In addition, glycosphingolipids, such as the ganglioside GD3, have been demonstrated to contribute substantially to the immunogenicity of metastatic melanoma and are presented to NKT cells through CD1d by DCs, coordinating antitumor responses (15–19). More importantly, NKT cells have been recently described as a critical component of ICT-induced antitumor mechanism since these cells can also express immune checkpoint regulators, such as PD1 and others (20).
Taking into consideration recent findings on the epigenetic impact on β2M and associated faults in MHC-dependent peptide presentation leading to ICT resistance, we sought to investigate whether β2M deficiencies could also indicate deficiencies in other MHC family molecules, such as CD1d, and consequently, pointing a potential deficiency in the presentation of tumor glycoproteins and glycolipids as a contributing factor to ICT resistance. In this study, we revisited the tumor transcriptomic dataset of the skin cutaneous melanoma cohort (SKCM) of The Cancer Genome Atlas (TCGA) study (21), which is a part of The Genomic Data Commons (GDC). The GDC is a data-sharing platform developed by the National Cancer Institute (NCI) to support cancer research and hosts the TCGA project, which includes a large-scale collaborative effort to characterize the genomic and molecular features of multiple types of cancer, including melanoma. The TCGA datasets have been normalized and are ready to be used by integrated analysis platforms (such as Xena (22)) and re-published. In parallel, we revisited the publicly available transcriptomic datasets of different anti-PD1 metastatic melanoma cohorts (23–26) and concatenated the data using a TPM normalization protocol.
We evaluated whether the differential expression of B2M and its correlated genes (CD1D, CD1B, and FCGRT) is associated with poor responses to anti-PD1 in metastatic melanoma. We provide further evidence that epigenetic changes in the TME of melanoma tumors have a direct impact on B2M and an indirect impact on CD1D gene expression (through SPI1) but not on CD1B and FCGRT expression in melanoma patients from the TCGA dataset. This evidence suggests that methylation of B2M and SPI1 might impact antigen presentation to T and NKT cells, respectively, ultimately suppressing local antitumor immune responses. These findings introduce new resistance mechanisms to anti-PD1 ICT and promote the rational development of new combinations targeting the epigenetic control of DCs/NKT activation to overcome resistance to anti-PD1 ICT in metastatic melanoma.
2 Justification of the hypothesis
2.1 β2M physically interacts with proteins associated with the presentation of self and non-self-glycolipids and predicts their differential clustering in metastatic melanoma
β2M is an essential molecular partner of the MHC-I complex (HLA class I in human and MHC-I in mouse). Such physical interaction is critical for the HLA/peptide complex formation for further priming (presentation) to antitumor T cells. Therefore, we sought to analyze what other clusters of molecules could also physically interact with β2M and potentially have a functional impact on cancer immunity and ICT outcomes. First, we performed a protein-protein interaction network functional enrichment analysis of β2M with neighboring proteins using Search Tool for the Retrieval of Interacting Genes/Proteins (STRING) (27). STRING is a bioinformatics database and web resource that provides information about protein-protein interactions, functional associations, and networks to evaluate the interaction of new potential biomarkers and systems immunology. STRING collects and integrates data from various sources, including experimental studies, computational predictions, and public databases. In this study, STRING is used to predict protein-protein interactions, including direct (physical) and indirect (functional) associations.
The functional enrichment analysis reveals that β2M has more interactions among HLA-related proteins than expected for a random set of proteins of the same size and degree distribution drawn from the human genome, suggesting that initially obtained clusters of proteins are at least partially biologically connected as a group. Expected connectivity enrichment was added to a network of 20 proteins. The k-means clustering method was applied to the network revealing three main clusters of proteins (red, green, and blue clusters) (Figure 1A).
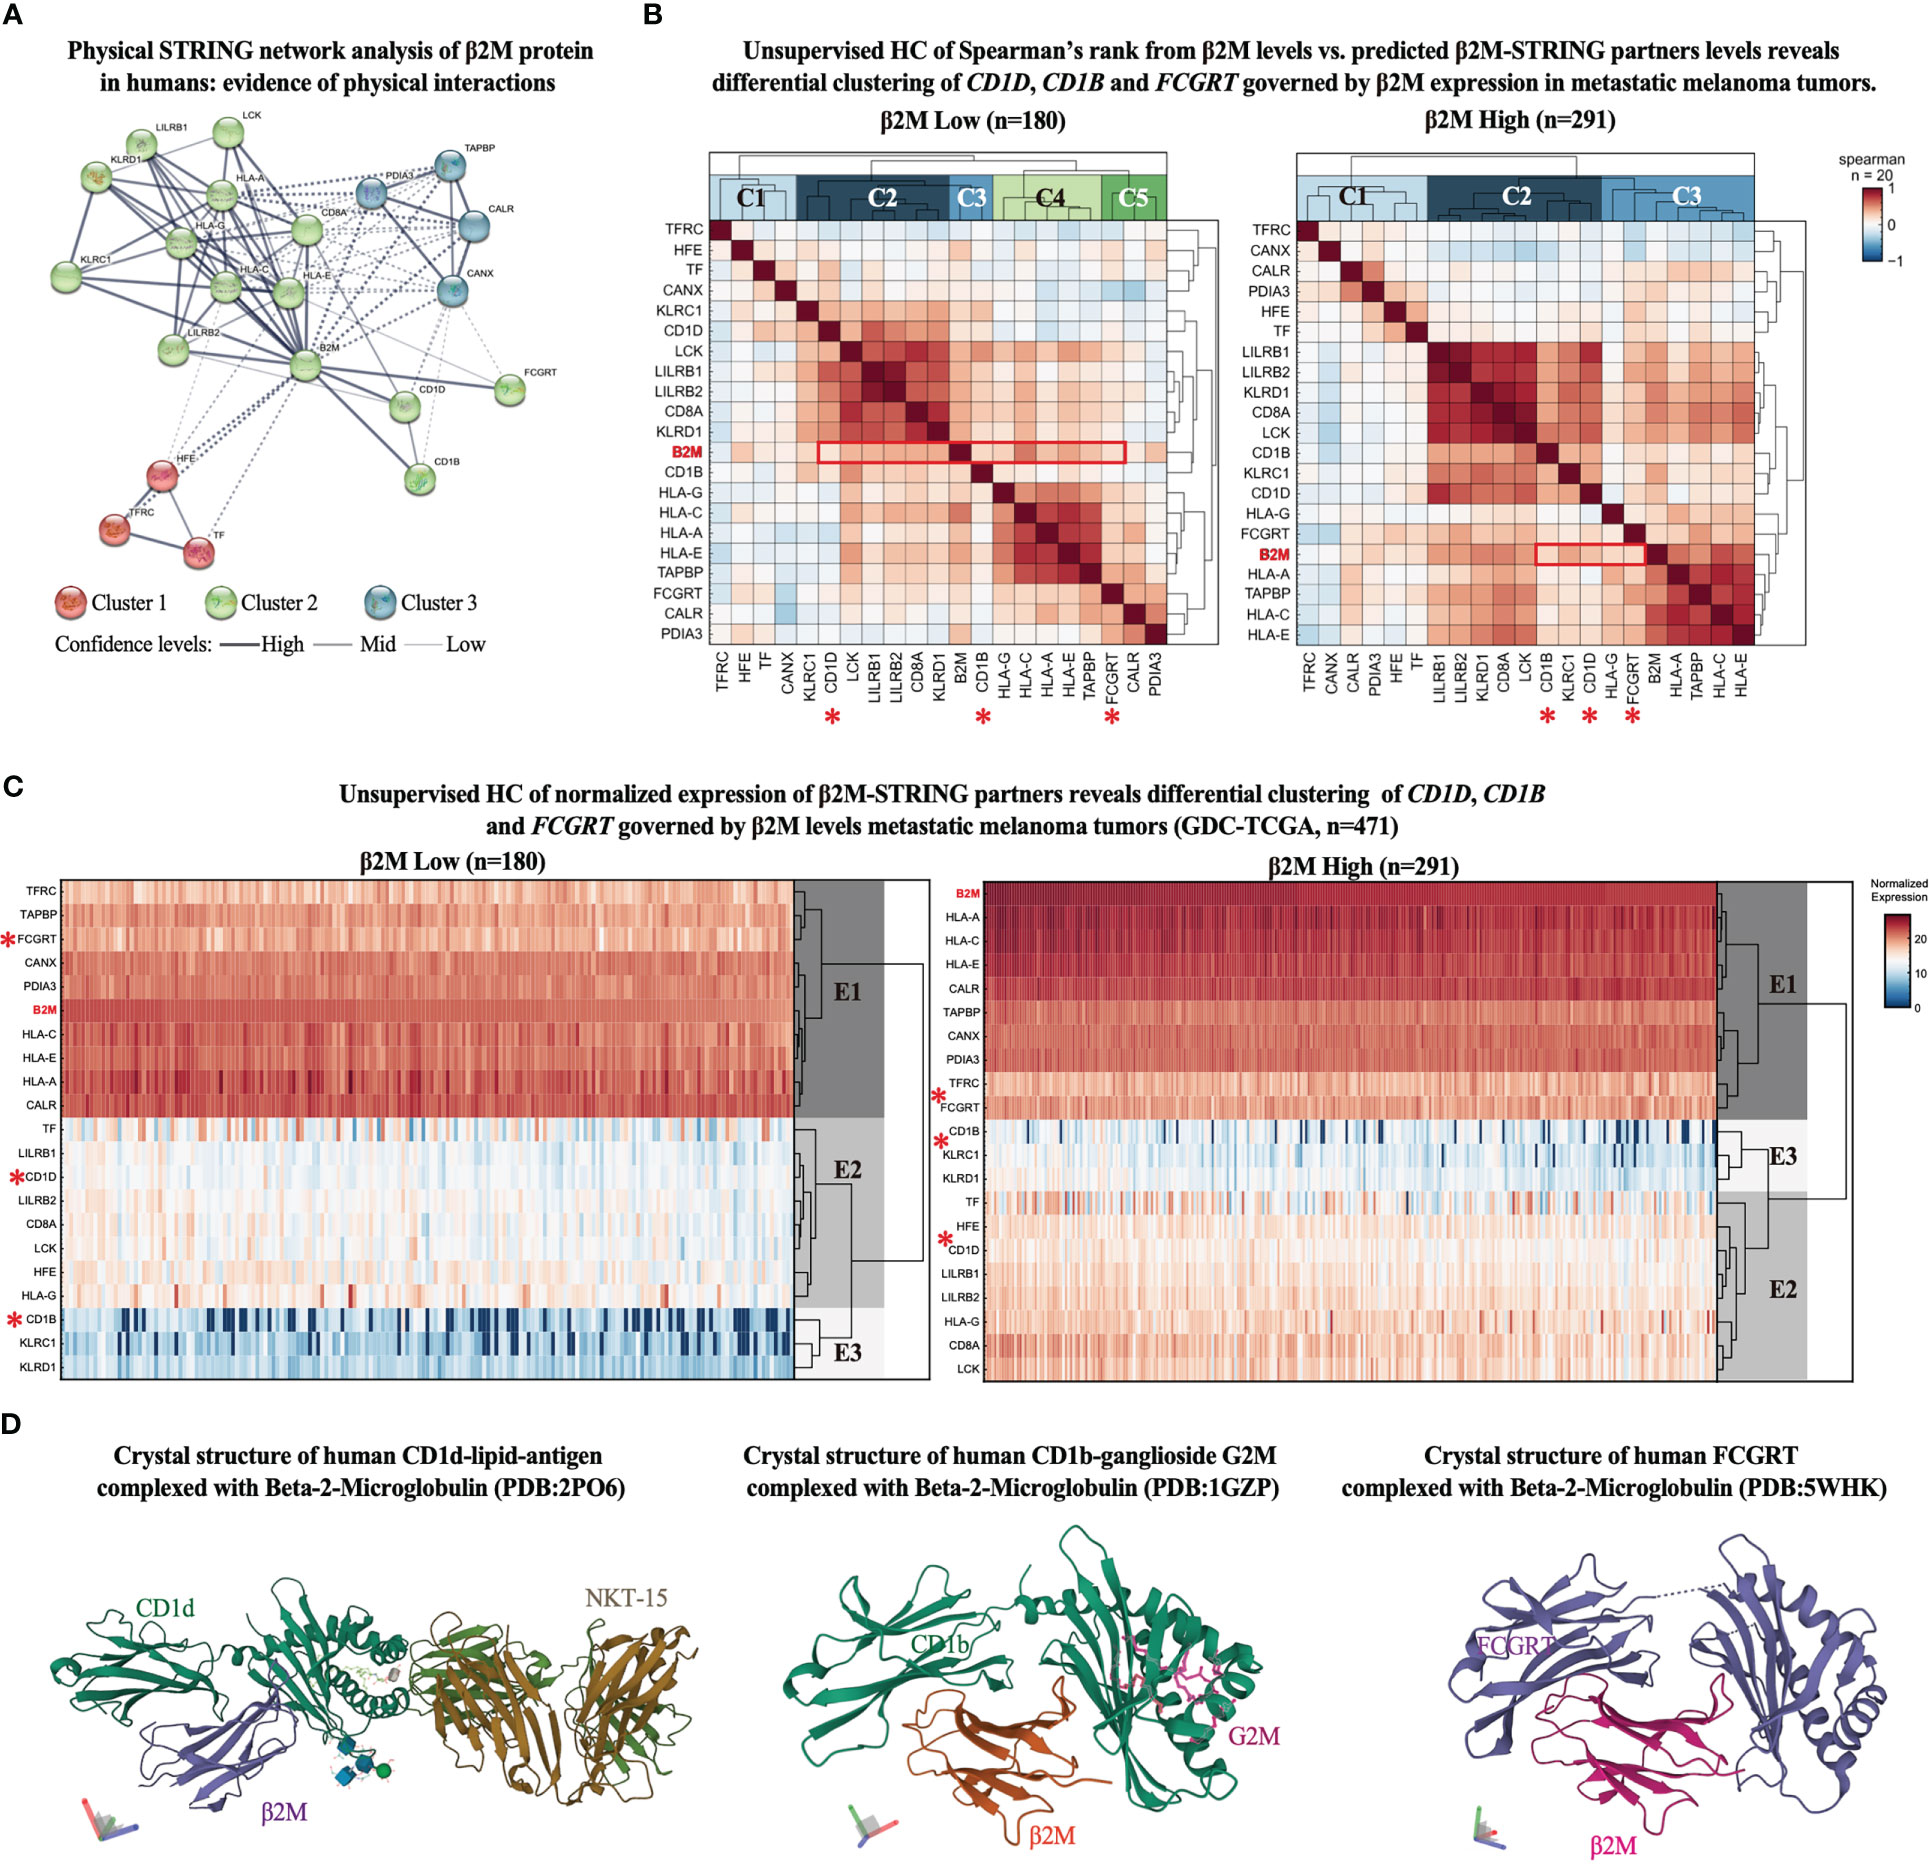
Figure 1 β2M expression associates with proteins responsible for antigen presentation of non-self-glycolipids in metastatic melanoma. (A) STRING network representation of human β2M-associated proteins. Edges indicate that the proteins are part of a physical complex distributed in the subnetwork. Line thickness indicates the strength of data support. The minimum required interaction score was set at 0.400. The k-means clustering method was used for network distribution to three clusters. Dotted lines represent edges between clusters. (B) Unsupervised hierarchical clustering (HC) of Spearman’s correlation scores between β2M expression levels and STRING-predicted β2M physical partners expression levels from metastatic melanoma samples from GDC-TCGA-SKCM study. Heatmaps represent positive correlation (up to 1, red), low correlation (close to 0, white), and negative correlation (up to -1, blue) scores in patients with low (left) and high (right) β2M expression. Expression cutoff: median of β2M expression in the cohort. (C) Unsupervised hierarchical clustering (HC) of STRING-predicted β2M physical partners. Columns are clustered using Euclidian/Ward metric/method. Paired color maps indicate raw expression values. (D) Crystal structure of β2M conjugated with CD1d (PDB: 2PO6), CD1b (PDB: 1GZP), and FCGRT (PDB: 5WHK) (28).
As expected, the main β2M interacting cluster comprises proteins associated with antigen presentation via HLA class I to T cell receptors. Different HLA class I types are found in the cluster, as well as LCK (lymphocyte-specific protein tyrosine kinase), a protein kinase with essential roles in the function of mature T-cells once activated via antigen presentation by HLA class I molecules, LILRB (leukocyte immunoglobulin-like receptor B), which recognizes a broad spectrum of HLA-A, HLA-B, HLA-C, and HLA-G alleles, and natural killer (NK) cell antigens (KLRD1 or CD94) and KLRC1 (killer cell lectin-like receptor C1), which recognizes HLA class 1 in NK cells (29–31).
Notably, three other proteins showed high interaction scores with β2M, and despite having similar biological functions (HLA-associated antigen presentation), they cluster in an opposing edge of the network (Figure 1A). These proteins include CD1d, CD1b, and FCGRT, which characterize an edge in the network responsible for binding self and non-self-glycolipids and presenting them to NKT cells. Other edges include clusters 1 and 3, which roles are associated with iron recycling metabolism in non-canonical T cell activation and conjugation with APCs (32, 33), and calcium-dependent interaction of MHC class I with transporter associated with antigen processing (TAP) (34), respectively. These findings highlight β2M antigen-presenting functions other than those strictly associated with HLA genes to be further investigated for their potential antitumor immune responses in ICT outcomes. Therefore, we focused our further analyses solely on the proteins of the opposing edge of cluster 2, which is functionally associated with the antigen presentation of glycolipids (CD1d, CD1b, and FCGRT) (12, 19, 35).
To evaluate whether the expression of CD1D, CD1B, and FCGRT is affected in a β2M-dependent manner in malignant melanoma, we first obtained the expression levels of all β2M-STRING-predicted interacting genes (n = 20) from the GDC-TCGA-SKCM study. Next, melanoma patients were sorted accordingly to B2M differential expression (high to low B2M expression). The median of B2M expression was used as a stratification cut-off. Then, we evaluated the correlation pattern of the expression levels of these genes across patients with high and low B2M expression and performed an unsupervised hierarchical clustering (HC) of the correlation scores, which indicates the clustering pattern of patients with high and low B2M levels (clusters C1, C2, C3, etc.). As observed in the correlation matrix of Figure 2B, different B2M-associated markers show a range of correlation scores from -1 to +1, including HLA and NK genes with high correlation scores with different markers. These scores are useful to provide sufficient complexity to the matrix for further unsupervised clustering analysis, of which purpose is not to evaluate markers with higher or lower correlation but ultimately to observe how the cluster identity of CD1D, CD1B, and FCGRT fluctuates in the context of patients expressing high and low B2M, providing further insight on whether antigen-presentation of glycolipids governed by these genes (12, 19, 35) could be impacted by B2M differential expression in melanoma.
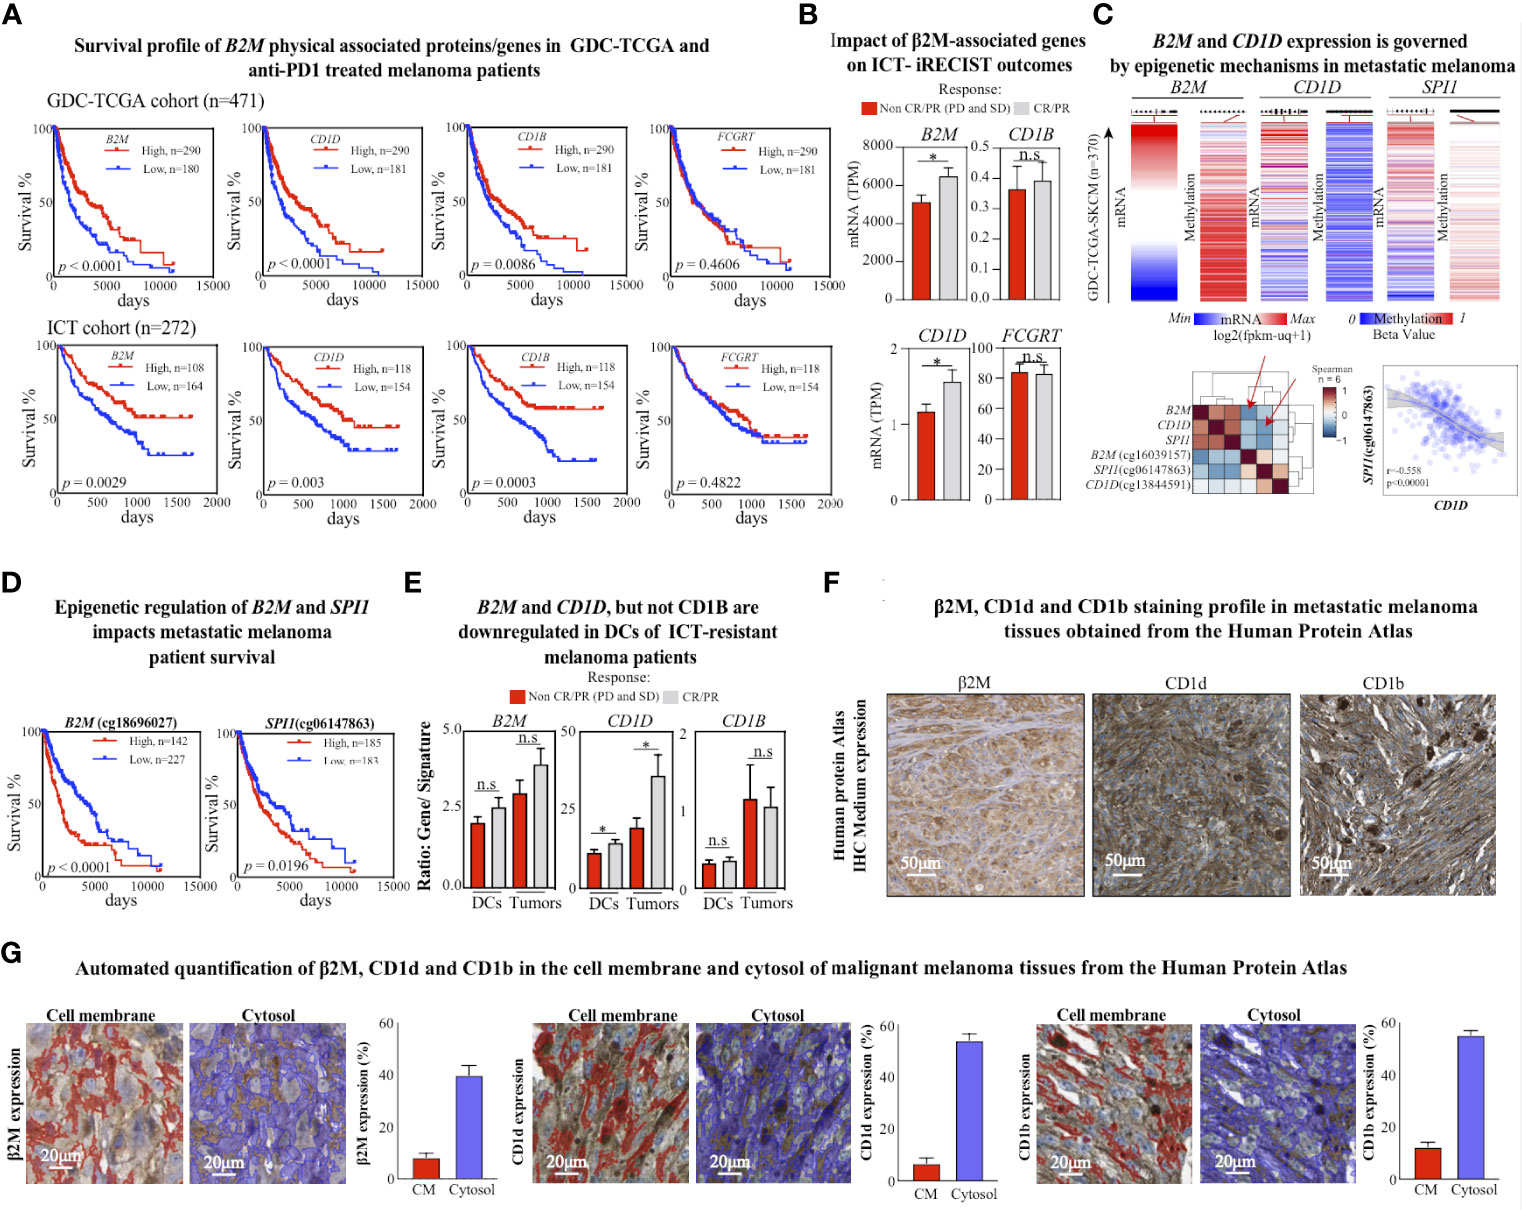
Figure 2 CD1d loss is associated with poor response to ICT. (A) Kaplan–Meier plots of overall survival for GDC-TCGA-SKCM metastatic melanoma cohort (upper panel) and anti-PD1 treated metastatic melanoma patients (bottom panel). The B2M low expression (blue lines) and high expression (red lines) groups were compared by the two-sided log-rank (Mantel-Cox) test. Cutoff curves were defined by their best fit in the Mantel-Cox test. (B) Expression levels of assigned genes (B2M, CD1D, CD1B, and FCGRT) in patients with metastatic melanoma treated with anti-PD1 ICT, responding or not responding to anti-PD1 treatment (pretreatment biopsies, n = 271). Two-tailed, unpaired t-test (* p < 0.05; n.s.: not significant). (C) Normalized mRNA expression and methylation beta levels obtained from Illumina Human Methylation 450 from GDC-TCGA-SKCM study. Methylation heatmaps were obtained from the promoter region of the corresponding gene. The lower left heatmap shows the euclidean distribution of Spearman’s rank correlation between normalized gene HTseq-FPKM-UQ scores and Illumina Human Methylation 450 beta values from the GDC-TCGA-SKCM study. Red arrows indicate significant negative correlation scores between B2M and cg cg18696027 methylation scores from B2M, and between CD1D and cg06147863 methylation scores from SPI1. The lower right plot shows the sigmoidal Pearson correlation curve between SPI1 and the methylation in the SPI1 promoter region. (D) Kaplan–Meier plots of overall survival for the GDC-TCGA-SKCM metastatic melanoma cohort for methylation levels of B2M and SPI1 genes in their promoter regions. The low methylation (blue lines) and high methylation (red lines) groups were compared by the two-sided log-rank (Mantel-Cox) test. Cutoff curves were defined by their best fit in the Mantel-Cox test. (E) Comparison of gene expression (B2M, CD1D, and CD1B) and cell signature (DCs and melanoma cells) rations between metastatic melanoma responders and non-responders to ICT. Two-tailed, unpaired t-test (*p < 0.05; n.s.: not significant). Response defined by clinical criteria. (F) Immunohistochemistry representation of positive stainings for β2M, CD1d, and CD1b in malignant melanoma tissues were obtained from the Human Protein Atlas. β2M antibody code: CAB002572 and patient ID: 744. CD1d antibody code: CAB016107 and patient ID: 1369. CD1b antibody code: HPA021824 and patient ID: 1369. (G) Representative images of quantified tissue areas and automated quantification of β2M, CD1d, and CD1b expression in the cell membrane (in red) and cytosol (in blue) of malignant melanoma tissues from the Human Protein Atlas.
Patients with high B2M expression have a correlation diversity represented by clusters C1, C2, and C3 (Figure 1B, right correlation heatmap), and patients with B2M loss have higher correlation diversity, represented by clusters C1, C2, C3, C4, and C5 (Figure 1B, left correlation heatmap). We observed that gene B2M correlation scores with CD1D, CD1B, and FCGRT is located in different clusters between patients with high and low B2M expression. B2M and CD1B correlation score ranks in cluster C2 from patients with high B2M expression, as opposed to cluster C3, from patients with low B2M expression.
Similarly, B2M and FCGRT correlation scores shift from cluster C3 (patients with high B2M expression) to cluster C5 (patients with low B2M expression). CD1D, however, remains in the correlation cluster C2 in both groups. We also performed an HC analysis of the expression scores of these genes across patients with high and low B2M expression. Although CD1D, CD1B, and FCGRT are distributed in the same expression clusters (E1, E2, and E3), there is an evident dispersion of their expression score in the heredogram cluster, which can be explained by the downregulation of these genes in patients with B2M expression loss (Figure 1C). Since CD1D, CD1B, and FCGRT distribution across correlation (C) and expression (E) clusters are dispersed following B2M differential expression, these findings indicate that the expression levels of these genes and their association may be impacted in the same biological context governing B2M differential expression in melanoma.
Further representation of the molecular interaction of β2M with CD1d, CD1b, and FCGRT was obtained from the Protein Data Bank (PDB), in which the crystal structure of β2M with CD1d, CD1b, and FCGRT was previously determined (Figure 1D). Altogether, findings suggest that loss of β2M expression may not only play an important role in MHC-I deficiency as a mechanism of immunosuppression and ICT resistance (2, 8), but also impact other important β2M-dependent biological processes, such as the ones related to non-classical MHC proteins (CD1d, CD1b, and FCGRT) are potentially impacted by β2M loss and may contribute to ICT resistance.
2.2 CD1d downregulation is associated with poor metastatic melanoma outcome and resistance to ICT
Since β2M is an essential component of MHC-I antigen presentation to CD8+ T cells in the context of tumor immunity (36), and downregulation of HLA-I has been associated with deficient expression of β2M in ICT-resistant metastatic melanoma patients (8), we sought to evaluate whether CD1d, CD1b, and FCGRT, could also be associated with β2M-dependent ICT resistance. An expanded analysis of the GDC-TCGA-SKCM study confirmed that loss of B2M is significantly associated with poor survival outcomes (Figure 2A, upper panel). Then, we normalized and combined four transcriptomic publicly available cohorts of metastatic melanoma patients receiving anti-PD1 therapies and evaluated the survival responses regarding B2M differential expression. We confirmed that B2M loss is also strongly associated with reduced survival in patients treated with anti-PD1 therapies (Figure 2A, lower panel). Notably, a similar pattern of survival outcome was also observed for CD1D and CD1B expression profiles but not for FCGRT (Figure 2A). These findings suggest that loss of B2M may not only impact the biological processes related to the priming of CD8+T cells but also impact other β2M-dependent biological processes, such as CD1-associated antigen presentation, contributing to ICT resistance.
We performed an alternative analysis of the differential expression of CD1D, CD1B, and FCGRT between responders (CR and PR) and non-responders (SD and PD) to ICT outcome as previously described (37). Notably, only CD1D and B2M differential expression significantly predict response to anti-PD1 following the clinical response criteria (Figure 2B). These findings reinforce a potential CD1D-dependent role associated with B2M loss in ICT-driven resistance rather than solely regulating the priming of CD8+ T cells through MHC class-I. Indeed, previous evidence suggests that B2M is important to provide physical stability to CD1d protein and that downregulation of B2M would drive the CD1d degradation (38).
Similar survival outcome predictions by B2M and CD1D suggest that differential expression of these genes might be governed by a shared mechanism of gene expression control rather than solely a protein-protein relationship. Epigenetic changes have been suggested as a general mechanism of gene expression control in the context of the ICT resistance (2), such as DNA methylation, which recruits proteins to repress gene expression or inhibits the binding of a transcription factor to the DNA (39).
Studies from the past decade have shown that epigenetic mechanisms largely influence the fate of immune cell differentiation in the cancer (40). Moreover, previous evidence shows that DNA methylation predicts response to ICT in metastatic melanomas (41). Therefore, we sought to evaluate whether B2M and CD1D gene expression is governed by epigenetic changes associated with DNA methylation in the tumor microenvironment of melanoma. We revisited the methylome profile of metastatic cutaneous melanoma patients from the GDC-TCGA study. We observed that the expression of B2M is negatively correlated with increased methylation of the promoter region cg18696027 (Figure 2C, upper panel), which is also significantly associated with a poor survival response to ICT (Figure 2D, left).
Interestingly, CD1D differential expression control is not correlated to differential methylation in the promoter region of CD1D (Figure 2C, upper panel). However, we found that the differential expression of the transcription regulator of CD1D, the transcription factor SPI1, is negatively correlated with methylation levels at the promoter region (Figure 2C, upper panel), which is also significantly associated with a poor survival response to ICT (Figure 2D, right). These findings suggest that epigenetic changes in the TME might directly impact the expression of B2M and indirectly impact the expression of CD1D through SPI1 regulation.
Next, we evaluated whether B2M, CD1D, and CD1B differential expression are impacted at the tumor cells or DCs levels in the TME. Using previously validated immune gene signatures from bulk RNA datasets to estimate immune cell abundances (42), we found that B2M and CD1D but not CD1B were significantly enriched on both tumor and DCs cells from patients responding to ICT (Figure 2E). Evidence of the expression profile of β2M, CD1d, and CD1b in melanoma tissues can be found in the Human Protein Atlas collection. Representative regions of positively stained melanoma tissues are shown, where the cell nuclei are labeled in blue color, and the protein is stained with brown color (Figure 2F). According to the atlas annotation, β2M, CD1d, and CD1b proteins are predominantly expressed in the cell cytoplasm and membrane. The expression levels of these markers were then quantified as described previously (43). As opposed to the cell membrane region, β2M, CD1d, and CD1b were mostly expressed in the cytosol of malignant melanoma tissues (Figure 2G). The frequencies of positively stained areas of the cell membrane and cytosol within the tumor tissue are as follows: β2M 8.2% (cell membrane) and 39.84% (cytosol); CD1d 6.72% (cell membrane) and 53.83% (cytosol); and CD1b 12.39% (cell membrane) and 55.18% (cytosol) (Figure 2G). These findings suggest that the expression profile of these genes in cellular components of the TME may be a critical step to engage innate cellular mechanisms of response to ICT, with potential further consequences, such as NKT cell activation.
The differential expression of CD1D and SPI1 genes and their impact on ICT outcome was further confirmed in the microarray dataset of tumors, and TME obtained from mice with resistance or response to anti-PD1 ICT, as previously described (44). From this dataset, we observed no differences in the expression profile of these genes within the tumors of mice with and without resistance to anti-PD1 ICT (Figure 3A, left). However, CD1D and SPI1, but not B2M, are significantly downregulated in the TME of anti-PD1 resistant mice (Figure 3A, right). Moreover, in the TME level, B2M shows a slight increase in the anti-PD1 resistant group, which does not support the results obtained from the human dataset, potentially given to natural differences existing cross-species (mouse and human), at least in the level of B2M.
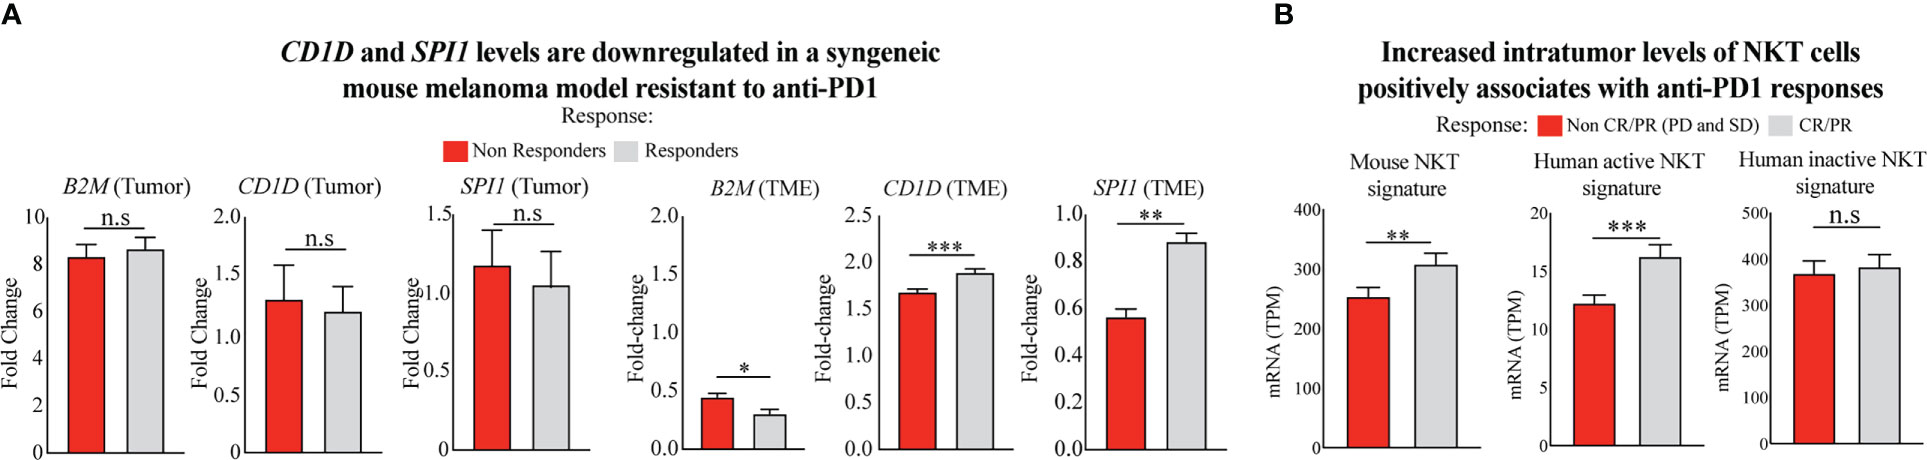
Figure 3 Poor response to ICT given is associated with reduced levels of intratumor NKT cells. (A) Comparison of gene expression of CD1D (CD1d1 in mouse) and SPI1 in the TME of anti-PD1 responsive and non-responsive mouse models (44). Two-tailed, unpaired t-test (***p < 0.0001; **p < 0.001; *p < 0.05; n.s., not significant). (B) Comparison of NKT cell levels using multigene NKT signature validated pairwise by the mouse model in bulk and single-cell datasets (45) and human active (stimulated) and inactive (unstimulated) NKT cell signature (46). Differential signature expression is shown between metastatic melanoma patients responding and not responding to anti-PD1 therapy. Patient samples were included from the integrated cohort of human melanoma patients receiving mainly anti-PD1 immunotherapies (23–26). Responders and non-responders to ICT were stratified using RECIST V1.1 (47) and iRECIST (48) criteria. Two-tailed, unpaired t-test (***p < 0.0001; **p< 0.001; n.s., not significant).
CD1d expression is crucial for presenting glycoprotein and glycolipid antigens to NKT cells (19). As a result, NKT cells become activated and exhibit enhanced survival and proliferative capacity in response to α-GalCer-mediated activation (49). Therefore, we interrogated the transcriptome of tumor biopsies from the integrated cohort of human melanoma patients before receiving anti-PD1 immunotherapies (23–26) to evaluate potential differences in intratumor NKT cell levels. We used the metagene expression values of the NKT cell signature to perform this analysis as previously described (45). First, we used an NKT cell signature validated in bulk and single-cell RNA datasets from healthy mouse tissues, including skin, lymph nodes, and lungs (45), the preferential sites for metastatic melanoma development. When interrogating the expression levels of this multigene signature in our combined cohort of anti-PD1 treated melanoma patients, we found that anti-PD1 responsive patients show significantly higher intratumor levels of NKT cell signature instead of non-responsive patients (Figure 3B, left). Since recent evidence has shown that innate immune cells have shared developmental programs in mice and humans (50), we also performed a similar analysis using human multigene signatures from stimulated and unstimulated human NKT cells described elsewhere (46), and with shared gene composition found in the mouse signature. Interestingly, we observed that only the multigene signature from human NKT cells previously stimulated and with an active phenotype are upregulated in patients responding to anti-PD1 therapy (Figure 3B, center), as opposed to the signature from unstimulated-inactive NKT cells (Figure 3B, right). These findings suggest that NKT cells with an active phenotype may display an important role following anti-PD1 therapies in patients with malignant melanomas, given their known antitumor properties, in which activation and frequency levels might be controlled by epigenetic changes regulating B2M, SPI1, and CD1D expression in anti-PD1 resistant tumors.
3 Discussion
In this article, we revisited the molecular interaction of β2M with CD1d, CD1b, and FCGRT and its implication for ICT response. Evidence for a new mechanism of ICT resistance is provided by differential expression of β2M/CD1d axis dependent on epigenetic alterations in the TME of metastatic melanoma, which is significantly associated with poor outcomes of metastatic melanoma patients receiving anti-PD1 immunotherapies (Figure 4).
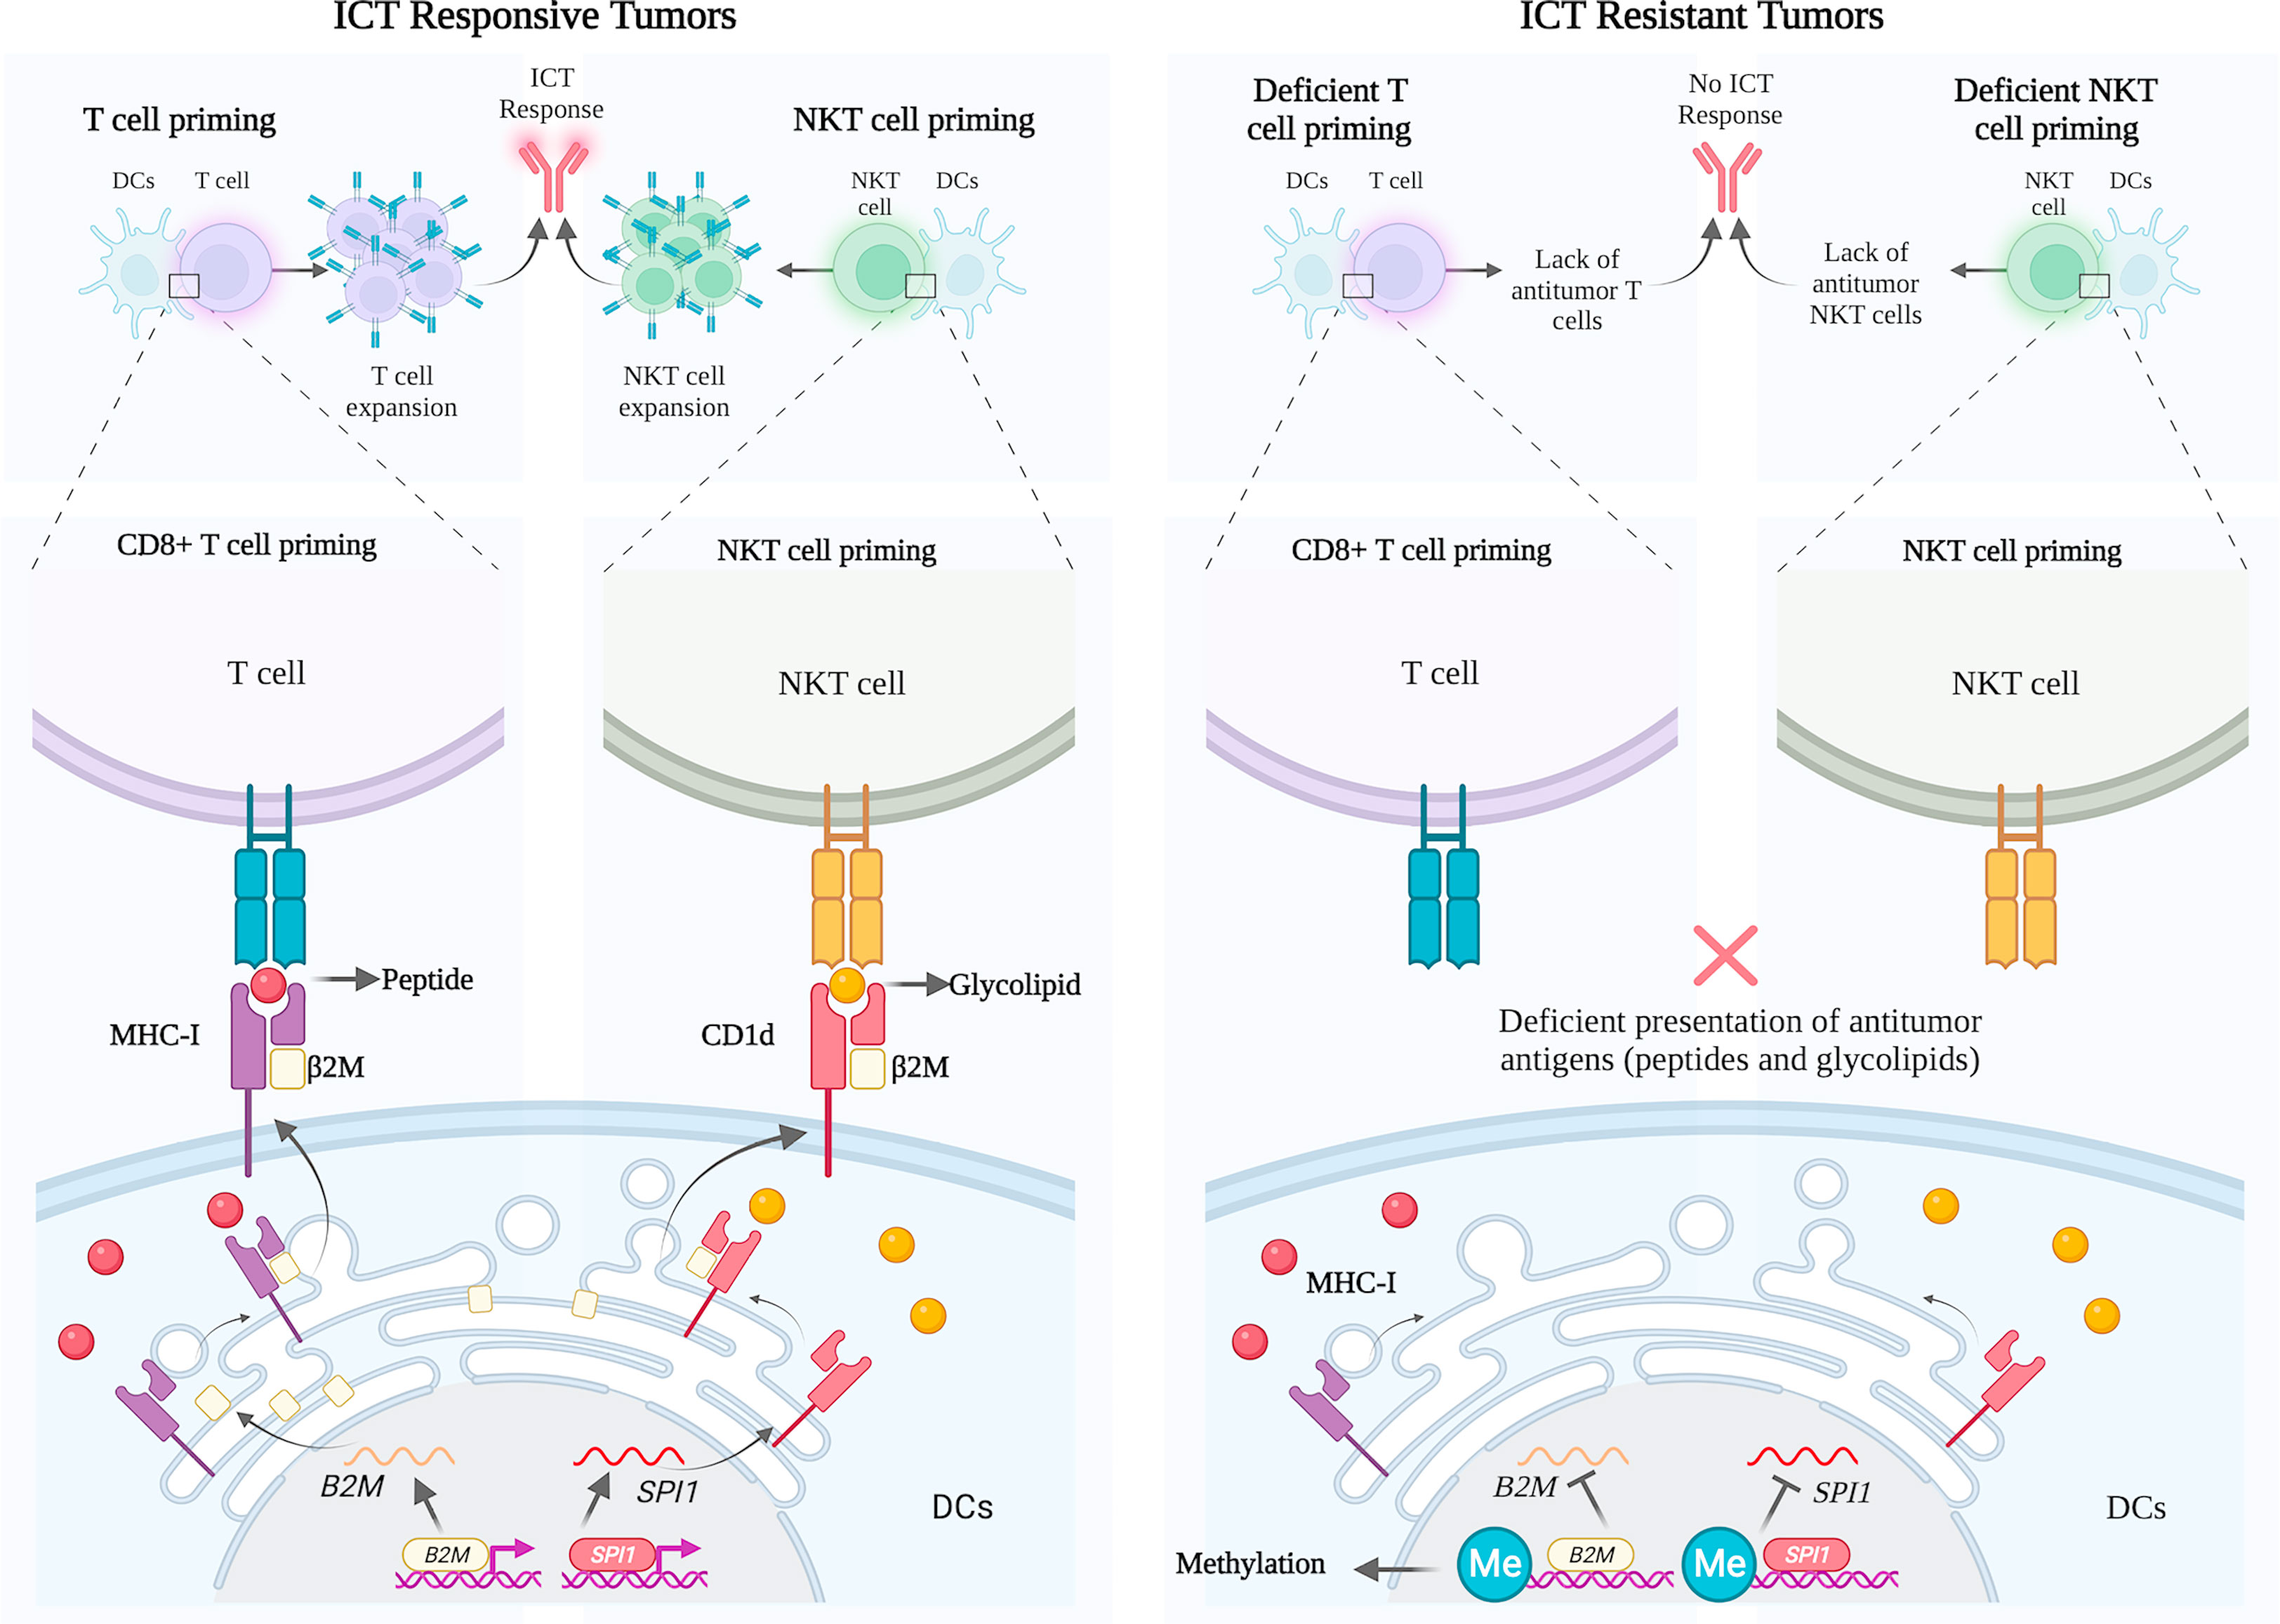
Figure 4 Schematic representation of B2M and CD1D expression profile in ICT responsive and resistant melanoma tumors. Left panel: Successful priming of T cells and NKT cells by dendritic cells with the physiological engagement of β2M with MHC and CD1d, respectively. Right panel: Deficient priming of T cells and NKT cells by dendritic cells given to methylation of promoter regions of B2M and SPI1, respectively, in patients not responding to ICT.
Existing evidence of physical interactions between β2M with CD1d, CD1b, and FCGRT suggests that these interactions may play an important functional role in the context of APCs, supported by the fact that β2M deficiencies significantly reduce the tumor antigen presentation via MHC-I, resulting in poor ICT outcome (2). Indeed, In the absence of β2M protein, CD1d can be transported to the cell surface independently, and glycosylation patterns of CD1d drive its rapid degradation to an immature glycoprotein state (38).
Antigen presentation is a critical stage in eliciting anti-tumor responses by ICT (51), which is not restricted to tumor peptides presented via MHC molecules to T cells, but includes antigen presentation via MHC-associated molecules, such as β2M and CD1d, which presents non-peptide (glycolipid) antigens, such as α-galactosylceramide (αGalCer), to antitumor NKT cells (52, 53). β2M deficiency causes downregulation of MHC-I expression and deficient CD1d-dependent NKT cells leading to complex immunodeficiency clinically (54). We hypothesize that the presentation of antigens to NKT cells, which depends on β2M/CD1d, is critically important for ICT clinical benefit.
Supporting this hypothesis, studies have shown that activation of NKT cells can lead to improved outcomes in mice and patients receiving ICT, mainly manifested by the increase of IL-2 (Interleukin 2) and IL-12 (Interleukin 12) by NKT cells upon CD1d stimulation by αGC in APCs, reinvigorating exhausted CD8 T cells in synergism with anti-PD1 therapies in tumor-bearing mice and patients with cancer (55). Indeed, NKT effector functions comprise abundant cytokine released upon activation (56), which in turn, reinvigorates other cytotoxic immune cells and effector responses of CD8+ T cell (57, 58). PMA/ionomycin stimulated NKT cells (as the ones profiled using human signatures in the anti-PD1 cohort of this study) previously presented to α-GalCer antigen through DCs-expressing CD1d, have been described to enhance the expression of IFN-γ, which ultimately impacts cancer immune microenvironment by increasing iNOS+CD206- M1 macrophage levels for melanoma control growth (59).
As a direct target of anti-PD1 therapy, little information is available about exhausted NKT cells in the tumor microenvironment. However, recent studies using the E0771 breast cancer and B16 melanoma models have found that in the later cancer stages, NKT cells have impaired cytotoxic capacities manifesting an exhausted phenotype (60). In addition, increased levels of total NKT cells have been observed in biopsies from anti-PD1 responding patients (61, 62). Therefore, molecular mechanisms driving NKT generation and proliferation, such as the antigen presentation of glycolipids and glycoproteins, should be characterized in melanoma biopsies to orient the development of new combinatory therapies.
CD1D differential expression is associated with metastatic melanoma patient survival outcomes from our analysis. Consistent with our finding, downregulation of CD1D has been documented in many cancer types, such as breast (63) and cervical carcinoma (64), and was associated with poor survival outcomes (65). Using non-small cell lung cancer (NSCLC) cells as a model, the downregulation of CD1D expression demonstrated limited NKT activities achieved by epigenetic modifications in those tumors (66, 67).
Indeed, cancer-specific changes in DNA methylation and histone acetylation result in pro-tumorigenic functions and repression of tumor suppressor genes (68) and have been associated with ICT resistance (2). Methylation levels of the gene SPI1 promoter region indirectly controlled CD1D gene expression. There are currently no reported studies investigating the relationship between SPI1 gene expression and resistance to ICT in melanoma., but this gene is downregulated and methylated in more than 70% of lymphoma patients (69).
Therefore, epigenetic therapeutic strategies that have been observed to improve ICT and modulate NKT cell responses, such as HDAC inhibitors, might mechanistically promote the increase in B2M and CD1D expression to support antigen presentation and generation of T cells and NKT cells (70–72).
The strength of our study is that it includes a robust combination of four transcriptomic datasets of anti-PD1 immunotherapies, compared with the TCGA dataset and a model of metastatic melanoma resistant to anti-PD1 therapy. However, a limitation of our study is the absence of in vitro and ex vivo validation using well-established functional immune assays, which are now considered to validate these findings and develop new therapeutic opportunities by our group.
In conclusion, this study conceptualizes the importance of further investigating therapeutic strategies to restore CD1D expression in metastatic melanoma by targeting epigenetic modulators in the TME. Restored expression of CD1D can be further compared with the effector functions of NKT cells and survival outcomes in preclinical and clinical research. Moreover, our findings point to new horizons for the rational development of combinatory approaches that block epigenetic mechanisms of suppression in the TME to restore DCs-dependent antigen presentation to NKT cells, which can lead to better responses to anti-PD1 immunotherapies in metastatic melanomas.
4 Materials and methods
4.1 Human cohort RNA-seq data sets and analysis
The mRNA expression and survival data of The Cancer Genome Atlas SKCM GDC dataset were downloaded from the Xena Functional Genomics Explorer of the University of California, Santa Cruz (https://xenabrowser.net/datapages/and https://xenabrowser.net/heatmap/) (73). The Genomic Data Commons (GDC) legacy archive obtained samples with methylation. The methylation sites tested are listed as follows: B2M (cg18696027), SPI1 (cg06147863), and CD1D (cg13844591). Generated data were extracted in tab‐separated values (TSV) format. RNA-seq datasets from all patients receiving immune checkpoint therapies were collected from anti-PD1 Riaz cohort (23) (access numbers: GSE91061 and SRP094781), anti-PD1 and anti-PD1/anti-CTLA4 Gide cohort (25) (access number: PRJEB23709), anti-PD1 Hugo cohort (26) (access number: GSE78220) and anti-PD1 Liu cohort (24) (access number: phs000452.v3.p1), available at Gene Expression Omnibus (GEO), Sequence Read Archive (SRA), European Nucleotide Archive (ENA) and database of Genotypes and Phenotypes (dbGaP). The downloaded SRA files were converted into FASTQ files using SRA-Toolkit (2.11.0). The quality of the sequenced reads was observed using FastQC (v0.11.9) tool (74). Transcript per Million (TPM) values were quantified using the human reference genome (GRCh38) and Kallisto (v0.48.0) (75). The transcript per million (TPM) values from the Liu dataset are also available in the Supplementary Data of the original publication (24). The TPM values of all the ICT cohorts were adjusted for batch correction using the R package ComBat-seq (76). Since it is our goal to measure the efficacy of responses based on the tumoricidal potential of effector immune cells, such as NKT cells, as described elsewhere (37), in our study, we consider Overall Response Rates (ORR) and not disease control (DC), to define the group of patients responding to the tumoricidal effects of ICT, and not cytostatic effects, accordingly to pre-established measurement guidelines (77). For this purpose, the response criteria include partial (PR) or complete response (CR) to patients responding to ICT, and stable disease (SD) and progressive disease (PD) to patients not responding to ICT. Riaz (23), Gide (25) and Liu (24) cohorts define response patterns using Response Evaluation Criteria for Solid Tumors version 1.1 (RECIST V1.1) (47), and Hugo cohort (26) uses the Immune-Related Response Evaluation Criteria for Solid Tumors (iRECIST) (48). SD patients from irRECIST cohorts (Hugo et al) were not included in this study due to the absence of transcriptomic data from these patients.
NKT cell expression was compared in responder and non-responder groups from the integrated ICT cohorts (23–26). Mouse NKT multigene signature was identified in a preclinical mouse model by screening the top 30 upregulated genes highly expressed in NKT cells enriched from the skin, lymph nodes, and lungs, which was validated in bulk and single-cell datasets (45). Human active and inactive NKT signatures were identified by analyzing matched signature components presented in a single-cell signature from stimulated and unstimulated human NKT cells (46), also present in the mouse signature. Overall survival was evaluated with survival and survminer package using a quartile range from 0.25 to 0.75 that obtained the minimum p-value. Survival was visualized as Kaplan-Meier (Log-rank) plots.
4.2 RNA Microarray analysis from preclinical ICT resistance melanoma model
Microarray data of tumor cells and TME from responding and non-responding mice to ICT were retrieved from the GEO database (number GSE122222 (44). The raw mRNA expression data were firstly normalized using a list of housekeeping genes (CHMP2A, PSMB2, PSMB4, REEP5, SNRPD3, VCP, VPS29) as previously described (78). The transcriptomic expression of tumor cells and TME were then calculated by averaging the normalized value by each housekeeping gene. Fold change analysis was performed as previously described (79).
4.3 Immunohistochemistry analysis
The Human Protein Atlas database provides the immunohistochemistry (IHC) protein staining for 15287 genes in 20 cancer types (80). For cutaneous melanoma tissues, the fraction of samples with protein expression levels is provided with 3, 3’-diaminobenzidine (DAB) staining in amelanotic areas. Scale bars indicate 50 and 20 μm in length. The protein expression level of β2M, CD1d, and CD1b in the cell membrane and cytosol were quantified using an automated machine learning quantification method based on marker intensity, color, density, and object size and circularity, as described previously (43). The frequency (%) of positive expression relative to the total area is represented by bar plots indicating Means ± Standard Error of Mean (SEM) from five independent quantified tissue areas from melanoma tissues.
4.4 Quantifications and statistical analysis
Graphpad prism 9.0 software was used for statistical analysis. The Shapiro-Wilk normality test was performed for all data sets to guide statistical tests. Unpaired two-tailed Mann-Whitney U test (non-parametric) was used with non-normally distributed samples group analysis. Non-parametric two-tailed Spearman’s correlation test was applied to non-normally distributed samples, and Pearson’s correlation test was applied to normally distributed samples. Graphpad prism 9.0 was used to generate all Kaplan Meier survival plots. The survival log-rank test was used to evaluate the significance of survival curves providing X2 (chi-squared) and p values. Differences were considered significant when p < 0.05. The two-tailed, unpaired t-test is used to determine whether there is a significant gene expression difference between independent groups. Z score transformation of transcriptomic data and heat cluster data analysis was performed using InstantClue (81).
Data availability statement
The original contributions and data availability presented in the study are publicly available datasets and are referenced in the article. Further inquiries can be directed to the corresponding author.
Author contributions
MW: Conceptualization, data curation, formal analysis, investigation, visualization, methodology, writing–review, and editing. SK: Data curation, software, formal analysis, validation, investigation, methodology, writing–review, and editing. AM: Data curation, software, formal analysis, and validation. ML and EM: writing–review and editing. CF: Conceptualization, data curation, formal analysis, supervision, funding acquisition, validation, methodology, writing-original draft, supervising the research. All authors contributed to the article and approved the submitted version.
Funding
This study was funded by the Academy of Finland (Figueiredo, CR), Emil Aaltonen Foundation (Figueiredo, CR), Sigrid Jusélius Foundation (Figueiredo, CR), InFlames Flagship (Figueiredo, CR).
Acknowledgments
We thank the Institute of Translational Medicine for supporting the metabolomics studies. Immunohistochemistry staining was performed by the Liverpool Ocular Oncology Centre (LOOC). We acknowledge The Cancer Genome Atlas (TCGA) for providing access to publicly available genomic datasets useful in discovering and validating our findings.
Conflict of interest
The authors declare that the research was conducted in the absence of any commercial or financial relationships that could be construed as a potential conflict of interest.
Publisher’s note
All claims expressed in this article are solely those of the authors and do not necessarily represent those of their affiliated organizations, or those of the publisher, the editors and the reviewers. Any product that may be evaluated in this article, or claim that may be made by its manufacturer, is not guaranteed or endorsed by the publisher.
References
1. Sharma P, Siddiqui BA, Anandhan S, Yadav SS, Subudhi SK, Gao J, et al. The next decade of immune checkpoint therapy. Cancer Discovery (2021) 11(4):838–57. doi: 10.1158/2159-8290.CD-20-1680
2. Jenkins RW, Barbie DA, Flaherty KT. Mechanisms of resistance to immune checkpoint inhibitors. Br J Cancer. (2018) 118(1):9–16. doi: 10.1038/bjc.2017.434
3. Pitt JM, Vétizou M, Daillère R, Roberti MP, Yamazaki T, Routy B, et al. Resistance mechanisms to immune-checkpoint blockade in cancer: Tumor-intrinsic and -extrinsic factors. Immunity (2016) 44(6):1255–69. doi: 10.1016/j.immuni.2016.06.001
4. Chen DS, Mellman I. Elements of cancer immunity and the cancer-immune set point. Nature (2017) 541(7637):321–30. doi: 10.1038/nature21349
5. Hanley CJ, Thomas GJ. T-Cell tumour exclusion and immunotherapy resistance: a role for CAF targeting. Br J Cancer. (2020) 123(9):1353–5. doi: 10.1038/s41416-020-1020-6
6. Li L, Dong M, Wang XG. The implication and significance of beta 2 microglobulin: A conservative multifunctional regulator. Chin Med J (Engl). (2016) 129(4):448–55. doi: 10.4103/0366-6999.176084
7. Wang C, Wang Z, Yao T, Zhou J, Wang Z. The immune-related role of beta-2-microglobulin in melanoma. Front Oncol (2022) 12:944722. doi: 10.3389/fonc.2022.944722
8. Sade-Feldman M, Jiao YJ, Chen JH, Rooney MS, Barzily-Rokni M, Eliane JP, et al. Resistance to checkpoint blockade therapy through inactivation of antigen presentation. Nat Commun (2017) 8(1):1136. doi: 10.1038/s41467-017-01062-w
9. Castaneda DC, Dhommée C, Baranek T, Dalloneau E, Lajoie L, Valayer A, et al. Lack of FcRn impairs natural killer cell development and functions in the tumor microenvironment. Front Immunol (2018) 9:2259. doi: 10.3389/fimmu.2018.02259
10. Borg NA, Wun KS, Kjer-Nielsen L, Wilce MC, Pellicci DG, Koh R, et al. CD1d-lipid-antigen recognition by the semi-invariant NKT T-cell receptor. Nature (2007) 448(7149):44–9. doi: 10.1038/nature05907
11. Gadola SD, Zaccai NR, Harlos K, Shepherd D, Castro-Palomino JC, Ritter G, et al. Structure of human CD1b with bound ligands at 2.3 a, a maze for alkyl chains. Nat Immunol (2002) 3(8):721–6. doi: 10.1038/ni821
12. Pereira CS, Pérez-Cabezas B, Ribeiro H, Maia ML, Cardoso MT, Dias AF, et al. Lipid antigen presentation by CD1b and CD1d in lysosomal storage disease patients. Front Immunol (2019) 10:1264. doi: 10.3389/fimmu.2019.01264
13. Mori L, Lepore M, De Libero G. The immunology of CD1- and MR1-restricted T cells. Annu Rev Immunol (2016) 34:479–510. doi: 10.1146/annurev-immunol-032414-112008
14. Almeida CF, Sundararaj S, Le Nours J, Praveena T, Cao B, Burugupalli S, et al. Distinct CD1d docking strategies exhibited by diverse type II NKT cell receptors. Nat Commun (2019) 10(1):5242. doi: 10.1038/s41467-019-12941-9
15. Pukel CS, Lloyd KO, Travassos LR, Dippold WG, Oettgen HF, Old LJ. GD3, a prominent ganglioside of human melanoma. detection and characterisation by mouse monoclonal antibody. J Exp Med (1982) 155(4):1133–47. doi: 10.1084/jem.155.4.1133
16. Watanabe T, Pukel CS, Takeyama H, Lloyd KO, Shiku H, Li LT, et al. Human melanoma antigen AH is an autoantigenic ganglioside related to GD2. J Exp Med (1982) 156(6):1884–9. doi: 10.1084/jem.156.6.1884
17. Carey TE, Lloyd KO, Takahashi T, Travassos LR, Old LJ. AU cell-surface antigen of human malignant melanoma: solubilization and partial characterization. Proc Natl Acad Sci U S A. (1979) 76(6):2898–902. doi: 10.1073/pnas.76.6.2898
18. Dias BR, Rodrigues EG, Nimrichter L, Nakayasu ES, Almeida IC, Travassos LR. Identification of iGb3 and iGb4 in melanoma B16F10-Nex2 cells and the iNKT cell-mediated antitumor effect of dendritic cells primed with iGb3. Mol Cancer. (2009) 8:116. doi: 10.1186/1476-4598-8-116
19. Macho-Fernandez E, Brigl M. The extended family of CD1d-restricted NKT cells: Sifting through a mixed bag of TCRs, antigens, and functions. Front Immunol (2015) 6:362. doi: 10.3389/fimmu.2015.00362
20. Al-Mterin MA, Murshed K, Elkord E. PD-1 expression, among other immune checkpoints, on tumor-infiltrating NK and NKT cells is associated with longer disease-free survival in treatment-naïve CRC patients. Cancer Immunol Immunother (2022), 1–7. doi: 10.1007/s00262-022-03337-8
21. Guan J, Gupta R, Filipp FV. Cancer systems biology of TCGA SKCM: efficient detection of genomic drivers in melanoma. Sci Rep (2015) 5(1):7857. doi: 10.1038/srep07857
22. Goldman M, Craft B, Hastie M, Repečka K, McDade F, Kamath A, et al. The UCSC Xena system for cancer genomics data visualization and interpretation [abstract]. In: Proceedings of the American Association for Cancer Research Annual Meeting (2017) 77(13 Suppl):Abstract nr 2584. doi: 10.1158/1538-7445.AM2017-2584
23. Riaz N, Havel JJ, Makarov V, Desrichard A, Urba WJ, Sims JS, et al. Tumor and microenvironment evolution during immunotherapy with nivolumab. Cell (2017) 171(4):934–49.e16. doi: 10.1016/j.cell.2017.09.028
24. Liu D, Schilling B, Sucker A, Livingstone E, Jerby-Arnon L, Zimmer L, et al. Integrative molecular and clinical modeling of clinical outcomes to PD1 blockade in patients with metastatic melanoma. Nat Med (2019) 25(12):1916–27. doi: 10.1038/s41591-019-0654-5
25. Gide TN, Quek C, Menzies AM, Tasker AT, Shang P, Holst J, et al. Distinct immune cell populations define response to anti-PD-1 monotherapy and anti-PD-1/Anti-CTLA-4 combined therapy. Cancer Cell (2019) 35(2):238–55.e6. doi: 10.1016/j.ccell.2019.01.003
26. Hugo W, Zaretsky JM, Sun L, Song C, Moreno BH, Hu-Lieskovan S, et al. Genomic and transcriptomic features of response to anti-PD-1 therapy in metastatic melanoma. Cell (2017) 168(3):542. doi: 10.1016/j.cell.2017.01.010
27. Snel B, Lehmann G, Bork P, Huynen MA. STRING: a web-server to retrieve and display the repeatedly occurring neighbourhood of a gene. Nucleic Acids Res (2000) 28(18):3442–4. doi: 10.1093/nar/28.18.3442
28. Kenniston JA, Taylor BM, Conley GP, Cosic J, Kopacz KJ, Lindberg AP, et al. Structural basis for pH-insensitive inhibition of immunoglobulin G recycling by an anti-neonatal fc receptor antibody. J Biol Chem (2017) 292(42):17449–60. doi: 10.1074/jbc.M117.807396
29. Bongen E, Vallania F, Utz PJ, Khatri P. KLRD1-expressing natural killer cells predict influenza susceptibility. Genome Med (2018) 10(1):1–12. doi: 10.1186/s13073-018-0554-1
30. Orr MT, Wu J, Fang M, Sigal LJ, Spee P, Egebjerg T, et al. Development and function of CD94-deficient natural killer cells. PloS One (2010) 5(12):e15184. doi: 10.1371/journal.pone.0015184
31. Allan AJ, Sanderson ND, Gubbins S, Ellis SA, Hammond JA. Cattle NK cell heterogeneity and the influence of MHC class I. J Immunol (2015) 195(5):2199–206. doi: 10.4049/jimmunol.1500227
32. Cardoso CS, de Sousa M. HFE, the MHC and hemochromatosis: paradigm for an extended function for MHC class I. Tissue Antigens (2003) 61(4):263–75. doi: 10.1034/j.1399-0039.2003.00065.x
33. Rossatti P, Redpath GMI, Ziegler L, Samson GPB, Clamagirand CD, Legler DF, et al. Rapid increase in transferrin receptor recycling promotes adhesion during T cell activation. BMC Biol (2022) 20(1):189. doi: 10.1186/s12915-022-01386-0
34. Wijeyesakere SJ, Gagnon JK, Arora K, Brooks CL 3rd, Raghavan M. Regulation of calreticulin-major histocompatibility complex (MHC) class I interactions by ATP. Proc Natl Acad Sci U S A. (2015) 112(41):E5608–17. doi: 10.1073/pnas.1510132112
35. Dai HS, Griffin N, Bolyard C, Mao HC, Zhang J, Cripe TP, et al. The fc domain of immunoglobulin is sufficient to bridge NK cells with virally infected cells. Immunity (2017) 47(1):159–70.e10. doi: 10.1016/j.immuni.2017.06.019
36. Dhatchinamoorthy K, Colbert JD, Rock KL. Cancer immune evasion through loss of MHC class I antigen presentation. Front Immunol (2021) 12:636568. doi: 10.3389/fimmu.2021.636568
37. Banchereau R, Leng N, Zill O, Sokol E, Liu G, Pavlick D, et al. Molecular determinants of response to PD-L1 blockade across tumor types. Nat Commun (2021) 12(1):3969. doi: 10.1038/s41467-021-24112-w
38. Kim HS, Garcia J, Exley M, Johnson KW, Balk SP, Blumberg RS. Biochemical characterization of CD1d expression in the absence of beta2-microglobulin. J Biol Chem (1999) 274(14):9289–95. doi: 10.1074/jbc.274.14.9289
39. Moore LD, Le T, Fan G. DNA Methylation and its basic function. Neuropsychopharmacology (2013) 38(1):23–38. doi: 10.1038/npp.2012.112
40. Liu Z, Ren Y, Weng S, Xu H, Li L, Han X. A new trend in cancer treatment: The combination of epigenetics and immunotherapy. Front Immunol (2022) 13:809761. doi: 10.3389/fimmu.2022.809761
41. Filipski K, Scherer M, Zeiner KN, Bucher A, Kleemann J, Jurmeister P, et al. DNA Methylation-based prediction of response to immune checkpoint inhibition in metastatic melanoma. J Immunother Cancer (2021) 9(7):e002226. doi: 10.1136/jitc-2020-002226
42. Bindea G, Mlecnik B, Tosolini M, Kirilovsky A, Waldner M, Obenauf AC, et al. Spatiotemporal dynamics of intratumoral immune cells reveal the immune landscape in human cancer. Immunity (2013) 39(4):782–95. doi: 10.1016/j.immuni.2013.10.003
43. Matareed M, Maranou E, Koskela SA, Mehmood A, Kalirai H, Coupland SE, et al. Novel prognostication biomarker adipophilin reveals a metabolic shift in uveal melanoma and new therapeutic opportunities. J Pathol (2023). doi: 10.1002/path.6076
44. Jaiswal AR, Liu AJ, Pudakalakatti S, Dutta P, Jayaprakash P, Bartkowiak T, et al. Melanoma evolves complete immunotherapy resistance through the acquisition of a hypermetabolic phenotype. Cancer Immunol Res (2020) 8(11):1365–80. doi: 10.1158/2326-6066.CIR-19-0005
45. Engel I, Seumois G, Chavez L, Samaniego-Castruita D, White B, Chawla A, et al. Innate-like functions of natural killer T cell subsets result from highly divergent gene programs. Nat Immunol (2016) 17(6):728–39. doi: 10.1038/ni.3437
46. Zhou L, Adrianto I, Wang J, Wu X, Datta I, Mi QS. Single-cell RNA-seq analysis uncovers distinct functional human NKT cell Sub-populations in peripheral blood. Front Cell Dev Biol (2020) 8:384. doi: 10.3389/fcell.2020.00384
47. Eisenhauer EA, Therasse P, Bogaerts J, Schwartz LH, Sargent D, Ford R, et al. New response evaluation criteria in solid tumours: revised RECIST guideline (version 1. 1). Eur J Cancer (2009) 45(2):228–47. doi: 10.1016/j.ejca.2008.10.026
48. Seymour L, Bogaerts J, Perrone A, Ford R, Schwartz LH, Mandrekar S, et al. iRECIST: guidelines for response criteria for use in trials testing immunotherapeutics. Lancet Oncol (2017) 18(3):e143–e52. doi: 10.1016/S1470-2045(17)30074-8
49. Tian G, Courtney AN, Jena B, Heczey A, Liu D, Marinova E, et al. CD62L+ NKT cells have prolonged persistence and antitumor activity in vivo. J Clin Invest (2016) 126(6):2341–55. doi: 10.1172/JCI83476
50. Lee M, Lee E, Han SK, Choi YH, Kwon DI, Choi H, et al. Single-cell RNA sequencing identifies shared differentiation paths of mouse thymic innate T cells. Nat Commun (2020) 11(1):4367. doi: 10.1038/s41467-020-18155-8
51. Mpakali A, Stratikos E. The role of antigen processing and presentation in cancer and the efficacy of immune checkpoint inhibitor immunotherapy. Cancers (Basel) (2021) 13(1):134. doi: 10.3390/cancers13010134
52. Bendelac A, Savage PB, Teyton L. The biology of NKT cells. Annu Rev Immunol (2007) 25:297–336. doi: 10.1146/annurev.immunol.25.022106.141711
53. Kawano T, Cui J, Koezuka Y, Toura I, Kaneko Y, Motoki K, et al. CD1d-restricted and TCR-mediated activation of valpha14 NKT cells by glycosylceramides. Science (1997) 278(5343):1626–9. doi: 10.1126/science.278.5343.1626
54. Ardeniz Ö, Unger S, Onay H, Ammann S, Keck C, Cianga C, et al. β2-microglobulin deficiency causes a complex immunodeficiency of the innate and adaptive immune system. J Allergy Clin Immunol (2015) 136(2):392–401. doi: 10.1016/j.jaci.2014.12.1937
55. Bae EA, Seo H, Kim BS, Choi J, Jeon I, Shin KS, et al. Activation of NKT cells in an anti-PD-1-Resistant tumor model enhances antitumor immunity by reinvigorating exhausted CD8 T cells. Cancer Res (2018) 78(18):5315–26. doi: 10.1158/0008-5472.CAN-18-0734
56. Motohashi S, Nagato K, Kunii N, Yamamoto H, Yamasaki K, Okita K, et al. A phase I-II study of alpha-galactosylceramide-pulsed IL-2/GM-CSF-cultured peripheral blood mononuclear cells in patients with advanced and recurrent non-small cell lung cancer. J Immunol (2009) 182(4):2492–501. doi: 10.4049/jimmunol.0800126
57. Dashtsoodol N, Shigeura T, Tashiro T, Aihara M, Chikanishi T, Okada H, et al. Natural killer T cell-targeted immunotherapy mediating long-term memory responses and strong antitumor activity. Front Immunol (2017) 8:1206. doi: 10.3389/fimmu.2017.01206
58. Gottschalk C, Mettke E, Kurts C. The role of invariant natural killer T cells in dendritic cell licensing, cross-priming, and memory CD8(+) T cell generation. Front Immunol (2015) 6:379. doi: 10.3389/fimmu.2015.00379
59. Paul S, Chhatar S, Mishra A, Lal G. Natural killer T cell activation increases iNOS. J Immunother Cancer. (2019) 7(1):208. doi: 10.1186/s40425-019-0697-7
60. Liu X, Li L, Si F, Huang L, Zhao Y, Zhang C, et al. NK and NKT cells have distinct properties and functions in cancer. Oncogene (2021) 40(27):4521–37. doi: 10.1038/s41388-021-01880-97
61. Kasanen H, Hernberg M, Mäkelä S, Brück O, Juteau S, Kohtamäki L, et al. Age-associated changes in the immune system may influence the response to anti-PD1 therapy in metastatic melanoma patients. Cancer Immunology Immunother (2020) 69(5):717–30. doi: 10.1007/s00262-020-02497-9
62. Krieg C, Nowicka M, Guglietta S, Schindler S, Hartmann FJ, Weber LM, et al. High-dimensional single-cell analysis predicts response to anti-PD-1 immunotherapy. Nat Med (2018) 24(2):144–53. doi: 10.1038/nm.4466
63. Hix LM, Shi YH, Brutkiewicz RR, Stein PL, Wang C-R, Zhang M. CD1d-expressing breast cancer cells modulate NKT cell-mediated antitumor immunity in a murine model of breast cancer metastasis. PloS One (2011) 6(6):e20702. doi: 10.1371/journal.pone.0020702
64. Miura S, Kawana K, Schust DJ, Fujii T, Yokoyama T, Iwasawa Y, et al. CD1d, a sentinel molecule bridging innate and adaptive immunity, is downregulated by the human papillomavirus (HPV) E5 protein: a possible mechanism for immune evasion by HPV. J Virol (2010) 84(22):11614–23. doi: 10.1128/JVI.01053-10
65. Melo AM, Conroy MJ, Foley EK, Dockry É, Breen EP, Reynolds JV, et al. CD1d expression and invariant natural killer T-cell numbers are reduced in patients with upper gastrointestinal cancers and are further impaired by commonly used chemotherapies. Cancer Immunology Immunother (2020) 69(6):969–82. doi: 10.1007/s00262-020-02514-x
66. Dockry ÉF. Epigenetic targeting of CD1d increases cytolytic activity of invariant natural killer T cells against non-small cell lung cancer cells. (Doctoral dissertation, Trinity College (Dublin, Ireland). Department of Immunology) (2016).
67. Dockry É, O'Leary S, Gleeson LE, Lyons J, Keane J, Gray SG, et al. Epigenetic induction of CD1d expression primes lung cancer cells for killing by invariant natural killer T cells. OncoImmunology (2018) 7(6):e1428156. doi: 10.1080/2162402X.2018.1428156
68. Baylin SB, Jones PA. A decade of exploring the cancer epigenome - biological and translational implications. Nat Rev Cancer. (2011) 11(10):726–34. doi: 10.1038/nrc3130
69. Özdemir İ, Pınarlı FG, Pınarlı FA, Aksakal FNB, Okur A, Uyar Göçün P, et al. Epigenetic silencing of the tumor suppressor genes SPI1, PRDX2, KLF4, DLEC1, and DAPK1 in childhood and adolescent lymphomas. Pediatr Hematol Oncol (2018) 35(2):131–44. doi: 10.1080/08880018.2018.1467986
70. Woods DM, Sodré AL, Villagra A, Sarnaik A, Sotomayor EM, Weber J. HDAC inhibition upregulates PD-1 ligands in melanoma and augments immunotherapy with PD-1 blockade. Cancer Immunol Res (2015) 3(12):1375–85. doi: 10.1158/2326-6066.CIR-15-0077-T
71. Luo N, Nixon MJ, Gonzalez-Ericsson PI, Sanchez V, Opalenik SR, Li H, et al. DNA Methyltransferase inhibition upregulates MHC-I to potentiate cytotoxic T lymphocyte responses in breast cancer. Nat Commun (2018) 9(1):248. doi: 10.1038/s41467-017-02630-w
72. Tiper IV, Webb TJ. Histone deacetylase inhibitors enhance CD1d-dependent NKT cell responses to lymphoma. Cancer Immunology Immunother (2016) 65:1411–21. doi: 10.1007/s00262-016-1900-z
73. Cline MS, Craft B, Swatloski T, Goldman M, Ma S, Haussler D, et al. Exploring TCGA pan-cancer data at the UCSC cancer genomics browser. Sci Rep (2013) 3:2652. doi: 10.1038/srep02652
75. Bray NL, Pimentel H, Melsted P, Pachter L. Near-optimal probabilistic RNA-seq quantification. Nat Biotechnol (2016) 34(5):525–7. doi: 10.1038/nbt.3519
76. Zhang Y, Parmigiani G, Johnson WE. Batch effect adjustment for RNA-seq count data. NAR Genom Bioinform (2020) 2(3):lqaa078. doi: 10.1093/nargab/lqaa078
77. Villaruz LC, Socinski MA. The clinical viewpoint: definitions, limitations of RECIST, practical considerations of measurement. Clin Cancer Res (2013) 19(10):2629–36. doi: 10.1158/1078-0432.CCR-12-2935
78. Eisenberg E, Levanon EY. Human housekeeping genes, revisited. Trends Genet (2013) 29(10):569–74. doi: 10.1016/j.tig.2013.05.010
79. Figueiredo CR, Azevedo RA, Mousdell S, Resende-Lara PT, Ireland L, Santos A, et al. Blockade of MIF–CD74 signalling on macrophages and dendritic cells restores the antitumour immune response against metastatic melanoma. Front Immunol (2018) 9. doi: 10.3389/fimmu.2018.01132
80. Uhlen M, Zhang C, Lee S, Sjöstedt E, Fagerberg L, Bidkhori G, et al. A pathology atlas of the human cancer transcriptome. Science (2017) 357(6352):eaan2507. doi: 10.1126/science.aan2507
Keywords: immune checkpoint therapy, DNA methylation, β2M, CD1d, melanoma, MHC-I, SPI1, Anti-PD1
Citation: Wang MM, Koskela SA, Mehmood A, Langguth M, Maranou E and Figueiredo CR (2023) Epigenetic control of CD1D expression as a mechanism of resistance to immune checkpoint therapy in poorly immunogenic melanomas. Front. Immunol. 14:1152228. doi: 10.3389/fimmu.2023.1152228
Received: 27 January 2023; Accepted: 20 March 2023;
Published: 03 April 2023.
Edited by:
Suzie Chen, Rutgers, The State University of New Jersey, United StatesReviewed by:
Andrea Ladányi, National Institute of Oncology (NIO), HungaryKevinn Eddy, Rutgers, The State University of New Jersey, United States
Copyright © 2023 Wang, Koskela, Mehmood, Langguth, Maranou and Figueiredo. This is an open-access article distributed under the terms of the Creative Commons Attribution License (CC BY). The use, distribution or reproduction in other forums is permitted, provided the original author(s) and the copyright owner(s) are credited and that the original publication in this journal is cited, in accordance with accepted academic practice. No use, distribution or reproduction is permitted which does not comply with these terms.
*Correspondence: Carlos R. Figueiredo, Y3JkZWZpQHV0dS5maQ==