 Francisca Palomares1*†‡
 Natalia Pérez-Sánchez1,2†Nazaret Nieto1
 Rafael Núñez1
 José Antonio Cañas1
 María del Carmen Martín-Astorga1,3Anyith Cruz-Amaya1
 María José Torres1,2,3
 Ibon Eguíluz-Gracia1,2
 Cristobalina Mayorga1,2*‡
 Francisca Gómez1,2‡
- 1Allergy Research Group, Instituto de Investigación Biomédica de Málaga-IBIMA Plataforma Andalusian Centre for Nanomedicine and Biotechnology (BIONAND), Málaga, Spain
- 2Allergy Unit, Hospital Regional Universitario de Malaga, Málaga, Spain
- 3Medicine Department, Universidad de Málaga-UMA, Málaga, Spain
Background: Immunopathology in food allergy is characterized by an uncontrolled type 2 immune response and specific-IgE production. Recent studies have determined that group 2 innate lymphoid cells (ILC2) participate in the food allergy pathogenic mechanism and their severity. Our objective was to investigate the role of ILC2 in peach-allergic patients due to non-specific lipid transfer protein (Pru p 3) sensitization.
Methods: The immune response in peripheral blood mononuclear cells was characterized in lipid transfer protein-allergic patients and healthy controls. We have analyzed the Pru p 3 uptake on ILC2, the expression of costimulatory molecules, and their involvement on the T-cell proliferative response and cytokine production under different experimental conditions: cytokines involved in group 2 innate lymphoid cell activation (IL-33 and IL-25), Pru p 3 as main food allergen, and the combination of both components (IL-33/IL-25+Pru p 3) using cell sorting, EliSpot, flow cytometry, and confocal microscopy.
Results: Our results show that Pru p 3 allergen is taken up by group 2 innate lymphoid cells, regulating their costimulatory molecule expression (CD83 and HLA-DR) depending on the presence of Pru p 3 and its combination with IL-33/IL-25. The Pru p 3-stimulated ILC2 induced specific GATA3+Th2 proliferation and cytokine (IL-4, IL-5, and IL-13) production in lipid transfer protein-allergic patients in a cell contact-dependent manner with no changes in Tbet+Th1- and FOXP3+Treg cell differentiation.
Conclusions: The results indicate that in lipid transfer protein-allergic patients, the responsible allergen, Pru p 3, interacts with group 2 innate lymphoid cells, promoting a Th2 cell response. Our results might be of interest in vivo, as they show a role of group 2 innate lymphoid cells as antigen-presenting cells, contributing to the development of food allergy. Consequently, group 2 innate lymphoid cells may be considered as potential therapeutic targets.
1 Introduction
Food allergy (FA), one of the most frequent entities in allergy consultations whose prevalence has increased by 50% during the last decade, affects 5% of the adult population and 8% of children (1, 2). Food allergy can be severe depending on different factors as co-sensitizations or a genetic predisposition to allergic reactions (3).
Foods of plant origin are the most common triggers in both adults and adolescents (2), with non-specific lipid transfer proteins (nsLTP) being the main allergens involved. nsLTP are highly stable, not modified during thermal and digestion processing (4, 5), which might explain their allergenicity and its involvement in severe systemic symptoms (6, 7). These proteins are panallergens, and consequently, although some patients can react to a single nsLTP (mainly Pru p 3, from peach), patients are frequently sensitized to nsLTP from different allergenic sources, thus hampering clinical management (6, 8).
Classical mechanisms in FA need the involvement of the innate immune system with antigen-presenting cells (APCs), like dendritic cells (DCs), recognizing, processing, and presenting the food allergen to T-cells (9), which differentiate toward IL-4-, IL-5-, and IL-13-producing Th2 cells (10). This is accompanied by specific immunoglobulin E (sIgE) production by B-cell-derived plasma cells and T regulatory (Treg) response blockage (11). However, knowledge about the underlying mechanisms involving other innate system elements in FA is limited.
Recent studies raised a possible role of innate lymphoid cells (ILC) in driving inflammatory diseases, mainly searching biomarkers and/or therapeutic targets (12, 13). ILC are involved in immunity, homeostasis regulation, and inflammation; therefore, an alteration in its levels may lead to the development of allergic reactions (14–16). ILC are grouped into three main subtypes defined by the combination of surface markers, transcription factors, and cytokine production (TGFβ and IFNγ for ILC1; GATA3 and IL-4, IL-5, IL-9 and IL-13 for ILC2; and RORγt and IL-22 for ILC3) (17). Although ILC2 have been associated with allergic pathologies (18) by inducing a faster and antigen-independent response upon activation, their implication in FA has not been completely elucidated, with many studies being performed only in experimental FA models (19). These studies describe that, in the presence of the antigen, epithelial cells produce IL-25 and IL-33 and thymic stromal lymphopoietin that activate and increase ILC2 survival, respectively. Activated ILC2 promote Th2 cells and IgE-producing B-cells, blocking Treg cells, to induce the anaphylactic reaction (20, 21). Moreover, IgE-mediated activation of mast cells induce IL-33 secretion, activating and amplifying the ILC2-mediated response (22). In humans, in FA context, our group recently reported evidence of the presence of circulating ILC2 producing IL-13 and IL-4 related to LTP-allergic patients (LTP-AP). We showed the ILC2 involvement in type 2 (T2) immune response, showing a correlation between Th2 cells and reaction severity (23).
Recently, it has been described that ILC2 express MHCII and costimulatory molecules (CD80 and CD86), showing their possible participation as APCs, and interact with T-cells to promote Th2 polarization in inflammatory pathologies (24–26). Related to PD-L1, despite being a regulatory marker observed in LTP-AP treated with specific allergen immunotherapy (27), its expression in ILC2 cells, both in vitro and in vivo, could be associated with a Th2 response or with the expression of GATA3 and the production of IL-13 as demonstrated in infectious pathologies (Nippostrongylus brasiliensis) (28). These studies suggest that further analyses are needed to explain the implication and functioning of ILC2 on T-cell polarization and FA.
Here we show that ILC2 can take up Pru p 3 and express different costimulatory molecules that will affect the presentation to T-cells in vitro. Indeed the Pru p 3-preactivated ILC2 induced the differentiation to a Th2 phenotype with a lack in Tbet+Th1/FOXP3+Treg activity. This interaction between ILC2 and T-cells is essential in FA regulation.
2 Materials and methods
2.1 LTP-allergic patients and tolerant controls
LTP-AP with a confirmed diagnosis of peach allergy was determined by a positive skin prick test (SPT), sIgE to peach LTP (Pru p 3), or a positive double-blind placebo-controlled food challenge (DBPCFC) to unpeeled peach when in doubt of the diagnosis. DBPCFC was not performed in patients with more than two episodes of anaphylaxis after peach ingestion in the 2 years preceding the study. Severity was classified according to FASS-5 (29). A tolerant group of subjects (HC) presenting negative SPT and Pru p 3-sIgE and with confirmed tolerance to unpeeled peach was included (Table 1). LTP-AP and HC were evaluated in relation to the presence of respiratory allergic diseases (allergic rhinitis), according to ARIA classification (Table 1), and all samples were obtained out of the seasonal period. The study was conducted at the Allergy Service and Research Laboratory of the Hospital Regional Universitario de Málaga-Instituto de Biomedicina de Málaga (HRUM-IBIMA), Spain, in accordance with the Declaration of Helsinki and was approved by the local ethics committee (code: 2201-N-20). All participants signed informed consent forms.
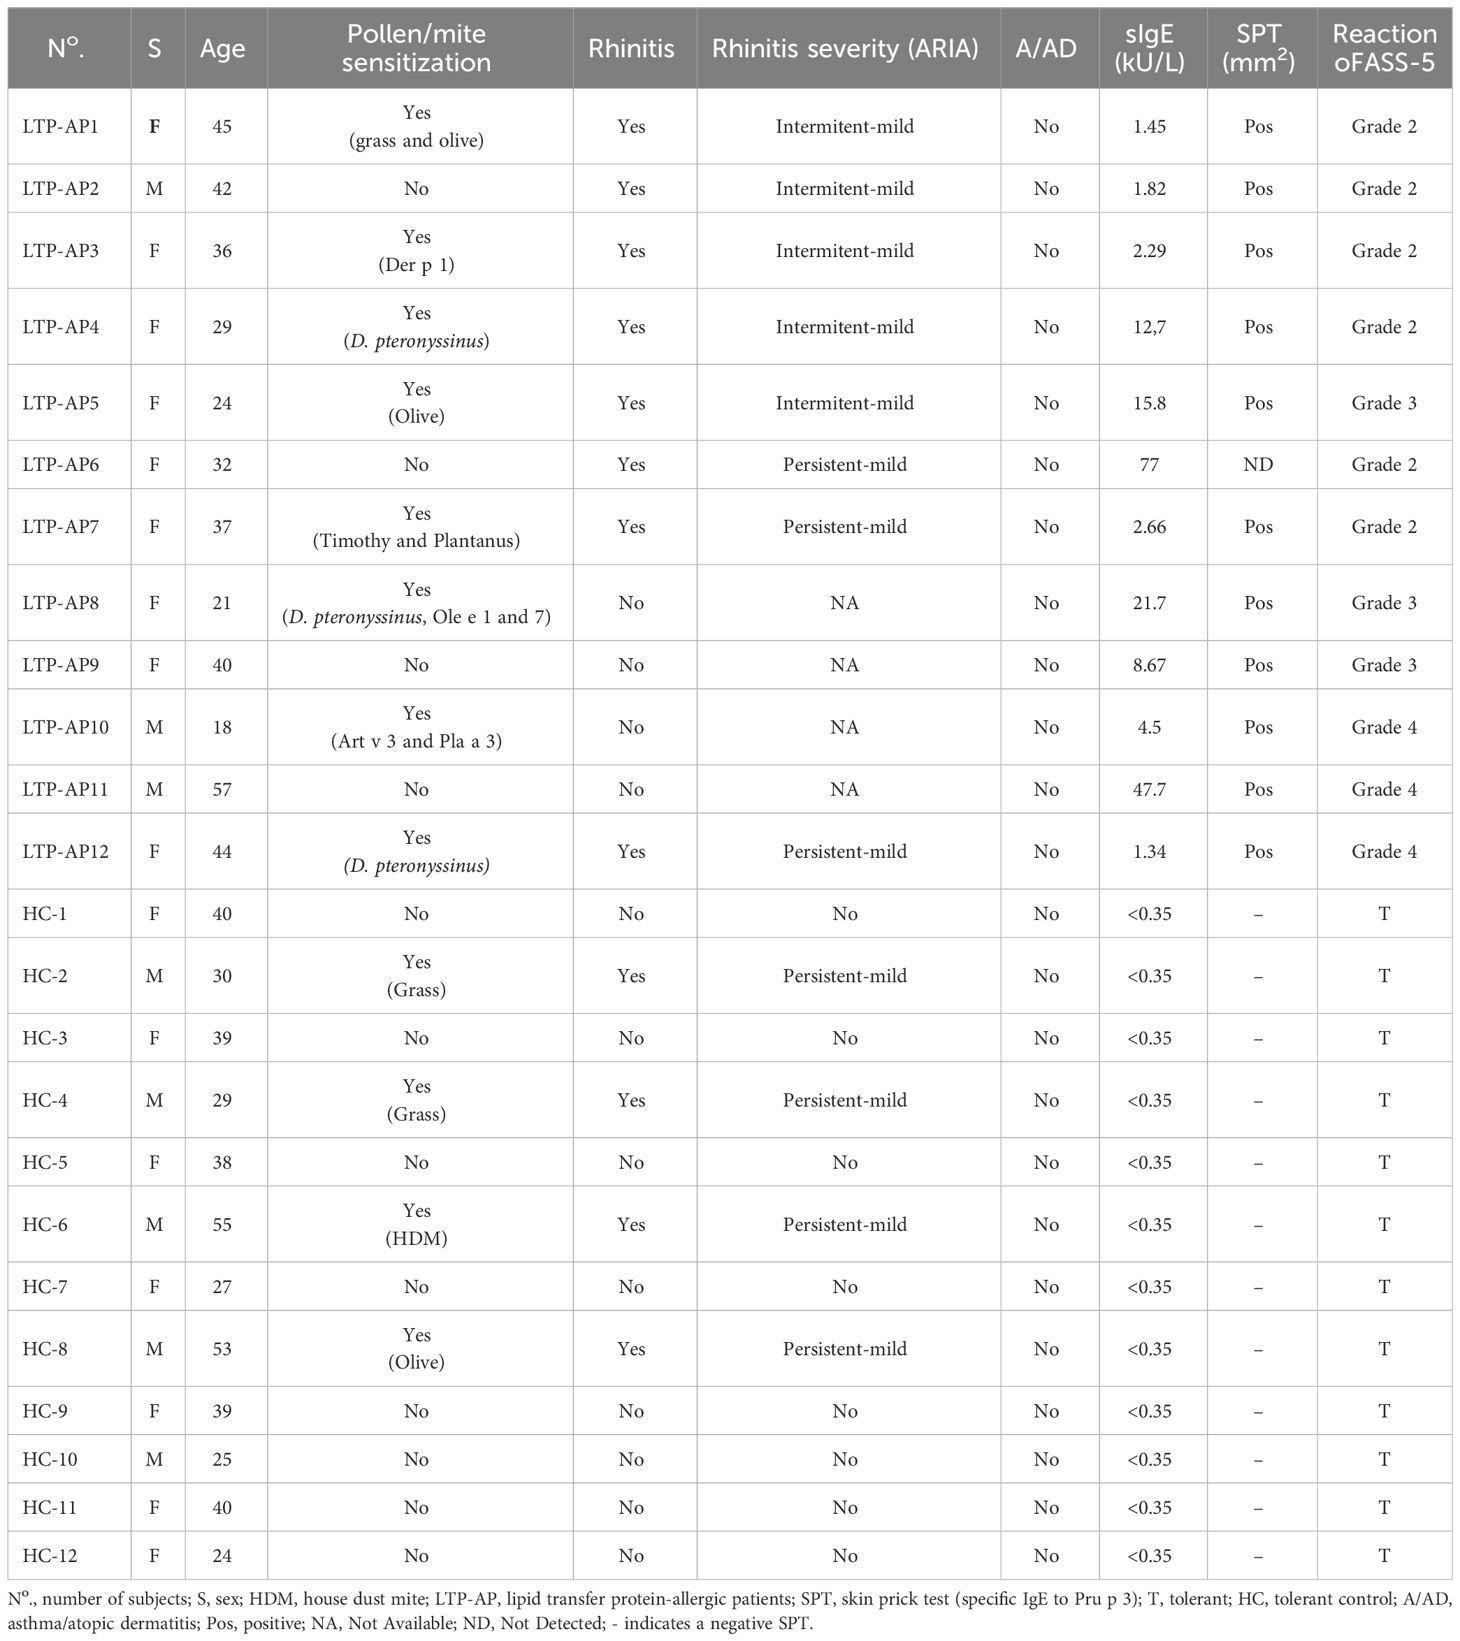
Table 1 Clinical characteristics and allergological workup results.
2.2 Skin prick tests
SPT were performed according to European guidelines (30) using extracts of aeroallergens (olive tree, Phleum, Artemisia, plane tree, and D. pteronyssinus), plant foods related to LTP (peanut, hazelnut, walnut, almond, tomato, and lettuce), and peach LTP (Pru p 3-enriched) (all from ALK-Abelló). A wheal size >3 mm2 compared to the one induced by a negative saline control was considered positive.
2.3 Double-blind placebo-controlled food challenge
DBPCFC to unpeeled peach was performed out of the pollen season (olive grass pollen and plane tree mainly, to avoid confusion with respiratory symptoms due to pollen symptoms) following European guidelines (30, 31).
2.4 Pru p 3-specific immunoglobulin (Ig) determination
Serum sIgE to Pru p 3 was determined using ImmunoCAP (Thermo Fisher Scientific, Uppsala, Sweden) following the manufacturer’s recommendations. Results higher than 0.35 kU/L were considered positive.
2.5 Sample collection and storing
Peripheral blood was obtained by venopunction. Peripheral blood mononuclear cells (PBMCs) were isolated using Ficoll gradient and stored in liquid nitrogen. The PBMCs and serum were managed at the biobank according to the standard procedures of HRUM-IBIMA Biobank, Andalusian Public Health System Biobank.
2.6 Cell sorting and flow cytometry
ILC2 (Linage-CD123-CD15-CD161+CD127+CRTH2+) (23) and T-cells (Linage+ CD123+CD15+CD3+CD4+) were isolated from PBMCs by using cell sorting (MoFloAstrios, Beckman Coulter, Brea, CA, USA) with purity >95% using fluorochromes-labeled-monoclonal antibodies (mAb) [Becton Dickinson Company (BD), Biolegend and MiltenyiBiotec (Bergen NJ, San Diego, CA, USA, and Germany, respectively]. We display the details of fluorochrome-conjugated monoclonal antibodies (moAbs) in Supplementary Table S1. Linage included CD3, CD14, CD16, CD19, CD20, and CD56 markers. The reanalysis by flow cytometry of the ILC2 after sorting, shown in Supplementary Figure S1, ensured the purity of the population. LIVE/DEAD fixable near-IR dead cell stain kit (Thermo Fisher Scientific) was used to determine cell viability. The results after sorting are presented as percentages in LTP-AP and HC.
ILC2 and T-cell absolute number was determined using the CountBright Plus kit (Thermo Fisher Scientific) and evaluated with a MoFloAstrios flow cytometer. The absolute cell count was obtained by multiplying the number of positive ILC2 and T-cell events by the number of positive bead events and dividing by the expected number of bead events (Supplementary Figures S1–S3).
2.7 Confocal microscopy
The sorted ILC2 and T-cells were fixed in PBS containing 1% paraformaldehyde, washed with PBS, stored, and protected from light until analysis. Sub-membrane actin and nuclei (DNA) were labeled with Alexa Fluor 488 Phalloidin (Sigma-Aldrich, Munich, Germany) and Hoechst 33258 (Sigma-Aldrich), respectively (32). The cells were either transferred to optical-bottom 12-well plates (Thermo Fisher Scientific) in PBS for observation by confocal microscopy (32). The samples were analyzed using a Leica DM6000 inverted microscope connected to a Leica SP5 laser scanning confocal system and Fiji software to determine the cell integrity after sorting.
2.8 Pru p 3 uptake by confocal microscopy and flow cytometry
For Pru p 3 internalization analysis in ILC2 by confocal microscopy and flow cytometry, natural Pru p 3 (ROXAL Oststeinbek, Germany) was labeled with Alexa Fluor 647 NHS Ester (succinimidyl ester) (Pru p 3-AF647) according to the manufacturer’s instructions (Thermo Fisher Scientific). After incubation with constant stirring in the dark, the uncoupled free AF647 was removed by gel filtration column (PD MiniTRap G-25 column, GE Healthcare, Chicago, IL, USA) with PBS. Pru p 3-AF647 was quantified with a Nanodrop 2000 spectrophotometer (Thermo Fisher Scientific).
A mean of 1,000 ILC2 was cultured with 25 µg/mL Pru p 3-AF647 (27) with/without the cocktail cytokines, IL-25/IL-33 (CK) both at 50 ng/mL (33) (R&D Systems) at 48 h and 37°C, as previously described for Pru p 3 uptake by DCs, as APC (32). Afterward, ILC2 was fixed and labeled with Alexa Fluor 488 Phalloidin and Hoechst 33258, as previously described (32). For flow cytometry, ILC2 was acquired in a FACSCanto II Cytometer (BD), and data was analyzed using FlowJo software (BD). The results were expressed as mean fluorescence intensity (MFI) on ILC2.
2.9 In vitro activation assay in ILC2
The sorted ILC2 were cultured in 96-well plates (Thermo Fisher Scientific) with different experimental conditions; cocktail cytokines, Pru p 3 (25 µg/mL) (27), and CK+Pru p 3 for 48 h at 37°C in 5% CO2. Unstimulated ILC2 in complete medium was considered as the negative control. Changes in CD83, CD86, HLA-DR, and PD-L1 molecule (BD) expression were analyzed using MoFloAstrios (Beckmand-Coulter). We display the details of fluorochrome-conjugated moAbs in Supplementary Table S1. Data were analyzed using FlowJo software (BD). The unstimulated cells were considered controls for flow cytometric analyses, following the gate strategy shown in Supplementary Figure S2. The results were expressed as percentage expression for each marker.
2.10 ELISpot assay in ILC2
After sorting, ILC2 (an average of 250 cells per experimental condition) were cultured. The number of IL-13- and IL-4-secreting ILC2 after different stimulations, cocktail cytokines, Pru p 3, and CK+Pru p 3, was measured by ELISpot assay (Human IL-13 and IL-4 ELISpot Basic Kits, Mabtech, Nacka Strand, Sweden). These cytokines were chosen as cytokines of inflammatory response by ILC2, as we have previously described (23). ELISpot Multiscreen HTS plates (Millipore, Darmstadt, Germany) were coated overnight with IL-13 and IL-4 monoclonal antibodies, and the protocol followed the manufacturer’s recommendations. The medium and unstimulated ILC2 were considered as negative controls. The number of IL-13- and IL-4-secreting cells was determined using an ELISpot Bioreader (R) 6000 (BioSys, Karben, Germany). The results were expressed as number of spots of cytokines producing ILC2.
2.11 Co-cultures and T lymphocyte proliferative response
Sorted T-cells (Supplementary Figure S3) were labeled with 5,6-carboxyfluorescein diacetate N-succinimidyl ester (CFSE, Thermo Fisher Scientific) and cultured alone or in the presence of ILC2 in a 1:100 ratio of ILC2/T-cells at a final volume of 250 μL in different experimental combinations, cocktail cytokines, Pru p 3, and CK+Pru p 3 and without stimulus for 7 days at 37°C and 5% CO2. The same co-cultures were performed using 3-μm Transwell porous plates at a final volume of 600 μL. For all culture assays, on day 7, T-cells were recovered and phenotyped as CD3+CD4+ (T-cells), CD3+CD4+CRTH2+GATA3+ (GATA3+Th2 cells), following the strategies shown in Supplementary Figure S4, CD3+CD4+Tbet+ (Tbet+Th1-cells), and CD3+CD4+CD127-CD25+FOXP3+ (FOXP3+Treg cells), following the strategies shown in Supplementary Figure S5, in MoFloAstrios. We display the details of fluorochrome-conjugated moAbs in Supplementary Table S1. Nuclear transcription factors were evaluated by human FOXP3 buffer (BD). Proliferation was determined by the percentage of CFSElow cells. The results were presented as percentages of CFSElow for each T-cell subpopulation.
2.12 Cytokine determination
Cytokine production (IL-4, IL-5, IL-9, IL-10, IL-13, IFNγ, and IL-27) from supernatant cell cultures (T-cells alone, ILC2-T-cells contact or with Transwell) collected after 7 days was determined with a human ProcartaPlex Multiplex Immunoassays kit (Thermo Fisher Scientific), following the manufacturer’s indications, and analyzed in Bio-Plex 200 using Bio-Plex Data Analysis Software (Bio-Rad, Hercules, CA, USA). The results were presented as concentration (pg/mL) of each cytokine.
2.13 Statistical analysis
Data were analyzed using Shapiro–Wilk test to determine the normal distribution, but most variables were fitted to non-parametric distribution. We compared the effects of the different experimental conditions (unstimulated cells, cocktail cytokines, Pru p 3, and CK+Pru p 3) between the different groups of subjects (LTP-AP vs. HC) using Kruskal–Wallis test. If this test showed significant differences between groups, then we applied Mann–Whitney U-test to compare the LTP-AP and HC groups. This showed four post hoc tests. Moreover, the comparisons between related samples in the same group (LTP-AP or HC) were carried out using Friedman test. If this test showed significant differences, Wilcoxon test was applied, showing six post hoc tests. The correlations were carried out using Spearman tests. The significant differences were reported with an asterisk, representing a p-value <0.05. The statistical analysis was carried out using GraphPad Prism7.
3 Results
3.1 Clinical characteristics of LTP-allergic patients and tolerant controls
A total of 12 LTP-AP, 75% female patients with a mean age 35.5 years, and 12 sex- and age-matched HC were included. In the LTP-AP group, six (50%) patients presented a reaction after unpeeled peach ingestion as grade 2, three (25%) as grade 3, and three (25%) as grade 4. Sensitization to Pru p 3 was confirmed with a positive SPT to peach and/or Pru p 3-sIgE (median of 6.59 ± 23.5 kU/L).
3.2 Pru p 3 uptake by activated ILC2
ILC2 purification from PBMCs by flow cytometry and confocal microscopy morphology are shown in Figure 1A. The data indicate that purified ILC2 percentages were significantly higher in LTP-AP compared to HC with high viability in both groups (Figure 1B; Supplementary Figure S1), confirming that the sorting protocol was optimum to ILC2. The analysis of Pru p 3 uptake capacity of ILC2 under different stimulation conditions, using Pru p 3-AF647 in flow cytometry, indicated that this preferentially happens in ILC2 independently of the presence of cocktail cytokines in LTP-AP (Figure 1C) and HC (data not shown). The confocal microscopy images confirmed this internalization of the Pru p 3 surrounding the nucleus after 48 h (Figure 1D).
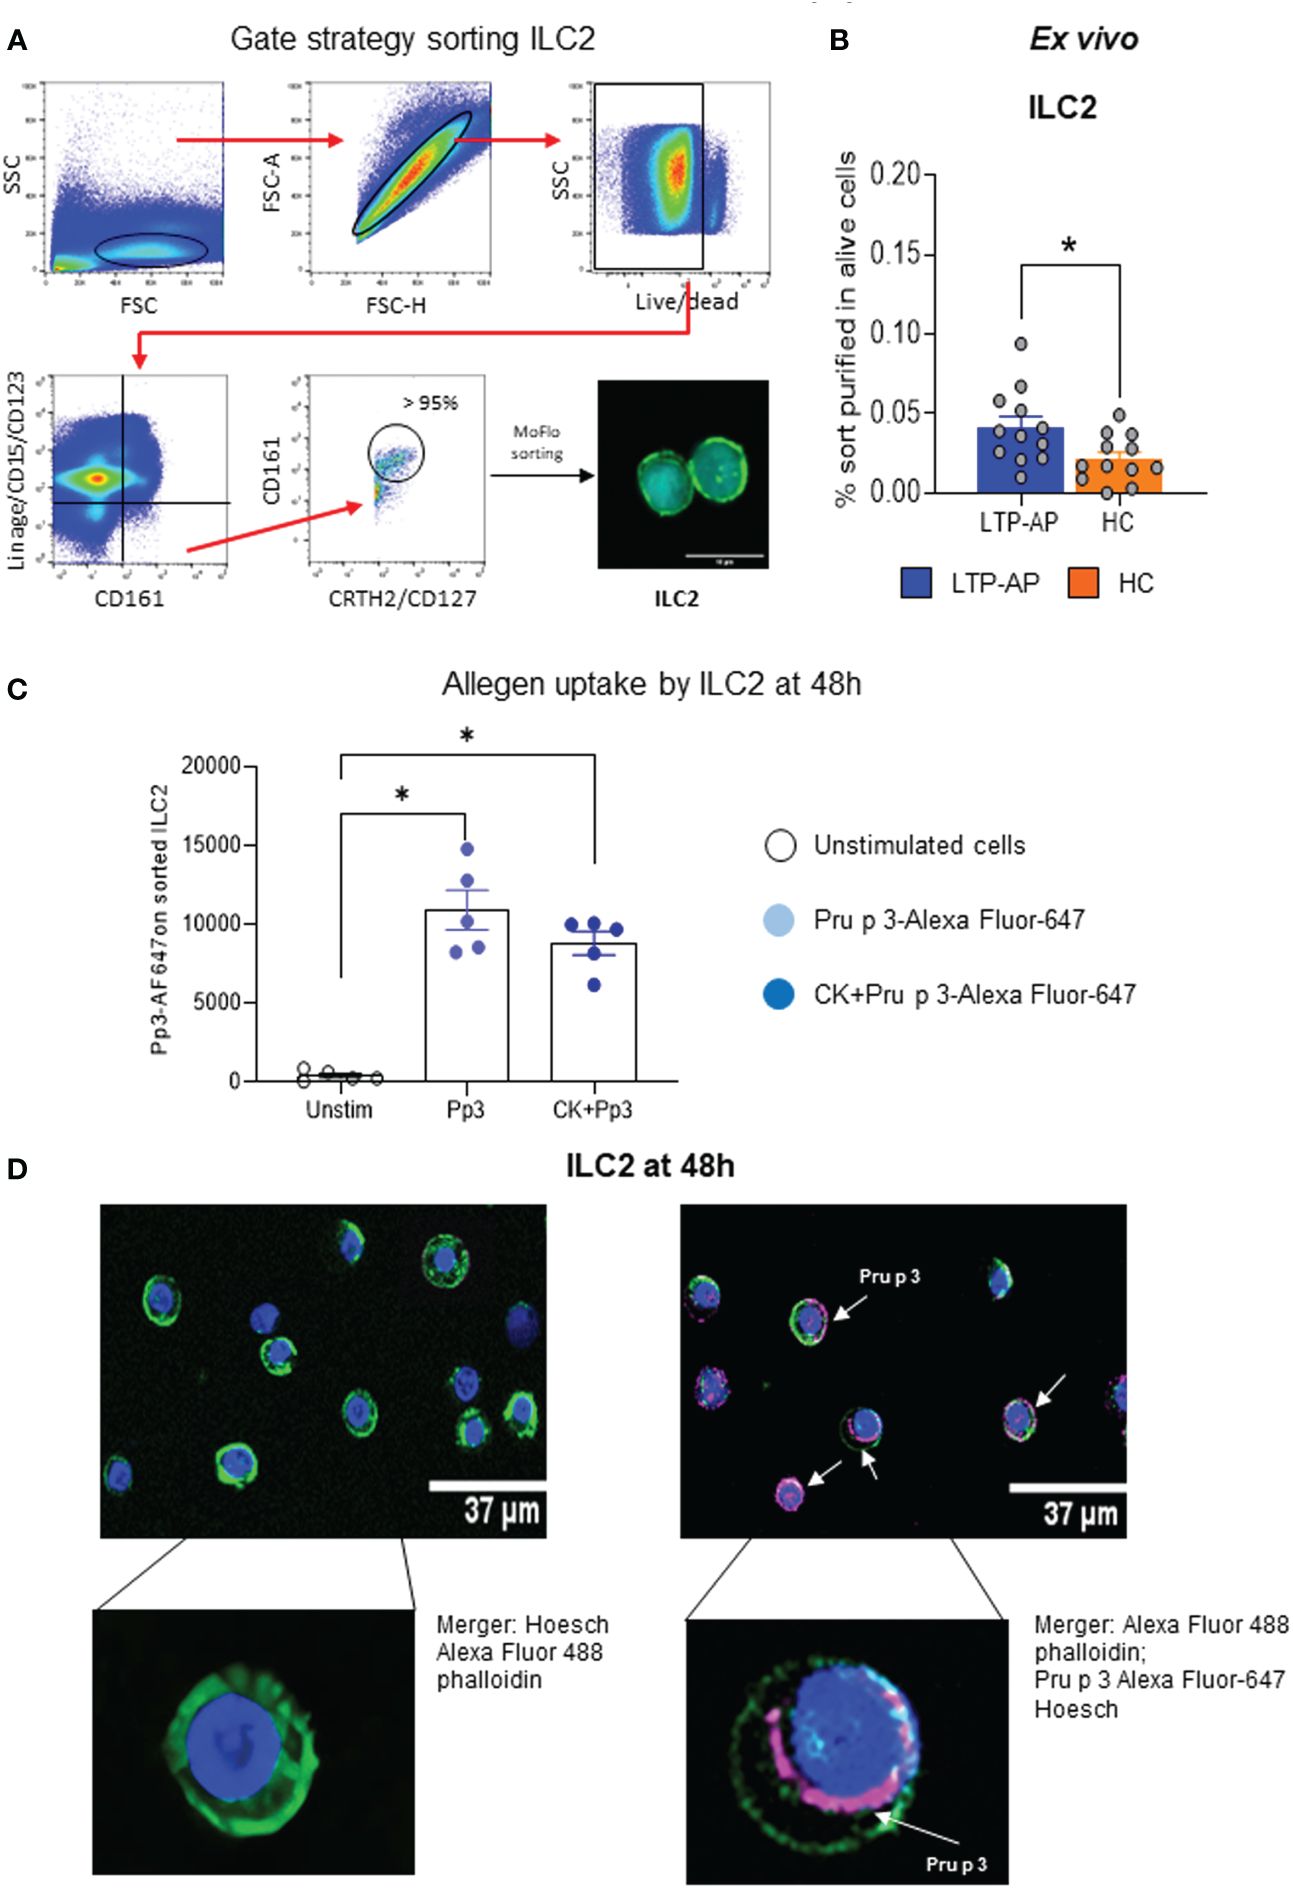
Figure 1 (A) Gating strategy for sorting ILC2, and ILC2 confocal images after sorting. (B) Frequency of sorted ILC2 on alive PBMCs in LTP-AP and HC (N = 12 for both groups). The bars with symbols represent the mean and SEM of ILC2 frequency. Mann–Whitney test for pairwise comparisons in unrelated samples. (C) Fluorescence-labeled Pru p 3 (Pp3) uptakes by ILC2 under different experimental conditions in LTP-AP (Pp3-Alexa Fluor-647 at 25 µm/mL and cocktail cytokines: IL-25 and IL-33 at 50 ng/mL). The bars with symbols represent the mean and SEM of mean fluorescence intensity. Friedman test, followed by Wilcoxon test, was used to detect differences. Significant p-values are marked with an asterisk (p < 0.05). (D) Representative confocal images of ILC2 incubated with Pp3 at 25 µg/mL in LTP-AP. The confocal images show different cellular regions. The sub-membrane actin was stained with Atto 488-phalloidin (green), the nuclei with Hoechst (blue), and Pp 3 with Alexa Fluor 647 (pink).
3.3 Pru p 3 upregulates the costimulatory marker and produces T2 cytokines on ILC2
We evaluated the changes of co-stimulatory molecules (CD83 and CD86), HLA-DR, and PD-L1 expression on ILC2 after Pru p 3 stimulation with/without cocktail cytokines (Figure 2A). Cocktail cytokines induced a significant upregulation of CD86, HLA-DR, and PD-L1 on ILC2 from LTP-AP compared to HC, independently of the presence of Pru p 3. Interestingly, CD83 and HLA-DR significantly increased their expressions in LTP-AP compared to HC under Pru p 3 and CK+Pru p 3 stimulation. This effect was amplified by the combination with cocktail cytokines, being significant for CD83 compared to Pru p 3 alone in LTP-AP (Figure 2A). No differences in the regulation of these markers were observed in HC for any experimental condition.
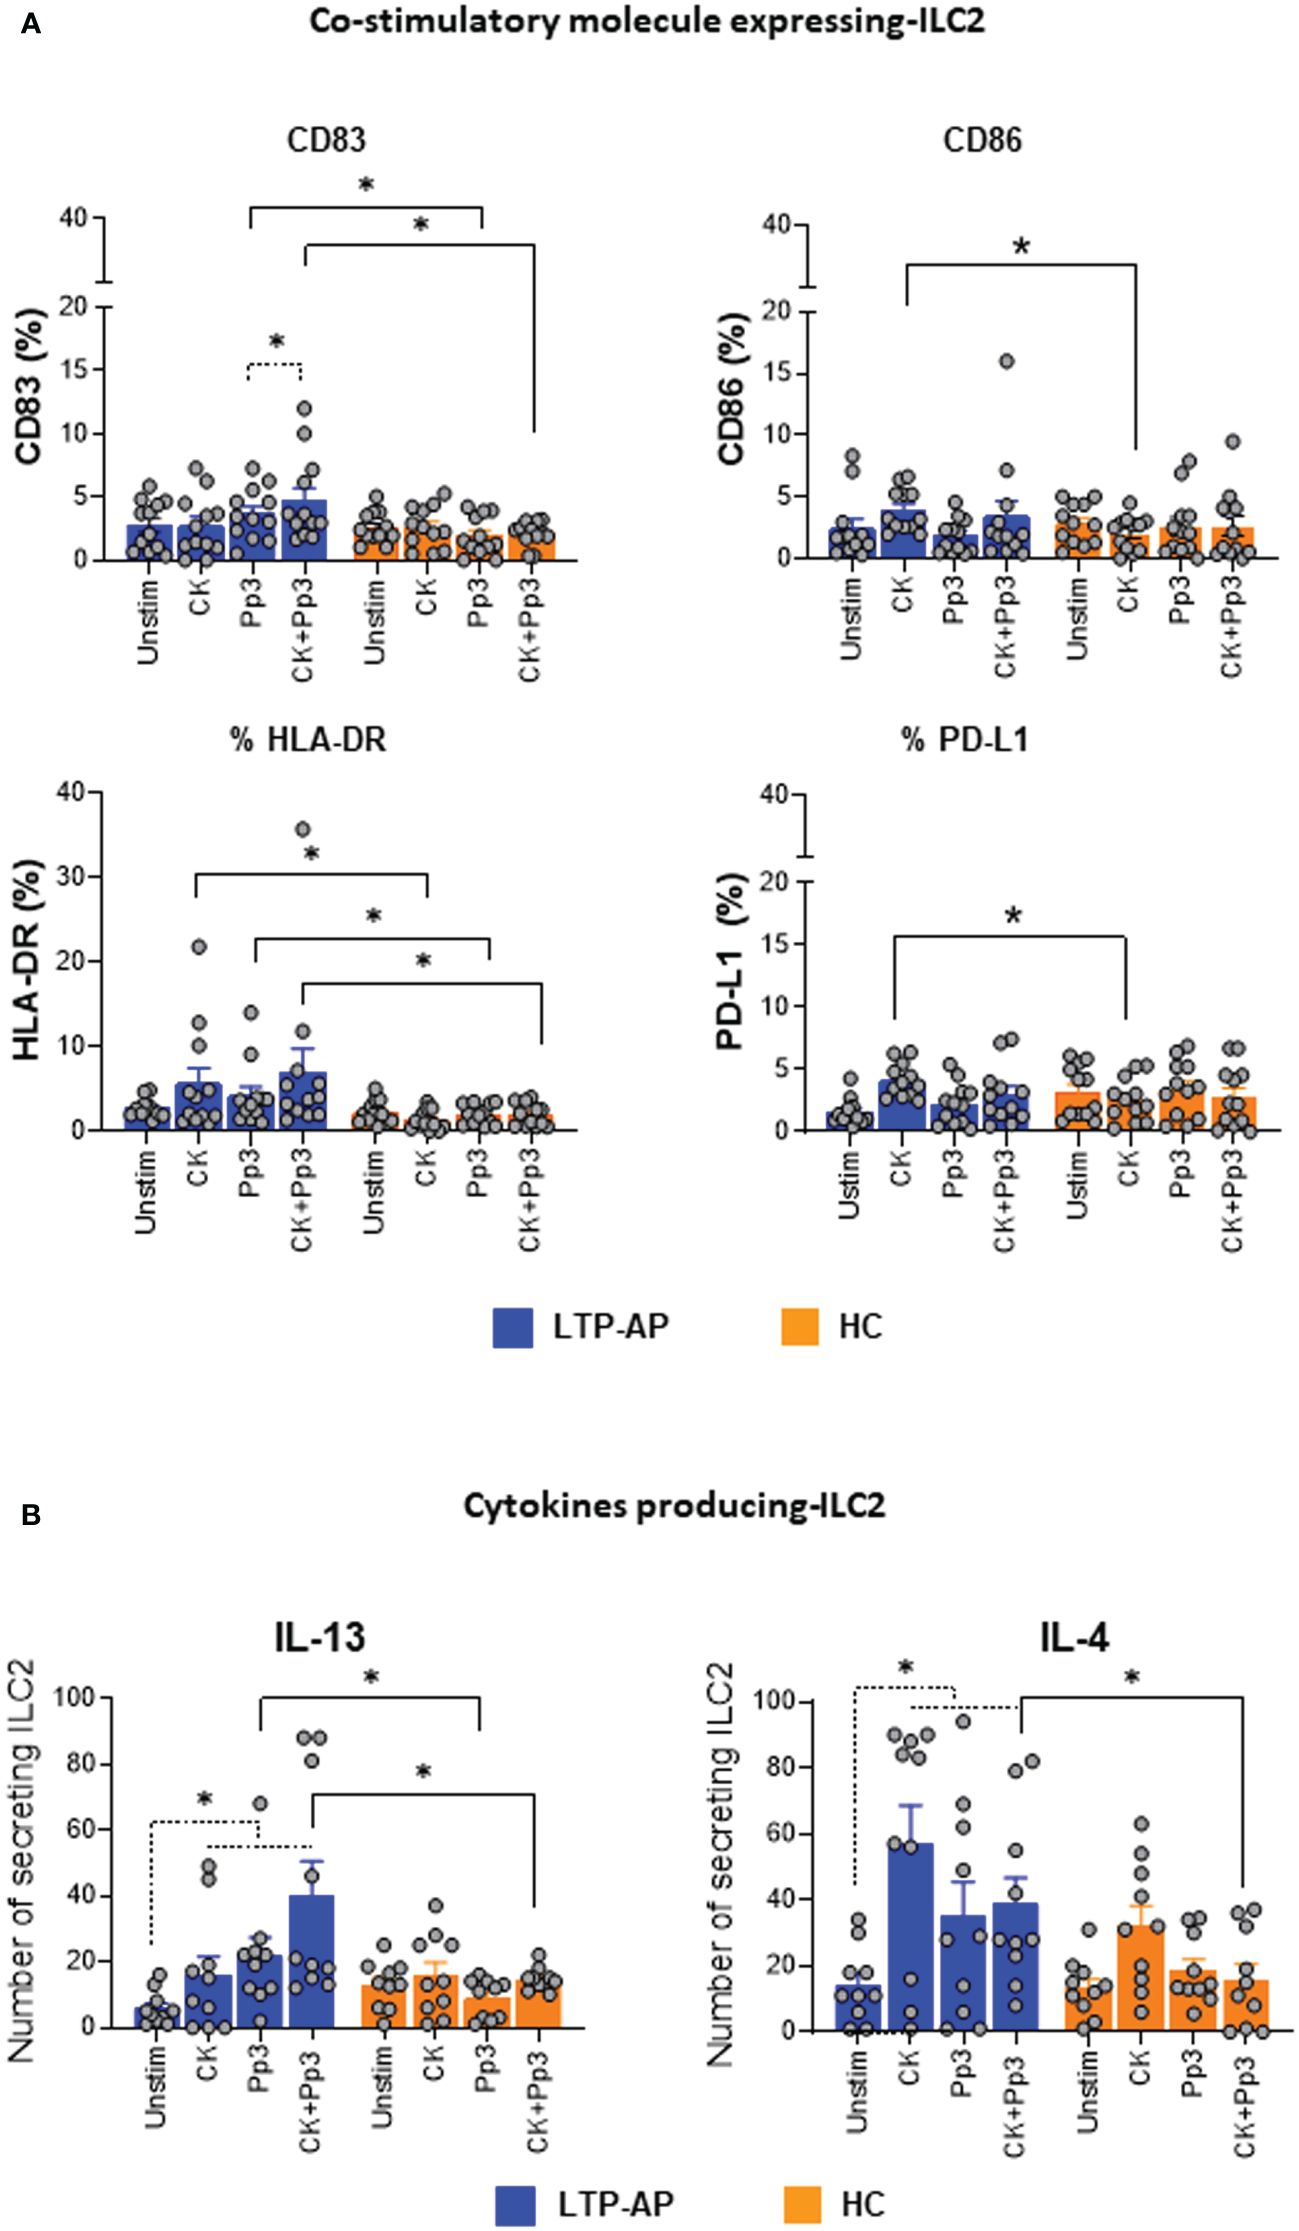
Figure 2 (A) Co-stimulatory molecule expression on ILC2. Percentages of ILC2 expressing for the different surface markers under different experimental conditions. Unstimulated cells (Unstim), cocktail cytokines (IL-25 and IL-33) at 50 ng/mL, Pru p 3 (Pp3) allergen (at 25 µm/mL), and CK+Pp3 for LTP-AP (N = 12) and HC (N = 12). (B) Cytokine producing ILC2. Number of cytokine-secreting ILC2 under different experimental conditions in LTP-AP and HC (N = 10 in both groups). The bars with symbols represent the mean and SEM of ILC2 number for (A, B). Kruskal–Wallis test, followed by Mann–Whitney test, was used for detecting differences between unrelated groups (continuous line). Friedman test, followed by Wilcoxon test, was used for pairwise comparisons in related samples (dotted line). The dashed horizontal line indicates significant differences when comparing unstimulated cells vs. the rest of the experimental conditions (CK, Pp3, and CK+Pp3) in both types of cytokines in LTP-AP. Significant p-values are marked with an asterisk (p < 0.05).
The ability of ILC2 to produce IL-4 and IL-13 in response to stimulation with cocktail cytokines, Pru p 3, and CK+Pru p 3 was investigated by ELISpot (Figure 2B). A significantly higher number of IL-13-secreting ILC2 was found in LTP-AP compared to HC when stimulating with Pru p 3, independently of the presence of cocktail cytokines, whereas IL-4-secreting ILC2 cells were only significantly increased when stimulated with the combination CK+Pru p 3 (Figure 2B). In the case of HC, Pru p 3 stimulation seems to reduce IL-13- and IL-4-producing cells compared to cocktail cytokines.
In LTP-AP, ILC2 increased the IL-13 and IL-4 production under the different stimuli compared to unstimulated cells, which suggested that these ILC2, in the presence of Pru p 3, could increase their activity.
3.4 Pru p 3-stimulated-ILC2 promotes Th2 cell proliferative response in LTP-AP
We sought to determine the effect of ILC2 stimulated with cocktail cytokines, Pru p 3, and their combination on CD3+CD4+T-cell responses. Isolated T-cell morphology, frequency, and absolute numbers are shown in Supplementary Figure S3 and were similar in LTP-AP and HC with a viability after sorting close to 100% in both groups.
Cell cultures of CD3+CD4+T-cell (alone) under the different conditions, cocktail cytokines, Pru p 3, and their combination, did not show cell proliferation in any study group, probably due to APCs’ absence (Figure 3A). Under co-culture conditions, Pru p 3- and CK+Pru p 3-stimulated ILC2 promoted a significant proliferation of T-cells and GATA3+Th2 cells in LTP-AP compared to HC (Figure 3B). However, the presence of stimulated ILC2 in co-cultures did not induce Tbet+Th1 or FOXP3+Treg proliferation in any group (Supplementary Figure S6). Moreover, these proliferative responses were abolished in the presence of Transwell plates (Figure 3C), indicating the contact-dependent mechanism. In HC, ILC2 were capable of inducing CD3+CD4+T-cell proliferation under cocktail cytokine stimulation, and this response was inhibited using Transwell plates (Figure 3C). This suggests that the cocktail of cytokines induces unspecific activation of ILC2 in HC, leading to the proliferation of CD3+CD4+T-cells, but not those with a Th2 profile.
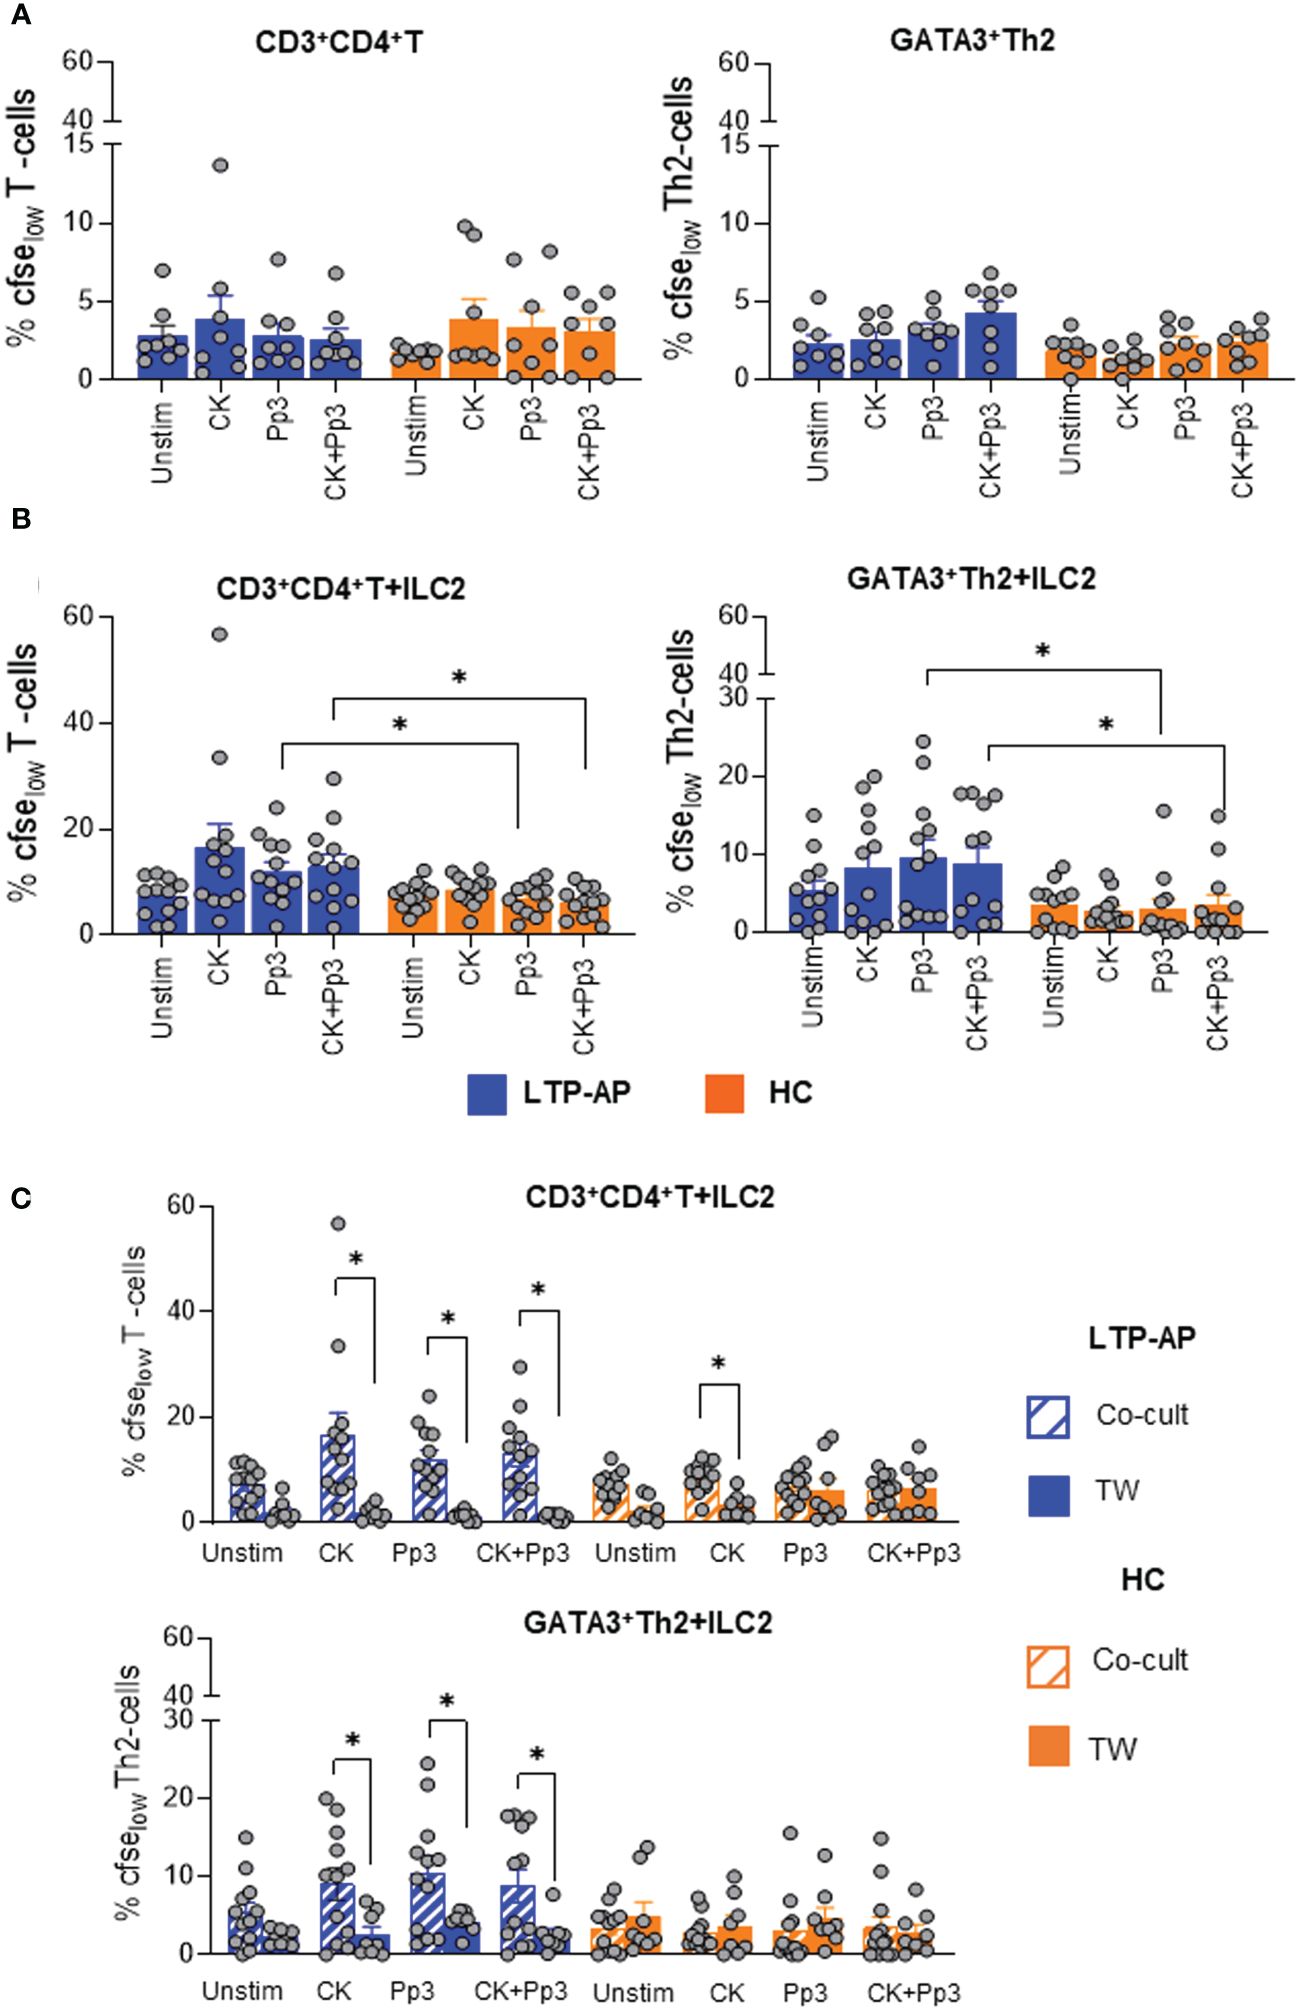
Figure 3 The bars with symbols represent the mean and SEM of percentages of CFSElow expression (A) in T-cell cultures alone for LTP-AP and HC (N = 8 in both groups), (B) in ILC2/T-cell co-cultures (LTP-AP and HC N = 12 in both groups), and (C) in ILC2/T-cell co-cultures using Transwell plate for LTP-AP and HC (N = 8, respectively) under different experimental conditions. Unstimulated cells (Unstim), cocktail cytokines (IL-25 and IL-33) at 50 ng/mL, Pru p 3 (Pp3) allergen at 25 µm/mL, and CK+Pp3. Kruskal–Wallis test, followed by Mann–Whitney test, was used to detect differences in between unrelated groups (continuous line). Friedman test, followed by Wilcoxon test, was used for pairwise comparisons in related samples (dotted line). Significant p-values are marked with an asterisk (p < 0.05).
We next sought to identify the secreted cytokines in supernatant from stimulated-ILC2 and CD3+CD4+T-cell co-cultures associated with type 2 (IL-4, IL-5, IL-9, and IL-13), type 1 (IFNγ), and regulatory (IL-10 and IL-27) immune response. IL-4, IL-5, and IL-13 levels, linked to Th2 cell polarization, were significantly detected in LTP-AP compared to HC under stimulation of Pru p 3 and CK+Pru p 3, with a clear production of these cytokines from ILC2/T-cell co-cultures in the presence of food allergens (Figure 4A). However, no changes in IL-9 levels were detected.
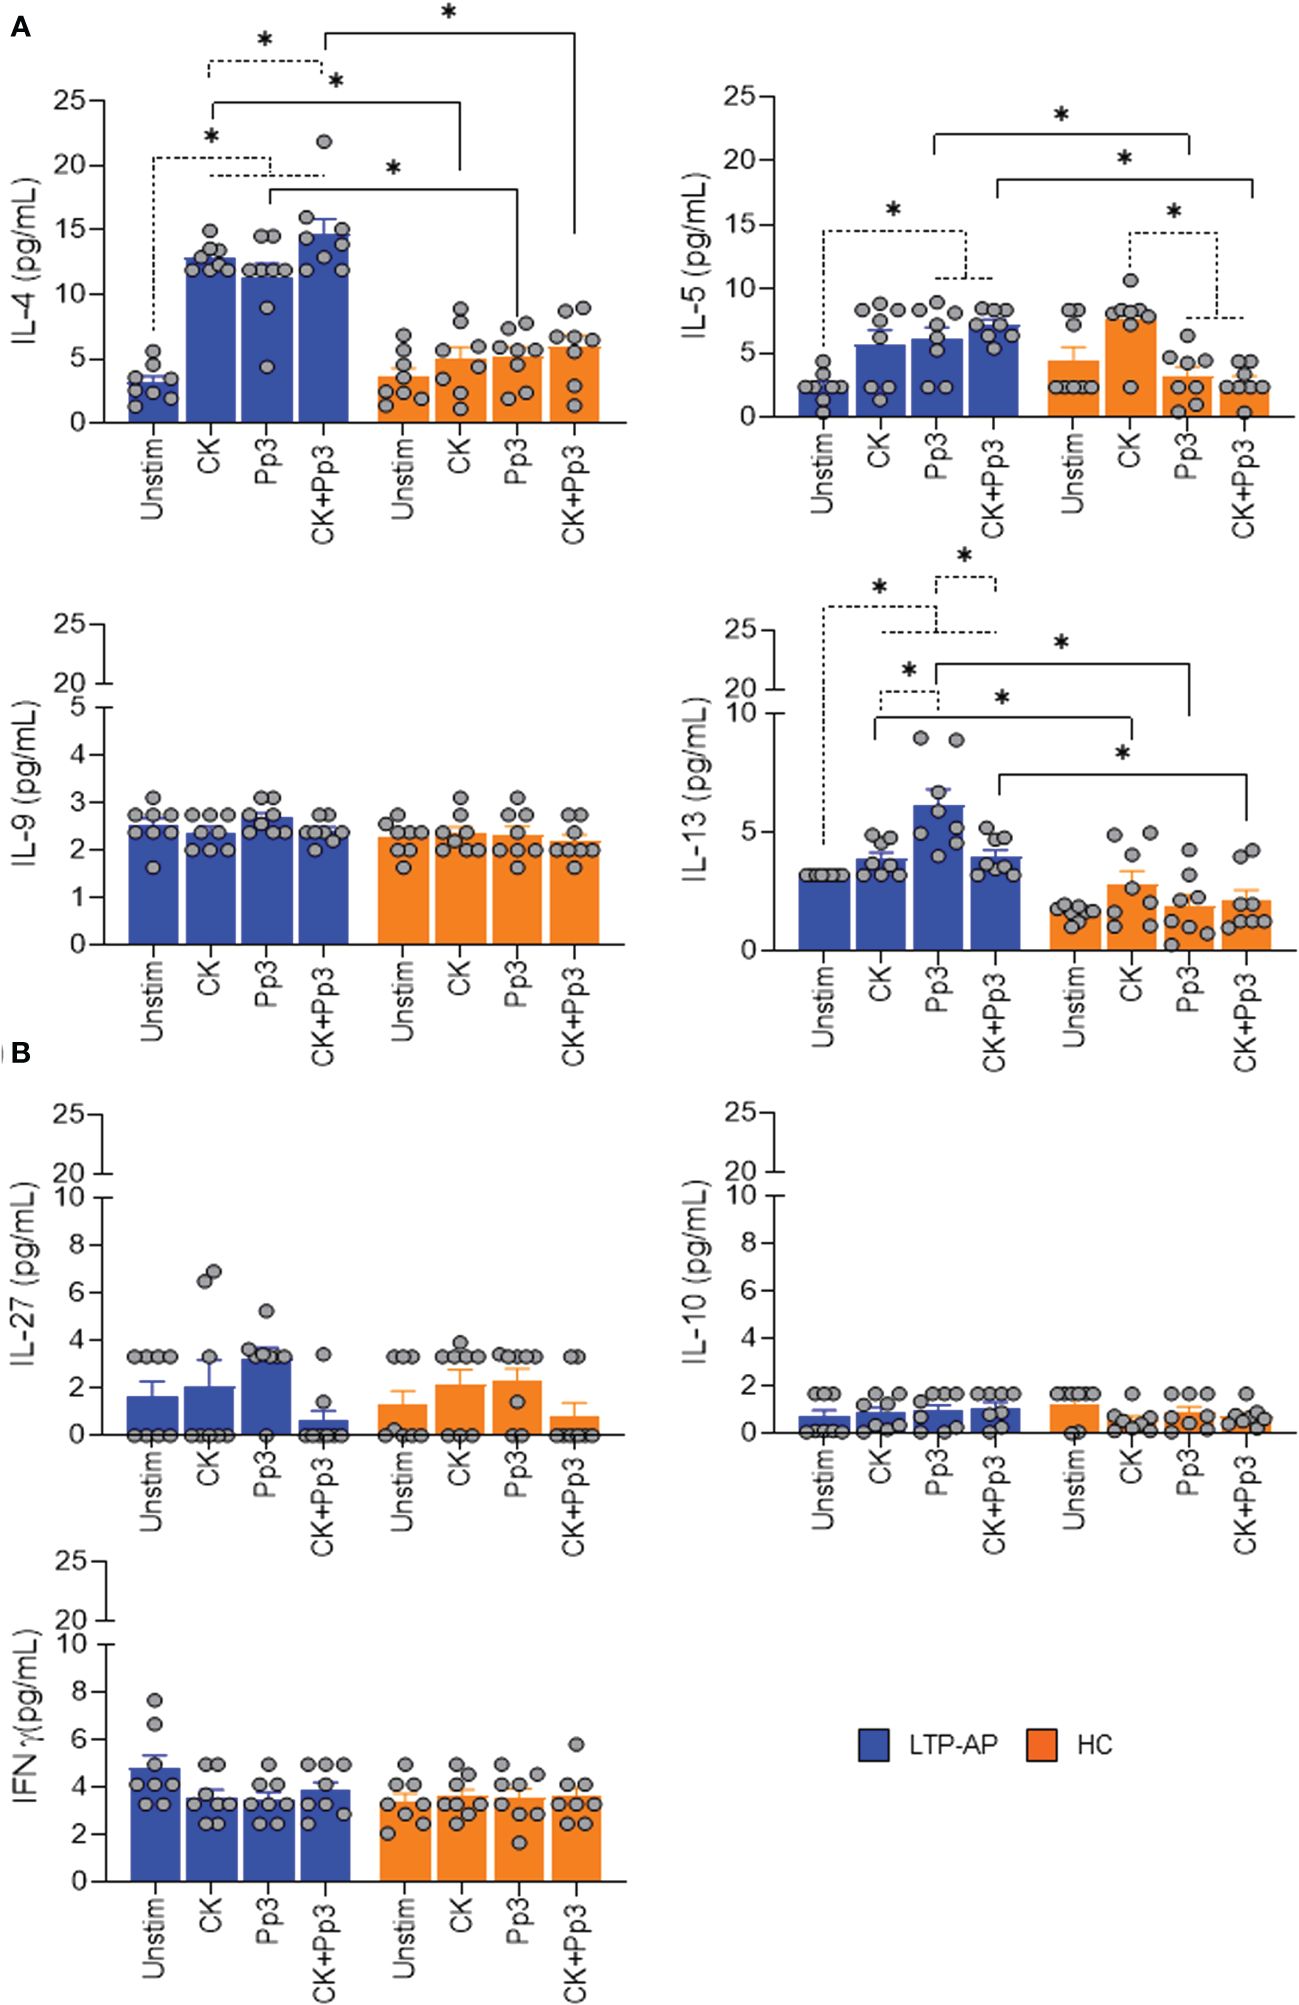
Figure 4 Cytokine production on cell co-culture. The bars with symbols represent the mean and SEM of the cytokine concentrations (pg/mL) in ILC2/T-cell co-cultures under different experimental conditions for LTP-AP and HC (N = 8 for both groups). Unstimulated cells (Unstim), cocktail cytokines (IL-25 and IL-33) at 50 ng/mL. Pru p 3 (Pp3) at 25 µm/mL, and CK+Pp3. (A) IL-4, IL-5, IL-9, and IL-13 production and (B) IL-27, IL-10, and IFNγ production on cell co-culture. Kruskal–Wallis test, followed by Mann–Whitney test, was used to detect differences in between unrelated groups (continuous line). Friedman test, followed by Wilcoxon test, was used for pairwise comparisons in related samples (dotted line). The dashed horizontal line indicates significant differences when comparing unstimulated cells vs. the rest of the experimental conditions (CK, Pp3, and CK+Pp3) in IL-4 and IL-13, and for IL-5 it indicates differences when comparing unstimulated cells vs. Pp3 and Ck+Pp3 in LTP-AP. In the case of HC, this dashed horizontal line shows significant differences between CK vs. Pp3 and CK vs. CK+Pp3. Significant p-values are marked with an asterisk (p < 0.05).
Nevertheless, in LTP-AP, the IL-4, IL-5, and IL-13 levels significantly increased in the presence of different experimental conditions with respect to unstimulated cells, and this increase was significant for IL-13 levels in the presence of Pru p 3 vs. cocktail cytokines and CK+Pru p 3. Moreover, for HC, we only observed an increase in IL-5 production under CK vs. CK+Pru p 3 and vs. Pru p 3 (Figure 4A). The IL-27, IL-10, and IFNγ levels were not detected in co-culture supernatants, confirming the ability of ILC2 to enhance CD3+CD4+T-cell type 2 cytokine production in the presence of Pru p 3 and block the regulatory response (Figure 4B).
3.5 IL-13+ILC2 are increased in severe clinical phenotypes in LTP-AP
After confirming the role of ILC2 in LTP allergy, we wanted to analyze their association with reaction severity [anaphylaxis (grades 3 and 4) and urticaria (grade 2) symptoms]. A slight increase in ILC2 frequency (ex vivo) between clinical phenotypes was found (Figure 5A), being significant in IL-13-producing ILC2 in grades 3 and 4 LTP-AP compared to grade 2 LTP-AP, under stimulation with CK+Pru p 3. No differences between clinical phenotypes were found for IL-4-producing ILC2 (Figure 5B). However, there were positive relationships between the numbers of IL-13-producing ILC2 and GATA3+Th2 cells in grades 3 and 4 LTP-AP and their sIgE serum levels, being significant for sIgE-Pru p 3 vs. GATA3+Th2 in the presence of Pru p 3 and CK+Pru p 3 (Figure 5C).
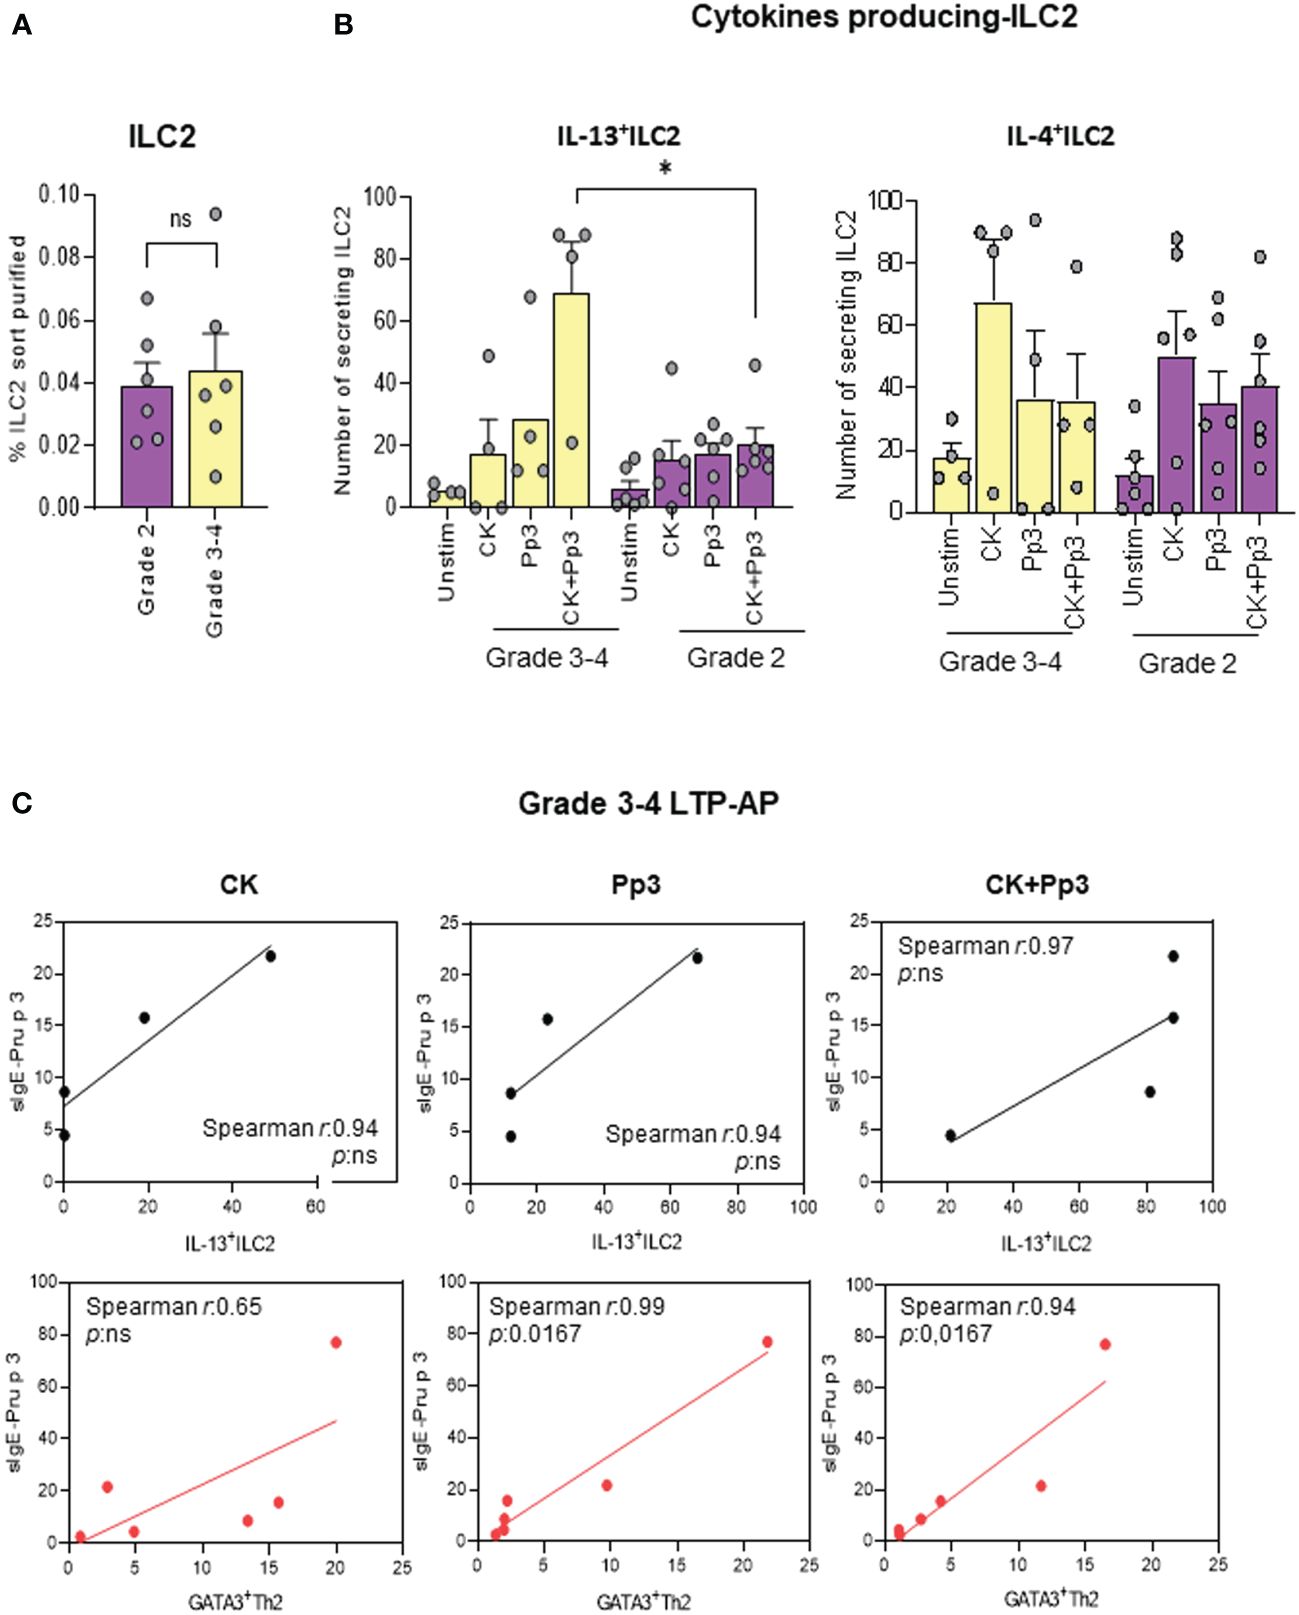
Figure 5 The bars with symbols represent the mean and SEM of (A) the percentages of purified ILC2 in grades 3 and 4 (anaphylactic) and grade 2 (urticaria) in LTP-AP (N = 6 for both phenotypes). Mann–Whitney test was used to detect differences in between unrelated groups. (B) Number of cytokines secreting ILC2 in anaphylactic (N = 4) and urticaria (N = 6) in LTP-AP. Kruskal–Wallis test, followed by Mann–Whitney test, was used to detect differences in between unrelated groups. Significant p-values are marked with an asterisk (p < 0.05). (C) Spearman correlation of IL13+ILC2 (black round symbols) and GATA3+Th2 cells (red round symbols) vs. Pru p 3 (Pp3) -sIgE in grades 3 and 4 LTP-AP. Significant p-values when p <0.05.
4 Discussion
FA is an abnormal immune response to a specific food that can be sIgE-mediated (immediate hypersensitivity reactions), non-IgE-mediated (eosinophilic esophagitis) (34), and mixed (immune reactions mediated by IgE and cells) (35). Classically, DCs are considered APCs, responsible for T2 immune response in respiratory and FA pathologies (9, 36). Evidence indicates that ILC2 are implicated in the immune response of allergic diseases (36), and specifically we demonstrated that also in FA to nsLTPs (23). Although ILC2 were classically claimed to activate in an antigen-independent manner (37), we have demonstrated that they can interact with Pru p 3 food allergen and activate, increasing the expression of costimulatory molecules and the production of T2 cytokines in LTP-AP. This study, in which ILC2 demonstrate the induction of an allergen-specific immunological response in LTP-AP, confirms our previous results (23).
Recent work has shown that ILC2, under stimulation of IL-33 and IL-25 (cocktail cytokines), enhance the T2 immunity (14). However, various cell surface molecules mediating cell–cell interactions serve as important ILC2 regulators and play critical roles in ILC2-driven allergic inflammation (26). Our results confirm that, in response to cocktail cytokines, ILC2 upregulated CD86 and PD-L1, as observed in ILC2 from IL-33-treated mice and humans (38) in infectious diseases (39), leading to an increase in the effector response (40). Interestingly, this happens only in LTP-AP but not in HC, suggesting a predisposition of ILC2 to present a faster and greater reactivity, indicating an inflammatory background in allergic subjects.
In this study, we demonstrated that ILC2 also expressed the costimulatory molecule CD83 and HLA-DR under stimulation of the involved allergen Pru p 3 alone or combined with cytokines, Pru p 3+CK, with a capacity to produce T2 cytokines, mainly IL-13, in a specific way since this only happens in LTP-AP. These results showed a more efficient immunological response when both allergen and cytokines interact with ILC2. Moreover, the expression of HLA-DR and CD83 on ILC2 could be the basis of an agonist effect necessary for the activation of T-cells, as described for MHC-II and CD86 (26), and contribute to T2 immune response in FA (41).
DCs are considered the professional APCs, responsible for T2 immune response in FA, as demonstrated in LTP-AP (9, 27). In fact, the Pru p 3 allergen was able to activate DCs, increasing the expression percentages of HLA-DR, CD83, and PD-L1 in LTP-AP compared with HC inducing an increase in Th2 cell proliferation and a decrease in regulatory T-cells (reduction in IL-10 production by them) (9, 27). In line with these results, we here show that ILC2 also increase their HLA-DR expression in the presence of Pru p 3, suggesting that they may also act as APCs. Indeed ILC2 take up Pru p 3, increasing CD83 and HLA-DR expression in LTP-AP. This agrees with another study in human in vitro assay where ILC2 process and present Der p 1 allergen to T-cells and exacerbate a T2 inflammatory response (26). Additionally, the role of ILC2 as APCs can be supported by the fact that, in the presence of ILC2, isolated T-cells proliferate in an antigen-specific manner and by a direct cell–cell contact (ILC2/T-cells), as shown in other in vivo and in vitro studies (42, 43). Given that, our results reveal a significant proliferation of T-cells and Th2 cells in LTP-AP, particularly when there is a direct contact between ILC2/T-cells in the presence of Pru p 3 allergen and their combinations with cocktail cytokines. This specific proliferation is further validated by the absence of proliferation of both cell types in co-cultures using Transwell plates. Importantly, this proliferation of T-cell and Th2 cells is accompanied by an increased production of T2 cytokines such as IL-4, IL-5, and IL-13, which further supports the importance of the physical interaction between ILC2 and T-cells in exacerbating the food allergic response.
Afterwards, we tried to dissect the effect of ILC2 mediated by Pru p 3 allergen and their combinations with cocktail cytokines in the immunological response in LTP-AP and observed that allergen-stimulated ILC2 promote an effector response in vitro that was accompanied by an absence of Tbet+Th1- and FOXP3+Treg cell proliferation with suppression of IL-10, IL-27, and IFNγ production, confirming the lack of regulatory response in the allergic reaction (44). It is tempting to speculate that this lack of regulatory response is possibly blocked by IL4- or IL13-producing ILC2 as demonstrated by others (21). Regarding this, the lack of regulatory response occurs in the interaction between ILC2 and T-cells, which blocks the generation of allergen-specific Treg cells and promotes FA.
We previously showed that, depending on the clinical phenotype, there was an increase in the frequency of IL-4+ILC2 and IL-13+ILC2 in LTP-AP with grades 3 and 4 compared to grade 2 (23). Despite the limited sample size in the different clinical phenotypes, our results confirm these previous data indicating that, in the presence of Pru p 3, ILC2 can produce higher levels of IL-13 in anaphylactic LTP-AP than in urticaria. This IL-13 production was significantly higher than IL-4 production in anaphylactic LTP-AP. Furthermore, IL-13+ILC2 in grades 3 and 4 LTP-AP had a positive correlation with the parameters of the effector response, Pru p 3-sIgE levels, and Th2 cell proliferation. These observations, together with the link between ILC2 and the IgE-mediated adaptive response, represent an important advance in the role of ILC2 in FA (20), suggesting them as key components and a potential therapeutic target for FA in clinical practice. In fact, ILC2 activation by Pru p 3 will trigger the release of inflammatory cytokines and amplify the allergic response.
Although our study has limitations such as the small sample size or the lack of in vitro studies relating the possible sentinel function of DCs on ILC2 for the generation of a Th2 cell response or the blocking MHCII/T-cell receptors (TCR) interactions, it shows important advances regarding the immunological mechanism mediated by ILC2 in LTP-AP. This study focuses on studying the role of ILC2 in the effector immunological response in food allergy. Nevertheless, it would be interesting to advance in future research on the role played by these ILC2 in the sensitization phases of the response by analyzing naive T-cells.
In summary, ILC2 are involved in the immunopathology of FA acting as antigen-presenting cells and promoting the T2 effector response in LTP-AP. Our results may be of interest in vivo, as they show that ILC2 can develop FA, mainly in severe clinical phenotypes, and therefore could be considered as a potential therapeutic target both in clinical practice and for the development of new treatments in FA.
Data availability statement
The datasets presented in this study can be found in online repositories. The names of the repository/repositories and accession number(s) can be found in the article/Supplementary Material.
Ethics statement
The study was conducted at the Allergy Service and Research Laboratory of the Hospital Regional Universitario de Málaga-Instituto de Biomedicina de Málaga (HRUM-IBIMA), Spain, in accordance with the Declaration of Helsinki and approved by the local ethics committee include: (code: 2201-N-20). All participants signed informed consent forms. The studies were conducted in accordance with the local legislation and institutional requirements. The participants provided their written informed consent to participate in this study.
Author contributions
FP: Conceptualization, Data curation, Formal analysis, Funding acquisition, Investigation, Methodology, Supervision, Writing – original draft, Writing – review & editing. NP-S: Conceptualization, Funding acquisition, Investigation, Writing – review & editing. NN: Formal analysis, Investigation, Methodology, Writing – review & editing. RN: Data curation, Formal analysis, Software, Writing – original draft, Writing – review & editing. JC: Validation, Writing – original draft. MM-A: Methodology, Writing – original draft. AC-A: Methodology, Writing – original draft. MT: Funding acquisition, Project administration, Resources, Supervision, Writing – review & editing. IE-G: Conceptualization, Supervision, Writing – original draft, Writing – review & editing. CM: Conceptualization, Funding acquisition, Investigation, Resources, Supervision, Validation, Writing – original draft, Writing – review & editing. FG: Conceptualization, Data curation, Funding acquisition, Investigation, Project administration, Supervision, Validation, Writing – original draft, Writing – review & editing.
Funding
The author(s) declare financial support was received for the research, authorship, and/or publication of this article. The study was funded by grants from the Andalusian Regional Ministry of Health (PI-0099-2020 and PI-0047-2022), Senior Clinical Researcher (B-0005-2019), Nicolas Monardes Program (RC-0004-2021), and Senior Postdoctoral Program (RH-0028-2021). Additional funding was provided by the Andalusian Regional Ministry of Economic Transformation, Industry, Knowledge (UMA20-FEDERJA-151). This study was also supported by the Institute of Health 'Carlos III' (ISCIII) of the Ministry of Science and Innovation through projects PI17/01318, PI21/01391, and PI21/000346, co-funded by the European Union, as well as the Juan Rodés Program (JR19/00029 and JR21/00024), Sara Borrell Program (CD20/00085), and its program of Redes Temáticas de Investigación Cooperativa en Salud (RETICS): Asma, Reacciones Adversas y Alérgicas-ARADyAL (RD16/0006/0001), and Redes de Investigación Cooperativa Orientadas al Resultado en Salud (RICORS): Enfermedades Inflamatorias (RD21/0002/0008). Additionally, this study received funding from Grant CNS2023-145123, the Ramon y Cajal Program (RYC2021-031256-I), and EQC2018-004874-P funded by MCIN/AEI, and by the European Union NextGeneration EU/PRTR. All grants were co-funded by the European Regional Development Fund, ‘Una manera de hacer Europa’ ‘Andalucía se mueve con Europa’.
Acknowledgments
The authors would like to thank Nanoimaging Unit for their help with the confocal microscopy analysis. We also thank Carolina Lobo (SCAI-Central Research Support Services-Malaga University) for her assistance with the Bio-Plex analyzer and the BIOBANK of IBIMA at Hospital Regional Universitario de Malaga for the biological sample management.
Conflict of interest
The authors declare that the research was conducted in the absence of any commercial or financial relationships that could be construed as a potential conflict of interest.
Publisher’s note
All claims expressed in this article are solely those of the authors and do not necessarily represent those of their affiliated organizations, or those of the publisher, the editors and the reviewers. Any product that may be evaluated in this article, or claim that may be made by its manufacturer, is not guaranteed or endorsed by the publisher.
Supplementary material
The Supplementary Material for this article can be found online at: https://www.frontiersin.org/articles/10.3389/fimmu.2024.1385101/full#supplementary-material
Abbreviations
APC, antigen-presenting cells; DCs, dendritic cells; DBPCFC, double-blind placebo-controlled food challenge; FA, food allergy; HC, healthy controls; ILC, innate lymphoid cells; ILC2, type 2 innate lymphoid cells; LTP-AP, lipid transfers proteins allergic patients; nsLTP, non-specific lipid transfers proteins; SPT, skin prick test; sIgE, specific immunoglobulin E; TSLP, thymic stromal lymphopoietin; Treg, T regulatory; T2, type 2 immune response.
References
1. Savage J, Johns CB. Food allergy: epidemiology and natural history. Immunol Allergy Clin North Am. (2015) 35:45–59. doi: 10.1016/j.iac.2014.09.004
2. Sicherer SH, Sampson HA. Food allergy: Epidemiology, pathogenesis, diagnosis, and treatment. J Allergy Clin Immunol. (2014) 133:291–307. doi: 10.1016/j.jaci.2013.11.020
3. Sicherer SH, Sampson HA. Food allergy: A review and update on epidemiology, pathogenesis, diagnosis, prevention, and management. J Allergy Clin Immunol. (2018) 141:41–58. doi: 10.1016/j.jaci.2017.11.003
4. Scheurer S, Schulke S. Interaction of non-specific lipid-transfer proteins with plant-derived lipids and its impact on allergic sensitization. Front Immunol. (2018) 9:1389. doi: 10.3389/fimmu.2018.01389
5. Skypala IJ, Asero R, Barber D, Cecchi L, Diaz Perales A, Hoffmann-Sommergruber K, et al. Non-specific lipid-transfer proteins: Allergen structure and function, cross-reactivity, sensitization, and epidemiology. Clin Transl Allergy. (2021) 11:e12010. doi: 10.1002/clt2.12010
6. Pastorello EA, Robino AM. Clinical role of lipid transfer proteins in food allergy. Mol Nutr Food Res. (2004) 48:356–62. doi: 10.1002/mnfr.200400047
7. Bogas G, Munoz-Cano R, Mayorga C, Casas R, Bartra J, Perez N, et al. Phenotyping peach-allergic patients sensitized to lipid transfer protein and analysing severity biomarkers. Allergy. (2020) 75:3228–36. doi: 10.1111/all.14447
8. Munoz-Cano R, San Bartolome C, Casas-Saucedo R, Araujo G, Gelis S, Ruano-Zaragoza M, et al. Immune-mediated mechanisms in cofactor-dependent food allergy and anaphylaxis: effect of cofactors in basophils and mast cells. Front Immunol. (2020) 11:623071. doi: 10.3389/fimmu.2020.623071
9. Gomez E, Diaz-Perales A, Tordesillas L, Dona I, Torres MJ, Blazquez AB, et al. Effect of Pru p 3 on dendritic cell maturation and T-lymphocyte proliferation in peach allergic patients. Ann Allergy Asthma Immunol. (2012) 109:52–8. doi: 10.1016/j.anai.2012.05.017
10. Satitsuksanoa P, Jansen K, Globinska A, van de Veen W, Akdis M. Regulatory immune mechanisms in tolerance to food allergy. Front Immunol. (2018) 9:2939. doi: 10.3389/fimmu.2018.02939
11. Eiwegger T, Hung L, San Diego KE, O’Mahony L, Upton J. Recent developments and highlights in food allergy. Allergy. (2019) 74:2355–67. doi: 10.1111/all.14082
12. Kortekaas Krohn I, Shikhagaie MM, Golebski K, Bernink JH, Breynaert C, Creyns B, et al. Emerging roles of innate lymphoid cells in inflammatory diseases: Clinical implications. Allergy. (2018) 73:837–50. doi: 10.1111/all.13340
13. Jin J, Sunusi S, Lu H. Group 2 innate lymphoid cells (ILC2s) are important in typical type 2 immune-mediated diseases and an essential therapeutic target. J Int Med Res. (2022) 50:3000605211053156. doi: 10.1177/03000605211053156
14. Zheng H, Zhang Y, Pan J, Liu N, Qin Y, Qiu L, et al. The role of type 2 innate lymphoid cells in allergic diseases. Front Immunol. (2021) 12:586078. doi: 10.3389/fimmu.2021.586078
15. Jacquelot N, Seillet C, Vivier E, Belz GT. Innate lymphoid cells and cancer. Nat Immunol. (2022) 23:371–9. doi: 10.1038/s41590-022-01127-z
16. Norlander AE, Peebles RS Jr. Innate type 2 responses to respiratory syncytial virus infection. Viruses. (2020) 12(5):521. doi: 10.3390/v12050521
17. Mjosberg J, Spits H. Human innate lymphoid cells. J Allergy Clin Immunol. (2016) 138:1265–76. doi: 10.1016/j.jaci.2016.09.009
18. Pasha MA, Patel G, Hopp R, Yang Q. Role of innate lymphoid cells in allergic diseases. Allergy Asthma Proc. (2019) 40:138–45. doi: 10.2500/aap.2019.40.4217
19. Sahiner UM, Layhadi JA, Golebski K, Istvan Komlosi Z, Peng Y, Sekerel B, et al. Innate lymphoid cells: The missing part of a puzzle in food allergy. Allergy. (2021) 76:2002–16. doi: 10.1111/all.14776
20. Lee JB, Chen CY, Liu B, Mugge L, Angkasekwinai P, Facchinetti V, et al. IL-25 and CD4(+) TH2 cells enhance type 2 innate lymphoid cell-derived IL-13 production, which promotes IgE-mediated experimental food allergy. J Allergy Clin Immunol. (2016) 137:1216–25 e5. doi: 10.1016/j.jaci.2015.09.019
21. Noval Rivas M, Burton OT, Oettgen HC, Chatila T. IL-4 production by group 2 innate lymphoid cells promotes food allergy by blocking regulatory T-cell function. J Allergy Clin Immunol. (2016) 138:801–11 e9. doi: 10.1016/j.jaci.2016.02.030
22. Lefrancais E, Duval A, Mirey E, Roga S, Espinosa E, Cayrol C, et al. Central domain of IL-33 is cleaved by mast cell proteases for potent activation of group-2 innate lymphoid cells. Proc Natl Acad Sci U S A. (2014) 111:15502–7. doi: 10.1073/pnas.1410700111
23. Palomares F, Gomez F, Bogas G, Maggi L, Cosmi L, Annunziato F, et al. Innate lymphoid cells type 2 in LTP-allergic patients and their modulation during sublingual immunotherapy. Allergy. (2021) 76:2253–6. doi: 10.1111/all.14745
24. Rao A, Strauss O, Kokkinou E, Bruchard M, Tripathi KP, Schlums H, et al. Cytokines regulate the antigen-presenting characteristics of human circulating and tissue-resident intestinal ILCs. Nat Commun. (2020) 11:2049. doi: 10.1038/s41467-020-15695-x
25. Halim TY, Hwang YY, Scanlon ST, Zaghouani H, Garbi N, Fallon PG, et al. Group 2 innate lymphoid cells license dendritic cells to potentiate memory TH2 cell responses. Nat Immunol. (2016) 17:57–64. doi: 10.1038/ni.3294
26. Oliphant CJ, Hwang YY, Walker JA, Salimi M, Wong SH, Brewer JM, et al. MHCII-mediated dialog between group 2 innate lymphoid cells and CD4(+) T cells potentiates type 2 immunity and promotes parasitic helminth expulsion. Immunity. (2014) 41:283–95. doi: 10.1016/j.immuni.2014.06.016
27. Palomares F, Gomez F, Bogas G, Campo P, Perkins JR, Diaz-Perales A, et al. Immunological changes induced in peach allergy patients with systemic reactions by pru p 3 sublingual immunotherapy. Mol Nutr Food Res. (2018) 62(3). doi: 10.1002/mnfr.201700669
28. Schwartz C, Khan AR, Floudas A, Saunders SP, Hams E, Rodewald HR, et al. ILC2s regulate adaptive Th2 cell functions via PD-L1 checkpoint control. J Exp Med. (2017) 214:2507–21. doi: 10.1084/jem.20170051
29. Fernandez-Rivas M, Gomez Garcia I, Gonzalo-Fernandez A, Fuentes Ferrer M, Dolle-Bierke S, Marco-Martin G, et al. Development and validation of the food allergy severity score. Allergy. (2022) 77:1545–58. doi: 10.1111/all.15165
30. Muraro A, Werfel T, Hoffmann-Sommergruber K, Roberts G, Beyer K, Bindslev-Jensen C, et al. EAACI food allergy and anaphylaxis guidelines: diagnosis and management of food allergy. Allergy. (2014) 69:1008–25. doi: 10.1111/all.12429
31. Dreyer F, Schmitt A. Different effects of botulinum A toxin and tetanus toxin on the transmitter releasing process at the mammalian neuromuscular junction. Neurosci Lett. (1981) 26:307–11. doi: 10.1016/0304-3940(81)90150-6
32. Losada Mendez J, Palomares F, Gomez F, Ramirez-Lopez P, Ramos-Soriano J, Torres MJ, et al. Immunomodulatory response of toll-like receptor ligand-peptide conjugates in food allergy. ACS Chem Biol. (2021) 16:2651–64. doi: 10.1021/acschembio.1c00765
33. Ercolano G, Gomez-Cadena A, Dumauthioz N, Vanoni G, Kreutzfeldt M, Wyss T, et al. PPARγ drives IL-33-dependent ILC2 pro-tumoral functions. Nat Commun. (2021) 12:2538. doi: 10.1038/s41467-021-22764-2
34. Wilson JM, Li RC, McGowan EC. The role of food allergy in eosinophilic esophagitis. J Asthma Allergy. (2020) 13:679–88. doi: 10.2147/JAA.S238565
35. Mayorga C, Palomares F, Canas JA, Perez-Sanchez N, Nunez R, Torres MJ, et al. New insights in therapy for food allergy. Foods. (2021) 10(5):1037. doi: 10.3390/foods10051037
36. Maspero J, Adir Y, Al-Ahmad M, Celis-Preciado CA, Colodenco FD, Giavina-Bianchi P, et al. Type 2 inflammation in asthma and other airway diseases. ERJ Open Res. (2022) 8(3):00576-2021. doi: 10.1183/23120541.00576-2021
37. Khodoun MV, Tomar S, Tocker JE, Wang YH, Finkelman FD. Prevention of food allergy development and suppression of established food allergy by neutralization of thymic stromal lymphopoietin, IL-25, and IL-33. J Allergy Clin Immunol. (2018) 141:171–9 e1. doi: 10.1016/j.jaci.2017.02.046
38. Taylor S, Huang Y, Mallett G, Stathopoulou C, Felizardo TC, Sun MA, et al. PD-1 regulates KLRG1(+) group 2 innate lymphoid cells. J Exp Med. (2017) 214:1663–78. doi: 10.1084/jem.20161653
39. Hepworth MR, Monticelli LA, Fung TC, Ziegler CG, Grunberg S, Sinha R, et al. Innate lymphoid cells regulate CD4+ T-cell responses to intestinal commensal bacteria. Nature. (2013) 498:113–7. doi: 10.1038/nature12240
40. Gurram RK, Zhu J. Orchestration between ILC2s and Th2 cells in shaping type 2 immune responses. Cell Mol Immunol. (2019) 16:225–35. doi: 10.1038/s41423-019-0210-8
41. Burton OT, Medina Tamayo J, Stranks AJ, Miller S, Koleoglou KJ, Weinberg EO, et al. IgE promotes type 2 innate lymphoid cells in murine food allergy. Clin Exp Allergy. (2018) 48:288–96. doi: 10.1111/cea.13075
42. Mirchandani AS, Besnard AG, Yip E, Scott C, Bain CC, Cerovic V, et al. Type 2 innate lymphoid cells drive CD4+ Th2 cell responses. J Immunol. (2014) 192:2442–8. doi: 10.4049/jimmunol.1300974
43. Drake LY, Iijima K, Kita H. Group 2 innate lymphoid cells and CD4+ T cells cooperate to mediate type 2 immune response in mice. Allergy. (2014) 69:1300–7. doi: 10.1111/all.12446
Keywords: food allergy, lipid transfers proteins, innate lymphoid cells, antigen-presenting cells, type 2 immune response, Th2-cells
Citation: Palomares F, Pérez-Sánchez N, Nieto N, Núñez R, Cañas JA, Martín-Astorga MdC, Cruz-Amaya A, Torres MJ, Eguíluz-Gracia I, Mayorga C and Gómez F (2024) Group 2 innate lymphoid cells are key in lipid transfer protein allergy pathogenesis. Front. Immunol. 15:1385101. doi: 10.3389/fimmu.2024.1385101
Received: 11 February 2024; Accepted: 05 April 2024;
Published: 25 April 2024.
Edited by:
Teresa Bellon, University Hospital La Paz Research Institute (IdiPAZ), SpainReviewed by:
Rosa Rodriguez-Perez, University Hospital La Paz Research Institute (IdiPAZ), SpainKapil Sirohi, National Jewish Health, United States
Copyright © 2024 Palomares, Pérez-Sánchez, Nieto, Núñez, Cañas, Martín-Astorga, Cruz-Amaya, Torres, Eguíluz-Gracia, Mayorga and Gómez. This is an open-access article distributed under the terms of the Creative Commons Attribution License (CC BY). The use, distribution or reproduction in other forums is permitted, provided the original author(s) and the copyright owner(s) are credited and that the original publication in this journal is cited, in accordance with accepted academic practice. No use, distribution or reproduction is permitted which does not comply with these terms.
*Correspondence: Francisca Palomares, ZnJhbmNpcy5wYWxvbWFyZXNAZ21haWwuY29t; Cristobalina Mayorga, bGluYS5tYXlvcmdhQGliaW1hLmV1
†These authors share first authorship
‡These authors share senior authorship