 Katharina M. Scheurlen1
 Jacob Hallion1Dylan L. Snook1Anne MacLeod1Robert J. Beal1Mary A. Parks1Andrew B. Littlefield1Eliah Hiken1Adrian T. Billeter2Jeannette Bensen3
 Jeremy T. Gaskins4
 Julia Chariker5
 Eric C. Rouchka5
 Susan Galandiuk1*
- 1Digestive Surgery Research Laboratory, Price Institute of Surgical Research, The Hiram C. Polk, Jr., MD Department of Surgery, University of Louisville, Louisville, KY, United States
- 2Department of Visceral Surgery, Clarunis-University Digestive Healthcare Center, St. Claraspital and University Hospital Basel, Basel, Switzerland
- 3Lineberger Comprehensive Cancer Center, University of North Carolina at Chapel Hill, Chapel Hill, NC, United States
- 4Department of Bioinformatics & Biostatistics, University of Louisville, Louisville, KY, United States
- 5Kentucky IDeA Networks of Biomedical Research Excellence (KY INBRE), Bioinformatics Core, University of Louisville, Louisville, KY, United States
Introduction: Obesity is a strong risk factor for early-onset colon cancer (EOCC) and is associated with chronic inflammation largely mediated by macrophages. The macrophage-specific metabolite itaconate promotes growth in several types of cancer; however, its role in colon cancer (CC) is unknown. Here, we investigate a tumor promoting link between obesity-related hormones and itaconate within the NOTCH4-GATA4-IRG1 pathway in EOCC.
Methods: Patient tissue (n=20) was obtained and qRT-PCR, ELISA, and mass spectrometry were performed to evaluate IRG1 expression (Human Immune-Responsive Gene 1, encoding ACOD1), ACOD1 expression (Cis-aconitate decarboxylase 1, enzyme producing itaconate), and itaconate concentration in human CC versus EOCC. RNA sequencing data from 5 sources in the USA and Europe were obtained to perform IRG1-related differential expression analysis (n=178), IRG1-related survival analysis (n=185), and differential expression analysis and survival analysis related to genes of the NOTCH4-GATA4-IRG1 pathway (n=371). Furthermore, tumor versus normal colon was compared and the interaction of tissue with sex, age, and body mass index (BMI) was investigated. A coculture model using two CC cell lines (HT-29 and SW480) and THP-1 cell line-derived M0 and M2-like macrophages was used to evaluate NOTCH4-GATA4-IRG1 pathway-related gene expression following treatment with obesity-related hormones (leptin, adiponectin) and itaconate derivatives.
Results: Both ACOD1 and IRG1 expression were elevated in human CC tissue compared to adjacent normal colon tissue. Normal colon itaconate levels were higher in EOCC patients compared to that in older patients. Plasma itaconate levels in CC patients correlated with their BMI. Survival was decreased in IRG1-positive stage IV CC. IRG1-associated gene expression within the NOTCH4-GATA4-IRG1 pathway differed in CC versus normal colon tissue: GATA4, DLL4, VEGFA, and MAPK15 upregulation was associated with EOCC, while ABCG5 and GATA5 were downregulated in CCs and associated with higher BMI. Adiponectin and leptin treatment of macrophages cocultured with CC cells increased IRG1 expression.
Discussion: Obesity-related hormones can increase itaconate production in M2-like macrophages. IRG1 expression and the NOTCH4-GATA4-IRG1 pathway are associated with EOCC, BMI, and patient survival. As a macrophage metabolite affecting inflammation, itaconate may have a particular immunotherapeutic role in patients with EOCC.
1 Introduction
Early-onset colon cancer (EOCC) has become one of the three most common causes of cancer death among those less than 50 years old in the United States; the underlying mechanisms are poorly understood (1). Simultaneously, obesity and metabolic dysfunction prevalence continue to increase among people in the United States, with more than 42% of adults over the age of 20 years being obese (2). The Nurses’ Health Study II demonstrated a direct link between obesity and EOCC risk among young women (3).
Chronic inflammation and metabolic overload in obese individuals lead to altered cellular metabolism and increased oxidative stress, both associated with colorectal carcinogenesis (4–7). The anti-inflammatory mitochondrial metabolite itaconate, a specific product of the Krebs cycle in macrophages, is a regulator of these mechanisms (8). Itaconate is a dicarboxylic acid and an enzymatic product of cis-aconitate decarboxylase 1 (ACOD1). It mediates carcinogenic effects in a variety of cancers, including glioma, melanoma, and ovarian carcinoma (9–11). Its production is associated with proteins regulating carcinogenesis as part of the NOTCH4-GATA4-IRG1 pathway (12, 13) (gene network shown in the Results section).. Itaconate’s role in human CC is not known (14).
In order to proliferate rapidly, cancer cells must reprogram their metabolism, which is a hallmark of cancer. There are several subtypes of CC characterized by different metabolic gene expression profiles. The CC subtype exhibiting downregulated lipid metabolism is linked to shorter survival duration (15, 16). The amount of fatty acid oxidation as an energy source also characterizes the phenotypes of tumor-associated macrophages (TAMs). These in turn, regulate oxidative stress and inflammation within the tumor microenvironment (17). Macrophage metabolism and therefore polarization determine either a more M1-like, pro-inflammatory or an M2-like anti-inflammatory phenotype (18). M1-like and M2-like macrophages both use mitochondrial oxidative and lipid metabolism to a variable extent. Itaconate is a metabolite normally found in proinflammatory M1-like macrophages; however, it has been measured in the M2-like subtype as well, as part of M2-like cell activation via glutamine metabolism (8, 19). In obese patients, metabolic dysfunction results in a chronic proinflammatory state which may cause metabolic reprogramming in tissue-resident macrophages, accelerating tumor growth and cancer onset (14).
In the CC tumor microenvironment, M2-like macrophages promote cancer progression by providing an anti-inflammatory environment. Advanced CC tumor stage and poor patient survival are associated with an increased M2/M1-like TAM ratio (20, 21). It is poorly understood as to whether itaconate produced by TAM contributes to this anti-inflammatory tumor microenvironment, CC onset, or progression. The aim of this study was to identify the role of obesity-related hormones and the macrophage-specific metabolite itaconate on CC metabolism within the NOTCH4-GATA4-IRG1 pathway in patients with sporadic colon adenocarcinoma and specifically in patients with EOCC. Therefore, we used a 4-pronged approach, 1) utilizing human colon cancer tissues and plasma samples to determine itaconate levels, as well as protein expression of ACOD1, (itaconate producing enzyme) and gene expression of Human Immune-Responsive Gene 1 (IRG1, the gene encoding ACOD1), 2) using the TCGA database to determine the effect of IRG1 gene expression on survival, 3) NOTCH4-GATA4-IRG1-pathway focused differential gene expression analysis, survival and tissue interaction analyses using several CC RNAseq datasets as outlined in the methods, and 4) using a macrophage/CC cell line model to evaluate the effect of adiponectin, leptin and itaconate treatment on gene expression.
2 Materials and methods
Consent was obtained from human participants in accordance with the ethical standards of the institutional research committee and with the 1964 Helsinki declaration. Ethical approval for this study was obtained from the Human Subjects Research and Institutional Review Board (IRB) of the University of Louisville, (IRB# 97.0361).
2.1 Cell lines and reagents
The human CC cell lines HT-29 (RRID: CVCL_0320) and SW480 (RRID: CVCL_0546) and the human monocyte cell line THP-1 (RRID: CVCL_0006) were obtained from the American Type Culture Collection (ATCC). Authentication by short tandem repeat (STR) analysis was performed for all cell lines. THP-1 cells were used to create either M0 or anti-inflammatory M2-like macrophages in a 14-day cell culture model as previously described (22) and cocultured with either HT-29 or SW480 CC cells, respectively. RPMI-1640 medium (ATCC) with 10% fetal bovine serum (FBS) was used, and 1% L-glutamine as well as 1% antibiotics (penicillin-streptomycin) (ATCC) were added. Cells were kept at 37°C and 5% CO2. THP-1 monocytic cells were seeded in 24-well plate inserts at a concentration of 0.2x10⁶ and either HT-29 or SW480 CC cells were seeded into the wells at 0.2x10⁶ cells per well (Falcon 24-well plates, VWR).
Leptin (BioVendor R&D), adiponectin (BioVendor R&D), 4-octyl-itaconate (OI) (Sigma-Aldrich) and dimethyl itaconate (DI) (Sigma-Aldrich) were processed as manufacturer’s instructions advised. Final treatment concentrations were reached by adding phosphate buffered saline (PBS) if needed to receive 300 ng/ml leptin, 20 μg/ml adiponectin, 50 μg/ml 4OI and 50 μg/ml DI. Itaconate is a highly polar molecule that has to be transferred intracellularly to exert its anti-inflammatory effects. OI and DI are exogenous esterification derivatives of itaconate that are able to cross the cell membrane and are commercially available to study itaconate’s anti-inflammatory effects.
Cocultured cells were treated in a time-response experiment in technical duplicates. Cells were treated with either leptin (n=10), adiponectin (n=10), or itaconate derivatives 4OI (n=10), or DI (n=10). Negative controls of each treatment and time point were treated with 10 μl/ml PBS. Samples were harvested after 6 hours and 18 hours of cell treatment.
2.2 Patient tissue samples
Twenty consecutive patients (age range 40–81 years) were included undergoing curative initial resection. Inclusion criteria were a diagnosis of sporadic colon adenocarcinoma with histologic confirmation and a minimum BMI of 18.5 kg/m2. Patients were excluded in case of a diagnosis of Lynch-syndrome, familial adenomatous polyposis (FAP), inflammatory bowel disease, or prior neoadjuvant chemotherapy and/or radiation. Patient demographics are shown in Supplementary Table 1. For purposes of this study, “young” or EOCC will be defined as CC in an individual ≤ 50 years old.
Both adjacent normal colon tissue (>5cm distance from the CC) and CC tissue were collected from each patient. In addition, 10 ml peripheral blood were collected immediately pre-operatively. Samples were processed directly after harvest and stored at -80°C.
Four paired tissue samples of adjacent normal colon tissue and CC (N=8) were obtained from the University of North Carolina at Chapel Hill, three pairs from patients with EOCC (diagnosis below the age of 50 years) and one paired sample from a patient above the age of 50 years at diagnosis. Samples were processed as above and stored at -80°C.
2.3 Gene expression analysis
The RNeasy kit (Qiagen) was used to obtain total RNA from CC and normal colon tissue. After RNA quantification using spectrophotometry (NanoDrop 1000, Thermo Scientific), reverse transcription to cDNA was performed. Quantitative real-time PCR (qRT-PCR) was performed using a StepOnePlus Real-Time PCR System (Applied Biosystems). TaqMan Expression Assays (Applied Biosystems) were used with 18S as the housekeeping gene (ABCG8: Hs00223690, IRG1: Hs00985781_m1, CD80:Hs01045161_m1, CCL22: Hs01574247_m1, CXCL10: Hs00171042_m1, GATA5: Hs00388359_m1, IL10: Hs00961622_m1, IL1B: Hs01555410_m1, IL6: Hs00174131_m1, IL8: Hs00174103_m1, LCT: Hs00158722_m1, CD206: Hs00267207_m1, NFKB: Hs00765730_m1, PLIN4: Hs00287411_m1, PPARA: Hs00947538_m1, PPARG: Hs01115513_m1, SERPINE: Hs00167155_m1, TNF: Hs00174128_m1, RNA18S5: Hs03928990_g1). For comparison of gene expression between samples ΔCT values were calculated. Results in macrophages were considered significant if demonstrated in combination with both CC cell lines. Results in CC cells were considered significant if shown with either M0 or M2-like macrophages.
2.4 Protein expression analysis using ELISA
The enzyme ACOD1 (encoding gene IRG1) was detected in normal colon tissue samples and CC by ELISA (IRG1-ELISA Kit, MyBioSource, Inc.). Protein concentrations are listed per µg total protein per respective sample.
2.5 Determination of itaconate levels using LC-MS/MS
Liquid chromatography with tandem mass spectrometry (LC-MS/MS) was used to determine itaconate levels in plasma, normal colon tissue and CC samples. An AB SCIEX API 4000TM tandem mass spectrometer (Concord) was coupled to Waters Acquity UPLC® BEH C18 columns (2.1×100 mm, 1.7 μm), with VanGuard T3 precolumns (2.1×5 mm, 1.7 μm) (Waters). Buffer A (mobile phase) consisted of 0.1% formic acid-water and buffer B acetonitrile with the following mass spectrometry conditions: 500°C, ion spray voltage (IS): -4500V, curtain gas (CUR): 25psi, gas 1 (GS1): 50psi, gas 2 (GS2): 60psi.
2.6 Determination of itaconate levels using LC-MS/MS
RNA-seq data on human colon samples was acquired from The Cancer Genome Atlas (TCGA)(RRID: SCR_003193) (n=40) and the European Genome-Phenome Archive (EGA) (RRID: SCR_004944) (n=69) (23, 24). (EGA data is hosted by the European Bioinformatics Institute (EBI) and the Centre for Genomic Regulation (CRG), under accession number EGAD00001000215.) Further data on human normal colon samples was obtained from the Genotype-Tissue Expression (GTEx) Project database (GTEx Portal, dbGaP accession number phs000424.v8.p2) (RRID: SCR_013042). Additional RNA-seq data was collected from sequenced patient tissue samples from the University of Louisville (N=40) and the University of North Carolina at Chapel Hill (UNC) (N=7).
RNA-seq data on 371 sporadic CC samples and matched normal colon tissue samples for age, sex, and BMI was analyzed for 18,884 genes.
2.7 Differential expression and tissue interaction analyses
Specific IRG1-related differential gene expression (N=109), IRG1-related survival analysis (N=185) and NOTCH4-GATA4-IRG1-focused differential gene expression and survival analysis (N=362) were performed.
Data on forty CC samples with matching normal colon samples were obtained from The Cancer Genome Atlas (TCGA), each with raw gene counts for 60,483 gene locations (Table 1) (23). The European Genome-phenome Archive (EGA) supplied 69 additional CC cases with matching normal colon tissue as paired-end raw sequencing files (fastq) (24, 25). Each EGA sample data file contained an average of 33 million reads. FastQC (v.0.10.1) (RRID: SCR_014583) was used to determine read quality. Based on this, no sequence trimming had to be performed (26). Star (v.2.6) (RRID: SCR_005622) was used to align sequences to the human reference genome assembly (hg38) using an average 97% alignment rate across samples (27). HTSeq (v.0.10.0) (RRID: SCR_005514) using Gencode (v22) (RRID: SCR_014966) annotations (identical with the ones used to derive TCGA sample gene counts) was used to obtain read counts for gene regions (28, 29). Raw counts were produced for the same 60,483 gene locations. The files obtained from EGA and TCGA were merged into one data set and genes with low expression were filtered, resulting in 46,634 gene locations. The relative log expression (RLE) method was used to normalize combined raw read counts which were then input to a principal component analysis (PCA). This visually demonstrated appropriate separation of normal colon tissue and CC samples (Supplementary Figure 1).
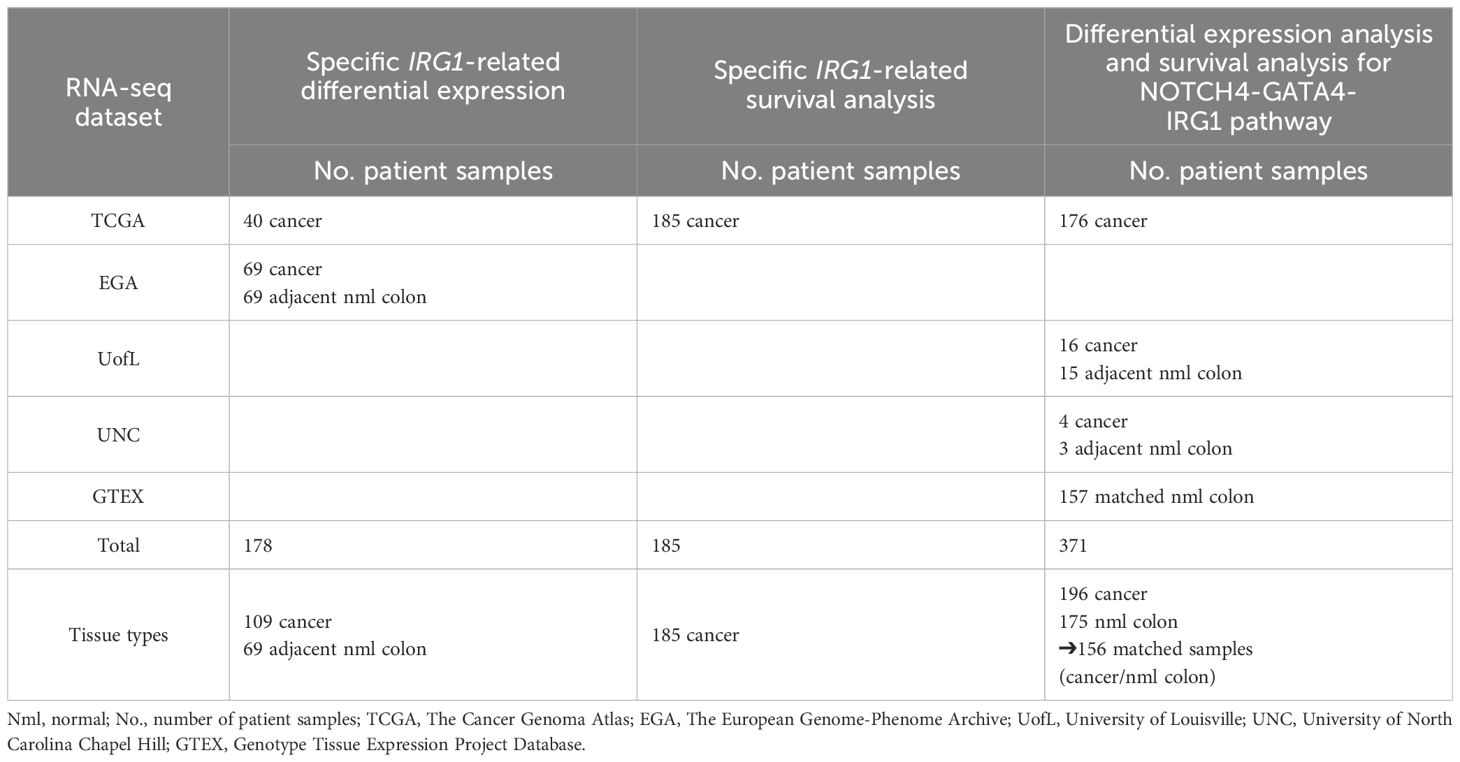
Table 1. Number of patient samples (No.) for RNA sequencing (RNA-seq) data & respective analyses (differential gene expression & survival analysis).
DEA for CC relative to normal tissue was performed using DESeq2 (RRID: SCR_015687) with its negative binomial regression model (30). The patient number was defined as a regression model covariate to account for sample pairing.
For tissue interaction analysis (N=362), 18,884 protein coding genes were tested. The parameters cancer versus normal, location (colon (general, right, left)), sex (male/female), age (younger, ≤50 years versus older, >50 years), and BMI (normal/overweight/obese) were included in the statistical model. Tumor versus normal colon was compared and the interaction of tissue with sex, age, and BMI was investigated.
2.8 Survival analysis
One hundred eighty-five TCGA colon tumor samples with information about patient survival were included for IRG1-related survival analysis (Table 1). Low expressed genes were filtered, and the RLE method used to normalize raw read counts. Significance levels and Kaplan-Meier curves were generated using R [R Foundation for Statistical Computing, survival package (v3.2.7)] to analyze the association of IRG1 expression with patient survival (31, 32).
For survival analysis related to expression of inflammatory genes of the NOTCH4-GATA4-IRG1 pathway, we investigated 156 paired tissue samples (N=312) with CC and matching normal colon samples.
2.9 Statistics
Prism 9 (GraphPad Software, Inc.) software was used for statistical analysis. Results are reported as mean values ± standard deviation or 95% confidence intervals (CI).
Binominal data of gene expression in patient samples was analyzed using a McNemar test. Paired samples were compared with the Wilcoxon matched pairs test while the unpaired samples were compared using the Wilcoxon rank sum test. A 2-tailed p-value was calculated, level of significance 5%.
Spearman correlation analysis was also performed. Microsoft Excel Version 2017 was used to create graphs.
R was utilized for differential gene expression and survival analyses (32). Survminer 0.2.4. (RRID: SCR_021094) was used to determine cutoff points for significant gene expression (IRG1-positive samples) versus no gene expression (IRG1-negative samples).
3 Results
3.1 IRG1 expression, ACOD1 expression and Itaconate levels in colon cancer patients
Itaconate metabolism was analyzed in patient colon tissue samples on three levels including (a) gene expression of IRG1, (b) protein expression of ACOD1 (enzyme responsible for itaconate production) and (c) by measuring the dicarboxylic acid itaconate and by investigating the role of IRG1 gene expression in patient survival (Figure 1A).
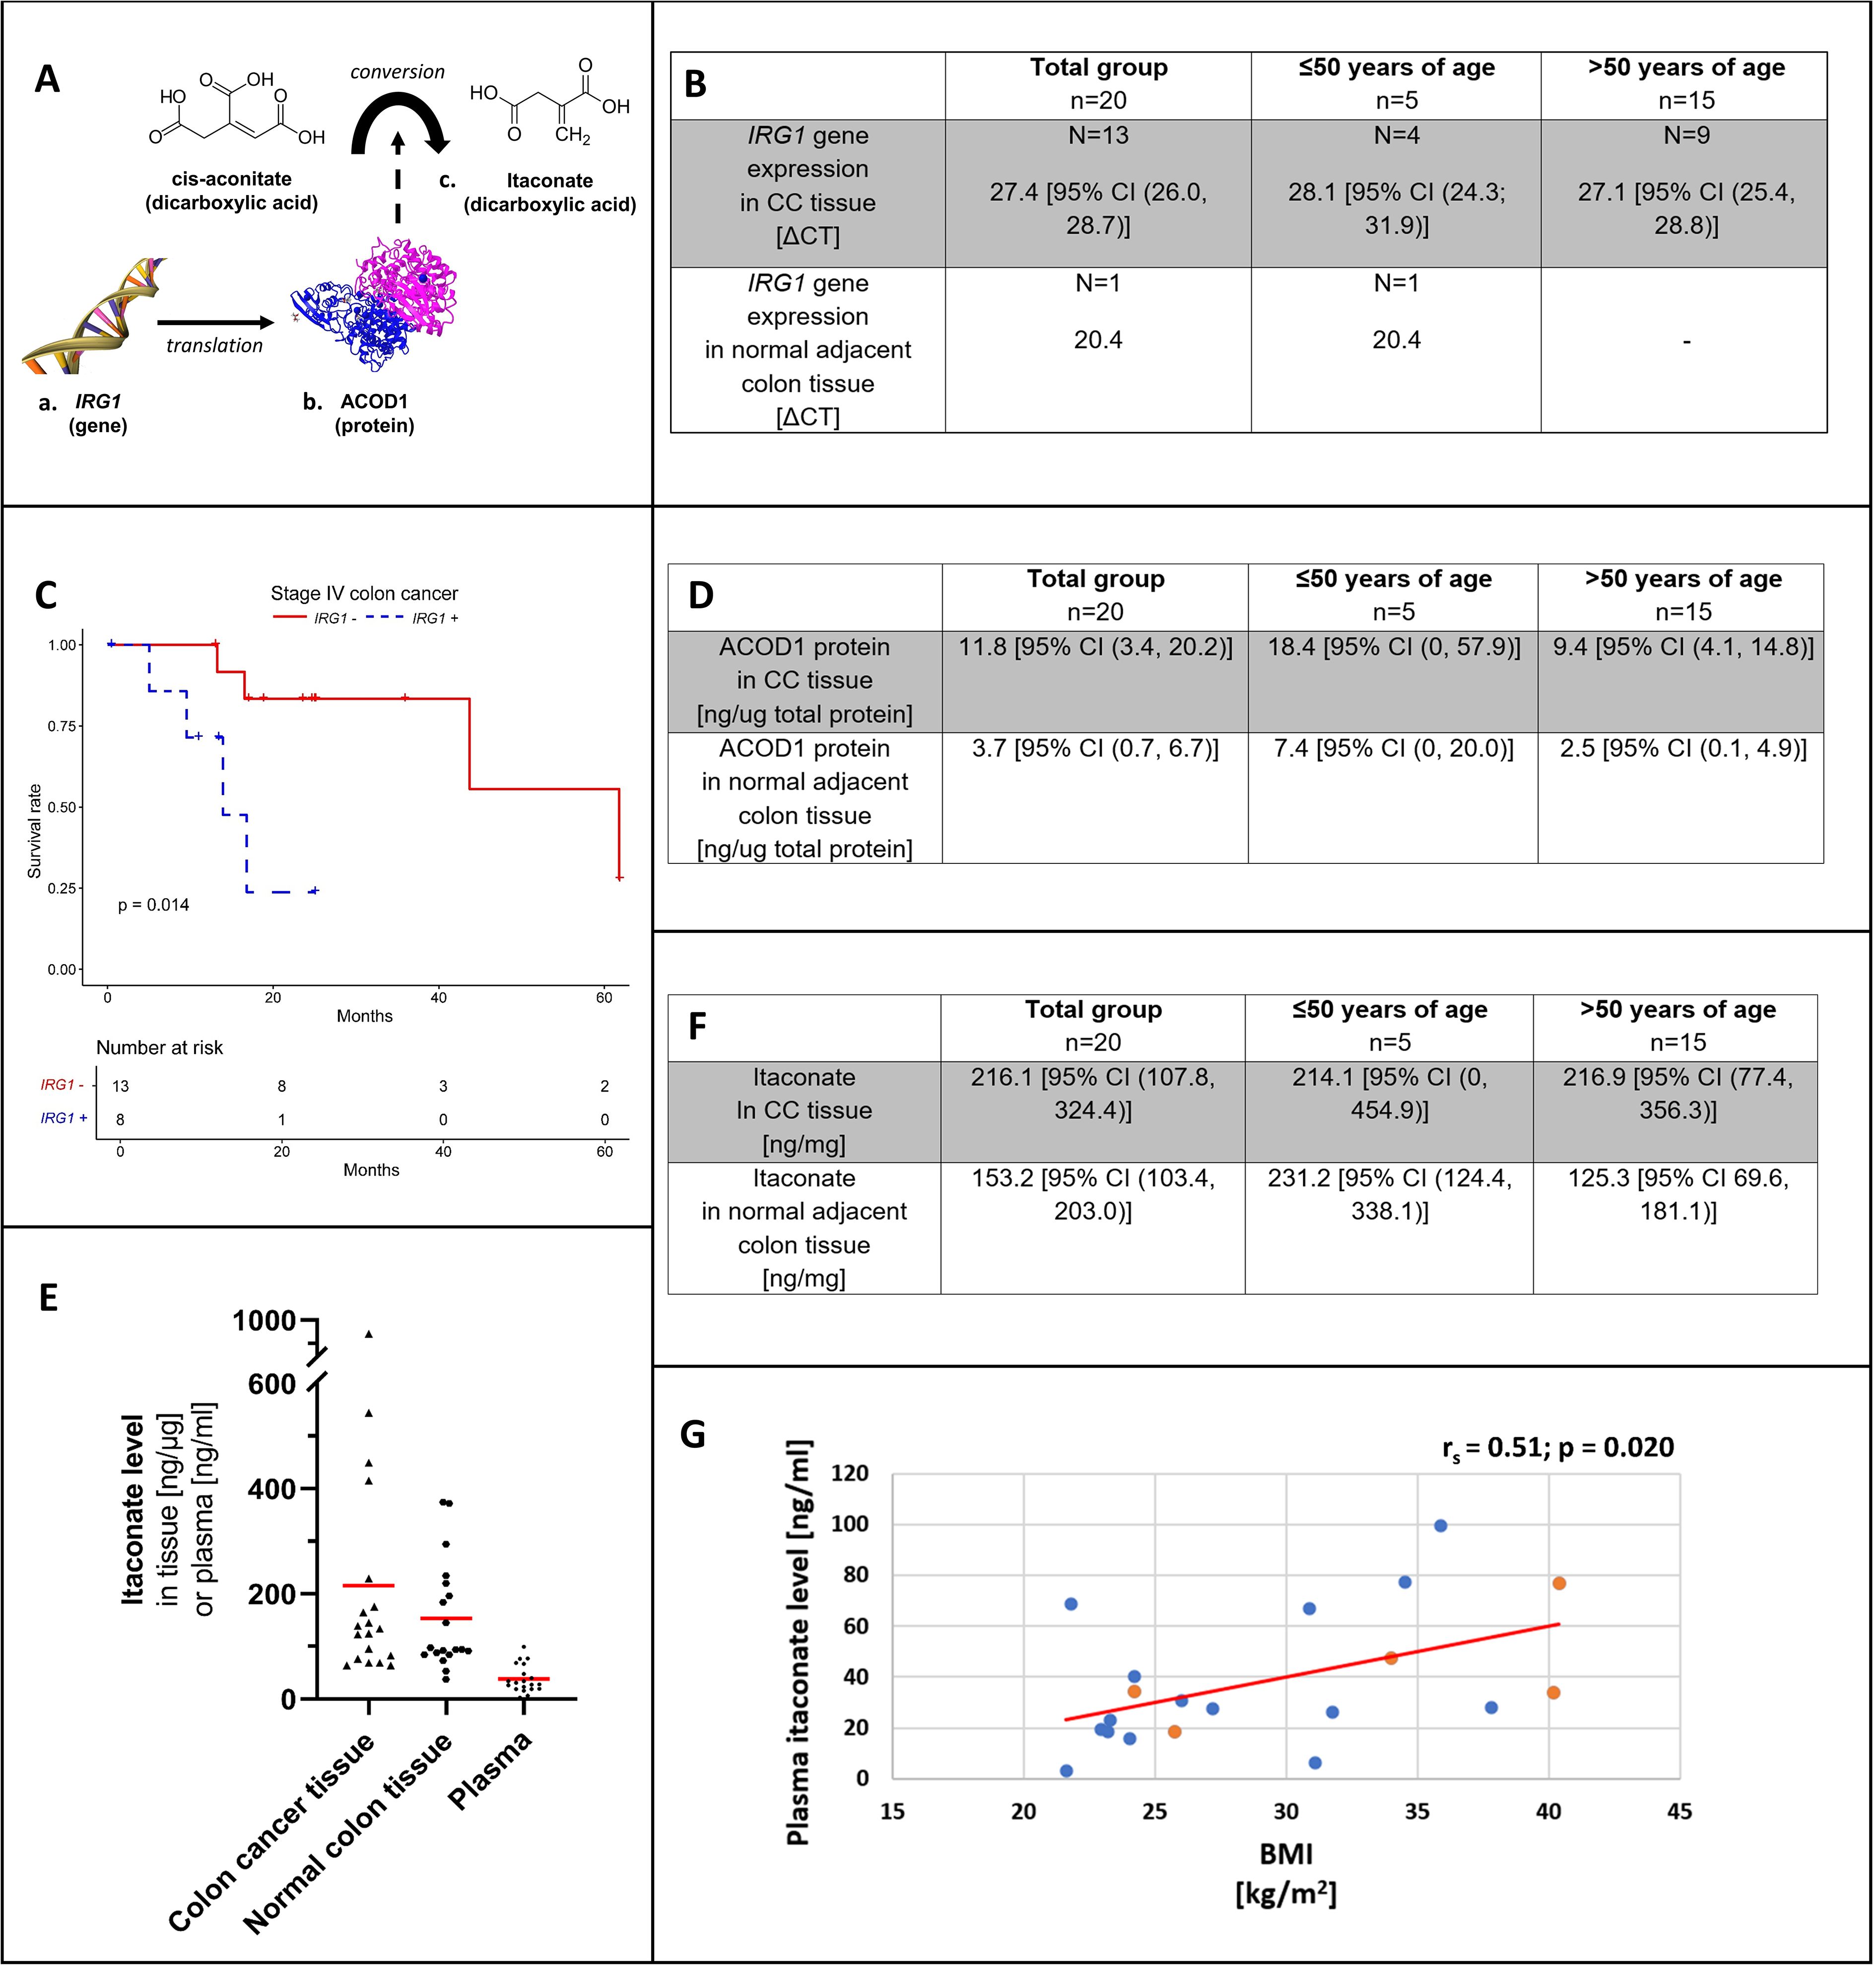
Figure 1. Overview on itaconate from gene to protein and anti-inflammatory metabolite (A). IRG1 gene expression (B) by patient age group in colon cancer tissue and adjacent normal colon. (C) shows the Kaplan-Meier curve for stage IV colon adenocarcinoma and colon cancer tissue IRG1 gene expression (blue, dotted line) versus no IRG1 gene expression (red, solid line). ACOD1 protein expression (D) by patient age group in colon cancer tissue and adjacent normal colon. (E) shows the distribution of itaconate levels with mean values (red) among patient tissue (colon cancer and adjacent normal colon) and corresponding patient plasma samples. Itaconate tissue levels (F) by patient age group in colon cancer tissue and adjacent normal colon. Correlation between plasma itaconate level and body mass index (BMI) among patients (G). Levels of patients ≤50 years of age are represented in orange and those of patients >50 years of age are shown in blue. CC, Colon cancer; IRG1, Immune-Responsive Gene 1; ACOD1, cis-aconitate decarboxylase 1.
3.2 IRG1 gene expression and ACOD1 protein levels are increased in human colon cancer
In CC tissue, the mean ΔCT for IRG1 gene expression was 27.4 [95% CI (26.0, 28.7)]. IRG1 was expressed in 65% of CC samples and in only 5% of normal colon tissue samples with a ΔCT of 20.4 (chi-square: 10.083, p=0.002) (Figure 1B).
ACOD1 levels were higher in CC compared to normal colon (11.8 ng/ug [95% CI (3.4, 20.2 ng/ug)] versus 3.7 ng/ug [95% CI (0.7, 6.7 ng/ug)]; p=0.002), respectively. Mean ACOD1 concentration was higher in patients with EOCC compared to patients >50 years of age, with higher ACOD1 levels in both CC tissue and normal colon tissue; however, this did not reach statistical significance (Figure 1D).
3.3 Itaconate levels in normal colon tissue of young CC patients are higher than those seen in patients >50 years of age
Figure 1E is showing itaconate concentrations in paired patient samples (CC/normal colon tissue and plasma).
In both CC and normal colon samples, itaconate was detected showing high variability of concentrations in both tissue types. Overall CC tissue itaconate levels appeared higher; however, no significant difference was demonstrated (216.1 ng/mg [95% CI (107.8, 324.4)] versus 153.2 ng/mg [95% CI (103.4, 203.0)]; p=0.294) (Figure 1F). Normal colon itaconate levels were higher in individuals with EOCC compared to those >50 years old (231.2 ng/mg [95% CI (124.4, 338.1)] versus 125.3 ng/mg [95% CI 69.6, 181.1)]; p=0.026) (Figure 1F).
Plasma itaconate concentrations and BMI correlated positively (rs= 0.51; p=0.020) (Figure 1G). Itaconate plasma levels showed no correlation with neither CC tissue levels (rs= -0.20; p=0.414) nor normal colon tissue concentrations (rs= 0.19; p=0.433).
3.4 TCGA database analysis to determine the effect of IRG1 expression on survival
3.4.1 IRG1 expression is linked to higher risk of death in stage IV colon cancer
The TCGA cohort (n=40) (Table 1) consisted of 48% men aged 40–90 years. In 39 out of 40 cases information on tumor stage was provided. Patients included showed stage I disease (N=5), stage II (N=22), stage III (N=5), and stage IV (N=7) disease. The EGA dataset did not provide metadata such as tumor stage or age at diagnosis.
Analyzing data of 109 individuals showed that IRG1 expression was detected in 53% of CC samples and 25% of normal colon tissues (z = 4.68, p=<0.001). Upregulation of IRG1 expression in CC samples relative to paired normal colon tissue was demonstrated (log2 FC=1.41, corrected p=0.03).
Across 185 CC tissue samples at different stages of tumor progression, detection of IRG1 (IRG1 expressed versus IRG1 not expressed) had no effect on survival (X2 = 0, p=0.9). The number of events for each tumor stage are listed in Supplementary Table 2. At stage I no deaths occurred and survival was not affected at stage II or III (stage II X2 = 1.4, p=0.2; stage III X2 = 1.7, p = 0.2). The risk of death was increased for the subset of stage IV cancer patients showing a risk increase for detectable IRG1 gene expression relative to no expression (X2 = 6.3, p=0.01). The Kaplan-Meier curve demonstrating stage IV survival is shown in Figure 1C.
3.5 NOTCH4-GATA4-IRG1 pathway – differential gene expression, survival and tissue interaction analyses
3.5.1 Age- and BMI-related FABP6 and GATA5 expression in colon cancer is linked to poor overall survival
RNAseq data is presented as heat maps in Figure 2 with corresponding values in Supplementary Table 3. The gene network involving NOTCH4-GATA4-IRG1 pathway genes is visualized in Figure 3.
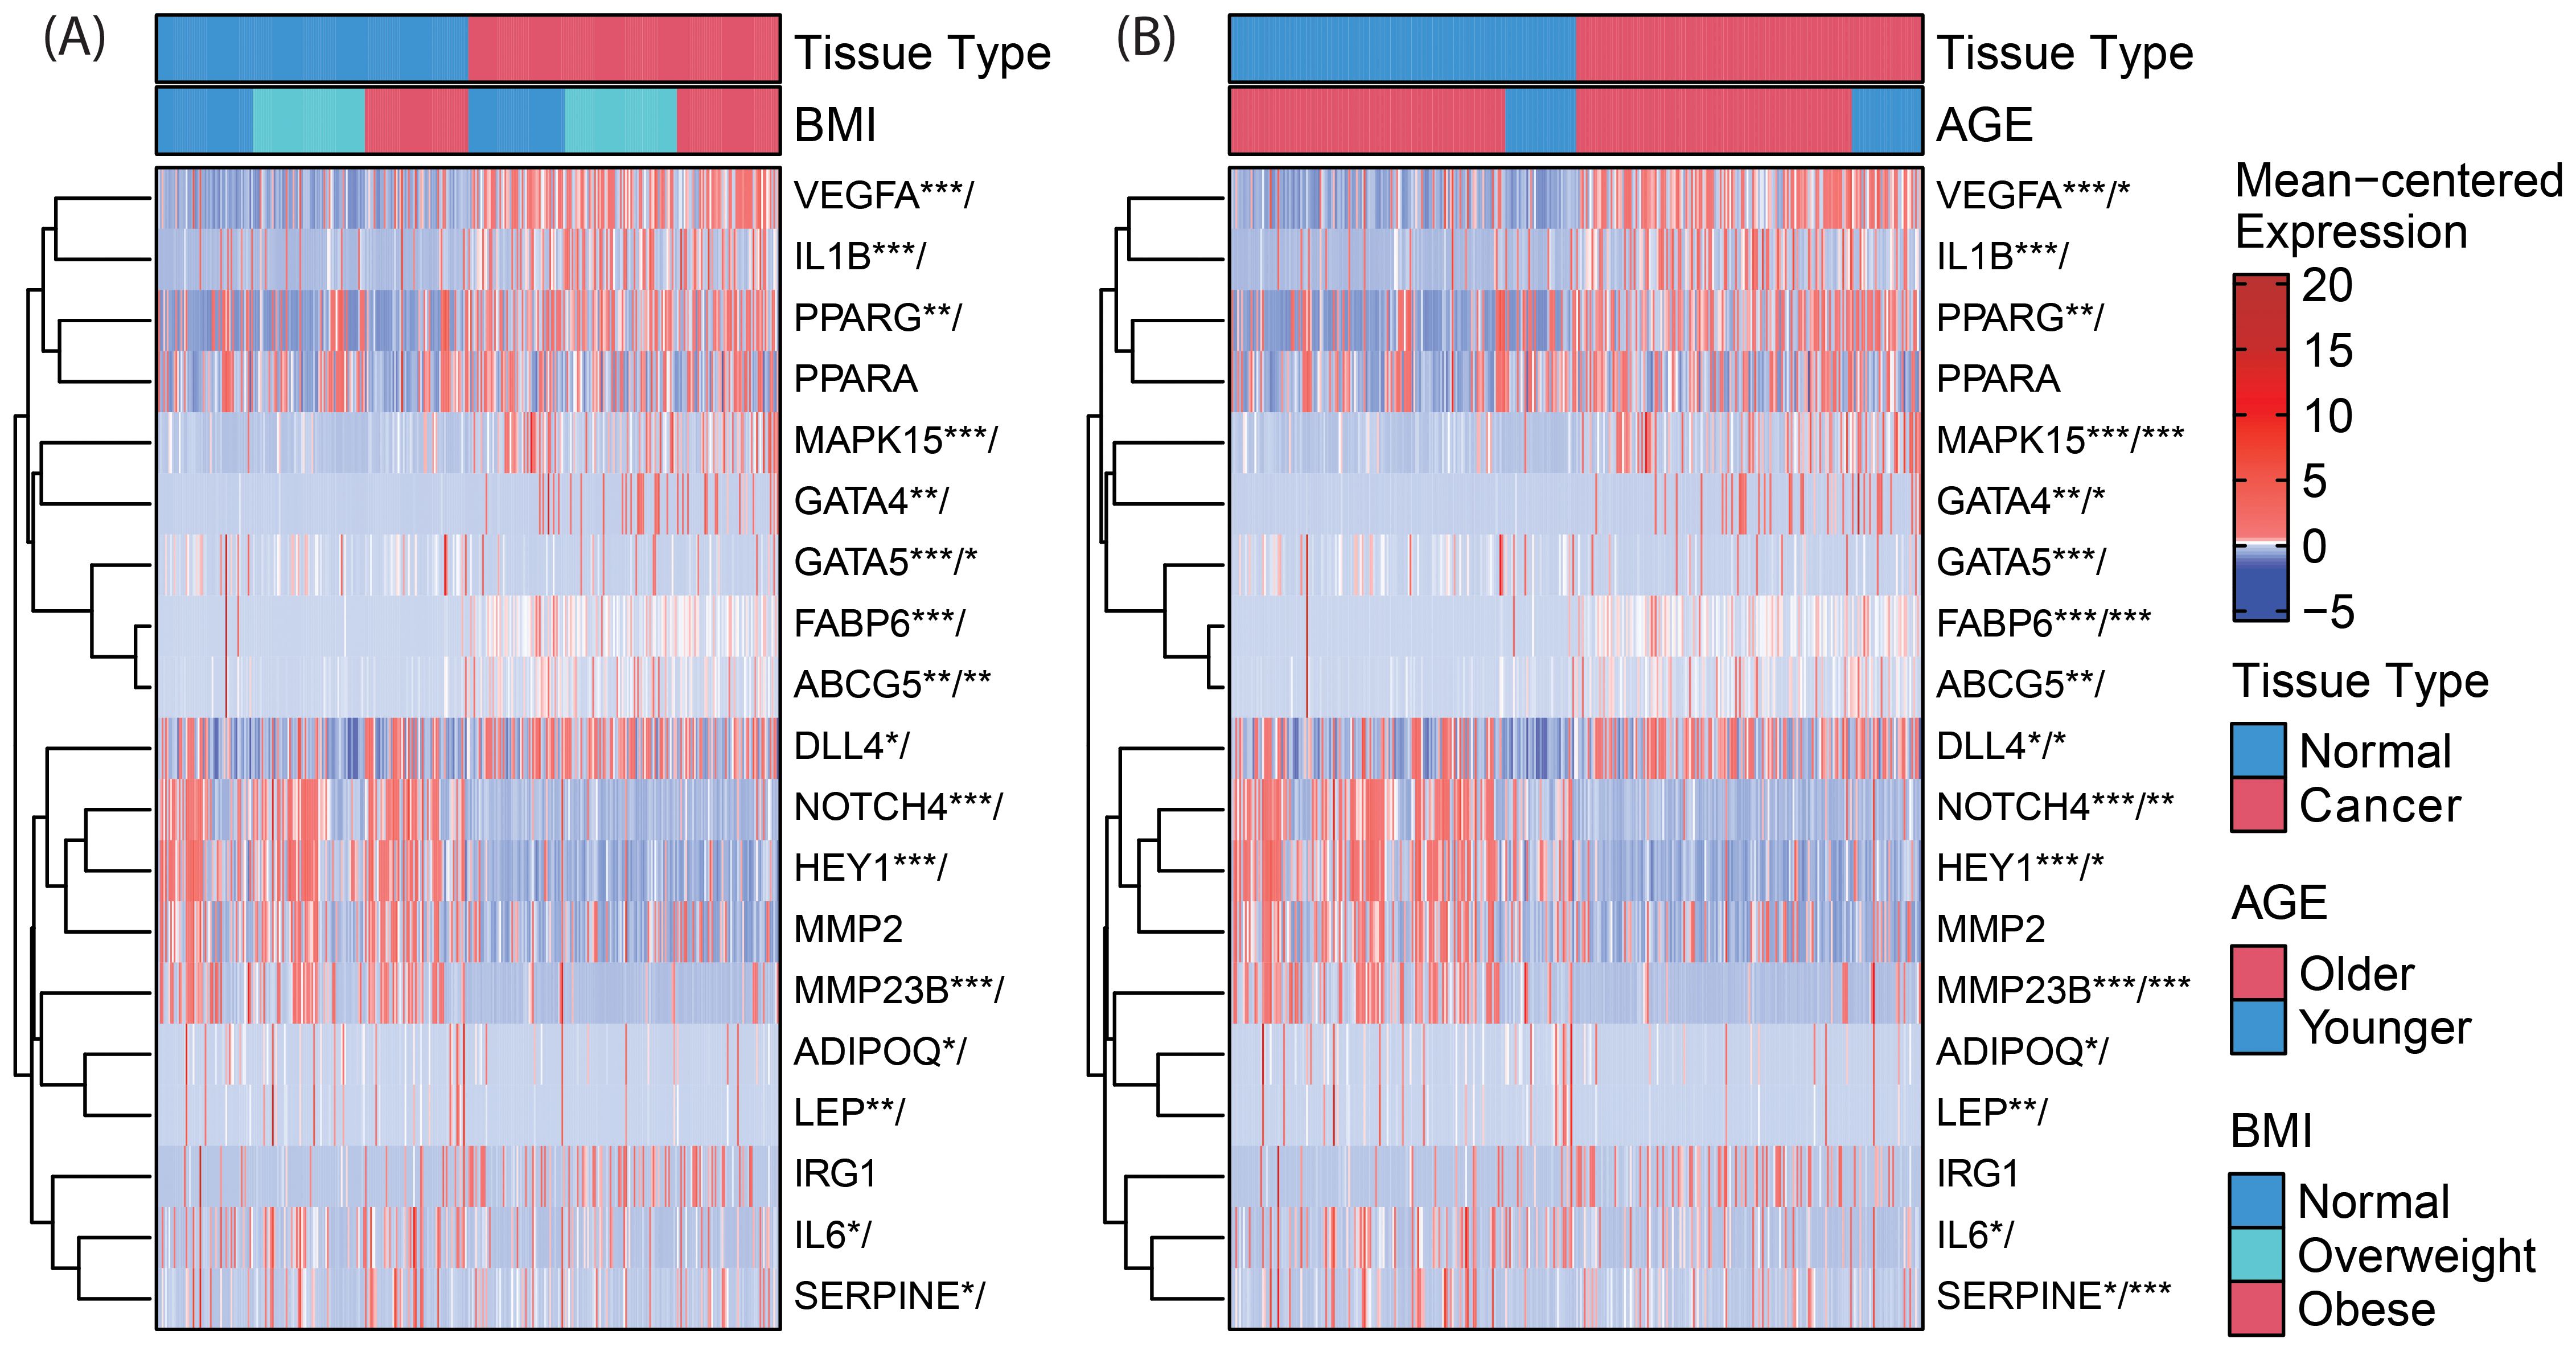
Figure 2. Clustered heatmaps (rows only) for differential gene expression and (A) BMI-by-tissue-type and (B) age-by-tissue-type interaction of genes within the NOTCH4-GATA4-IRG1 axis. Significance of annotated genes is shown as cancer tissue versus normal tissue/interaction for BMI (or age) with p-values * < 0.05, ** < 0.01, and *** < 0.001. VEGFA, Vascular Endothelial Growth Factor A; IL1B, Interleukin 1 Beta; PPARG, Peroxisome Proliferator Activated Receptor Gamma; PPARA, Peroxisome Proliferator Activated Receptor Alpha; MAPK15, Mitogen-Activated Protein Kinase 15; GATA4, GATA Binding Protein 4; GATA5, GATA Binding Protein 5; FABP6, Fatty Acid Binding Protein 6; ABCG5, ATP Binding Cassette Subfamily G Member 5; DLL4, Delta Like Canonical Notch Ligand 4; NOTCH4, Notch Receptor 4; HEY1, Hes Related Family BHLH Transcription Factor With YRPW Motif 1; MMP2, Matrix Metallopeptidase 2; ADIPOQ, Adiponectin, C1Q And Collagen Domain Containing; LEP, Leptin; IRG1, Immunoresponsive Gene 1; IL6, Interleukin 6; SERPINE1, Serpin Family E Member 1.
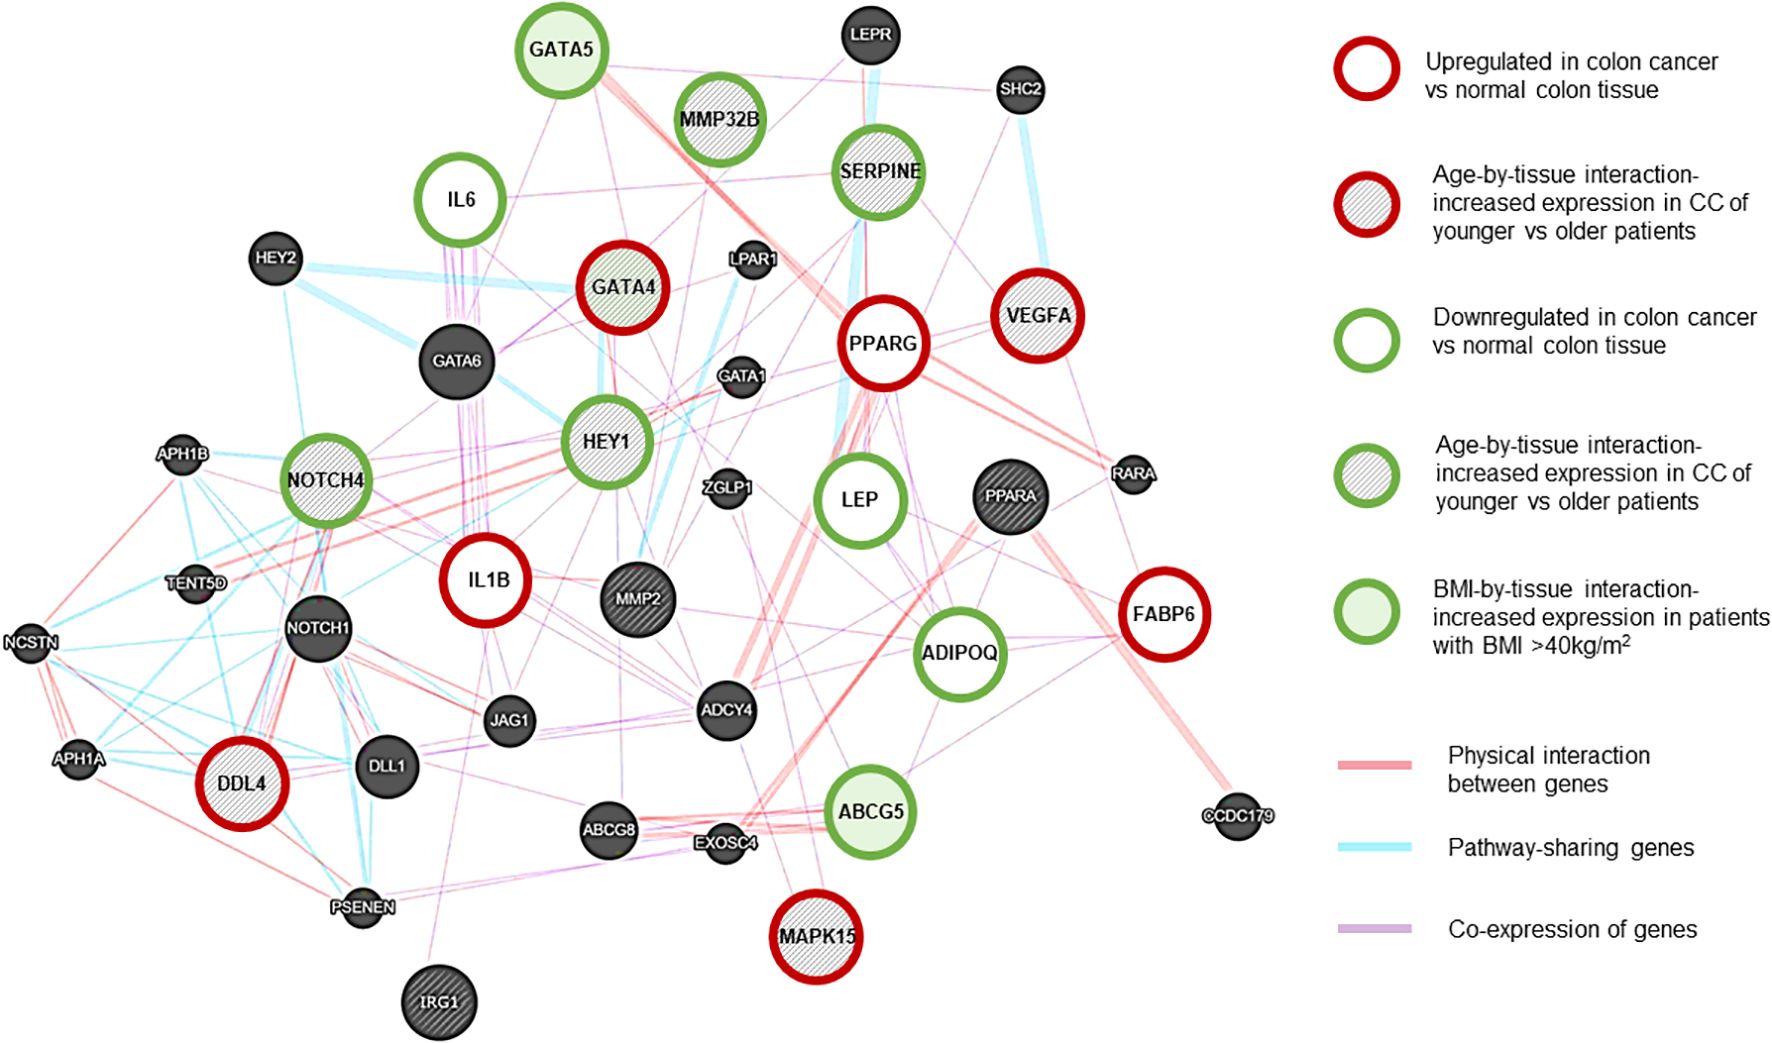
Figure 3. NOTCH4-GATA4-IRG1 network generated using Cytoscape (RRID: SCR_003032) (13). Gene associations are shown with different colors. Purple lines: Coexpression of genes. Red lines: Physical interaction between genes. Blue lines: Pathway-sharing genes. Red outline: genes with significant upregulation in CC vs normal tissue, Green outline: genes with significant downregulation in CC vs normal tissue. Grey-shaded stripes: age-by-tissue interaction. Green shaded: BMI by tissue interaction. (Based on paired samples, CC tissue N=181, normal colon tissue N=181.).
In CC samples, the NOTCH4-GATA4-IRG1 pathway genes DLL4, GATA4, IL1B, PPARG, VEGFA, MAPK15, and FABP6 (Figure 3) were upregulated compared to matched normal colon tissue of healthy individuals. The lowest mean overall expression was demonstrated for IRG1, therefore no significant difference was observed (Supplementary Table 3). The four target genes DDL4, GATA4, VEGFA, and MAPK15 showed significant age-by-tissue interaction with increased expression in CC tissue of younger patients (Figure 3; Supplementary Table 3). Downregulation in CC tissue was demonstrated for ABCG5, ADIPOQ, GATA5, HEY1, IL6, LEP, MMP23B, NOTCH4, and SERPINE. A significant age-by-tissue interaction with upregulation in younger compared to older patients was shown for HEY1, MMP23B, NOTCH4, MAPK15 and SERPINE. Downregulation in younger versus older patients was demonstrated for IL1B and PPARA. BMI-by-tissue interaction with upregulation in patients with BMI >40 kg/m2 (N=60) was found for ABCG5, GATA4, and GATA5. In patients with obesity versus normal-weight patients downregulation was demonstrated for NOTCH4 and VEGFA (Figure 3; Supplementary Table 3).
Genes with significant age-by-tissue or BMI-by-tissue interactions revealed that high GATA5 (p=0.012), HEY1 (p=0.023), MMP23B (p=0.001), MAPK15 (p=0.010) and SERPINE1 (p=0.005) expression (Figures 4A–E) and low FABP6 expression (p=0.010) (Figure 4F) were associated with decreased overall patient survival.
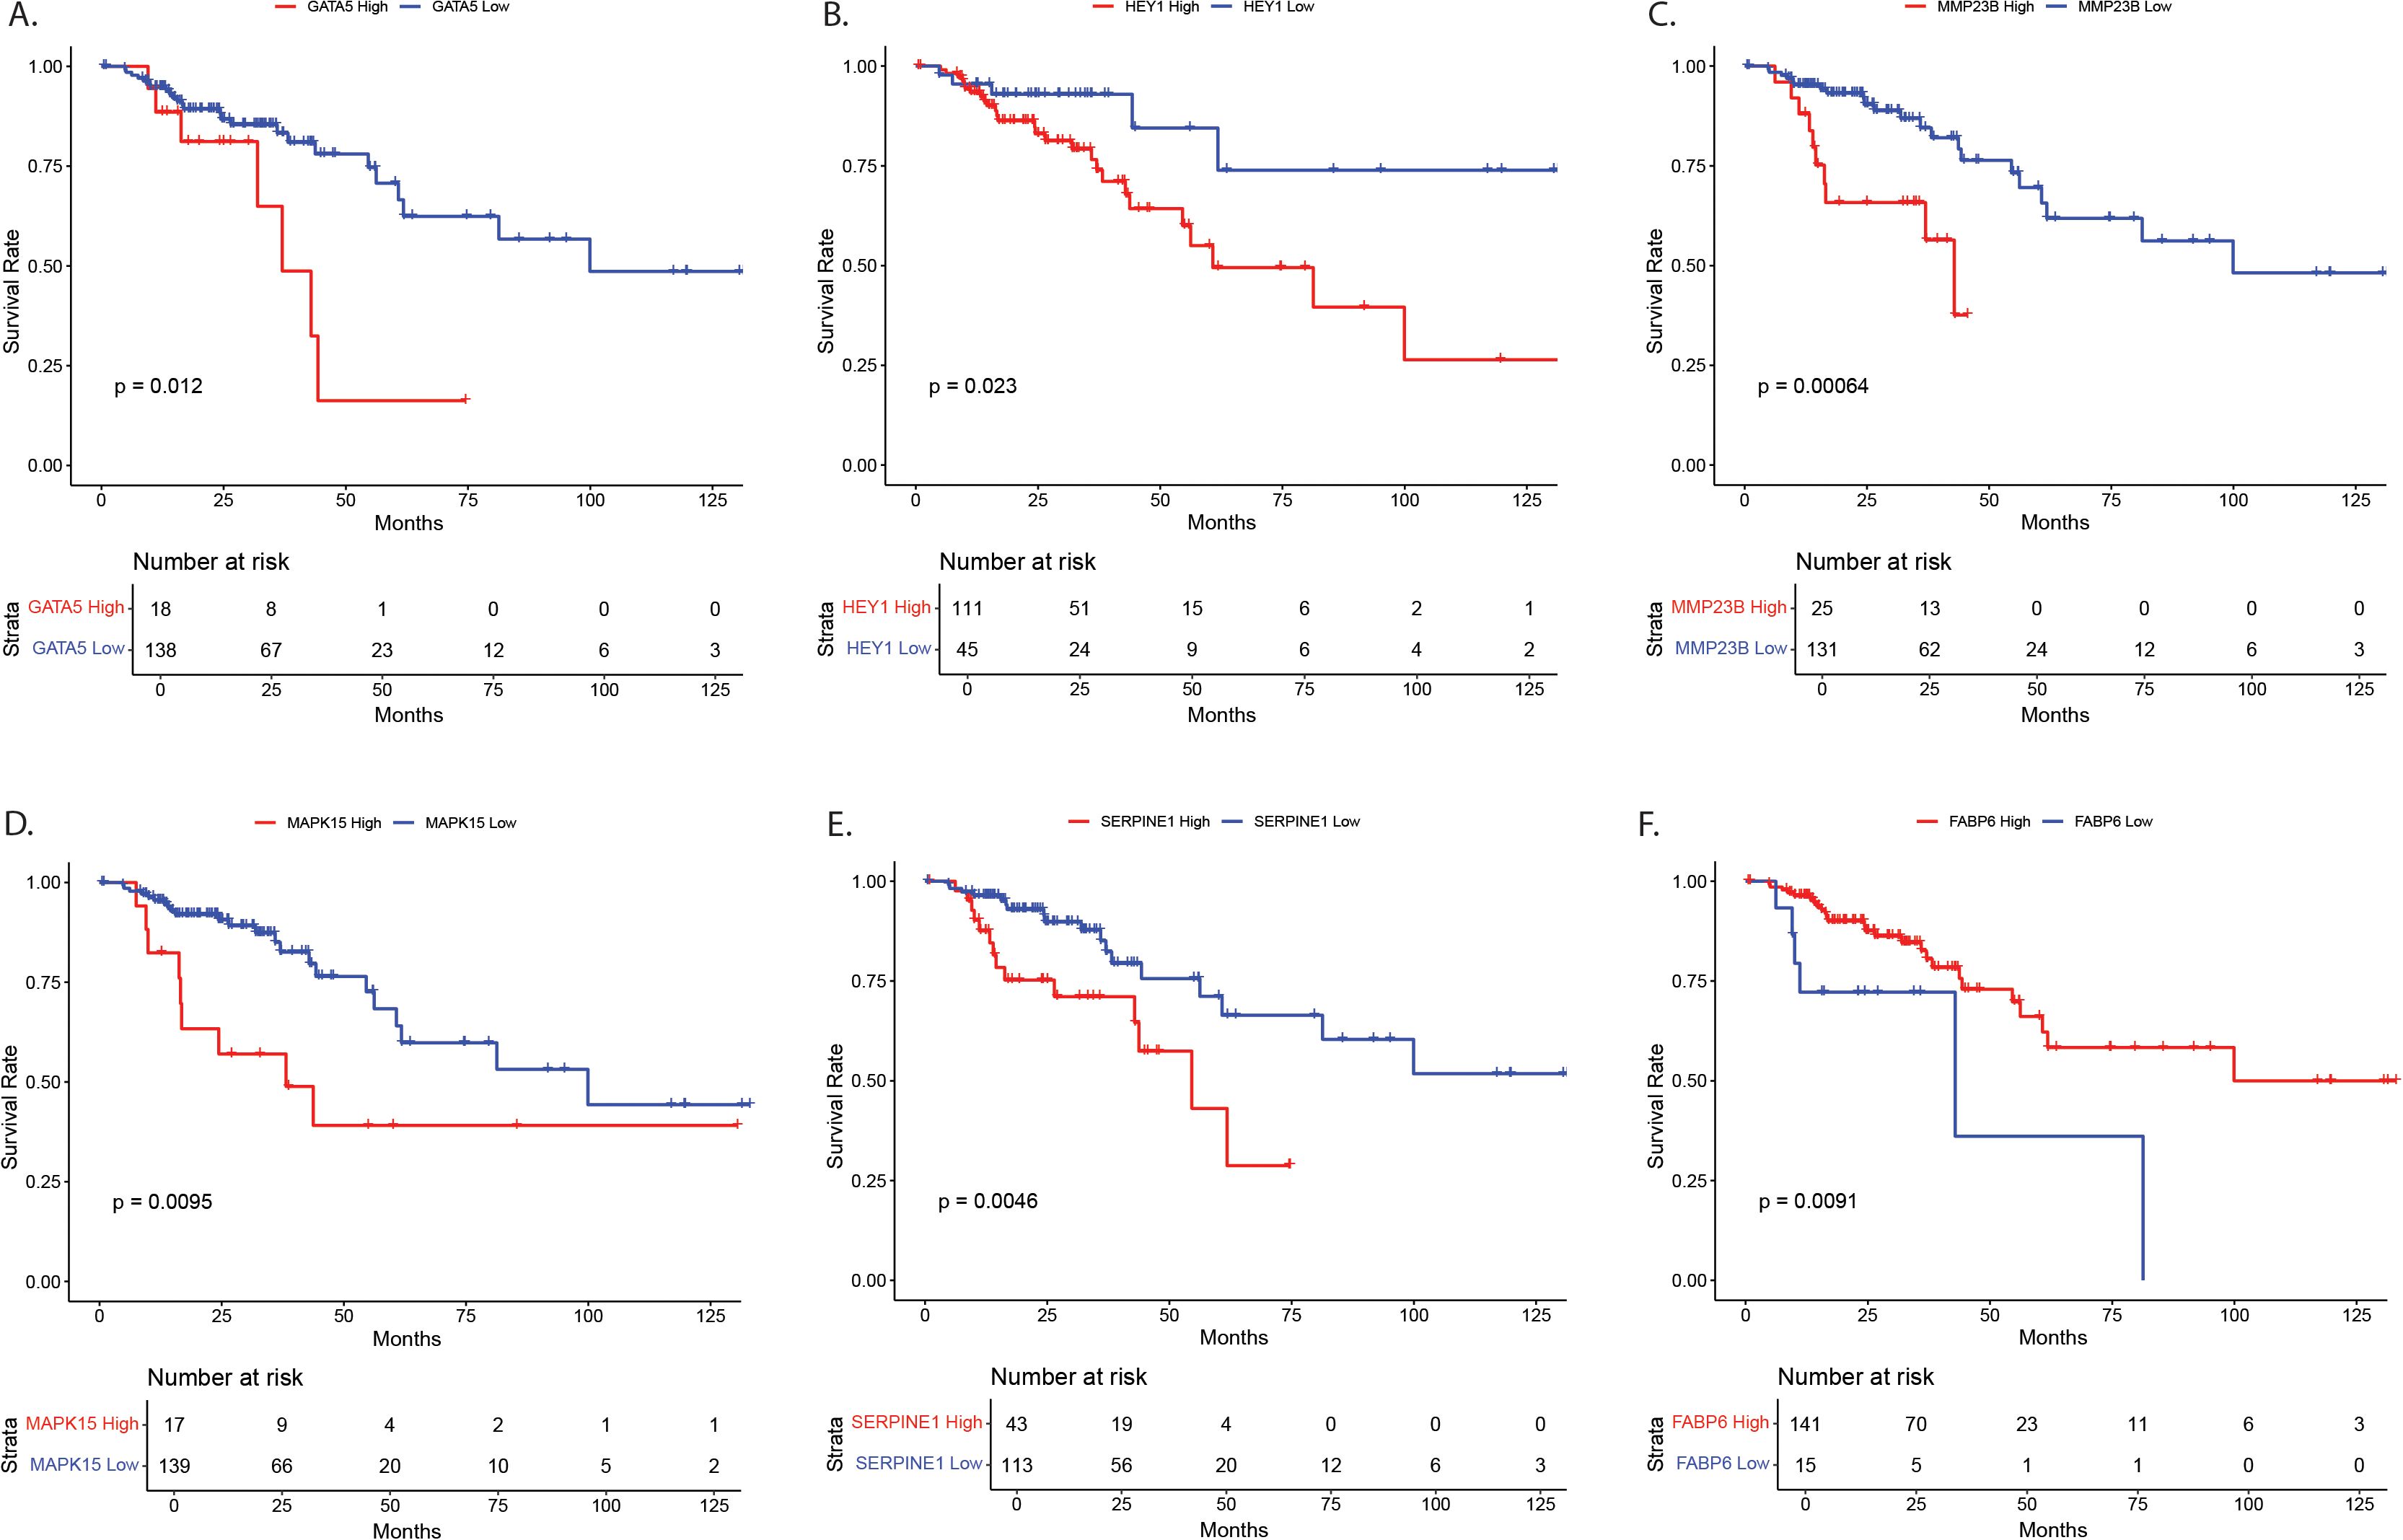
Figure 4. Survival analysis for NOTCH4-GATA4-IRG1 pathway target genes with significant age-by-tissue or BMI-by-tissue interaction for (A) GATA5, (B) HEY1, (C) MMP23B, (D) MAPK15, (E) SERPINE1, and (F) FABP6. Y-axes show survival probability, X-axes show time in months. GATA5, GATA Binding Protein 5; HEY1, Hes Related Family BHLH Transcription Factor With YRPW Motif 1; MMP23, Matrix Metallopeptidase 23; MAPK15, Mitogen-Activated Protein Kinase 15; SERPINE1, Serpin Family E Member 1; FABP6, Fatty Acid Binding Protein 6.
3.6 Macrophage/CC cell line coculture model to evaluate the effect of adiponectin, leptin and itaconate on gene expression
3.6.1 Obesity-related hormones and itaconate induce procarcinogenic gene expression
The coculture model with cell treatments and major gene expression changes is shown in Figure 5.
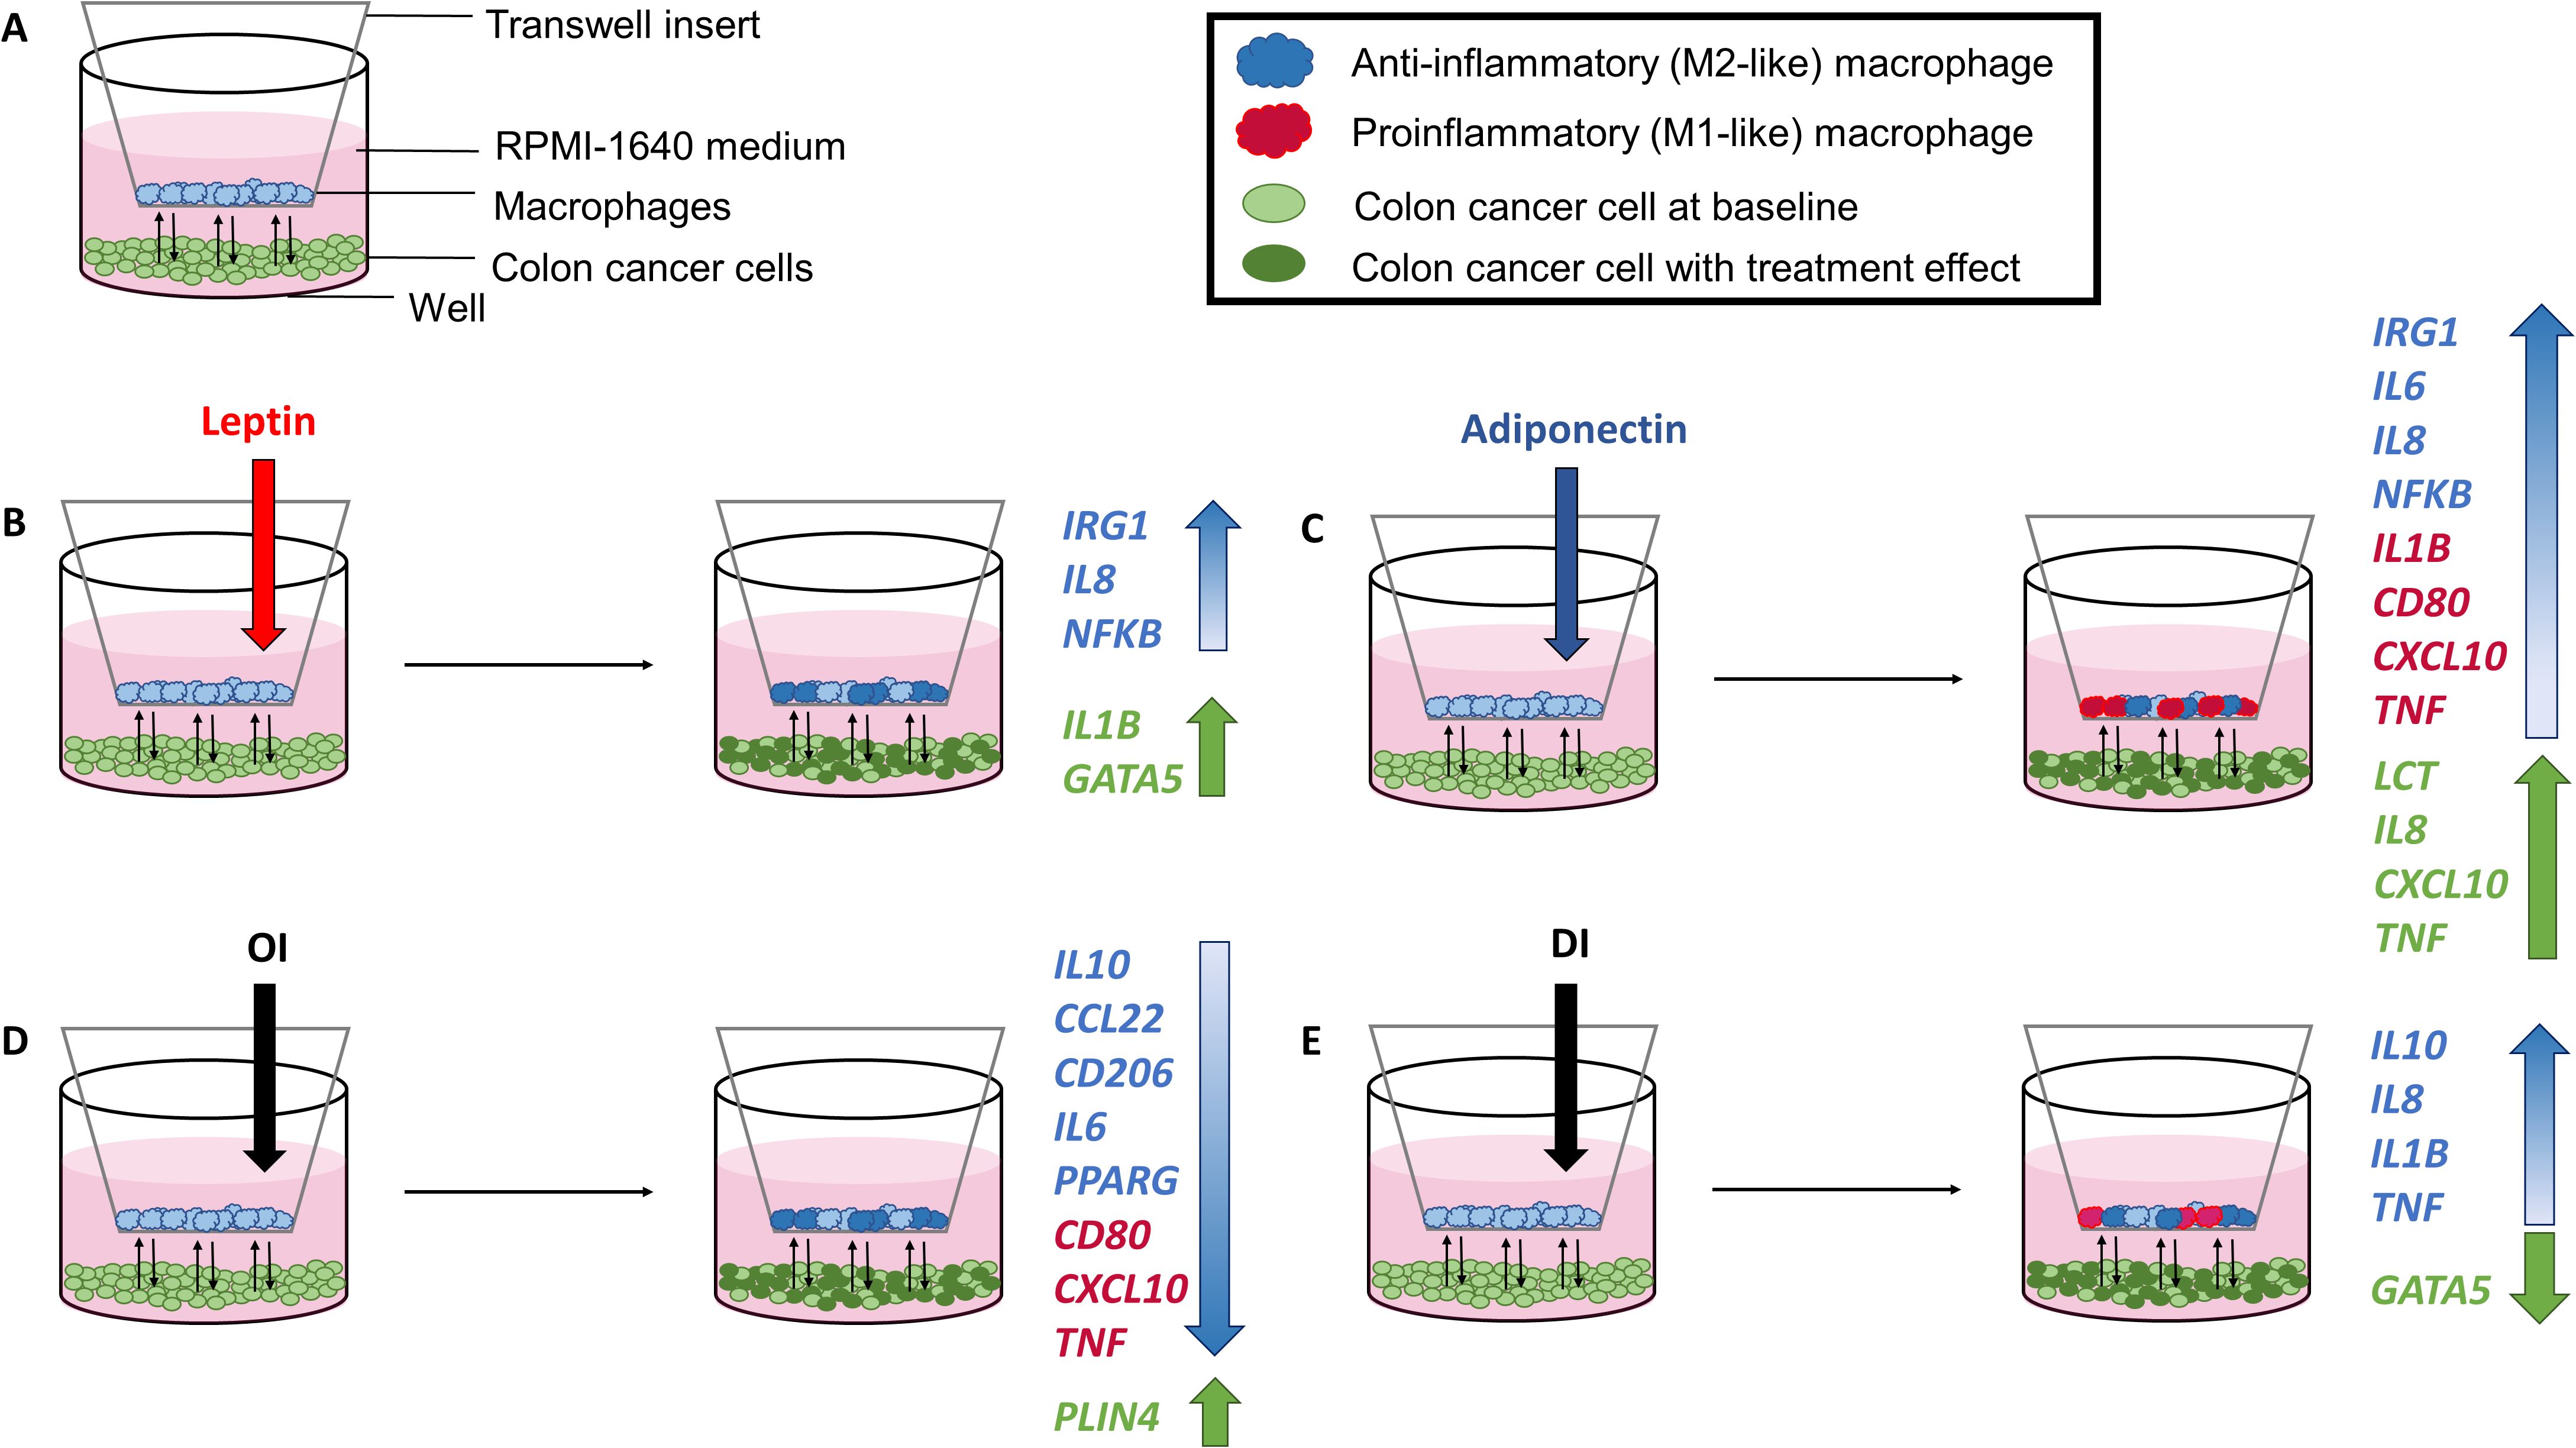
Figure 5. Coculture model with experimental setup (A) and cell treatments with corresponding gene expression results following leptin (B), adiponectin (C), OI (4-octyl itaconate) (D), and DI (dimethyl itaconate) (E) treatment.
Corresponding radar plots are shown in Figures 6. All ΔCT values and FC are shown in Supplementary Tables 4-11.
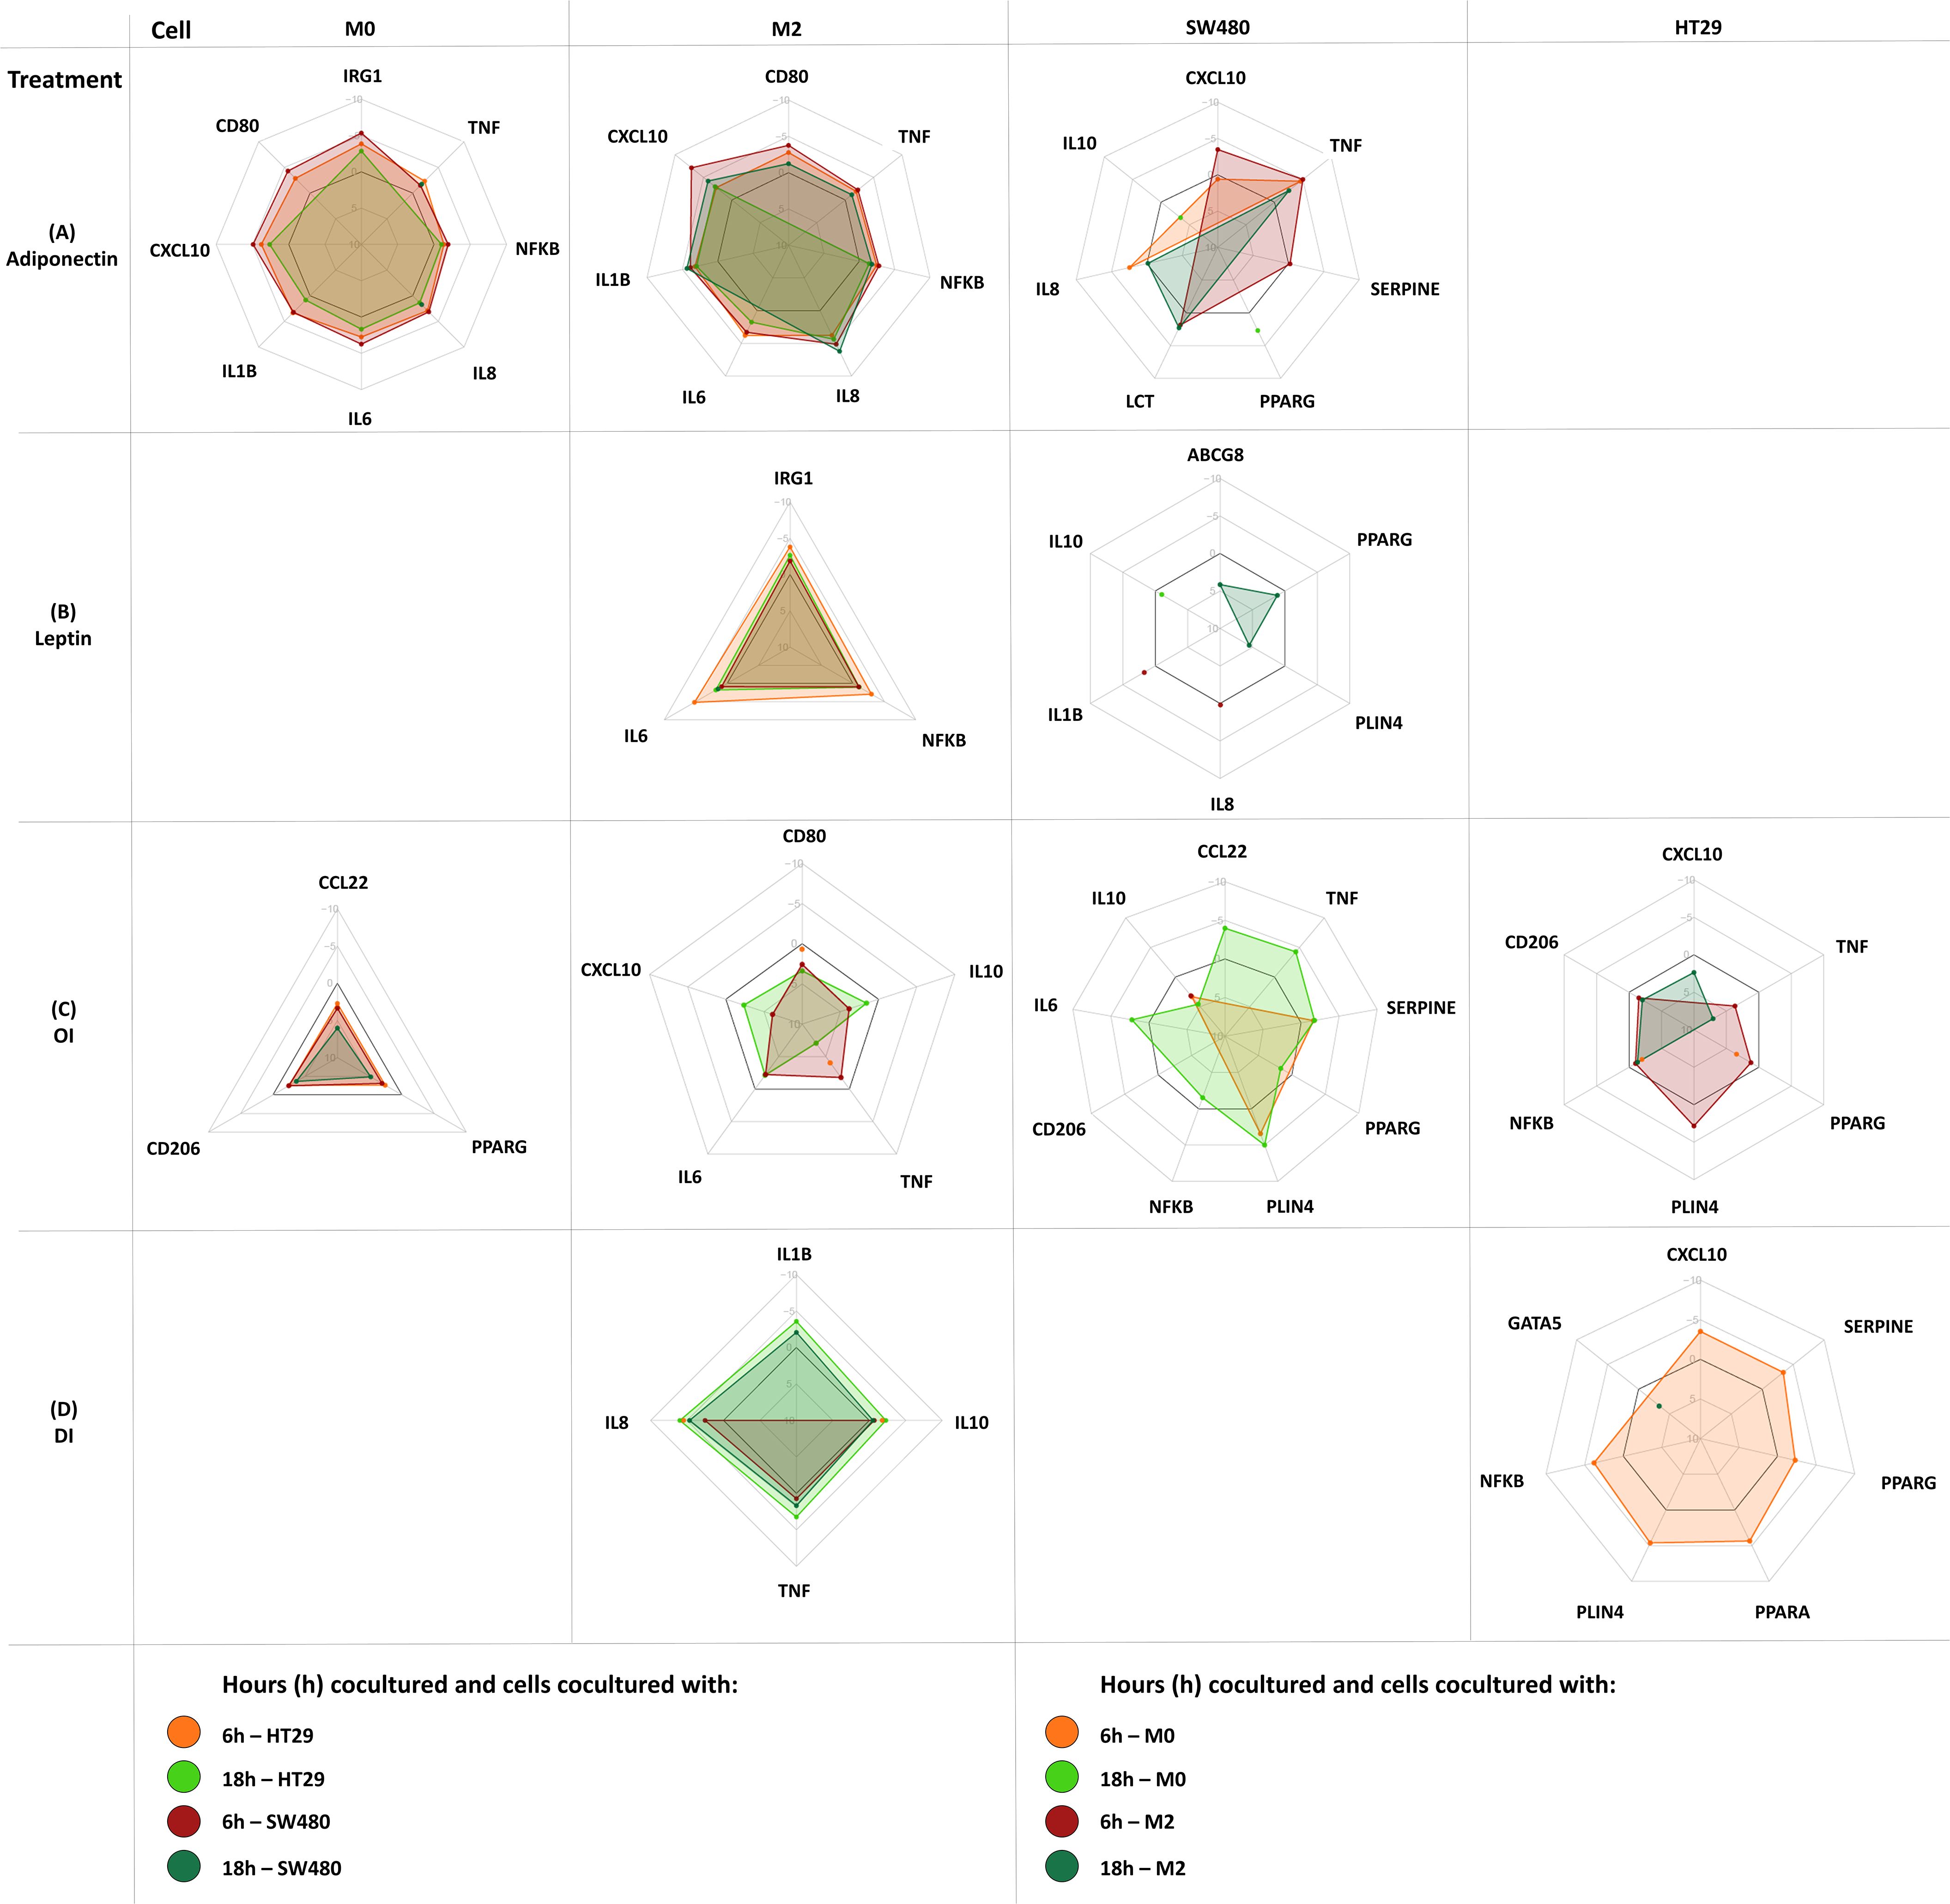
Figure 6. Gene expression changes in coculture following cell treatment (M0-macrophage, M2-macrophage as well as SW480, HT29 gene expression). Either M0 or M2 macrophages were cultured separately with either SW480 or HT29 CC cell lines and harvested after treatment at 6 hours and 18 hours. Cocultured cells were treated with either adiponectin (A), leptin (B), OI (4-octyl itaconate) (C), or DI (dimethyl itaconate) (D). Results are expressed as DDCT ± SEM. N=10 for each time point and treatment dose. The spider web line showing a DDCT of 0 is marked bold black (no change in gene expression). Upregulation is shown by a negative DDCT, while downregulations have positive DDCT values (DDCT values are shown on the vertical axis from -10 to +10). Single data points are shown as dots. Only statistically significant genes and time points are shown, for complete data see Supplementary Tables 4-11.
3.6.2 Leptin and adiponectin increase tumor promoting IRG1 and IL8 expression in macrophages
Gene expression following treatment with either adiponectin, leptin, 4OI or DI was assessed in macrophages. Significant changes were shown in both M0 and M2-like macrophages for all treatments except for leptin, which only affected M2 macrophages.
Adiponectin increased tumor promoting IRG1 expression in M0 macrophages, as well as IL6, IL8, and NFKB expression in M0 and M2-like macrophages (Figure 6A). It upregulated proinflammatory gene expression including CD80, CXCL10, and TNFA in M0 and in M2-like macrophages. Procarcinogenic IL1B was upregulated by adiponectin in M2 macrophages.
Leptin only increased expression of IRG1, IL8, and NFKB in M2-like macrophages (Figure 6B).
3.6.3 4OI and DI enhance anti-inflammatory gene expression in macrophages
In M0 macrophages, 4OI downregulated the monocyte and T-cell chemoattractant CCL22 and anti-inflammatory marker CD206, and exerted tumor promoting effects by directly downregulating PPARG (Figure 6C). M2-like macrophages demonstrated a predominantly anti-inflammatory profile following 4OI treatment with downregulation of proinflammatory CD80, CXCL10, TNFA, and IL6 (Figure 6C). While 4OI downregulated anti-inflammatory IL10 expression in M2 macrophages, DI upregulated IL10. DI also exerted further anti-inflammatory effects by upregulating IL8 in M0 and in M2 macrophages (Figures 6C, D).
3.6.4 Leptin, adiponectin and 4OI alter PPARG expression and induce tumor promoting mediator expression in colon cancer cells
Adiponectin, leptin, 4OI, and DI affected gene expression in HT29 and SW480 CC cell line cells (Figure 6).
Adiponectin only affected gene expression in SW480 and upregulated PPARG, CXCL10, IL8, LCT, SERPINE and TNFA, and downregulated IL10 (Figure 6A).
Only leptin treatment had an impact on ABCG8 and IL1B expression. Leptin upregulated GATA5 and downregulated CCL22, IL10, IL8, PLIN4, and PPARG (Figure 6B).
4OI exerted tumor promoting effects in both cancer cell lines by downregulating NFKB and PPARG in coculture with either M0 or M2 macrophages. PLIN4 was upregulated in both CC cell lines following 4OI treatment (Figure 6C).
In SW480, 4OI showed overall proinflammatory effects. In HT29, anti-inflammatory responses were observed with downregulation of CXCL10 and TNFA (Figure 6C).
DI upregulated CXCL10, NFKB, PLIN4, PPARA, PPARG, and SERPINE, and downregulated GATA5 in HT29, and IL8 and NFKB in SW480 (Figure 6D).
4 Discussion
Itaconate is a macrophage-specific metabolite and part of the NOTCH4-GATA4-IRG1 pathway, a subset of signaling pathways associated with cell differentiation and proliferation in CC. It reduces oxidative stress as an anti-inflammatory mediator (8, 17, 33). Itaconate’s tumor- promoting effects have been previously demonstrated in different types of cancers (9–11). It serves as an anti-inflammatory counterpart in the chronic proinflammatory state of obesity, which potentially defines it as a linking mediator of obesity, metabolic dysfunction, and cancer.
There are currently insufficient data available on IRG1-related expression and itaconate levels as part of the NOTCH4-GATA4-IRG1 pathway in CC. This study demonstrates that in individuals with obesity and sporadic CC, itaconate may affect cancer development. On the background of continuously increasing rates of obesity and EOCC, itaconate may play a key role in younger individuals with CC.
Gene expression of IRG1, which encodes the itaconate producing enzyme ACOD1, was more frequently detected in CC tissue samples (65%) versus matched normal adjacent colon tissue (5%). RNA-seq data results confirmed these findings (53% versus 25%). Also ACOD1 protein expression was significantly higher in CC versus normal colon tissue. Therefore, IRG1 may be amplified in sporadic CC and may represent an oncogene target. Similar ACOD1 protein expression patterns have been found in cancers such as human glioma, correlating with recurrence-free survival and cancer stage (11). ACOD1 expression was classified as either low or high in this study, without reporting quantitative expression levels (11). In patients with ovarian carcinoma, monocytes harvested from ascites fluid showed enhanced IRG1 expression, enforcing peritoneal tumor progression (9). In various murine cancer cell lines (melanoma, lung carcinoma, colon adenocarcinoma), IRG1 mRNA was detected (9). These findings suggest that tumor promoting effects through IRG1-related mechanisms may not be CC specific. The important role of macrophage metabolism and itaconate in CC; however, underlines the importance of immunosuppression via itaconate within the NOTCH4-GATA4-IRG1 pathway in CC (34, 35). Oxidative phosphorylation in TAMs is directly impacted by itaconate. This is accompanied by reactive oxygen species (ROS) production and macrophage polarization (9). ROS mediate cell proliferation, migration, and angiogenesis through several transcription factors and processes of autophosphorylation, including NF-κB, vascular endothelial growth factor receptor 2 (VEGFR2), and mitogen-activated protein kinases (MAPKs) (36). Development of colon polyps with malignant potential and poor patient survival in CC are associated with M2-like TAMs (37, 38). The relationship of NOTCH4-GATA4-IRG1 signaling, itaconate metabolism, and an anti-inflammatory macrophage phenotype in CC has yet to be investigated further.
EOCC, metabolic dysfunction, and obesity may be linked by itaconate metabolism. This study provides evidence for a link between obesity and systemic itaconate levels by demonstrating a correlation of BMI and preoperative plasma itaconate concentrations (rs=0.51; p=0.020). In individuals with elevated BMI and CC, the chronic proinflammatory state may be linked to an itaconate-producing macrophage phenotype derived from peripheral monocytes. In individuals with obesity, a phenotypic switch of adipose tissue-infiltrating macrophages is reported, which enhances inflammation, provokes insulin resistance and the onset of diabetes (39, 40). This switch mechanism could affect systemic itaconate concentrations and therefore CC risk as well.
A limitation of the correlation analysis shown in this study is that causality between itaconate and BMI cannot be confirmed and the sample size does not allow for concluding an empirical correlation. The observed correlations are primarily associative and future mechanistic studies with controlled experiments are necessary to establish causality. Finding a correlation that is significant despite these limitations, however, suggests that in patients with higher BMI and CC systemic itaconate may be a target of interest.
Comparing EOCC tissue versus that of patients with sporadic CC >50 years old revealed that a higher itaconate concentration was demonstrated in normal colon tissue of younger individuals with EOCC. There was no difference in CC itaconate concentrations between younger and older (>50 years of age) patients. These findings have not been previously reported. Due to the limited sample size, however, conclusions are limited, and findings cannot necessarily be generalized across the large and diverse population of colon cancer patients. As evidence suggests that colon cancer onset and progression are multifactorial, our results may only be significant for a certain subset of individuals with colon cancer. Despite the highly variable itaconate concentrations measured among colon samples, however, a significant difference was demonstrated. Therefore, additionally to itaconate’s basic role in CC, a particular effect on the early onset of CC may be related to itaconate, which should be further investigated.
Microsatellite-instability (MSI) affects tumor metabolism and clinical outcome in patients with CC. The MSI status correlates with the tumor location within the colon (41–43). Furthermore, MSI tumors show abnormal protein translation, which is triggering immune responses (44). Lacking metadata including MSI status marks another limitation of this study. In addition, small sample size did not allow for correlation of ACOD1 and itaconate levels with tumor stage.
Higher IRG1 expression in CC versus normal colon samples as well as higher levels of itaconate itself in CC tissue was demonstrated by differential gene expression analysis. This suggests potential effects of IRG1 expression in cancer growth and development. Only in patients with stage 4 CC, an effect of IRG1 cancer tissue expression on patient survival was found. In earlier stages of CC, the limited number of patients and a varying sensitivity of the respective sequencing technique, which is negatively affecting the detection of the generally low expression of IRG1, may mask a potential effect. Standardized sequencing methods and tissue quality suggest that data sets are feasibly comparable; however, expression differences between samples may be masked due to variations in gene expression resolution. This can negatively affect the validity of differential expression calls for genes that show low expression in general, especially when a number of highly expressed outliers dominate a sample. This bias can mask expression of low expression genes and no significant difference in differential expression can be found. Our largest set of genomic data (N=380) did not confirm initial IRG1 expression results. IRG1-associated gene expression of the NOTCH4-GATA4-IRG1 pathway; however, was altered significantly. GATA4, DLL4, VEGFA, and MAPK15 were all upregulated in CC and seem to be associated with a younger patient age. ABCG5 and GATA5 were downregulated in CC and shown to be associated with higher BMI. A limitation of this analysis is the fact that CC and part of the normal colon samples were matched and were not obtained from the same patient, which can potentially mask differences in gene expression between tissues. To minimize this bias, however, we used adjacent normal colon tissue data where available, and used GTEx as a resource for normal colon samples matched for sex, age, and BMI.
The role of obesity-related hormones can have a significant impact on cell metabolism and therefore macrophage polarization, but their role in EOCC is mostly unknown. Our results suggest that adiponectin induces a mostly proinflammatory response in M0 macrophages with a simultaneous increase in IRG1 expression, which may have a significant effect in early cancer development. Leptin upregulated IRG1 in already polarized M2-like macrophages, and therefore exerted potential effects during later tumor stages. As a known key mechanism in CC development, OI mediated tumor promoting effects by downregulating PPARG in M0 macrophages and by enhancing the anti-inflammatory profile in M2-like macrophages (45). DI showed a mixed response by upregulating IL8 and IL1B as a potential mechanism in CC (46, 47).
Itaconate and its related procarcinogenic mechanisms within the NOTCH4-GATA4-IRG1 pathway could represent a novel immunomodulatory target in TAM to break the NOTCH4 signaling cascade that enhances anti-inflammatory macrophage polarization. This could combat tumor-induced immunosuppression and tumor progression in individuals with obesity and CC and in patients with EOCC. Furthermore, suppression of IRG1 and obesity hormone-associated gene expression in macrophages could perhaps induce cancer remission or inhibit tumor growth, as well as prolong survival in advanced stage cancers. Our data suggest that TAM metabolism and its production of itaconate in EOCC may promote cancer progression.
IRG1 is amplified in sporadic CC. ACOD1 protein levels and itaconate concentrations in colon tissue differ between age groups. These findings provide new insight into EOCC-related TAM metabolism. In patients with elevated BMI and CC, itaconate may have a immunotherapeutic role. Studies investigating a larger number of subjects are necessary to determine the role of itaconate in metabolic dysfunction and EOCC. Itaconate and the NOTCH4-GATA4-IRG1 pathway may represent potential immunotargets in EOCC.
Data availability statement
The datasets (TCGA, EGA, GTEx) presented in this study can be found in online repositories. The names of the repository/repositories and accession number(s) can be found in the article/Supplementary Material. Additional datasets included in this study are available upon request.
Ethics statement
The studies involving humans were approved by The University of Louisville Institutional Review Board. The studies were conducted in accordance with the local legislation and institutional requirements. The participants provided their written informed consent to participate in this study.
Author contributions
KS: Conceptualization, Data curation, Formal Analysis, Investigation, Methodology, Project administration, Resources, Software, Supervision, Validation, Visualization, Writing – original draft, Writing – review & editing. JH: Data curation, Investigation, Visualization, Writing – review & editing. DS: Data curation, Formal Analysis, Investigation, Software, Visualization, Writing – review & editing. AM: Conceptualization, Formal Analysis, Investigation, Software, Visualization, Writing – review & editing. RB: Data curation, Formal Analysis, Investigation, Methodology, Software, Supervision, Visualization, Writing – review & editing. MP: Data curation, Formal Analysis, Investigation, Software, Writing – review & editing. AL: Data curation, Formal Analysis, Investigation, Software, Writing – review & editing. EH: Data curation, Software, Writing – review & editing. AB: Conceptualization, Investigation, Methodology, Validation, Writing – review & editing. JB: Conceptualization, Investigation, Methodology, Project administration, Resources, Writing – review & editing. JG: Conceptualization, Formal Analysis, Software, Validation, Writing – review & editing. JC: Conceptualization, Formal Analysis, Methodology, Project administration, Writing – review & editing. ER: Conceptualization, Methodology, Project administration, Software, Validation, Writing – review & editing. SG: Conceptualization, Data curation, Formal Analysis, Investigation, Methodology, Project administration, Resources, Software, Supervision, Validation, Visualization, Writing – original draft, Writing – review & editing, Funding acquisition.
Funding
The author(s) declare that financial support was received for the research and/or publication of this article. The John W. Price and Barbara Thruston Atwood Price Trust supported this work. University of Louisville Cancer Education Program (National Institutes of Health, National Cancer Institute R25CA134283) (received by ABL and MAP). The Genotype-Tissue Expression (GTEx) Project was supported by the Common Fund of the Office of the Director of the National Institutes of Health (NIH), and by NINDS, NIMH, NHLBI, NIDA, NHGRI, and NCI.
Acknowledgments
A small portion of preliminary data was presented at the 17th Annual Academic Surgical Congress in Orlando 2022. We thank our collaborators Adrian A. Gerstel and Laura Farnan from the University of North Carolina at Chapel Hill.
Conflict of interest
The authors declare that the research was conducted in the absence of any commercial or financial relationships that could be construed as a potential conflict of interest.
Generative AI statement
The author(s) declare that no Generative AI was used in the creation of this manuscript.
Publisher’s note
All claims expressed in this article are solely those of the authors and do not necessarily represent those of their affiliated organizations, or those of the publisher, the editors and the reviewers. Any product that may be evaluated in this article, or claim that may be made by its manufacturer, is not guaranteed or endorsed by the publisher.
Supplementary material
The Supplementary Material for this article can be found online at: https://www.frontiersin.org/articles/10.3389/fimmu.2025.1572985/full#supplementary-material
References
1. Bhandari A, Woodhouse M, and Gupta S. Colorectal cancer is a leading cause of cancer incidence and mortality among adults younger than 50 years in the USA: a SEER-based analysis with comparison to other young-onset cancers. J Investig Med. (2017) 65:311–5. doi: 10.1136/jim-2016-000229
2. Hales CM, Carroll MD, Fryar CD, and Ogden CL. Prevalence of obesity and severe obesity among adults: United States, 2017-2018. NCHS Data Brief. (2020) 360:1–8.
3. Liu PH, Wu K, Ng K, Zauber AG, Nguyen LH, and Song M. Association of obesity with risk of early-onset colorectal cancer among women. JAMA Oncol. (2019) 5:37–44. doi: 10.1001/jamaoncol.2018.4280
4. Saud SM, Li W, Morris NL, Matter MS, Colburn NH, Kim YS, et al. Resveratrol prevents tumorigenesis in mouse model of Kras activated sporadic colorectal cancer by suppressing oncogenic Kras expression. Carcinogenesis. (2014) 35:2778–86. doi: 10.1093/carcin/bgu209
5. Stone WL, Krishnan K, Campbell SE, and Palau VE. The role of antioxidants and pro-oxidants in colon cancer. World J Gastrointest Oncol. (2014) 6:55–66. doi: 10.4251/wjgo.v6.i3.55
6. Monteiro R and Azevedo I. Chronic inflammation in obesity and the metabolic syndrome. Mediators Inflammation. (2010) 2010. doi: 10.1155/2010/289645
7. Holowatyj AN, Gigic B, Herpel E, Scalbert A, Schneider M, Ulrich CM, et al. Distinct molecular phenotype of sporadic colorectal cancers among young patients based on multiomics analysis. Gastroenterology. (2020) 158:1155–58.e2. doi: 10.1053/j.gastro.2019.11.012
8. O’Neill LAJ and Artyomov MN. Itaconate: the poster child of metabolic reprogramming in macrophage function. Nat Rev Immunol. (2019) 19:273–81. doi: 10.1038/s41577-019-0128-5
9. Weiss JM, Davies LC, Karwan M, Ileva L, Ozaki MK, Cheng RY, et al. Itaconic acid mediates crosstalk between macrophage metabolism and peritoneal tumors. J Clin Invest. (2018) 128:3794–805. doi: 10.1172/JCI99169
10. McNeal S, Bitterman P, Bahr JM, Edassery SL, Abramowicz JS, Basu S, et al. Association of immunosuppression with DR6 expression during the development and progression of spontaneous ovarian cancer in laying hen model. J Immunol Res. (2016) 2016:6729379. doi: 10.1155/2016/6729379
11. Pan J, Zhao X, Lin C, Xu H, Yin Z, Liu T, et al. Immune responsive gene 1, a novel oncogene, increases the growth and tumorigenicity of glioma. Oncol Rep. (2014) 32:1957–66. doi: 10.3892/or.2014.3474
12. Scheurlen KM, Chariker JH, Kanaan Z, Littlefield AB, George JB, Seraphine C, et al. The NOTCH4-GATA4-IRG1 axis as a novel target in early-onset colorectal cancer. Cytokine Growth Factor Rev. (2022) 67:25–34. doi: 10.1016/j.cytogfr.2022.06.002
13. Shannon P, Markiel A, Ozier O, Baliga NS, Wang JT, Ramage D, et al. Cytoscape: a software environment for integrated models of biomolecular interaction networks. Genome Res. (2003) 13:2498–504. doi: 10.1101/gr.1239303
14. Scheurlen KM, Billeter AT, O'Brien SJ, and Galandiuk S. Metabolic dysfunction and early-onset colorectal cancer - how macrophages build the bridge. Cancer Med. (2020) 9:6679–93. doi: 10.1002/cam4.v9.18
15. Peng X, Chen Z, Farshidfar F, Xu X, Lorenzi PL, Wang Y, et al. Molecular characterization and clinical relevance of metabolic expression subtypes in human cancers. Cell Rep. (2018) 23:255–69.e4. doi: 10.1016/j.celrep.2018.03.077
16. Zhang M, Wang HZ, Peng RY, Xu F, Wang F, and Zhao Q. Metabolism-associated molecular classification of colorectal cancer. Front Oncol. (2020) 10:602498. doi: 10.3389/fonc.2020.602498
17. Li R, Zhang P, Wang Y, and Tao K. Itaconate: A metabolite regulates inflammation response and oxidative stress. Oxid Med Cell Longev. (2020) 2020:5404780. doi: 10.1155/2020/5404780
18. Tarique AA, Logan J, Thomas E, Holt PG, Sly PD, Fantin E, et al. Phenotypic, functional, and plasticity features of classical and alternatively activated human macrophages. Am J Respir Cell Mol Biol. (2015) 53:676–88. doi: 10.1165/rcmb.2015-0012OC
19. Nelson VL, HC, Nguyen B, Garcìa-Cañaveras JC, Briggs ER, Ho WY, DiSpirito JR, et al. PPARgamma is a nexus controlling alternative activation of macrophages via glutamine metabolism. Genes Dev. (2018) 32:1035–44. doi: 10.1101/gad.312355.118
20. Edin S, Wikberg ML, Dahlin AM, Rutegård J, Öberg Å, Oldenborg PA, et al. The distribution of macrophages with a M1 or M2 phenotype in relation to prognosis and the molecular characteristics of colorectal cancer. PLoS One. (2012) 7:e47045. doi: 10.1371/journal.pone.0047045
21. Liu J, Geng X, Hou J, and Wu G. New insights into M1/M2 macrophages: key modulators in cancer progression. Cancer Cell Int. (2021) 21:389. doi: 10.1186/s12935-021-02089-2
22. Scheurlen KM, Snook DL, Gardner SA, Eichenberger MR, and Galandiuk S. Macrophage Differentiation and Polarization into an M2-Like Phenotype using a Human Monocyte-Like THP-1 Leukemia Cell Line. J Vis Exp. (2021) 174. doi: 10.3791/62652
23. Tomczak K, Czerwinska P, and Wiznerowicz M. The Cancer Genome Atlas (TCGA): an immeasurable source of knowledge. Contemp Oncol (Pozn). (2015) 19:A68–77. doi: 10.5114/wo.2014.47136
24. Lappalainen I, Almeida-King J, Kumanduri V, Senf A, Spalding JD, Ur-Rehman S, et al. The European Genome-phenome Archive of human data consented for biomedical research. Nat Genet. (2015) 47:692–5. doi: 10.1038/ng.3312
25. Cock PJA, Fields CJ, Goto N, Heuer ML, and Rice PM. The Sanger FASTQ file format for sequences with quality scores, and the Solexa/Illumina FASTQ variants. Nucleic Acids Res. (2010) 38:1767–71. doi: 10.1093/nar/gkp1137
26. Andrews S. FastQC: A quality control tool for high throughput sequence data . Available online at: http://www.bioinformatics.babraham.ac.uk/projects/fastqc/ (Accessed December 1, 2024).
27. Dobin A, Davis CA, Schlesinger F, Drenkow J, Zaleski C, Jha S, et al. STAR: ultrafast universal RNA-seq aligner. Bioinformatics. (2013) 29:15–21. doi: 10.1093/bioinformatics/bts635
28. Anders S, Pyl PT, and Huber W. HTSeq–a Python framework to work with high-throughput sequencing data. Bioinformatics. (2015) 31:166–9. doi: 10.1093/bioinformatics/btu638
29. Frankish A, Diekhans M, Jungreis I, Lagarde J, Loveland JE, Mudge JM, et al. Gencode 2021. Nucleic Acids Res. (2021) 49:D916–23. doi: 10.1093/nar/gkaa1087
30. Love M, Anders S, and Huber W. Differential analysis of count data–the DESeq2 package. Genome Biol. (2014) 15:10.1186. doi: 10.1186/gb-2010-11-10-r106
31. TM T. A package for survival analysis in R (2020). Available online at: https://CRAN.R-project.org/package=survival (Accessed September 1, 2024).
32. R_Core_Team. R: A language and environment for statistical computing. Vienna, Austria.: R Foundation for Statistical Computing (2020). Available at: https://www.R-project.org (Accessed September 1, 2024).
33. Hooftman A and O’Neill LAJ. The immunomodulatory potential of the metabolite itaconate. Trends Immunol. (2019) 40:687–98. doi: 10.1016/j.it.2019.05.007
34. Lasry A, Zinger A, and Ben-Neriah Y. Inflammatory networks underlying colorectal cancer. Nat Immunol. (2016) 17:230–40. doi: 10.1038/ni.3384
35. Miao H, Ou J, Peng Y, Zhang X, Chen Y, Hao L, et al. Macrophage ABHD5 promotes colorectal cancer growth by suppressing spermidine production by SRM. Nat Commun. (2016) 7:11716. doi: 10.1038/ncomms11716
36. Gupta SC, Hevia D, Patchva S, Park B, Koh W, Aggarwal BB, et al. Upsides and downsides of reactive oxygen species for cancer: the roles of reactive oxygen species in tumorigenesis, prevention, and therapy. Antioxid Redox Signal. (2012) 16:1295–322. doi: 10.1089/ars.2011.4414
37. Feng Q, Chang W, Mao Y, He G, Zheng P, Tang W, et al. Tumor-associated macrophages as prognostic and predictive biomarkers for postoperative adjuvant chemotherapy in patients with stage II colon cancer. Clin Cancer Res. (2019) 25:3896–907. doi: 10.1158/1078-0432.CCR-18-2076
38. Taniyama D, Taniyama K, Kuraoka K, Yamamoto H, Zaitsu J, Saito A, et al. CD204-positive tumor-associated macrophages relate to Malignant transformation of colorectal adenoma. Anticancer Res. (2019) 39:2767–75. doi: 10.21873/anticanres.13403
39. Lumeng CN, Bodzin JL, and Saltiel AR. Obesity induces a phenotypic switch in adipose tissue macrophage polarization. J Clin Invest. (2007) 117:175–84. doi: 10.1172/JCI29881
40. Uysal KT, Wiesbrock SM, Marino MW, and Hotamisligil GS. Protection from obesity-induced insulin resistance in mice lacking TNF-alpha function. Nature. (1997) 389:610–4. doi: 10.1038/39335
41. Salem ME, Battaglin F, Goldberg RM, Puccini A, Shields AF, Arguello D, et al. Molecular analyses of left- and right-sided tumors in adolescents and young adults with colorectal cancer. Oncologist. (2020) 25:404–13. doi: 10.1634/theoncologist.2019-0552
42. Azar I, Masalmeh Al N, Esfandiarifard S, Virk G, Kiwan W, Shields Frank A, et al. The impact of primary tumor sidedness on survival in early-onset colorectal cancer by stage: A National Veterans Affairs retrospective analysis. Cancer Med. (2021) 10:2987–95. doi: 10.1002/cam4.v10.9
43. Lin A, Zhang J, and Luo P. Crosstalk between the MSI status and tumor microenvironment in colorectal cancer. Front Immunol. (2020) 11:2039. doi: 10.3389/fimmu.2020.02039
44. Xiao Y and Freeman GJ. The microsatellite instable subset of colorectal cancer is a particularly good candidate for checkpoint blockade immunotherapy. Cancer Discovery. (2015) 5:16–8. doi: 10.1158/2159-8290.CD-14-1397
45. Scheurlen KM, Snook DL, Walter MN, Cook CN, Fiechter CR, Pan J, et al. Itaconate and leptin affecting PPARgamma in M2 macrophages: A potential link to early-onset colorectal cancer. Surgery. (2022) 171:650–6. doi: 10.1016/j.surg.2021.10.054
46. Li Y, Wang L, Pappan L, Galliher-Beckley A, and Shi J. IL-1beta promotes stemness and invasiveness of colon cancer cells through Zeb1 activation. Mol Cancer. (2012) 11:87. doi: 10.1186/1476-4598-11-87
Keywords: early-onset colon cancer, macrophages, immunology, obesity, metabolism
Citation: Scheurlen KM, Hallion J, Snook DL, MacLeod A, Beal RJ, Parks MA, Littlefield AB, Hiken E, Billeter AT, Bensen J, Gaskins JT, Chariker J, Rouchka EC and Galandiuk S (2025) Itaconate and obesity-related hormones promote tumor progression – new insights on metabolic dysfunction in early-onset colon cancer. Front. Immunol. 16:1572985. doi: 10.3389/fimmu.2025.1572985
Received: 08 February 2025; Accepted: 21 May 2025;
Published: 09 June 2025.
Edited by:
Sandesh J. Marathe, University of Tennessee Health Science Center (UTHSC), United StatesReviewed by:
Florin Zugun-Eloae, Grigore T. Popa University of Medicine and Pharmacy, RomaniaMinjeong Kim, University of Tennessee Health Science Center (UTHSC), United States
Copyright © 2025 Scheurlen, Hallion, Snook, MacLeod, Beal, Parks, Littlefield, Hiken, Billeter, Bensen, Gaskins, Chariker, Rouchka and Galandiuk. This is an open-access article distributed under the terms of the Creative Commons Attribution License (CC BY). The use, distribution or reproduction in other forums is permitted, provided the original author(s) and the copyright owner(s) are credited and that the original publication in this journal is cited, in accordance with accepted academic practice. No use, distribution or reproduction is permitted which does not comply with these terms.
*Correspondence: Susan Galandiuk, c3VzYW4uZ2FsYW5kaXVrQGxvdWlzdmlsbGUuZWR1