 Silvia Varricchio1
 Simona Romano2
 Daniela Russo1
 Antonio Travaglino3Rosaria Cappiello1Mariarosaria Cervasio1Gennaro Ilardi1Laura Marrone2
 Fabrizio Pane4
 Marco Picardi4Marcello Persico5
 Elena Vigliar6Gennaro Acanfora6
 Maria Fiammetta Romano2*
 Massimo Mascolo1
- 1Department of Advanced Biomedical Sciences, Pathology Section, University of Naples “Federico II”, Naples, Italy
- 2Department of Molecular Medicine and Medical Biotechnology, University of Naples Federico II, Naples, Italy
- 3Unit of Pathology, Department of Medicine and Technological Innovation, University of Insubria, Varese, Italy
- 4Department of Clinical Medicine and Surgery, Hematology Section, University of Naples “Federico II”, Naples, Italy
- 5Department of Clinical Medicine and Surgery, University of Naples “Federico II”, Naples, Italy
- 6Department of Public Health, University of Naples “Federico II”, Naples, Italy
Background: Hodgkin lymphoma (HL) is characterized by rare Hodgkin/Reed-Sternberg (H/RS) cells surrounded by a predominant immune infiltrate that shapes tumor biology and influences prognosis. FKBP51, an immunophilin and NF-κB/Akt modulator, is implicated in cancer progression, but its role within the HL tumor microenvironment (TME) remains unclear.
Methods: We retrospectively analyzed 103 HL cases by immunohistochemistry for FKBP51, Bcl2, and immune subsets (CD4, CD8, CD68, CD163), with quantitative PCR of FKBP5, TRAF2, PCNA, XIAP, and BCL2 in 36 cases. Spatial immune architecture was assessed morphologically and via image analysis, with a focus on CD4 T-cell rosettes. Prognostic associations were evaluated through multivariate analyses.
Results: FKBP51 was detected in both H/RS cells and infiltrating lymphocytes. While nuclear FKBP51 in H/RS cells lacked prognostic significance, FKBP51 expression in the TME correlated with adverse outcomes and remained an independent prognostic factor. CD4 T cells were the predominant immune cell subset and the main FKBP51-positive population. However, it was the density of tumor-associated macrophages (TAMs), rather than CD4 T-cell density, that held prognostic significance. CD4 T cells frequently formed rosette-like structures around H/RS cells, a spatial organization associated with the highest FKBP51 scores and unfavorable prognosis. CD8 T cells were less abundant, increased in advanced stages along with TAMs, and exhibited limited FKBP51 expression. Gene expression analysis showed FKBP51 correlation with proliferative and anti-apoptotic transcripts (PCNA, TRAF2, XIAP), supporting a protumor, NF-κB-driven microenvironment.
Conclusions: FKBP51 expression in CD4 tumor-infiltrating lymphocytes, rather than tumor cells, defines a protumor TME that supports H/RS cell survival. Spatial immune architecture, particularly CD4 rosettes and TAM density, holds prognostic relevance in HL. FKBP51 may serve as a biomarker for risk stratification.
1 Introduction
Hodgkin lymphoma (HL) is one of the most common lymphomas in the Western world, accounting for about half of all lymphomas in children and young adults (1). The first-line treatment for classic HL consists of ABVD (doxorubicin, bleomycin, vinblastine, and dacarbazine) polychemotherapy with or without radiotherapy (2). The number of first-line cycles and radiation dose leading to a complete response in most patients is determined by prognostic factors such as extra-nodal disease, mediastinal bulky, high erythrocyte sedimentation rate and B symptoms (3–5). A significant number of patients with HL experience refractory disease or relapse even after achieving a complete response to therapy. In cases of relapse or refractory HL, immunotherapy options such as PD-1 inhibitors (6) or the CD30 inhibitor brentuximab vedotin (7) have demonstrated efficacy, however, achieving a definitive cure in such cases remains challenging (6, 7). Identifying prognostic biomarkers linked to inadequate responses in HL can help pathologists deliver more accurate diagnostic definitions and characterizations, aid in patient stratification, and discover new therapeutic targets.
Diagnosing HL presents several challenges for pathologists, H/RS cells are generally rare in tissue samples, making them difficult to detect. HL is characterized by large-sized neoplastic B cells, termed “Hodgkin cells” and “Reed-Sternberg cells” (H/RS cells), scattered in a dominant background of non-neoplastic immune cells. Such microenvironments comprise T and B lymphocytes, eosinophils, and macrophages in classic HL (which accounts for >95% of all HL cases) and mainly lymphocyte in nodular lymphocyte-predominant HL (8).
H/RS cells secrete chemokines that attract CD4 T cells and Tregs while repelling CD8 T cells (9, 10). A distinctive feature of HL is the formation of “rosettes,” where CD4 T lymphocytes surround H/RS cells. This unique organization of immune cells is driven by a combination of chemokine signaling, receptor-ligand interactions, and other immune evasion mechanisms (11). Instead of initiating an anti-tumor response, CD4 T cells are co-opted by H/RS cells to provide growth signals, promote immune suppression, and shield the tumor from cytotoxic effects (9, 10, 12). This relationship highlights a complex interaction within the HL TME, where CD4 T cells not only fail to eliminate H/RS cells but also support their survival.
In HL, a deregulated NF-κB pathway represents one of the key mechanisms promoting survival of H/RS cells (13). FKBP51 is an immunophilin and cochaperone that plays a crucial role in NF-κB activation (14). It exerts an essential role in supporting lymphocyte activation and promoting their proliferation (15). Furthermore, numerous studies have reported abnormal FKBP51 expression in various cancers (16–20) and have proposed it as a reliable prognostic marker in human solid tumors, including mycosis fungoides (21).
FKBP51 has not yet been studied in HL. This research aims to evaluate its expression and prognostic significance alongside Bcl-2, which is a well-known prognostic marker for HL (22). Additionally, the study will examine any potential association between FKBP51, and the gene expression of molecular factors involved in proliferation and anti-apoptosis that are under the transcriptional control of NF-κB.
2 Materials and methods
2.1 Case selection
Clinical data and formalin-fixed, paraffin-embedded (FFPE) tissue blocks of 103 consecutive patients with HL, diagnosed between January 2012 and February 2020, were retrieved from the archives of the Hematology Unit and Pathology Unit of the Federico II University of Naples. Three expert pathologists (AT, DR and MM) re-evaluated the histological slides to confirm the diagnosis.
The study complies with the Institutional Ethics Committee guidelines, which, following Italian law, do not ask for the Ethical Committee approval on the current research topics.
Furthermore, it follows the Declaration of Helsinki, for studies based only on retrospective analyses on routine FFPE tissue, for which written informed consent from the living patient is required, following the indication of Legislative Decree no. 196/03 (Codex on Privacy) at the time of the intervention for the CL.
2.2 Quantitative PCR
Total RNA extraction was performed on 36 tissue samples by using a FFPE RNA Purification Kit (Merck, Darmstadt, Germany), according to the manufacturer’s instructions and as previously described (21). One μg of each RNA was used for cDNA synthesis with iScriptTM Reverse Transcription (Bio-Rad, Hercules, CA, USA). Gene expression was quantified by qPCR using SsoAdvancedTM SYBR Green Supermix (Bio-Rad) and specific qPCR primers were used for the relative quantitation of the transcripts, performed using co-amplified 18S as an internal control for normalization. To represent the expression differences between different patients, relative quantification of transcripts was calculated with the 2–ΔΔCt method by choosing as reference samples the average 2–ΔΔCt values obtained from peripheral blood mononuclear cells (PBMCs) of 3 healthy donors. For FKBP51, XIAP and 18S specific real-time-validated QuantiTect primers from Qiagen (Valencia, CA, USA) were used. Oligo sequences of TRAF2 and BCL2 were previously reported (14); oligo sequences for PCNA and P53 are indicated: hPCNA_Fw: 5’-CTGCAGAGCATGGACTCGTC-3’, hPCNA_Rev: 5’-GTAGGTGTCGAAGCCCTCAGA; hP53_Fw: 5’-ATCCTCACCATCATCACACTGG-3’, hP53_Rev: 5’-TCTTGCGGAGATTCTCTTCCTC-3’.
2.3 Immunohistochemistry
For each case, we selected a block of tissue fixed in formalin and embedded in paraffin with the highest abundance of H/RS cells and used it to obtain serial sections. Serial 4 µm tissue sections were cut from the paraffin blocks using an ordinary microtome and were mounted on TOMO® IHC Adhesive Glass Slides (Matsunami Glass Ind., Ltd., Japan), for the immunohistochemical evaluation of FKBP51 (clone H-100, sc-13983 Santa Cruz Biotechnology; 1: 200 dilution), Bcl2 (clone SP66, 790–4604 Roche Diagnostics; prediluted), CD4 (clone SP35, 790–4423 Roche Diagnostics; prediluted), CD8 (clone SP239, 790–7176 Roche Diagnostics; prediluted), CD68 (clone KP1, 790–2931 Cell Marque; prediluted) and CD163 (clone MRQ26, 760–4437 Roche Diagnostics; prediluted). Immunohistochemical staining was performed on a Ventana Benchmark Ultra (Ventana Medical Systems Inc., Tucson, AZ) following previously described methods (21). The immunohistochemical expression was assessed through a combined score that considered both intensity and distribution of immunostaining. The intensity of immunostaining was categorized as follows: 0 = null; 1 = weak intensity; 2 = moderate intensity; 3 = strong intensity. The distribution of immunostaining was categorized as follows: 0=<10% of cells, 1 = 10-49%, 2=≥50%. The combined score was calculated as intensity + distribution, with a resulting score of 0-5. All immunohistochemical slides were evaluated by three expert pathologists (AT, DR and MM) after being blinded to the clinical data.
2.4 Statistical analyses
The association among immunohistochemical markers and between qPCR data (Prism GraphPad 7.0a for Macintosh) was assessed by using the Pearson correlation coefficient. The association among immunohistochemical markers was assessed by using the Pearson correlation coefficient. The association between the markers and oncologic outcomes were assessed by using univariate and multivariate binary logistic regression. A significant p-value ≤ 0.05 was adopted. Statistical analyses were performed by using the Statistical Package for Social Science (SPSS) 18.0 package (SPSS Inc., Chicago, IL, USA) and Prism GraphPad 7.0a for Macintosh.
3 Results
3.1 Clinical pathological data
The mean age of the 103 patients was 41 years (range 12-85); 49 patients were male, and 54 were female. All patients underwent Ann Arbor staging system with whole body FDG/PET scans and were treated accordingly with frontline ABVD. Information about the stage was available for 102 patients, out of which 4 were at stage I, 53 were at stage II, 17 were at stage III, and 28 were at stage IV. The mean follow-up was 121.3 months (range 1-156); during the observation time, 29 (28,2%) patients were lost at the follow-up, and so, their data were censored from the statistical analysis; 61 (59,2%) patients were alive with no evidence of disease at the last follow-up, while 7 (6,8%) died from disease and 6 (5,8%) had primary refractory disease. Table 1 summarizes clinical-pathological data.
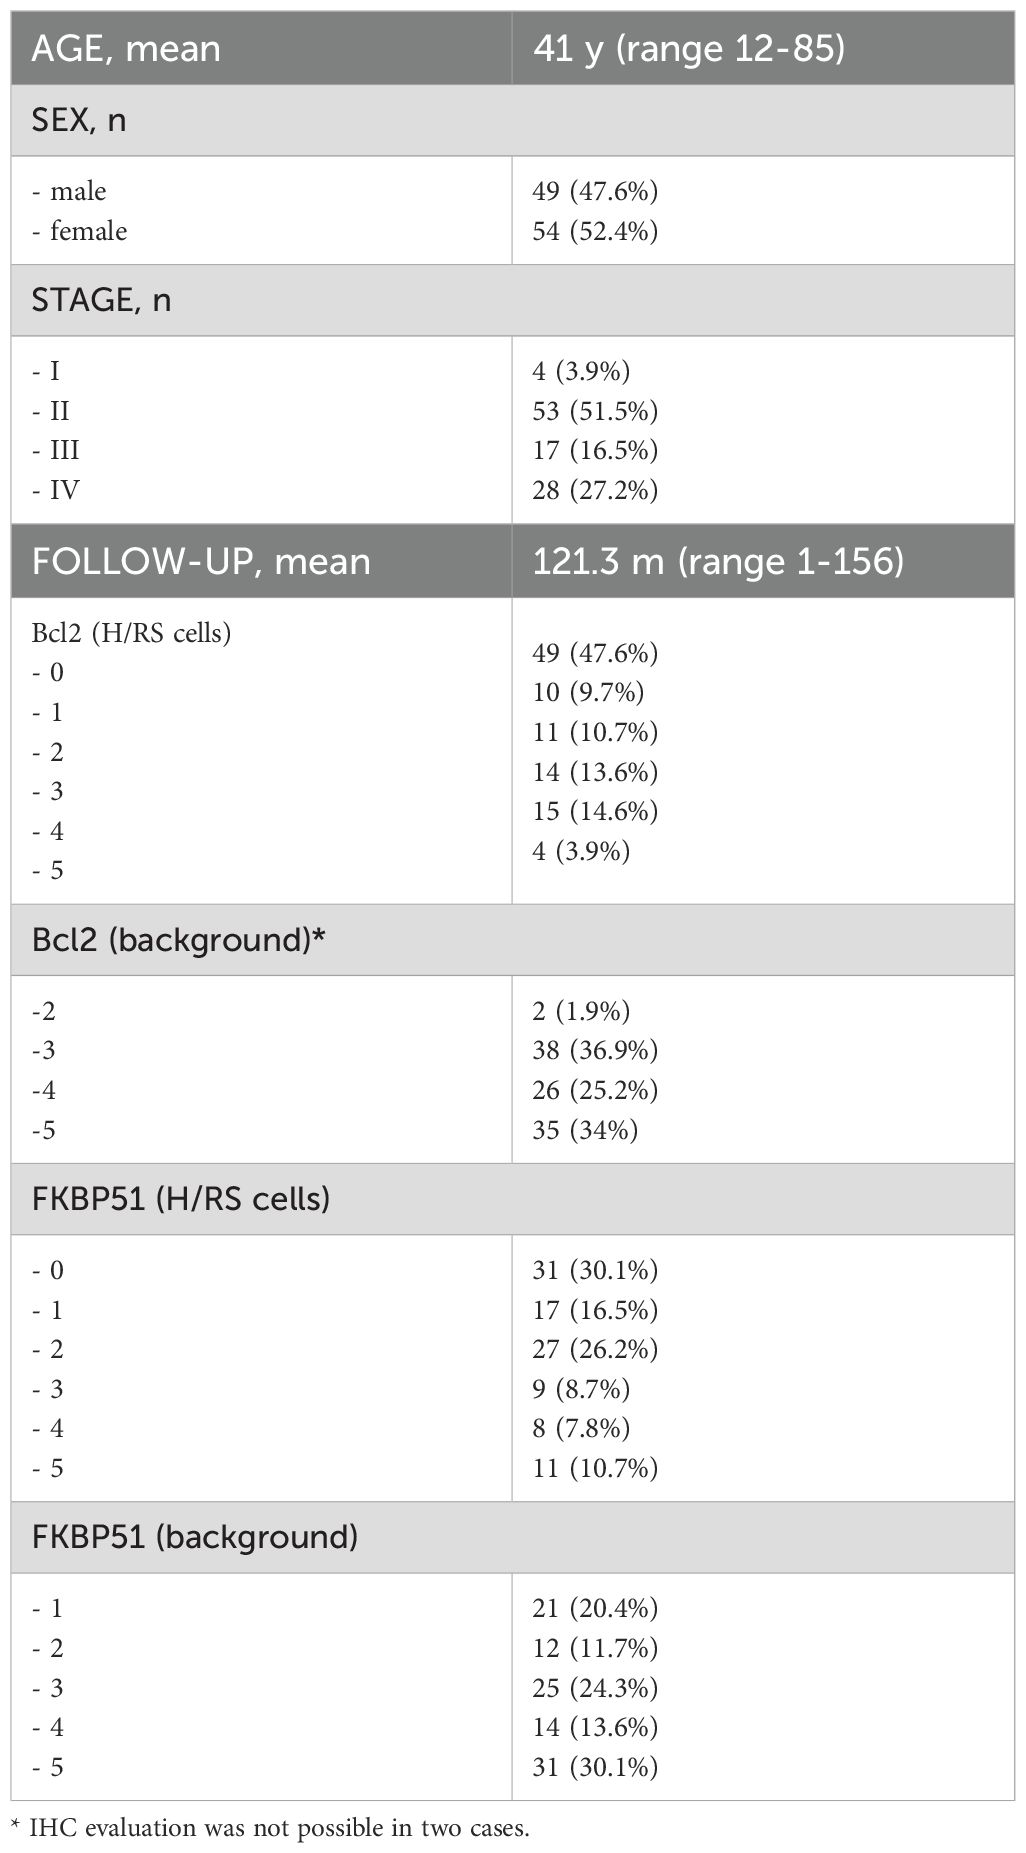
Table 1. Characteristics of the patients and immunohistochemical expression of FKBP51 and BCL2 in HL.
3.2 Immunohistochemical staining reveals background lymphocytes exhibiting strong and prominent FKBP51
FKBP51 expression in the H/RS cells was almost exclusively nuclear (Figure 1) and completely negative in 31 cases (30.1%). Most of the positive cases had weak and/or focal expression with a score 1 (n=17, 16.5%) or 2 (n=26, 26.2%); the remaining cases showed a score of 3 (n=9, 8.7%), 4 (n=8, 7.8%) or 5 (n=11, 10.7%) (Table 1). All HL cases showed a nuclear FKBP51 score ≥1 in the background lymphocytes; the expression was strongest in the lymphocytes adjacent to H/RS cells and showed at least moderate intensity in most cases, with a score of 4 (n=14, 13.6%) or 5 (n=31, 30.1%); the remaining cases showed scores 1 (n=21, 20.4%), 2 (n=12, 11.7%) or 3 (n=25, 24.3%) (Figure 1). The lymphocytes expressing FKBP51 appeared to be T-helper (CD4+ on immunohistochemistry) (Figure 2). There was a significant correlation between the expression of FKBP51 in H/RS cells and in the background lymphocytes (p=0.008) (Table 2). Supplementary Figure S1 shows single IHC performed on consecutive serial sections, in parallel with the double IHC, using the conventional DAB chromogen (brown). The expression of Bcl2 in H/RS cells was cytoplasmic (Figure 3) and showed the following distribution of scores: 0, (complete negativity) in 49 cases (47.6%); score 1, in 10 cases (9.7%); score 2, in 11 cases (10.7%); score 3, in 14 cases (13.6%); score 4, in 15 cases (14.6%); and score 5, in 4 cases (3.9%). The expression of Bcl2 in the background lymphocytes showed scores 2 (n=2, 1.9%), 3 (n=38, 36.9%), 4 (n=26, 25.2%) or 5 (n=35, 34%). No correlation was found between H/RS Bcl2 expression and FKBP51 expression in either H/RS cells or in the background lymphocytes (Table 2).
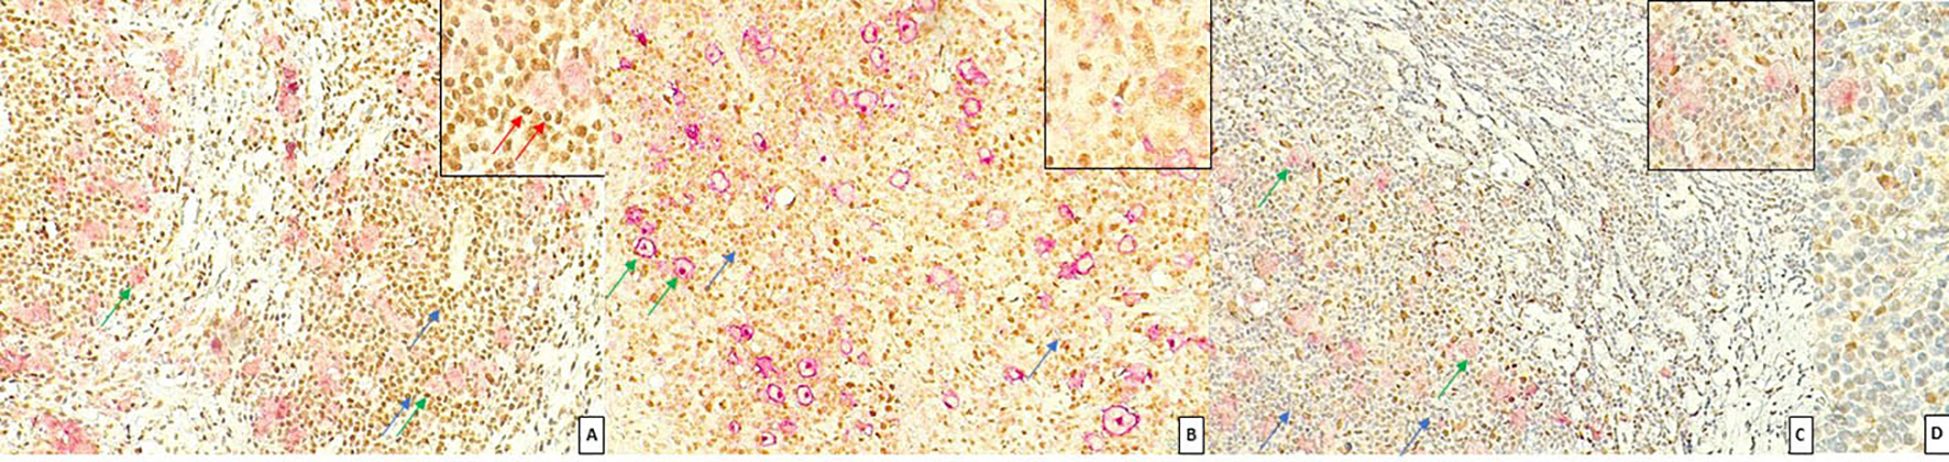
Figure 1. Expression of FKBP51 in Hodgkin lymphoma. (A) Double immunostaining for CD30 (red, green arrow) and FKBP51 (brown, blue arrow) (magnification 200X): FKBP51 negative in Hodgkin/Reed-Sternberg cells and strong (red arrow in inset) background lymphocytes in a poor prognosis HL case; (B) FKBP51 negative in Hodgkin/Reed-Sternberg cells and moderate in the background lymphocytes in a favorable prognosis HL case (magnification 200X). (C) FKBP51 negative in Hodgkin/Reed-Sternberg cells and weak in the background lymphocytes in a favorable prognosis HL case; (D) The blue color from hematoxylin staining indicates the cell nuclei negative for markers (magnification 400X).
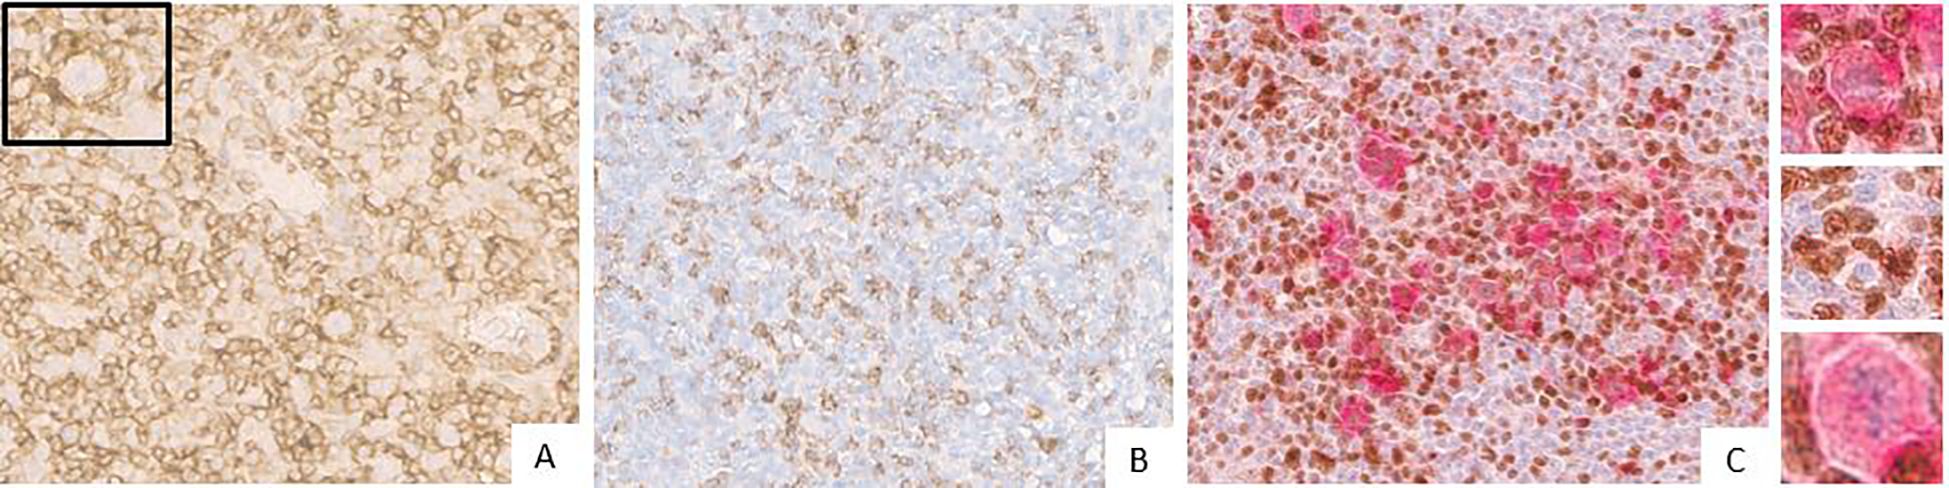
Figure 2. (A) Expression of CD4 (brown) in Hodgkin lymphoma (the inset displays Reed-Sternberg cell surrounded by a rosette of CD4 cells). The blue coloration reflects hematoxylin-stained nuclei in regions lacking marker expression. (B) Expression of CD 8 (brown) in Hodgkin lymphoma. The blue coloration reflects hematoxylin-stained nuclei in regions lacking marker expression. (C) Double immunostaining for CD30 (red) and FKBP51 (brown) in Reed–Sternberg cells. The insets show: (upper) a CD30-positive Reed–Sternberg cell surrounded by a rosette of CD4-positive lymphocytes; (intermediate) FKBP51-positive lymphocytes; and (lower) a CD30-positive H/RS cell. The blue coloration reflects hematoxylin-stained nuclei in regions lacking marker expression.
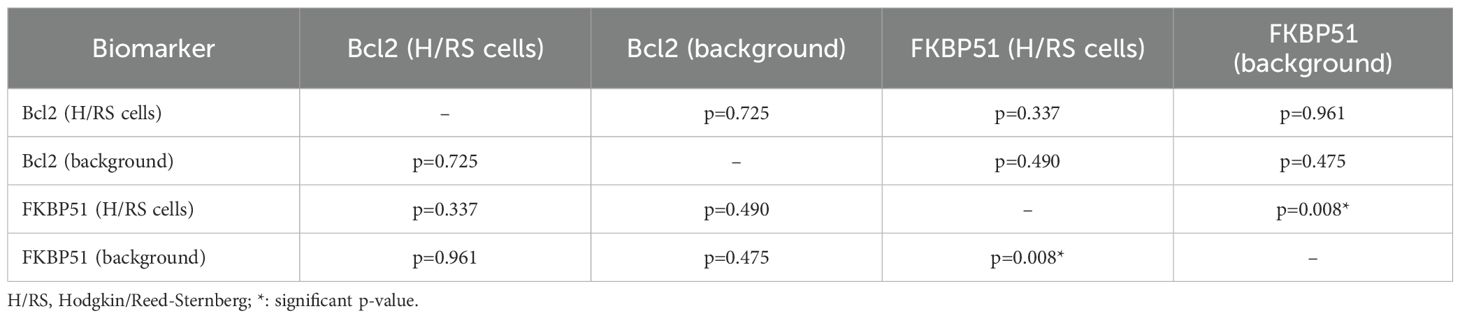
Table 2. Correlation between immunohistochemical markers.
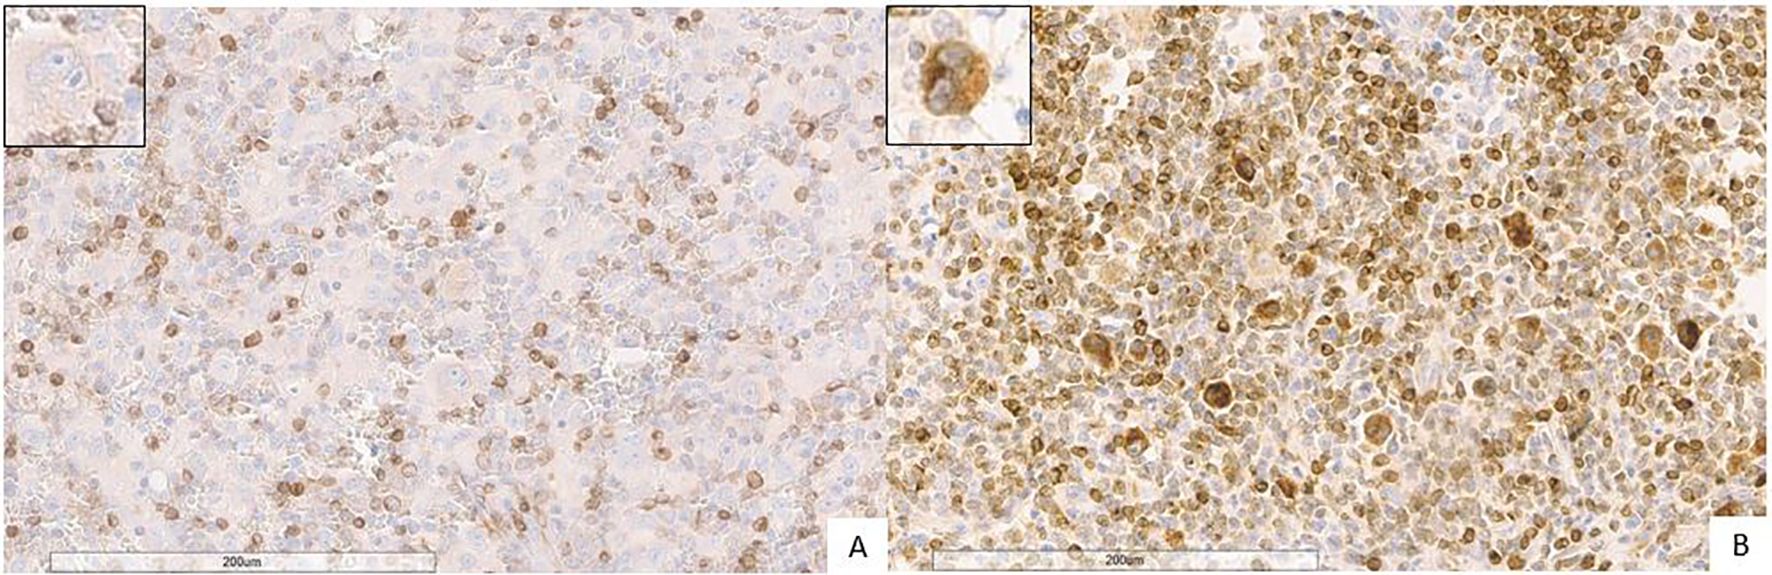
Figure 3. Expression of Bcl2 (brown) in Hodgkin lymphoma (magnification 20X). (A) Negative Bcl2 expression in Hodgkin/Reed-Sternberg cells. The blue coloration reflects hematoxylin-stained nuclei in regions lacking marker expression. (B) Strong Bcl2 expression in Hodgkin/Reed-Sternberg cells (the inset displays Hodgkin/Reed-Sternberg cell). The blue coloration reflects hematoxylin-stained nuclei in regions lacking marker expression.
3.3 Prognostic analysis reveals FKBP51 expression in the TME as an unfavorable factor for HL
A previous study identified Bcl-2 as a prognostic marker in Hodgkin lymphoma (HL) (22). In this study, we confirm that Bcl-2 expression in H/RS cells is associated with an unfavorable clinical outcome, with a p-value of 0.042 (Table 3). Furthermore, we have identified FKBP51 expression in the background lymphocytes as an additional prognostic marker, which shows a statistically significant p-value of 0.008 (Table 3). This significance was maintained in multivariate analysis for both Bcl-2 (p=0.035) and FKBP51 (p=0.008) (Table 3). In contrast, FKBP51 expression in H/RS cells and Bcl-2 in H/RS cells did not correlate with clinical outcomes, showing a p-value of 0.595 and 0.966, respectively (Table 3). Supplementary information, Supplementary Figure S2 shows Kaplan–Meier survival curves based on H/RS Bcl-2 and background FKBP51 expression.
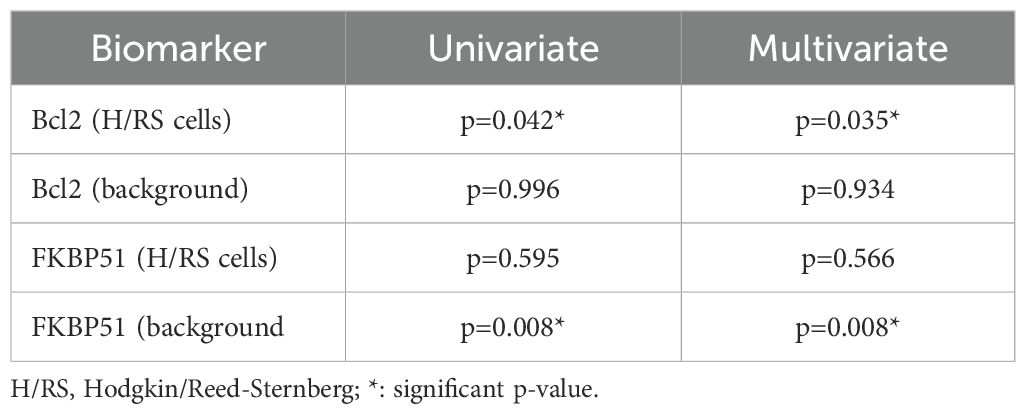
Table 3. Association between immunohistochemical markers and unfavorable outcome (refractoriness/relapse).
3.4 Immunohistochemical characterization of inflammatory infiltrate
The inflammatory infiltrate in classical Hodgkin lymphoma is composed mainly of T cells (especially CD4 helper T cells, but also some CD8 cytotoxic T cells) and macrophages (23, 24). Additional components of the inflammatory infiltrate, which typically make up less than 5% each of the total cellular infiltrate, can include eosinophils, neutrophils, plasma cells, dendritic cells, mast cells, and fibroblasts. Though less abundant than T-cells, tumor-infiltrating macrophages play a pivotal role in supporting HRS survival. They are strongly associated with shortened survival in patients with classic Hodgkin’s lymphoma (25). We performed immunohistochemical examination of CD4, CD8, CD68, and CD163 subpopulations in tumor sections. Our finding confirms that the CD4+ T-cell component is significantly predominant among the inflammatory cells (Figure 4A). Figure 4A shows a graphical representation of the density of inflammatory cells across tumor stages, according to the Ann Arbor classification. CD4 T cells consistently represent the most abundant immune subset, with significantly higher counts than other populations (see Table 4), except in stage III, where the difference between CD4 and CD163 cell counts is not statistically significant. When comparing the densities of individual immune cell subpopulations across tumor stages, a progressive increase in CD8 cell numbers is observed with advancing stage (Figure 4B). This pattern suggests that CD8 T cells may be functionally ineffective. This hypothesis is consistent with the parallel increase in M2-like macrophages (i.e., CD163) (Figure 4B), which are likely to exert an inhibitory effect on CD8 cytotoxic activity, as we have previously demonstrated (26).
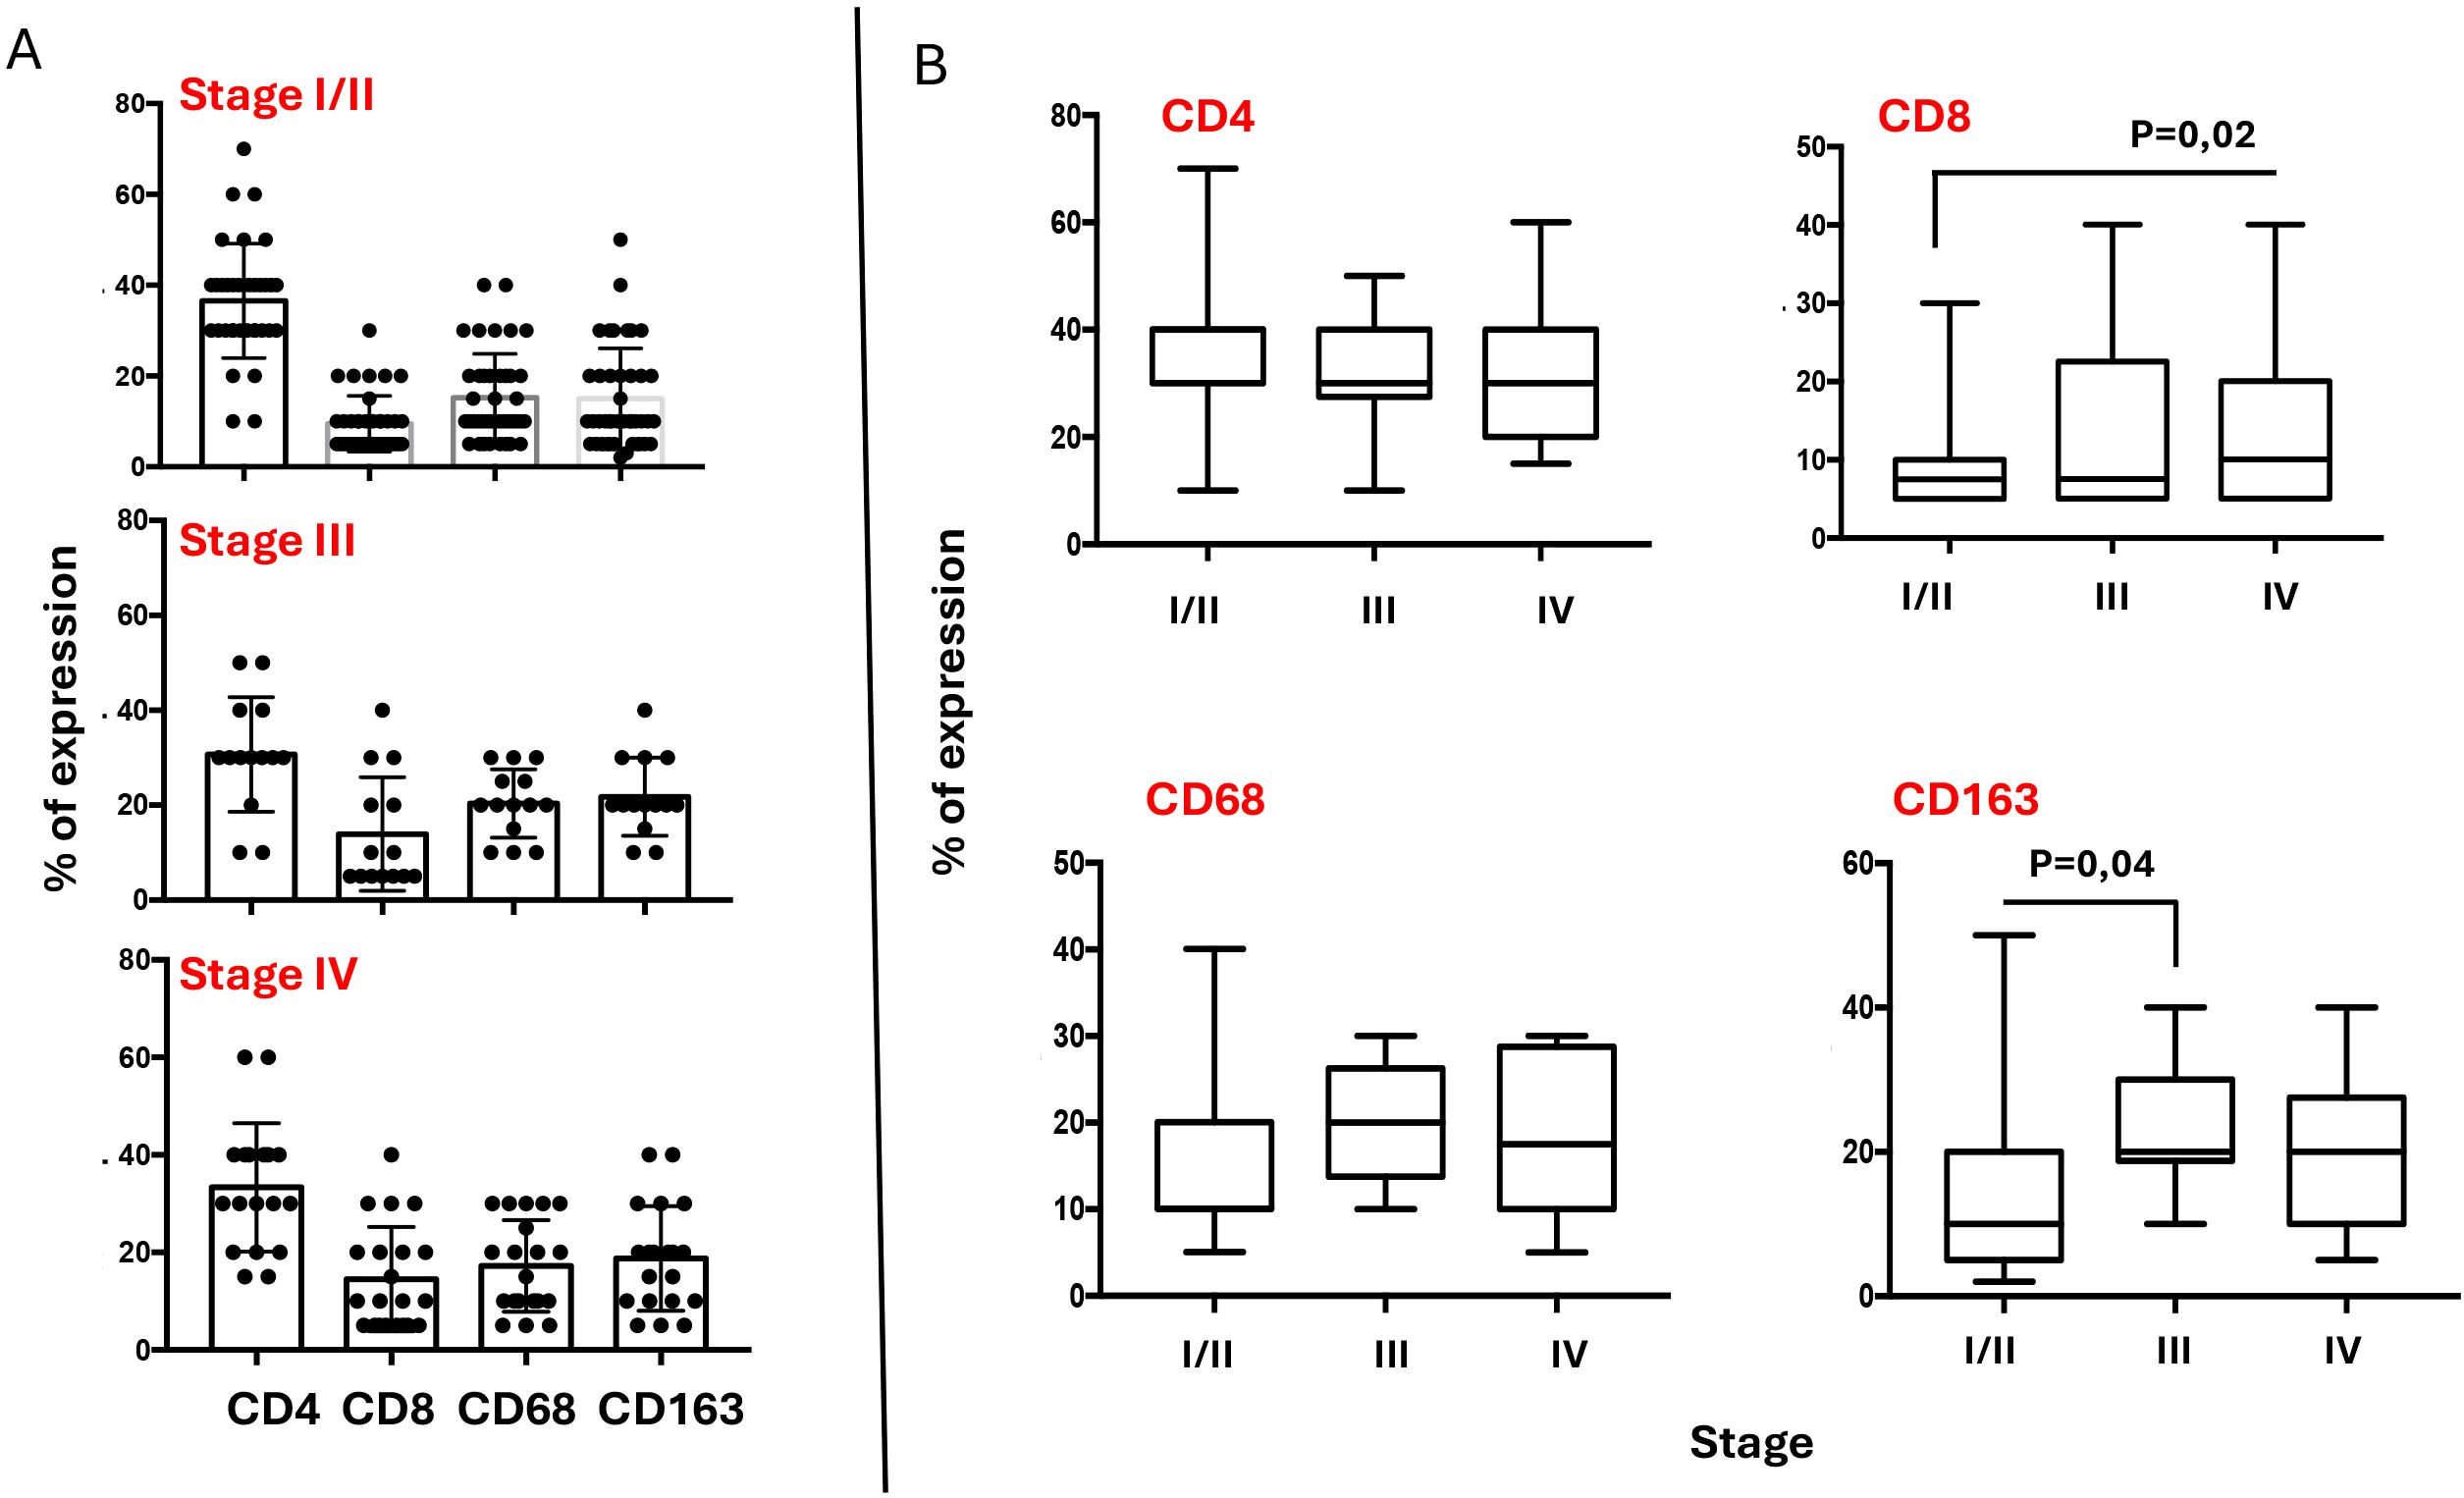
Figure 4. Composition of Inflammatory infiltrate across Ann Arbor stages. (A) Graphic representation of CD4, CD8, CD68 and CD163 densities in TME of HL lymph nodes, according to the stage. The percentage of each cellular component was quantified relative to the total lymph node cellularity, including both neoplastic cells and non-neoplastic cells. Some cell types may coexpress multiple lineage markers at varying levels. For statistical analysis see Table 4. (B) Variations of each immune cell subsets across the stages.
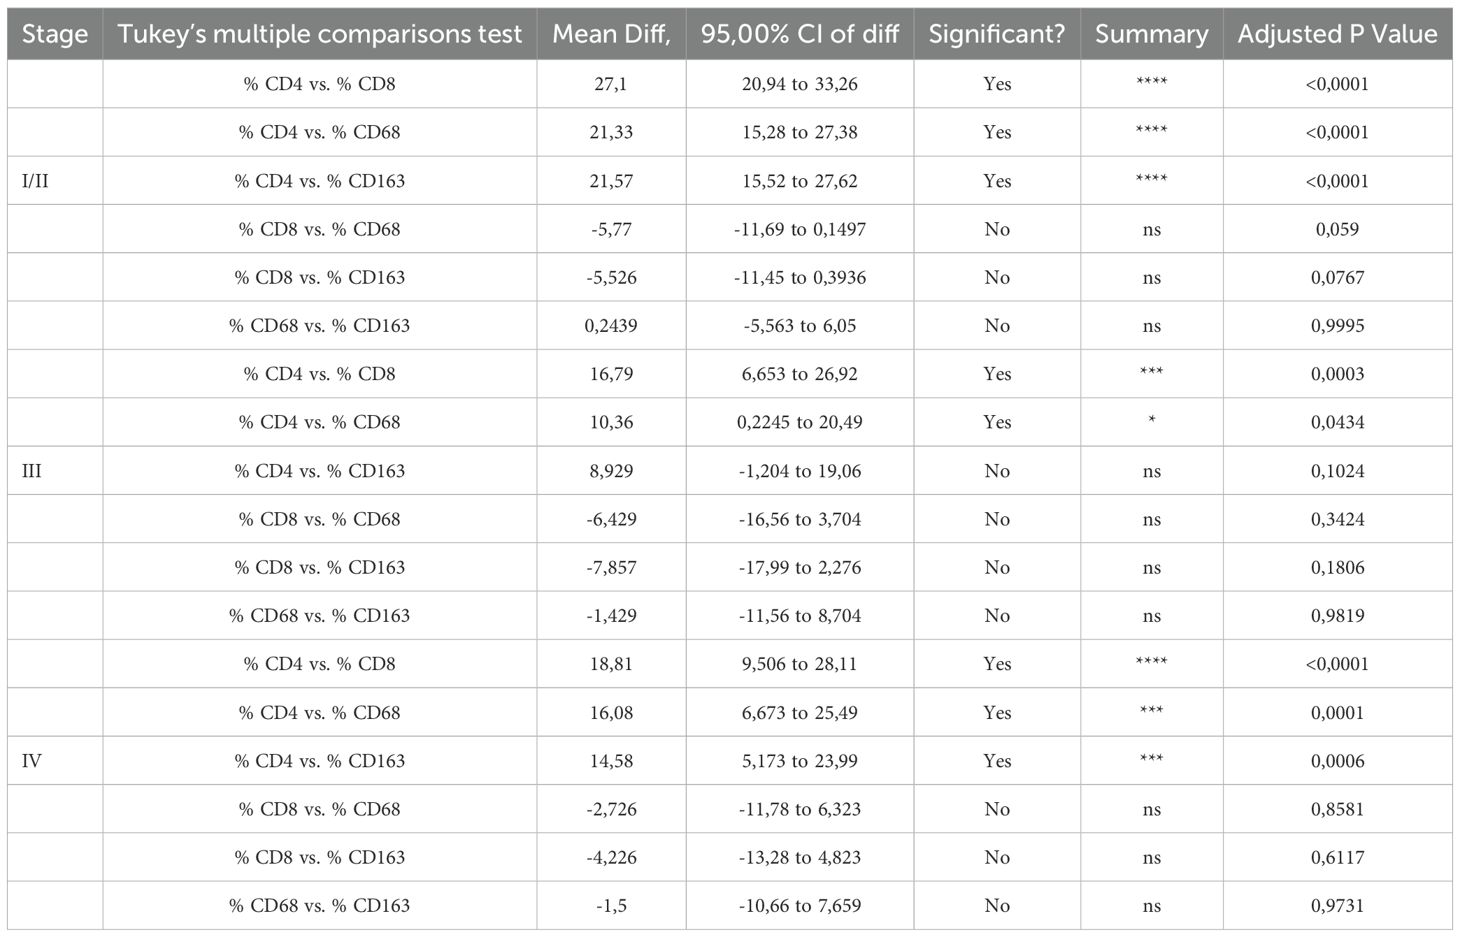
Table 4. Differences in subpopulation densities in inflammatory infiltrate according to Ann Arbor stage.
3.5 Stage-specific prognostic significance of TME subsets and FKBP51 expression in HL
To assess the prognostic value of each inflammatory subset within the TME, we grouped stages I, II, and III together and analyzed them separately from stage IV cases. Unfortunately, due to scarce prognostic information for stage I and II patients, we were unable to evaluate these stages separated from those of stage III. Our results indicate that only the macrophage subsets, specifically CD68 and CD163 cells, held prognostic value, being associated with poorer outcomes in stages I–III and not stage IV (Figure 5A). In contrast, CD4 T cells, despite being more abundant, did not impact prognosis (Figure 5A).
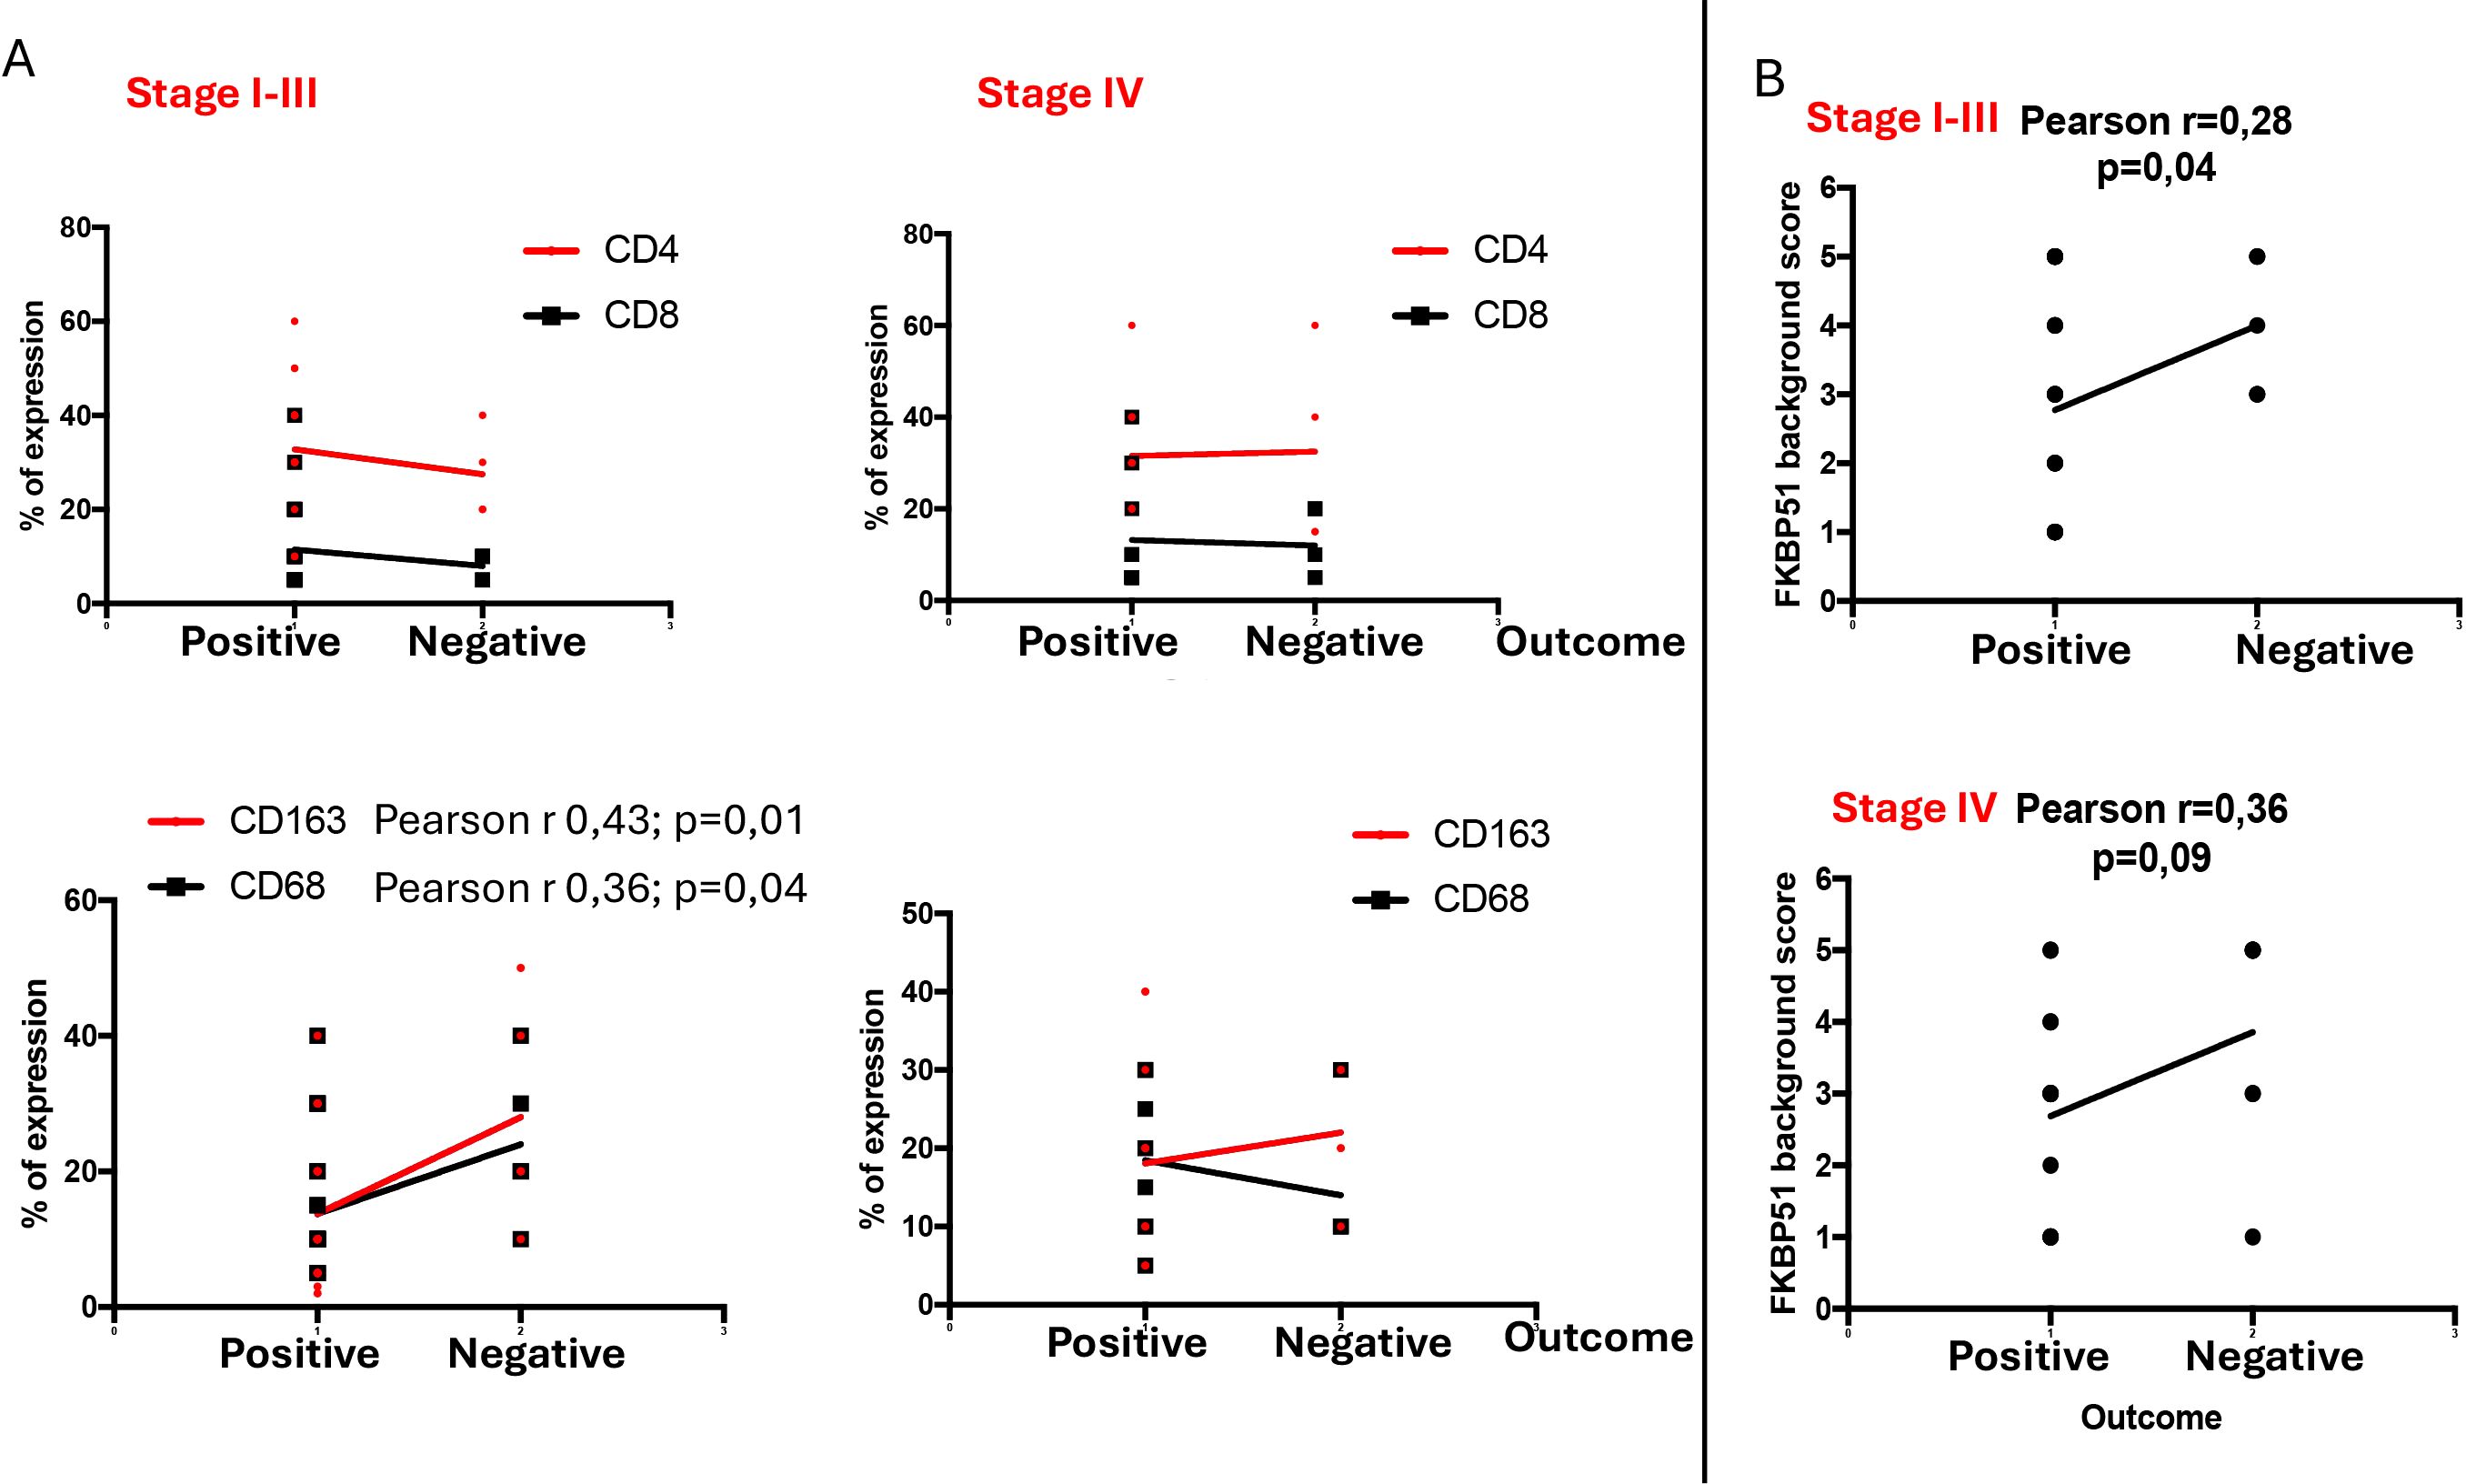
Figure 5. Stage-specific prognostic significance of TME subsets (A) and FKBP51 expression (B) in HL. Stages I, II, and III were grouped together and analyzed separately from stage IV. In stages I–III, CD68 and CD163 macrophages demonstrated prognostic relevance, along with FKBP51 expression.
Using the same stage grouping, we analyzed the prognostic value of FKBP51 expression and found that FKBP51 retains its prognostic significance in stages I–III, whereas this significance is lost in stage IV disease (Figure 5B).
Double immunohistochemical staining has been performed, respectively, for CD4/FKBP51 (Figures 6A, B), CD8/FKBP51 (Figures 6C, D), CD68/FKBP51 (Figures 6E, F), and CD163/FKBP51 (Figures 6G, H), with red staining for FKBP51 and brown staining for the other. As we observed, all the T-helper lymphocytes co-express red staining for FKBP51 and brown staining for CD4, resulting in a merged color that we can identify as a bronze color (Figures 6A, B). This overlapping can be noted in all the fields, with the same intensity. Otherwise, T-cytotoxic lymphocytes express only brown staining for CD8, underlining the differences from T-helper lymphocytes (Figures 6C, D). In fact, in this case, we can see both the colors identifying the two different lymphocytic populations. We also noticed that the CD68 histiocytes closer to the HRS cells express more FKBP51(resulting in a merged staining bronze color) than histiocytes far from HRS cells that appear stained only brown for CD68 (Figures 6E, F). CD163 histiocytes are, in the majority of cases, negative for FKBP51, expressing only the brown staining for CD163 (Figures 6G, H). Supplementary Figure S3 shows single IHC performed on consecutive serial sections, in parallel with the double IHC, using the conventional DAB chromogen (brown). At the highest magnification, T-helper lymphocytes forming rosettes with HRS cells are strongly reactive for FKBP51 (Figure 7).
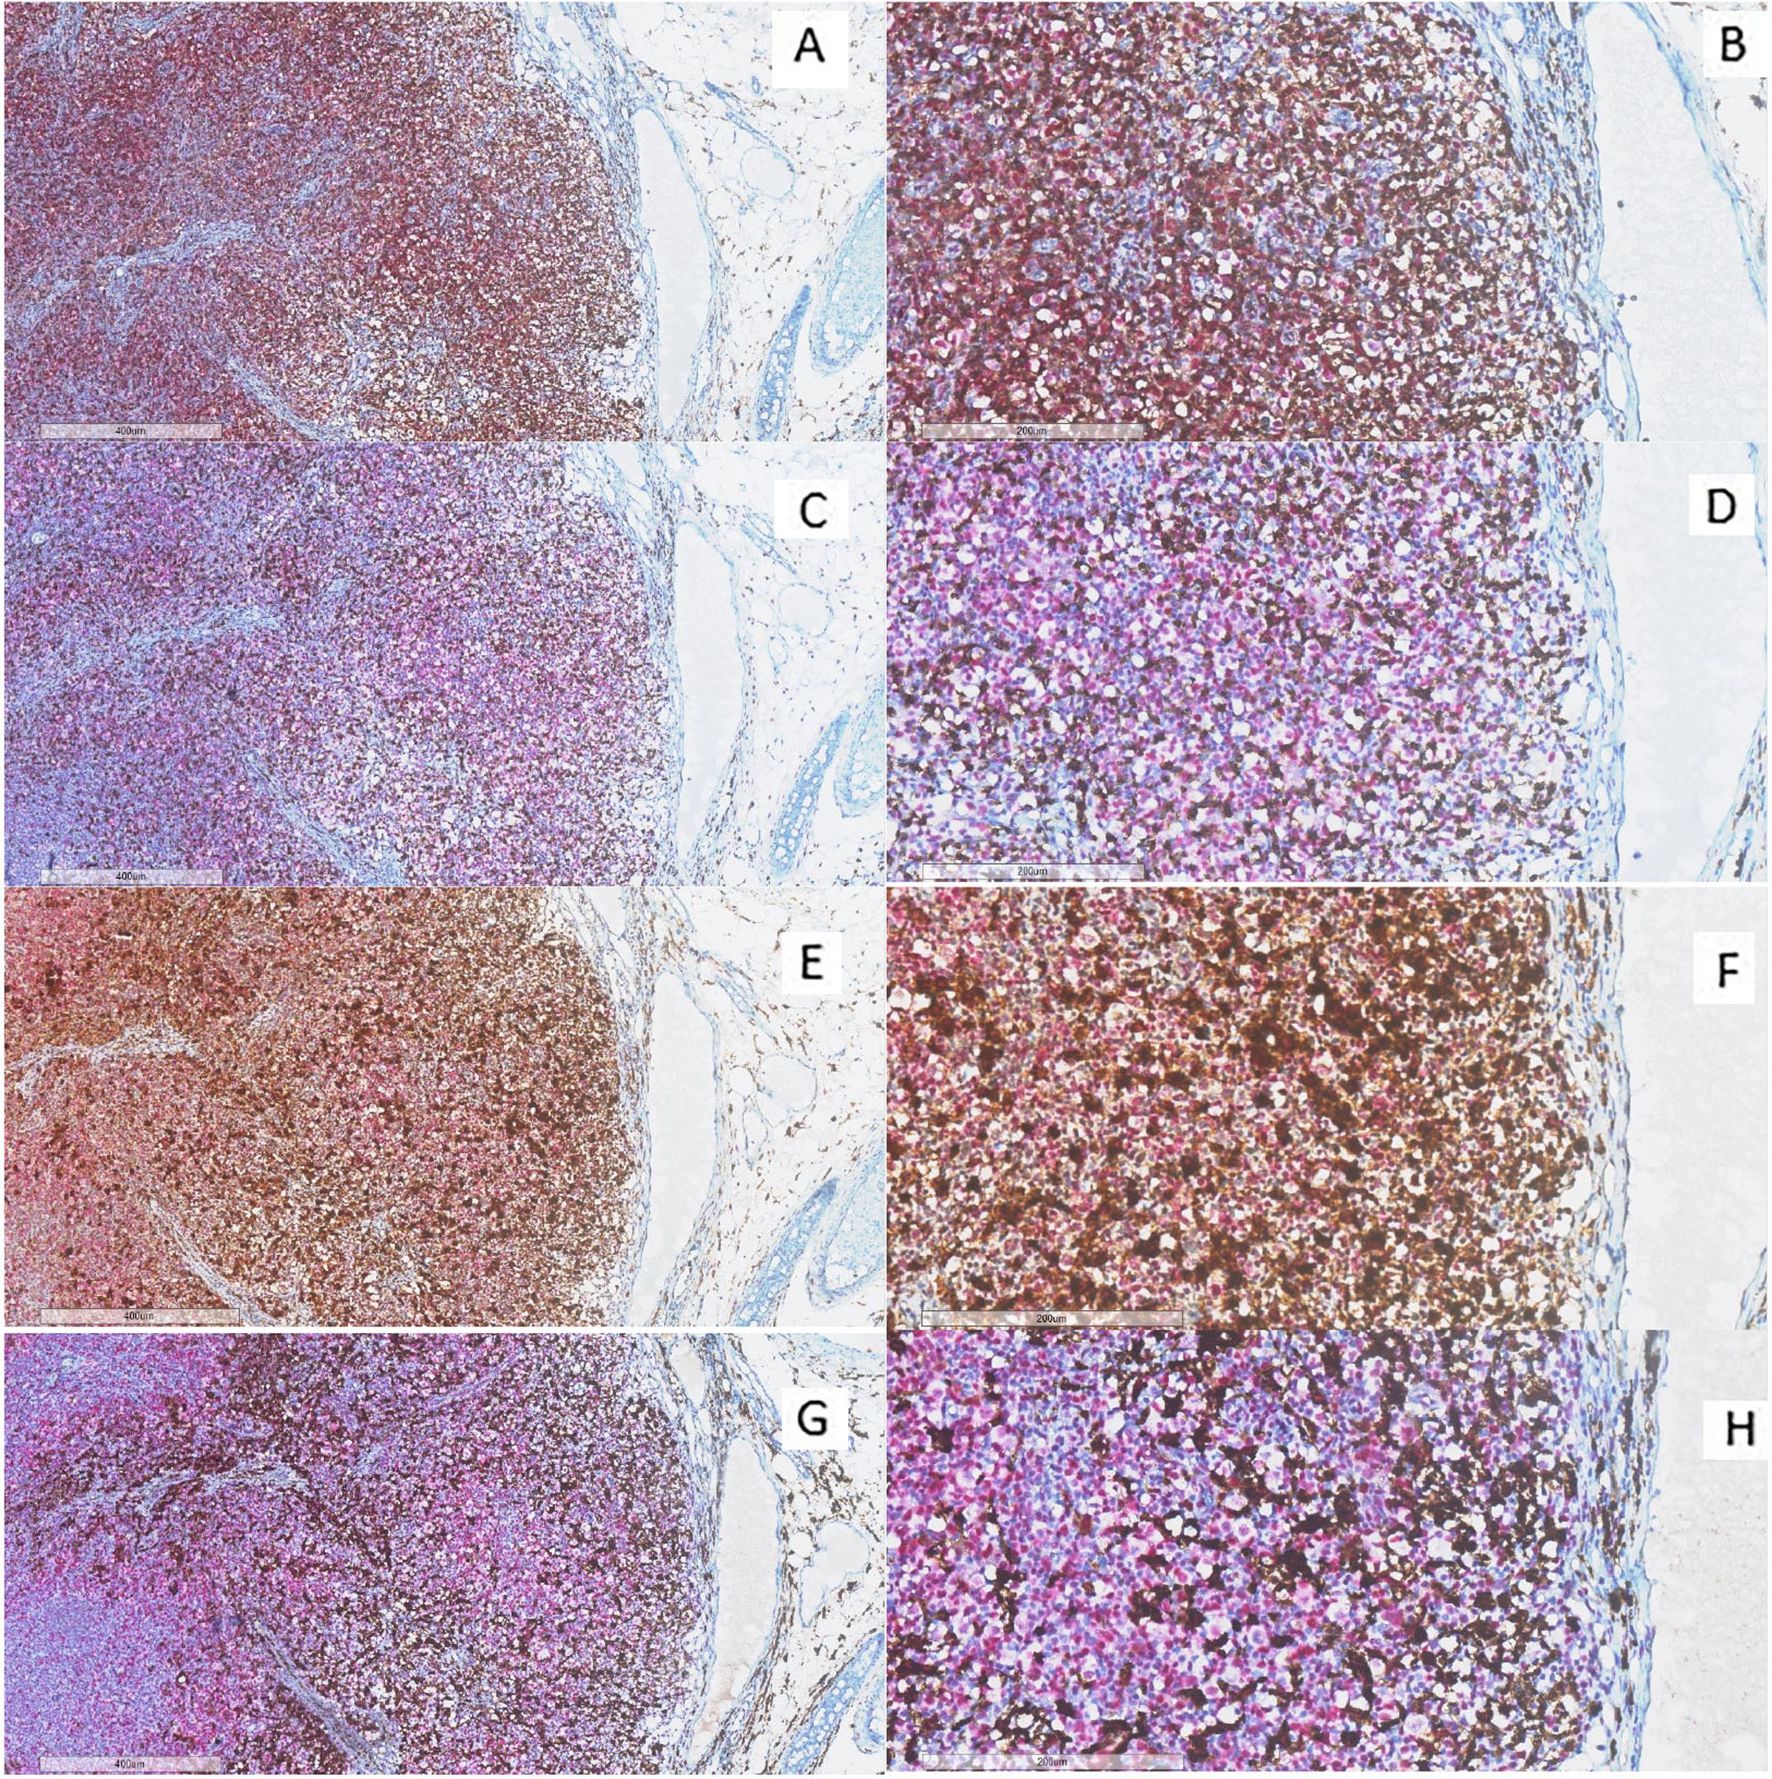
Figure 6. Immunohistochemical analysis of immune infiltrate. (A, B) A diffuse co-expression of CD4 and FKBP51 was observed in T-helper lymphocytes, resulting in a merged color (double staining for CD4, brown; and FKBP51, red; (A) original magnification, x6; (B) original magnification, x20). (C, D) A merged staining for CD8 and FKBP51 was seen in a minority of T-cytotoxic lymphocytes, with many of these cells being negative for FKBP51 (double staining for CD8, brown; and FKBP51, red; (C) original magnification, x6; (D) original magnification, x20). (E, F) a merged staining for CD68 and FKBP51 was observed in a minority of histiocytes, a large part of these cells is negative for FKBP51 (double staining for CD68, brown; and FKBP51, red; (C) original magnification, x6; (D) original magnification, x20). (G, H) A merged staining for CD163 and FKBP51 was noted in a minority of histiocytes, in which a large portion of the cells were negative for FKBP51 (double staining for CD163, brown; and FKBP51, red; (G) original magnification, x6; (H) original magnification, x20).
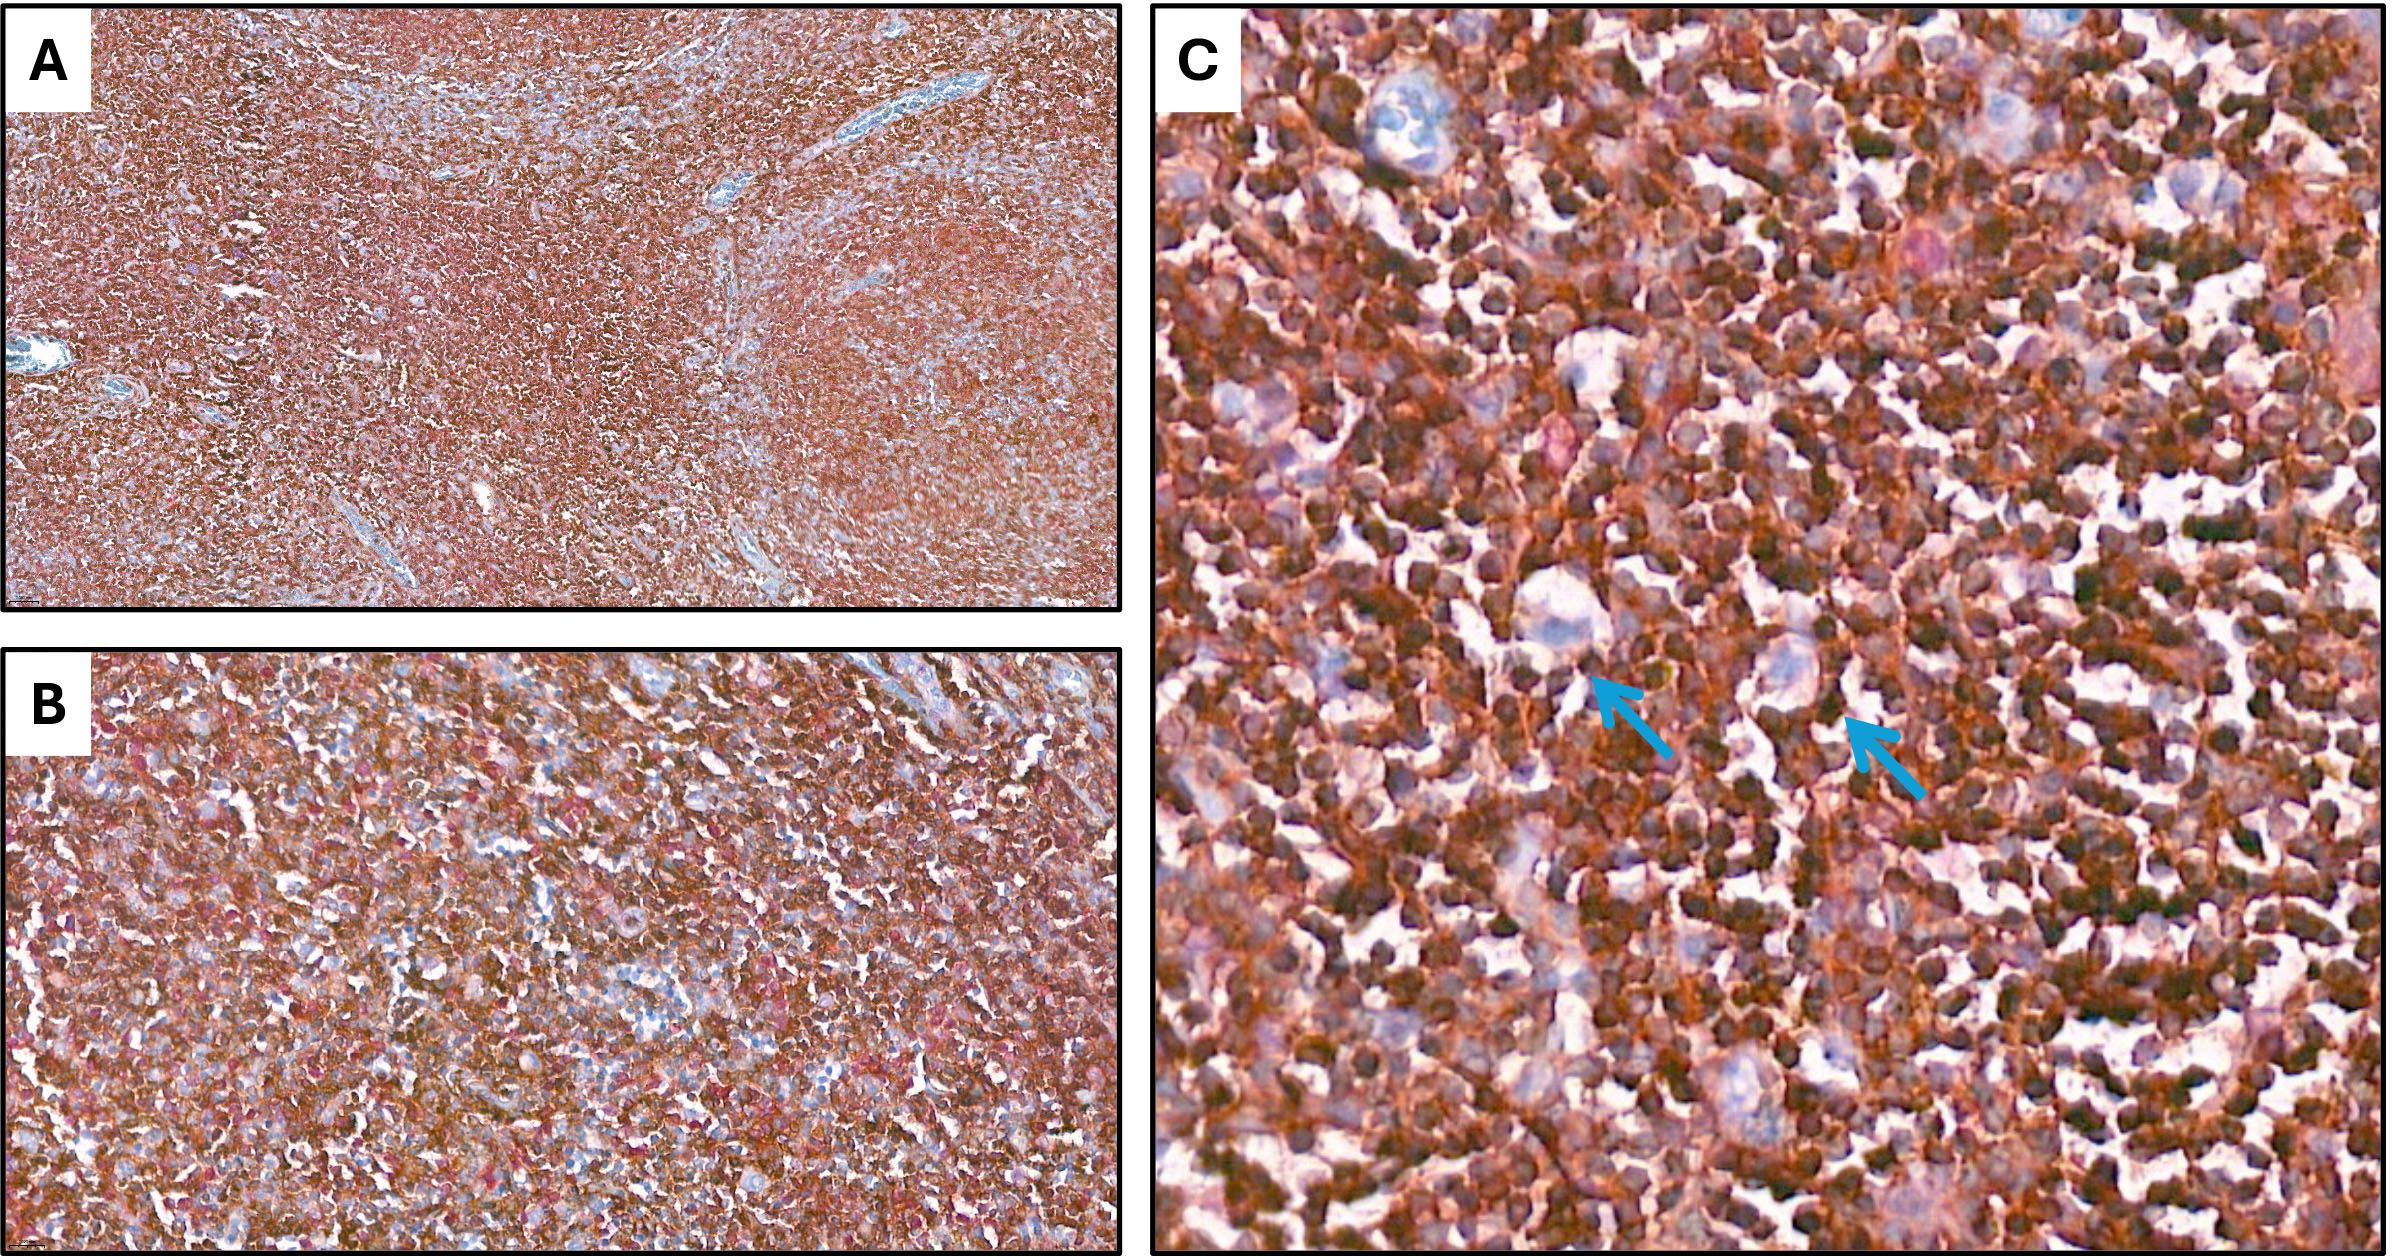
Figure 7. Co-expression of CD4 and FKBP51 (A–C) Double immunohistochemical staining demonstrates co-expression of CD4 (brown) and FKBP51 (red) in many T-helper lymphocytes, resulting in an overlapping color. The blue coloration reflects hematoxylin-stained nuclei in regions lacking marker expression. Notably, at the highest magnification, T-helper lymphocytes forming rosettes with HRS cells are diffusely and strongly reactive for FKBP51 (double staining for CD4 and FKBP51; (A) original magnification, x10; (B) original magnification, x40; (C) original magnification, x63; blue arrows highlighted the T-lymphocytes rosettes).
This finding shows that it was CD4 T cells and not the macrophages, despite their prognostic value, that exhibit the strongest FKBP51 expression. A correlation analysis between the counts of TME subsets and FKBP51 background score revealed a linear relationship between CD4 cell density and FKBP51 expression (Figure 8A). Notably, in HL, immune cells exhibit varied spatial distributions within the TME, interstitial, nodular, or diffuse. Among these, CD4+ T cells uniquely form a characteristic rosette-like arrangement around tumor cells. The rosette pattern was evaluated using a histological scoring system (high vs. low), supported by image analysis to quantify both rosette density and extent. A high rosette score was significantly associated with increased FKBP51 expression (Figure 8B) as well as with poorer patient prognosis (Figure 8C), suggesting that the spatial architecture of the immune infiltrate may hold prognostic relevance in Hodgkin lymphoma.
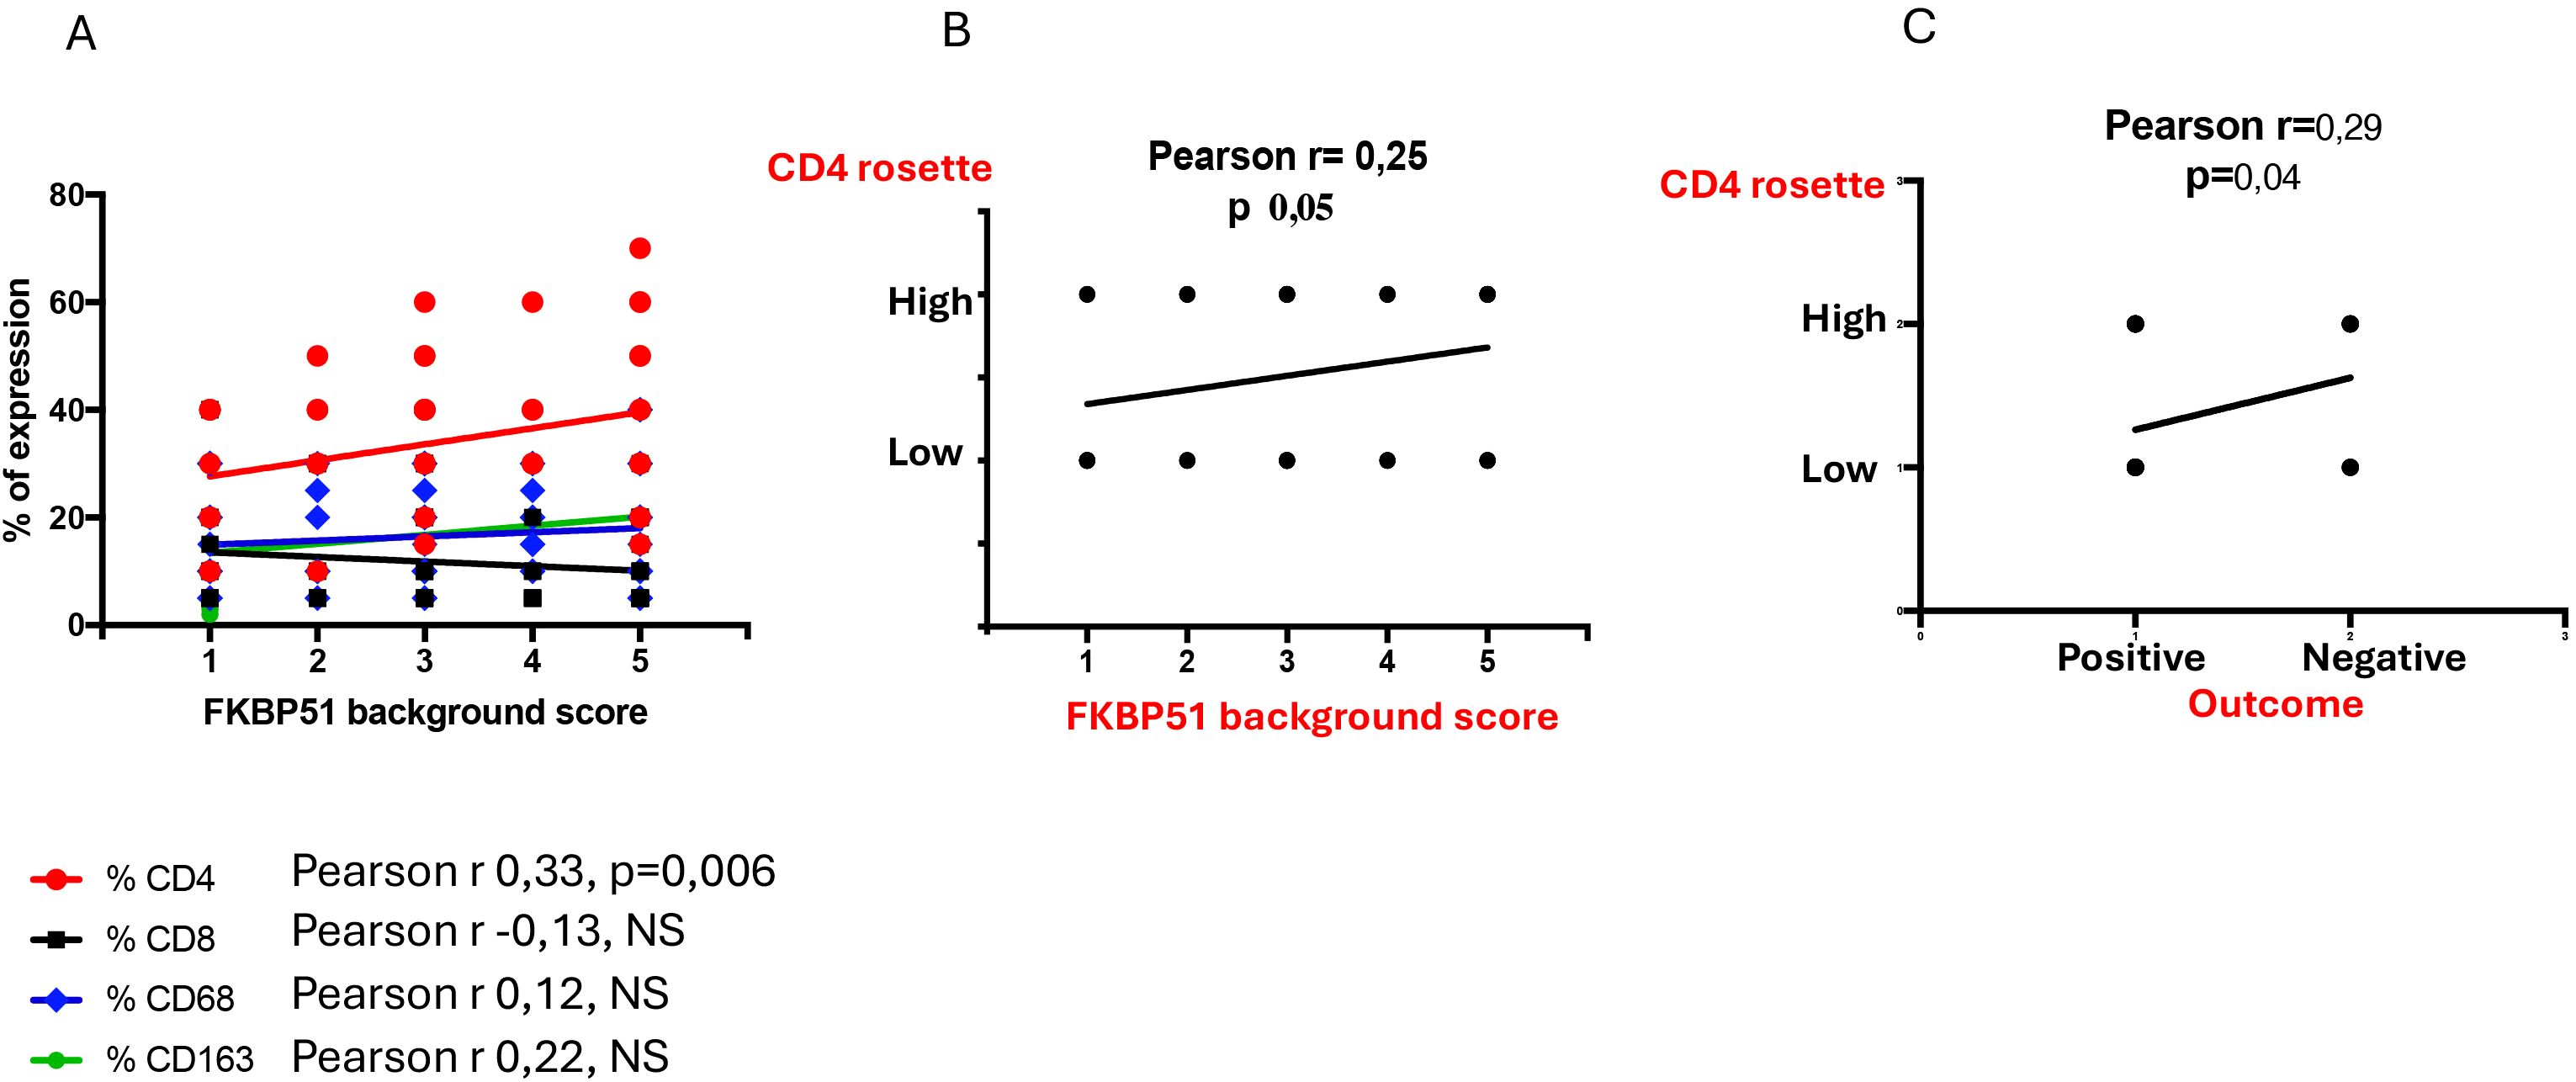
Figure 8. (A) Correlation analysis between the counts of TME subsets and FKBP51 background score: a linear relationship subsists between CD4 cell density and FKBP51 score. A high rosette score is significantly associated with increased FKBP51 expression (B) as well as with poorer patient prognosis (C).
3.6 Gene expression profiles of tumor biopsies reveal an FKBP51 association with proliferative and anti-apoptosis markers
H/RS cells typically make up only a minority (<1–2%) of the tumor mass. Their specific gene expression is underrepresented in bulk RNA (27). With the aim to gain more insights into the characteristics of the TME, we thought to analyze the transcript levels of FKBP5 alongside various genes related to proliferation and apoptosis in RNA extracted from tumor biopsies. PCNA, BCL2, TRAF2, XIAP and FKBP5 expression levels in whole RNAs extracted by 36 tumor tissue samples were quantified as relative expression, using expression from healthy donor PBMCs as a reference sample (=1). Although, with high variability, most transcript levels were quantifiable in tumor tissue samples. Figure 9 shows a correlative analysis of gene expression. FKBP51 was associated with TRAF2, an essential element in the activation of NF-κB signaling pathway (28), and with XIAP and PCNA, suggesting an active NF-κB/anti-apoptosis/proliferative axis in the TME (Figure 9). Consistent with IHC results, no correlation was found between FKBP51 and Bcl2. The lack of correlation between BCL2 and TRAF2 suggests that Bcl-2 is not activated by the canonical NF-κB pathway (see Supplementary Figure S4). This aligns with previous studies that have shown the dependence of Bcl-2 on non-canonical NF-κB pathway (29, 30). Furthermore, the significant correlation found between TRAF2 and XIAP indicates that the canonical NF-κB pathway concurs in the anti-apoptotic mechanisms of CD4 T lymphocytes (Supplementary information, Supplementary Figure S4). Analyzing the expression levels of FKBP51, TRAF2, Bcl-2, XIAP, and PCNA transcripts in relation to the Ann Arbor stage, we observed that TRAF2 positively correlated with stage (Supplementary information, Supplementary Figure S5).
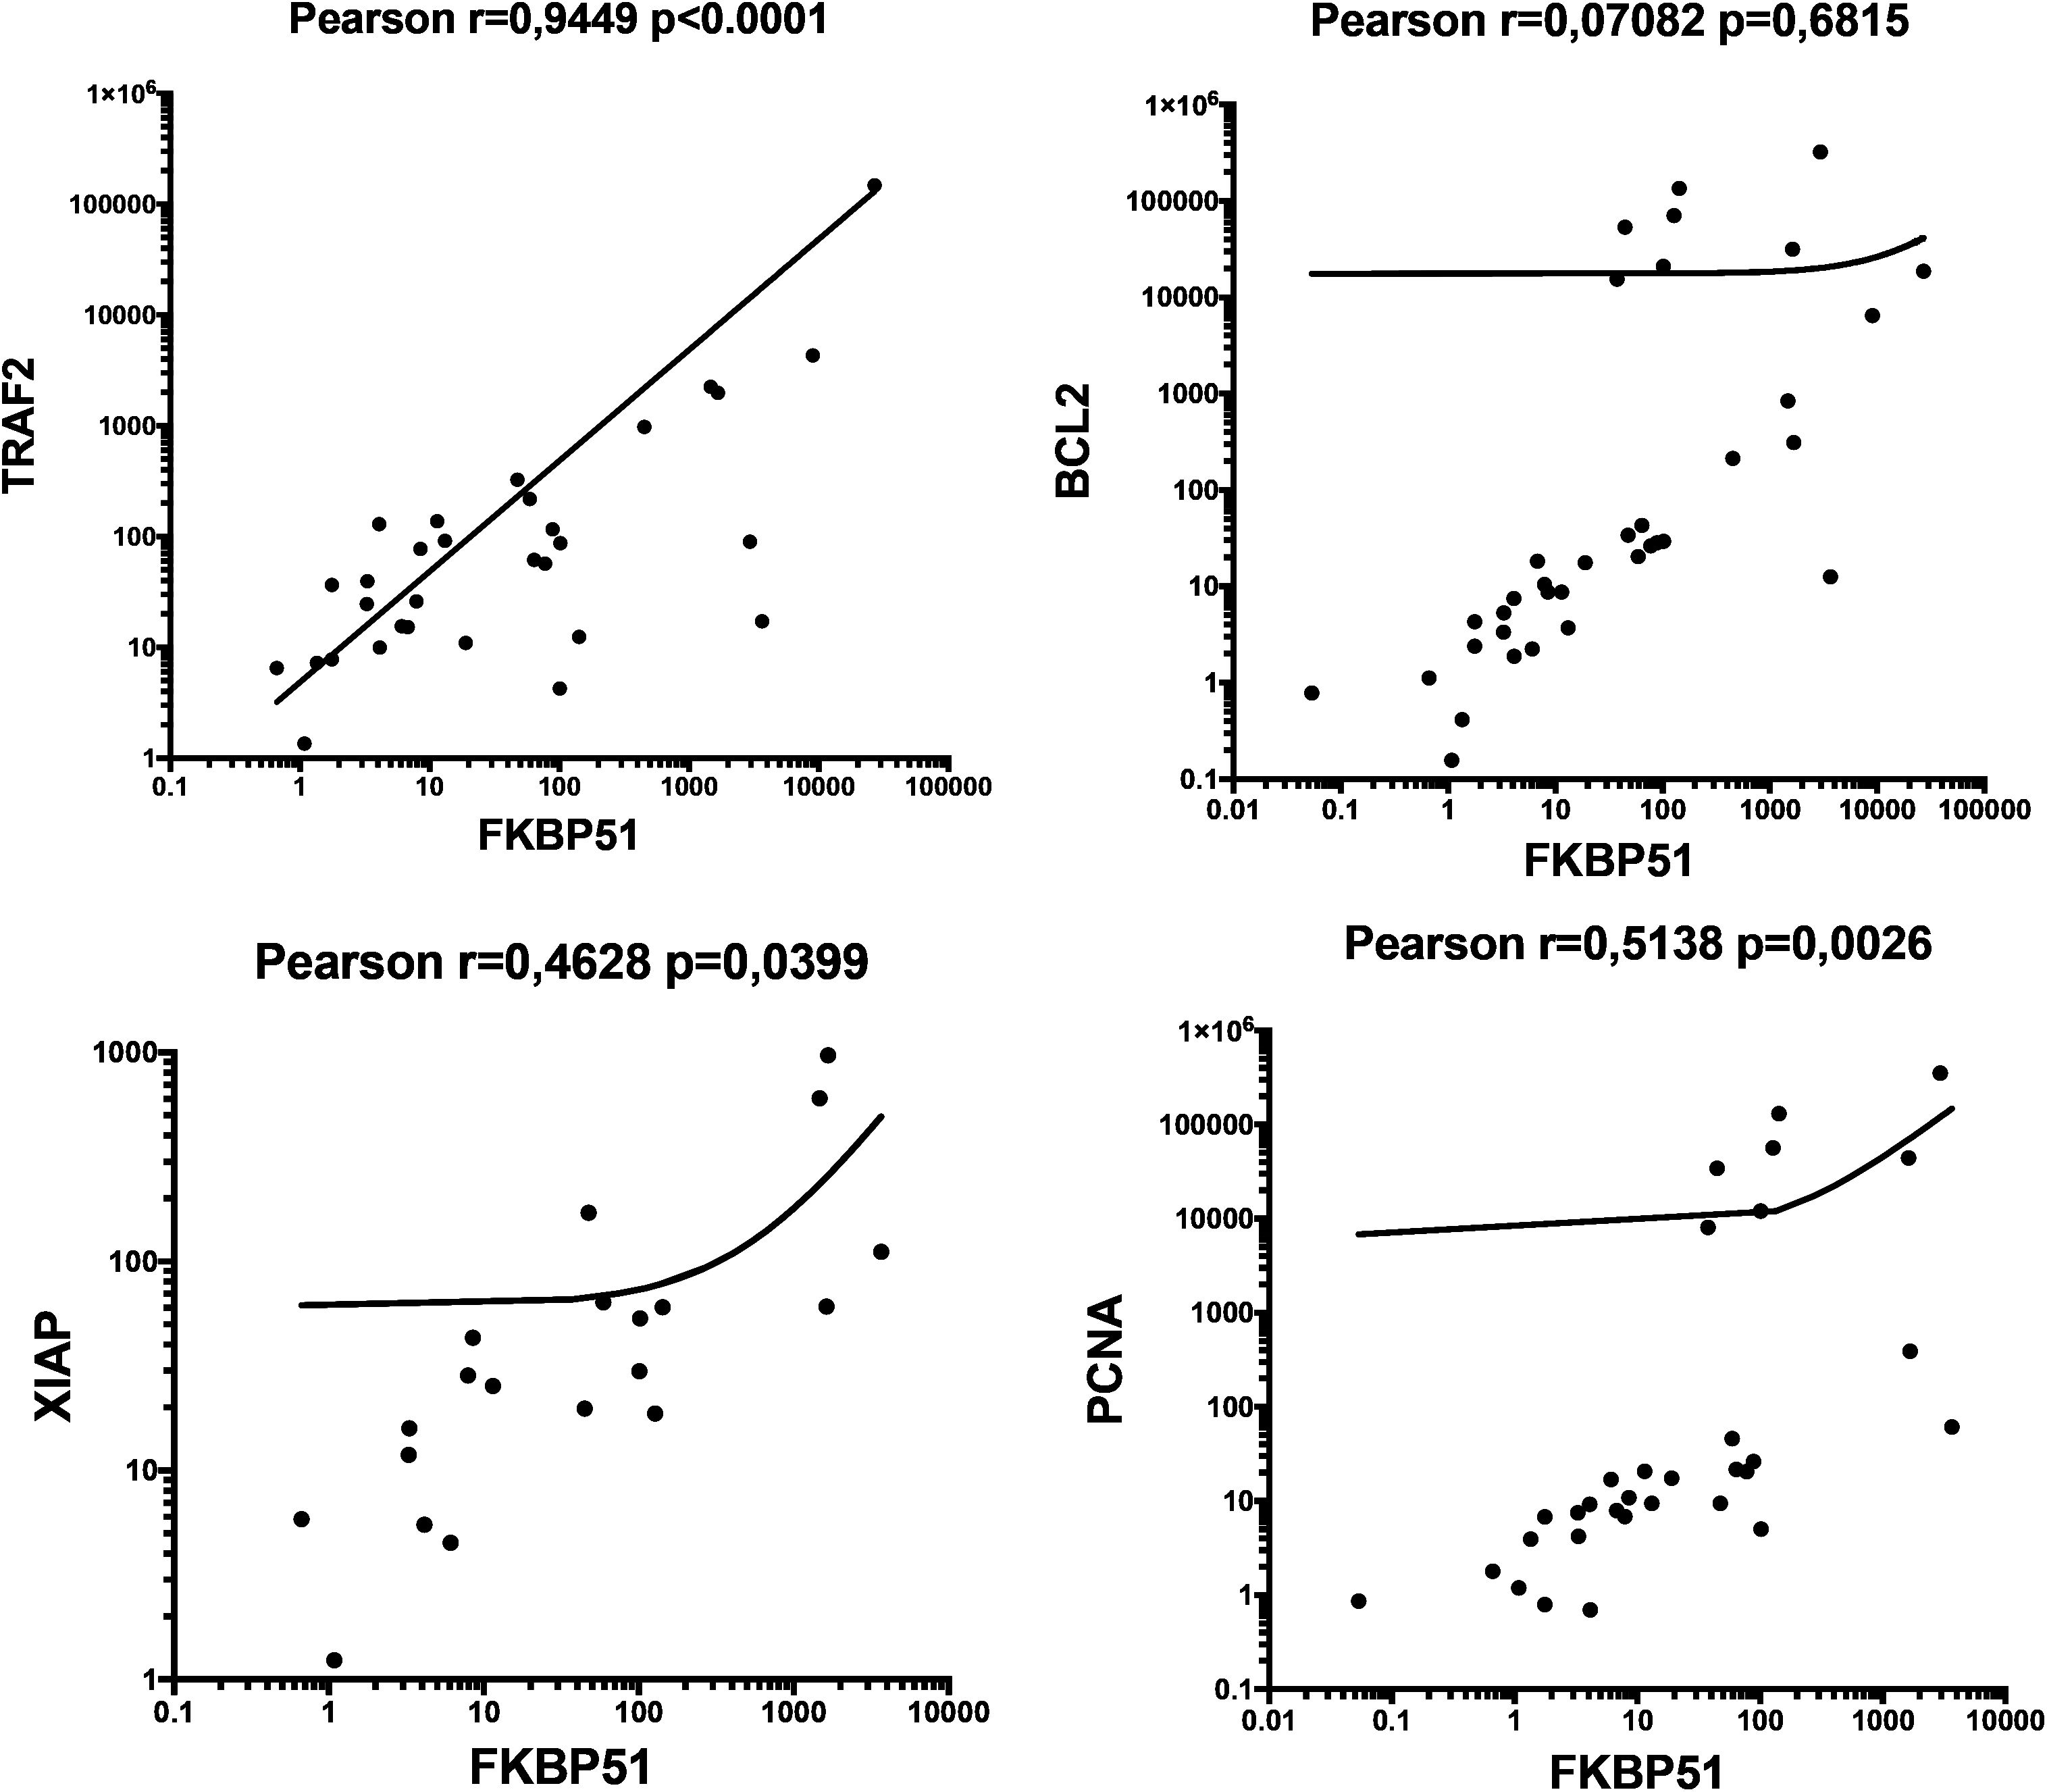
Figure 9. Scatterplots of Pearson’s correlations between FKBP5 and TRAF2, BCL2, XIAP and PCNA, gene transcripts, measured by qPCR. The total numbers of cases analyzed were as follows: 36, for FKBP5 and BCL2; 31, for TRAF2; 20 for XIAP; 32, for PCNA.
4 Discussion
Hodgkin lymphoma is a unique lymphoid malignancy characterized by a minority of neoplastic H/RS cells surrounded by a predominant population of non-neoplastic immune cells. These tumor-associated lymphoid cells play a fundamental role in disease biology and have important prognostic implications.
One of the key findings of our study is that FKBP51 expression in tumor-infiltrating lymphocytes acts as an independent adverse prognostic marker in HL. While FKBP51 was also detected in H/RS cells, predominantly within the nucleus, its expression in tumor cells was not associated with clinical outcome. In contrast, FKBP51 expression in the surrounding lymphoid background correlated significantly with poorer prognosis and remained significant in multivariate analysis. These data point to a functional role of the TME, rather than the tumor cells alone, in disease progression. The differential expression pattern of FKBP51 may reflect distinct NF-κB regulatory mechanisms. In H/RS cells, recurrent inactivating mutations in NFKBIA (31), which encodes the IκBα inhibitor, result in constitutive NF-κB activation that is thus disconnected from both positive and negative regulators (31).
Immunohistochemical characterization confirmed that CD4 T cells represent the predominant immune subset within the TME, followed by CD8 T cells and macrophages (CD68 and CD163). Despite their abundance, CD4 T cells did not display prognostic impact. Double immunostaining revealed that CD4 T cells are the main FKBP51-expressing population, with staining intensity correlating with their spatial proximity to H/RS cells. FKBP51 is known to enhance immune activity (15) via NF-κB (14) and Akt (32) signaling pathways, making its association with poor prognosis somewhat unexpected. Nonetheless, the strong FKBP51 immunoreactivity observed in CD4+ cells is indicative of an immunologically active phenotype, potentially engaged in sustained helper functions.
In contrast, CD8 T cells show relatively low FKBP51 expression and are less prominent, particularly in early-stage disease. Interestingly, their numbers increased in advanced stages, possibly reflecting a compensatory, yet ultimately ineffective, antitumor response. This functional inefficacy may be explained by the concurrent accumulation of tumor-associated macrophages. In previous work, we demonstrated that CD163 macrophages can profoundly inhibit CD8 T cell cytotoxicity in co-culture systems (26), reinforcing their role as potent immunosuppressive players within the HL microenvironment (25).
The paradox of highly immunoreactive CD4 T cells alongside hyporeactive CD8 T cells can be reconciled by considering the spatial architecture of the TME in HL lymph node. A key factor modulating immune interactions is the physical organization of immune subsets. CD4 T cells are frequently arranged in rosette-like structures tightly encircling H/RS cells, likely creating a protective niche that favors tumor survival (9, 11, 23, 33). In contrast, CD8 T cells are more diffusely distributed throughout the lymph node, as are TAMs, which virtually exert broader immunosuppressive effects that systemically limit CD8 effector function. This spatial dichotomy enables CD4 T cells to act as functional allies of the tumor, delivering trophic and immunomodulatory cues, while TAMs maintain a suppressive environment that hinders effective cytotoxic responses.
Gene expression profiling further indicated that FKBP51 is significantly associated with transcripts involved in proliferation (PCNA) and apoptosis resistance (TRAF2, XIAP), underscoring its potential role in promoting a protumor, NF-κB-dependent phenotype in support of H/RS cells. Notably, TRAF2 expression is the only transcript among those analyzed to correlate positively with disease stage, reinforcing its relevance in disease progression.
4.1 Limitations
While using bulk HL biopsies offers a more comprehensive understanding of gene expression compared to single-cell analysis, single-cell RNA sequencing could be used to better profile H/RS cells separately from the TME, potentially leading to more thorough conclusions. An even more effective approach is spatial transcriptomics that preserves tissue architecture while providing information about the physical interactions and proximity between cells. This technology should greatly aid future studies to enhance our understanding of how interactions between cancer cells, CD4 T cells, and other immune or stromal populations influence disease pathology.
The correlation of FKBP51 between lymphocytes and tumor cells is in line with the notion of a cell-cell connection. However, FKBP51 expression in H/RS cells is not linked to prognosis, leaving its role in H/RS cells unclear.
Further research is needed to explore all these aspects more thoroughly.
5 Conclusion
Our study highlights prognostic relevance of macrophages in early-stage disease, in accordance with previous study and FKBP51 as part of a proliferative and anti-apoptotic transcriptional network. Its expression pattern, particularly in the context of spatial architecture such as the rosette-like CD4 arrangement, could serve as a histopathological biomarker to improve risk stratification (34–36).
Data availability statement
The datasets presented in this study can be found in online repositories. The names of the repository/repositories and accession number(s) can be found in the article/Supplementary Material, and at the link below: https://github.com/repositoryromano/doi-10.3389-fimmu.2025.1604920.
Ethics statement
The studies involving humans were approved by Federico II University Ethics Committee. The studies were conducted in accordance with the local legislation and institutional requirements. The participants provided their written informed consent to participate in this study.
Author contributions
SV: Data curation, Formal Analysis, Investigation, Methodology, Validation, Visualization, Writing – original draft. SR: Data curation, Formal Analysis, Investigation, Methodology, Validation, Visualization, Writing – original draft. DR: Data curation, Investigation, Methodology, Validation, Visualization, Writing – original draft. AT: Data curation, Formal Analysis, Investigation, Methodology, Software, Validation, Visualization, Writing – original draft. RC: Investigation, Methodology, Visualization, Writing – original draft. MC: Investigation, Methodology, Visualization, Writing – original draft. GI: Investigation, Methodology, Visualization, Writing – original draft. LM: Investigation, Methodology, Validation, Visualization, Writing – original draft. FP: Conceptualization, Supervision, Visualization, Writing – original draft. MPi: Conceptualization, Supervision, Visualization, Writing – original draft. MPe: Investigation, Visualization, Writing – original draft. EV: Investigation, Methodology, Visualization, Writing – original draft. GA: Investigation, Methodology, Visualization, Writing – original draft. MR: Conceptualization, Data curation, Funding acquisition, Investigation, Supervision, Validation, Visualization, Writing – original draft, Writing – review & editing. MM: Conceptualization, Data curation, Formal Analysis, Investigation, Methodology, Validation, Visualization, Writing – original draft, Writing – review & editing.
Funding
The author(s) declare financial support was received for the research and/or publication of this article. Maria Fiammetta Romano received funds by National Center for Gene Therapy and Drugs based on RNA Technology MUR-CN3 CUP E63C22000940007.
Conflict of interest
The authors declare that the research was conducted in the absence of any commercial or financial relationships that could be construed as a potential conflict of interest.
The reviewer GF declared a shared affiliation with the authors SV, SR, DR, RC, MC, GI, LM, FP, MPi, MPe, EV, GA, MFR AND MM to the handling editor at the time of review.
Generative AI statement
The author(s) declare that Generative AI was used in the creation of this manuscript. To check the quality of language.
Any alternative text (alt text) provided alongside figures in this article has been generated by Frontiers with the support of artificial intelligence and reasonable efforts have been made to ensure accuracy, including review by the authors wherever possible. If you identify any issues, please contact us.
Publisher’s note
All claims expressed in this article are solely those of the authors and do not necessarily represent those of their affiliated organizations, or those of the publisher, the editors and the reviewers. Any product that may be evaluated in this article, or claim that may be made by its manufacturer, is not guaranteed or endorsed by the publisher.
Supplementary material
The Supplementary Material for this article can be found online at: https://www.frontiersin.org/articles/10.3389/fimmu.2025.1604920/full#supplementary-material
Supplementary Figure 1 | Immunohistochemical analysis of Reed Sternberg cell. (A) Double immunostaining for CD30 (red) and FKBP51 (brown) (magnification 20X). (B) Single immunostaining for CD30 (brown) (magnification 20X). (C) Single immunostaining for FKBP51 (brown) (magnification 20X).
Supplementary Figure 2 | Kaplan–Meier survival curves based on H/RS Bcl-2 and background FKBP51 expression. Patients were stratified according to immunohistochemical expression levels of Bcl-2 (left) and FKBP51 (right). Survival outcomes were compared using the Gehan–Breslow–Wilcoxon test.
Supplementary Figure 3 | Multiple 4-μm-thick serial sections were cut from a single formalin-fixed, paraffin-embedded tissue block. The first five serial sections were used for single immunostaining of the following markers: FKBP51 (BROWN), CD4 (BROWN), CD8 (BROWN), CD68 (BROWN), and CD163 (BROWN). The subsequent four sections (sixth to ninth) were employed for double immunostaining with the following combinations: CD4 (BROWN) and FKBP51 (RED); CD8 (BROWN) and FKBP51 (RED); CD68 (BROWN) and FKBP51 (RED); and CD163 (BROWN) and FKBP51 (RED). The resulting images have been assembled as follows: (A) Double immunostaining for CD4 (BROWN) and FKBP51 (RED); (B) Single immunostaining for CD4 (BROWN); (C) Single immunostaining for FKBP51 (BROWN); (D) Double immunostaining for CD8 (BROWN) and FKBP51 (RED); (E) Single immunostaining for CD8 (BROWN); (F) Double immunostaining for CD68 (BROWN) and FKBP51 (RED); (G) Single immunostaining for CD68 (BROWN); (H) Double immunostaining for CD163 (BROWN) and FKBP51 (RED); (I) Single immunostaining for CD163 (BROWN).
Supplementary Figure 4 | Scatterplots of Pearson’s correlations between TRAF2 and BCL2 or XIAP gene transcripts, measured by qPCR.
Supplementary Figure 5 | Linear correlation between TRAF2 transcript levels and stages according to Ann Arbor.
References
1. Swerdlow SH, Campo E, Pileri SA, Harris NL, Stein H, Siebert R, et al. The 2016 revision of the World Health Organization classification of lymphoid neoplasms. Blood. (2016) 127:2375–90. doi: 10.1182/blood-2016-01-643569
2. Bonadonna G, Zucali R, Monfardini S, De Lena M, and Uslenghi C. Combination chemotherapy of Hodgkin’s disease with adriamycin, bleomycin, vinblastine, and imidazole carboxamide versus MOPP. Cancer. (1975) 36:252–9. doi: 10.1002/1097-0142(197507)36:1<252::aid-cncr2820360128>3.0.co;2-7
3. Engert A, Plütschow A, Eich HT, Lohri A, Dörken B, Borchmann P, et al. Reduced treatment intensity in patients with early-stage Hodgkin’s lymphoma. N Engl J Med. (2010) 363:640–52. doi: 10.1056/NEJMoa1000067
4. Lister TA, Crowther D, Sutcliffe SB, Glatstein E, Canellos GP, Young RC, et al. Report of a committee convened to discuss the evaluation and staging of patients with Hodgkin’s disease: Cotswolds meeting. J Clin Oncol. (1989) 7:1630–6. doi: 10.1200/JCO.1989.7.11.1630
5. Eich HT, Diehl V, Görgen H, Pabst T, Markova J, Debus J, et al. Intensified chemotherapy and dose-reduced involved-field radiotherapy in patients with early unfavorable Hodgkin’s lymphoma: final analysis of the German Hodgkin Study Group HD11 trial. J Clin Oncol. (2010) 28:4199–206. doi: 10.1200/JCO.2010.29.8018
6. Ansell SM, Lesokhin AM, Borrello I, Halwani A, Scott EC, Gutierrez M, et al. PD-1 blockade with nivolumab in relapsed or refractory Hodgkin’s lymphoma. N Engl J Med. (2015) 372:311–9. doi: 10.1056/NEJMoa1411087
7. Macapagal SC, Lee H, Abdul Jabbar J, Fjorden AC, Joseph IT, Kaur R, et al. Efficacy of brentuximab vedotin and nivolumab in refractory or relapsed hodgkin lymphoma: A systematic review. Cureus. (2022) 14:e23452. doi: 10.7759/cureus.23452
8. Vardhana S and Younes A. The immune microenvironment in Hodgkin lymphoma: T cells, B cells, and immune checkpoints. Hematologica. (2016) 101:794–802. doi: 10.3324/haematol.2015.132761
9. Wein F and Küppers R. The role of T cells in the microenvironment of Hodgkin lymphoma. J Leukoc Biol. (2016) 99:45–50. doi: 10.1189/jlb.3MR0315-136R
10. Masel R, Roche ME, and Martinez-Outschoorn U. Hodgkin Lymphoma: A disease shaped by the tumor micro- and macroenvironment. Best Pract Res Cl Ha. (2023) 36:101514. doi: 10.1016/j.beha.2023.101514
11. Veldman J, Visser L, Huberts-Kregel M, Muller N, Hepkema B, van den Berg A, et al. Rosetting T cells in Hodgkin lymphoma are activated by immunological synapse components HLA class II and CD58. Blood. (2020) 136:2437–41. doi: 10.1182/blood.2020005546
12. Cellini A, Scarmozzino F, Angotzi F, Ruggeri E, Dei Tos AP, Trentin L, et al. Tackling the dysregulated immune-checkpoints in classical Hodgkin lymphoma: bidirectional regulations between the microenvironment and Hodgkin/Reed-Sternberg cells. Front Oncol. (2023) 13:1203470. doi: 10.3389/fonc.2023.1203470
13. Weniger MA and Küppers R. NF-κB deregulation in Hodgkin lymphoma. Semin Cancer Biol. (2016) 39:32–9. doi: 10.1016/j.semcancer.2016.05.001
14. Romano S, Xiao Y, Nakaya M, D’Angelillo A, Chang M, Jin J, et al. FKBP51 employs both scaffold and isomerase functions to promote NF-κB activation in melanoma. Nucleic Acids Res. (2015) 43:6983–93. doi: 10.1093/nar/gkv615
15. Marrone L, D’Agostino M, Cesaro E, di Giacomo V, Urzini S, Romano MF, et al. Alternative splicing of FKBP5 gene exerts control over T lymphocyte expansion. J Cell Biochem. (2024) 125:e30364. doi: 10.1002/jcb.30364
16. Jiang W, Cazacu S, Xiang C, Zenklusen JC, Fine HA, Berens M, et al. FK506 binding protein mediates glioma cell growth and sensitivity to rapamycin treatment by regulating NF-kappaB signaling pathway. Neoplasia. (2008) 10:235–43. doi: 10.1593/neo.07929
17. Romano S, D’Angelillo A, Pacelli R, Staibano S, De Luna E, Bisogni R, et al. Role of FK506-binding protein 51 in the control of apoptosis of irradiated melanoma cells. Cell Death Differ. (2010) 17:145–57. doi: 10.1038/cdd.2009.115
18. Periyasamy S, Hinds T Jr, Shemshedini L, Shou W, and Sanchez ER. FKBP51 and Cyp40 are positive regulators of androgen-dependent prostate cancer cell growth and the targets of FK506 and cyclosporin A. Oncogene. (2010) 29:1691–701. doi: 10.1038/onc.2009.458
19. Sun NK, Huang SL, Chang PY, Lu HP, and Chao CC. Transcriptomic profiling of taxol-resistant ovarian cancer cells identifies FKBP5 and the androgen receptor as critical markers of chemotherapeutic response. Oncotarget. (2014) 5:11939–56. doi: 10.18632/oncotarget.2654
20. Russo D, Merolla F, Mascolo M, Ilardi G, Romano S, Varricchio S, et al. FKBP51 immunohistochemical expression: A new prognostic biomarker for OSCC? Int J Mol Sci. (2017) 18:443. doi: 10.3390/ijms18020443
21. Mascolo M, Romano MF, Ilardi G, Romano S, Baldo A, Scalvenzi M, et al. Expression of FK506-binding protein 51 (FKBP51) in Mycosis fungoides. J Eur Acad Dermatol Venereol. (2018) 32:735–44. doi: 10.1111/jdv.14614
22. Travaglino A, Russo D, Varricchio S, Picardi M, and Mascolo M. Prognostic value of Bcl2 and p53 in Hodgkin lymphoma: A systematic review and meta-analysis. Pathol Res Pract. (2021) 219:153370. doi: 10.1016/j.prp.2021.153370
23. Wein F, Weniger MA, Höing B, Arnolds J, Hüttmann A, Hansmann ML, et al. Complex immune evasion strategies in classical hodgkin lymphoma. Cancer Immunol Res. (2017) 5:1122–32. doi: 10.1158/2326-6066.CIR-17-0325
24. Ferrarini I, Bernardelli A, Lovato E, Schena A, Krampera M, and Visco C. An updated portrait of monocyte-macrophages in classical Hodgkin lymphoma. Front Oncol. (2023) 13:1149616. doi: 10.3389/fonc.2023.1149616
25. Steidl C, Lee T, Shah SP, Farinha P, Han G, Nayar T, et al. Tumor-associated macrophages and survival in classic Hodgkin’s lymphoma. N Engl J Med. (2010) 362:875–85. doi: 10.1056/NEJMoa0905680
26. Marrone L, Di Giacomo V, Malasomma C, Vecchione MA, Hausch F, Cacace M, et al. Exploring the potential of selective FKBP51 inhibitors on melanoma: an investigation of their in vitro and in vivo effects. Cell Death Discov. (2025) 11:138. doi: 10.1038/s41420-025-02430-y
27. Trümper LH, Brady G, Bagg A, Gray D, Loke SL, Griesser H, et al. Single-cell analysis of Hodgkin and Reed-Sternberg cells: molecular heterogeneity of gene expression and p53 mutations. Blood. (1993) 81:3097–115. doi: 10.1182/blood.V81.11.3097.3097
28. Sun SC and Ley SC. New insights into NF-kappaB regulation and function. Trends Immunol. (2008) 29:469–78. doi: 10.1016/j.it.2008.07.003
29. Ranuncolo SM, Pittaluga S, Evbuomwan MO, Jaffe ES, and Lewis BA. Hodgkin lymphoma requires stabilized NIK and constitutive RelB expression for survival. Blood. (2012) 120:3756–63. doi: 10.1182/blood-2012-01-405951
30. Gamboa-Cedeño AM, Castillo M, Xiao W, Waldmann TA, and Ranuncolo SM. Alternative and canonical NF-kB pathways DNA-binding hierarchies networks define Hodgkin lymphoma and Non-Hodgkin diffuse large B Cell lymphoma respectively. J Cancer Res Clin Oncol. (2019) 145:1437–48. doi: 10.1007/s00432-019-02909-z
31. Küppers R. Advances in Hodgkin lymphoma research. Trends Mol Med. (2024) 31:326–43. doi: 10.1016/j.molmed.2024.10.004
32. Tufano M, Marrone L, D’Ambrosio C, Di Giacomo V, Urzini S, Xiao Y, et al. FKBP51 plays an essential role in Akt ubiquitination that requires Hsp90 and PHLPP. Cell Death Dis. (2023) 14:116. doi: 10.1038/s41419-023-05629-y
33. Takeuchi M, Miyoshi H, Semba Y, Yamada K, Nakashima K, Sato K, et al. Digital spatial profiling of CD4+ T cells in classic Hodgkin lymphoma. Virchows Arch. (2023) 483:255–60. doi: 10.1007/s00428-023-03562-1
34. Picardi M, Della Pepa R, Giordano C, Pugliese N, Mortaruolo C, Trastulli F, et al. Brentuximab vedotin followed by bendamustine supercharge for refractory or relapsed Hodgkin lymphoma. Blood Adv. (2019) 3:1546–52. doi: 10.1182/bloodadvances.2019000123
35. Picardi M, Fonti R, Della Pepa R, Giordano C, Pugliese N, Nicolai E, et al. 2-deoxy-2[F-18] fluoro-D-glucose positron emission tomography Deauville scale and core-needle biopsy to determine successful management after six doxorubicin, bleomycin, vinblastine and dacarbazine cycles in advanced-stage Hodgkin lymphoma. Eur J Cancer. (2020) 132:85–97. doi: 10.1016/j.ejca.2020.03.008
Keywords: Hodgkin lymphoma, FKBP51, Bc2, tumor microenvironment, prognosis
Citation: Varricchio S, Romano S, Russo D, Travaglino A, Cappiello R, Cervasio M, Ilardi G, Marrone L, Pane F, Picardi M, Persico M, Vigliar E, Acanfora G, Romano MF and Mascolo M (2025) Expression and prognostic value of FKBP51 in Hodgkin lymphoma. Front. Immunol. 16:1604920. doi: 10.3389/fimmu.2025.1604920
Received: 02 April 2025; Accepted: 20 October 2025;
Published: 03 November 2025.
Edited by:
Yusuke Oji, Osaka University, JapanReviewed by:
Xiaoyu Jiang, University of Miami Health System, United StatesAntonio Celentano, University of Melbourne, Australia
Guendalina Froechlich, University of Naples Federico II, Italy
Copyright © 2025 Varricchio, Romano, Russo, Travaglino, Cappiello, Cervasio, Ilardi, Marrone, Pane, Picardi, Persico, Vigliar, Acanfora, Romano and Mascolo. This is an open-access article distributed under the terms of the Creative Commons Attribution License (CC BY). The use, distribution or reproduction in other forums is permitted, provided the original author(s) and the copyright owner(s) are credited and that the original publication in this journal is cited, in accordance with accepted academic practice. No use, distribution or reproduction is permitted which does not comply with these terms.
*Correspondence: Maria Fiammetta Romano, bWFyaWFmaWFtbWV0dGEucm9tYW5vQHVuaW5hLml0