 Tanja Šegvić-Bubić1*
 Iva Žužul1
 Igor Talijančić1*
 Nika Ugrin2
 Ivana Lepen Pleić1
 Luka Žuvić1Nika Stagličić1
 Leon Grubišić1
- 1Laboratory of Aquaculture, Institute of Oceanography and Fisheries, Split, Croatia
- 2Department of Marine Studies, University of Split, Split, Croatia
The European flat oyster, Ostrea edulis, is a keystone species suffering major population declines due to overfishing, habitat loss and parasite diseases. Knowledge of its fine-scale population genetic structure and connectivity, needed for effective conservation, restoration and management, is largely lacking. Along the eastern Adriatic Sea, genotyping of 1178 O. edulis individuals at 12 microsatellite loci was conducted, grouping the sampled populations by geographical origin (North, Middle, South Adriatic), shell-farm association (farmed, farm-impacted, wild oysters) and sampling year (2017, 2018), in order to explore spatio-temporal genetic variation and potential footprint of known human-mediated spat translocation events for aquaculture purpose. Short-term temporal genetic structuring of O. edulis populations was less pronounced compared to their spatial variability, which showed genetic discontinuity between O. edulis populations from different geographical regions, with the main boundary separating the North from the Middle and South Adriatic, and the weaker one limiting the flow between the Middle and South Adriatic. While the present culture practise and ongoing spat translocation promotes genetic heterogeneity in the investigated farms, reduced genetic diversity and smallest effective populations size of impacted, i.e., farm-associated O. edulis was consistently recorded in all geographical regions. Taken together, the results reflect regional oceanographic features, ongoing spat translocation and intensive harvesting, which might have reduced the wild O. edulis densities below the critical threshold for reproductive success, compromising settlement and favoring unidirectional gene-flow toward higher density farmed O. edulis. Genetic structure of Adriatic O. edulis populations revealed some concerning demographic changes and farm-wild oyster interactions and hence further investigation and management recommendations are given.
Introduction
Population connectivity and spatial structure information provide a basis for understanding marine species population dynamics, and play a key role in the conservation and management of fisheries (Reiss et al., 2009). Gene flow is assumed to occur over large marine geographical scale due to the lack of obvious barriers to dispersal and to the existence of pelagic larvae phases in many species (Sa-Pinto et al., 2012). It appears that a different degree of connectivity among populations is greatly dependent on early life history traits, like pelagic larval dispersal as the presumed mechanism of primary connectivity (Huserbraten et al., 2013). Additionally, in bivalve species with relatively short pelagic larval duration, such as Ostrea edulis, larval settlement plays an important role in connectivity and successful stock restauration, as larvae are unable to metamorphose unless they are attached to a suitable substrate (Wieczorek and Todd, 1998).
The European flat oyster (O. edulis) is one of the bivalve species with the longest tradition of harvesting and aquaculture (e.g., Caceres-Martinez and Figueras, 1997; Edwards, 1997; Goulletquer and Heral, 1997). It is a sessile, filter-feeding bivalve mollusc with a distribution ranging from Norway to Morocco in the Atlantic Ocean, and in the Mediterranean Sea and extending into the Black Sea. In the wild, O. edulis lives from the intertidal to 90 m depth and on different types of bottoms. Due its aquaculture potential, it has also been introduced into other parts of the world, including the United States and Canada (Carnegie and Barber, 2001; Vercaemer et al., 2006).
Although bivalve aquaculture has generally been showing a steady increase in recent decades, production of O. edulis in European aquaculture has decreased from an average production of 9152 tonnes per year in the period 1980–1989 to an average of 3305 tonnes per year in the period 2006–20151. Overharvesting, loss of habitat and the successive occurrence of two parasitic diseases, marteiliosis (Marteilia refringens) and the more serious bonamiosis (Bonamia ostreae) have been identified as the main causes of this drastic decline in the O. edulis production (Airoldi and Beck, 2007). Northern European counties are investing significant efforts in oyster restauration activities and programs (Laing et al., 2005; Shelmerdine and Leslie, 2009; Woolmer et al., 2011; Gravestock et al., 2014; Smaal et al., 2015; Harding et al., 2016), suggesting that O. edulis is an integral component of a biologically healthy functional benthic environment and, as such, the restauration of wild stocks is a matter of urgency (Smyth et al., 2018).
In Croatia, European flat oyster aquaculture has a long tradition, with the first organized oyster farming in the eastern Adriatic dating back to the 16th century (Horváth et al., 2013). Over the last 5 years, production limited to 49 tonnes of oysters per year was sold exclusively on the local market. Despite the strong resistance of Adriatic flat oyster populations to both parasitic diseases over time, thanks mainly to a ban on spat imports spat from Western Europe (Zrnčić et al., 2007; Horváth et al., 2013), several other factors have contributed to declining oyster production, i.e., small domestic market, intense fisheries, great variability in larval dispersion and settlement, fish predation and alien species (Pineda et al., 2009; Šegvić-Bubić et al., 2011, 2016).
In line with most bivalve aquaculture production, oyster farming still relies on the collection of wild spat and its cultivation in long-line systems to a length of 3–4 mm. Due to the great spatial and temporal variability of spat settlement and its collection among years and at farming sites, spat translocation for farming purposes is commonplace at the regional scale, i.e., from the Mali Ston Bay in the south to the Lim Bay in the north of eastern Adriatic coast; however, such transfers are poorly documented. It is well known that the impact of translocation of individuals from wild populations into other genetically distinct populations is an important issue for the management of exploited or endangered species (Johnson, 2000), since the link between the risk associated with translocation and impacts on genetic integrity and diversity of native stock is well established (Brenner et al., 2014; Bromley et al., 2016). Despite the high importance of the European flat oyster as an aquaculture species, the implications that might arise from such practices on the receiving and farm-surrounding populations in the eastern Adriatic have not yet been assessed. Furthermore, there are no genetic descriptions of wild and farmed oyster populations to support the present population composition.
Several previous studies identified the importance of understanding genetic diversity of wild and cultured O. edulis populations in Europe (e.g., Naciri-Graven et al., 2000; Launey et al., 2002; Culloty et al., 2004; Diaz-Almela et al., 2004; Vercaemer et al., 2006; Taris et al., 2008; Lallias et al., 2010a). This is especially relevant for understanding the genetic basis for resistance to parasitic diseases (Culloty et al., 2004), differences in growth rates (Naciri-Graven et al., 2000) and reproductive success (Lallias et al., 2010a), and for conducting oyster restoration programs (Lallias et al., 2010a; Vera et al., 2016). High genetic diversity has been reported in oyster populations and the available data suggest that the genetic structure follows an isolation by distance model across the Atlantic and Mediterranean regions (Saavedra et al., 1995; Launey et al., 2002; Diaz-Almela et al., 2004), while the north Atlantic populations clustered into geographical regions associated with oceanic fronts (Vera et al., 2016).
Thus, to explore the genetic population structure and potential footprint of human-mediated spat translocation in European flat oyster populations along the eastern Adriatic coast, we genetically assayed 1178 wild and cultured individuals sampled in two consecutive years, using 13 published microsatellite markers. This study aimed to: (i) examine the possible changes in genetic variation occurring over the spatial and short-term temporal scale of oyster populations, and (ii) investigate the potential impact of spat transfer between different culture sites on the genetic diversity and structure observed in the farm and farm-surrounding populations.
Materials and Methods
Oyster Sampling
A total of 1178 O. edulis individuals were sampled from 15 sampling sites in two consecutive years, during November 2017 and 2018 (Table 1 and Figure 1). All sampled individuals were within the size of 6–8 cm corresponding to the age of 2 or 3 years. Collection included: (i) wild oysters sampled from eight natural beds covering 600 km of Croatian coastline; (ii) farmed oysters sampled from the three main aquaculture areas along the coastline, and (iii) three farm-associated populations sampled from natural beds located in the vicinity of oyster-farm installations. All farms included in this study were active with annual production of more than 10 tonnes of oysters. A muscle section of each sampled oyster was stored separately in 96% ethanol and later used in genetic analysis. Depending on location, sample sizes ranges from 12 to 67 individuals (Table 1). Populations were coded according to the sampling year (17, 2017; 18, 2018), regional geographical origin (N, north; M, middle; S, south Adriatic), sampling location, and origin (W, wild; F, farmed; A, farm-associated).
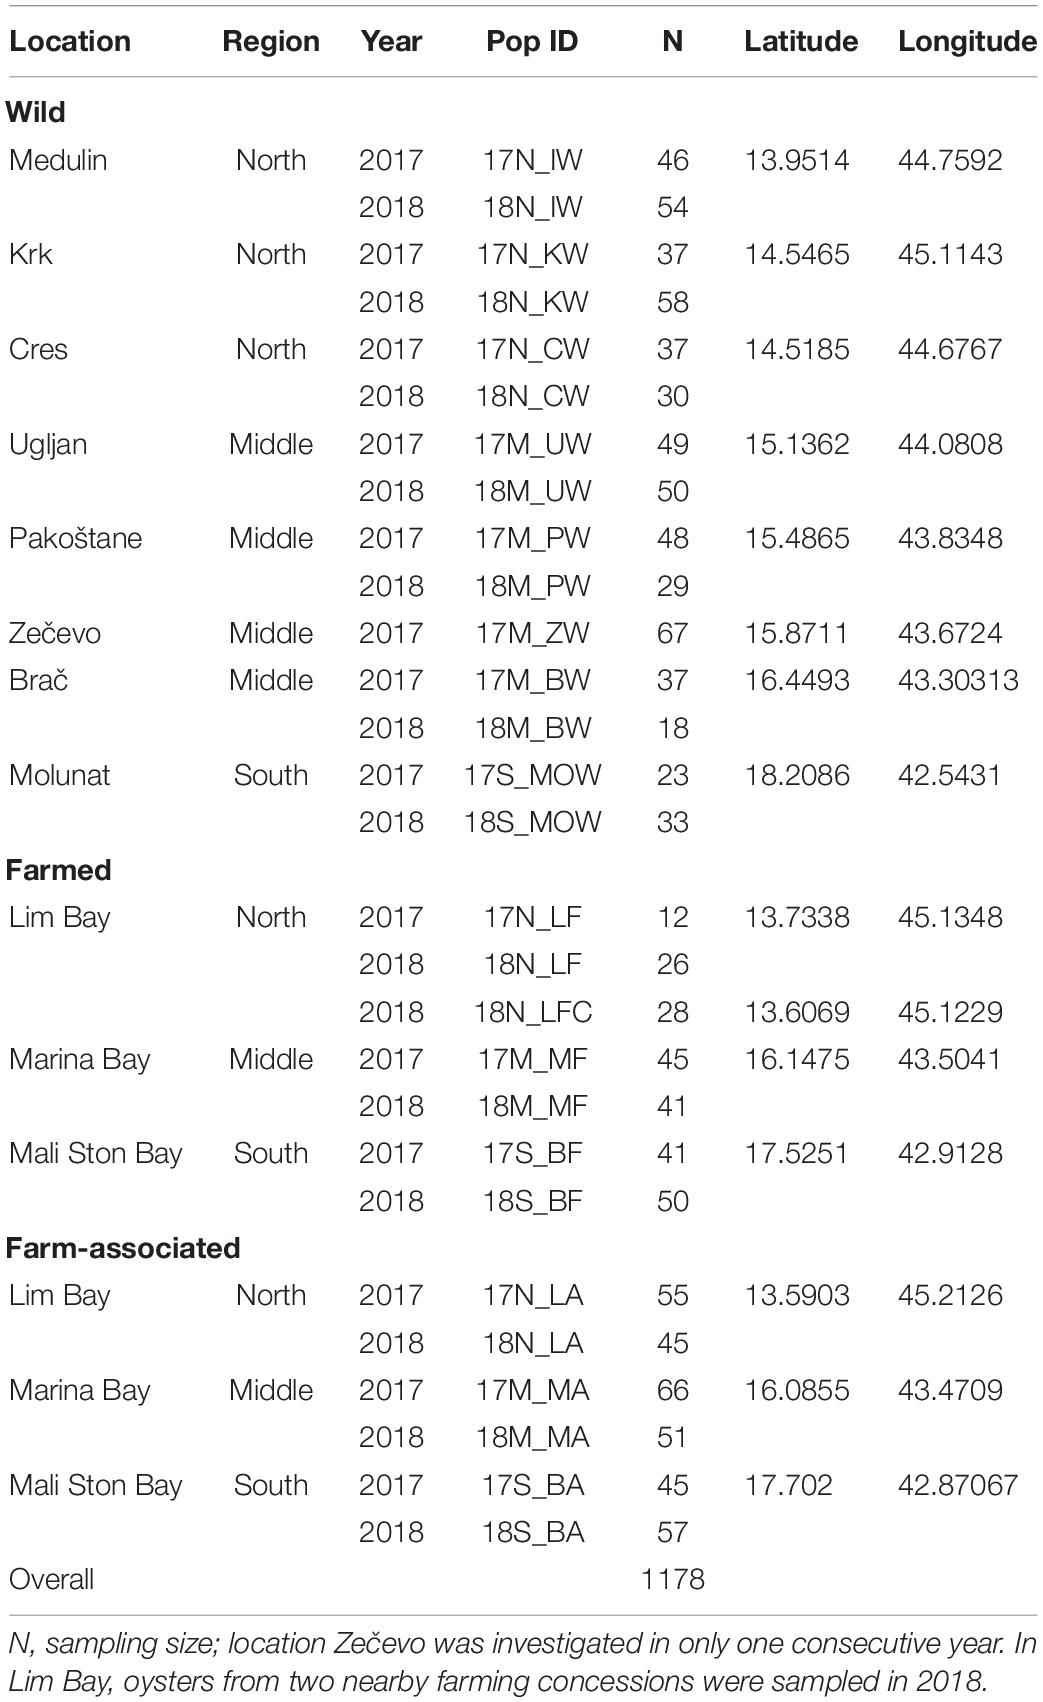
Table 1. Information of sampling locations, regions, years and codes, along with the number of individual European flat oyster that were genetically assayed with 12 putatively neutral microsatellites.
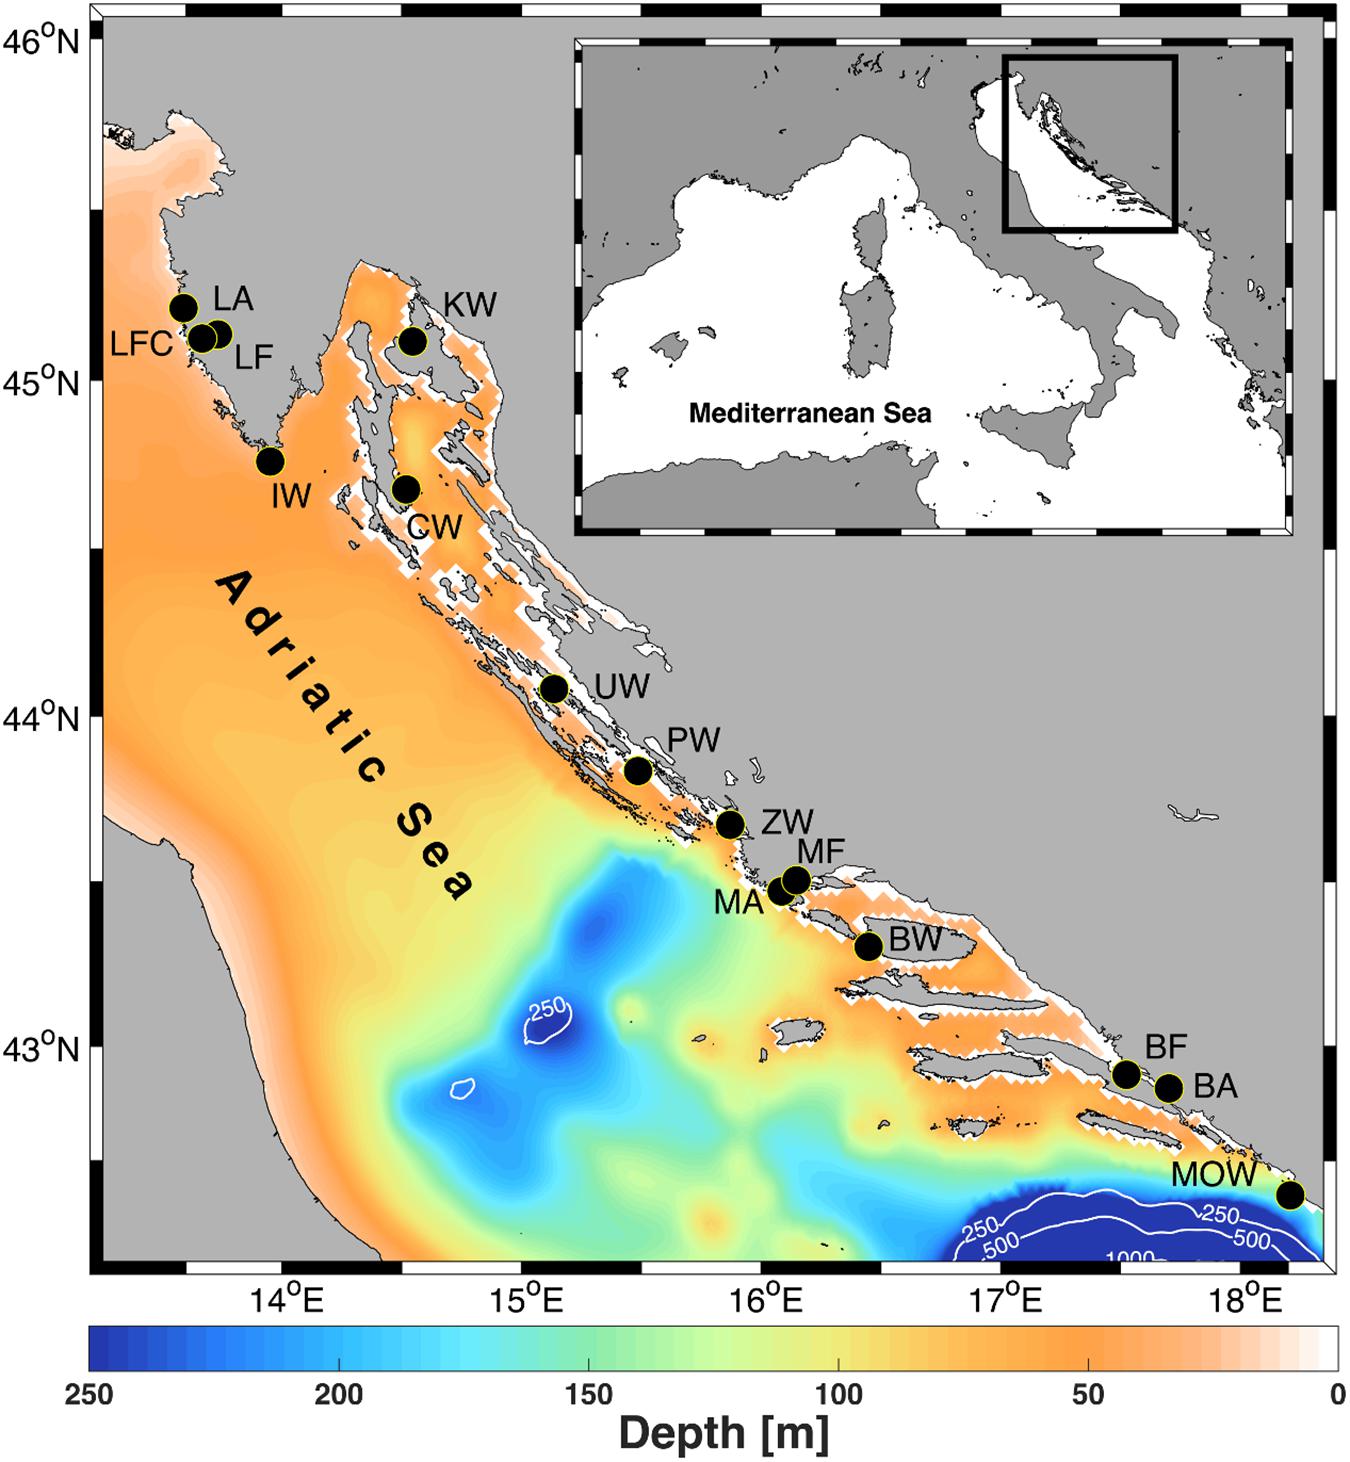
Figure 1. Adriatic Sea bathymetry with sampling locations of wild European flat oyster (IW, Medulin; KW, Krk; CW, Cres; UW, Ugljan; PN, Pakoštane; ZW, Zečevo; BW, Brač; MOW, Molunat), farmed (LF and LFC, Lim Bay; MF, Marina Bay; BF, Mali Ston Bay) and farm-associated adults (LA, Lim Bay; MA, Marina Bay; BA, Mali Ston Bay). Contours are drawn for 250, 500, and 1000 m depths. More information about population abbreviations and sampling years are provided in Table 1. The figure has been created using MATLAB 2014a (www.mathworks.com) and GIMP 2.8.16 (www.gimp.org) software.
DNA Extraction and Genotyping
Total genomic DNA from muscle was extracted by proteinase K digestion, followed by standard phenol-chloroform extraction protocol. DNA quality and quantity were assessed by spectrophotometry (IMPLEN N50, Germany), following sample dilution to 10 ng μL–1 in DNAse/RNAse free water. A set of 13 microsatellite loci (Launey et al., 2002; Lallias et al., 2009; Vera et al., 2015; see Supplementary Table 1) were split into two PCR multiplex and amplified using the Qiagen multiplex kit with labeled (FAM, NED, VIC and PET, Applied Biosystems) primers following manufacturer recommendations in 12.5 μL reactions. Primer dies were set up to avoid similar allele size overlapping. PCR multiplex conditions are shown in Supplementary Table 1. Fragments were separated on an ABI3130 automated sequencer (Applied Biosystems) using Macrogen (Macrogen Inc., Seoul, South Korea) services, while peak height values for each microsatellite allele were scored manually by two persons using GeneMapper v.3.5 software (Applied Biosystems).
Hardy-Weinberg Equilibrium, Linkage Disequilibrium and Null Alleles
Software MICROCHECKER 2.2.3 (Van Oosterhout et al., 2004) was used to test for genotyping errors on scored alleles, while the presence and frequency of null alleles were additionally examined by FreeNA (Chapuis and Estoup, 2007). The software computed the FST statistic, both with exclusion and inclusion of the ENA (Excluding Null Alleles) correction method that efficiently corrects for the positive bias induced by the presence of null alleles on FST estimation. The bootstrap 95% confidence intervals (CI) for the global FST values were calculated using 50,000 replicates over loci. Fisher’s exact test for deviations from Hardy-Weinberg equilibrium and the linkage disequilibrium (LD) test for all pairs of loci were performed by GENEPOP v.4.0.9 (Rousset, 2008). Exact P-values for the individual population or locus tests were estimated using the Markov Chain algorithm (10,000 dememorization steps, 100 batches and 5000 iterations) and the significance of HWE and LD values were adjusted by sequential Bonferroni correction (Rice, 1989).
Genetic Diversity, Test of Demographic Changes and Effective Population Size
Allelic richness (Ar) and the inbreeding coefficient (FIS) were calculated using FSTAT v.2.3 (Goudet, 2002) while the number of alleles (N) and mean effective number of alleles across loci (Ae) were calculated using POPGENE v.1.32 (Yeh et al., 2000). Observed (Ho) and expected (He) heterozygosity was calculated in ARLEQUIN v.3.5 (Excoffier et al., 2005) while the contemporary effective population size (Ne) was estimated in the program NeEstimator V2 (Do et al., 2014) using the single-sample linkage disequilibrium method for populations with a sample size over 17 individuals. Low frequency alleles ≤0.02 were excluded from the analysis.
Evidence for a recent reduction in local population size was tested with the heterozygosity excess method in the BOTTLENECK 1.2.02 software and by the Two-Phased mutation model (TPM), incorporating 90% of single-step mutations and 10% of variance among multiple steps (Piry et al., 1990). Statistical significance was evaluated by Wilcoxon signed-rank test from 10,000 simulation replicates. In addition, Garza and Williamson’s M-ratio (Garza and Williamson, 2001) for each population was calculated using ARLEQUIN. It is sensitive to population bottlenecks because it measures the proportion of unoccupied allelic states given the range in allele size, and this ratio is reduced as alleles are randomly lost due to drift. M-ratio values less than 0.68 are generally indicative of populations that have experienced a recent reduction in size (Garza and Williamson, 2001). Relatedness was calculated with COANCESTRY v1.0 (Wang, 2011), using the triadic likelihood method (Wang, 2007). This estimator was chosen because it is least biased when data contain many unrelated individuals, as expected in our dataset. Significance of mean differences in relatedness between samples was assessed by 10,000 permutations.
Genetic Differentiation and Population Structuring
Statistical power of tests for genetic homogeneity on the applied data set and sample sizes was assessed by POWSIM software (Ryman and Palm, 2006). Global FST and pair-wise values were calculated in ARLEQUIN v.3.5 where confidence levels were estimated by 2000 permutations of the dataset. Given that FST can underestimate population differentiation when highly polymorphic microsatellites are used, the alternative measure Dest based on allele identities (Jost, 2008) was also calculated using GENODIVE (Meirmans and Van Tienderen, 2004). Analyses of molecular variance (AMOVA) were carried out with two different analyses of distance, the number of different alleles (FST) based on the infinite allele model and the sum of squared size difference (RST) based on the stepwise mutation model. To investigate the distribution of genetic variability within the eastern Adriatic Sea, spatial Principal Component Analysis (sPCA) were performed on allelic frequencies for each sampling year, by using the R software package adegenet (Jombart, 2008; Jombart et al., 2008). Spatial network using a matrix of the inverse Euclidian distance between sampling locations was used for the calculation of Moran’s I. sPCA optimizes the product of the variance of individual scores and of Moran’s I to summarize genetic variability in a spatial context. The presence of global or local structures was further assessed using the Global and Local random test with 1000 permutations implemented in the adegenet package. The lag scores for each of the first two principal components were plotted across geographic space to identify spatial genetic structure. Mantel test with function mantel.randtest was used to test spatial structures for each sampling year, by assessing the correlation between genetic distances and geographic distances.
Population variability was further examined with a discriminant analysis of principal components (DAPC) included in the package adegenet (Jombart and Ahmed, 2011), using the sampling sites as a prior for each sampling year. The optimal number of clusters was determined based on the Bayesian information criterion (BIC) (Jombart et al., 2010). The function xvalDapc was used sequentially with 1000 replicates, to determine the optimal number of principal components (n = 150) to retain in the discriminant analysis for both analyses. The compoplot function was used to calculated posterior membership probability.
Results
Genetic Diversity
A total of 1178 individuals of O. edulis were genotyped at 13 microsatellite loci (Table 1 and Figure 1) where the proportion of missing data per locus ranged from 0 to 3.8%, with an average of 1.3%. Locus OeduJ12 was immediately excluded from analysis due to the poor amplification result in the dataset. Still, several populations, especially those having farm-associated origin, showed significant deviation from Hardy-Weinberg equilibrium, with tendencies toward heterozygote deficiency at seven of eleven loci (Oedu240, Oedu327, OeduU2, Oedu46 and Oedu212b, Supplementary Tables 2, 3), as revealed by Fisher’s exact test. This deficiency in heterozygotes is unlikely to be a technical artifact, as it was observed for the majority of markers. The existence of null alleles can be regarded as the most likely cause, as null alleles are widely observed in other molluscs (Hedgecock et al., 2004; Zhan et al., 2007). MICROCHECKER detected null alleles for the loci Oedu240, Oedu327, OeduU2, Oedu46 and Oedu212b at low frequencies <5% and these loci were retained. The estimation of FST with and without the ENA correction method gave comparable results; 0.0085 vs. 0.0082 with vs. without the ENA, with overlapping 95% CI. Further, large allele dropout was not detected with MICROCHECKER and no consistent evidence of linkage disequilibrium among pair of loci was recorded when applying strict Bonferroni correction for multiple tests.
Among the 12 loci examined, all were polymorphic with the number of alleles per locus ranging from 4 to 25 (Supplementary Tables 1, 2). While the expected heterozygosity (He) showed small variations among populations and years (0.87–0.90), the observed heterozygosity (Ho) revealed varying degrees of genetic diversity (0.77–0.87) with reduced values found in 2017 vs. 2018 and in farm-associated groups in comparison to the farm and wild counterparts for both years (Table 2). The indices of effective number of alleles (Ae) and allelic richness (Ar) showed similar diversity levels among populations, origins and years, while the number of alleles per locus was slightly reduced in farmed populations in contrast to wild ones.
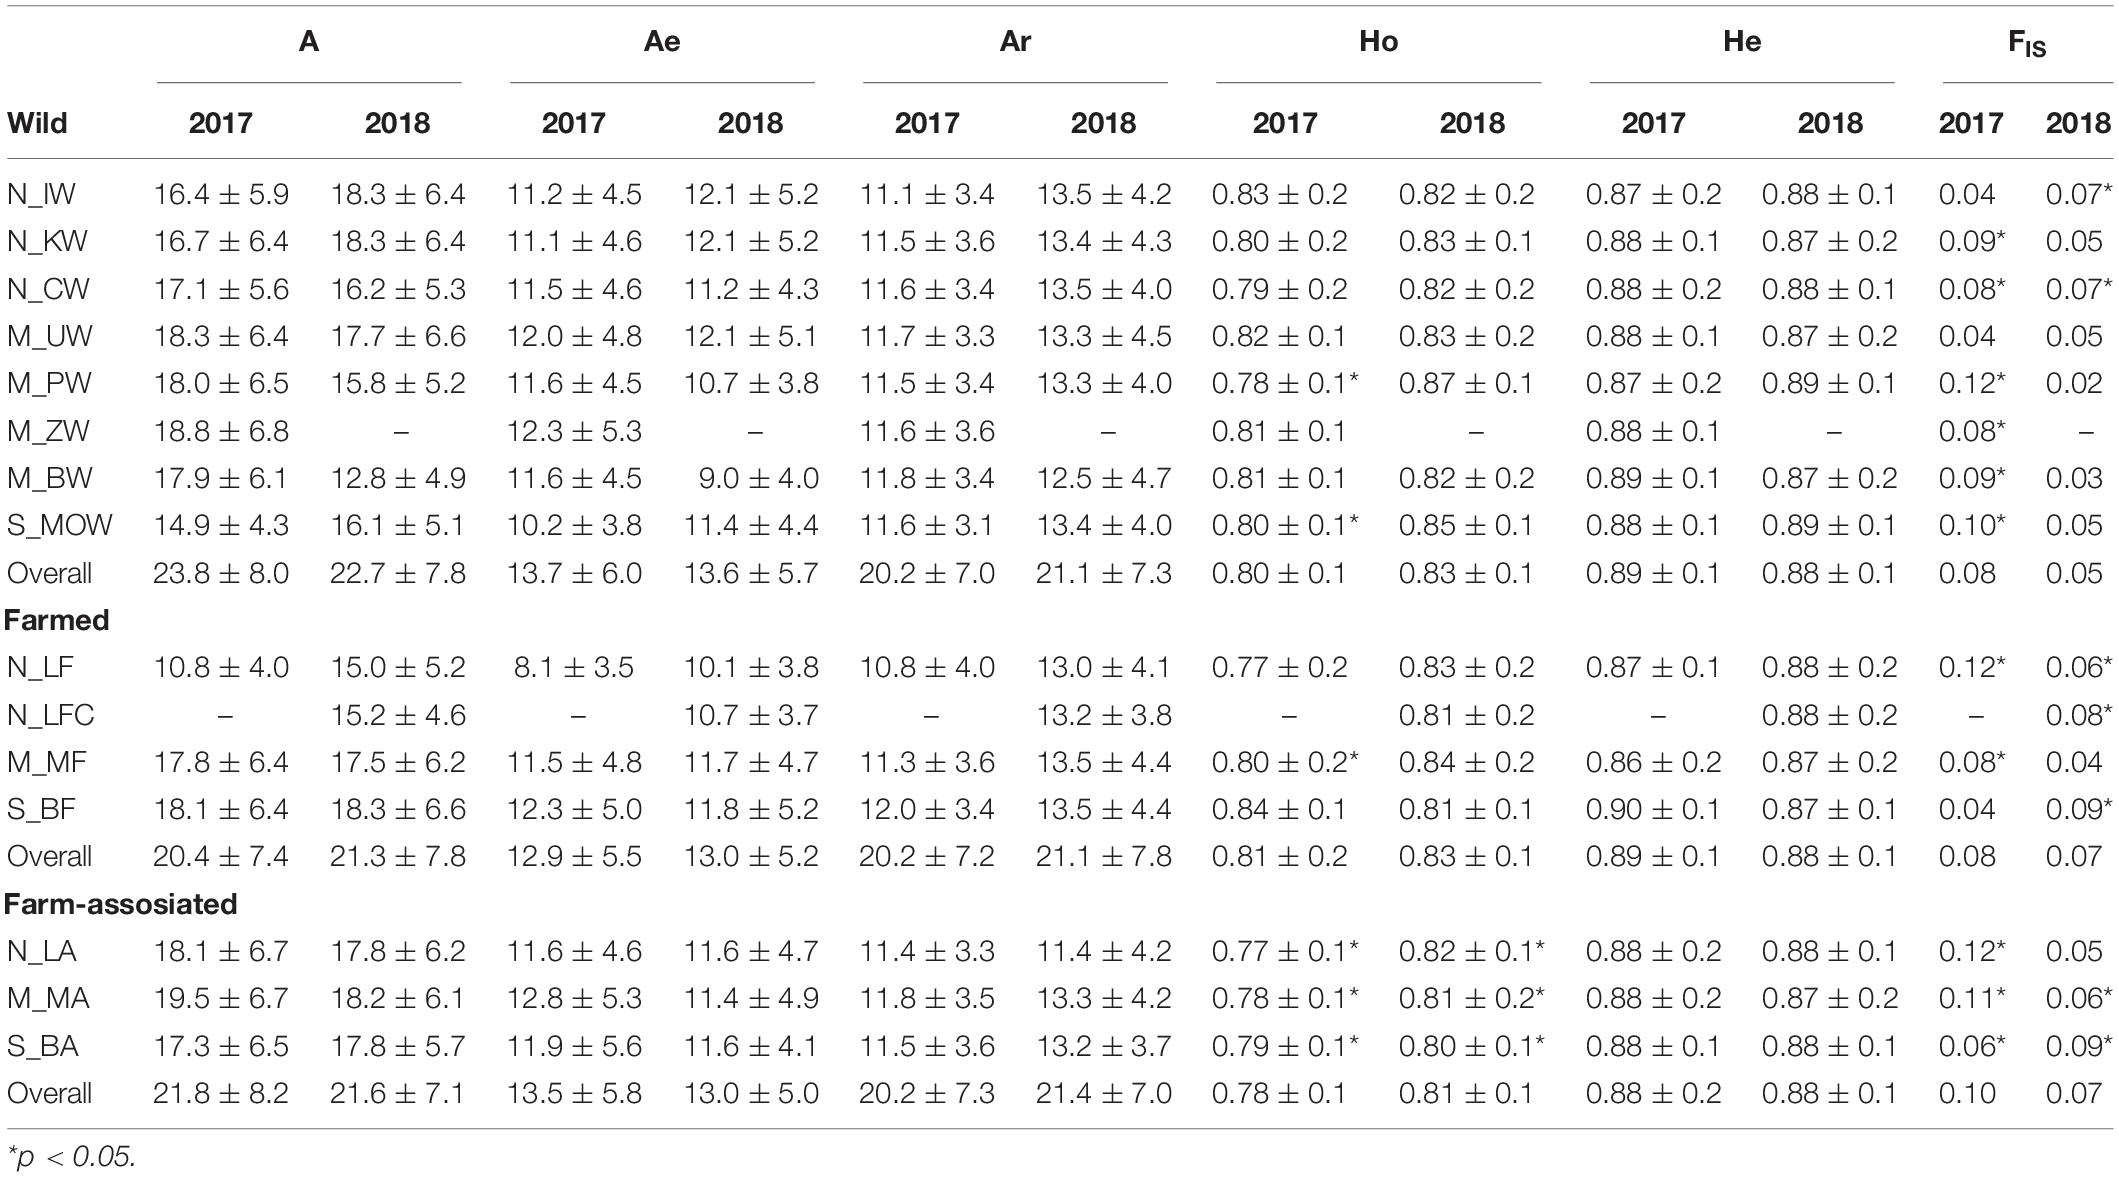
Table 2. Summary statistics for genetic variation of Ostrea edulis in the Adriatic Sea showing the average number of alleles (A), effective number of alleles (Ae), allelic richness (Ar), expected (He) and observed (Ho) heterozygosity, and fixation index (FIS).
The inbreeding coefficient, FIS, ranged from 0.02 to 0.12 in the dataset and was significantly higher than zero in 85% and 50% populations sampled in 2017 and 2018, respectively (Table 2). High disparity of contemporaneous effective population sizes (Ne) in respect to oyster origin was recorded (Table 3). On average, estimates of Ne were 2-fold and 4-fold smaller in the farm-associated group for 2017 (493) and 2018 (547) in comparison to the farmed (1009; 1816) and wild groups (2241; 2332), respectively. In line with temporal sample replicates, both bottleneck tests showed statistical evidence that oyster populations from different origins had undergone a recent reduction in population size (Table 3). Wilcoxon signed-rank tests detected significant heterozygote excess (p < 0.05) under the two-phase model in 7/14 and 9/14 populations for 2017 and 2018, respectively. Only 1/14 populations in 2017 and 2018 had a significant probability of heterozygosity excess under the stepwise model (Table 3). In contrast to the first method, M-ratio analyses revealed signatures of genetic bottlenecks in all populations in 2017 and 2018, considering that the observed values (mean M-ratio 0.42 ± 0.05) were lower than the simple threshold criterion (M-ratio < 0.68; Garza and Williamson, 2001), which is widely used as a rule of thumb in conservation genetics (Hoban et al., 2013). The average relatedness among farmed (0.027), wild (0.0273) and farm-associated individuals (0.0262) was not statistically different from the 1,000 simulated unrelated individuals (0.032). The average relatedness among farmed and wild populations (0.027) was slightly higher than the average relatedness among farmed and impacted populations (0.025) (P < 0.05).
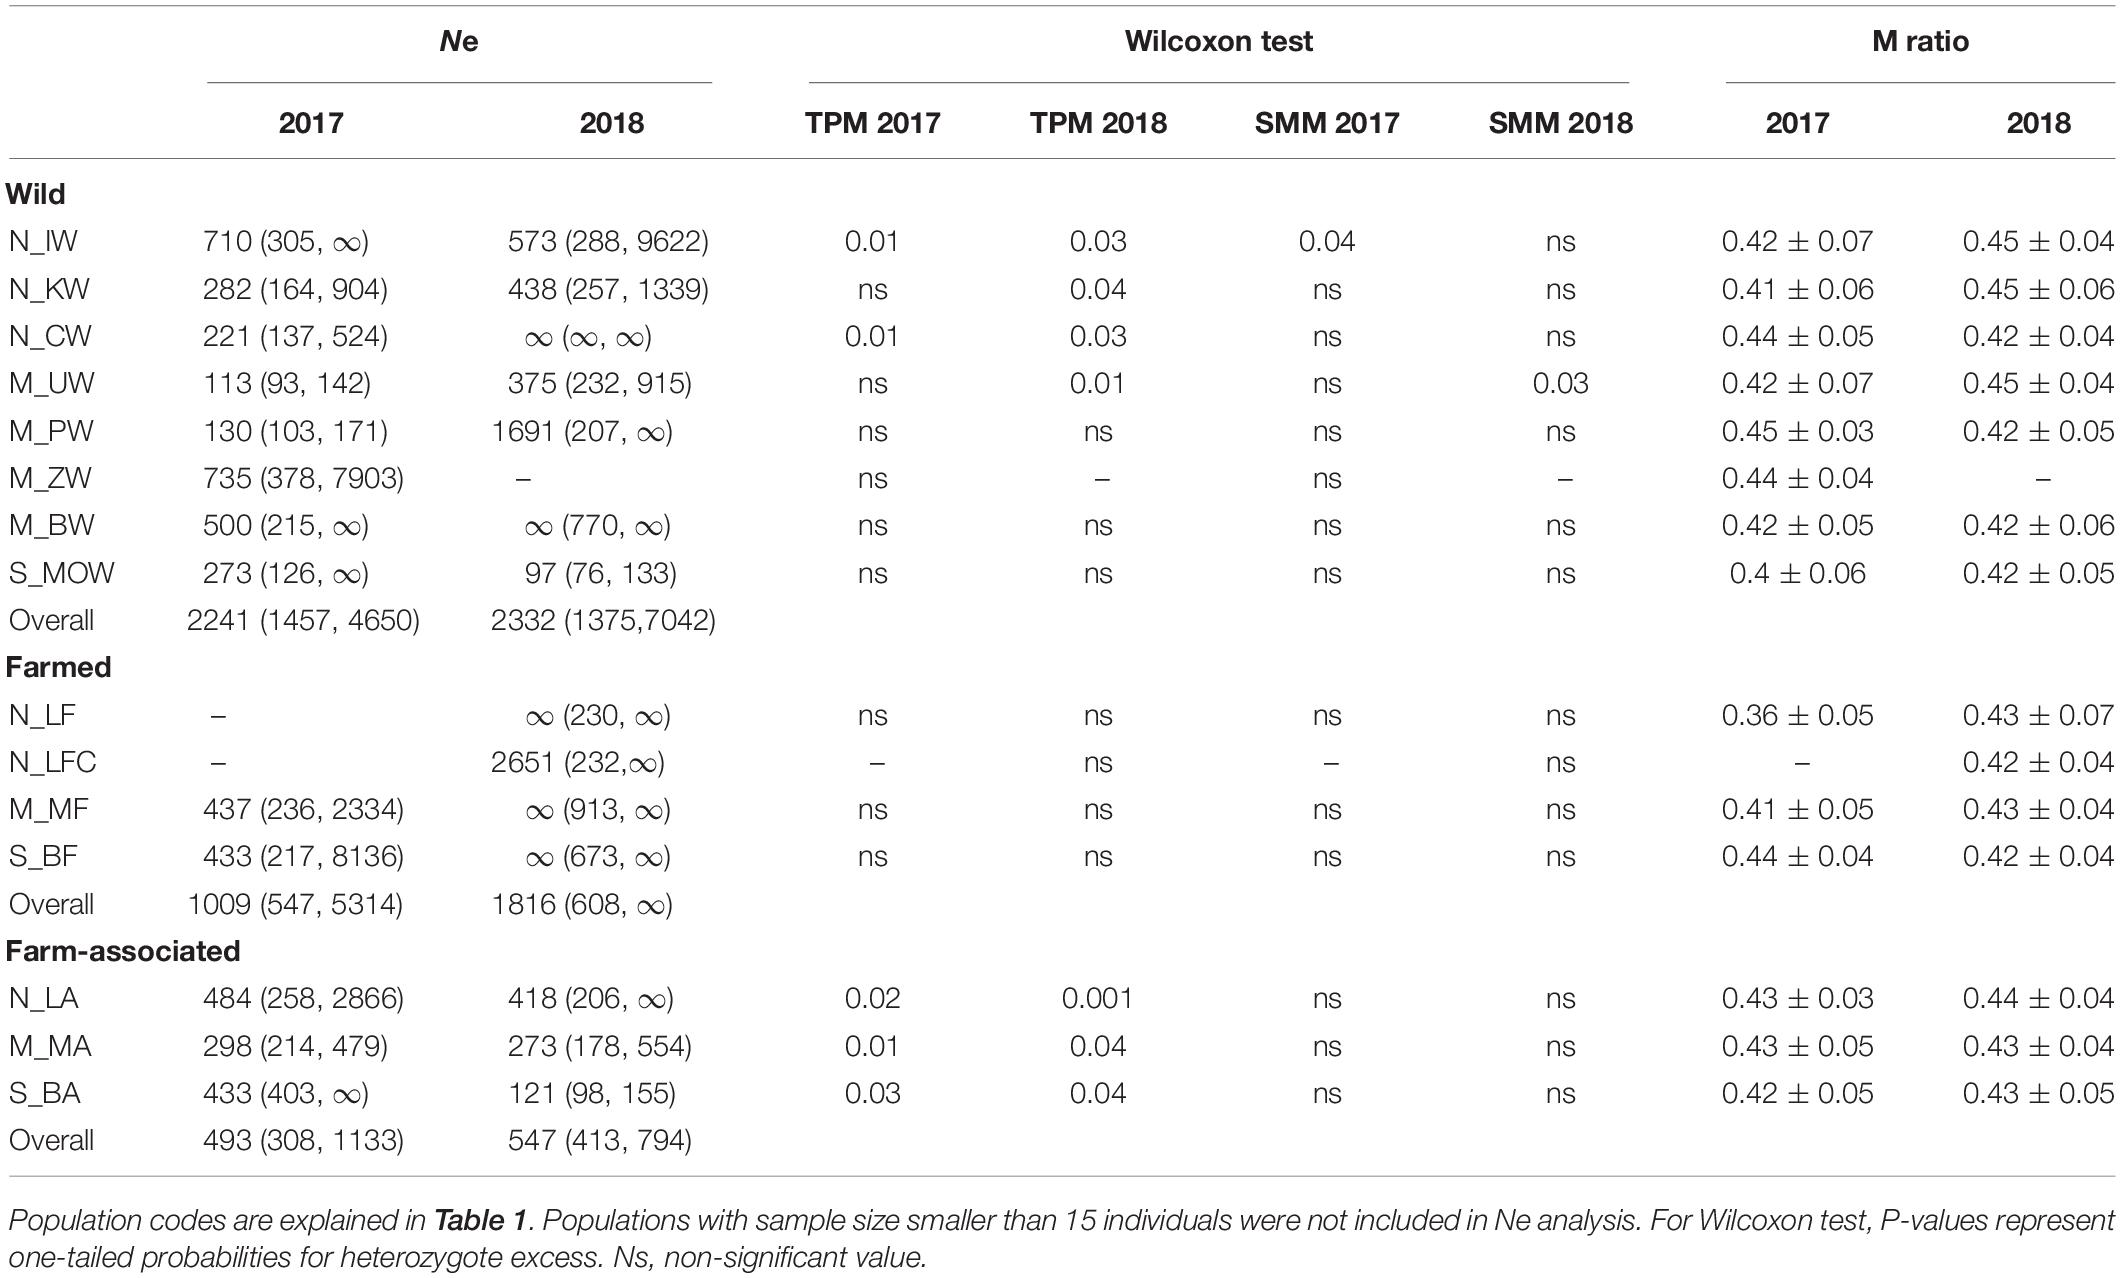
Table 3. Effective population size (NE) of Ostrea edulis for 12 putatively neutral microsatellite loci and tests for genetic bottlenecks using two models of microsatellite allele mutations (TPM, two phase model and SMM, stepwise model) and the Garza-Williamson index (M ratio, Garza and Williamson, 2001).
Among-Population Genetic Differentiation
Assessment of the statistical power for both microsatellite data sets in POWSIM revealed that it was possible to detect genetic divergence as low as FST = 0.01 with 100% certainty (χ2, Fisher’s test) and with 98% certainty for FST = 0.001.
Global genetic differentiation, estimated using FST and Dest, across all 28 populations was 0.0082 (p < 0.0001) and 0.064 for the total dataset, supporting a relatively low to moderate level of differentiation among individual populations. The highest global index values of 0.012 and 0.109 were recorded within farmed populations in contrast to the lower levels of global values observed within the other two population groups, wild (0.008 and 0.062) and farmed-associated (0.005 and 0.040) group, respectively. Pairwise FST and Dest among populations for both sampling years are outlined in Supplementary Table 4. Following Bonferroni correction, 160 of 378 pairwise FST comparisons were statistically significant when permuted by Fisher’s exact test. Pairwise differentiation Dest values displayed the same trend as FST values after 1000 bootstraps and Bonferroni correction. Mantel test analysis showed strong correlation between two matrices (r = 0.99, p = 0.01)whereas on average Dest values were 7-8 fold larger than the equivalent statistic.
Farmed samples from the north Adriatic region (17N-LF) showed high and significant pair-wise differentiation (FST: 0.006 – 0.068, Dest: 0.034 – 0.401) in relation to all populations included in the dataset. A similar pattern was observed for other farmed samples from the middle and south region, having less significant interactions in comparison to the north region sample. Although, several wild populations, as 17N-IW, 17N-KW and 18M-BW, showed a break in gene flow toward other populations of different origin, the majority of non-significant comparisons were found within adjacent wild populations sampled throughout the Adriatic. No clear pattern of gene flow reduction was observed among origins, regions or years, which is further supported by the AMOVA results based on FST and RST differentiation measures, where less than 0.01% of the total variance was explained by differences among groups and 99.98% was within populations. Only RST based AMOVA arranged by three geographical regions identified a significant level of sub-structuring (p < 0.05), but with evident gene flow among groups and within populations.
The isolation by distance (IBD) analysis for flat European oyster populations from both years revealed a low but statistically significant isolation by distance pattern (r = 0.285, p = 0.04), where the scatterplot of local densities of distances showed a consistent cloud of points with no clear-cut discontinuation, indicating a gradual cline of genetic differentiation (Supplementary Figure 1). However, when this global pattern of genotype distribution based on coordinates was analyzed in greater detail with spatial Analysis of Principal Components (sPCA), a significant global structure appeared (Gtest (2017): obs = 0.005, P-value = 0.01; Gtest (2018): obs = 0.003, P-value = 0.03), differentiating the north from the middle and south genetic pools (Figure 2). The first sPCs that were significantly positively autocorrelated in both years (I2017 = 0.0115, p = 0.001; I2018 = 0.009, p = 0.02) separated the north region populations of different origin with a bathymetric threshold of 150 m on one side (black squares) from the middle and south populations on the other side (white squares, Figure 2). In addition, connectivity strength of populations from middle and south regions toward the north region varied interannually, where the middle populations in 2017 showed a transition pattern of connectivity between the north-south regions, i.e., with progressive changes instead of sharp boundaries from one patch to another, supporting the isolation by distance process (Figure 2A).
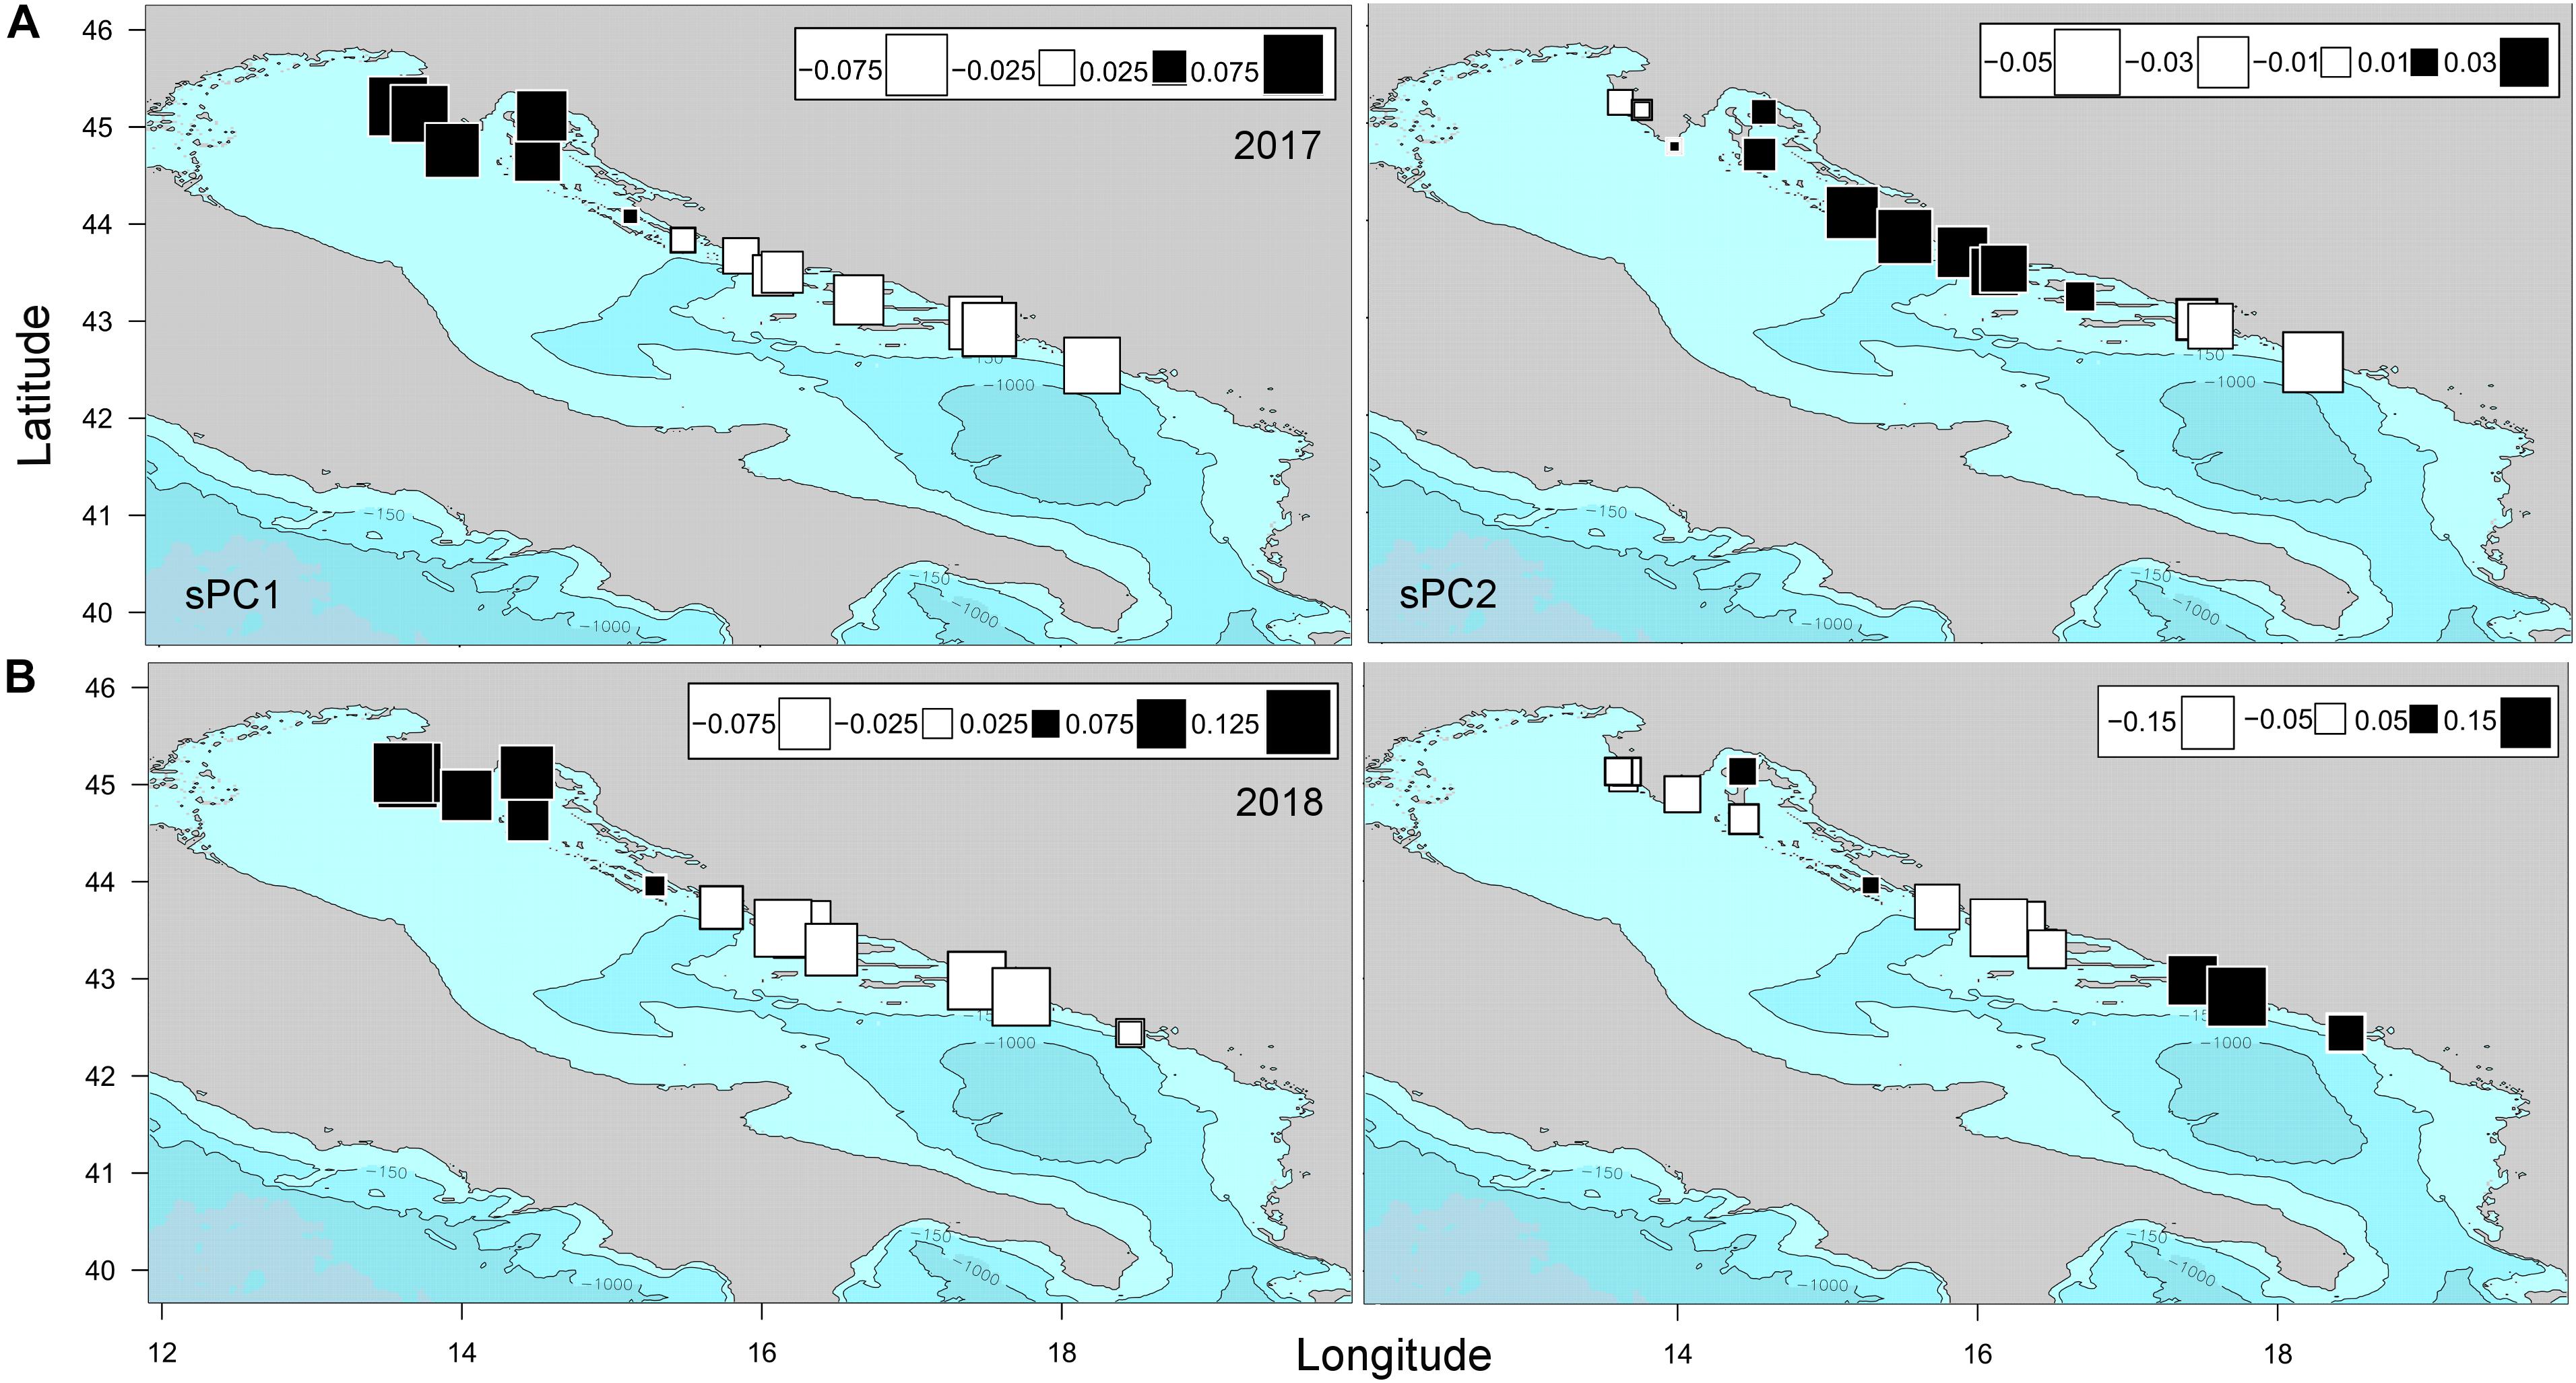
Figure 2. Spatial Principal Component Analysis (sPCA) of Ostrea edulis populations from the eastern Adriatic Sea sampled in 2017 and 2018, based on 12 microsatellites loci frequencies. The first two global components sPC1 (A) and sPC2 (B) are depicted for both years. Positive values are represented by black squares; negative values are represented by white squares; the size of the square is proportional to the absolute value of sPC scores.
The second sPCA scores were less representative than the first in terms of both variance and spatial autocorrelation (I2017 = 0.004, p = 0.015; I2018 = 0.001, p = 0.06), and depicted additional population structuring, i.e., gene flow discontinuity between the middle and southern populations in both years (Figure 2). The optimal number of clusters identified using DAPC and successive K-means clustering analyses supported three clusters (Supplementary Figure 2). Treating each sampling location as an a priori cluster, the DAPC plots showed subtle population structuring following the pattern observed by the sPCA analysis (Figures 3A,B). Isolation by distance across the eastern Adriatic with exclusion of two northern populations that formed separated clusters was recorded for 2017. On the other hand, in 2018 northern populations showed a central grouping pattern in PC space with overlapping clusters from both sides, i.e., populations from the middle Adriatic on one side and southern population on the other. Posterior membership probability plots showed slight heterogeneity in cluster stratification (Figures 3C,D), where the average assignment score of the individual to its sampling site origin ranged from 75% in 2017 to 77% in 2018. While the majority of farmed individuals showed strong assignment to their actual sampling site origin (82–86%), that was not the case with farm-associated individuals. Namely, for all three regions and for both sampling years, farm-associated individuals had assignment scores below the average (68–72%), where assignment overlapped between sampling locations, with a prevalence toward the farming sites.
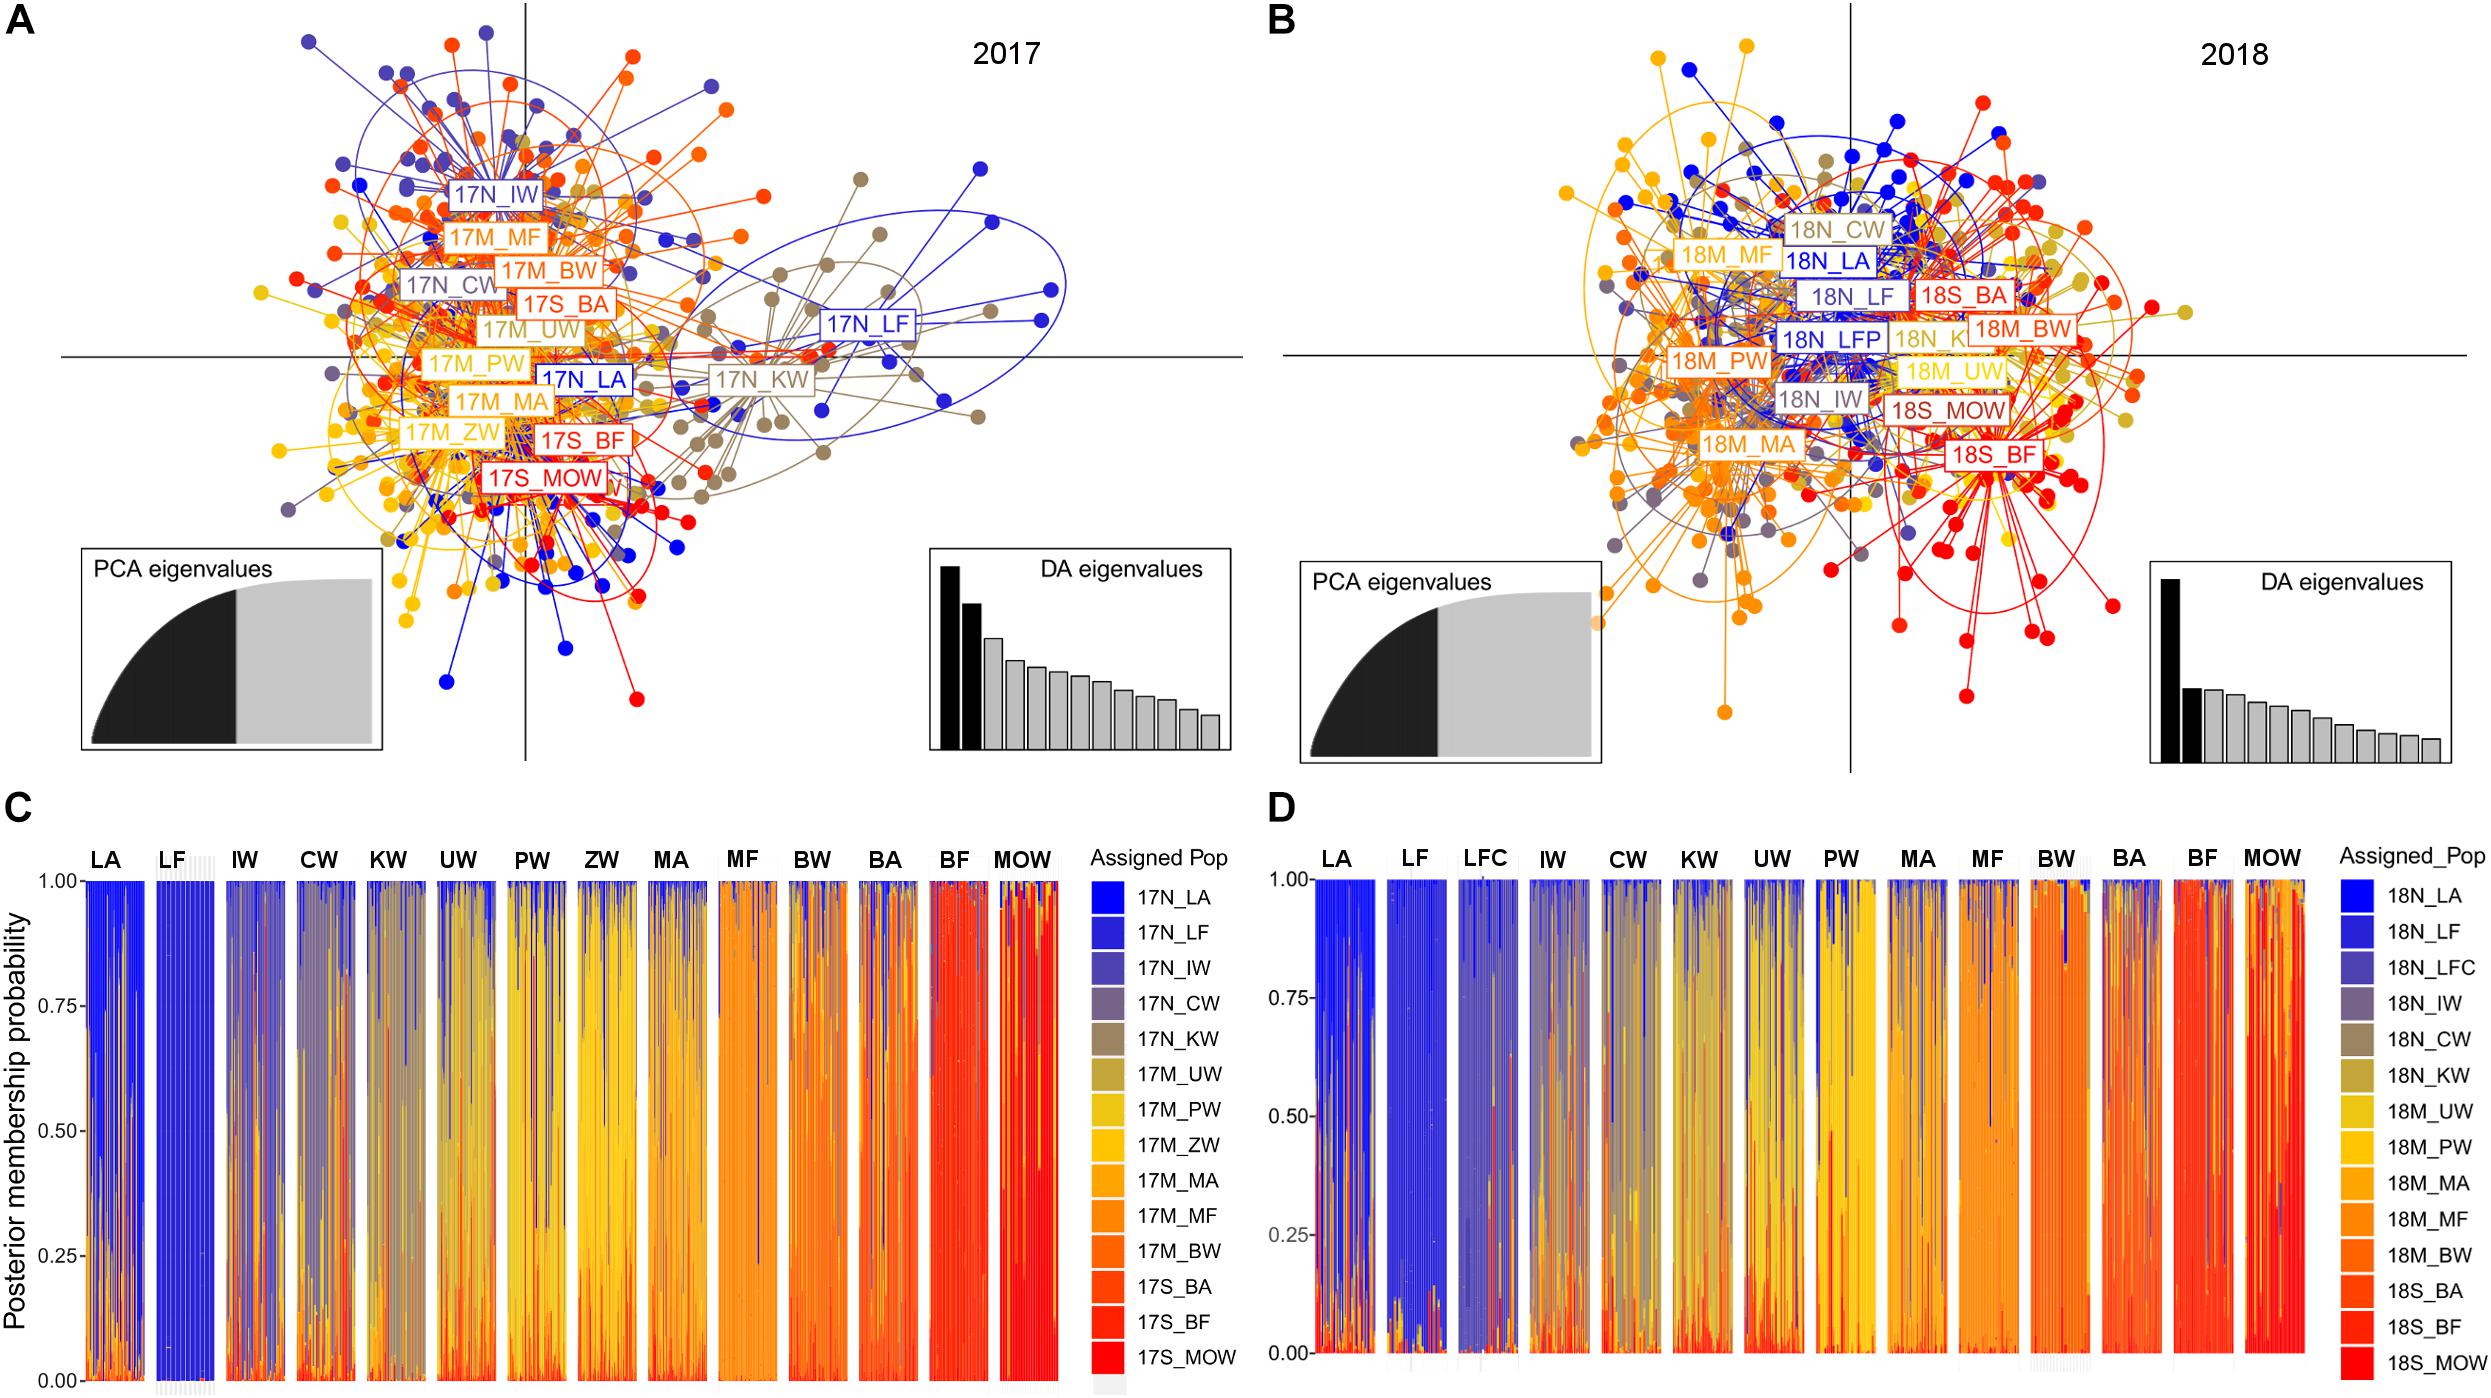
Figure 3. (A,B) Scatterplot of the final Discriminant Analysis of Principal Components (DAPC) model with sampling locality as a prior, where points are individual genotypes, color-coded by their original sampling locality and surrounded by a 95% confidence ellipse. DA and PCA Eigenvalues represent the amount of genetic variation captured by the analysis for 2017 and 2018. (C,D) Membership plot showing the posterior probability assignment of individuals against their original populations.
Discussion
Human-mediated translocation of wild or hatchery-born O. edulis from one location to another, for the purpose of restoration of stocks depleted by intense exploitation and/or outbreak of disease, has been increasingly used in recent decades as a conservation management strategy for endangered species (Seddon et al., 2014; Bromley, 2015). As an ecosystem engineer, O. edulis builds biogenic reefs and as such plays a key ecological role for the enhancement of biodiversity and ecosystem services in the marine environment (Gutiérrez et al., 2011; Pogoda et al., 2019). On the other hand, translocation of wild individuals from one location to another for commercial and farming purposes has rarely been studied in detail, even though millions of O. edulis have been translocated over the past 200 years (Bromley et al., 2016). Such actions may induce an increase of genetic diversity in recipient populations by mixing genetically divergent populations, and may reduce genetic divergence among geographically distant populations, as already seen in case of the black-lipped pearl oyster in French Polynesia (Lemer and Planes, 2012). In Croatian waters, translocations of juvenile oysters for farming purposes are common. Thus, in the present study, 12 neutral microsatellites loci were used to explore geographically fine-scale population processes of species during two consecutive years, to gain a deeper understanding of the factors shaping genetic connectivity, and to evaluate the impact of seed translocation among regions, by comparing 1178 sampled individuals grouped by origin (wild vs. farmed vs. farmed-associated) and sampling region (north vs. middle vs. south). To the best of our knowledge, this is the first systematic description of genetic diversity and structure of the European flat oyster O. edulis, an ecologically and commercially important European bivalve, from the waters of the eastern Adriatic Sea.
Several main findings were outlined in this study. First, we observed a high level of diversity indices (Ar > 20, He > 0.88) in the dataset with the presence of slight inter-annual and inter-populations variation. This corroborated previous reports from the Adriatic and other Mediterranean regions (Launey et al., 2002; Diaz-Almela et al., 2004), even though those studies employed only several of the microsatellite markers used in this study. In addition, observed diversity levels support the findings of significantly higher diversities in flat oyster Mediterranean populations in comparison to Atlantic ones (Diaz-Almela et al., 2004; Vera et al., 2016). This can be linked with: (i) a more favorable temporal window for successful reproduction and consequently a lower variance in effective sizes in the Mediterranean (Launey et al., 2002), and (ii) the absence of oyster parasites in the eastern Adriatic which were responsible for dramatic stock declines in the waters of north Europe in the late 1960s and 1970s (Culloty and Mulcahy, 2007; Berghahn and Ruth, 2015).
While allele richness and expected heterozygosity values showed small temporal and spatial variations within the sampled Adriatic populations, observed heterozygosity was significantly reduced in farm-associated populations in comparison to others, affecting the HWE. Heterozygote deficiencies relative to HWE seem to be a common observation in marine bivalve populations (Huvet et al., 2000; Launey et al., 2002), mainly due to the high frequency of null alleles generated by the extremely high level of polymorphism in the flanking regions targeted by PCR primers (Hedgecock et al., 2004). In this study, several loci were identified as having null alleles, though at relatively low frequencies (<5%). Still, affected loci with heterozygote deficiencies were not consistently recorded in all sampled populations but were more frequently observed in farm-associated populations, explaining the significant multilocus FIS estimates in all abovementioned populations. In addition, all three farm-associated populations, sampled from different geographical regions along the coast (north, middle and south) and in bays where oyster culture has a long tradition and suitable environmental conditions, showed to have contemporaneous Ne estimates significantly smaller than in other wild or farmed groups for both sampling years. The observed differences in Ne between the farmed and farm-associated population at such small scale, within the same bay, were surprising.
Settlement preferences of O. edulis larvae and population densities was put forward as a plausible explanation for the observed differences. Namely, the availability of a suitable settlement environment is considered a key driver for the successful recruitment of oyster populations (Möbius, 1877; Korringa, 1946; Low et al., 2007; Smyth et al., 2018) that models the larval connectivity between beds where larvae can delay metamorphosis if suitable settlement cues are absent (Cole and Jones, 1939; Coon et al., 1990). A recent study examined the chemical cues for successful settlement, indicating that most effective settlement cue originates from conspecifics, not the substrate material itself (Rodriguez-Perez et al., 2019). In addition, increased fertilization success has been recently linked with high population densities, where oysters with a nearest neighbor ≤1.5 m were found to brood significantly more larvae than individuals with nearest neighbors ≥1.5 m (Guy et al., 2019). Since the concentrated chemical release of adult conspecifics is the driver for dense gregarious localized settlements (Tamburri et al., 2008), it can be argued that during spawning season, oyster farms with a high density of mature oysters per square meter, produce and attract O. edulis larvae more successfully than the adjacent wild populations that are scattered at low densities along the bays (<1 oyster/m2, Stagličić et al., 2019). Such an attraction bias was further confirmed by the slightly greater pairwise relatedness observed between farmed and wild populations compared to the farmed and impacted populations (2.7% vs. 2.6%). In the long term, spat settlement disturbance by oyster farms may seriously compromise the viability of surrounding populations, considering that: (i) with increased farming capacities and oyster densities, the fertilization success rate and concertation of chemical cues mediating successful settlement will shift in favour of farming sites, and (ii) with continued illegal harvest of wild oysters from special marine reserves put under protection due to tradition of oyster farming (i.e., Lim and Mali Ston Bays), successful fertilization and settlement may be dramatically reduced without a robust oyster population of sufficient density scale, which may eventually result in population extinction in specific areas. This is contrary to the findings in impacted populations of the black-lipped pearl oyster aquaculture, where the pearl culture promoted transmission of farmed heterogeneity to adjacent wild populations as a result of interbreeding (Lemer and Planes, 2012). In that study, adjacent wild populations tended to have higher genetic diversity values and greater pairwise relatedness coefficient with farmed populations than wild populations, contrary to our findings here. Such differences could arise from the species-specific reproduction and applied culture strategies. While the 2-year culture practice of flat oysters in Croatian waters enables species to spawn only once in the second farming year, the culture cycle of 3–6 years for pearl oysters enables multiple spawning events, starting at an average age of 2 years (Zhu et al., 2019), allowing farmed individuals more opportunity to reproduce with adjacent populations (Lemer and Planes, 2012). Additionally, O. edulis as brooding or partial broadcast spawners have a limited dispersal time, with larvae of relatively short planktonic phase (about 2 weeks), and therefore tend to be more aggregated around the parent population (Guy et al., 2019). On the contrary, species with a longer planktonic juvenile stage, such as Pinctada margaritifera (up to 4 weeks), are more prone to settling diffusely apart from the parent population due to the effect of broadcast spawning events, larval swimming time, wind and current forcing (Thomas et al., 2014). Still, these farmed-wild oyster interactions in the Adriatic Sea require further attention, since the strong bias in reproductive success, skewed sex ratio and naturally variable recruitment patterns may reduce the effective population sizes and increase inbreeding values (Hedgecock et al., 2007; Lallias et al., 2010b), affecting the abovementioned conclusions.
Molecular signatures of the occurrence of effective size reduction in the Adriatic populations of O. edulis were captured for some populations, with varying results among the heterozygosity-excess and the M-ratio tests. Significant heterozygote excess in the wild populations from the northern Adriatic region and in all farm-associated populations was detected under the TPM mutation model, potentially corresponding to a bottleneck signal. Furthermore, for all populations of O. edulis, M ratios were far below the diagnostic value for genetic bottlenecks (0.70; Garza and Williamson, 2001). These results should be interpreted with caution, considering that high reproductive variance is typically observed in bivalves, and the interannual variance of effective population sizes in this dataset increases the rate of false positives in both bottleneck detection tests (Hoban et al., 2013). Still, demographic changes recorded in the northern Adriatic might carry alarming signals that should not be overlooked. Namely, high density flat oyster stock from deeper waters (20–40 m) in the northern Adriatic has been harvested intensively by bream trawls, where the average biomass index per trawl was 780 kg/km2 in 2013 and 2014. Such large-scale removal of commercially marketable oysters led to the significant depletion of catches, resulting in a harvest of only 76 kg/km2 in 2017 (Ezgeta-Balić et al., 2017). It may be that the continuous harvest of fecund broodstock in recent years increased the inter-individual distance and consequently fertilization success, while also reducing spawner production of the chemical signals that mediate successful larval settlement. The detrimental impact of intense harvesting on O. edulis beds throughout Europe is well documented (Hiscock et al., 2013; Thurstan et al., 2013; Smyth et al., 2016), while successful restoration of self-sustained populations is extremely difficult unless sites are closed and properly managed (Beck et al., 2011; Selkoe et al., 2015).
The low global genetic differentiation of flat oyster in the Adriatic Sea (FST = 0.0082) was similar to levels previously documented using polymorphic SNPs (FST = 0.0061; Vera et al., 2019) and 16 microsatellite loci (FST = 0.0079; Vera et al., 2016) on a broad sample collected from the Atlantic area. When populations from the Mediterranean and Atlantic regions were analyzed together using five microsatellite loci, inter-population differentiation was found to be slightly increased (FST = 0.019) and followed the isolation by distance pattern, separating populations according to geographic origin (Launey et al., 2002). The continuous cline of genetic differentiation, with slope varying among sampling years, and a lack of strong genetic structure was observed in the present study. It seems that the present culture practise and ongoing spat translocation promotes genetic heterogeneity in the investigated farms, considering that the main source of genetic differentiation in the dataset was measured in farmed populations (FST = 0.012) in contrast to wild (FST = 0.008) and farmed-associated (FST = 0.005) populations. Posterior membership assignment plots confirmed strong assignment of farmed populations to their sampling site origin (82–86%). Taking into account the reduced diversities and effective sizes of farm-associated populations, it can be hypothesized that unidirectional gene flow from impacted toward farmed populations promoted the absence of genetic differentiation within the farming sites, with the exaction of farmed vs. farm-associated populations from the Lim Bay in 2017. While the level of genetic differentiation greatly depends on spatial variations in population sizes (Prunier et al., 2017) where neutral and selective mechanisms can influence the adaptive potential in farm-associated populations, present study relies on a relatively small number of molecular markers that may limits the statistical probability of detecting heterogeneous patterns of introgression among markers (Putman and Carbone, 2014, and references therein). Namely, selection-driven introgression might affect relatively few markers (Fitzpatrick et al., 2010) and thus use of a dense genome-wide set of single-nucleotide polymorphism (SNP) markers is recommended for allocation of chromosomal regions under selection and detection of introgressed alleles that may be rapidly spread across native populations (Fitzpatrick et al., 2010). These functional genetic markers can reveal important processes of local adaptation among populations that may not be evident based solely on neutral genetic markers, as in case for the Lessepsian migrant Fistularia commersoni or for the estuarine fish Fundulus heteroclitus where several of the genes identified as having FST outliers were related to disease resistance, osmoregulation and thermal tolerance (Bernardi et al., 2016; Dayan et al., 2019). Additionally, human-induced environmental shifts tend to be linked with rapid polygenic adaptation that makes it difficult to identify relevant adaptive alleles (Dayan et al., 2019). Still, when population genetic distributions were analyzed in accordance to geographic coordinates by sPCA, two levels of spatial gene flow discontinuity were observed within the basin. The first level, i.e., segregation of the north from the middle and south populations in both years, presents a pattern of genetic differentiation linked with local oceanographic features. The Adriatic is characterized by a large-scale cyclonic meander, with a northerly flow from the Ionian Sea along the eastern coast and a southerly return flow along the western coast (Orlić et al., 1992), with three cyclonic gyres subdividing the basin into three regions (North, Middle and South) in line with our regional population grouping.
While the boundary between the Middle and South Adriatic basins is an area of genetic discontinuity for several marine organisms (Schiavina et al., 2014; Matić-Skoko et al., 2018; Paterno et al., 2019), in the current study the limit between the North and Middle Adriatic basins, located north of the Jabuka Pit, proved to be the main boundary for O. edulis populations. The north cyclonic gyre enables high larval retention and promotes homogenization within the region (Artegiani et al., 1997). The second level, which is less representative in both variance and spatial autocorrelation, recognized the weaker gene barrier between the Middle and South Adriatic basins, located north of the South Adriatic Pit. Additionally, weak grouping of the Istria populations in the north Adriatic with southern populations in 2017, and additional grouping with populations from the middle Adriatic in 2018, may represent connectivity associated with spat translocation, which has been occurring between these regions for several years.
In conclusion, human activities associated with oyster culture, stock transfer and overfishing in the eastern Adriatic have significantly mediated the demographic and genetic characteristics of wild populations, especially those associated with aquaculture sites. Several implications were derived from the spatial robust dataset, i.e., reduced heterozygosity and effective size levels of farmed impacted beds, recent bottleneck signatures and decreased census sizes of wild populations. Thus, the first step toward sustainable shellfish aquaculture is to enable suitable substrate for successful larval recruitment in reinforcement sites where O. edulis is still present, but at very low densities, such as farm-impacted sites in marine protected areas in Croatia. Since oyster farming and translocation may pose an environmental risk due to the genetic erosion of wild counterparts and spread of disease, the polluter-pays principle that has been suggested for finfish mariculture should be implemented in the national legislation. A further suggestion is that the annual donation of fertile oysters and their deposition to coastal banks of farm surroundings should be an obligation for each farmer, aimed at retaining high population densities, high fertilization success and settlement of wild populations.
Data Availability Statement
The full dataset of genotypes for this study can be found in the GenoBase of Institute of Oceanography and Fisheries (http://jadran.izor.hr/~tsegvic/aquapop/GenoBase.html) and is available from the corresponding authors on reasonable request.
Author Contributions
TŠ-B conceived of the study. IŽ, IT, LG, and NS conducted the sampling. TŠ-B, IŽ, IL, LŽ, and NU conducted the molecular and data analysis. TŠ-B, IT, IL, and LŽ wrote and revised the manuscript. TŠ-B and LG obtained funding for the work.
Funding
This study was fully supported by the Croatian Science Foundation under project number IP-2014-09-9050.
Conflict of Interest
The authors declare that the research was conducted in the absence of any commercial or financial relationships that could be construed as a potential conflict of interest.
Acknowledgments
The authors are grateful to local farmers for assistance with sample collection.
Supplementary Material
The Supplementary Material for this article can be found online at: https://www.frontiersin.org/articles/10.3389/fmars.2020.00084/full#supplementary-material
Footnotes
References
Airoldi, L., and Beck, M. W. (2007). Loss, status and trends for coastal marine habitats of Europe. Oceanogr. Mar. Biol. 45, 357–405.
Artegiani, A., Bregant, D., Paschini, E., Pinardi, N., Raicich, F., and Russo, A. (1997). The Adriatic Sea general circulation. 2. baroclinic circulation structure. J. Phys. Oceanogr. 27, 1515–1532. doi: 10.1016/j.marpolbul.2019.01.014
Beck, M., Brumbaugh, D. R., Airoldi, L., Carranza, A., Coen, L. D., Crawford, C., et al. (2011). Oyster reefs at risk and recommendations for conservation, restoration, and management. Bioscience 61, 107–116. doi: 10.1525/bio.2011.61.2.5
Berghahn, R., and Ruth, M. (2015). The disappearance of oysters from the Wadden Sea: a cautionary tale for no-take zones. Aquat. Conserv. Mar. Freshw. Ecosyst. 15, 91–104. doi: 10.1002/aqc.635
Bernardi, G., Azzurro, E., Golani, D., and Miller, M. R. (2016). Genomic signatures of rapid adaptive evolution in the Bluespotted cornetfish, a mediterranean lessepsian invader. Mol. Ecol. 25, 3384–3396. doi: 10.1111/mec.13682
Brenner, M., Fraser, D., Van Nieuwenhove, K., O’Beirn, F., Buck, B. H., Mazurie, J., et al. (2014). Bivalve aquaculture transfers in Atlantic Europe. Part B environmental impacts of transfer activities. Ocean Coast. Manag. 89, 139–146. doi: 10.1186/s12711-018-0376-z
Bromley, C., McGonigleb, C., Ashtona, E. C., and Roberts, D. (2016). Bad moves: pros and cons of moving oysters e a case study of global translocations of Ostrea edulis linnaeus, 1758 (Mollusca: Bivalvia). Ocean Coast. Manag. 122, 103–115. doi: 10.1016/j.ocecoaman.2015.12.012
Bromley, C. A. (2015). Science-Based Management Strategies for the Commercial and Environmental Sustainability of the European Oyster, Ostrea edulis L. Ph.D. thesis, The Queen’s University of Belfast, Belfast, IL. doi: 10.1016/j.ocecoaman.2015.12.012
Caceres-Martinez, J., and Figueras, A. (1997). “The mussel, oyster, clam and pectinid fisheries of Spain,” in The History, Present Condition, and Future of the Molluscan Fisheries of North and Central America and Europe: Volume 3, Europe, eds C. L. MacKenzie, V. G. Burrell, A. Rosenfield, and W. L. Hobart, (Seattle, FL: NOAA), 165–190.
Carnegie, R. B., and Barber, B. J. (2001). Growth and mortality of Ostrea edulis at two sites on the damariscotta river estuary. Maine, USA. J. World. Aquac. Soc. 32, 222–227.
Chapuis, M. P., and Estoup, A. (2007). Microsatellite null alleles and estimation of population differentiation. Mol. Biol. Evol. 24, 621–631. doi: 10.1093/molbev/msl191
Cole, H. A., and Jones, E. W. K. (1939). Some observations and experiments on the setting behaviour of larvae of Ostrea edulis. ICES J. Mar. Sci. 14, 86–105. doi: 10.1093/icesjms/14.1.86
Coon, S. L., Fitt, W. K., and Bonar, D. B. (1990). Competence and delay of metamorphosis in the Pacific oyster Crassostrea gigas. Mar. Biol. 106, 379–387.
Culloty, S. C., Cronin, M. A., and Mulcahy, M. F. (2004). Potential resistance of a number of populations of the oyster Ostrea edulis to the parasite Bonamia ostreae. Aquaculture 237, 41–58. doi: 10.1016/j.aquaculture.2004.04.007
Culloty, S. C., and Mulcahy, M. F. (2007). Bonamia ostreae in the native oyster Ostrea edulis - a review. Mar. Environ. Health Ser. 29, 1–36.
Dayan, D. I., Du, X., Baris, T. Z., Wagner, D. N., Crawford, D. L., and Oleksiak, M. F. (2019). Population genomics of rapid evolution in natural populations: polygenic selection in response to power station thermal effluents. BMC Evol. Biol. 19:61. doi: 10.1186/s12862-019-1392-5
Diaz-Almela, E., Boudry, P., Launey, S., Bonhomme, F., and Lapegue, S. (2004). Reduced female gene flow in the European flat oyster Ostrea edulis. J. Hered. 95, 510–516. doi: 10.1093/jhered/esh073
Do, C., Waples, R. S., Peel, D., Macbeth, G. M., Tillett, B. J., and Ovenden, J. R. (2014). NeEstimator v2: re-implementation of software for the estimation of contemporary effective population size (Ne) from genetic data. Mol. Ecol. Resour. 14, 209–214. doi: 10.1111/1755-0998.12157
Edwards, E. (1997). “Molluscan fisheries in Britain,” in The History, Present Condition, and Future of the Molluscan Fisheries of North and Central America and Europe: Volume 3, Europe, eds C. L. MacKenzie, V. G. Burrell, A. Rosenfield, and W. L. Hobart, (Seattle, FL: NOAA), 85–99.
Excoffier, L., Laval, G., and Schneider, S. (2005). Arlequin (version 3.0): an integrated software package for population genetics data analysis. Evol. Bioinform. 1, 47–50.
Ezgeta-Balić, D., Vrgoč, N., Isajlović, I., Despalatović, M., Cvitković, I., Medvešek, D., et al. (2017). Pilot Study on the Catch and by-Catch of Beam Trawl Fisheries – Scientific Base for the Derogation. Goa: Institute of Oceanography and Fisheries.
Fitzpatrick, B. M., Johnson, J. R., Kump, D. K., Smith, J. J., Voss, S. R., and Shaffer, H. B. (2010). Rapid spread of invasive genes into a threatened native species. Proc. Natl. Acad. Sci. U.S.A. 107, 3606–3610. doi: 10.1073/pnas.0911802107
Garza, J. C., and Williamson, E. G. (2001). Detection of reduction in population size using data from microsatellite loci. Mol. Ecol. 10, 305–318. doi: 10.1046/j.1365-294x.2001.01190.x
Goudet, J. (2002). FSTAT, A Program to Estimate And Test Gene Diversities And Fixation Indices (Version 2.9.3.2). Available at: https://www2.unil.ch/popgen/softwares/fstat.htm (accessed July 01, 2019).
Goulletquer, P., and Heral, M. (1997). “Marine molluscan production trends in France: from fisheries to aquaculture,” in The History, Present Condition, and Future of the Molluscan Fisheries of North and Central America and Europe: Volume 3, Europe, eds C. L. MacKenzie, V. G. Burrell, A. Rosenfield, and W. L. Hobart, (Seattle, FL: NOAA), 137–164.
Gravestock, V., James, F., and Goulden, M. (2014). Solent Native Oyster (Ostrea edulis) Restoration - Literature Review and Feasibility Study. Lymington: Mac Alister Elliott and Partners.
Gutiérrez, J. L., Jones, C. G., Byers, J. E., Arkema, K. K., Berkenbusch, K., Commito, J. A., et al. (2011). “Physical ecosystem engineers and the functioning of estuaries and coasts,” in Treatise on Estuarine and Coastal Science, eds E. Wolanski and D. S. McLusky, (Waltham: Academic Press), 53–81. doi: 10.1016/b978-0-12-374711-2.00705-1
Guy, C., Smyth, D., and Roberts, D. (2019). The importance of population density and inter-individual distance in conserving the European oyster Ostrea edulis. J. Mar. Biolog. Assoc. U.K. 99, 587–593. doi: 10.1017/s0025315418000395
Harding, S., Nelson, L., and Glover, T. (2016). Solent Oyster Restoration Project Management Plan. London: Blue Marine Foundation (BLUE).
Hedgecock, D., Launey, S., Pudovkin, A. I., Naciri, Y., Lapegue, S., and Bonhomme, F. (2007). Small effective number of parents (N b) inferred for a naturally spawned cohort of juvenile European flat oysters Ostrea edulis. Mar. Biol. 150, 1173–1182. doi: 10.1007/s00227-006-0441-y
Hedgecock, D., Li, G., Hubert, S., Bucklin, K., and Ribes, V. (2004). Wide spread null alleles and poor cross-species amplification of microsatellite DNA loci cloned from the Pacific oyster. Crassostrea gigas. J. Shellfish Res. 23, 379–385.
Hiscock, K., Bayley, D., Pade, N., Lacey, C., Cox, E., and Enever, R. (2013). Prioritizing action for recovery and conservation of marine species: a case study based on species of conservation importance around England. Aquat. Conserv. Mar. Freshw. Ecosyst. 23, 88–110. doi: 10.1002/aqc.2283
Hoban, S. M., Mezzavilla, M., Gaggiotti, O. E., Benazzo, A., Van Oosterhout, C., and Bertorelle, G. (2013). High variance in reproductive success generates a false signature of a genetic bottleneck in populations of constant size: a simulation study. BMC Bioinform. 14:309. doi: 10.1186/1471-2105-14-309
Horváth, A., Kuzman, A., Bubalo, A., Bartulović, V., Patakiné Várkonyi, E., Urbányi, B., et al. (2013). Karyological study reveals a putatively distinctive population of the european flat oyster (Ostrea edulis) in Mali Ston Bay, Croatia. Acta Adriat. 54, 111–116.
Huserbraten, M. B. O., Moland, E., Knutsen, H., Olsen, E. M., André, C., and Stenseth, N. C. (2013). Conservation, spillover and gene flow within a network of Northern European marine protected areas. PLoS One 8:e73388. doi: 10.1371/journal.pone.0073388
Huvet, A., Lapégue, S., Magoulas, A., and Boudry, P. (2000). Mitochondrial and nuclear DNA phylogeography of Crassostrea angulata, the Portuguese oyster endangered in Europe. Conserv. Genet. 1, 251–262.
Johnson, M. S. (2000). Measuring and interpreting genetic structure to minimize the genetic risks of translocations. Aquac. Res. 31, 133–143. doi: 10.1046/j.1365-2109.2000.00396.x
Jombart, T. (2008). Adegenet: a R package for the multivariate analysis of genetic markers. Bioinformatics 24, 1403–1405. doi: 10.1093/bioinformatics/btn129
Jombart, T., and Ahmed, I. (2011). adegenet 1.3-1: new tools for the analysis of genome-wide SNP data. Bioinformatics 27, 3070–3071. doi: 10.1093/bioinformatics/btr521
Jombart, T., Devillard, S., and Balloux, F. (2010). Discriminant analysis of principal components: a new method for the analysis of genetically structured populations. BMC Genet. 11:94. doi: 10.1186/1471-2156-11-94
Jombart, T., Devillard, S., Dufour, A. B., and Pontier, D. (2008). Revealing cryptic spatial patterns in genetic variability by a new multivariate method. Heredity 101, 92–103. doi: 10.1038/hdy.2008.34
Jost, L. (2008). GST and its relatives do not measure differentiation. Mol. Ecol. 17, 4015–4026. doi: 10.1111/j.1365-294x.2008.03887.x
Laing, I., Walker, P., and Areal, F. (2005). A Feasibility Study of Native Oyster (Ostrea edulis) Stock Regeneration in the United Kingdom. Lowestoft: The Centre for Environment, Fisheries and Aquaculture Science.
Lallias, D., Boudry, P., Lapegue, S., King, J. W., and Beaumont, A. R. (2010a). Strategies for the retention of high genetic variability in European flat oyster (Ostrea edulis) restoration programmes. Conserv. Genet. 11, 1899–1910. doi: 10.1007/s10592-010-0081-0
Lallias, D., Stockdale, R., Boudry, P., Beaumont, A. R., and Lapégue, S. (2009). Characterization of 27 microsatellite loci in the European flat oyster Ostrea edulis. Mol. Ecol. Resour. 9, 960–963. doi: 10.1111/j.1755-0998.2009.02515.x
Lallias, D., Taris, N., Boudry, P., Bonhomme, F., and Lapčgue, S. (2010b). Variance in the reproductive success of flat oyster Ostrea edulis L. assessed by parentage analyses in natural and experimental conditions. Genet. Res. 92, 175–187. doi: 10.1017/S0016672310000248
Launey, S., Ledu, C., Boudry, P., Bonhomme, F., and Naciri-Graven, Y. (2002). Geographic structure in the European flat oyster (Ostrea edulis L.) as revealed by microsatellite polymorphism. J. Hered. 93, 331–351. doi: 10.1093/jhered/93.5.331
Lemer, S., and Planes, S. (2012). Translocation of wild populations: conservation implications for the genetic diversity of the black-lipped pearl oyster Pinctada margaritifera. Mol. Ecol. 21, 2949–2962. doi: 10.1111/j.1365-294X.2012.05588.x
Low, P. J., Moore, G., Smith, I. P., and Hannah, F. (2007). Conservation of the native oyster Ostrea edulis in Scotland. Commun. Rep 25, 27–48.
Matić-Skoko, S., Šegvić–Bubić, T., Mandić, I., Izquierdo-Gomez, D., Arneri, E., Carbonara, P., et al. (2018). Evidence of subtle genetic structure in the sympatric species Mullus barbatus and Mullus surmuletus (Linnaeus, 1758) in the Mediterranean Sea. Sci. Rep. 8:676. doi: 10.1038/s41598-017-18503-7
Meirmans, P. G., and Van Tienderen, P. H. (2004). GENOTYPE and GENODIVE: two programs for the analysis of genetic diversity of asexual organisms. Mol. Ecol. Notes 4, 792–794. doi: 10.1111/j.1471-8286.2004.00770.x
Naciri-Graven, Y., Launey, S., Lebayon, N., Gerard, A., and Baud, J. P. (2000). Influence of parentage upon growth in Ostrea edulis: evidence for inbreeding depression. Genet. Res. 76, 159–168. doi: 10.1017/s0016672300004663
Orlić, M., Gačić, M., and La Violette, P. E. (1992). The currents and circulation of the Adriatic Sea. Oceanol. Acta 15, 109–124.
Paterno, M., Bat, L., Souissi, J. B., Boscari, E., Chassanite, A., Congiu, L., et al. (2019). A Genome-wide approach to the phylogeography of the mussel Mytilus galloprovincialis in the adriatic and the Black Seas. Front. Mar. Sci. 6:566. doi: 10.3389/fmars.2019.00566
Pineda, J., Reyns, N. B., and Starczak, V. R. (2009). Complexity and simplification in understanding recruitment in benthic populations. Popul. Ecol. 51, 17–32. doi: 10.1007/s10144-008-0118-0
Piry, S., Luikart, G., and Cornuet, J. M. (1990). Computer note. Bottleneck: a computer program for detecting recent reductions in the effective site using allele frequency data. Heredity 90, 502–503. doi: 10.1093/jhered/90.4.502
Pogoda, B., Brown, J., Hancock, B., Preston, J., Pouvreau, S., Kamermans, P., et al. (2019). The native oyster restoration alliance (NORA) and the berlin oyster recommendation: bringing back a key ecosystem engineer by developing and supporting best practice in Europe. Aquat. Living Resour. 32:13. doi: 10.1051/alr/2019012
Prunier, J. G., Dubut, V., Chikhi, L., and Blanchet, S. (2017). Contribution of spatial heterogeneity in effective population sizes to the variance in pairwise measures of genetic differentiation. Methods Ecol. Evol. 8, 1866–1877. doi: 10.1111/2041-210x.12820
Putman, A. I., and Carbone, I. (2014). Challenges in analysis and interpretation of microsatellite data for population genetic studies. Ecol. Evol. 4, 4399–4428. doi: 10.1002/ece3.1305
Reiss, H., Hoarau, G., Dickey-Collas, M., and Wolff, W. J. (2009). Genetic population structure of marine fish: mismatch between biological and fisheries management units. Fish Fish. 10, 361–395. doi: 10.1111/j.1467-2979.2008.00324.x
Rice, W. R. (1989). Analyzing tables of statistical tests. Evolution 43, 223–225. doi: 10.1111/j.1558-5646.1989.tb04220.x
Rodriguez-Perez, A., James, M., Donnan, D. W., Henry, T. B., Møller, L. F., and Sanderson, W. G. (2019). Conservation and restoration of a keystone species: understanding the settlement preferences of the European oyster (Ostrea edulis). Mar. Pollut. Bull. 138, 312–321. doi: 10.1016/j.marpolbul.2018.11.032
Rousset, F. (2008). genepop‘007: a complete re-implementation of the genepop software for Windows and Linux. Mol. Ecol. Resour. 8, 103–106. doi: 10.1111/j.1471-8286.2007.01931.x
Ryman, N., and Palm, S. (2006). POWSIM: a computer program for assessing statistical power when testing for genetic differentiation. Mol. Ecol. Notes 6, 600–602. doi: 10.1111/j.1471-8286.2006.01378.x
Saavedra, C., Zapata, C., and Alvarez, G. (1995). Geographical patterns of variability at allozyme loci in the European oyster Ostrea edulis. Mar. Biol. 122, 95–104. doi: 10.1007/bf00349282
Sa-Pinto, A., Branco, M. S., Alexandrino, P. B., Fontaine, M. C., and Baird, S. J. (2012). Barriers to gene flow in the marine environment: insights from two common intertidal limpet species of the Atlantic and Mediterranean. PLoS One 7:e50330. doi: 10.1371/journal.pone.0050330
Schiavina, M., Marino, I. A. M., Zane, L., and Melià, P. A. C. O. (2014). Matching oceanography and genetics at the basin scale. Seascape connectivity of the Mediterranean shore crab in the Adriatic Sea. Mol. Ecol. 23, 5496–5507. doi: 10.1111/mec.12956
Seddon, P. J., Moehrenschlager, A., and Ewen, J. (2014). Reintroducing resurrected species: selecting deextinction candidates. Trends Ecol. Evol. 29, 140–147. doi: 10.1016/j.tree.2014.01.007
Šegvić-Bubić, T., Grubišić, L., Karaman, N., Tičina, V., Mišlov Jelavić, K., and Katavić, I. (2011). Damages on mussel farms potentially caused by fish predation – Self service on the ropes? Aquaculture 319, 497–504. doi: 10.1016/j.aquaculture.2011.07.031
Šegvić–Bubić, T., Grubišić, L., Zrnčić, S., Jozić, S., Žužul, I., and Talijančić, I. (2016). Range expansion of the non-native oyster Crassostrea gigas in the Adriatic Sea. Acta Adriat. 57, 321–330.
Selkoe, K. A., Blenckner, T., Caldwell, M. R., Crowder, L. B., Erickson, A. L., Essington, T. E., et al. (2015). Principles for managing marine ecosystems prone to tipping points. Ecosyst. Health Sustain. 1, 17–24.
Shelmerdine, R. L., and Leslie, B. (2009). Restocking of the Native Oyster, Ostrea Edulis, In Shetland: Habitat Identification Study. Scottish Natural Heritage Commissioned Report No. 396. Inverness: Scottish Natural Heritage.
Smaal, A. C., Kamermans, P., van der Have, T. M., Engelsma, M., and Sas, H. J. W. (2015). Feasibility of Flat Oyster (Ostrea edulis L.) Restoration in the Dutch Part of the North Sea. Wageningen UR: IMARES.
Smyth, D., Kregting, L., Elsäßer, B., Kennedy, R., and Roberts, D. (2016). Using particle dispersal models to assist in the conservation and recovery of the overexploited native oyster (Ostrea edulis) in an enclosed sea lough. J. Sea Res. 108, 50–59. doi: 10.1016/j.seares.2015.12.009
Smyth, D., Mahon, A. M., Roberts, D., and Kregting, L. (2018). Settlement of Ostrea edulis is determined by the availability of hard substrata rather than by its nature: implications for stock recovery and restoration of the European oyster. Aquat. Conserv. Mar. Freshw. Ecosyst. 28, 1–10.
Stagličić, N., Šegvić-Bubić, T., Ezgeta-Balić, D., Bojanić Varezić, D., Grubišić, L., Žuvić, L., et al. (2019). Distribution patterns of two co-existing oyster species in northern Adriatic Sea: the native European flat oyster Ostrea edulis and non-native Pacific oyster Magallana gigas. Ecol. Indic. [in press].
Tamburri, M. N., Luckenbach, M. W., Breitburg, D. L., and Bonniwell, S. M. (2008). Settlement of Crassostrea ariakensis larvae: effects of substrate, biofilms, sediment, and adult chemicalcues. J. Shellfish Res. 27, 601–608. doi: 10.2983/0730-8000(2008)27%5B601:socale%5D2.0.co;2
Taris, N., Boundry, P., Bonhomme, F., Camara, M. D., and Lepčgue, S. (2008). Mitochondrial and nuclear DNA analysis of genetic heterogeneity among recruitment cohorts of the European flat oyster Ostrea edulis. Biol. Bull. 217, 233–241. doi: 10.1086/bblv217n3p233
Thomas, Y., Dumas, F., and Andréfouët, S. (2014). Larval dispersal modeling of Pearl Oyster Pinctada margaritifera following realistic environmental and biological forcing in ahe atoll lagoon. PLoS One 9:e95050. doi: 10.1371/journal.pone.0095050
Thurstan, R. H., Hawkins, J. P., and Roberts, C. M. (2013). Oyster (Ostrea edulis) extirpation and ecosystem transformation in the firth of forth, Scotland. J. Nat. Conserv. 21, 253–261. doi: 10.1016/j.jnc.2013.01.004
Van Oosterhout, C., Hutchinson, W. F., Wilis, D. P. M., and Shipley, P. (2004). MICRO-CHECKER: software for identifying and correcting genotyping errors in microsatellite data. Mol. Ecol. Notes 4, 535–538. doi: 10.1111/j.1471-8286.2004.00684.x
Vera, M., Bello, X., Álvarez-Dios, J. A., Pardo, B., Sánchez, L., Carlsson, J., et al. (2015). Screening of repetitive motifs inside the genome of the flat oyster (Ostrea edulis): transposable elements and short tandem repeats. Mar. Genom. 24, 335–341. doi: 10.1016/j.margen.2015.08.006
Vera, M., Carlsson, J., Carlsson, J. E. L., Cross, T., Lynch, S., Kamermans, P., et al. (2016). Current genetic status, temporal stability and structure of the remnant wild European flat oyster populations: conservation and restoring implications. Mar. Biol. 163:239.
Vera, M., Pardo, B. G., Cao, A., Vilas, R., Fernandez, C., Blanco, A., et al. (2019). Signatures of selection for bonamiosis resistance in European flat oyster (Ostrea edulis): New genomic tools for breeding programs and management of natural resources. Evol. Appl. 12, 1781–1796. doi: 10.1111/eva.12832
Vercaemer, B., Spence, K. R., Herbinger, C. M., Lapčgue, S., and Kenchington, E. L. (2006). Genetic diversity of the European oyster (Ostrea edulis L.) in nova scotia: comparison with other parts of canada, maine and europe and implications for broodstock management. J. Shellfish Res. 25, 543–551. doi: 10.2983/0730-8000(2006)25%5B543:gdoteo%5D2.0.co;2
Wang, J. (2007). Triadic IBD coefficients and applications to estimating pairwise relatedness. Genet. Res. 89, 135–153. doi: 10.1017/s0016672307008798
Wang, J. (2011). COANCESTRY: a program for simulating, estimating and analysing relatedness and inbreeding coefficients. Mol. Ecol. Resour. 11, 141–145. doi: 10.1111/j.1755-0998.2010.02885.x
Wieczorek, S. K., and Todd, C. D. (1998). Inhibition and facilitation of settlement of epifaunal marine invertebrate larvae by microbial biofilm cues. Biofouling 12, 81–118. doi: 10.1080/08927019809378348
Woolmer, A. P., Svret, M., and FitzGerald, A. (2011). Restoration of Native Oyster, Ostrea edulis, in South Wales: Options and Approaches. CCW Contract Science Report No. 960. Newtown: Countryside Council for Wales.
Yeh, F., Young, R., and Boyle, T. (2000). POPGENE, Version 1.32. A Microsoft Windows-Based Freeware For Population Genetic Analysis. Edmonton: University of Alberta.
Zhan, A. B., Bao, Z. M., Hui, M., Wang, M. L., Zhao, H. B., Lu, W., et al. (2007). Inheritance pattern of EST-SSRs in self-fertilized larvae of the bay scallop Argopecten irradians. Ann. Zool. Fenn. 44, 259–268.
Zhu, C., Southgate, P. C., and Li, T. (2019). Production of Pearls Goods and Services of Marine Bivalves. Cham: Springer, 73–93.
Keywords: aquaculture, bivalve, European flat oyster, spat translocation, genetic diversity, effective size, sPCA
Citation: Šegvić-Bubić T, Žužul I, Talijančić I, Ugrin N, Lepen Pleić I, Žuvić L, Stagličić N and Grubišić L (2020) Translocation and Aquaculture Impact on Genetic Diversity and Composition of Wild Self-Sustainable Ostrea edulis Populations in the Adriatic Sea. Front. Mar. Sci. 7:84. doi: 10.3389/fmars.2020.00084
Received: 31 October 2019; Accepted: 03 February 2020;
Published: 20 February 2020.
Edited by:
Pierre Lejeune, Station de Recherches Sous-marines et Océanographiques de Calvi (STARESO), FranceReviewed by:
Carlos Vergara-Chen, Technological University of Panama, PanamaMontse Pérez, Oceanographic Center of Vigo, Spanish Institute of Oceanography, Spain
Copyright © 2020 Šegvić-Bubić, Žužul, Talijančić, Ugrin, Lepen Pleić, Žuvić, Stagličić and Grubišić. This is an open-access article distributed under the terms of the Creative Commons Attribution License (CC BY). The use, distribution or reproduction in other forums is permitted, provided the original author(s) and the copyright owner(s) are credited and that the original publication in this journal is cited, in accordance with accepted academic practice. No use, distribution or reproduction is permitted which does not comply with these terms.
*Correspondence: Tanja Šegvić-Bubić, dGFuamEuc2VndmljQGl6b3IuaHI=