 Hamed D. Ibrahim
 Pengfei Xue
 Elfatih A. B. Eltahir1
- 1Parsons Laboratory, Department of Civil and Environmental Engineering, Massachusetts Institute of Technology, Cambridge, MA, United States
- 2Department of Civil and Environmental Engineering, Michigan Technological University, Houghton, MI, United States
The Persian/Arabian Gulf is the most important region for seawater desalination. Surrounding countries produce about 50% of global desalinated seawater. If Gulf salinity significantly rises because of desalination effluent (brine), marine ecosystems and the water supply for many population centers will be threatened. In order to quantify current and future impacts of seawater desalination on Gulf salinity and avoid costly environmental problems, it is vital to first examine the present Gulf salinity state and its response to salinity perturbation (i.e., determine its stability). Here, using a coupled Gulf-Atmosphere numerical climate model, we test the hypothesis that the Gulf has a single stable equilibrium state under the current climate. Simulations with different initializations under identical external forcing show that the natural coupled Gulf-Atmosphere system may exhibit a mixture of unstable and stable equilibrium salinity states. When continuous salinity perturbation is added to the simulations, results show that the present Gulf equilibrium state, characterized by annual mean basin-average salinity of about 40.5 g/kg, is stable. We conclude that Gulf basin salinity is resilient to present brine discharge activities under the current climate.
Introduction
The Persian/Arabian Gulf, hereafter Gulf, is a semi-enclosed shallow sea with mean depth of about 35 m and approximate surface area of 2.35 × 10¹¹ m2. It is connected to the Gulf of Oman through the Strait of Hormuz, hereafter Strait (Figure 1A). Because of the arid climate there, Gulf evaporation (about 1.84 m/year) greatly exceeds freshwater input (about 0.28 m/year) from precipitation and river runoff (Privett, 1959; Johns et al., 2003; Xue and Eltahir, 2015), causing Gulf waters to be hypersaline. Gulf freshwater loss by evaporation is balanced by a net inflow of saline water from the Strait, mainly through upper layers, and the hypersaline return flow at the Strait, which contains the salt left behind after evaporation, is through deep layers. Within the Gulf the main circulation pattern is a basin-wide cyclonic gyre with several cyclonic eddies in the central and northern Gulf, and strong coastal currents extend along the coast of Saudi Arabia and the United Arab Emirates (Figure 1B).
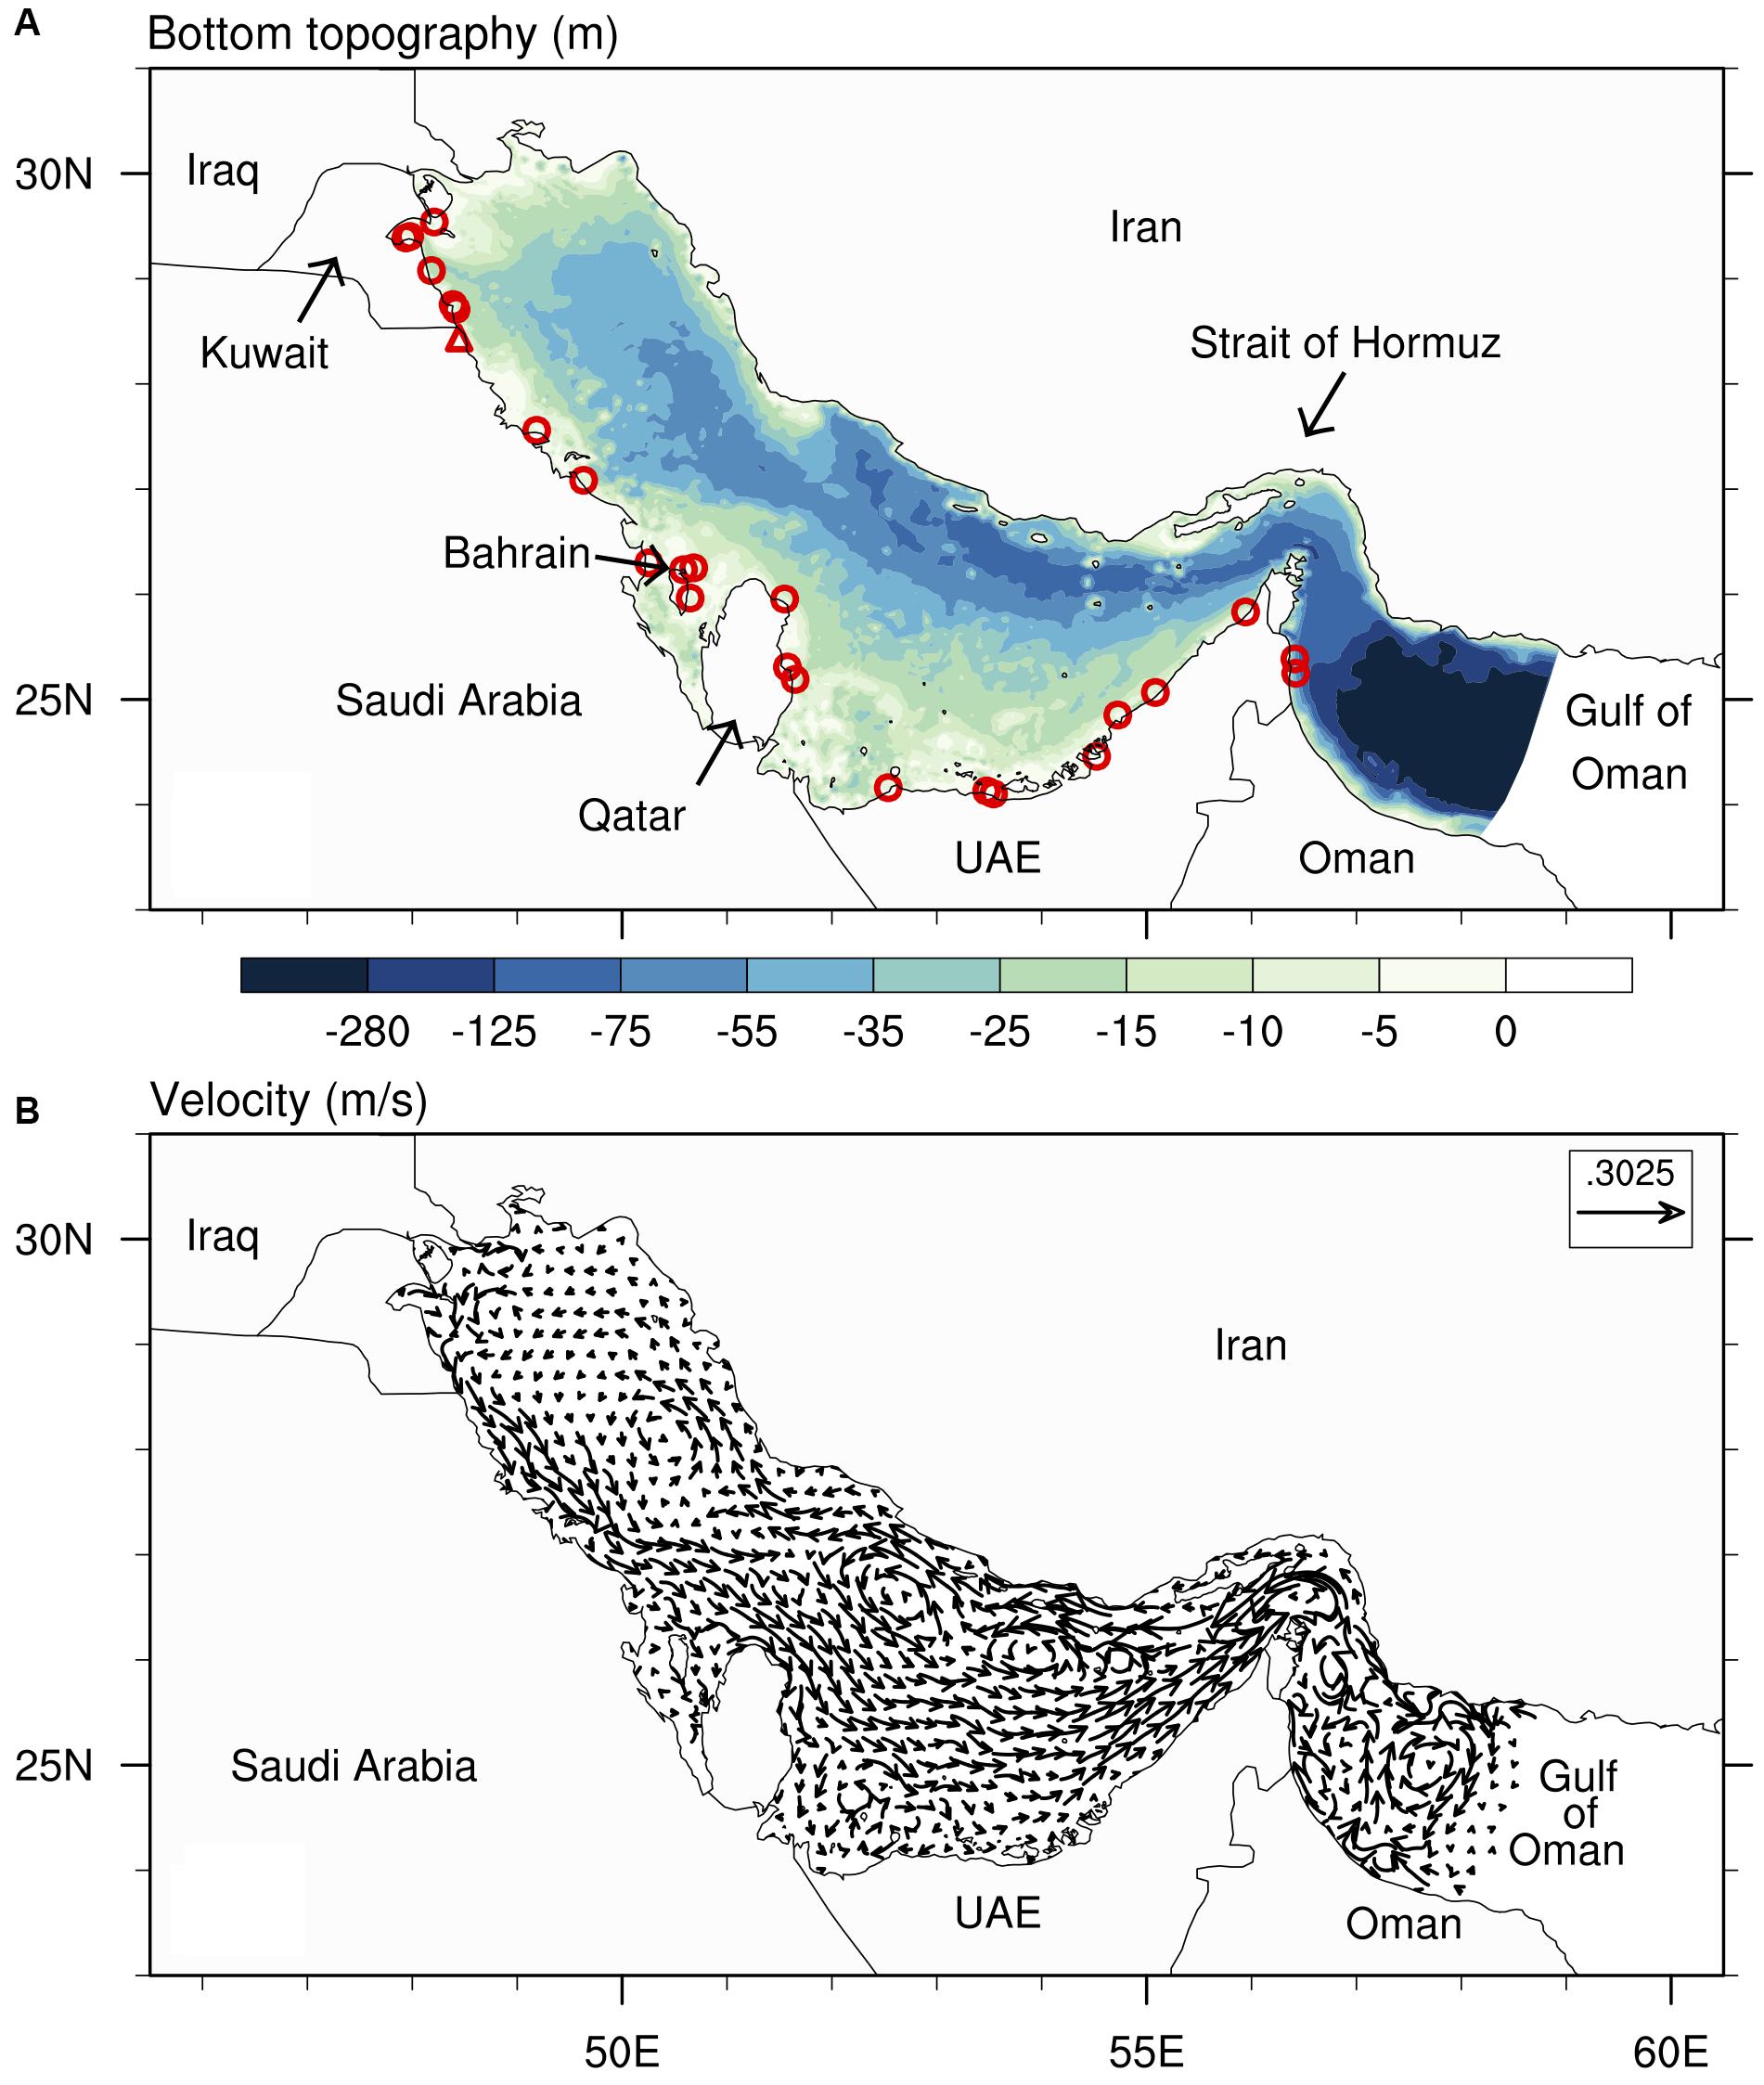
Figure 1. Gulf bottom topography and residual circulation (RS) characteristics: (A) Bottom topography; mean depth is approximately 35 m, and depth decreases from east to west; triangle marker indicates position of freshwater sink in D1a experiment and circle markers indicate positions of freshwater sink in D1b and D1c experiments (see Table 1). (B) Depth-average RS horizontal velocity when lateral extent is maximum (June).
The countries surrounding the Gulf are in a region of strategic and ecological significance and have some of the highest rates of economic and population growth; but the Gulf is increasingly under environmental stress (Roberts et al., 2010; Sheppard et al., 2010; Sale et al., 2011). Because of scarce renewable freshwater resources, many surrounding countries rely on seawater desalination, about 50% of global capacity (Lattemann and Hopner, 2008; Jones et al., 2019). This anthropogenic activity removes about 5 km3/year of freshwater from the Gulf (Ibrahim and Eltahir, 2019), and the associated brine (about 12 km3/year) is disposed into the Gulf (Jones et al., 2019). Brine threatens Gulf marine ecosystems (Dupavillon and Gillanders, 2009; Roberts et al., 2010; Sale et al., 2011). Meanwhile, basin buildup of the salt in brine threatens potable water supply there because energy required for desalination increases as salinity increases (Elimelech and Phillip, 2011; Voutchkov, 2018). While the impact of seawater desalination on the regional water quality has been studied (Ibrahim and Eltahir, 2019), there are rising concerns about the sustainability of seawater desalination and its impact on Gulf basin-scale salinity and marine ecosystem into the future (Sheppard et al., 2010; Elimelech and Phillip, 2011; Sale et al., 2011). In order to quantify current and future impacts of seawater desalination on Gulf salinity and avoid costly environmental problems, it is therefore vital to understand the stability of Gulf salinity state and its resilience to salinity perturbations resulting from seawater desalination.
The Gulf is the hot spot for seawater desalination brine discharge (mainly into near-surface waters), accounting for about 50% of the 51.7 billion m3/year global brine production; but ocean and sea brine discharge are also rising in other arid-coastal regions: North Africa (20.3%), East Asia and Pacific (10. 5%), North America (3.9%), Western Europe (5.9%), and Latin America and Caribbean (3.9%; Jones et al., 2019). This study therefore develops and tests a methodology that can be applied in these other regions to quantify the salinity response to salinity perturbations and hence to facilitate improved brine management strategies in other seas and oceanic regions.
Most climate systems on earth are characterized by a single stable equilibrium state. But climate systems with multiple equilibrium states (i.e., sensitive to initial conditions) are of practical and theoretical importance (Stommel, 1961; Lorenz, 1968, 1970; Stocker, 1999; Ferreira et al., 2011). The equilibrium state of climatic elements (e.g., temperature, salinity) characterize the past and provide a fixed baseline from which to measure natural or anthropogenic climatic change. Beyond thresholds that separate equilibrium states, natural feedbacks enhance perturbations; whereas within such thresholds, these feedbacks attenuate perturbations. Hence, multiple equilibrium states affect resilience of climate systems to natural or anthropogenic perturbations. Analysis of observations and simulation experiments in numerical models have shown the existence of multiple equilibrium states at the global scale (Budyko, 1969; Sellers, 1969; Broecker et al., 1985; Langen and Alexeev, 2004; Ferreira et al., 2011) and at regional scales (Claussen and Esch, 1994; Wang and Eltahir, 2000; Zeng and Neelin, 2000; Dekker, 2010; Bathiany et al., 2012).
In coastal regions and marginal seas [e.g., the Mediterranean Sea where multiple equilibrium states have been found (Ashkenazy et al., 2012)], a switch from low to high basin-average salinity can have a considerable economic impact. For example, high salinity in coastal waters can adversely affect marine productivity and thus fish catches (Iselin, 1940). This paper aims to test the hypothesis that the Gulf annual mean basin-average salinity (hereafter, Gulf equilibrium salinity) is unique and stable (i.e., unlikely to change) under current climate ocean and atmosphere boundary conditions and current seawater desalination activities. Using a coupled Gulf-Atmosphere regional model (GARM), we performed and analyzed two sets of simulation experiments to examine the uniqueness and stability of Gulf equilibrium salinity. The methodology, results and discussion, and conclusion are given, respectively, in the following sections.
Methodology
Observational Datasets
Observations of Gulf water properties, especially salinity, are limited in space and time coverage. There are few published basin-wide survey results including a 1948 summer cruise (Emery, 1956), the 1976 wintertime expedition of the Atlantis from Woods Hole Oceanographic Institution (Brewer and Dryssen, 1985), and the surveys from February to June 1992 on the Mt. Mitchell expedition (Reynolds, 1993). Historical hydrographic datasets, compiled mostly from the Master Oceanographic Observations Data Set (MOODS) maintained by the U.S. Naval Oceanographic Office, was used to describe the seasonal variability of Gulf seawater (Brewer and Dryssen, 1985). However, this dataset has large temporal gaps and a bias toward winter and spring months. Because coverage of in situ salinity is limited, we used the Simple Ocean Data Assimilation (SODA v2.2.4) reanalysis data for salinity analysis. SODA is a data assimilation effort to reconstruct the global ocean climate, which combines a first guess of the evolving ocean state from a numerical model, and a correction based on direct observations, including the abovementioned observation efforts. The resulting ocean reanalysis provides an improvement overestimates based solely on either the sparse set of observations or numerical simulation (Carton et al., 2000; Carton and Giese, 2008).
We used two analyses datasets to validate simulated Gulf sea-surface temperature (SST). First, for monthly means, we used NOAA 1/4 degree daily Optimum Interpolation Sea Surface Temperature (Reynolds et al., 2007), OISST v2, because it is available for our simulation experiments period. Second, for climatological monthly means, we used the Jet Propulsion 1 km by 1 km MUR-JPL-L4-GLOB-SST v4.1, which is available only from mid 2002 to present (Chin et al., 2017).
To validate simulated Gulf water surface elevation, we used daily 1/4 degree, merged, absolute dynamic topography (SSALTO/DUACS merged-allsat-phy-14) from Copernicus Marine Environment Monitoring Service (Copernicus, 2019). This dataset combines measurements by 11 satellites from 1993 to 2018. The Gulf is shallow and there are a few other coastal altimetry datasets (e.g., ALES and PISTACH) that apply shallow-region corrections to global altimetry measurements. However, these datasets have only been validated for individual satellites with short periods, which is unsuitable for the climatological analysis here.
Numerical Model
We used a high-resolution, coupled GARM with current climate ocean and atmosphere boundary conditions. GARM includes the two-way interaction between its atmosphere and ocean components with a coupling frequency of 3 h (Figure 2). Synchronous coupling is achieved with OASIS3 coupler (Valcke, 2013), and simulations in the two components are integrated forward simultaneously in a parallelized computation environment for low intrusiveness and high portability. OASIS coupler controls data transfer between GARM components, interpolates the coupling data between the different grids, coordinates the synchronization of the constituent models’ simulation, and allows the free air-sea interaction between GARM components.
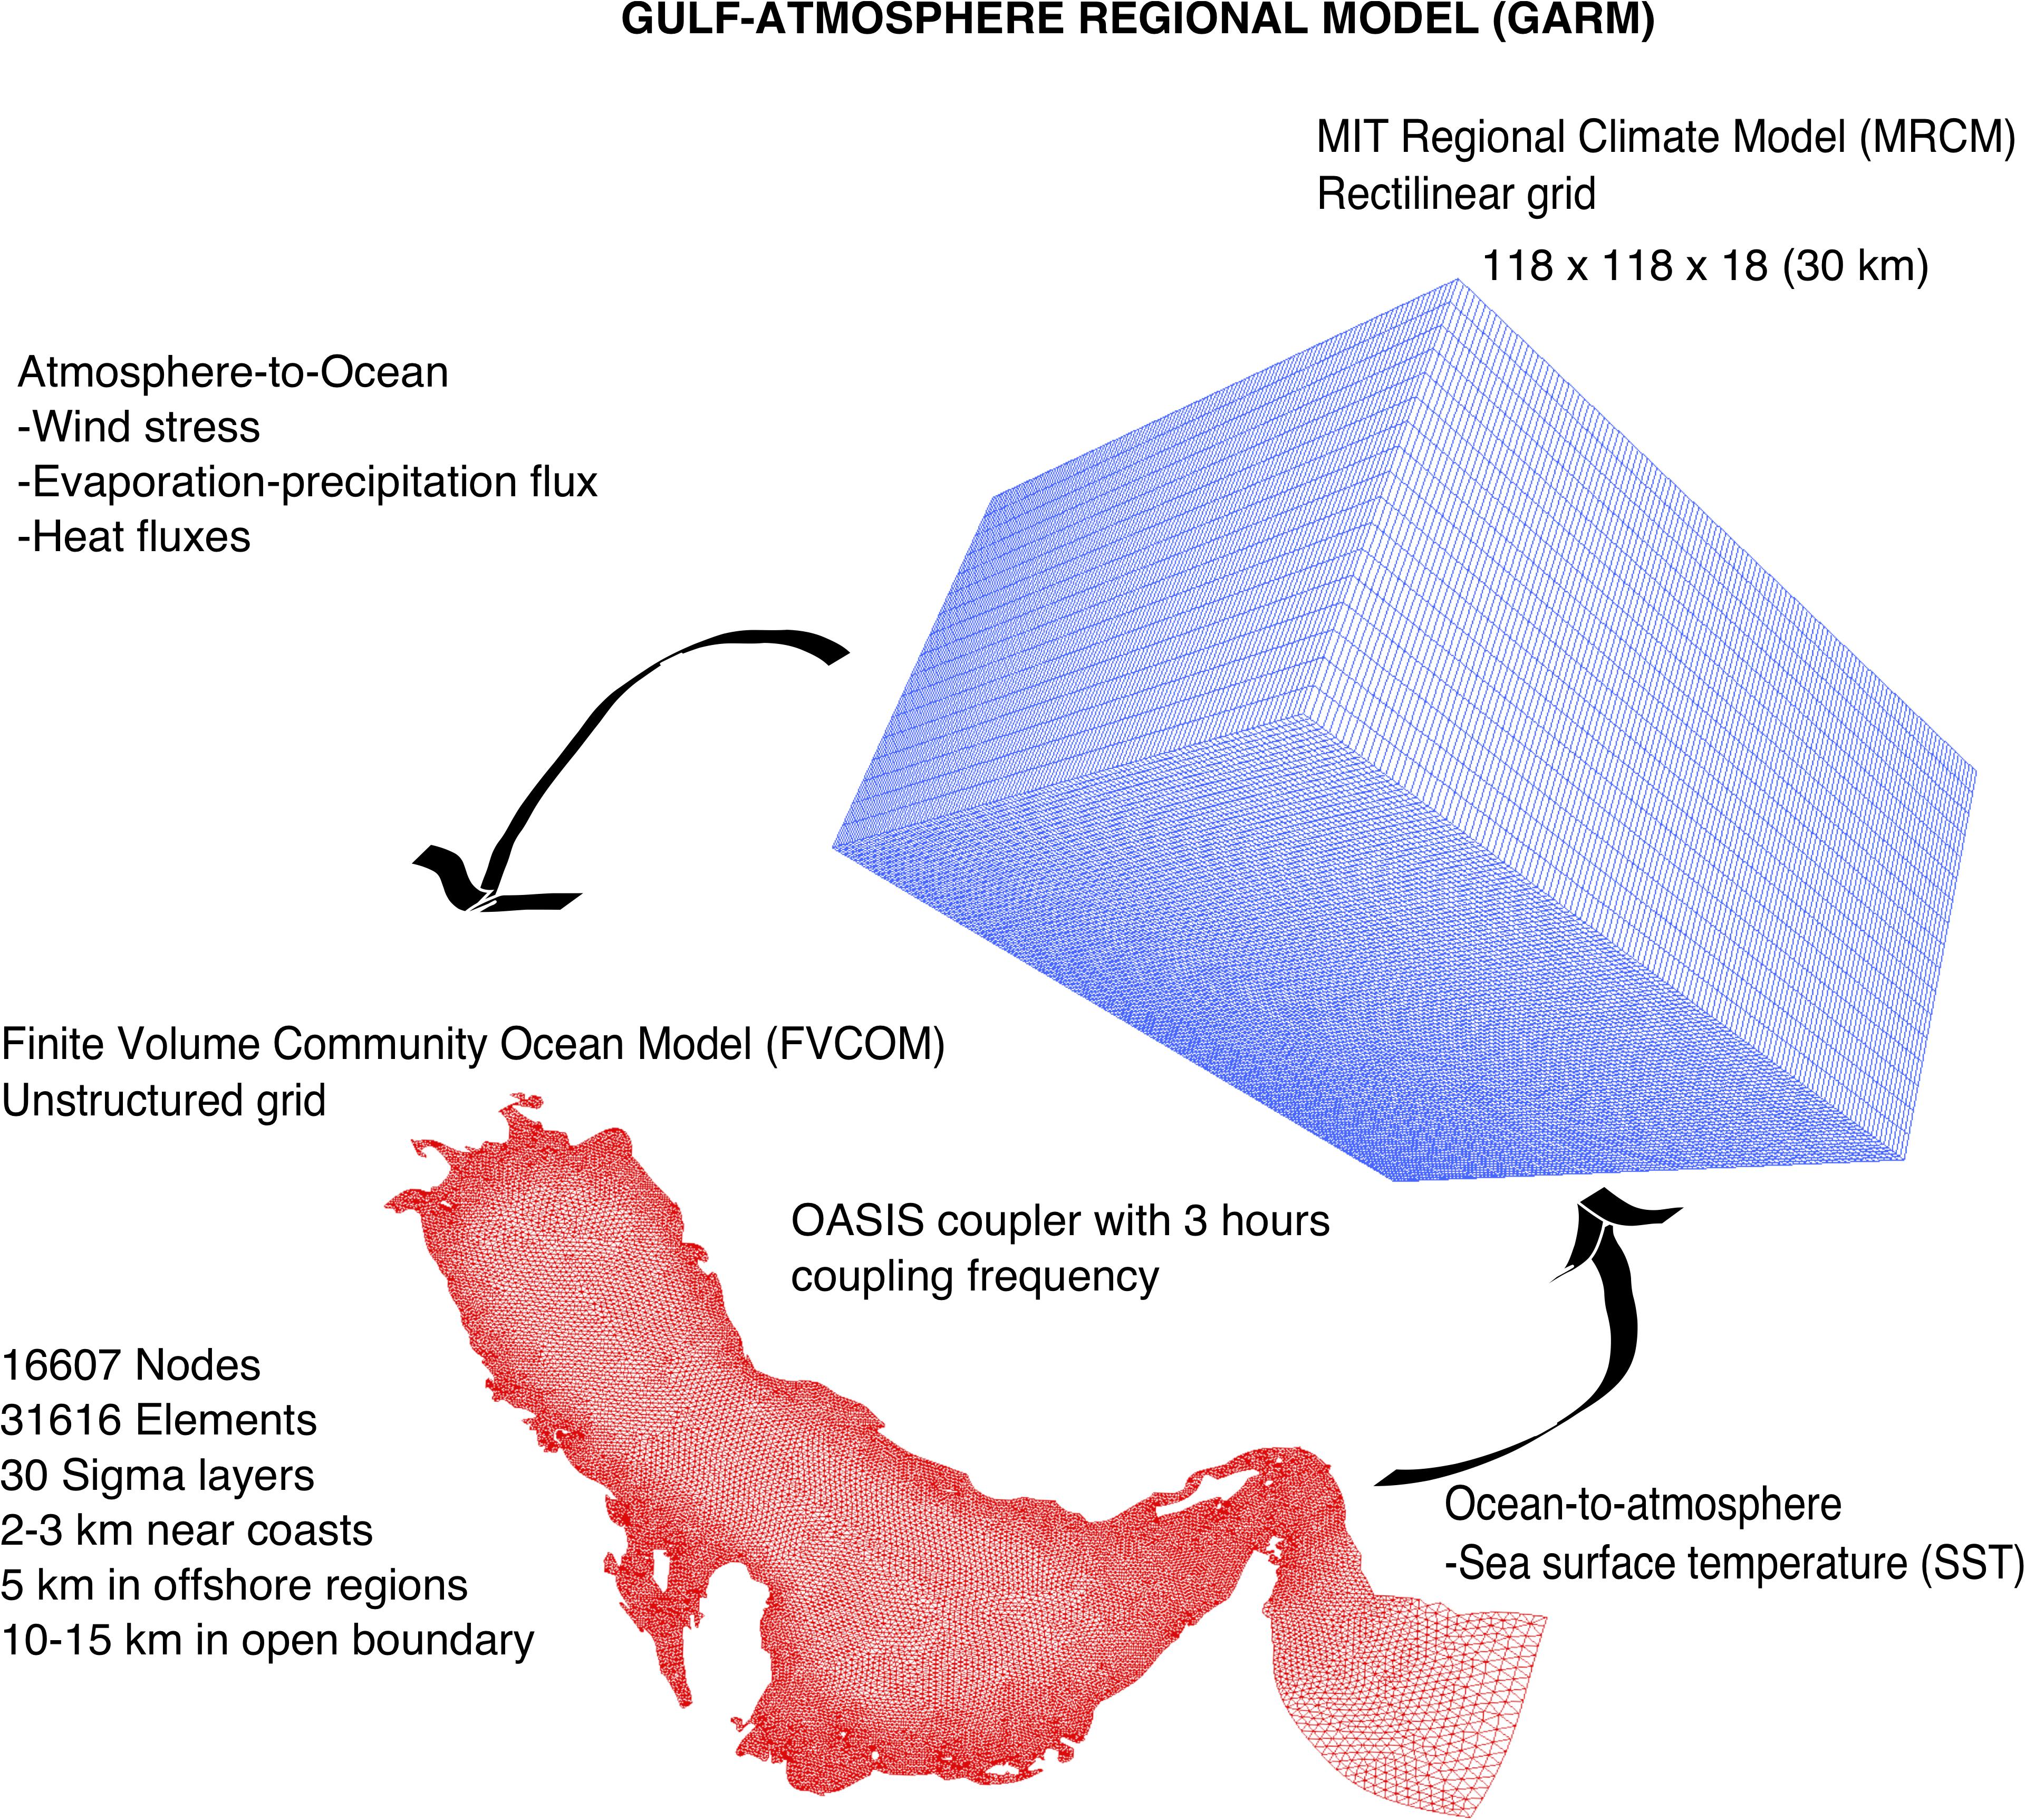
Figure 2. Configuration of Gulf–Atmosphere Regional Model (GARM).
Gulf-Atmosphere regional model atmospheric component is the MIT Regional Climate Model (MRCM), an advanced version of Regional Climate Model version 3 (RegCM3; Giorgi and Mearns, 1999; Pal et al., 2007). MRCM has new or improved physical schemes and high skill to simulate different regional climates (Winter and Elfatih, 2009; Marcella and Eltahir, 2012, 2014; Gianotti and Eltahir, 2014a, b; Im and Eltahir, 2017). GARM ocean component that simulates Gulf hydrodynamics is the unstructured-grid Finite Volume Community Ocean Model (FVCOM; Chen et al., 2003, 2006). Because of the different spatial scales of atmospheric and Gulf residual circulation, GARM-MRCM horizontal domain is larger (29–61°E and 12–40.5°N), with 30 km resolution in 120 by120 grids. GARM-FVCOM has horizontal resolution of 2–3 km near coast, 5 km in offshore regions and 10–15 km at the open ocean boundary. GARM-FVCOM is configured with 30 generalized sigma layers where water depth is <60 m; while in regions with water depth >60 m, the thickness of the top and bottom 5 layers are set to 2 m, and the other 20 intermediate layers are uniformly divided for the remaining water column. Thus, vertical resolution is <1 m for nearshore Gulf regions and 1–2 m in most offshore Gulf regions.
Gulf-Atmosphere regional model-MRCM boundary condition is from current climate simulations of ECHAM5/Max Planck Institute Ocean Model (MPIOM), now Max Planck Institute Earth System Model (MPI-ESM) in phase 5 of the Coupled Model Intercomparison Project (CMIP5). GARM-FVCOM boundary condition is from climatological monthly mean fields of temperature (Locarnini, 2010) and salinity (Antonov, 2010) from the World Ocean Atlas 2009; mean flow velocity boundary condition is dynamically calculated with wind, temperature and salinity. River runoff into the Gulf from the Shatt Al Arab/Arvand Rud, the main source of freshwater into the Gulf, was specified based on streamflow statistics for the Tigris and Euphrates River Basins (Saleh, 2010).
Gulf-Atmosphere regional model has been used successfully to estimate Gulf heat and water budgets (Xue and Eltahir, 2015) and to characterize the dynamic interplay between brine discharge and Gulf residual circulation (Ibrahim and Eltahir, 2019). MRCM and FVCOM have individually been used in many regional climate numerical studies. Details of GARM configuration and sensitivity to forcing fields are described at length in Xue and Eltahir (2015). For the sake of brevity, additional GARM details and skill assessments are given in the Supplementary Material. The methods for computing lateral volume exchange fluxes at the strait, and for converting the volume fluxes into equivalent over-Gulf freshwater fluxes (i.e., m/year) to facilitate comparison, were given in Xue and Eltahir (2015); equation 10) and thus are not repeated here. This is convenient for comparing the magnitudes of the water budget and fluxes, especially since evaporation (∼1.8 m/year) plays a vital role in Gulf-Atmosphere dynamics. The average annual lateral fluxes are referenced to Sv. unit (see Table 2) to facilitate comparison with previous studies.
Design of Simulation Experiments
We performed two sets of experiments: (1) to examine the influence of initial salinity condition on the establishment of possible equilibrium salinity states, six 10-yearr-long experiments (Ic1–Ic6) were initialized with different basin-average salinities, and seawater desalination perturbation was excluded. (2) to establish the response of Gulf equilibrium salinity states to current seawater desalination activities (i.e., determine the stability equilibrium salinity states), three 19-year-long experiments were initialized with a low (D1a and D1c), and high (D1b) initial basin-average salinities, and continuous seawater desalination perturbation was added.
Ic1–Ic6 Scenarios: Variation of Initial Basin-Average Salinity
Ic1 started with spatially variable initial salinity and temperature (basin-averages are shown in Table 1), representing current Gulf conditions based on climatological monthly mean fields of temperature (Locarnini, 2010), and salinity (Antonov, 2010) from the World Ocean Atlas 2009. To explore the possible lower limit of Gulf equilibrium salinity, a low initial basin-average salinity was assumed for Ic2; and to explore the possible upper limit, a high initial basin-average salinity was assumed for Ic3 (Table 1). Ic4–Ic6 initial basin-average salinities were chosen between those of Ic1 and Ic2 experiments (Table 1).
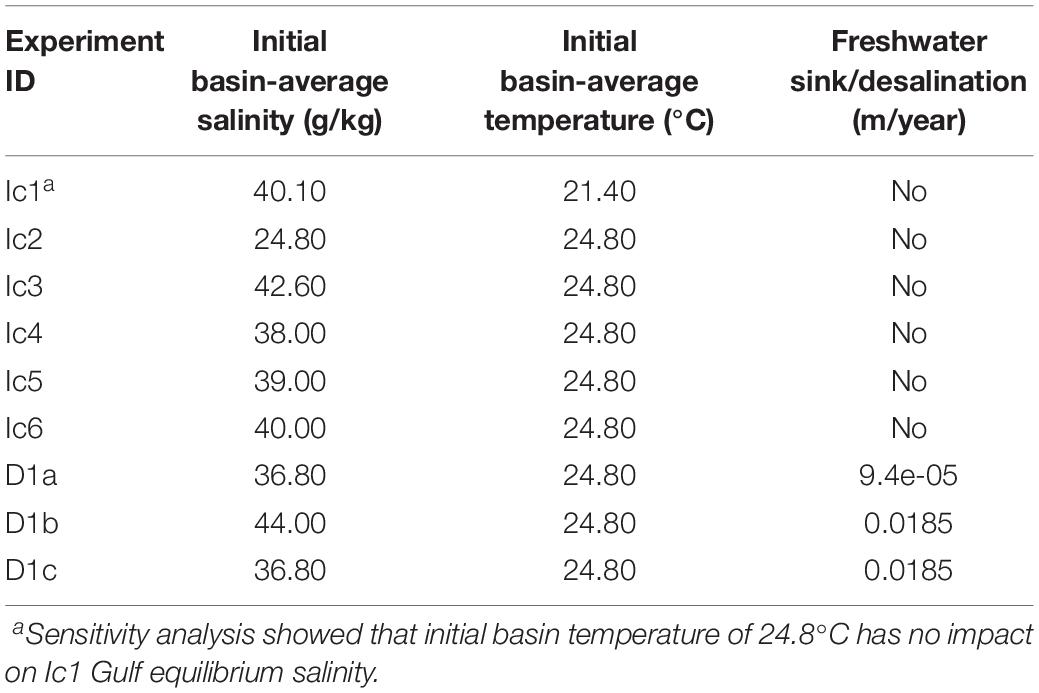
Table 1. Overview of simulation experiments: in the first set of 10-year-long experiments GARM is initialized with different Gulf basin-average salinities (Ic1–Ic6); and in the second set of 19-year-long experiments GARM is initialized with a low (D1a and D1c); and a high (D1b) initial Gulf basin-average salinity and continuous seawater desalination perturbation is included for the duration of the experiments.
D1a–D1c Scenarios: Addition of Continuous Seawater Desalination Perturbation
The lowest simulated Gulf equilibrium salinity (in Ic2 experiment) was chosen as the initial basin-average salinity of D1a and D1c experiments (Table 1). Because the only difference between D1a and D1c experiment is the freshwater sink magnitudes (Table 1), comparing the results of these two experiments elucidates the influence of salinity perturbation flux magnitude on the stability of Gulf equilibrium salinity. In D1b experiment, GARM was initialized with a higher-than-present basin-average salinity of 44 PSU (Table 1) in order to demonstrate the stability of the present Gulf equilibrium salinity as it restores back from higher-than-present salinity initialization even with desalination activities. Note that the desalination perturbation in D1b and D1c simulation (4.35 km3/year) is the same order of magnitude as current Gulf seawater desalination capacity, about 5 km3/year. There are more than 850 seawater desalination plants in the Gulf, and most of these plants, including the largest 24 (based on production capacity ≥100,000 m3/day) are located near the Arabian coast of the Gulf (Ibrahim and Eltahir, 2019). Hence, for practical reasons, and since small plants are assumed to have negligible impact, we use here only the production capacities of the 24 largest plants as the freshwater sink in D1b and D1c experiments.
Results and Discussion
Gulf Response to Variation of Initial Basin-Average Salinity
Corresponding to Ic1 and Ic2 experiments, GARM simulates two different equilibrium salinities.
(1) Ic1 simulation Gulf sea-surface salinity (SSS) shows a close agreement, in magnitude and spatial pattern, with the SSS from the SODA dataset (Figures 3A–D). Ic1 equilibrium salinity is about 40.5 g/kg (Figure 5A). Water with salinity between 40–41 g/kg occupies most of the Gulf region while the saltiest water (salinity > 41 g/kg) is located in the southern Gulf. Salinity gradients around the Strait show that relatively fresher water enters the Gulf and becomes saltier because of excessive evaporation. Although river discharge is not reflected in the SODA dataset because of its coarse resolution, the river plume from the Shatt Al Arab/Arvand Rud traveling southeastward along the coast is well reflected in the GARM simulation (Figures 3C,D). (2) Ic2 simulation (initialized with a salinity of 24 g/kg) shows SSS of about 35–36 g/kg with little spatial variation (Figures 3E,F). Ic2 equilibrium salinity is about 36.8 g/kg (Figure 5A).
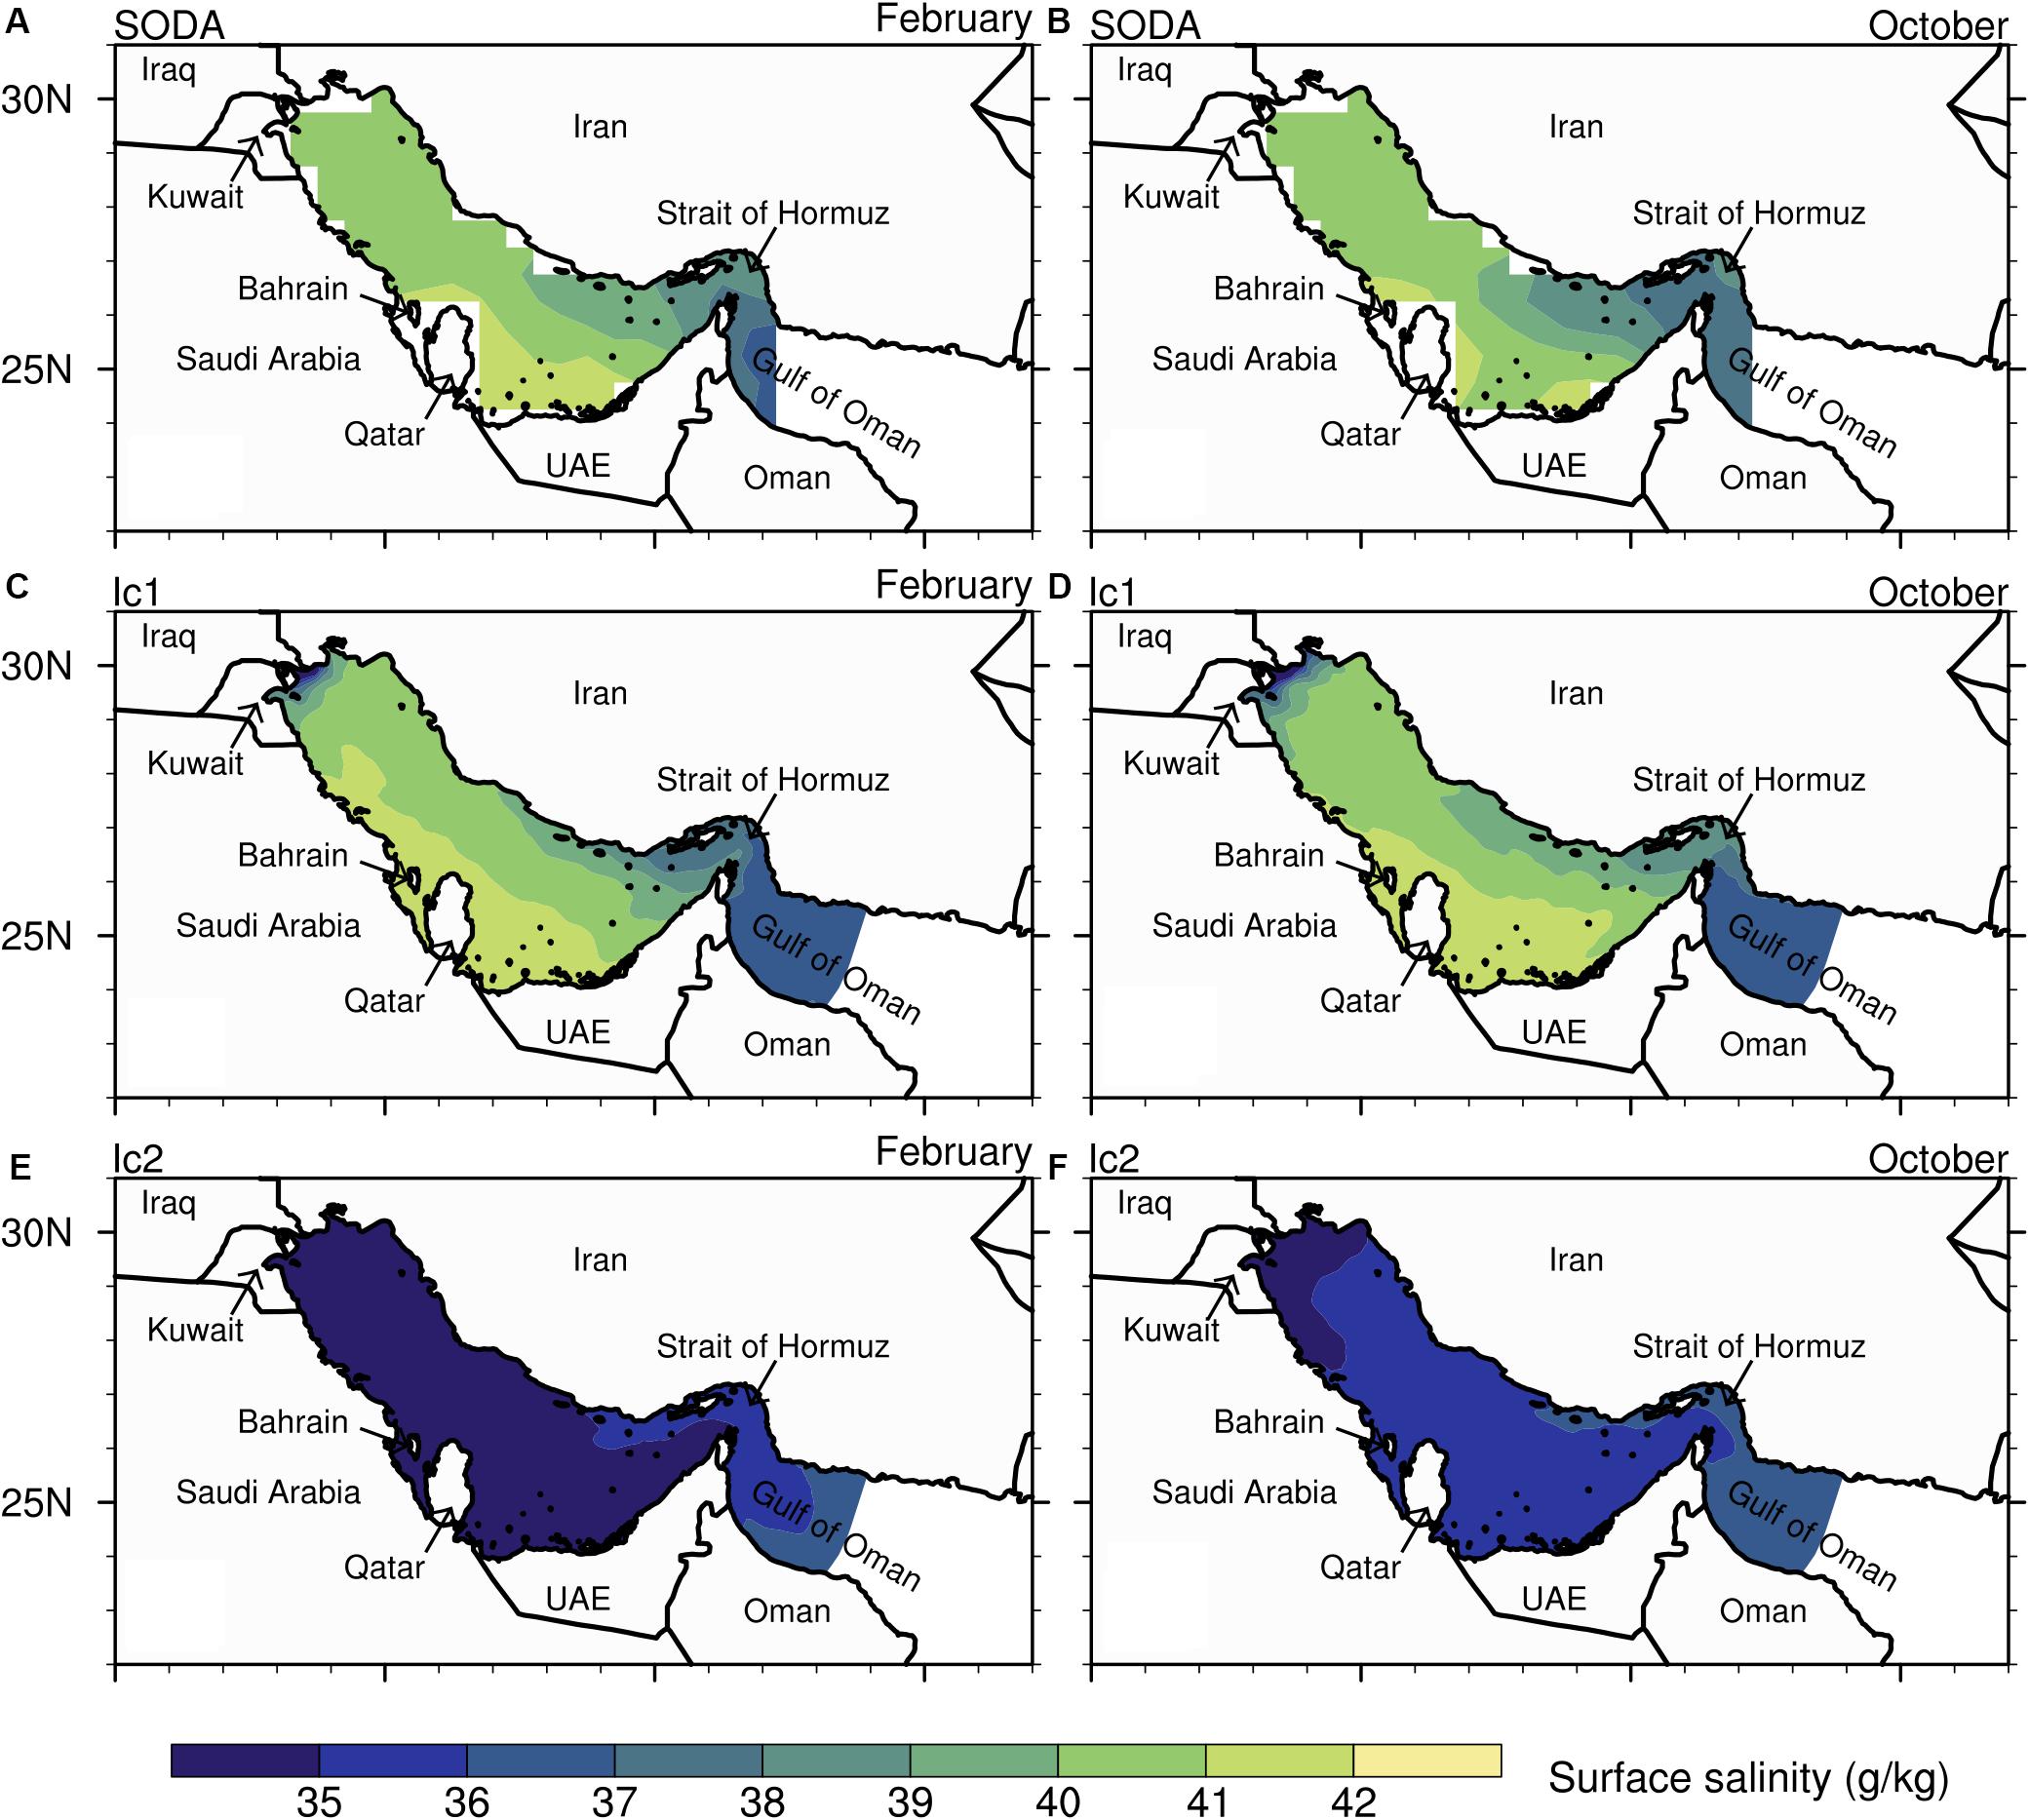
Figure 3. Simulated climatological (1981–1990) sea-surface salinity (SSS) in February and October compared to reanalysis SODA SSS. (A,B) SODA. (C,D) Ic1experiment. (E,F) Ic2 experiment.
In contrast to the striking difference in SSS between Ic1 and Ic2, SST horizontal structures are similar and basin-average SSTs are identical in the two cases (Figures 4C–F, 5B), suggesting that the salinity difference between these two cases has little impact on water temperature. It also suggests that the heat fluxes, which control the water temperature, is mostly unaffected by the difference in equilibrium salinity between Ic1 and Ic2 simulations.
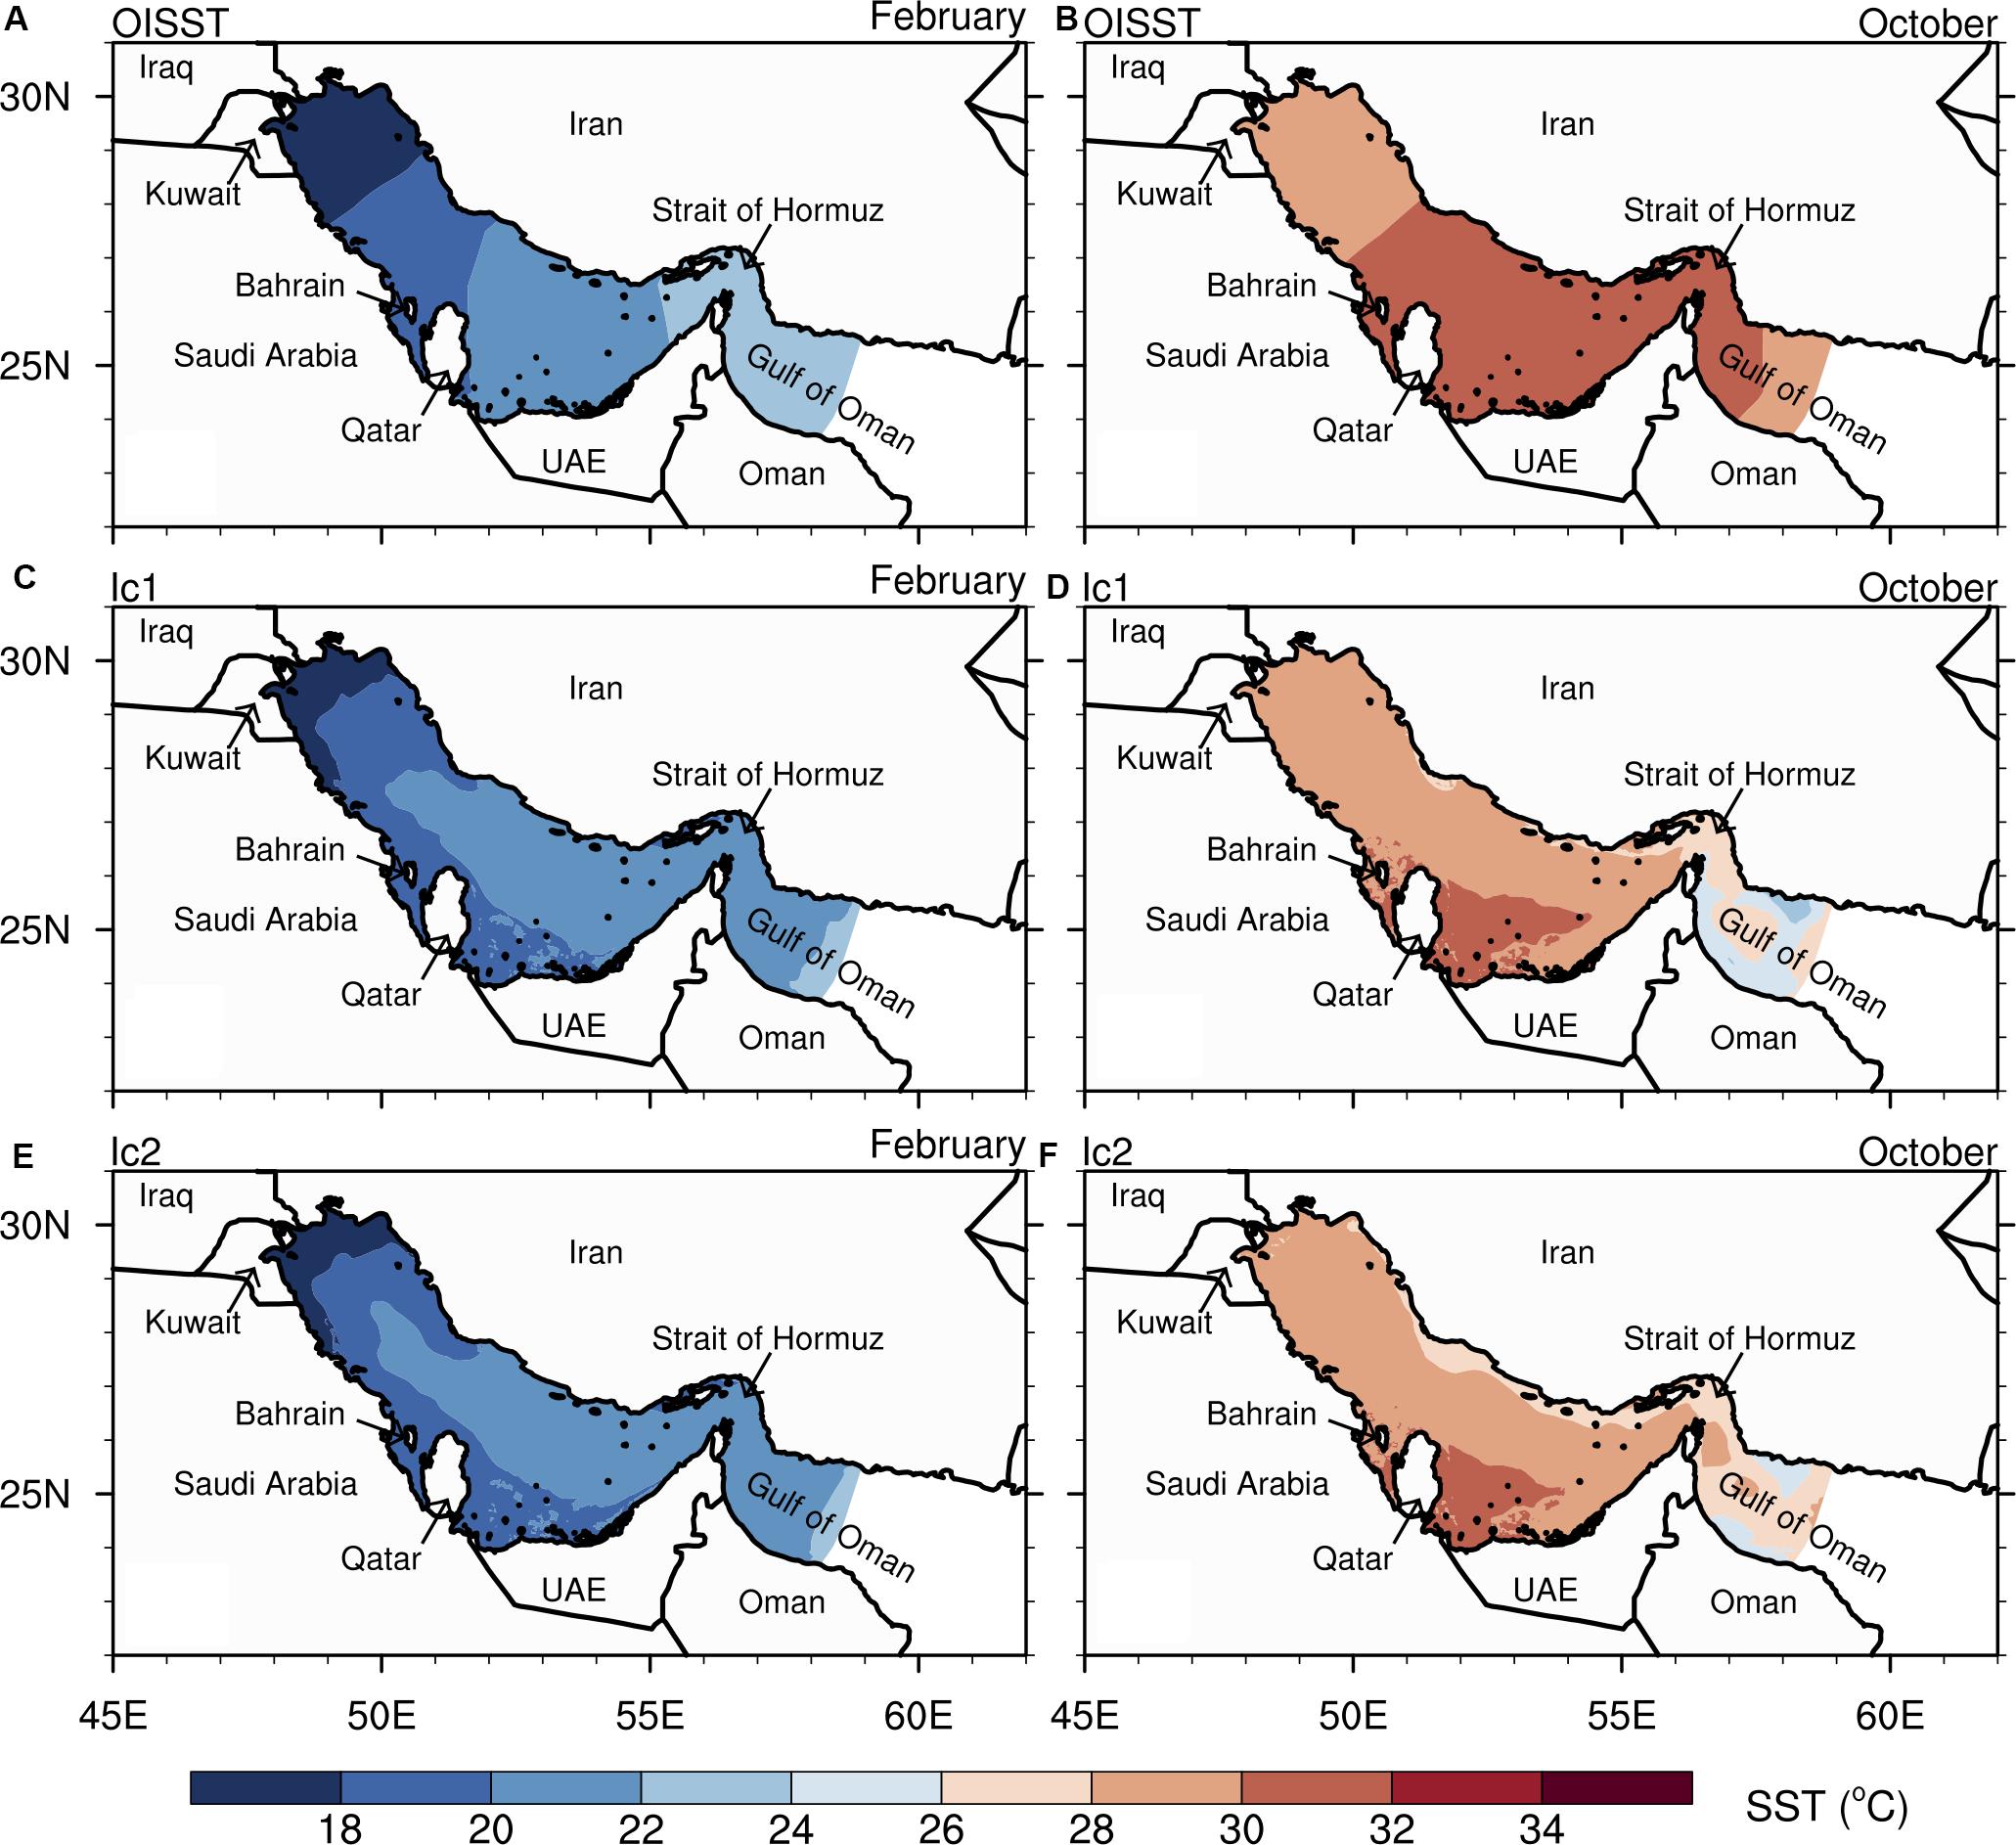
Figure 4. Simulated climatological (1981–1990) sea-surface temperature (SST) in February and October compared to analysis SST (OISST). (A,B) OISST. (C,D) Ic1experiment. (E,F) Ic2 experiment.
Ic1 and Ic2 water surface elevations (WSE) are different (Figure 5C). WSE in Ic1 simulation is similar to the satellite-derived value, which implies that the well-simulated temperature and salinity reproduces the correct water density and therefore WSE. On the other hand, Ic2 WSE is much higher than the satellite-derived value (Figure 5C) because of the much lower Ic2 salinity (Figures 3E,F, 5A).
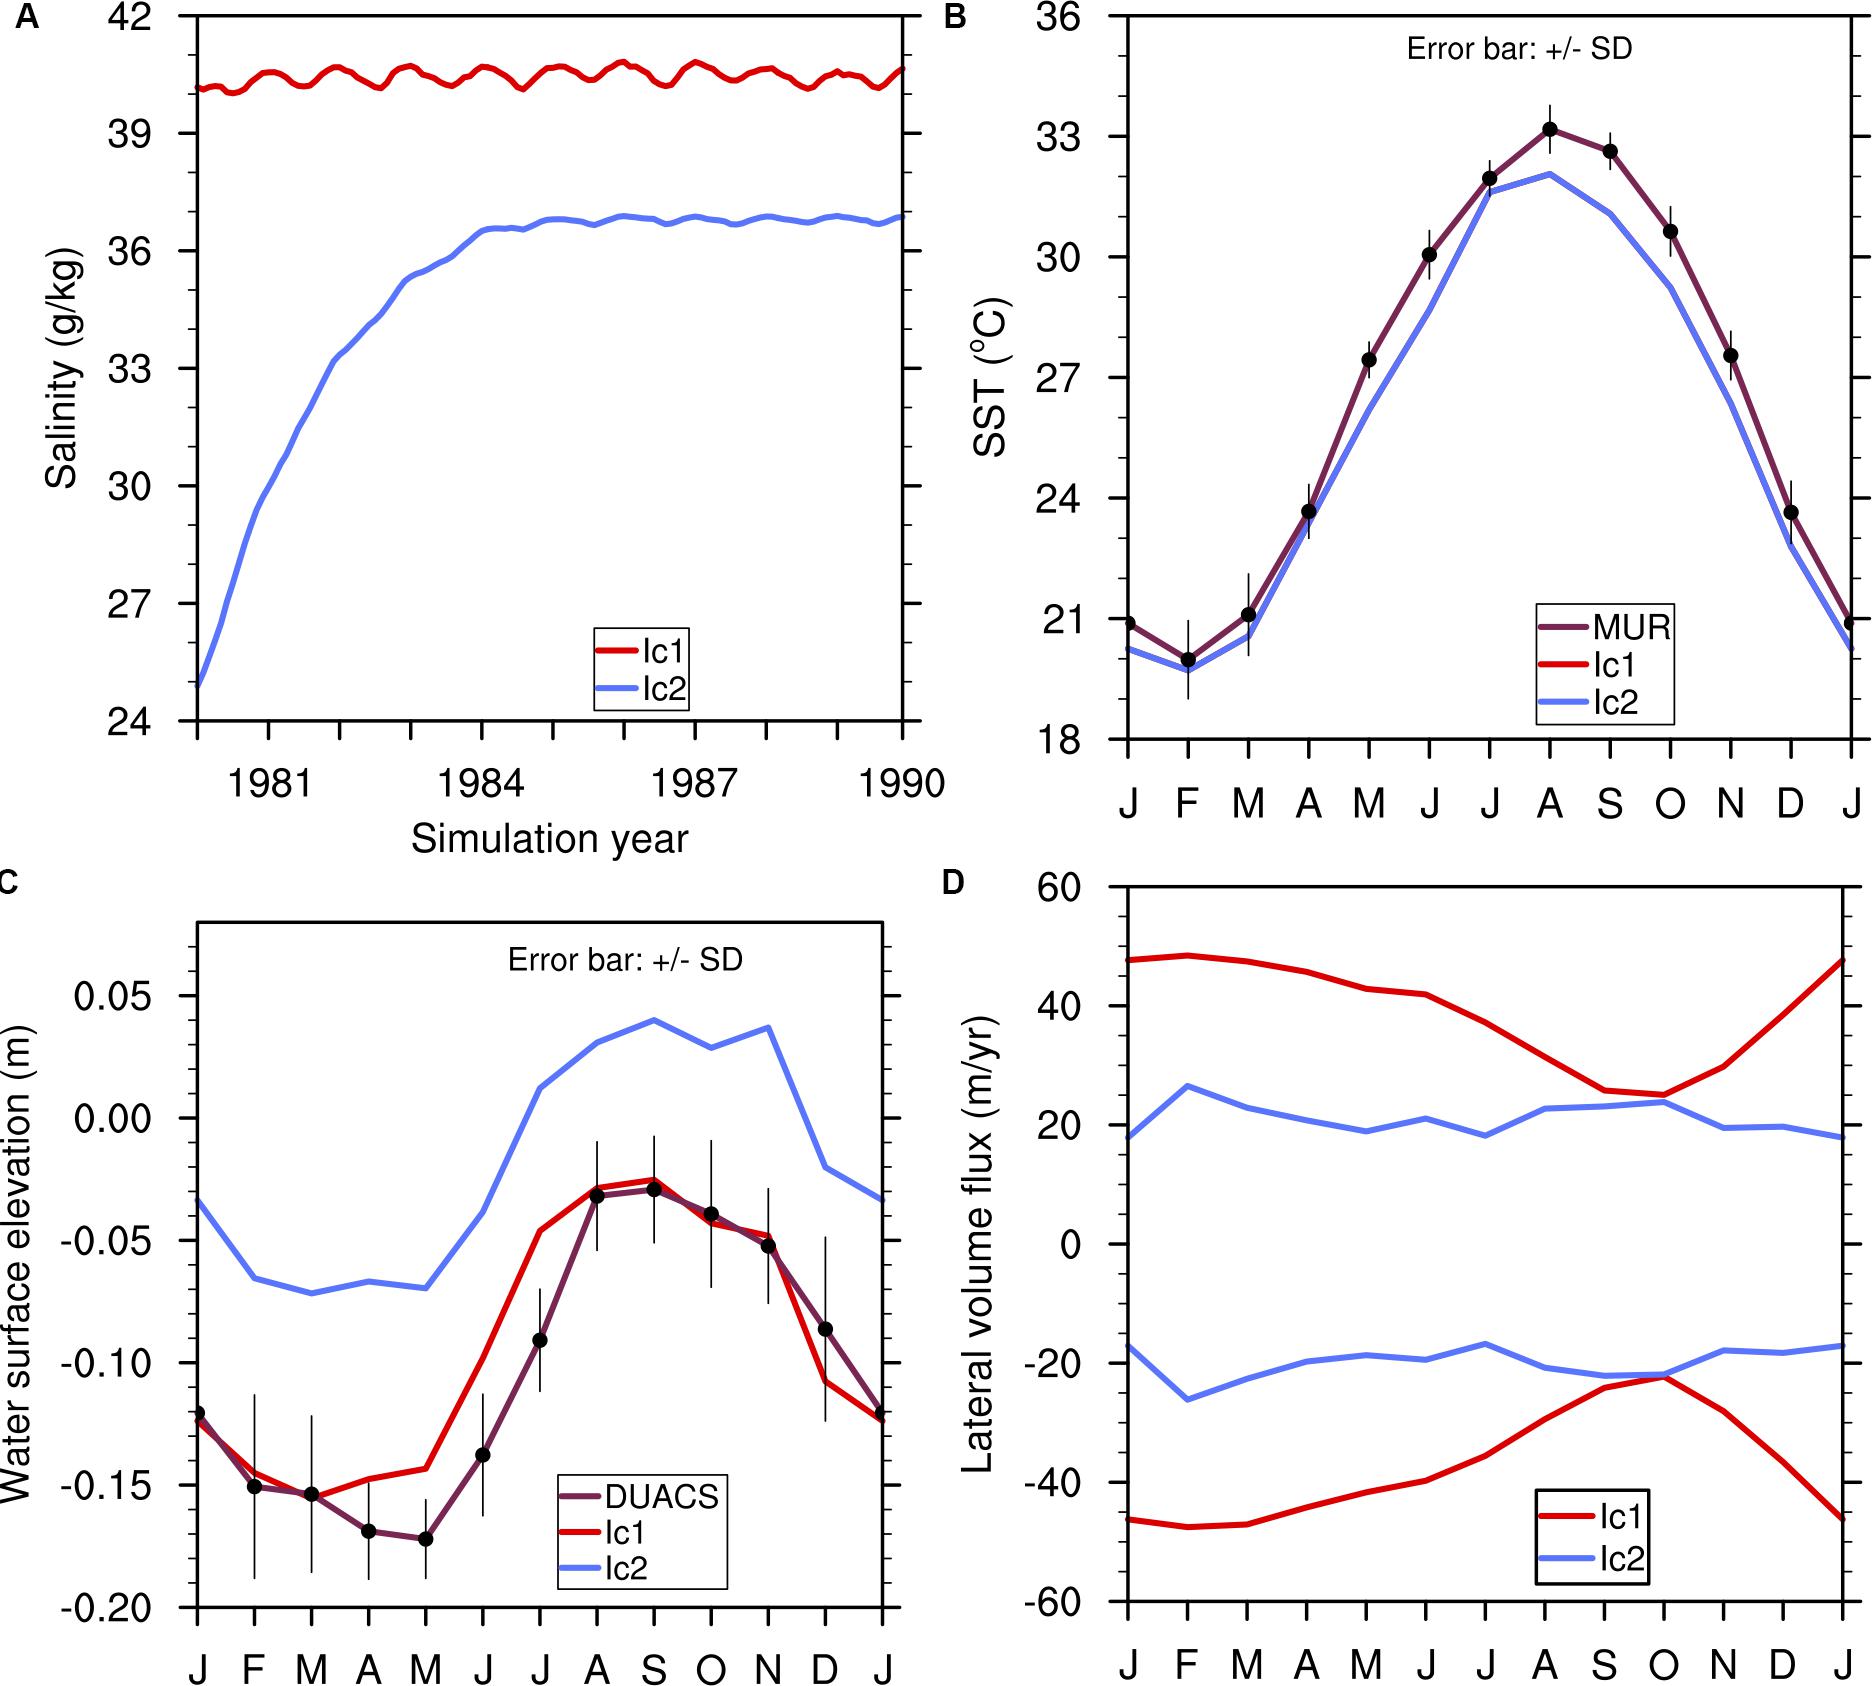
Figure 5. Gulf dynamical properties in Ic1 and Ic2 equilibrium. (A) Simulated monthly basin-average salinity. (B) Simulated climatological monthly basin-average SST compared to JPL MUR analysis SST. (C) Simulated climatological monthly Gulf WSE (relative to Indian Ocean) compared to satellite-derived WSE. (D) Simulated climatological monthly lateral volume flux into the Gulf from the Indian Ocean (positive) and out of the Gulf to the Indian Ocean (negative) in the vertical overturning circulation.
Consequently, the overturning circulation between the Gulf and the Indian Ocean that is associated with Ic1 and Ic2 equilibrium states have different temporal and vertical structures at the Strait. In Ic1 equilibrium, lateral inflow to the Gulf and outflow from the Gulf have their respective maximum and minimum in February and October (Figure 5D): lateral inflow is in top layers while the outflow is in bottom layers (Figures 6A,B), as evidenced in situ observations (Johns et al., 2003). The annual structure and direction of Ic1 overturning circulation, year-round counterclockwise inflow in top layers and outflow in bottom layers, thus represents an anti-estuarine circulation.
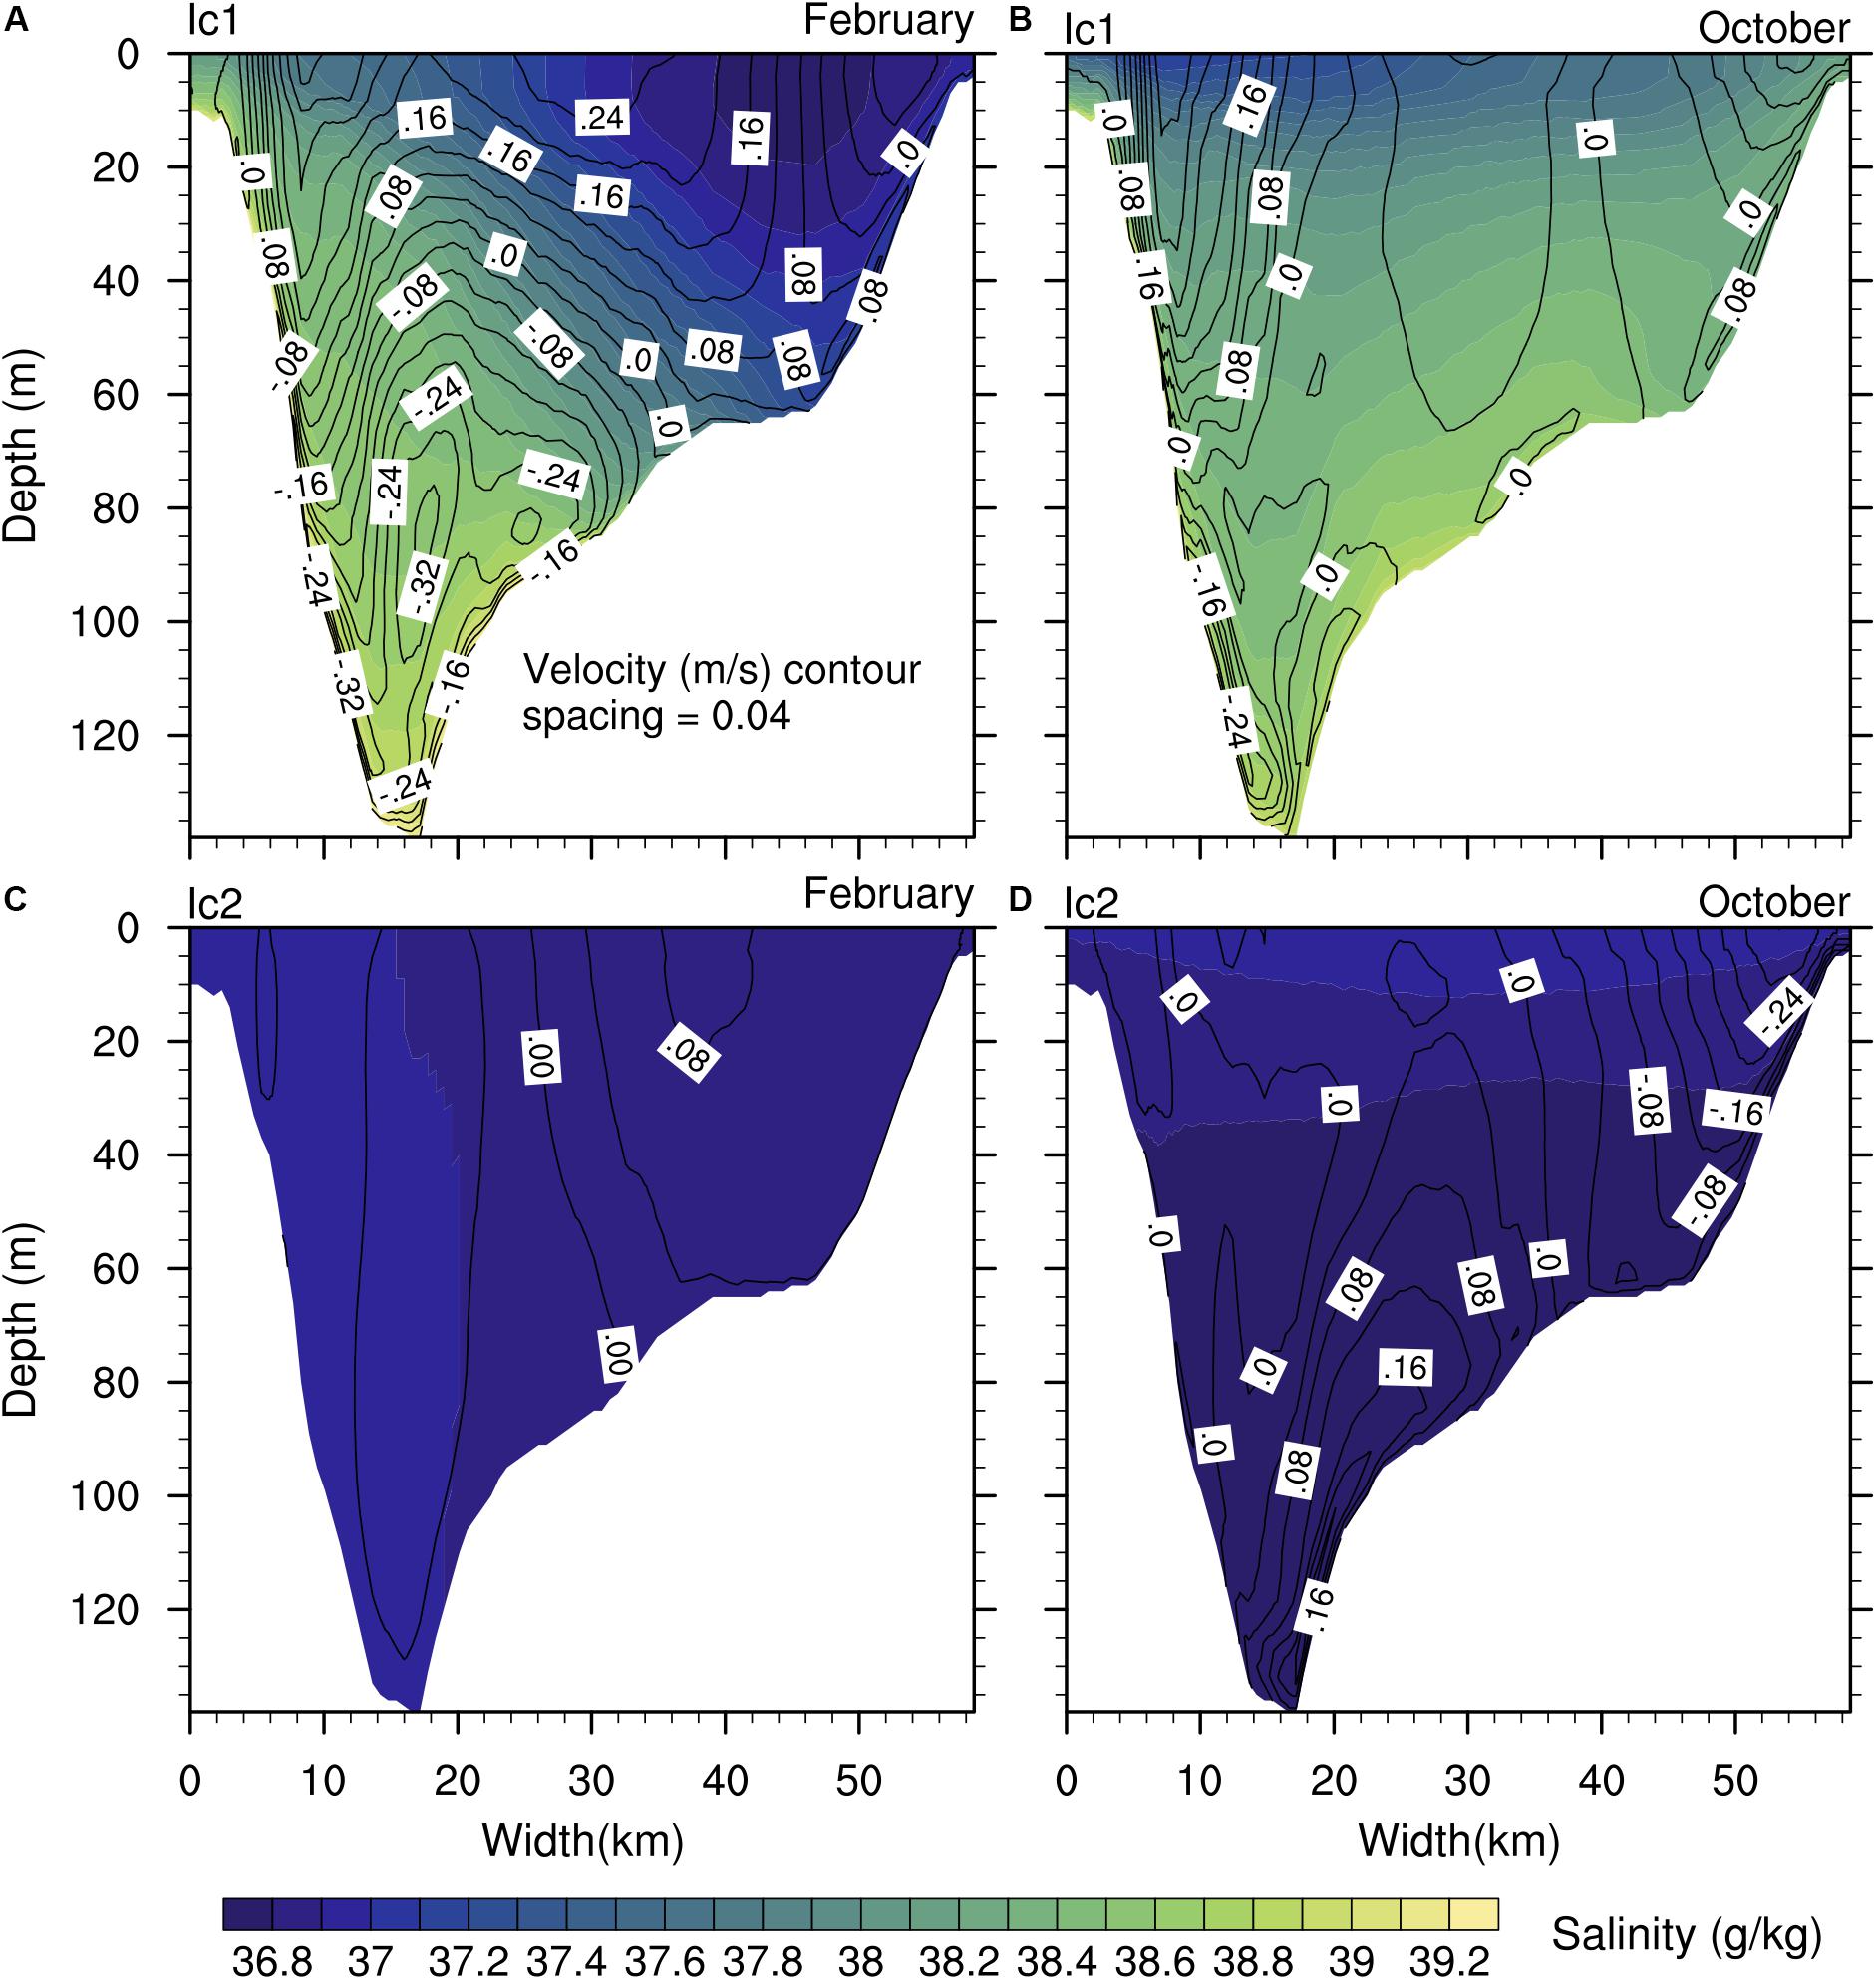
Figure 6. Simulated climatological February and October salinity and net lateral velocity (velocity in minus velocity out) into (positive) and out (negative) of the Gulf at the Strait of Hormuz in the overturning circulations associated with: Ic1 equilibrium (A,B) and Ic2 equilibrium (C,D); colored contour is salinity and line contour is net lateral velocity.
Unlike Ic1 simulation, lateral fluxes in Ic2 simulation have a much weak seasonality (Figure 5D). More importantly, in February, flow into the Gulf is in the northern shallow Strait region and flow out of the Gulf is in the deep southern channel (Figures 6C,D); whereas in October the opposite vertical flow structure occurs. Therefore, the annual structure and direction of Ic2 overturning circulation at the Strait, which switches between counterclockwise and clockwise patterns, represents a mixture of estuarine and anti-estuarine circulations.
In Ic4–Ic6 experiments, GARM was initialized with salinity 38, 39, and 40 g/kg, and simulation results show that monthly mean basin-average salinities and WSEs of Ic4–Ic6 remained between those of Ic1 and Ic2 equilibria (Figures 7A–C); and likewise with Ic4–Ic6 lateral inflow and outflow (Figure 7D). However, in Ic3 experiment where GARM was initialized with a salinity of 42.6 g/kg (which is higher than the present basin-average salinity of around 40.5 g/kg simulated in Ic1 experiment), the Gulf system is restored back to Ic1 equilibrium salinity. Furthermore, whereas the overturning circulation associated with Ic3 equilibrium is very similar to that of Ic1 equilibrium (anti-estuarine circulation), the overturning circulations associated with Ic4–Ic6 equilibria have vertical structures that are similar to the Ic2 vertical structure: mixture of anti-estuarine and estuarine circulation.
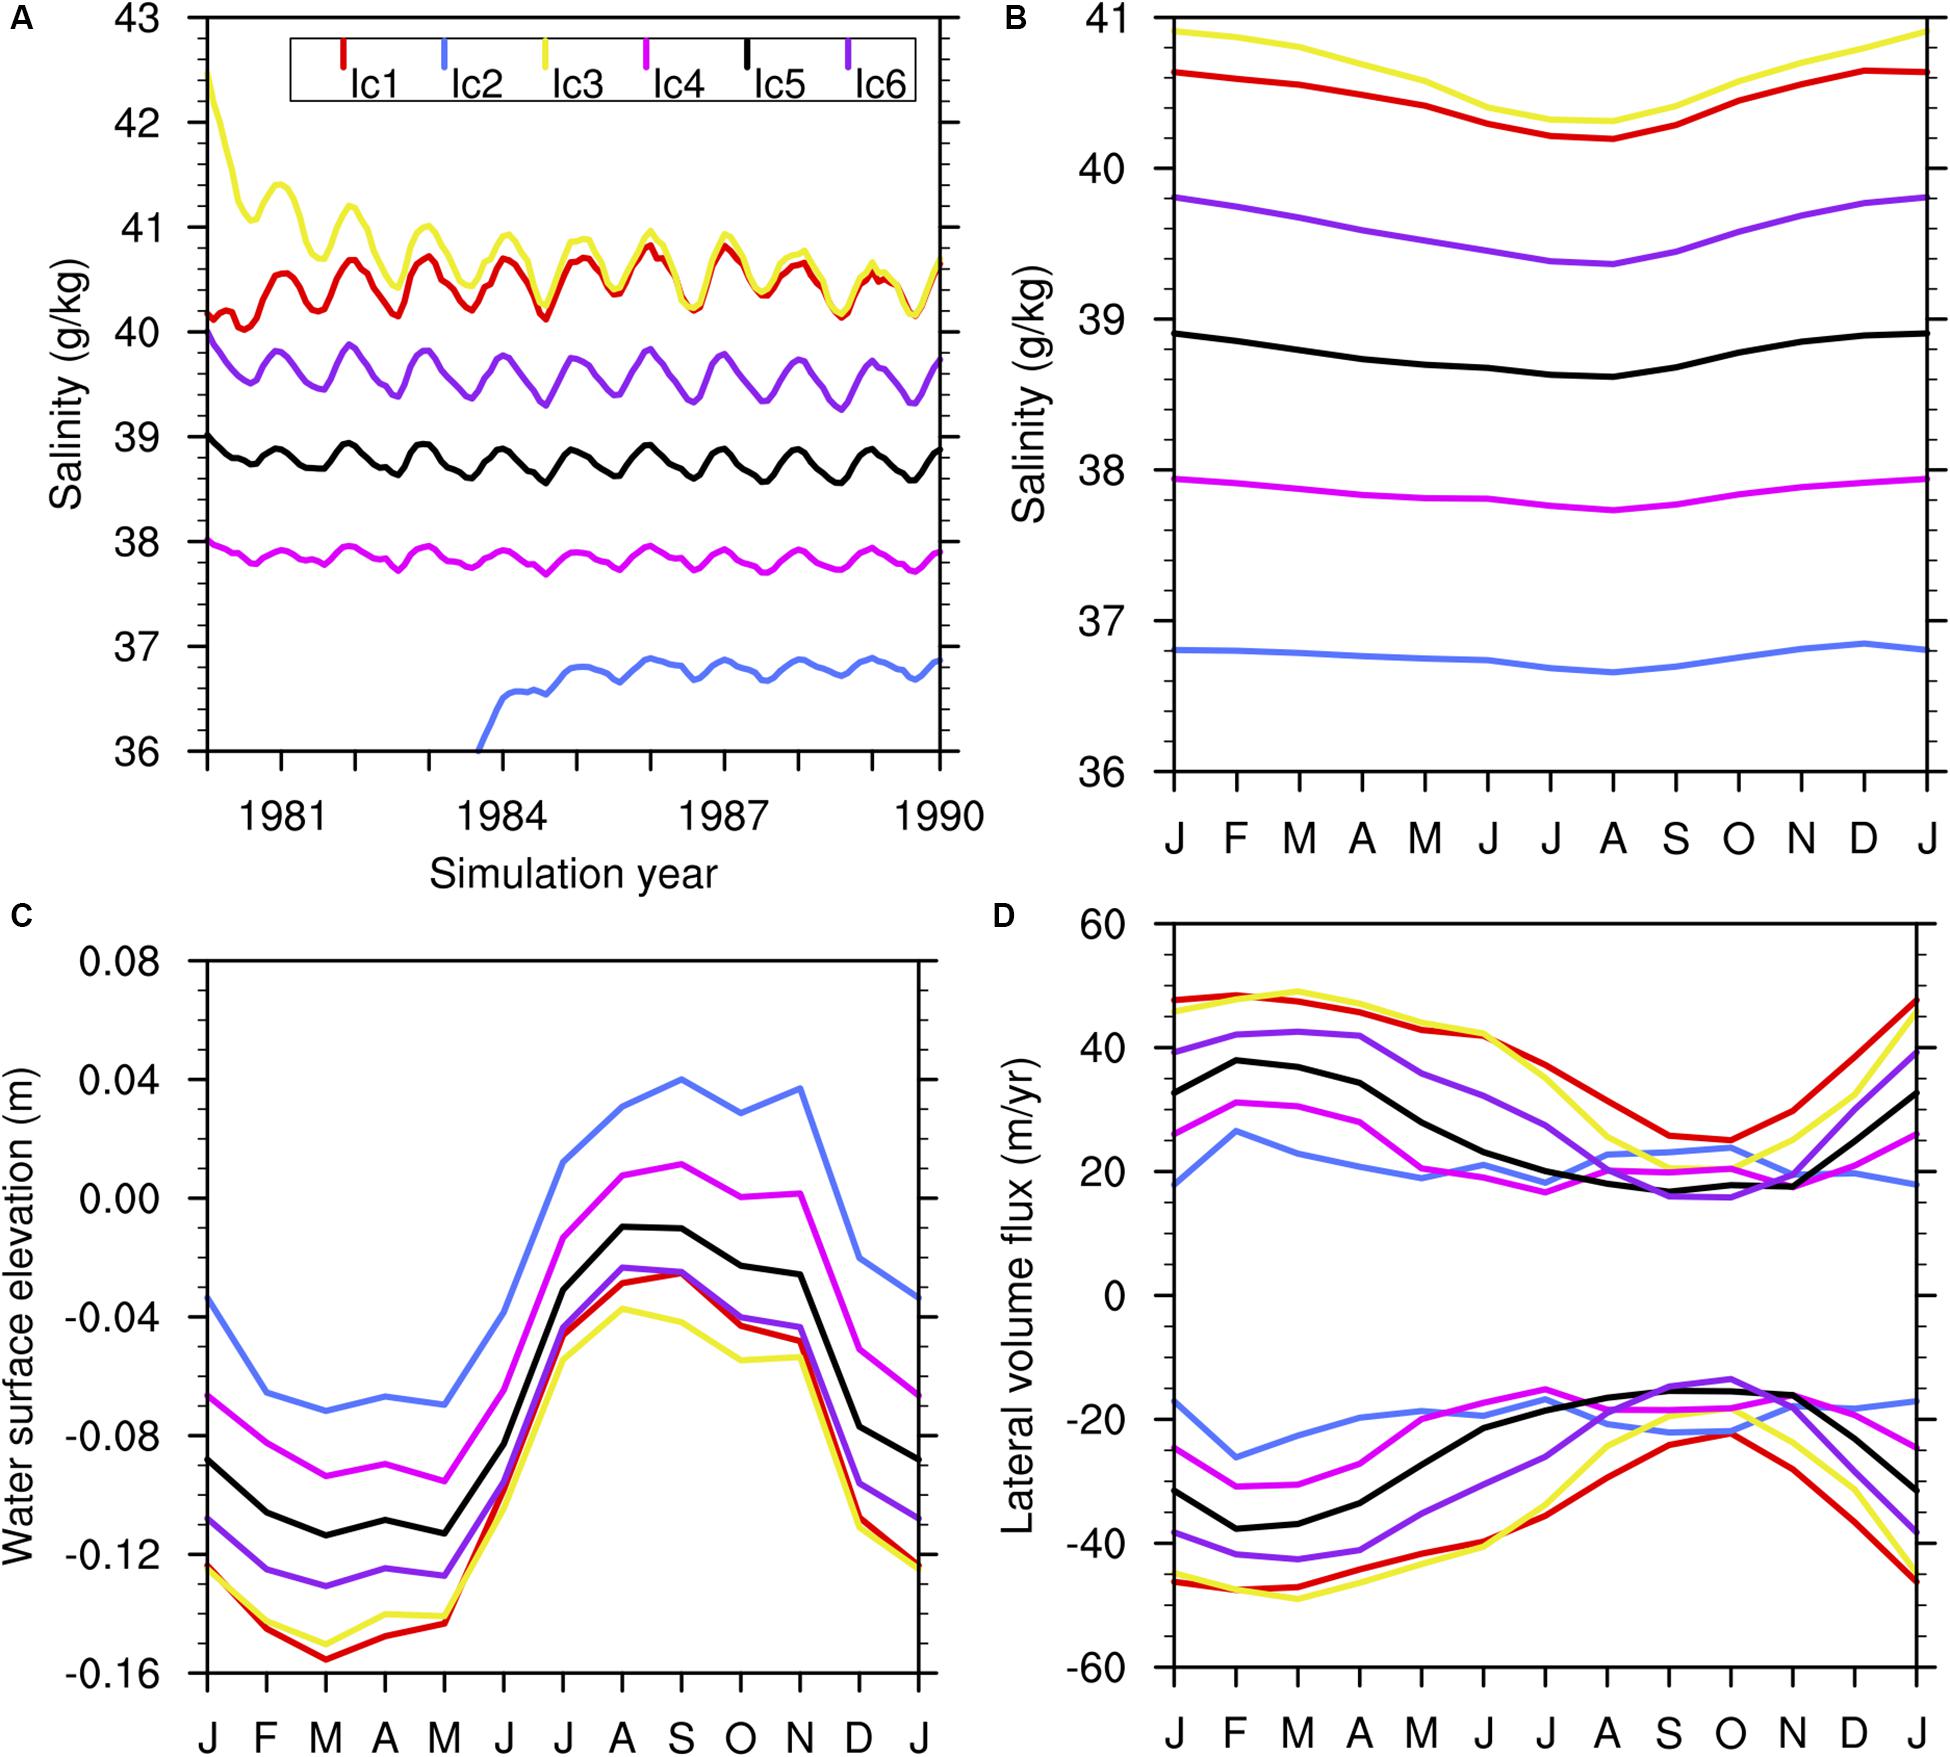
Figure 7. Simulated Gulf dynamical properties of three equilibria (Ic4–Ic6) intermediate between Ic1 and Ic2 equilibria. (A) Monthly basin-average salinity [Ic2 salinity (as in Figure 3A) is not plotted up to 36 g/kg improve clarity]. (B) Climatological monthly basin-average salinity. (C) Climatological monthly basin-average WSE (relative to the Indian Ocean). (D) climatological monthly lateral volume flux into the Gulf from the Indian Ocean (positive) and out of the Gulf to the Indian Ocean (negative) in the associated overturning circulation.
An important follow-up question is the stability of the different dynamical structures associated with Ic1–Ic6 simulations. A system in an equilibrium state is said to be stable if the system returns to its equilibrium state after a small, externally induced disturbance; whereas in an unstable equilibrium, natural feedbacks enhance small perturbations, and move the system away from the original equilibrium state. In the following section, we test the stability of Ic1–Ic6 equilibria to salinity perturbation in order to understand the resilience of the Gulf basin salinity to brine discharge from seawater desalination plants.
Stability of Equilibrium States to Seawater Desalination Perturbation
Model results show that the simulated Gulf system, when initialized with different salinities, exhibits both unstable and stable equilibrium salinity states in response to continuous seawater desalination perturbation. Ic1 equilibrium salinity state is stable because the Gulf system returns to this state after a seawater desalination perturbation was introduced starting from either a lower—36.8 g/kg—or a higher—44 g/kg—initial salinity (Figure 8A). Although multiple possible equilibrium salinity states were simulated when the GARM was initialized with different salinities in Ic1–Ic6 experiments, these states are not all stable. For example, Ic2 simulation was initialized with salinity of 24.8 g/kg and Gulf basin salinity increased to reach an equilibrium state of about 36.8 g/kg (Figures 5A, 7A,B), which turned out to be an unstable equilibrium. This is because when seawater desalination perturbation was introduced (D1a experiment), Gulf basin salinity continued to increase, crossing over several equilibria (Ic4–Ic6), until it reached Ic1 equilibrium salinity state—the current Gulf equilibrium salinity (Figure 8A). Whereas in D1a experiment the lateral fluxes became stronger during the adjustment process to Ic1 equilibrium salinity state, in D1b experiment the lateral fluxes became weaker during the adjustment process (Figure 8B).
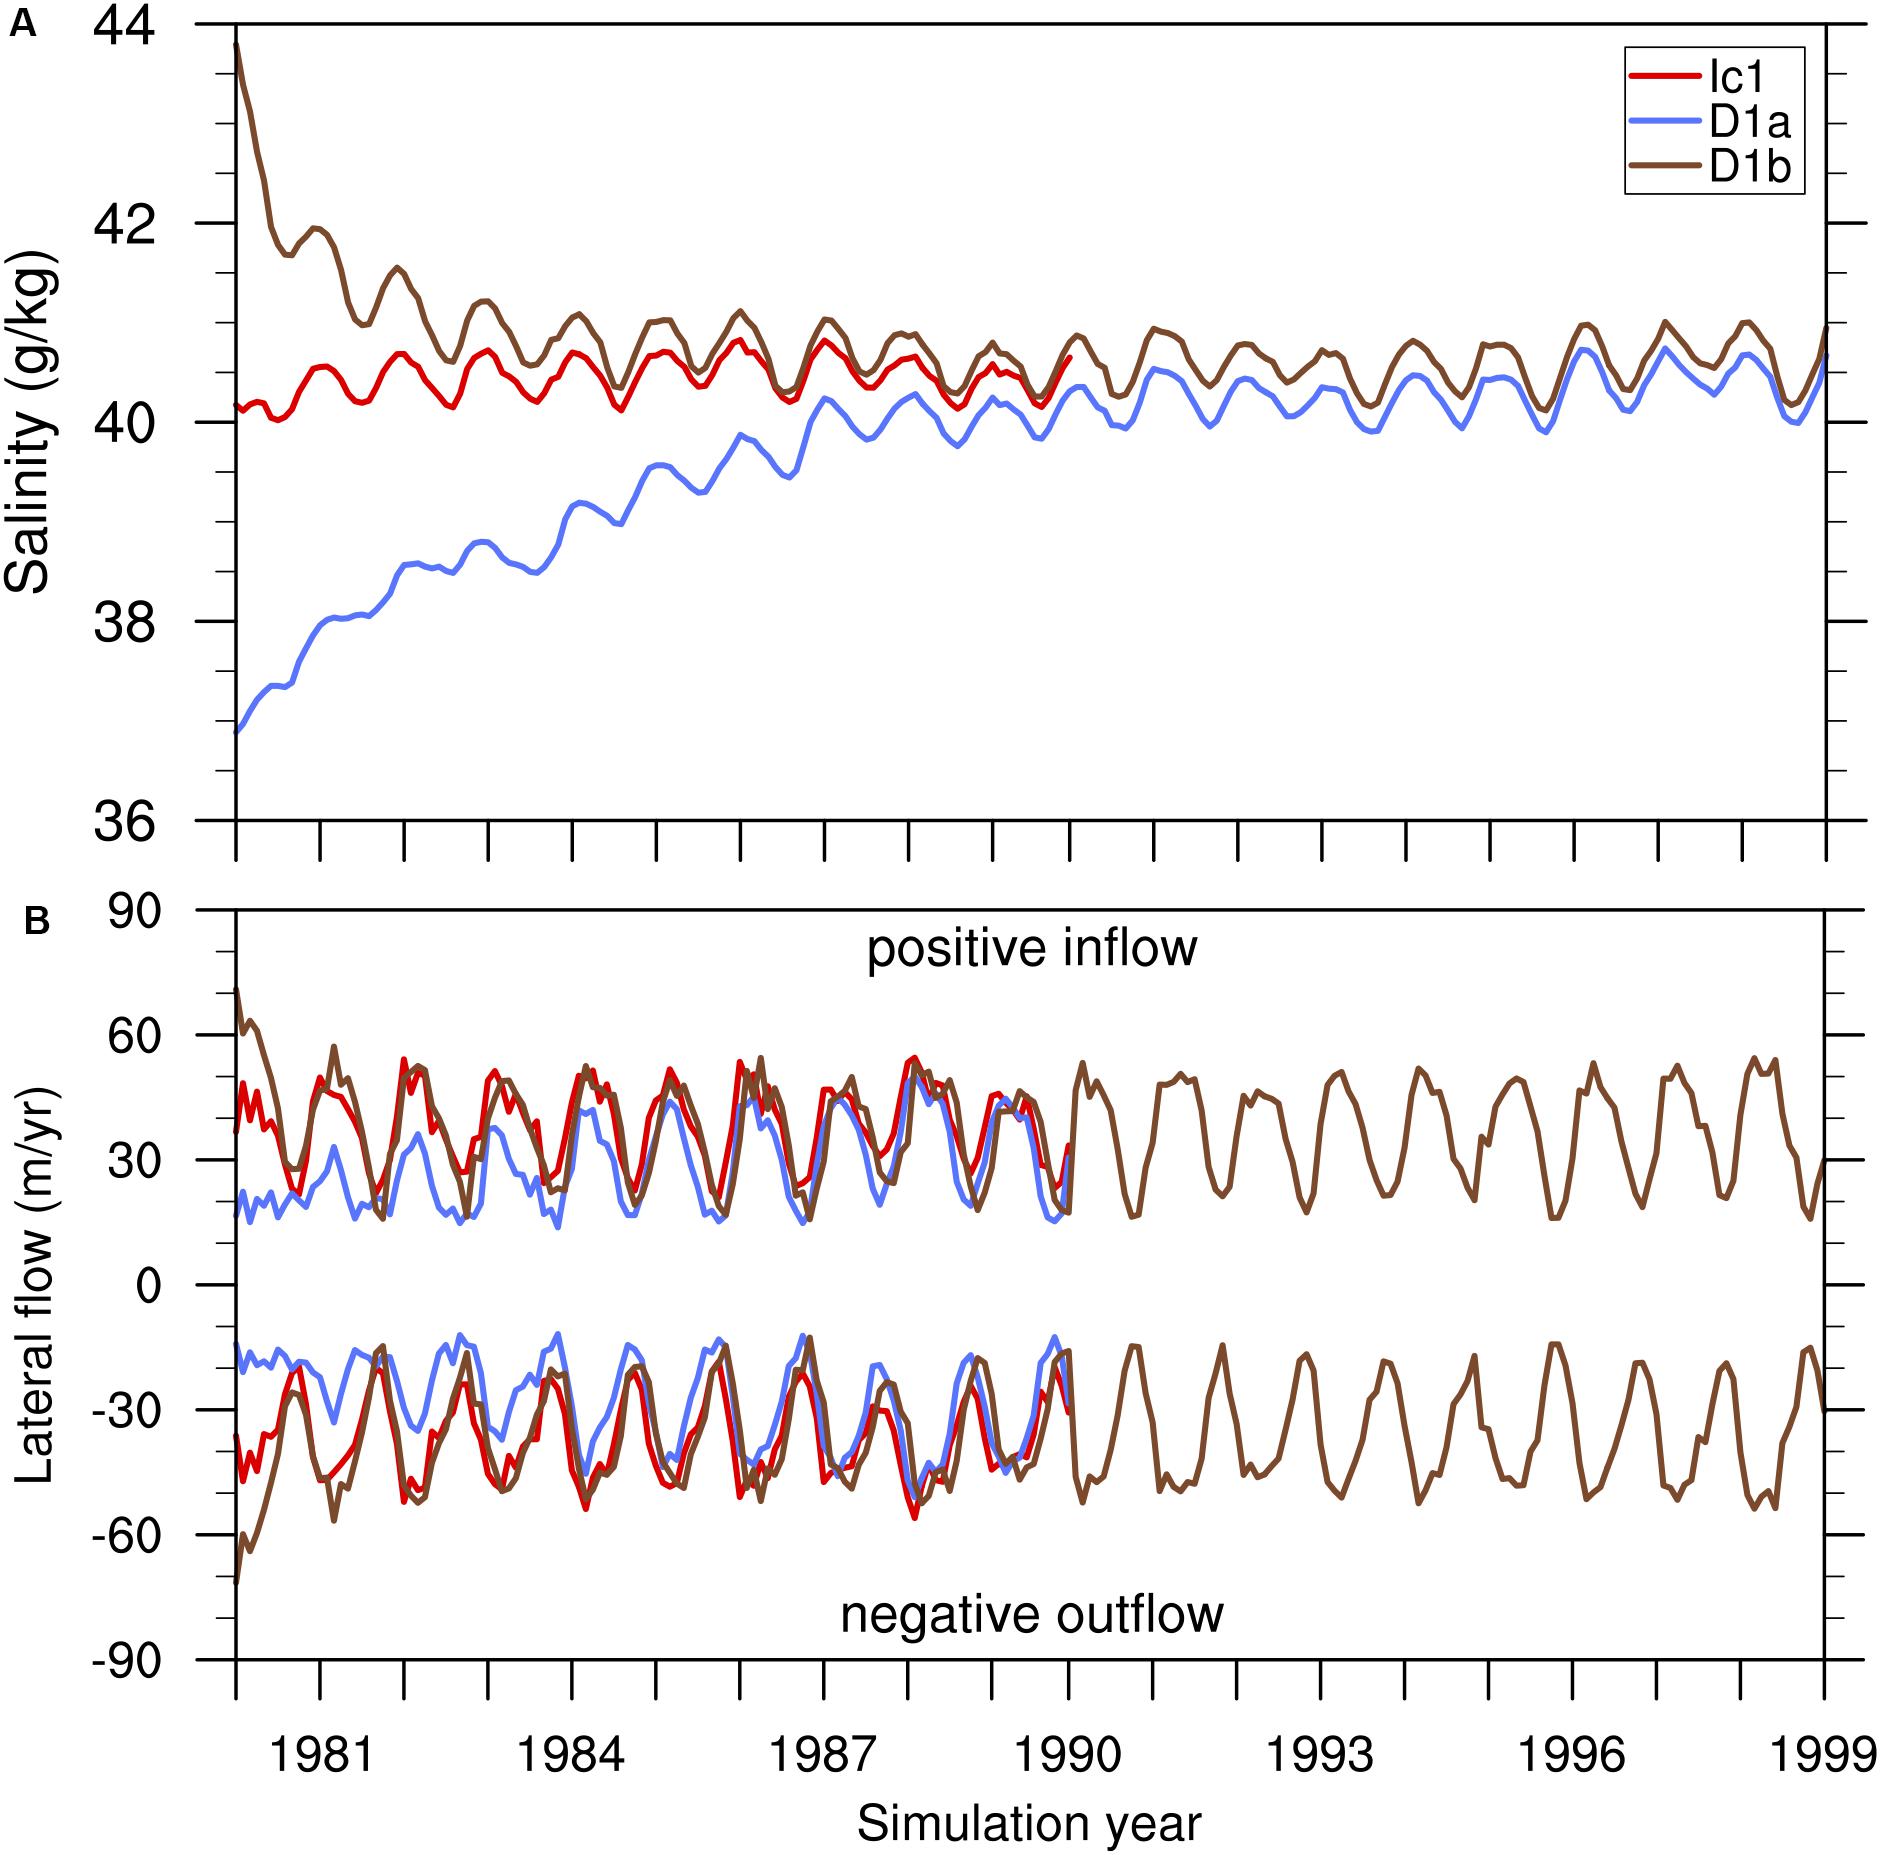
Figure 8. Simulated (A) Gulf monthly basin-average salinity in Ic1, D1a, and D1b experiments; and (B) the corresponding lateral volume inflow and outflow. See Table 1 for experiment design details.
At the annual time scale Ic1 equilibrium salinity and net lateral flow are also stable (Table 2). However, although Gulf equilibrium salinity in D1b experiment converges to Ic1 equilibrium salinity, the standard deviation of depth-average annual mean salinity in these two experiments are different (Figure 9), indicating that brine discharge causes substantial changes in regional salinity maxima and minima. The largest changes in regional salinities are in Gulf southwest region, especially in nearshore regions of Saudi Arabia, Bahrain, Qatar, and the United Arab Emirates (Figures 9C,D). These regional salinity changes, which has been quantified and discussed in Ibrahim and Eltahir (2019), are very likely to have significant impact on local marine ecosystems. Accordingly, D1b experiment identifies Gulf subdomains that should be monitored for ecosystem stress due to brine discharge.
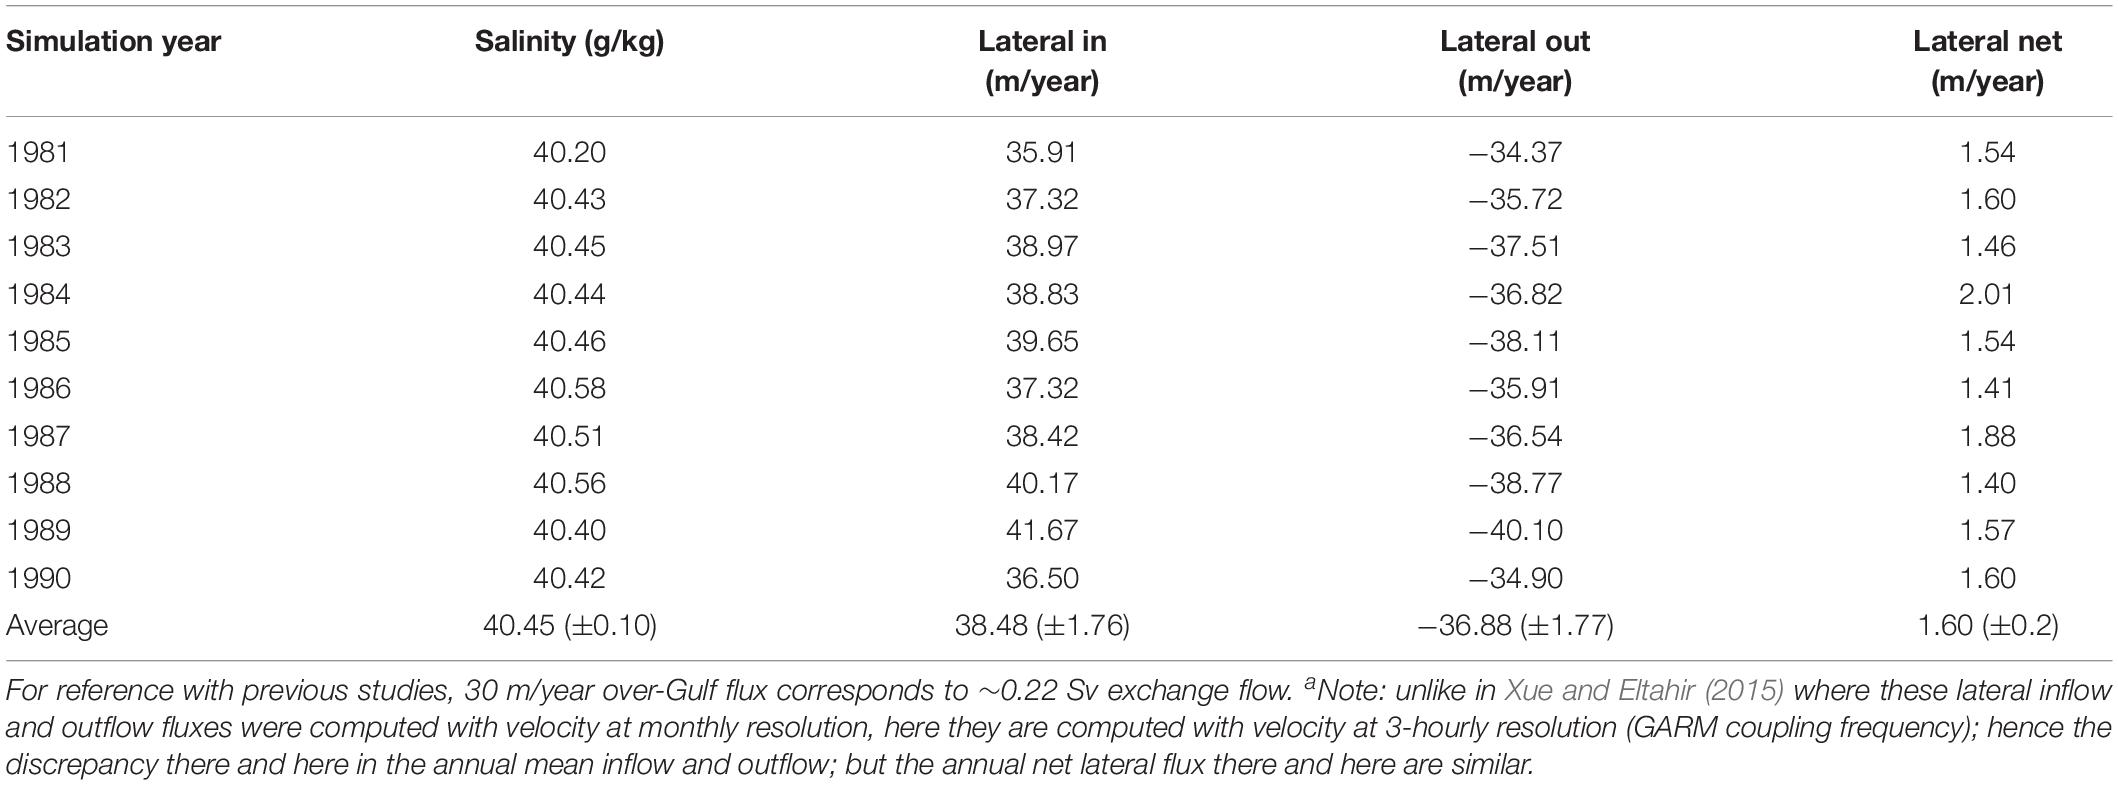
Table 2. Gulf annual mean basin-average salinity and lateral inflow (in), outflow (out), and net exchange fluxesa in Ic1 experiment.
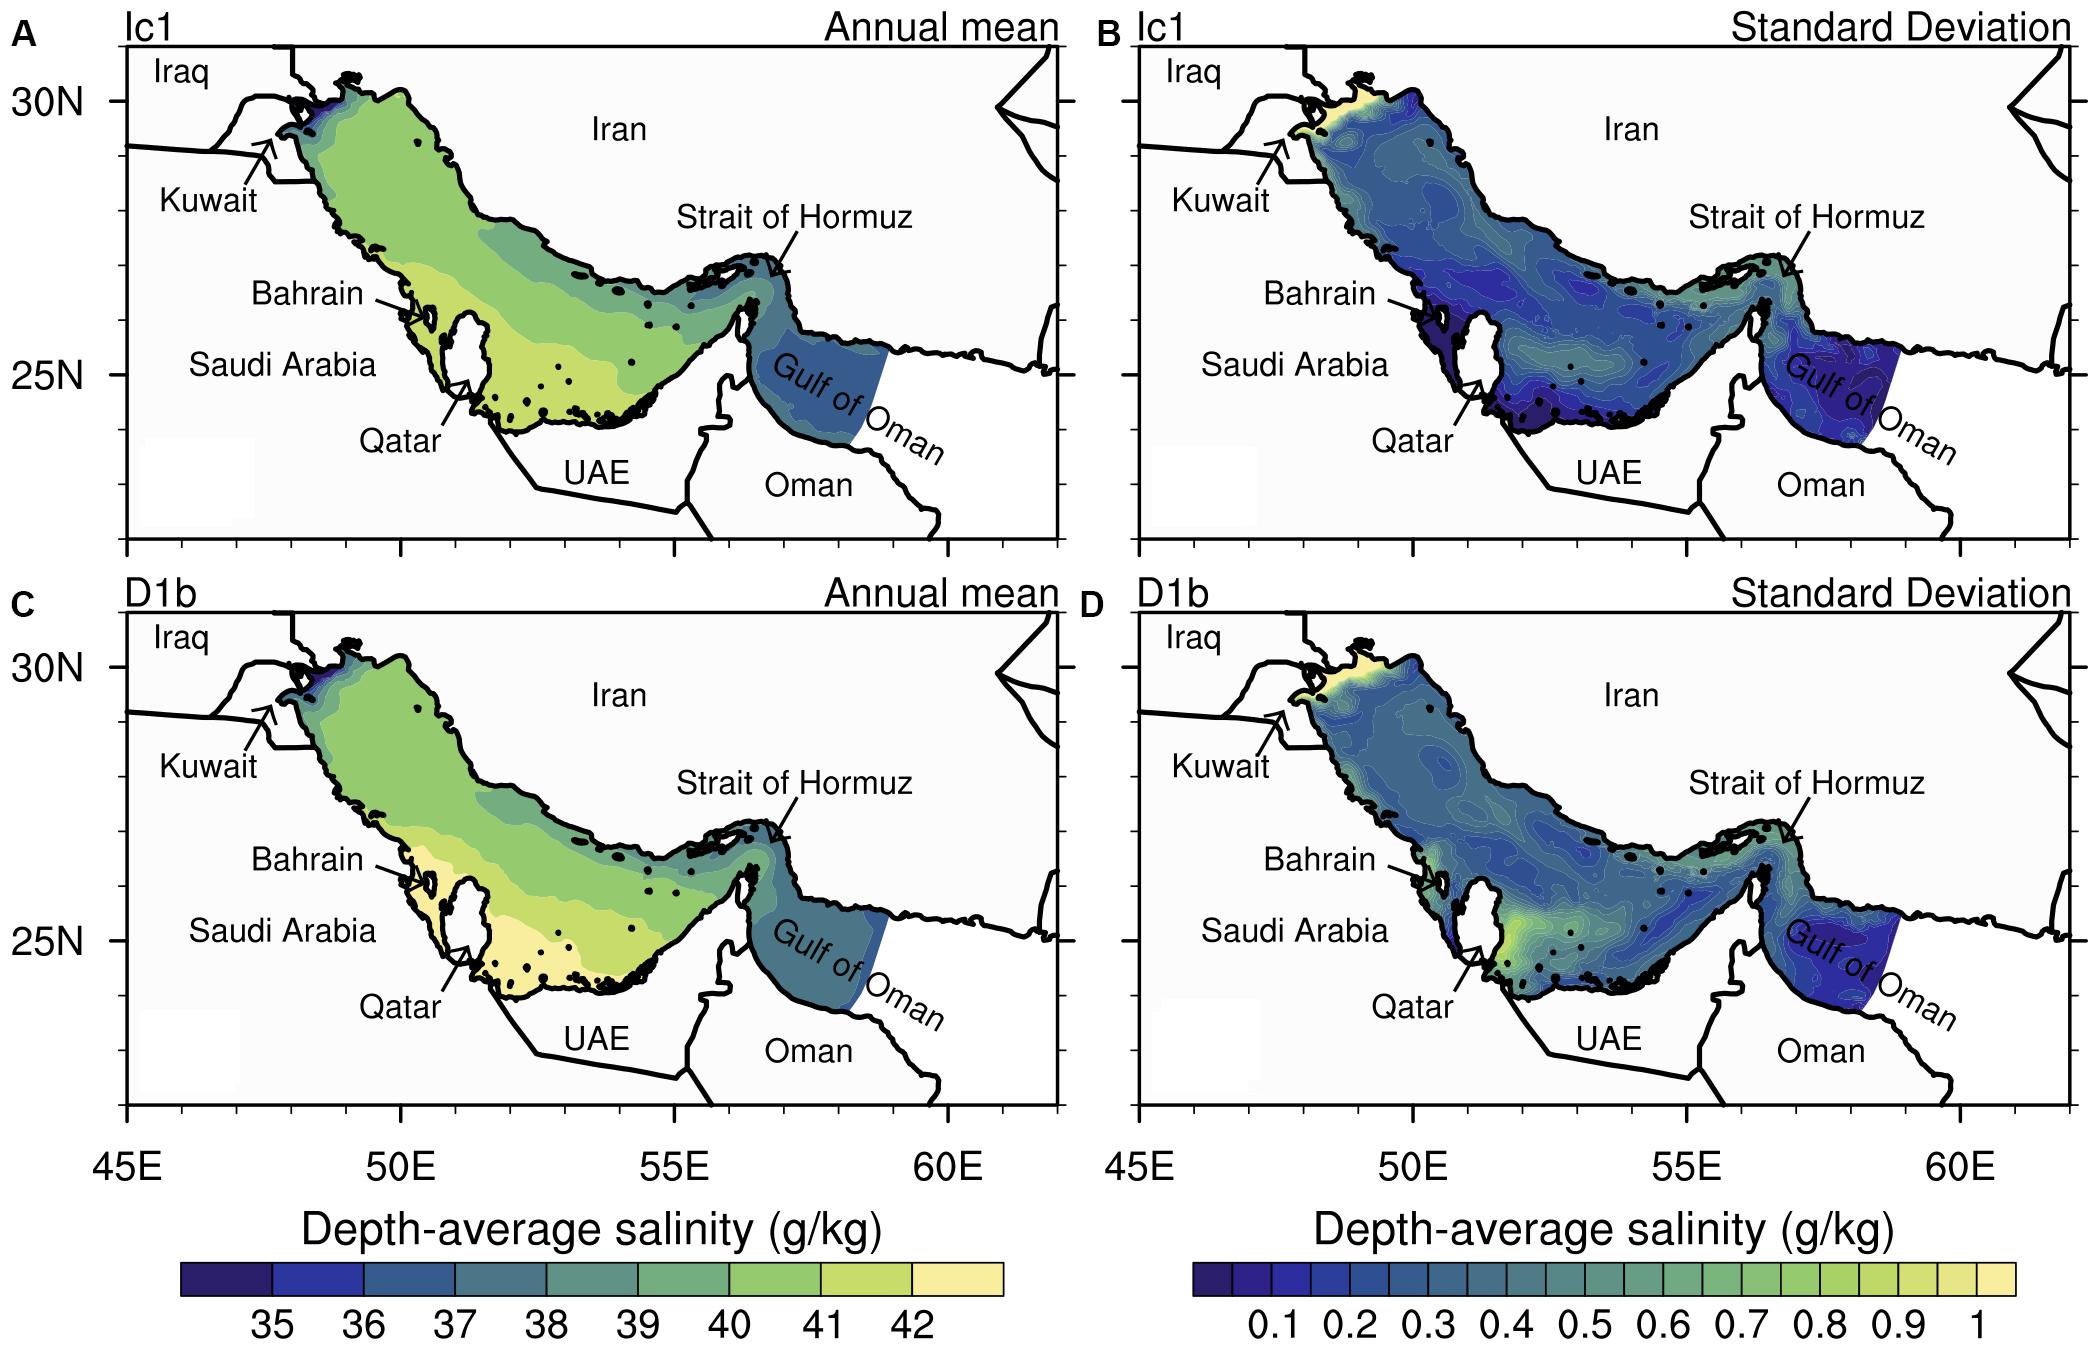
Figure 9. Simulated climatological, depth-average annual mean salinity and corresponding temporal standard deviation: (A,B) Ic1 experiment (1981–1990). (C,D) D1b experiment (1990–1999). Note that the large standard deviation in the northwestern Gulf is a consequence of the Tigris and Euphrates Rivers freshwater discharge into this region.
Statistical Analysis of the Stability of Current Gulf Equilibrium Salinity
We performed non-linear regression analysis, using the exponential model fitting, and linear regression analysis to further examine whether the Gulf has reached (or approaches) a steady equilibrium salinity state in D1a and D1b simulations. As the first step in both regression analyses, the climatological seasonal cycle is removed from the monthly mean basin-average salinity. For D1b experiment, the robustness of the non-linear regression model is visually evident (Figure 10B). Using data from the first 13-years (1981–1993) to build the model and data from the last 6-years (1994–1999) to test the model prediction, the non-linear regression model shows not only good fitting, but also reliable prediction: the 95% confidence bound is narrow (about 0.45), and residual errors of the fitting model are small (±0.3). The well-fitted regression model (Y = a + b⋅exp(−c⋅x),a = 40.56;b = 2.4318;c = 0.074) result suggests that Gulf annual mean basin-average salinity (i.e., equilibrium salinity) in D1b simulation has reached an equilibrium of ∼40.56 g/kg (±0.3), where Y is the monthly mean basin average salinity (climatological seasonal cycle removed), and x is the time (in month).
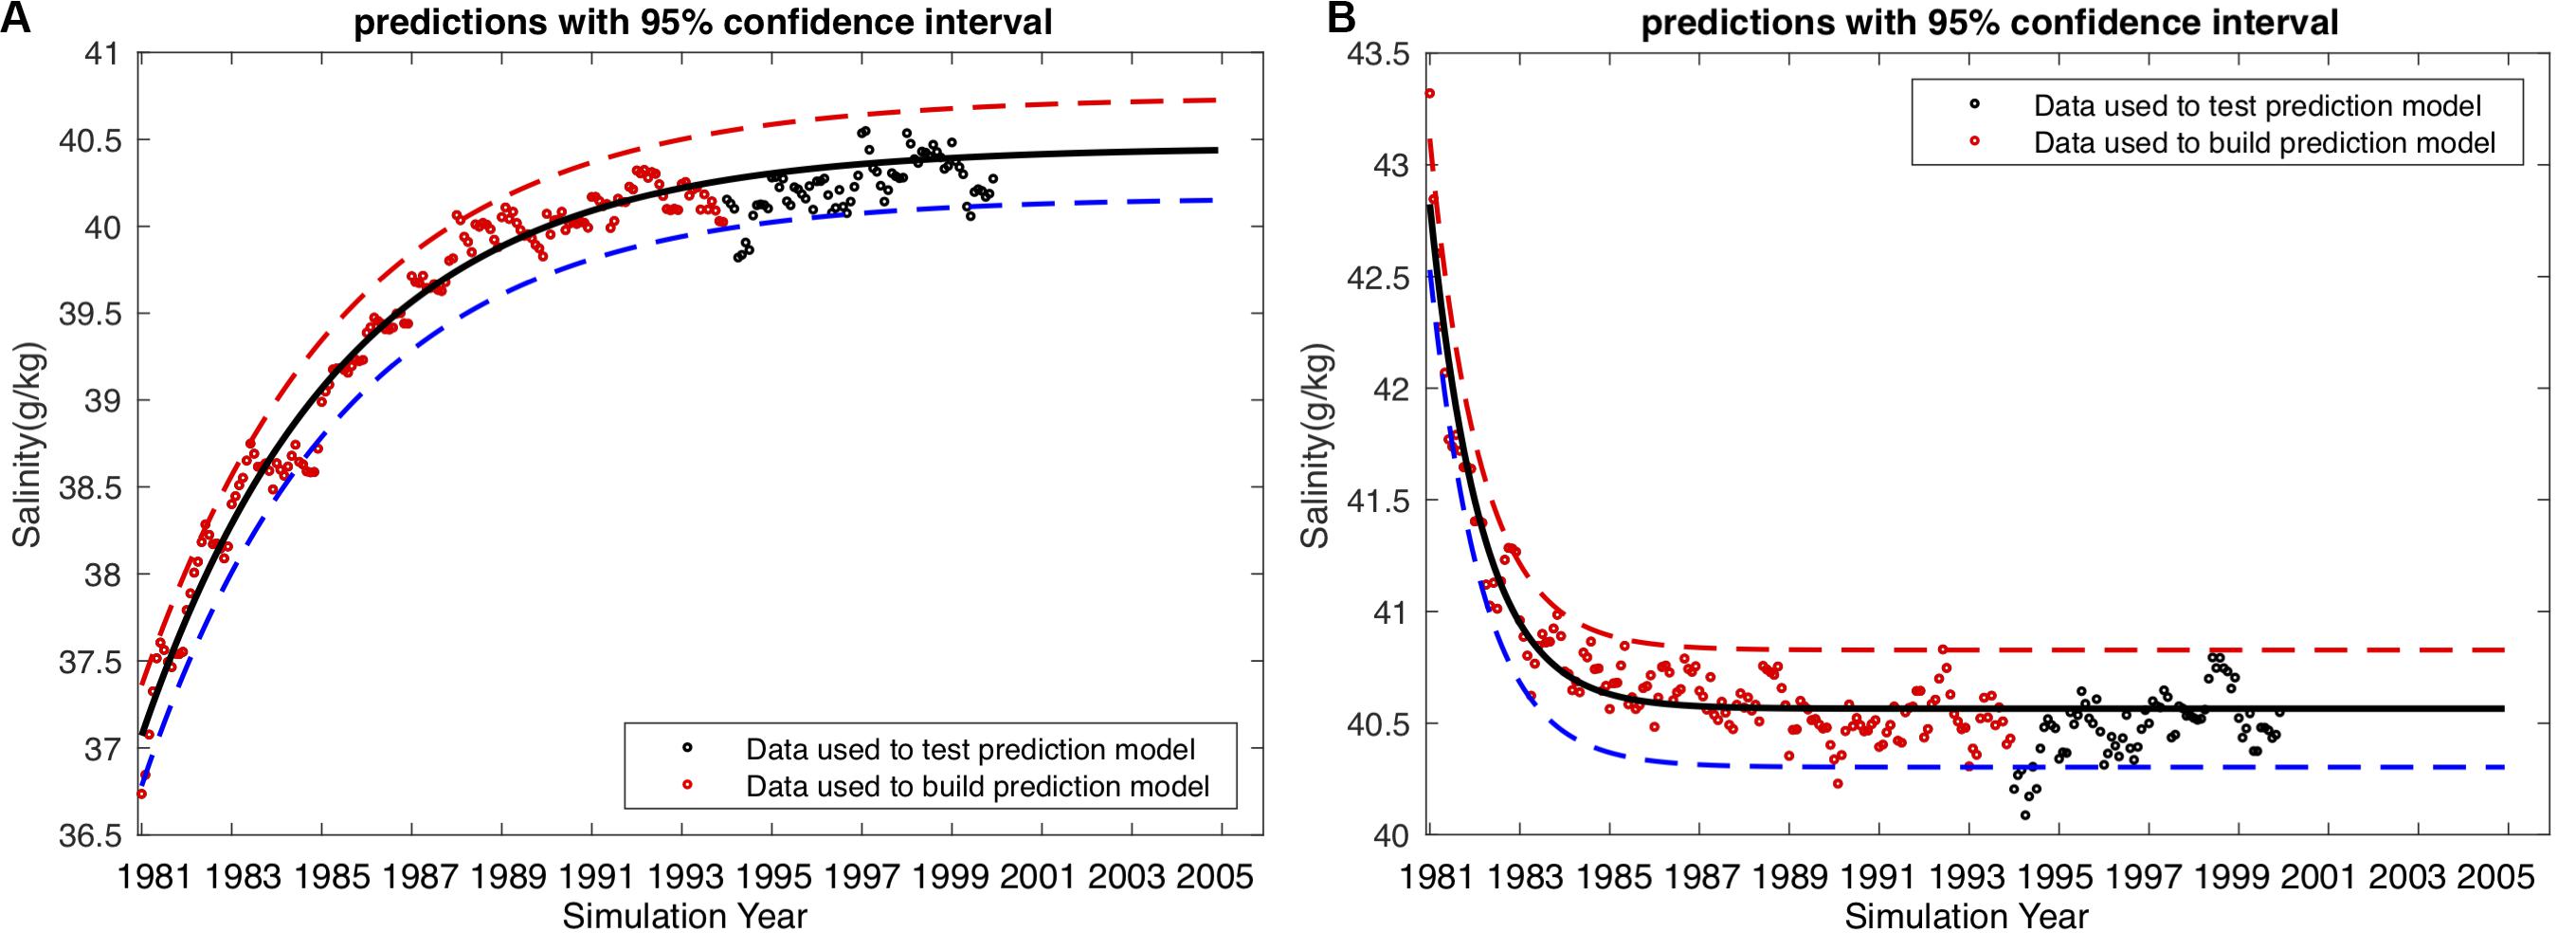
Figure 10. Exponential model to fit basin-average salinity in D1a (A) and D1b (B) experiments. GARM simulation results from 1981–1993 (red dots) are used to build the regression model, while results from 1994–1999 (black dots) are used to test the predictive capability of the regression model.
Furthermore, we performed a linear trend analysis for D1b simulation using the last 8-years simulation results: that is, we test a linear regression model, Y = β0 + β1x + ε, where Y is the monthly mean basin-average salinity (climatological seasonal cycle removed), x is time (in month), and ε is the random error. The coefficients of the best-fit linear regression model are β0 = 40.465,β1 = 0.00068943. This implies that it will take 120 years for Gulf annual mean basin-average salinity to increase by 1 g/kg, and this is so only if the trend is statistically significant. We then conducted a statistical hypothesis test on the linear regression coefficients, and F-test shows that we can’t reject the null hypothesis [β1 (slope) = 0] since the P-value = 0.29 > 0.05. Consequently, no statistically significant trend can be confirmed, reinforcing the conclusion that the Gulf has reached an equilibrium salinity state.
For D1a simulation, non-linear regression model result, using an exponential model (Y = a + b⋅exp(−c⋅x),a = 40.45;b = −3.4472;c = 0.0186), also fit robustly (Figure 10A) and suggests that Gulf basin-average salinity will eventually reach a steady state of ∼40.45 g/kg (±0.3). However, linear regression model with the last 8-year of simulation results shows a statistically significant trend (β0 = 40.11,β1 = 0.002312 with P-value = 2.4e–6 < 0.05), suggesting that the model has not reached steady state (Figure 10A). The reason why Gulf equilibrium salinity in D1a simulation has not reached the steady state is because of the small magnitude of seawater desalination perturbation (Table 1). Note that D1a and D1b simulations are designed to examine the stability of Gulf equilibrium salinity state: D1a simulation shows the transition from an unstable (Ic2) to the current stable (Ic1) equilibrium salinity state with small desalination, and D1b simulation shows that even when the Gulf system is initialized with a higher-than-present salinity and with a large desalination perturbation, Ic1 equilibrium salinity state is restored (Figure 8). The third salinity perturbation experiment, D1c simulation, is the same as D1a simulation but a large perturbation flux is applied (as in D1b). Results show that the equilibrium salinity state in D1c and D1b simulations are similar (figure not shown), but the transition period in D1c simulation (3 years) to reach Ic1 equilibrium is shorter compared to D1a simulation (>9 years).
In summary, the statistical analyses of D1a and D1b simulation experiments show the existence of a single stable Gulf equilibrium salinity of about 40.5 g/kg, which is an upper limit in the current climate.
Conclusion
Discharge of brine into the Gulf may cause costly environmental problems to marine ecosystems. To ensure the long-term sustainability of seawater desalination, which has grown rapidly in the last five decades, it is necessary and urgent to determine current Gulf equilibrium salinity and its response to seawater desalination perturbation. Model results from Ic1 simulation show a close agreement with multiple observational datasets including reanalysis temperature and salinity, and satellite-derived Gulf WSE, which is also directly influenced by the Gulf basin salinity and temperature. Thus, Ic1 simulation is a high-fidelity representation of the present Gulf system.
The current overturning circulation between the Gulf and the Indian Ocean is an anti-estuarine circulation (lateral inflow and outflow in the low- and high-density layers, respectively) with the year-round counterclockwise overturning circulation. In this anti-estuarine overturning circulation, Gulf WSE controls inflow to the Gulf: lower Gulf WSE, relative to the Indian Ocean, causes the Indian Ocean surface flow to the Gulf to increase, and vice versa. Strong evaporation removes freshwater excessively from the Gulf surface, resulting in high salinity (dense) water that drive more Gulf bottom waters to the Indian Ocean. Consequently, the anti-estuarine overturning circulation in the Gulf depends upon an adjustment of two opposite tendencies: thermal expansion, a function of Gulf heat content, and haline contraction, a function of Gulf salt content. If a positive salinity perturbation is applied to Gulf equilibrium salinity, such as in Ic3 and D1b experiment (Figures 7A, 8), then the resulting haline contraction causes flow out of the Gulf to increase until the equilibrium salinity is restored. Therefore, the anti-estuarine overturning circulation between the Gulf and the Indian Ocean is a dynamical upper limit, associated with a stable equilibrium salinity under the current climate.
The hydrodynamic characteristics of this dynamical upper limit (i.e., Ic1 experiment, the present Gulf salinity state) that are described here are consistent with findings from several other observational and modeling studies, including: (1) fresher lateral surface water inflow in northern regions of the Strait and hypersaline lateral Gulf outflow in southern regions of the Strait near the Omani slope (Figures 6A,B; Johns et al., 2003; Pous et al., 2004); (2) seasonal variation and vertical structure of salinity at the Strait (Figures 6A,B; Kämpf and Sadrinasab, 2006; Yao and Johns, 2010); (3) seasonal variation of lateral inflow and outflow (Figures 5D, 6A,B), and (4) interannual variation of Gulf basin-average salinity and volume transport of the inflow and outflow at the Strait (see estimates in Table 2; Pous et al., 2015; Lorenz et al., 2020). The salt in the Gulf comes from the Indian Ocean, thus a higher-salinity state will occur only if the anti-estuarine overturning circulation between the Gulf and Indian Ocean brings more salt into the Gulf. This circulation controls Gulf salt content; hence the circulation also controls Gulf salinity stability.
Our results show that the present equilibrium salinity is stable and unlikely to change under current climate ocean and atmosphere boundary conditions. The freshwater sink perturbation in D1b simulation is the same order of magnitude as the current Gulf seawater desalination capacity, about 5 km3/year. Thus, D1b simulation shows that seawater desalination comparable to current capacity does not increase Gulf annual mean basin-average salinity from its current level of 40.5 g/kg (±0.3 g/kg). However, under a changing climate, if seawater desalination capacity in the Gulf continues to expand to meet the projected freshwater demand in the region (World Bank, 2012), then it is possible that a new equilibrium salinity may be established in the future. However, the impact of changing future climate on Gulf equilibrium salinity is beyond the scope of this work and should be examined in future studies.
Data Availability Statement
The original contributions presented in the study are included in the article/Supplementary Material, further inquiries can be directed to the corresponding author/s.
Author Contributions
HI and EE conceived and designed the experiments. HI performed the modeling experiments. HI, EE, and PX analyzed the data and co-wrote the manuscript. All authors contributed to the article and approved the submitted version.
Conflict of Interest
The authors declare that the research was conducted in the absence of any commercial or financial relationships that could be construed as a potential conflict of interest.
Acknowledgments
The authors are grateful for the support of the MIT & Masdar Institute Cooperative Program (MIT&MICP). This is Contribution No. 75 OF THE GLRC at Michigan Tech. We thank Chenfu Huang for his assistance in the model data processing.
Supplementary Material
The Supplementary Material for this article can be found online at: https://www.frontiersin.org/articles/10.3389/fmars.2020.00573/full#supplementary-material
References
Antonov, I. (2010). World Ocean Atlas 2009, Salinity. 2, Washington D.C: U.S. Government Printing Office.
Ashkenazy, Y., Stone, P. H., and Melanotte-Rizzoli, P. (2012). Box modeling of the eastern mediterranean Sea. Phys. A Stat. Mech. Appl. 391, 1519–1531. doi: 10.1016/j.physa.2011.08.026
Bathiany, S., Claussen, M., and Fraedrich, K. (2012). Implications of climate variability for the detection of multiple equilibria and for rapid transitions in the atmosphere-vegetation system. Clim. Dyn. 38, 1775–1790. doi: 10.1007/s00382-011-1037-x
Brewer, P. G., and Dryssen, D. (1985). Chemical oceanography of the Persian Gulf. Prog. Oceanogr. 14, 41–55. doi: 10.1016/0079-6611(85)90004-7
Broecker, W. S., Peteet, D. M., and Rind, D. (1985). Does the ocean-atmosphere system have more than one stable mode of operation. Nature 315, 21–26. doi: 10.1038/315021a0
Budyko, M. (1969). The effect of solar radiation variations on the climate of earth. Tellus 21, 611–619. doi: 10.1111/j.2153-3490.1969.tb00466.x
Carton, J. A., Chepurin, G., Cao, X., and Giese, B. (2000). A simple ocean data assimilation analysis of the global upper ocean 1950-95. Part I: methodology. J. Phys. Oceanogr 30, 294–309. doi: 10.1175/1520-04852000030<0294:ASODAA<2.0.CO;2
Carton, J. A., and Giese, B. S. (2008). A reanalysis of ocean climate using simple ocean data assimilation (SODA). Mon. Weather Rev. 136, 2999–3017. doi: 10.1175/2007MWR1978.1
Chen, C., Beardsley, R. C., and Cowles, G. (2006). An unstructured grid, finite-volume coastal ocean model (FVCOM) system. Oceanography 19, 78–89. doi: 10.5670/oceanog.2006.92
Chen, C., Liu, H., and Beardsley, R. C. (2003). An unstructured grid, finite-volume, three dimensional, primitive equations ocean model: application to coastal ocean and estuaries. J. Atmos. Oceanic Technol. 20, 159–186. doi: 10.1175/1520-04262003020<0159:AUGFVT<2.0.CO;2
Chin, T. M., Vasquez-Cuervo, J., and Armstrong, E. M. (2017). A multi-scale high-resolution analysis of global sea surface temperature. Remote Sens. Environ. 200, 154–169. doi: 10.1016/j.rse.2017.07.029
Claussen, M., and Esch, M. (1994). Biomes computed from simulated climatologies. Clim. Dyn. 9, 235–243. doi: 10.1007/BF00208255
Copernicus. (2019). Sea Level Thematic Assembly Center. Avaliable at: http://marine.copernicus.eu (accessed July 24, 2019).
Dekker, S. C. (2010). Biogeophysical feedbacks trigger shifts in the modeled vegetation-atmosphere system at multiple scales. Biogeoscience 7, 1237–1245. doi: 10.5194/bg-7-1237-2010
Dupavillon, J. L., and Gillanders, B. M. (2009). Impacts of seawater desalination on the giant Australian cuttlefish Sepia apama in the upper Spencer Gulf. South Australia. Mar. Environ. Res. 67, 207–218. doi: 10.1016/j.marenvres.2009.02.002
Elimelech, M., and Phillip, W. A. (2011). The future of seawater desalination: energy, technology, and the environment. Science 333, 712–717. doi: 10.1126/science.1200488
Emery, K. O. (1956). Sediments and water of Persian Gulf. AAPG Bull. 40, 2354–2383. doi: 10.1306/5CEAE595-16BB-11D7-8645000102C1865D
Ferreira, D., Marshall, J., and Rose, B. (2011). Climate determinism revisited: multiple equilibria in a complex climate model. J. Clim. 24, 992–1012. doi: 10.1175/2010JCLI3580.1
Gianotti, R. L., and Eltahir, E. A. (2014a). Regional climate modeling over the maritime continent Part I: new parameterization for convective cloud fraction. J. Clim. 27, 1488–1503. doi: 10.1175/JCLI-D-13-00127.1
Gianotti, R. L., and Eltahir, E. A. (2014b). Regional climate modeling over the maritime continent Part II: new parameterization for autoconversion of the convective rainfall. J. Clim. 27, 1504–1523. doi: 10.1175/JCLI-D-13-00171.1
Giorgi, F., and Mearns, L. O. (1999). Introduction to special section: regional climate model revisited. J. Geophys. Res. Atmos. 104, 6335–6352. doi: 10.1029/98JD02072
Ibrahim, H. D., and Eltahir, E. A. (2019). Impact of brine discharge from seawater desalination plants on persian/arabian gulf salinity. J. Environ. Eng. 145:04019084. doi: 10.1061/(ASCE)EE.1943-7870.0001604
Im, E.-S., and Eltahir, E. A. (2017). Simulations of the observed ‘jump’ in the West African monsoon and its underlying dynamics using the MIT regional climate model. Int. J. Climatol. 38, 841–852. doi: 10.1002/joc.5214
Iselin, C. O. (1940). The necessity of a new approach to the study of the circulation on the continental shelf. Amer. Geoph. Union 21, 347–348. doi: 10.1029/TR021i002p00347
Johns, W. E., Yao, F., Olson, D. B., Josey, S. A., Grist, J. P., and Smeed, D. A. (2003). Observations of seasonal exchange through the Straits of Hormuz. J. Geophys. Res 108:3391. doi: 10.1029/2003JC001881
Jones, E., Qadir, M., van Vilet, M. T., Smakhtin, V., and Kang, S.-M. (2019). The state of desalination and brine production: a global outlook. Sci. Total Environ. 657, 1343–1356. doi: 10.1016/j.scitotenv.2018.12.076
Kämpf, J., and Sadrinasab, M. (2006). The circulation of the Persian Gulf: a numerical study. Ocean Sci. 2, 27–41. doi: 10.5194/os-2-27-2006
Langen, P. L., and Alexeev, V. A. (2004). Multiple equilibria and asymmetric climates in the CCM3 coupled to an oceanic mixed layer with thermodynamic sea ice. Geophys. Res. Lett. 31:L04201. doi: 10.1029/2003GL019039
Lattemann, S., and Hopner, T. (2008). Environmental impact and impact assessment of seawater desalination. Desalination 220, 1–15. doi: 10.1016/j.desal.2007.03.009
Locarnini, A. (2010). World Ocean Atlas 2009, Temperature, Vol. 1. Washington D.C: U.S. Government Printing Office.
Lorenz, M., Klingbeil, K., and Burchard, H. (2020). Numerical study of the exchange flow of the persian gulf using an extended total exchange flow analysis framework. J. Geophys. Res. Oceans 125:e2019JC015527. doi: 10.1029/2019JC015527
Marcella, M. P., and Eltahir, E. A. (2012). Modeling the summertime climate of Southwest Asia: the role of land surface processes in shaping the climate of semiarid regions. J. Clim. 25, 704–719. doi: 10.1175/2011JCLI4080.1
Marcella, M. P., and Eltahir, E. A. (2014). Introducing an irrigation scheme to a regional climate model: a case study over West Africa. J. Climate 27, 5708–5723. doi: 10.1175/jcli-d-13-00116.1
Pal, J. S., Giorgi, F., Bi, X., Elguindi, N., Solmon, F., Gao, X., et al. (2007). Regional climate modeling for the developing world: the ictp regcm3 and regcnet. Bull. Amer. Meteor. Soc. 88, 1395–1409. doi: 10.1175/BAMS-88-9-1395
Pous, S., Lazure, P., and Carton, X. (2015). A model of the general circulation in the persian gulf and in the strait of hormuz: intraseasonal to interannual variability. Cont. Shelf Res. 94, 55–70. doi: 10.1016/j.csr.2014.12.008
Pous, S. P., Carton, X., and Lazure, P. (2004). Hydrology and circulation in the strait of hormuz and the gulf of oman—results from the GOGP99 experiment: 1. Strait of Hormuz. J. Geophys. Res 109:C12037. doi: 10.1029/2003JC002145
Privett, D. W. (1959). Monthly charts of evaporation from the N. Indian Ocean (including the Red Sea and the Persian Gulf). Q. J. R. Meteorol. Soc. 85, 424–428. doi: 10.1002/qj.49708536614
Reynolds, M. R. (1993). Physical oceanography of the Gulf, Strait of Hormuz, and the Gulf of Oman-results from the Mt Mitchell expedition. Mar. Pollut. Bull. 27, 35–59. doi: 10.1016/0025-326X(93)90007-7
Reynolds, R. W., Smith, T. M., Liu, C., Chelton, D. B., Casey, K. S., and Schlax, M. G. (2007). Daily high-resolution-blended analyses for sea surface temperature. J. Clim. 20, 5473–5496. doi: 10.1175/2007JCLI1824.1
Roberts, D. A., Johnston, E. L., and Knott, N. A. (2010). Impact of desalination plant discharge on the marine environment. Water Res. 44, 5117–5128. doi: 10.1016/j.watres.2010.04.036
Sale, P. F., Feary, D. A., Bauman, A. G., Cavalcante, G. H., and Drouillard, K. G. (2011). The growing need for sustainable ecological management of marine communities of the Persian Gulf. Ambio 40, 4–17. doi: 10.1007/s13280-010-0092-6
Saleh, D. (2010). Stream gage Descriptions and Streamflow Statistics for Sites in the Tigris River and Euphrates River Basins, Iraq. Reston, VA: U.S. Geological Survey.
Sellers, W. D. (1969). A global climate model based on the energy balance of the earth-atmosphere system. J. Appl. Meteor. 8, 392–400. doi: 10.1175/1520-04501969008<0392:AGCMBO<2.0.CO;2
Sheppard, C., Al-Husiani, M., Al-Jamali, F., Al-Yamani, F., Baldwin, R., Bishop, J., et al. (2010). The Gulf: a young sea in deline. Mar. Pollut. Bull. 60, 13–38. doi: 10.1016/j.marpolbul.2009.10.017
Stocker, T. F. (1999). Abrupt climate changes: from past to future- a review. Int. J. Earth Sci. 88, 365–374. doi: 10.1007/s005310050271
Stommel, H. (1961). Thermohaline convection with two stable regimes of flow. Tellus 13, 224–230. doi: 10.1111/j.2153-3490.1961.tb00079.x
Valcke, S. (2013). The OASIS3 coupler: a European climate modelling community software. Geosci. Model Dev. 6, 373–388. doi: 10.5194/gmd-6-373-2013
Voutchkov, N. (2018). Energy use for membrane seawater desalination-current status and trends. Desalination 431, 2–14. doi: 10.1016/j.desal.2017.10.033
Wang, G., and Eltahir, E. (2000). Biosphere-atmosphere interactions over West Africa II: multiple climate equilibria. Q. J. Roy. Meteor. Soc. 126, 1261–1280. doi: 10.1002/qj.49712656504
Winter, J. M., and Elfatih, E. A. (2009). Coupling the integrated biosphere simulator to regional climate model version 3. J. Clim. 22, 2743–2757. doi: 10.1175/2008JCLI2541.1
World Bank (2012). Renewable Energy Desalination: an Emerging Solution to Close the Water Gap in the Middle East and North Africa. Washington DC: World Bank.
Xue, P., and Eltahir, E. A. (2015). Estimation of the heat and water budgets of the Persian (Arabian) Gulf using a regional climate model. J. Clim. 28, 5041–5062. doi: 10.1175/JCLI-D-14-00189.1
Yao, F., and Johns, W. E. (2010). A HYCOM modeling study of the Persian Gulf: 2 Formation and export of Persian Gulf Water. J. Geophys. Res. 115:C11018. doi: 10.1029/2009JC005788
Keywords: Persian/Arabian Gulf Salinity, overturning circulation, salinity perturbation, seawater desalination, equilibrium state, stability
Citation: Ibrahim HD, Xue P and Eltahir EAB (2020) Multiple Salinity Equilibria and Resilience of Persian/Arabian Gulf Basin Salinity to Brine Discharge. Front. Mar. Sci. 7:573. doi: 10.3389/fmars.2020.00573
Received: 08 April 2020; Accepted: 22 June 2020;
Published: 10 July 2020.
Edited by:
Alejandro Jose Souza, Centro de Investigacion y de Estudios Avanzados – Unidad Mérida, MexicoReviewed by:
Mei Xuefei, East China Normal University, ChinaHans Burchard, Leibniz Institute for Baltic Sea Research (LG), Germany
Marvin Lorenz, Leibniz Institute for Baltic Sea Research, Germany, in collaboration with reviewer HB
Copyright © 2020 Ibrahim, Xue and Eltahir. This is an open-access article distributed under the terms of the Creative Commons Attribution License (CC BY). The use, distribution or reproduction in other forums is permitted, provided the original author(s) and the copyright owner(s) are credited and that the original publication in this journal is cited, in accordance with accepted academic practice. No use, distribution or reproduction is permitted which does not comply with these terms.
*Correspondence: Hamed D. Ibrahim, aGlicmFoaW1AbWl0LmVkdQ==; aGFtZWRkaWJyYWhpbUBnbWFpbC5jb20=; Pengfei Xue, cGV4dWVAbXR1LmVkdQ==
†ORCID: Hamed D. Ibrahim, orcid.org/0000-0002-4720-3476; Pengfei Xue, orcid.org/0000-0002-5702-421X