 Ron K. Hoeke
 Herve Damlamian
 Jérome Aucan
 Moritz Wandres
- 1Climate Science Centre, Commonwealth Science and Industrial Research Organisation (CSIRO), Aspendale, VIC, Australia
- 2Geoscience, Energy and Maritime Division, Pacific Community (SPC), Suva, Fiji
- 3Laboratoire d’Ecologie Marine Tropicale des Océans Pacifique et Indien (ENTROPIE), Institut de Recherche pour le Développement (IRD), Nouméa, New Caledonia
Tropical cyclone (TC) Pam formed in the central south Pacific in early March 2015. It reached a category 5 severity and made landfall or otherwise directly impacted several islands in Vanuatu, causing widespread damage and loss of life. It then moved along a southerly track between Fiji and New Caledonia, generating wind-waves of up to approximately 15 m, before exiting the region around March 15th. The resulting swell propagated throughout the central Pacific, causing flooding and damage to communities in Tuvalu, Kiribati and Wallis and Futuna, all over 1,000 km from TC Pam’s track. The severity of these remote impacts was not anticipated and poorly forecasted. In this study, we use a total water level (TWL) approach to estimate the climatological conditions and factors contributing to recorded impacts at islands in Tuvalu and Kiribati. At many of the islands, the estimated TWL associated with Pam was the largest within the ∼40-year period of available data, although not necessarily the largest in terms of estimated wave setup and runup; elevated regional sea-level also contributed to the TWL. The westerly wave direction likely contributed to the severity, as did the locally exceptional storm-swell event’s long duration; the overall timing and duration of the event was modulated by astronomical tides. The findings of this study give impetus to the development, implementation and/or improvement of early warning systems capable of predicting such reef-island flooding. They also have direct implications for more accurate regional flood hazard analyses in the context of a changing climate, which is crucial for informing adaptation policies for the atolls of the central Pacific.
Introduction
Coastal areas are perceived to be at risk of increasingly frequent and severe flooding and erosion impacts associated with sea level rise (SLR). This has led to concern that island nations are especially vulnerable to coastal flooding (Nicholls et al., 2007; Seneviratne et al., 2012), particularly the atoll nations of Kiribati, Tuvalu, Marshall Islands and Maldives (Barnett and Adger, 2003; Nicholls et al., 2011). There has been some debate on the nature and timing of these impacts, however. Several studies have presented evidence that, despite sea level rise on the order of 20 cm over the last century, atoll islands have not (yet) experienced net erosion and that many may have some capacity to keep up with future SLR (e.g., Webb and Kench, 2010; Beetham et al., 2017; Tuck et al., 2019) through the deposition of reef-derived materials during storm over wash events (e.g., Maragos et al., 1973; Smithers and Hoeke, 2014). Other studies have suggested that rates of SLR will outstrip reefs accretion rates (Perry et al., 2018), and that in any case, the increased frequency and severity of inundation will make most atoll islands uninhabitable within a few decades (e.g., Storlazzi et al., 2018). Regardless, there is widespread agreement that overall vulnerability to SLR will be heterogeneous due to differences in reef/island morphology and exposure to extreme sea level drivers (viz sea level variability, storm waves, storm surges, and astronomic tides), and that more detailed event-based case studies are needed to understand the role of background sea level (and SLR) compared to these drivers (Woodroffe, 2008; Beetham and Kench, 2018; Idier et al., 2019). Such case studies can also better inform the development of early warning forecast systems, which are essential in the face of likely increased flooding and erosion events (Storlazzi, 2018), by identifying the relative importance of the extreme sea level processes and indications of local vulnerability.
In this study, we investigate extensive flooding and erosion impacts which occurred in Tuvalu and the Gilbert Islands of Kiribati during March 2015. Unlike the case studies of Hoeke et al. (2013), Wadey et al. (2017), Ford et al. (2018), and Wandres et al. (2020), all of which focused at least primarily on events triggered by distance-source swell waves generated by mid-latitude (temperate) cyclones in the western Pacific (primarily the Federated States of Micronesia, Papua New Guinea, and Solomon Islands), the Maldives, Majuro Atoll (Marshall Islands) and Fiji, respectively, the events in Tuvalu and Kiribati described here are associated with the passage of tropical cyclone (TC) Pam. TC Pam formed in the central south Pacific in early March 2015. It reached a category five severity and made landfall or otherwise directly impacted several islands in Vanuatu, causing widespread damage and loss of life (Gov. of Vanuatu, 2015). It then moved along a southerly track between Fiji and New Caledonia, exiting the region around March 15th. The resulting swell propagated throughout the central Pacific, causing flooding and damage to communities in Tuvalu, Kiribati, and Wallis and Futuna, all over 1,000 km from TC Pam’s track (Damlamian et al., 2017; Figure 1).
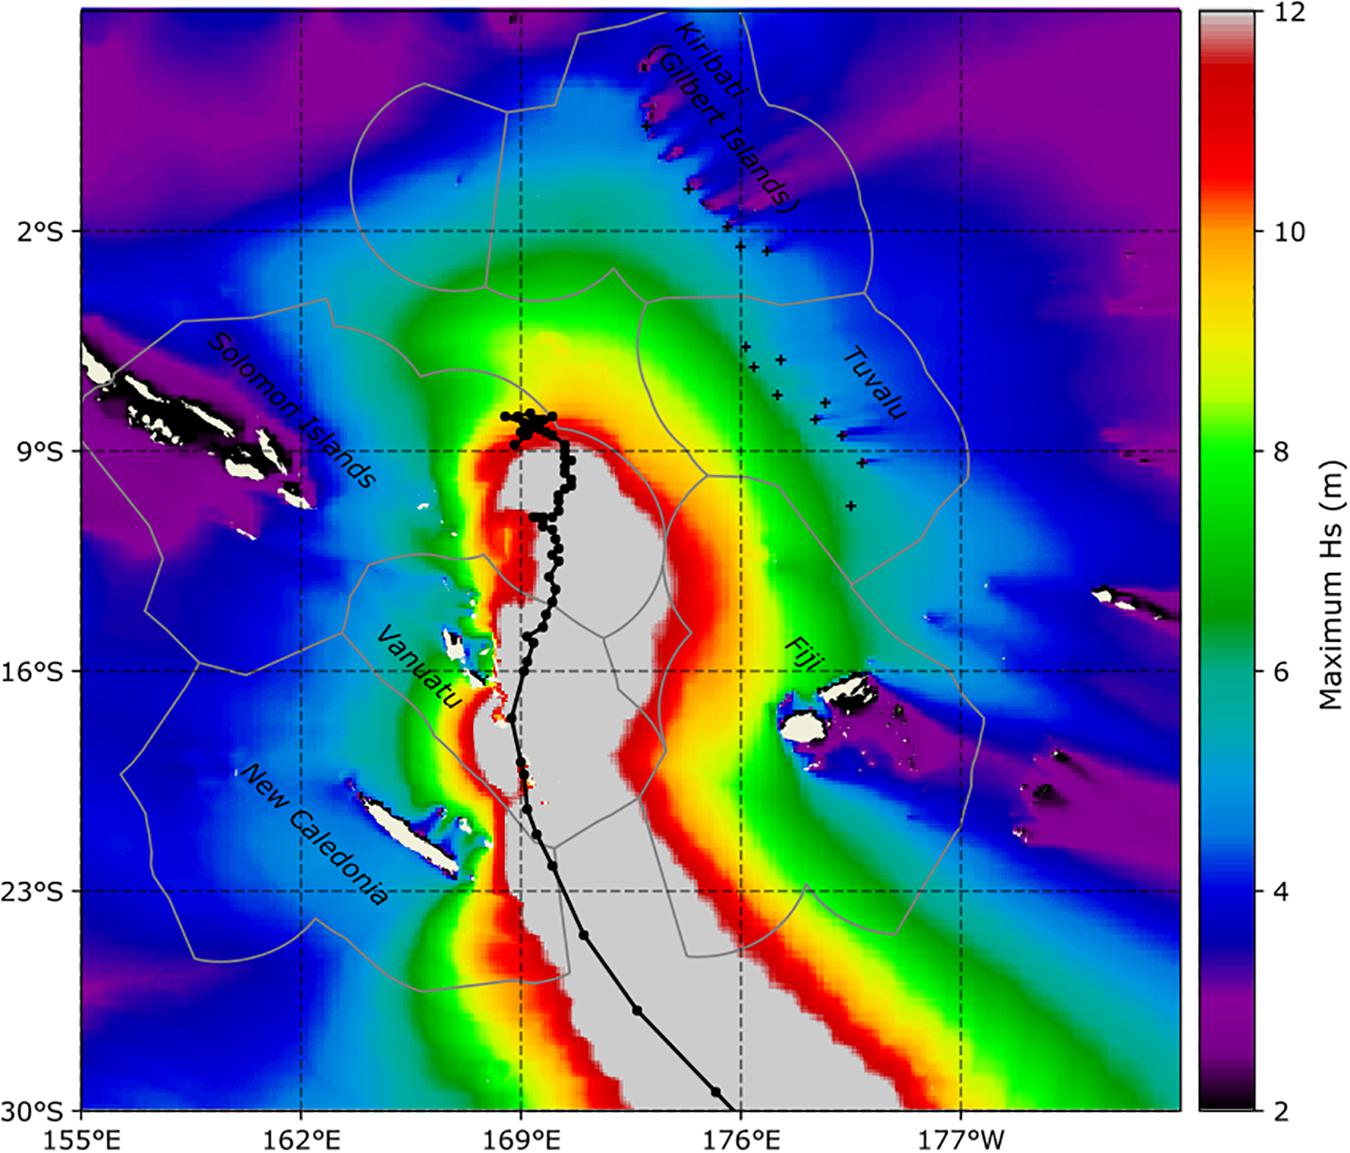
Figure 1. Tropical Cyclone (TC) Pam’s track (black line), with maximum hindcast significant wave height (Hs) during the TC’s passage (March 6–17, 2015) indicated in color shading. Island nations/archipelagos in the area are labeled and their exclusive economic zones (Flanders Marine Institute, 2019), indicated with gray lines. The locations in Table 1 are indicated with black +’s.
Here, we focus on the remote impacts to Tuvalu and Kiribati, which were poorly forecast or otherwise anticipated (Taupo and Noy, 2017). Multiple reports were collated (Table 1) and then a combination of astronomical tidal predictions and numerical wind-wave and sea level hindcasts, spanning from 1979 to the present, were combined using a total water level (TWL) approach (e.g., similar to Dodet et al., 2019), to estimate the climatological conditions and factors contributing to recorded impacts. The accuracy of these TWL components were independently assessed using tide gauge and satellite altimetry observations; it also includes an empirical wave runup estimate. This resulting proxy for flooding severity was compared to the recorded flooding and erosion impacts; the relative contribution of waves, tides and background sea level to TWL were assessed, as was event duration and wave direction.
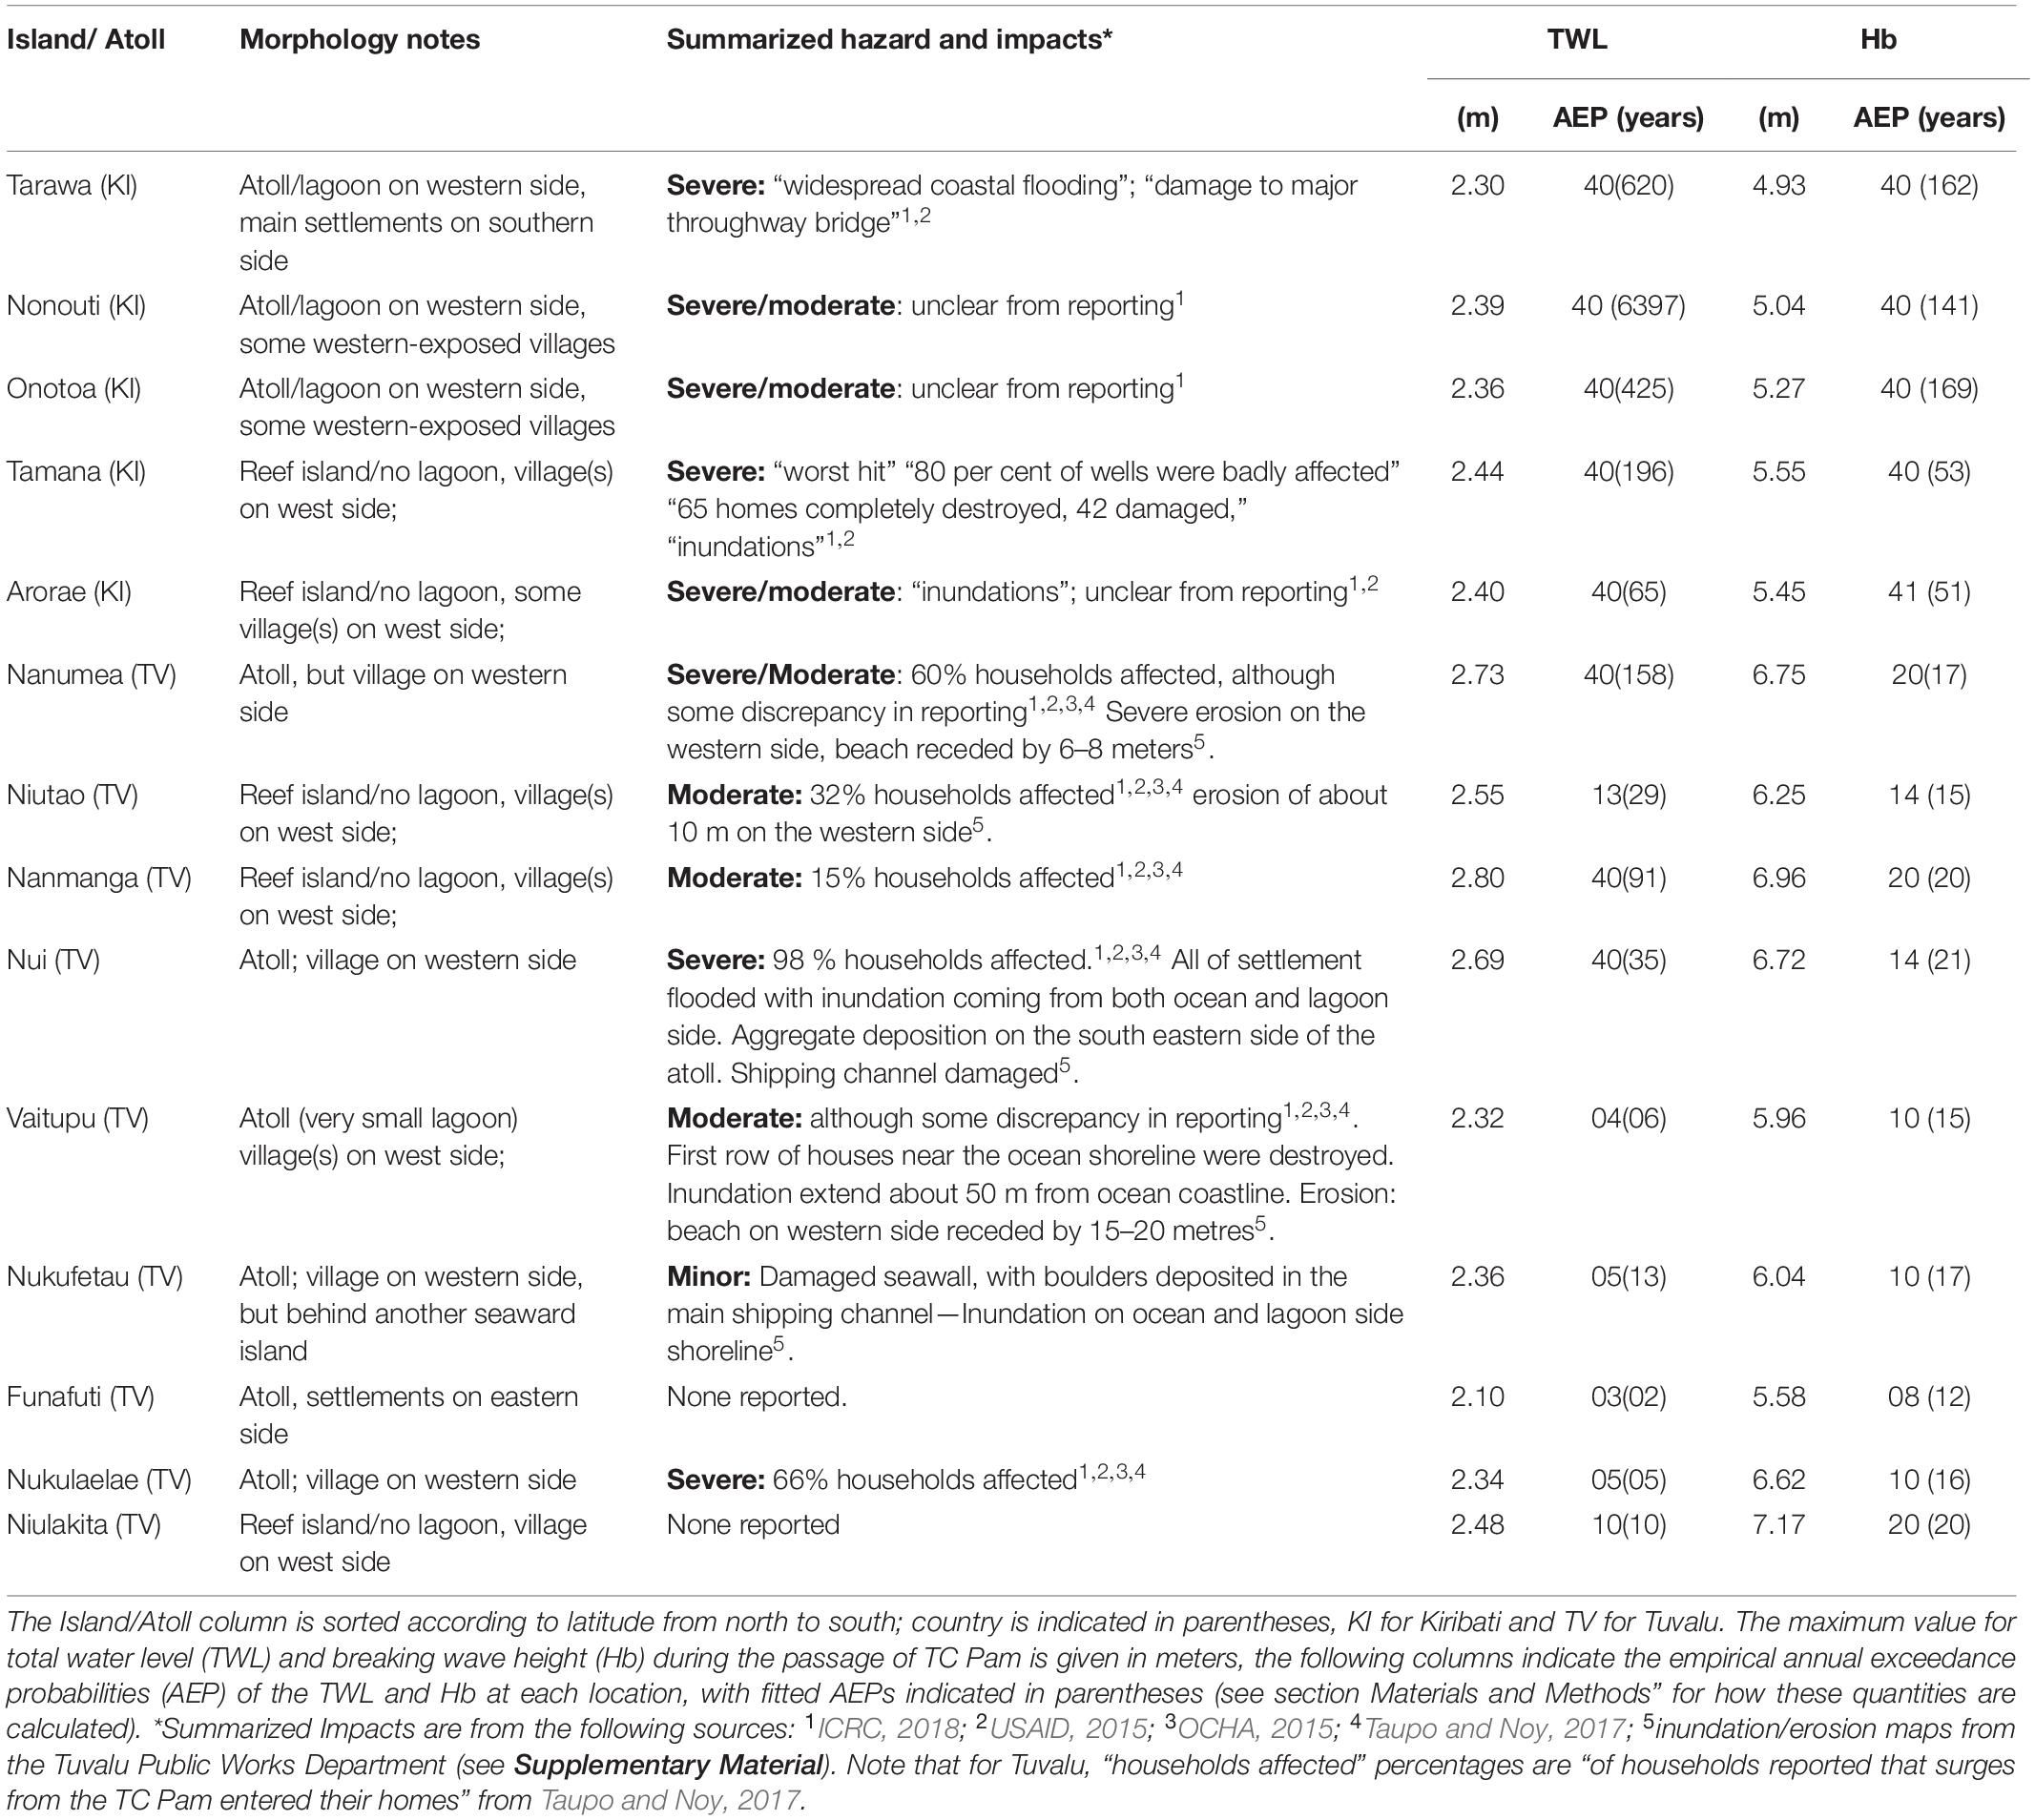
Table 1. Documented remote impacts in Tuvalu and Kiribati.
Materials and Methods
Summary of Impacts to Islands and Atolls
Information on which island and atolls within Tuvalu and Kiribati were impacted (or were not), and types of impacts were collated from a number of sources, primarily disaster relief agencies. These are summarized in Table 1; these locations are also plotted in Figure 2. Note that (hand drawn) “inundation” and “erosion” maps, and notes provided by the Tuvalu Public Works Department to the authors are provided in this article’s “Supplementary Material” section.
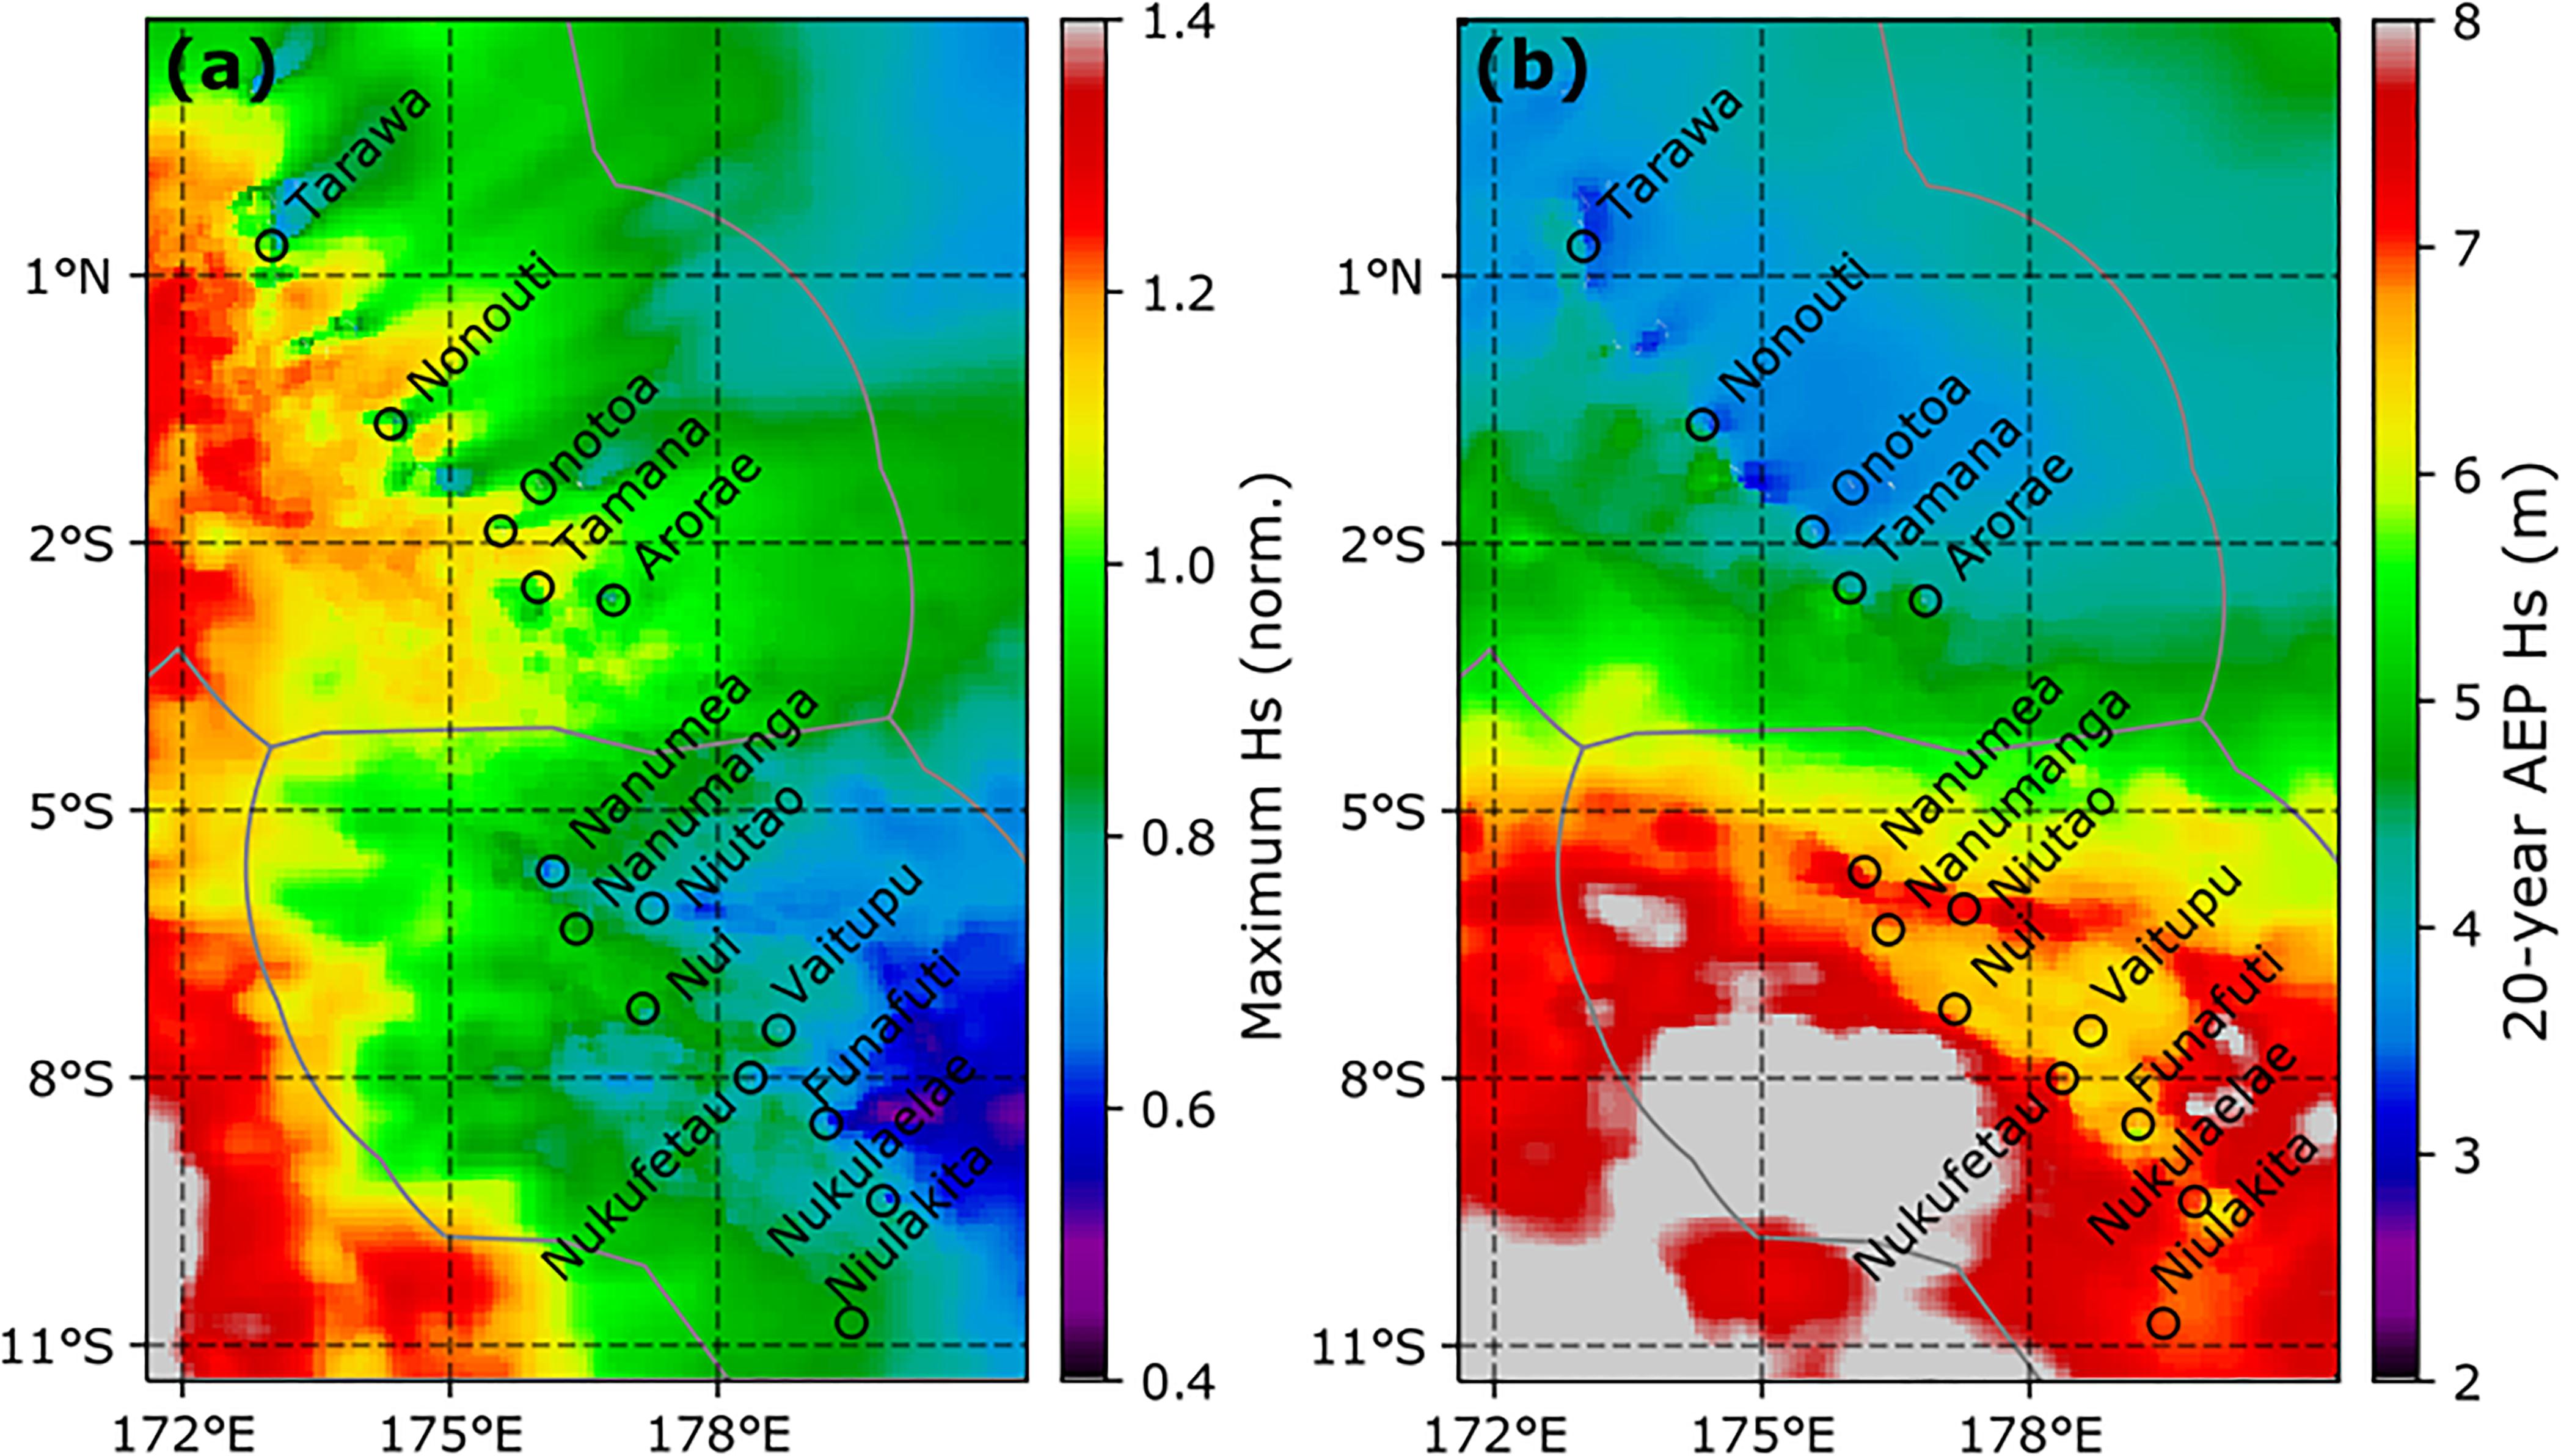
Figure 2. Region and locations indicated in Table 1. The maximum hindcast significant wave height (Hx) during TC Pam’s passage (March 6–17, 2015) is shown in subplot (a), which is normalized by the local 1-in-20 year annual exceedance probability (AEP) shown in subplot (b). Note Hs, rather breaking wave height (Hb) or total water level (TWL) as these latter quantities follow wave shoaling and breaking across shallow fringing reef, respectively, and the area of Figure 2 (apart from the scattered islands and reefs) contains abyssal ocean depths.
Geophysical Data
To assess the timing and location of regional TCs, particularly TC Pam, the IBTrACS (Knapp et al., 2010) database (version 04r0)1 was interrogated for TCs tracks; any portion of which occurred between longitudes 155°E and 170°W and latitudes of 30°S and 10°N and between the years 1979–2019 (the time period of the wave hindcast used in this study, see next section) were retained and defined as “regional” TCs. TC Pam’s track is given in Figure 1.
To assess impacts, three different categories of sea level information were used in this analysis: wind-waves, astronomical tides, and non-tidal sea-level. These are detailed in following sub-sections.
Wind-Waves
Hourly significant wave height (Hs), integrated wave energy flux (CgE), peak wave period (Tp) and peak wave direction (Dp) for years 1979–2019 were extracted from the CAWCR Wave Hindcast, a validated global wind-wave hindcast with increased (approximately 7 km) spatial resolution around the Pacific island nations (Durrant et al., 2014)2 and related collections. Previous global and regional comparisons with satellite altimetry and wave buoy data have found the overall hindcast Hs bias and overall root-mean-square (RMS) difference to be on the order of −5% and < 10%, respectively, in the central Pacific (Durrant et al., 2014; Hemer et al., 2016). However, in this study, a further verification of the hindcast’s ability to estimate the extreme waves associated specifically with TC Pam was performed by comparing hindcast Hs to calibrated Hs measured by multiple satellite altimeters, provided via the Ribal and Young (2019) dataset (sourced from Australia’s Integrated Marine Observing System)3. While overall correlation coefficients (R) and errors between hindcast Hs and that estimated by various altimeters/bands indicate good agreement (R > 0.9, std.err. < 0.004 m) for the area and time period indicated in Figure 1, the hindcast overestimated the most extreme waves (Hs> 12) near TC Pam’s eye wall compared to the altimeter data by up to several meters (Supplementary Figure 1). This divergence is at least partially attributable to (1) the known tendency of the WaveWatch III model to overestimate energy of waves traveling in the oblique and opposing winds (as would occur in a tight-radius TC, including with the “ST4” physics package used in the hindcast) and; (2) uncertainty in the radar altimeters estimation of Hs in such extreme conditions: Ribal and Young (2019) limit their calibrations to values of Hs < 9.0 m. This overestimation (or divergence between hindcast and altimetry observations) of Hs does not occur at all for the same time period in the area indicated by Figure 2 (which corresponds to the area of flooding and erosion impacts researched in this paper), and statistics in this area are modestly improved (R > 0.92, std.err. < 0.002 m, Supplementary Figure 2). For further information on the details and discussion of this hindcast/satellite altimeter comparison, please refer to Supplementary Material, however, the authors have confidence that the CAWCR wave hindcast represented the propagation of the wave field associated with TC Pam, and its representation within the overall extreme value statistics of the hindcast, throughout the Gilbert Islands and Tuvalu sufficiently to support the paper’s conclusions.
Astronomical Tides
Hourly astronomic tidal predictions (ηtide) were calculated for a time period corresponding to that of the wave hindcast (years 1979–2019) from TPXO tidal constituents (version 9.1, Egbert and Erofeeva, 2002) at all locations in Table 1. To assess the skill of TPXO-based tidal predictions used in this study, they were compared to tidal predictions based on hourly tide gauge observations from Tarawa and Funafuti (years 1988–2018 and 1979–2017, respectively) sourced from the University of Hawaii Sea Level Center (4 Caldwell et al., 2015). Root-mean-square-differences (RMSD) between tide gauge and TPXO predictions at Funafuti and Tarawa were 0.01 and 0.02 m, respectively. More importantly for this analysis, 99.5th quantiles differences between tide gauge and TPXO predictions at Funafuti and Tarawa were 0.021 and 0.025 m, respectively. The tidal software UTide (Codiga, 2011) was used both to estimate constituents from tide gauge observations and to calculate predictions for both the TPXO and tide gauge constituents.
Non-tidal Sea-Level
The computation of TWLs and associated extreme value analysis (see next) requires an uninterrupted time span of non-tidal sea-level data that corresponds to the wave hindcast (years 1979–2019) and the astronomical tides calculated in section “Astronomical Tides”. This precludes using sea surface heights measured by satellite altimetry, which only start around 1992. We evaluated three global gridded sea level products, all available from publicly accessible data repositories, which meet this time span requirement:
1. NCEP Climate Forecast System Reanalysis Reforecast (CFSR) 6-hourly sea surface height (Saha et al., 2013);
2. CSIRO monthly sea-level reconstruction (Church and White, 2011); and
3. ORAS5 Ocean ReAnalysis System 5 (ORAS5) monthly sea surface height5.
These sea level products were assessed for best representing background non-tidal sea levels (ηSL) by comparing them to the 30-days median low-pass filtered tide gauge residual sea level at Tarawa and Funafuti (see section “Astronomical Tides”). All sea levels, (including tide gauge residuals) where adjusted such that mean sea level = 0 between 1999 and 2009 prior to comparison. Correlation coefficients (R) and RMSD calculated against the low-pass filtered tide gauge residuals are shown in Table 2.
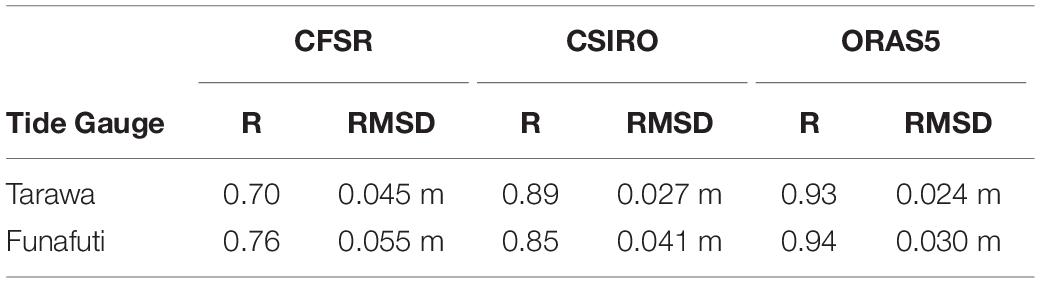
Table 2. Comparison of CFSR, CSIRO and ORAS5 sea surface height values with monthly-median low-pass filtered non-tidal (residual) tide gauge observations.
ORAS5 clearly outperforms the other two sea surface height products in comparison to the (observed) Tarawa and Funafuti tide gauge residuals. ORAS5 monthly values are linearly interpolated to the (hourly) times of the wave hindcast (years 1979–2019) to represent non-tidal sea levels (ηSL); throughout the remainder of this article, ηSL refers to that derived from ORAS5 sea surface height values. It should be noted that thus ηSL omits high-frequency (timescales < 1 month) sea level variability. However, the variance of the 30-days median low-pass filtered (observed) residuals is 0.005 m at Tarawa and 0.010 m at Funafuti. The high-frequency (remainder) residual variance at both sites is 0.001 m, i.e., 5–10 times less than that of the monthly variance; which is fairly typical of low-latitude Pacific locations where sea level variability is dominated by seasonal and interannual (e.g., ENSO) dynamics (Merrifield et al., 1999; Church et al., 2006; Zhang and Church, 2012). Thus, the lack of inclusion of higher-frequency sea level fluctuations is assumed to introduce a relatively small error into this analysis. Future studies may evaluate introducing inverse barometer estimates, based on global sea level products to further ameliorate this error.
Extreme Value Analysis and Total Water Level (TWL)
To reduce complexity of the extreme value (statistical) analysis, we focus on four of the previously defined variables: CgE (wave energy flux), Dp (peak wave direction), ηtide, and ηSL as well as event duration, which arises from the analysis. CgE, rather than Hs, is chosen as a primary diagnostic variable for the analysis, since (as a measure of power, rather than energy), it tends to scale more linearly with nearshore processes such as wave runup and setup.
Extreme events are identified for each site in Table 1 by choosing a threshold and identifying exceedances of CgE above it; an event begins when the CgE exceeds the threshold, and a new event is assumed only when CgE remains below the threshold for more than 12 h (i.e., “declustering” events). The threshold for this analysis is the 99.5% quantile.
Event duration is then calculated as the amount of time that each declustered CgE event remains above the threshold. The Dp (peak wave direction) associated with the event is taken as that occurring at the time of the peak (maximum) CgE. The ηSL andηtide associated with the event are the respective maxima of each occurring during the storm duration, i.e., not necessarily the water level at the time of maximum CgE. To further aid in interpretation, empirical annual exceedance probability (AEP), also commonly called return periods or return levels, were empirically calculated from the declustered storm event maximum CgE values at both locations.
In order to better understand how these variables (CgE, Dp, ηSL, and ηtide) combine to create extreme sea level events, we follow a “total water level” (TWL) approach (Dodet et al., 2019), and calculate a further variable (η2), defined as the 2% exceedance water level at the shoreline above the “still” water level, as a function of wave setup and variable swash (“runup”) due to both wind-waves and infra-gravity/longwave dynamics associated with shoaling and breaking of wave groups at the reef edge. The TWL is simply calculated as:
To calculate η2, we follow the simpler of the two approaches described by Merrifield et al. (2014), viz:
Where Hb is “breaking wave height,” calculated using a simplified relation to account for wave refraction and shoaling to breaking depth from the (deep water) Hs provided by the wave hindcasts:
In Equation 2, the two empirical coefficients b1 and b0 are assumed a value of 0.3 and –0.1, both near the mean value and within the 95% confidence limits for the two study sites examined in Merrifield et al. (2014). While these sites were both in the Marshall Islands, it is arguable that the Tuvalu and Kiribati sites in this study share similar atoll/narrow fringing reef morphology to the Marshall Islands sites, although morphological effects are discussed in more detail in the following sections. In Equation 3, γ is the ratio of breaking Hb to breaking water depth and Dn is the local shore-normal angle.
Results
Time series of total water level (TWL) and breaking wave height (Hb) centered on a 2-week period of the peak of Hb during the time period of TC Pam’s passage, is presented in Figure 3. From these plots, it is clear that most impacted locations experienced a sustained period of 5 or more days of Hb above the 99.5th quantile threshold (based on the entire 40-year timeseries); TWL was similarly elevated during successive high tides during the same period. These highly elevated values (above the threshold) are noticeably absent for Funafuti, where no impacts were reported during the period; however, Nukufetau and Niulakita also did not report impacts, but experienced highly elevated TWL and Hb, similar to highly impacted neighboring Tuvaluan islands/atolls (Table 1 and Figure 3). Potential reasons for this discrepancy are discussed later.
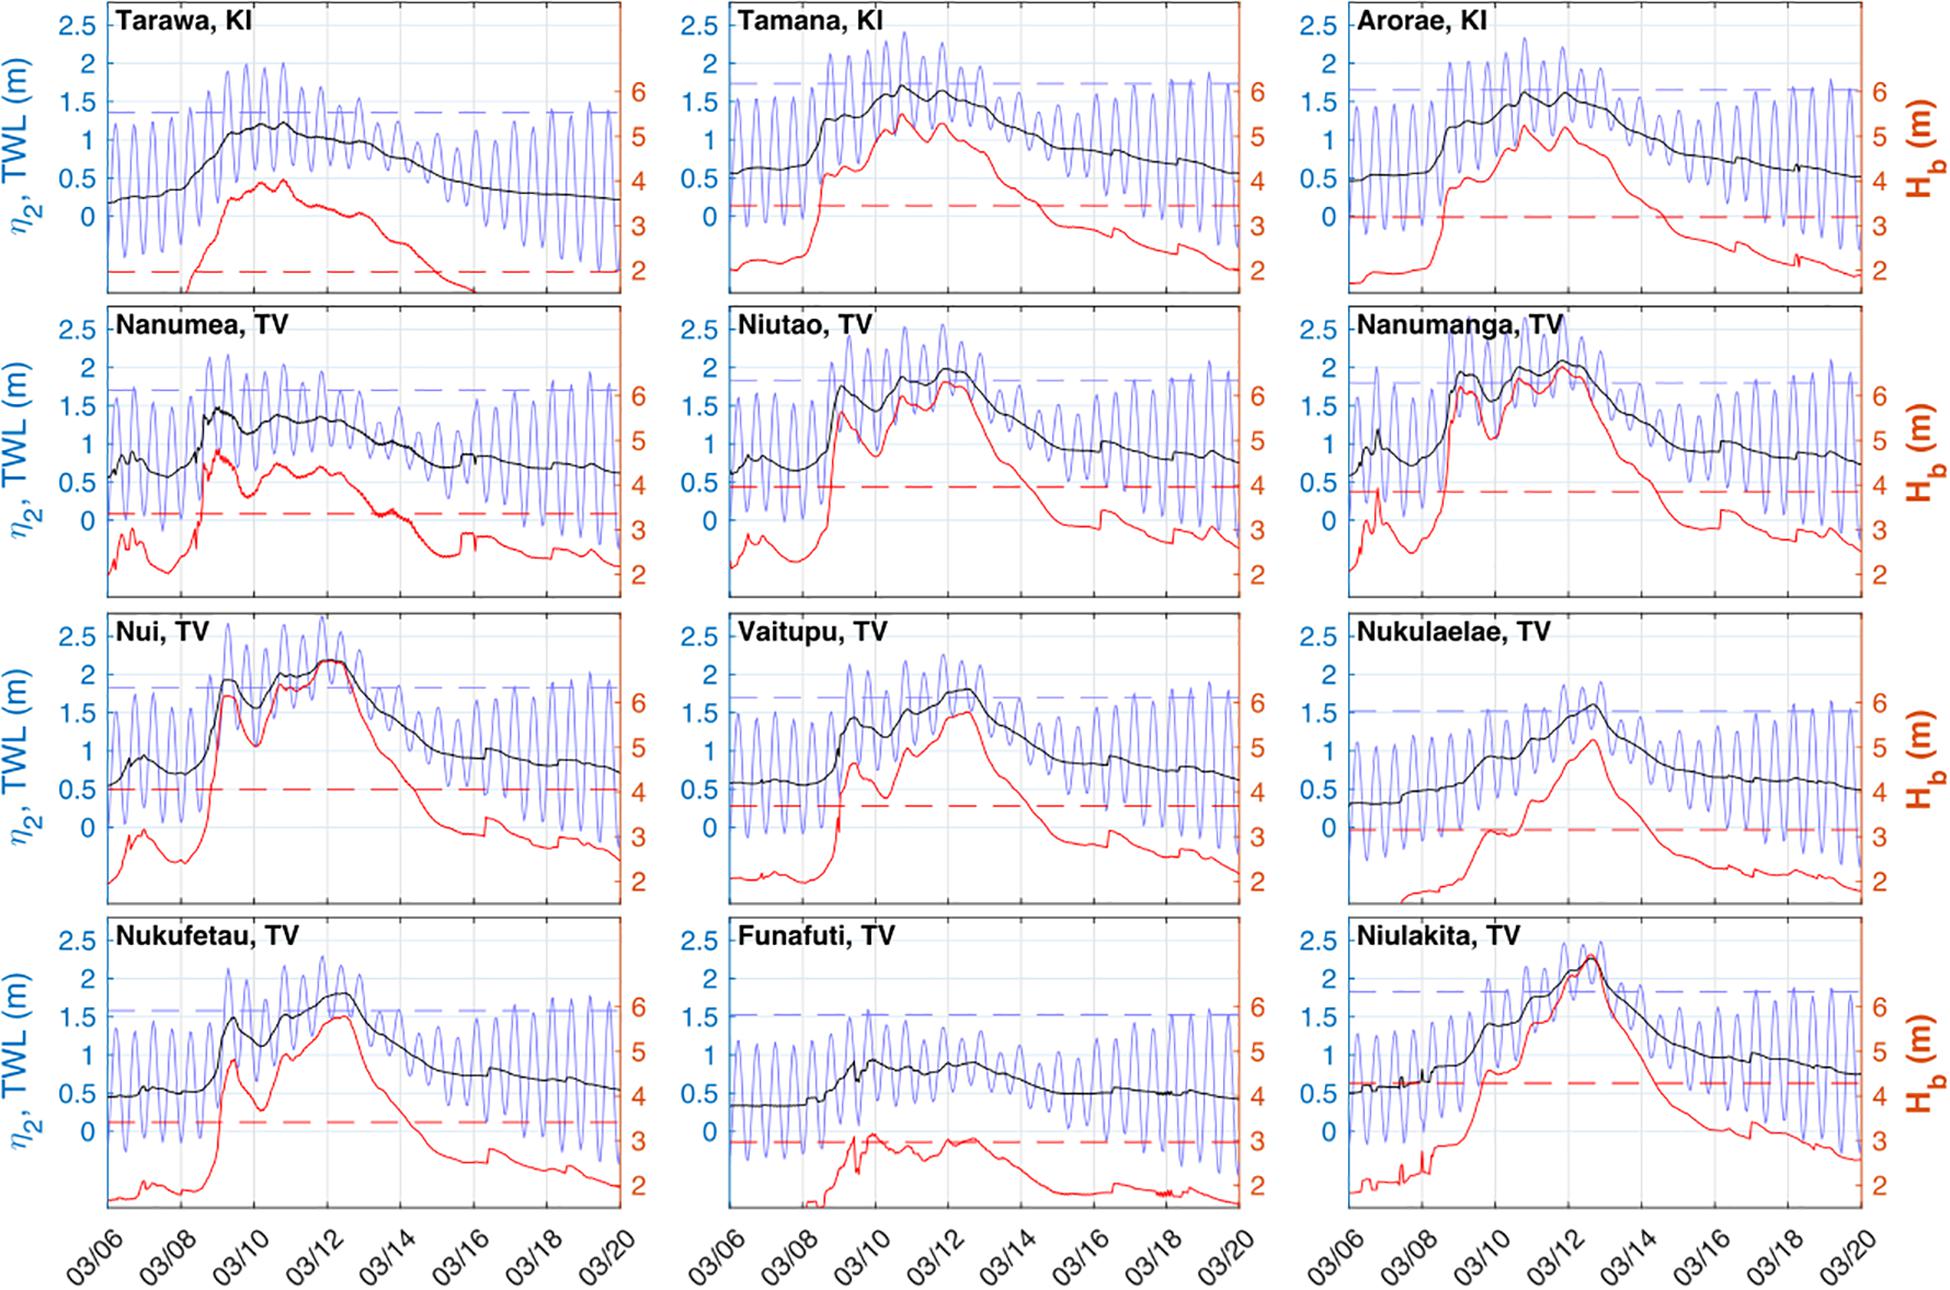
Figure 3. Time series plot of estimated breaking wave height (Hb, red), wave setup/runup (η2, black) and total water level (TWL, blue) for selected islands listed in Table 1, from March 6—March 20, 2015. The 99.5th quantiles (percentiles) for the entire hindcast timeseries (1980–2019) are shown as dashed red and blue lines for Hb andTWL, respectively.
As previously mentioned, the timing of high tides in relation to the timing of maximum Hb (and CgE) appear to have modulated the timing of impacts at the different islands. However, astronomical tides were not abnormally high (mostly roughly between spring and neap, Figure 3) during the event at any of the impacted islands. This tidal modulation could explain the lesser impacts reported in the southern islands of Tuvalu (except Nukulaelae) where the peak of Hb (and CgE) was of shorter duration and occurred predominantly during neap tides.
To better examine the relative contribution of CgE, tides (ηtide), background sea level (ηSL), other multivariate aspects of this event and its relation to other TWL extreme events, Figures 4, 5 present “scatterplot matrix” diagrams for Tamana and Nui, which were selected as representative of impacted locations within Kiribati and Tuvalu, respectively. These scatterplot matrices allow the visualization of the co-occurrence CgE, ηtide, and ηSL, as well as wave direction (Dp) and event duration for all events above the (99.5th quantile) TWL threshold within the hindcast record, particularly when combined with annual exceedance probability (AEP) plot of all locations (Figure 6).
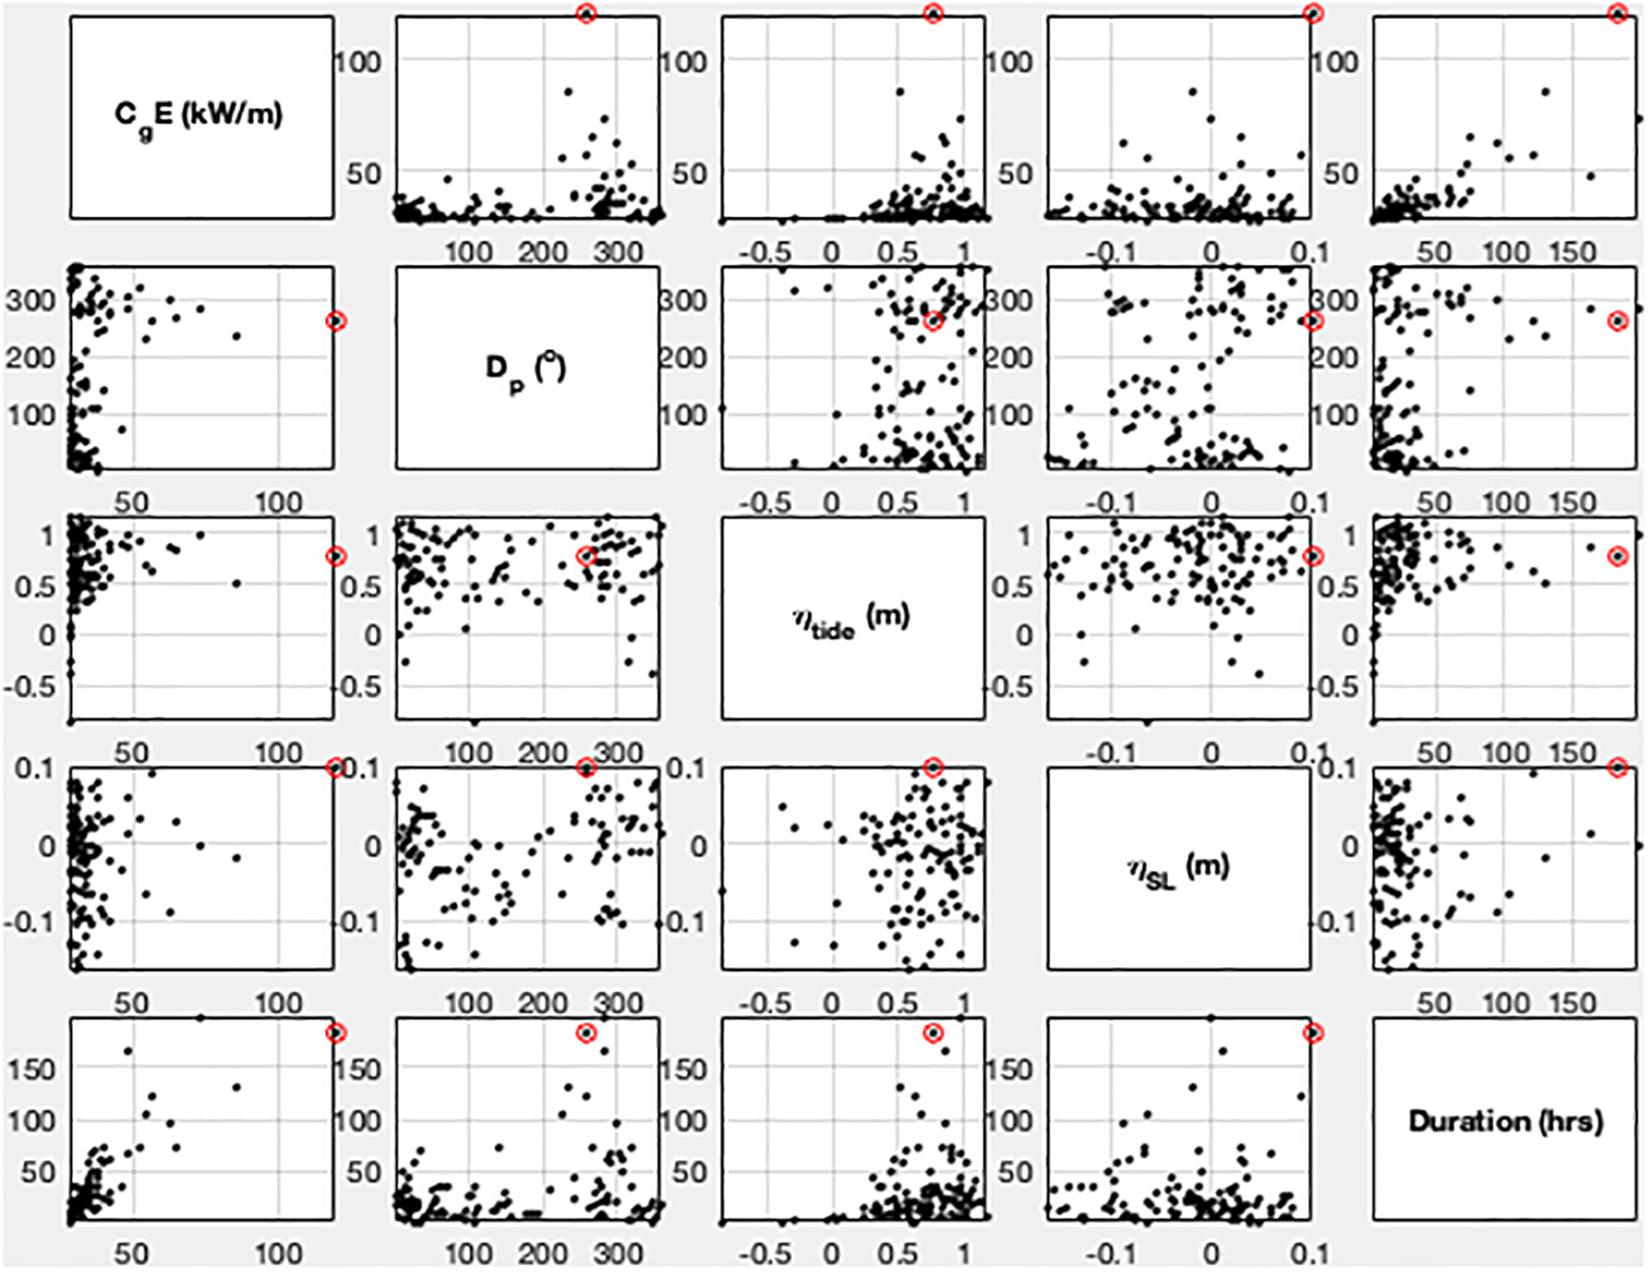
Figure 4. Scatterplot matrix of Tamana (Kiribati) event-based data identified by declustering extreme sea level events with integrated wave energy flux (CgE) above the 99.5 percentile threshold. The variables are: within-event maximum CgE, peak wave direction (Dp) during the hour of maximum CgE, within-event maximum astronomic tide maximum (ηtide), background sea level (ηSL), and event duration (hours). Within each subplot the event closest to March 15, 2015 (i.e., associated with TC Pam) is highlighted with a red circle.
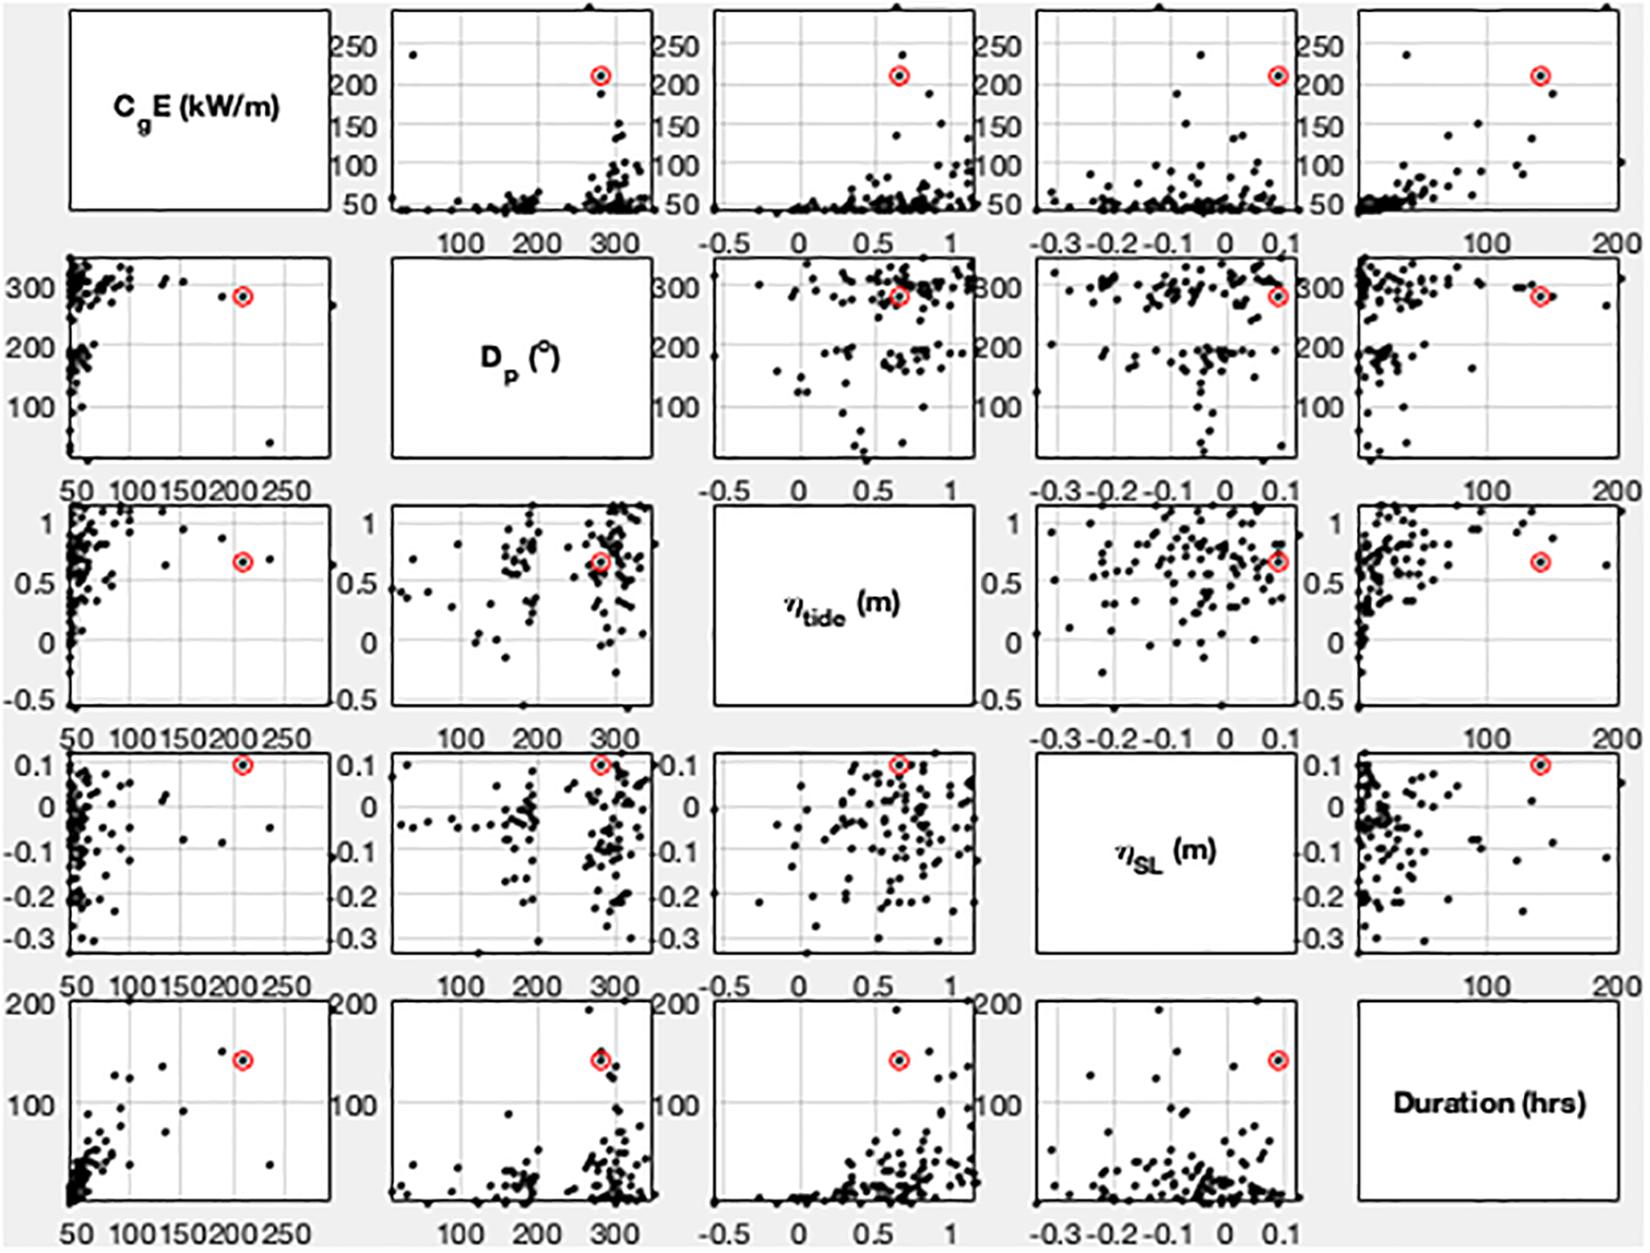
Figure 5. Scatterplot matrix of Nui (Tuvalu) event-based data identified by declustering extreme sea level events with wave energy flux (CgE), above the 99.5 percentile threshold. The variables are the same as in Figure 4. Within each subplot the event closest to March 15, 2015 (i.e., associated with TC Pam) is highlighted with a red circle.
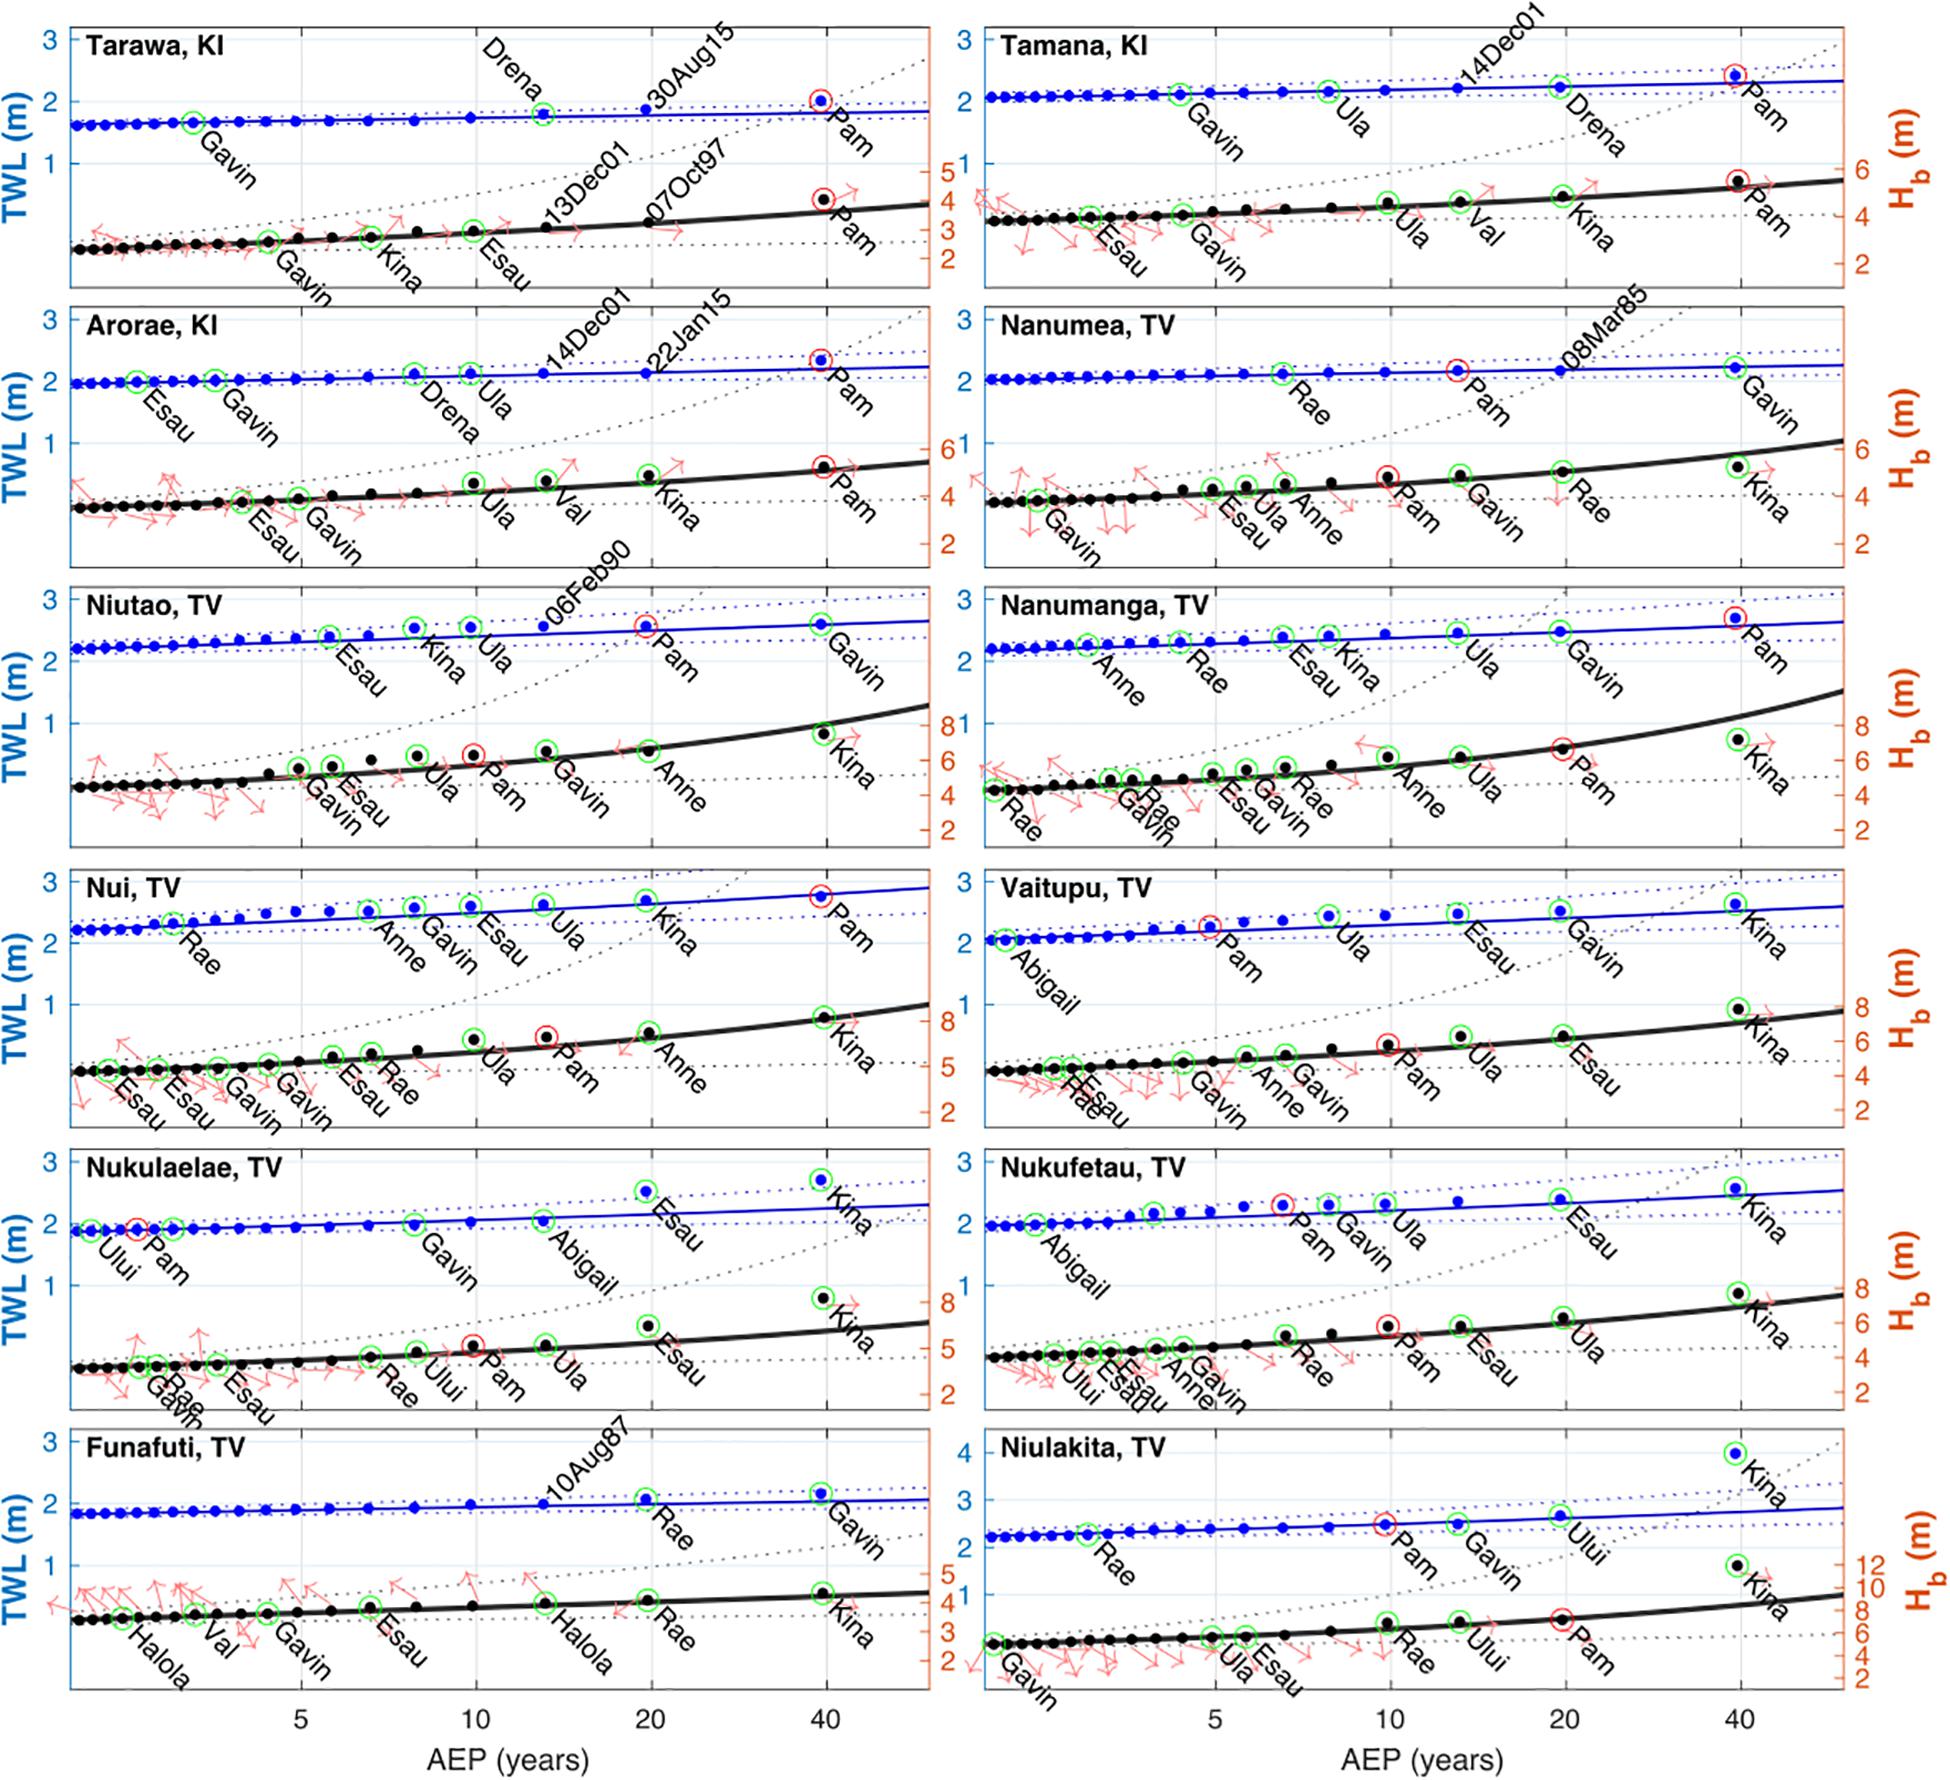
Figure 6. Annual exceedance probability (AEP) plots for selected islands listed in Table 1. Black and blue dots indicate empirical AEPs for estimated breaking wave height (Hb), wave runup (η2) and total water level (TWL), respectively; black and blue lines indicate a maximum likelihood estimate curve using a generalized Pareto tail model for the same variables, respectively. 95% confidence limits are indicated with dotted lines. Peak wave direction (Dp) for each event is indicated by red arrow on the Hb AEPs, respectively. Where TWL or Hb empirical AEP events have occurred during or up to 5 days after the occurrence of a TC in the region (see Figure 6) are highlighted with green circles and labeled with the TC name; the event associated with TC Pam is highlighted with a red circle. For events with RI > 10 years not matched with a TC are labeled with their date.
At Tamana (Kiribati), maximum CgE (and thus estimated wave setup/runup) was by far the highest in the entire hindcast record, on the order of 40% higher than the next highest event in terms of CgE (Figure 4). The event also had the longest or second longest duration at the impacted islands. This probably contributed to the noted erosion at Tarawa, in addition to recorded severity of inundation at the impacted islands in Kiribati. At Nui (Tuvalu), maximum CgE was not the highest in the entire hindcast record, it was third highest (Figure 5). However, when combined with ηSL and ηtide it created the highest TWL in the record (Figure 5). Event duration at Nui (Figure 5) was also among the top three events, and likely contributed to the extensive erosion recorded at many of the locations in Tuvalu, as in Kiribati.
Overall, TWL and Hb were the highest in the hindcast period, with a calculated empirical AEP of 40 years (the highest possible for the time duration of the hindcasts used in this study) for all islands in Kiribati with recorded impacts (Table 1 and Figure 6). These results are more varied in Tuvalu: Hb empiricalAEPs generally ranged between 10 and 20 years, in the northern islands, elevated ηtide and particularly ηSL increase TWL empirical AEP values above those of Hb. In the southern islands, the aforementioned later onset of elevated Hb, closer to neap tides, lead to lower TWL empirical AEP values relative to that of Hb. Never the less, all islands in Tuvalu which recorded severe impacts experienced greater than a 10-year AEP TWL, excepting Nukulaelae (Table 1 and Figure 6).
In addition to the TWL and Hb event AEP levels of indicated in Figure 6, wave direction (Dp) associated with each event is also indicated by an arrow indicating the direction waves are traveling at the time of peak Hb. This indicates that all large events (AEP > 10 years) are from the west in Kiribati, but not in Tuvalu. At some (but not all) Tuvalu locations, TC Pam was the largest westerly event. To further investigate the drivers the storm wave events, all regional TCs with maximum sustained winds greater than 48 knots (the lower threshold for category 2 TCs according to the southern hemisphere intensity scale) were queried. Hb and TWL events which occurred during or up to 5 days after TCs which occurred within ± 5 days of empirical AEP events are labeled as such in Figure 6 and these TCs tracks are plotted in Figure 7. This illustrates that despite TC tracks never crossing the Gilbert Islands and only very rarely crossing the Tuvalu islands within the 40-year hindcast period, all Hb events (and most TWL events) greater than the 10-year AEP value at all locations excepting Tarawa (the northernmost of the study site), are associated with TCs. All of the associated TCs’ tracks lay primarily well to the south and west (or north and west in one case) of the Gilbert Islands and Tuvalu, and most, though not all, attained at least a TC category 4 maximum sustained wind intensity. Of note is TC Kina which occurred in early January, 1993. It is associated with the largest Hb and TWL at many of the southern Tuvalu islands in our analysis; severe flooding and destruction of homes were reported on Nanumea, Nanumaga, Niutao, Nui, and Vaitupu6.
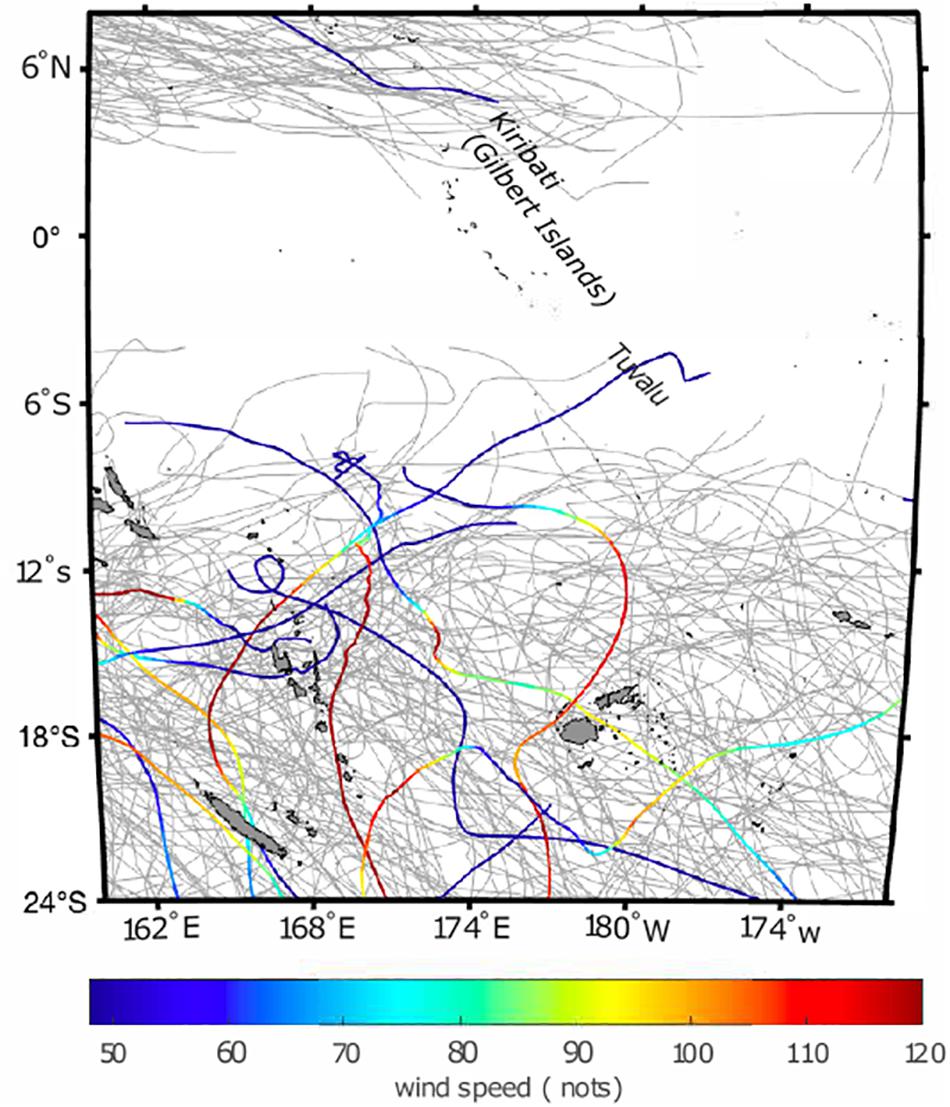
Figure 7. TC tracks in region of the Gilbert Islands (Kiribati) and Tuvalu (1979–2019). TCs which were matched with TWL and/or Hb events above the 99.5th quantile threshold (i.e., those plotted in Figures 4, 5) are plotted in color, indicating along-track maximum sustained winds; other cyclones are plotted in gray.
Finally, it should be reiterated that at all locations, background sea levels (ηSL) were the highest or among the highest on record (+0.1 m) during the TC Pam events. This definitely contributed to the overall severity of the event, particularly in Tuvalu. What portion of that is attributable to sea level rise (SLR) vs. seasonal and/or inter-annual (e.g., ENSO) sea level variability is beyond the scope of this paper, since higher order techniques (such as multivariate regression or empirical function analyses) are needed to separate these two components (Zhang and Church, 2012; Albrecht et al., 2019). This will be addressed in future studies.
Discussion and Conclusion
In this study, we link a widespread series flooding, island overwash and erosion events in 2015 in the atoll nations of Tuvalu and Kiribati to locally extreme values of total water level (TWL), composed of regional sea-level, astronomic tide and wind-wave components. Similar to other studies (e.g., Hoeke et al., 2013; Wadey et al., 2017; Ford et al., 2018; Wandres et al., 2020), extreme wind-waves associated with a distant storm (swell) was the proximate cause, or trigger, of the flooding and erosion reported here. In contrast to (or perhaps complimenting) these other studies, the swell triggering this event was generated not by distant mid-latitude storms, but by a distant tropical cyclone (TC Pam). Like these other studies, however, local TWL extremes (and impacts) were highly modulated by the timing of swell arrival relative to local tidal phase (Table 1 and Figure 3) and by regional sea level anomalies. Other than the swell generated by it, meteorological phenomena directly associated with TC Pam, e.g., local wind setup and inverse barometer effect, appear to have played little, if any, role.
The relative severity of the flooding and erosion impacts amongst the islands and atolls included does not appear to be simply linked to the local values of TWL or breaking wave heights (Hb): e.g., maximum TWLs and Hb heights were significantly smaller (approximately 1.5 m and 30 cm smaller, respectively) in the southern Gilbert Islands (Kiribati) than in Tuvalu (Table 1 and Figure 6), but reported impacts in the affected Gilbert Islands appear to be nearly as bad, perhaps worse in some cases. Local annual exceedance probabilities (AEPs), however, align much better with the reported impacts; e.g., significant wave heights (Hs), TWL and Hb AEPs in the southern Gilberts were almost universally higher (despite scalar height values being lower) compared to those in Tuvalu (Figures 2, 6 and Table 1). The exceptional duration of the event (greater again in the Gilberts than in Tuvalu, Figures 4, 5) undoubtedly also played a role. In other words, when extreme water levels associated with TC Pam are taken into local historical context (through extreme value analysis), they align better with the reported impacts. This makes sense from a geomorphology perspective, since local storm ridges and other reef island features are highly dependent on local wave climate (e.g., Woodroffe, 2008; Vila-Concejo and Kench, 2017). It also makes sense from a coastal engineering perspective (coastal defenses are typically designed using wave and/or water level exceedance probabilities); and also with respect to traditional island settlement patterns, although inconsistent coastal management and contemporary changes in settlement patterns may cloud this picture somewhat (Duvat, 2013; Kench et al., 2018).
There is also further reason to use such an approach, i.e., to describe (or predict) an island flooding and/or erosion event in the context of an extreme value analysis (EVA) of historical baseline data. In many cases, the EVA can establish a proxy or threshold for anticipated impacts, viz rather than simply predicting flood levels of so-and-so many meters, they can be predicted in terms of a known historical event or (e.g.) the 1-in-50 year level. For example: we predict the flooding impacts of TC Pam will be similar to/less than/greater than (depending on island) TC Kina in 1993 (which did indeed cause similar impacts in many of the southern Tuvalu islands, see “Results” section). This offers an opportunity to timely, easily understood information toward an increased efficiency of post disaster emergency efforts, and also provide a pathway for the development of a simple regional coastal inundation forecasting (or warning) system for locations where heights and datums of local coastal defenses may not be well know, and with computational need tailored to the current local resources.
Both applications would require further investigation to determine the reliability of existing global or regional wave forecast products to adequately predict TC- or mid-latitude storm generated waves and their subsequent propagation thousands of kilometers away: the wave hindcast used (and verified for TC Pam) in this study is approximately an order of magnitude higher spatial resolution than wave products available from the major numerical weather prediction centers for the region of this study. Ongoing efforts by regional organizations to provide downscaling of these global wave forecast products for Kiribati and Tuvalu could significantly contribute to the generation of island community scale actionable warning information; however, bias correction between forecast products and hindcast/historical products is necessary, and better overall skill assessment of both are needed. To this end, an increase in in situ wave observations and monitoring is required, perhaps to at least the level currently provided for sea level monitoring via the tide gauge network. Also required is improved consistency and detail in the reporting of flooding and erosion impacts; despite gathering reports from multiple sources in this study, local impacts at many islands is unclear because of inconsistencies in reporting (Table 1). Establishment and widespread adaptation of reef island flooding reporting guidelines would be extremely helpful in this regard.
While this TWL extreme value analysis approach appears to have been largely successful at describing the severity of this event at island scale, a number of issues are evident. For example, severe flooding was at Nukulaelae (Tuvalu), while TWL empirical AEP level was amongst the lowest of the impacted sites; conversely Niulakita (Tuvalu) which recorded no impacts had a (much higher) event TWL AEP of ∼10 years. Such discrepancies may of course be attributable to inaccuracies associated with the wave and/or sea level hindcasts. More likely, however, it is due to the highly simplistic approach taken in estimating wave runup and setup (η2), which neglects any details of local reef morphology, as well as (other) natural or man-made coastal defenses or shoreline orientation (although the method is capable of the latter). It thus neglects any approximations of local wave transformations required to predict sub-island scale extreme water levels and subsequent flooding. A number of researchers are developing meta-modeling methods (e.g., Pearson et al., 2017; Beetham and Kench, 2018; Rueda et al., 2019) capable of including local details of reef morphology; a number of statistical/analytic methods based purely on a limited number of nearshore observations (Merrifield et al., 2014; Wandres et al., 2020) are also under development. Both of these approaches show promise for much more accurate estimation of local wave transformations over reefs (as relevant to island flooding) compared to the extremely simple approach taken in this study. They all also come with a low enough computational cost to be widely applied to the approach presented in this paper, e.g., by using the kind of long-term hindcast data presented here as boundary condition to establish much more locally relevant extreme value analysis-thresholding. However, these meta-model and statistical nearshore wave transformation models require detailed spatial data on reef morphology (reef flat widths, shoreline orientations, and slopes, etc.) and/or local in situ observations of water levels and waves, which are currently available only in very few locations. Also, further research into how to incorporate reef passes and lagoons into such hybrid (statistical-dynamical) approaches is needed.
In summary, the type of TWL event-driven extreme value analysis presented in this paper shows promise to be a valuable tool toward improved understanding and prediction of inundation and erosion events, at both weather forecasting and for longer term future climate timescales. Improved understanding through development of such tools is generally seen as imperative to understand the continued habitability of atoll islands in the face of sea level rise (Kench et al., 2018; Storlazzi, 2018). Although it is beyond the scope of this paper to quantitatively attribute what role sea level rise may have played in the events reported here, it does implicate positive sea level anomaly, and forms a basis to examine attribution of sea level rise in reef island flooding events in future studies.
Data Availability Statement
The datasets used in this study can be found in online repositories. The names of the repository/repositories and accession number(s) can be found in the article/Supplementary Material.
Author Contributions
RKH conceived the study and preformed most of the analysis and writing. HD, JA, and MW contributed data and other information, as well as assisting with writing and analysis. All authors contributed to the article and approved the submitted version.
Funding
RKH was supported in this research by the CSIRO Climate Science Centre and by the Earth Systems and Climate Change (ESCC) Hub, funded through the Australian Government’s National Environmental Science Program.
Conflict of Interest
The authors declare that the research was conducted in the absence of any commercial or financial relationships that could be construed as a potential conflict of interest.
The handling editor declared a past co-authorship with several of the authors RKH, JA, and MW.
Acknowledgments
Many thanks to following: Alec Stephenson (CSIRO) who originated pieces of code used in the statistical analysis; Claire Trenham (CSIRO) who assisted in data identification and management; Kathy McInnes and Julian O’Grady (CSIRO) who provided comments on early versions of this manuscript; Xuebin Zhang (CSIRO) for recommending use of ORAS5 sea surface heigh; and Tom Durrant (Oceanum) for discussion of performance of WaveWatchIII under tropical cyclone conditions.
Supplementary Material
The Supplementary Material for this article can be found online at: https://www.frontiersin.org/articles/10.3389/fmars.2020.539646/full#supplementary-material
Footnotes
- ^ https://www.ncdc.noaa.gov/ibtracs/
- ^ https://data.csiro.au/collections/collection/CIcsiro:6616v8
- ^ http://imos.org.au/
- ^ https://uhslc.soest.hawaii.edu/
- ^ https://www.ecmwf.int/en/research/climate-reanalysis/ocean-reanalysis
- ^ https://reliefweb.int/report/tuvalu/tuvalu-cyclone-nina-jan-1993-dha-undro-situation-report-1
References
Albrecht, F., Pizarro, O., Montecinos, A., and Zhang, X. (2019). Understanding sea level change in the south pacific during the late 20th century and early 21st century. J. Geophys. Res. Oceans 124, 3849–3858. doi: 10.1029/2018JC014828
Barnett, J., and Adger, W. N. (2003). Climate dangers and atoll countries. Clim. Change 61, 321–337. doi: 10.1023/B:CLIM.0000004559.08755.88
Beetham, E., and Kench, P. S. (2018). Predicting wave overtopping thresholds on coral reef-island shorelines with future sea-level rise. Nat. Commun. 9, 1–8. doi: 10.1038/s41467-018-06550-1
Beetham, E., Kench, P. S., and Popinet, S. (2017). Future reef growth can mitigate physical impacts of sea-level rise on atoll islands. Earths Future 5, 1002–1014. doi: 10.1002/2017EF000589
Caldwell, P. C., Merrfield, M. A., and Thompson, P. R. (2015). Sea Level Measured by Tide Gauges from Global Oceans — the Joint Archive for Sea Level Holdings, Version 5.5. NOAA National Centers for Environmental Information, Dataset. doi: 10.7289/V5V40S7W
Church, J. A., White, N., and Hunter, J. (2006). Sea-level rise at tropical pacific and Indian ocean islands. Glob. Planet. Change 53, 155–168. doi: 10.1016/j.gloplacha.2006.04.001
Church, J. A., and White, N. J. (2011). Sea-level rise from the late 19th to the early 21st century. Surv. Geophys. 32, 585–602. doi: 10.1007/s10712-011-9119-1
Codiga, D. L. (2011). Unified Tidal Analysis and Prediction Using the UTide Matlab Functions. Technical Report 2011-01. Narragansett, RI: University of Rhode Island.
Damlamian, H., Bosserelle, C., Raj, A., Begg, Z., Katterborn, T., Ketewai, M., et al. (2017). Tropical Cyclone Pam: A Report on the Coastal Inundation Assessment Undertaken in Vanuatu Using an Unmanned Aerial Vehicle (UAV). Suva: Pacific Community (SPC).
Dodet, G., Melet, A., Ardhuin, F., Bertin, X., Idier, D., and Almar, R. (2019). The contribution of wind-generated waves to coastal sea-level changes. Surv. Geophys. 40, 1563–1601. doi: 10.1007/s10712-019-09557-5
Durrant, T., Greenslade, D., Hemer, M., and Trenham, C. (2014). A global wave hindcast focussed on the central and south pacific. CAWCR Tech. Rep. 70, 1–54. doi: 10.1016/j.coastaleng.2017.03.005
Duvat, V. (2013). Coastal protection structures in Tarawa atoll, Republic of Kiribati. Sustain. Sci. 8, 363–379. doi: 10.1007/s11625-013-0205-9
Egbert, G. D., and Erofeeva, S. Y. (2002). Efficient inverse modeling of barotropic ocean tides. J. Atmos. Ocean. Technol. 19, 183–204. doi: 10.1175/1520-04262002019<0183:EIMOBO<2.0.CO;2
Flanders Marine Institute (2019). Maritime Boundaries Geodatabase: Maritime Boundaries and Exclusive Economic Zones (200NM), Version 11. doi: 10.14284/386
CrossRef Full Text Available online at: https://www.marineregions.org/ | Google Scholar
Ford, M., Merrifield, M. A., and Becker, J. M. (2018). Inundation of a low-lying Urban atoll island: Majuro, Marshall Islands. Nat. Hazards 91, 1273–1297. doi: 10.1007/s11069-018-3183-5
Hemer, M. A., Zieger, S., Durrant, T., O’Grady, J., Hoeke, R. K., McInnes, K. L., et al. (2016). A revised assessment of Australia’s national wave energy resource. Renew. Energy 114, 85–107. doi: 10.1016/j.renene.2016.08.039
Hoeke, R. K., Mcinnes, K. L., Kruger, J. C., Mcnaught, R. J., Hunter, J. R., and Smithers, S. G. (2013). Widespread inundation of pacific islands triggered by distant-source wind-waves. Glob. Planet. Change 108, 128–138. doi: 10.1016/j.gloplacha.2013.06.006
ICRC (2018). Emergency Plan of Action Final Report Pacific Region: Tropical Cyclone Pam. Geneva: ICRC.
Idier, D., Bertin, X., Thompson, P., and Pickering, M. D. (2019). Interactions between mean sea level, tide, surge, waves and flooding: mechanisms and contributions to sea level variations at the coast. Surv. Geophys. 40, 1603–1630. doi: 10.1007/s10712-019-09549-5
Kench, P. S., Ford, M. R., and Owen, S. D. (2018). Patterns of island change and persistence offer alternate adaptation pathways for atoll nations. Nat. Commun. 9, 1–7.
Knapp, K. R., Kruk, M. C., Levinson, D. H., Diamond, H. J., Neumann, C. J., Knapp, K. R., et al. (2010). The international best track archive for climate stewardship (IBTrACS). Bull. Am. Meteorol. Soc. 91, 363–376. doi: 10.1175/2009BAMS2755.1
Maragos, J., Baines, G., and Beveridge, P. (1973). Tropical cyclone creates a new land formation on Funafuti atoll. Science 181, 1161–1164. doi: 10.1126/science.181.4105.1161
Merrifield, M. A., Becker, J. M., Ford, M., and Yao, Y. (2014). Observations and estimates of wave-driven water level extremes at the marshall islands. Geophys. Res. Lett. 41, 7245–7253. doi: 10.1002/2014GL061005
Merrifield, M. A., Kilonsky, B., and Nakahara, S. (1999). Interannual sea level changes in the tropical pacific associated with ENSO. Geophys. Res. Lett. 26, 3317–3320. doi: 10.1029/1999GL010485
Nicholls, R. J., Marinova, N., Lowe, J. A., Brown, S., Vellinga, P., de Gusmão, D., et al. (2011). Sea-level rise and its possible impacts given a ‘beyond 4°C World’ in the Twenty-First Century. Philos. Trans. R. Soc. A Math. Phys. Eng. Sci. 369, 161–181. doi: 10.1098/rsta.2010.0291
Nicholls, R. J., Wong, P. P., Burkett, V. R., Codignotto, J., Hay, J. E., McLean, R. F., et al. (2007). “Coastal systems and low-lying areas,” in Climate Change 2007: Impacts, Adaptation and Vulnerability, eds M. L. Parry, O. F. Canziani, J. P. Palutikof, P. J. van der Linden, and C. E. Hanson (Cambridge: Cambridge University Press).
Pearson, S. G., Storlazzi, C. D., van Dongeren, A. R., Tissier, M. F. S., and Reniers, A. J. H. M. (2017). A Bayesian-based system to assess wave-driven flooding hazards on coral reef-lined coasts. J. Geophys. Res. Oceans 122, 10099–10117. doi: 10.1002/2017JC013204
Perry, C. T., Alvarez-Filip, L., Graham, N. A. J., Mumby, P. J., Wilson, S. K., Kench, P. S., et al. (2018). Loss of coral reef growth capacity to track future increases in sea level. Nature 558, 396–400. doi: 10.1038/s41586-018-0194-z
Ribal, A., and Young, I. R. (2019). 33 years of globally calibrated wave height and wind speed data based on altimeter observations. Sci. Data 6:77. doi: 10.1038/s41597-019-0083-9
Rueda, A., Cagigal, L., Pearson, S., Antolínez, J. A. A., Storlazzi, C., van Dongeren, A., et al. (2019). HyCReWW: a hybrid coral reef wave and water level metamodel. Comput. Geosci. 127, 85–90. doi: 10.1016/j.cageo.2019.03.004
Saha, S., Moorthi, S., Wu, X., Wang, J., Nadiga, S., Tripp, P., et al. (2013). The NCEP climate forecast system version 2. J. Clim. 27, 2185–2208. doi: 10.1175/JCLI-D-12-00823.1
Seneviratne, S. I., Nicholls, N., Easterling, D., Goodess, C. M., Kanae, S., Kossin, J., et al. (2012). Changes in Climate Extremes and Their Impacts on the Natural Physical Environment: An Overview of the IPCC SREX Report.” EGU General Assembly 2012. Geneva: IPCC.
Smithers, S. G., and Hoeke, R. K. (2014). Geomorphological impacts of high-latitude storm waves on low-latitude reef islands – observations of the december 2008 event on Nukutoa, Takuu, Papua New Guinea. Geomorphology 222, 106–121. doi: 10.1016/j.geomorph.2014.03.042
Storlazzi, C. D. (2018). Challenges of Forecasting Flooding on Coral Reef–Lined Coasts.” Eos 99. J. Geophys. Res. Ocean doi: 10.1029/2018eo098517
Storlazzi, C. D., Gingerich, S. B., Van Dongeren, A., Cheriton, O. M., Swarzenski, P. W., Quataert, E., et al. (2018). Most atolls will be uninhabitable by the Mid-21st century because of sea-level rise exacerbating wave-driven flooding. Sci. Adv. 4:eaa9741. doi: 10.1126/sciadv.aap9741
Taupo, T., and Noy, I. (2017). At the very edge of a storm: the impact of a distant cyclone on atoll islands. Econ. Disast. Clim. Change 1, 143–166. doi: 10.1007/s41885-017-0011-4
Tuck, M. E., Kench, P. S., Ford, M. R., and Masselink, G. (2019). Physical modelling of the response of reef islands to sea-level rise. Geology 47, 803–806. doi: 10.1130/G46362.1
Vanuatu, G. (2015). Tropical Cyclone Pam—Humanitarian Action Plan. Available online at: https://reliefweb.int/sites/reliefweb.int/files/resources/vanuatu_tc_pam_hap.pdf (accessed January 15, 2020).
Vila-Concejo, A., and Kench, P. (2017). “Storms in Coral Reefs.” Coast. Storms Process. Ciavola, P and Coco, G, 127–49. Hoboken, NJ: John Wiley and Sons.
Wadey, M., Brown, S., Nicholls, R. J., and Haigh, I. (2017). Coastal flooding in the maldives: an assessment of historic events and their implications. Nat. Hazards 89, 131–159. doi: 10.1007/s11069-017-2957-5
Wandres, M., Aucan, J., Espejo, A., Jackson, N., De Ramon N’Yeurt, A., and Damlamian, H. (2020). Distant-source swells cause coastal inundation on Fiji’s coral coast. Front. Mar. Sci. 7:546. doi: 10.3389/fmars.2020.00546
Webb, A., and Kench, P. (2010). The dynamic response of reef islands to sea-level rise: evidence from multi-decadal analysis of island change in the central pacific. Glob. Planet. Change 72, 234–246. doi: 10.1016/j.gloplacha.2010.05.003
Woodroffe, C. D. (2008). Reef-island topography and the vulnerability of atolls to sea-level rise. Glob. Planet. Change 62, 77–96. doi: 10.1016/j.gloplacha.2007.11.001
Keywords: tropical cyclones, flooding, sea level, wave climate analysis, coastal hazards, atolls
Citation: Hoeke RK, Damlamian H, Aucan J and Wandres M (2021) Severe Flooding in the Atoll Nations of Tuvalu and Kiribati Triggered by a Distant Tropical Cyclone Pam. Front. Mar. Sci. 7:539646. doi: 10.3389/fmars.2020.539646
Received: 02 March 2020; Accepted: 27 October 2020;
Published: 22 January 2021.
Edited by:
Robert Timothy McCall, Deltares, NetherlandsReviewed by:
Christian M. Appendini, National Autonomous University of Mexico, MexicoRui Caldeira, Agência Regional para o Desenvolvimento da Investigação Tecnologia e Inovação (ARDITI), Portugal
Copyright © 2021 Hoeke, Damlamian, Aucan and Wandres. This is an open-access article distributed under the terms of the Creative Commons Attribution License (CC BY). The use, distribution or reproduction in other forums is permitted, provided the original author(s) and the copyright owner(s) are credited and that the original publication in this journal is cited, in accordance with accepted academic practice. No use, distribution or reproduction is permitted which does not comply with these terms.
*Correspondence: Ron K. Hoeke, cm9uLmhvZWtlQGNzaXJvLmF1