 Sylvain Agostini1*
 Fanny Houlbrèque2
 Tom Biscéré2
 Ben P. Harvey1
 Joshua M. Heitzman1
 Risa Takimoto1Wataru Yamazaki1
 Marco Milazzo3
 Riccardo Rodolfo-Metalpa2
- 1Shimoda Marine Research Center, University of Tsukuba, Shimoda, Japan
- 2ENTROPIE, IRD, Université de la Réunion, CNRS, IFREMER, Université de Nouvelle-Calédonie, Nouméa, France
- 3Dipartimento di Scienze della Terra e del Mare, Università Di Palermo, Palermo, Italy
Coral communities around the world are projected to be negatively affected by ocean acidification. Not all coral species will respond in the same manner to rising CO2 levels. Evidence from naturally acidified areas such as CO2 seeps have shown that although a few species are resistant to elevated CO2, most lack sufficient resistance resulting in their decline. This has led to the simple grouping of coral species into “winners” and “losers,” but the physiological traits supporting this ecological assessment are yet to be fully understood. Here using CO2 seeps, in two biogeographically distinct regions, we investigated whether physiological traits related to energy production [mitochondrial electron transport systems (ETSAs) activities] and biomass (protein contents) differed between winning and losing species in order to identify possible physiological traits of resistance to ocean acidification and whether they can be acquired during short-term transplantations. We show that winning species had a lower biomass (protein contents per coral surface area) resulting in a higher potential for energy production (biomass specific ETSA: ETSA per protein contents) compared to losing species. We hypothesize that winning species inherently allocate more energy toward inorganic growth (calcification) compared to somatic (tissue) growth. In contrast, we found that losing species that show a higher biomass under reference pCO2 experienced a loss in biomass and variable response in area-specific ETSA that did not translate in an increase in biomass-specific ETSA following either short-term (4–5 months) or even life-long acclimation to elevated pCO2 conditions. Our results suggest that resistance to ocean acidification in corals may not be acquired within a single generation or through the selection of physiologically resistant individuals. This reinforces current evidence suggesting that ocean acidification will reshape coral communities around the world, selecting species that have an inherent resistance to elevated pCO2.
Introduction
Ocean acidification and ocean warming are threatening the existence of coral reefs. The latest IPCC report warns that if meaningful reductions in CO2 emissions does not happen soon, 99% of coral reefs could disappear by the end of the century (IPCC, 2018). The effects of ocean warming on hermatypic corals are readily observable with a dramatic increase in the frequency and severity of massive coral bleaching events in recent years (Hughes et al., 2018). Recent studies have shown that ocean acidification has already reduced the community calcification rates of reefs. For instance, Albright et al. (2016) chemically manipulated seawater carbonate chemistry of a section of a reef to attain pre-industrial carbonate concentration and aragonite saturation state levels, increasing reef net calcification by ca. 7%. Ultimately ocean acidification may cause some reefs to shift to net dissolution in the near future (Eyre et al., 2018). Hermatypic corals and other calcifying organisms are considered among the most vulnerable to ocean acidification, as the decrease in oceanic pH and carbonate ions concentration makes the precipitation of calcium carbonate (aragonite in the case of corals) more energetically costly (Cohen and Holcomb, 2009).
In hermatypic corals, the calcification process occurs in a semi-isolated space located between the calicoblastic tissue and the already formed skeleton. At this site of calcification, corals elevate the aragonite saturation state by expelling protons, pumping in calcium ions and maintaining a high concentration of carbonates. This tight regulation of the calcifying fluid chemistry allows corals to maintain high calcification rates and for some species to even maintain an elevated saturation state of the calcifying fluid under reduced seawater Ωaragonite (Holcomb et al., 2014; McCulloch et al., 2017). However, this regulation comes at a cost as the active ion transport required to maintain the elevated pH (Holcomb et al., 2014) and/or calcium ions (DeCarlo et al., 2018) is achieved via the activity of Calcium-ATPase (Zoccola et al., 2004). In addition, bicarbonate ion concentration and the resulting aragonite saturation state are also tightly regulated through the activities of multiple enzymes and ion transporters (Bhattacharya et al., 2016). The energy required for the activity of those enzymes and transporters is produced by the coral host in the form of ATP through the mitochondrial electron transport system (ETSA) and oxidative phosphorylation of the respiration process (Chalker and Taylor, 1975; Galli and Solidoro, 2018).
The dependence of calcification on the capacity of energy (ATP activities) production is supported by the observation of a high number of mitochondria in the calicoblastic tissue (Tambutté et al., 2007), the suppression of light calcification by oxidative phosphorylation inhibitors (Chalker and Taylor, 1975), the expression of the enzymes and transporter involved in calcification which is limited to calicoblastic cells, and the correlation between the ETSA activities with calcification rates in both healthy and bleached corals (Agostini et al., 2013, 2016; Higuchi et al., 2018). Electron transport system activities can be measured by isolating fragmented mitochondrial membranes of the host tissue, and measuring the reduction of an artificial tetrazolium substrate (by the mitochondrial complex II) in the presence of a saturating concentration of the coenzyme NADH (Packard, 1971; Agostini et al., 2013). The transfer of electrons from complex II is deemed to be the slowest reaction in the chain and therefore would limit the following reaction including the production of ATP. Therefore, ETSA can be used to assess the coral potential for energy production (i.e., ATP).
Most studies on the effects of ocean acidification on coral calcification are conducted in laboratories under highly controlled environments and over relatively short timescales (Gattuso et al., 2015). Short experimental durations (days to weeks) do not allow corals to acquire complete acclimation to high pCO2 conditions and are clearly insufficient for achieving adaptation (multi-generation evolution) or ecological adaptation (selection of resistant species and/or individuals) to these conditions (Riebesell et al., 2010). Natural analogues such as volcanic CO2 seeps have increasingly been used to complement laboratory experiments (Hall-Spencer et al., 2008), allowing the physiological study of corals that have fully acclimatized to elevated pCO2 throughout at least their entire post-settlement lives (Noonan et al., 2018). At such natural analogues for future conditions, ocean acidification has drastically decreased the coverage and diversity of corals (Fabricius et al., 2011; Inoue et al., 2013; Enochs et al., 2015; Agostini et al., 2018). Since corals found in the acidified areas of CO2 seeps are ecologically adapted to the elevated pCO2 conditions (i.e., capable of surviving), those species for which individuals are found in reasonable numbers have been designated as winning species, while those that are very rare or absent from the elevated pCO2 areas are the losing species (sensu Fabricius et al., 2011).
The dichotomy of a species being either a “winner” or a “loser” may be inappropriate to encapsulate the range of effects of ocean acidification on hermatypic corals, but it has facilitated the distinction between traits that contribute toward the resistance of corals to ocean acidification. Here we present a study using two CO2 seeps, one located in the coral reefs off the coast of Normanby Island in Papua New Guinea, and the other in the coral communities off the coast of Shikine Island in Japan. The aim of the study was to highlight general physiological traits that distinguished winning species that are resistant to ocean acidification (present in the elevated pCO2 areas) from losing species that are sensitive to ocean acidification (almost or entirely absent in the elevated pCO2 areas but common in the control sites at ambient pCO2). The physiological traits studied were protein contents as a proxy for tissue biomass, and coral host mitochondrial electron transport system activities (ETSA) as a proxy for energy production, either normalized by coral tissue surface area or coral host protein contents. ETSA normalized by tissue surface area (surface area-specific ETSA) represents the potential energy production while ETSA normalized by protein contents of coral tissue (biomass-specific ETSA) represents the biomass specific potential energy production. Three hypotheses were tested (Figure 1).
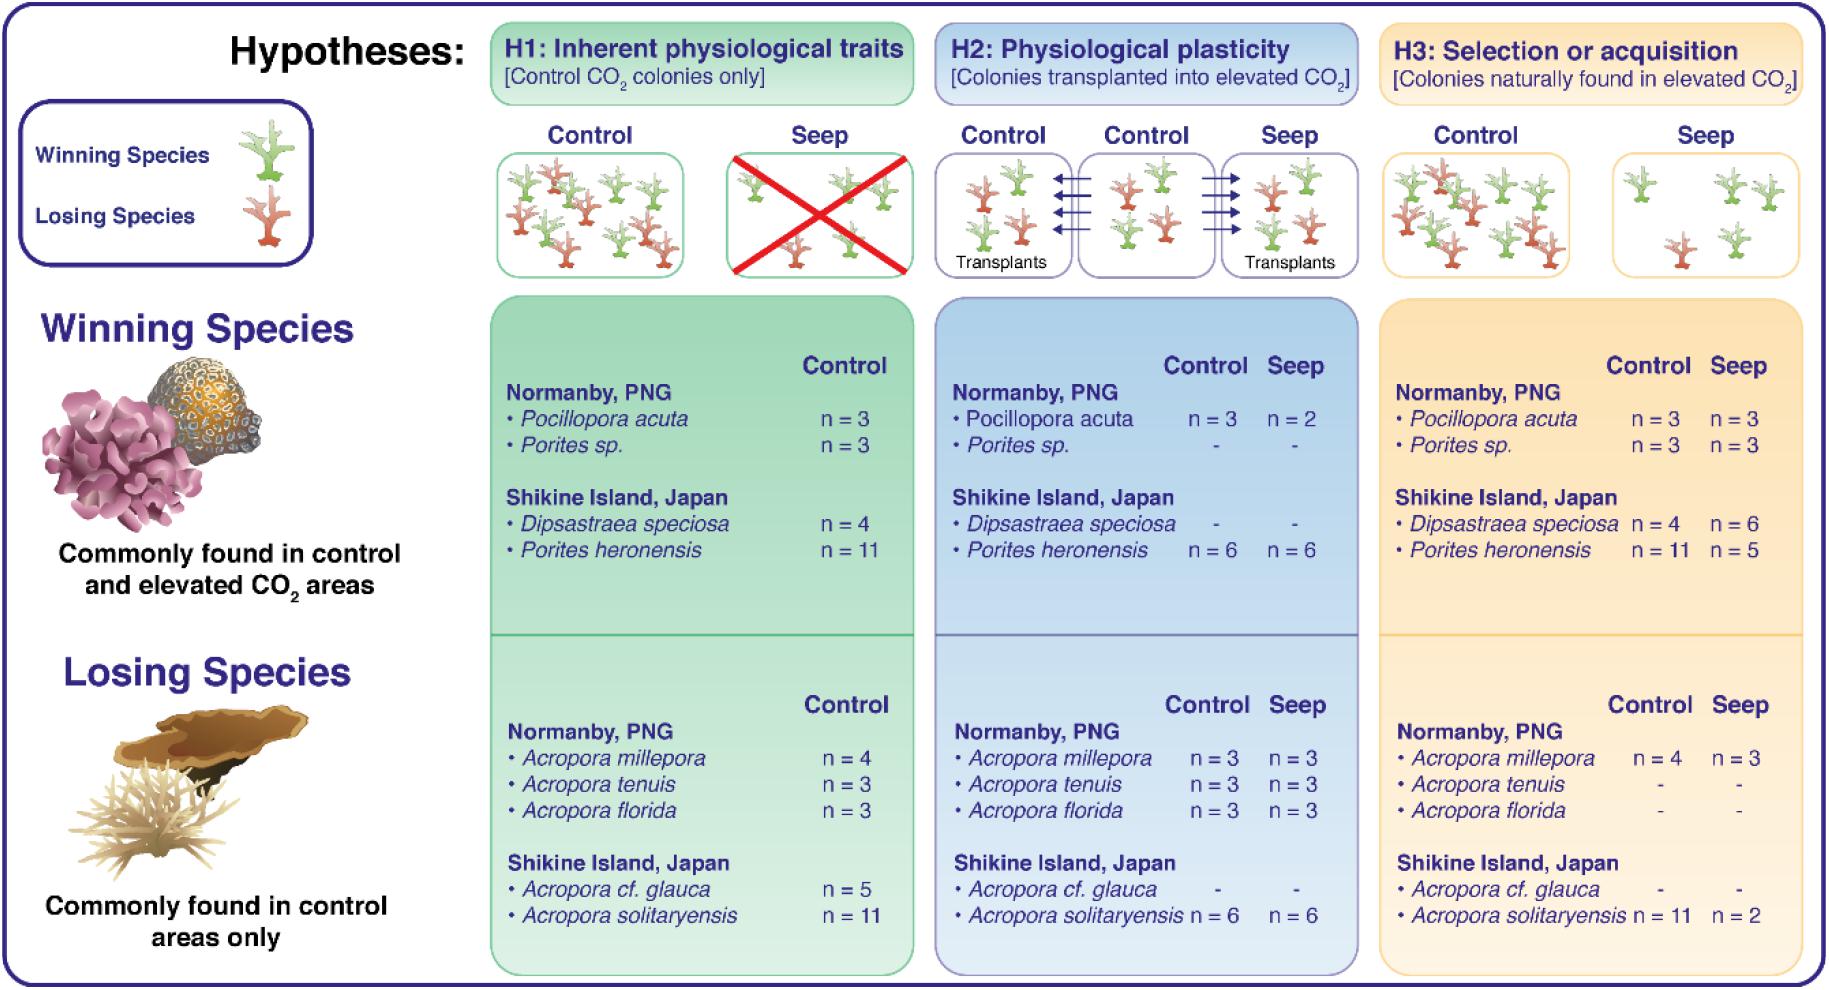
Figure 1. Physiological traits (Protein per surface, surface area-specific ETSA and biomass-specific ETSA) of coral specimens belonging to winning species and losing species were used to test three hypotheses. (1) Inherent physiological traits of coral species resistant to ocean acidification: Physiological traits of corals in control areas; (2) Physiological plasticity as an acclimation response to ocean acidification: Physiological traits of corals transplanted from control areas into control and elevated pCO2 areas (seep); (3) Selection or acquisition of resistance to ocean acidification: Physiological traits of corals found naturally in both elevated pCO2 (seep) and control areas (n indicates the number of coral specimens used for each species and each CO2 condition).
(1) Inherent physiological traits of coral species resistant to ocean acidification: Are inherent physiological traits related to biomass and energy production linked with the resistance to ocean acidification? This hypothesis was tested by measuring traits in individuals sampled in control areas only, thereby excluding potential stress responses and any acclimation/adaptation to elevated pCO2 conditions.
(2) Physiological plasticity as an acclimation response to ocean acidification: Can resistance to ocean acidification be acquired over a short timescale (4–5 months) via physiological plasticity? This was tested by conducting transplantation experiments of winning and losing coral species from the control areas to the same control areas, and from the control areas to the elevated pCO2 areas.
(3) Selection or acquisition of resistance to ocean acidification: Can the physiological traits required to tolerate ocean acidification be acquired either during the lifetime of individuals or through the selection of resistant individuals? This was tested by assessing the changes in protein contents and ETSA of winning and losing species that are naturally found in both the elevated pCO2 areas and nearby (non-acidified) control areas.
Materials and Methods
Sampling Sites
The study was conducted at two well-known CO2 seeps. Previous studies at these two sites showed that the main driver of the difference in benthic communities between control and elevated pCO2 sites was the increase in pCO2. No difference in depth, total alkalinity, and temperature were found between sites (Uthicke and Fabricius, 2012; Fabricius et al., 2014; Agostini et al., 2018; Harvey et al., 2019; Witkowski et al., 2019; Cattano et al., 2020). At both seeps, the released gas is composed of more than 97% CO2 with minimal concentrations in toxic gas such as hydrogen (Fabricius et al., 2011; Agostini et al., 2015). The first seep is located on the coast of Normanby Island in Papua New Guinea, and it has been extensively described in Fabricius et al. (2011) and following papers. The control area close to the CO2 seep is a well-developed fringing reef showing a high diversity and coverage of corals. This control site experienced pHT (mean ± SD) of 7.96 ± 0.03, corresponding to a pCO2 of 468 ± 37 ppm and Ωaragonite of 3.25 ± 0.17. In comparison, only few species of corals were found in the elevated pCO2 area, with the coral community clearly dominated by massive Porites spp., although a few massive or sub-massive Favids, and a few branching corals of different species were present where space was available. The carbonate chemistry at this elevated pCO2 area was: pHT (mean ± SD) 7.66 ± 0.22, corresponding to a pCO2 of 1,429 ± 1,027 ppm and Ωaragonite of 1.83 ± 0.69. The second seep system used in this study is located off the shore of Shikine Island in Japan which was first described in Agostini et al. (2015, 2018) and following papers. Situated at a latitude of 34°N, this site is at the transition between sub-tropical and temperate zones. Due to the oceanographic context of the region, waters off Shikine Island show low CO2 concentrations with pCO2 often dropping down to 300 ppm. Large tabular Acroporids, sub-massive and encrusting corals (e.g., Favids and Porites) inhabit the control areas of these warm temperate reefs. In contrast, the area close to the seeps shows a very low abundance of corals and an ecosystem mostly dominated by turf algae (Harvey et al., 2019). There, the only corals recorded are a few small colonies of Porites heronensis, Dipsastraea speciosa and two small colonies of Acropora solitaryensis. This area close to the seeps, hereafter “elevated pCO2 area” has the following carbonate chemistry conditions: pHT (mean ± SD) of 7.81 ± 0.09 corresponding to a pCO2 of 769 ± 225 ppm and a Ωaragonite of 1.76 ± 0.28. In contrast, the control areas located in an adjacent bay to the seeps are at ambient seawater carbonate chemistry: pHT (mean ± SD) of 8.14 ± 0.06, pCO2 of 309 ± 46 ppm and Ωaragonite of 3.30 ± 0.35 (Harvey et al., 2018). Coral sampling and transplantation were conducted at both the Normanby and Shikine study sites, and in both the elevated pCO2 and control areas.
Coral Samples
A total of 107 coral samples across 12 species were used, with 47 (across 7 species) sampled in Papua New Guinea under CITES permit 016132, and 60 (across 5 species) sampled in Shikine Island under permit Tokyo Prefecture 29-12. Fragments (5–10 cm2 in size) of individual colonies were randomly sampled using chisel and hammer by a SCUBA diver. Care was taken to remove potentially attached algae or fauna. All colonies sampled were healthy and did not show signs of bleaching or tissue necrosis. Each coral species was categorized as a winning species if they were commonly found in the elevated CO2 zones, or as a losing species if they were commonly found in the control zones but were absent or very rare from the elevated CO2 zones. Previous literature available on the distribution of coral species for the two locations was also taken into consideration, namely Fabricius et al. (2011) and Agostini et al. (2018) for the Normanby Island and Shikine Island seeps, respectively. Figure 1 summarizes all the species and coral specimens that were used.
(1) Inherent physiological traits of coral species resistant to ocean acidification: Physiological traits of corals in control areas
For the analyses designed to test hypothesis (1) Inherent physiological traits of coral species resistant to ocean acidification, fragments from colonies of the losing species Acropora millepora, Acropora florida, and Acropora tenuis for the Normanby site, and Acropora cf glauca and Acropora solitaryensis for the Shikine site, were sampled from the control areas. These were compared to traits measured on specimens from winning species sampled always at the control areas, Pocillopora acuta and massive Porites spp. for the Normanby site and Dipsastrea speciosa and Porites heronensis for the Shikine site.
(2) Physiological plasticity as an acclimation response to ocean acidification: Physiological Traits of corals transplanted from control areas into control and elevated pCO2 areas
To test hypothesis 2, we transplanted corals from the control areas into the elevated CO2 areas as well as into the same control site, the latter to test for transplantation effects. In Normanby, three losing species: A. millepora (control n = 4 and elevated pCO2 n = 3), A. tenuis (control n = 3 and elevated pCO2 n = 3), A. florida (control: n = 3 and elevated pCO2 n = 3), and one winning species: P. acuta (control n = 3 and elevated pCO2 n = 2), were transplanted from the 1st October 2016 to the 23rd January 2017. At the Shikine site, 12 individuals from the losing species A. solitaryensis and 12 individuals from the winning species P. heronensis were transplanted from the 22nd February 2018 to the 19th July 2018 into each site (n = 6 at each site for each species). Large fragments (>10 cm2 in surface area) of healthy colonies of the various species were haphazardly sampled from the control areas using chisel and hammer, avoiding the base of the colonies and parts with clearly visible lesions. The fragments were glued to PVC tiles using epoxy glue and randomly attached to metallic grids (90 × 60 cm) that were fixed 10–20 cm above the seabed using metallic anchors at a depth of 3–6 m at the respective sites. In Normanby, the samples were collected and immediately transplanted. In Shikine, the transplantation field setup was done 1 month after sampling the coral fragments. During that month, the fragments were allowed to recover from the sampling in outdoor aquarium with running seawater at the Shimoda Marine Research Center, University of Tsukuba, Japan. At the end of the transplantation period, coral fragments were retrieved and measured on board the research vessels.
(3) Selection or acquisition of resistance to ocean acidification: Physiological traits of corals found naturally in both elevated pCO2 and control areas
For the analyses designed to test hypothesis 3, we compared the physiological traits of winning and losing species where colonies could be found in both the control and elevated pCO2 area. Although winning species could be found and collected easily in both areas (P. acuta, massive Porites spp. at the Normanby site, and D. speciosa and P. heronensis at the Shikine site), only the losing species A. millepora (Normanby site) and A. solitaryensis (Shikine site) could be collected in both areas. Physiological traits of the specimens found in control and elevated pCO2 areas were compared. In addition, the traits of the specimens naturally found in the elevated pCO2 area were compared to the traits of corals transplanted from the control areas to the elevated pCO2 areas during the transplantation experiment.
ETSA and Protein Measurements Methods
The sampled fragments of colonies were immediately treated after collection, either aboard the M/B Chertan in Normanby, or at the Shikine Island Field Station (Shimoda Marine Research Center, University of Tsukuba) on Shikine Island. Coral tissue was removed using a custom air-gun connected to a source of compressed air in 10 ml of 0.2 μm filtered ice-cold seawater. Symbiodiniacea were pelleted by centrifugation (600 g, 15 min) and the coral host ETSA and protein contents were measured using the supernatant. All steps were conducted on ice to limit the degradation of the mitochondrial ETSAs. ETSA were measured under saturating concentrations of the NADH and NADPH coenzymes, in the presence of the artificial substrate INT ([4-iodophenyl]-3-[4-nitrophenyl]-5-phenyl-2H-tetrazolium chloride), following the protocols detailed in Agostini et al. (2013) with the following modifications. Filtered seawater instead of phosphate buffer saline was used for the blanks and for dissolving the reagents, and ETSA were extracted by placing 1 ml of the tissue slurry supernatant in 1.5 ml microtube in a sonic bath at 100 KHz for 10 min. For protein contents, 1 ml of the supernatant was stored at −20°C until measurement, which was carried out using the Bradford method (Bradford, 1976). Coral surface areas were determined by the wax method (Stimson and Kinzie, 1991).
Statistical Analysis
For all hypotheses the same physiological traits were used as response variables: protein contents (coral surface area normalized protein concentration), surface area-specific ETSA (coral surface area normalized ETSA), and biomass-specific ETSA (ETSA normalized by the host protein contents). For hypothesis 1, we tested for differences in those physiological traits between winning and losing species using a generalized linear mixed model (Gamma, link: identity) with resistance as a fixed effect (two levels: “Winning” and “Losing”) and location (two levels: “Shikine,” “Normanby”) as a random effect in order to account for the associated variability. For hypothesis 2, we assessed the effect of a short-term exposure to elevated pCO2 (4 months at the Normanby and 5 months at the Shikine seeps) compared to control conditions, for both winning and losing species. This used a generalized linear mixed model (Gamma, link: identity) with resistance (two levels: “Winning” and “Losing”) and CO2 condition (two levels: “Control,” “elevated pCO2”) as fixed effects, and species as a random effect.
For hypothesis 3, we tested for the differences in physiological traits for coral specimens found naturally in the elevated pCO2 areas compared to those found in the control areas, for both winning and losing species. This used a generalized linear mixed model (Gamma, link: identity) with resistance (two levels: “Winning” and “Losing”) and CO2 condition (two levels: “Control,” “elevated pCO2”) as fixed effects, and species as a random effect. Finally, the response to elevated pCO2 observed for coral specimens used in hypothesis 2 (“short exposure”) and hypothesis 3 (“life-long exposure”) were compared using a generalized linear mixed model (Gamma, link: identity) with resistance (two levels: “Winning” and “Losing”) and exposure duration (two levels: “short exposure,” “life-long exposure”) as fixed effects and species as a random effect. All analysis and visualizations were performed with the R statistical programming languages (R Core Team, 2020) using the RStudio IDE1 and the following packages: tidyverse (Wickham et al., 2019), ggplot2 (Wickham, 2016, p. 2), rstatix (Kassambara, 2020), patchwork (Pedersen, 2019), and lme4 (Bates et al., 2015). The code and raw data are available at https://gitlab.com/agoremix/oa-resistance.
Results
(1) Inherent physiological traits of coral species resistant to ocean acidification: Physiological traits of corals in control areas
The amount of protein normalized per coral surface area was more than twofold higher in losing species compared to winning species (175 ± 20 and 73 ± 15 μg cm–2, respectively; GLMM, resistance: t-value = 5.510, p < 0.001; Figure 2A and Supplementary Tables 1, 2.1). Mean surface area-specific ETSA was higher for losing species compared to winning species (15.0 ± 1.1 and 11.8 ± 1.2 μg O2 h–1 cm–2, respectively, Figure 2B and Supplementary Table 1) but the difference was marginally non-significant (GLMM, resistance: t-value = −1.921, p = 0.055; Supplementary Table 2.2). This resulted in the biomass-specific ETSA being fourfold greater in the winning species compared to the losing species (0.46 ± 0.14 and 0.11 ± 0.01 mg O2 h–1 mg–1 protein, respectively, GLMM, t-value = 2.039, p = 0.041; Figure 2C and Supplementary Tables 1, 2.3).
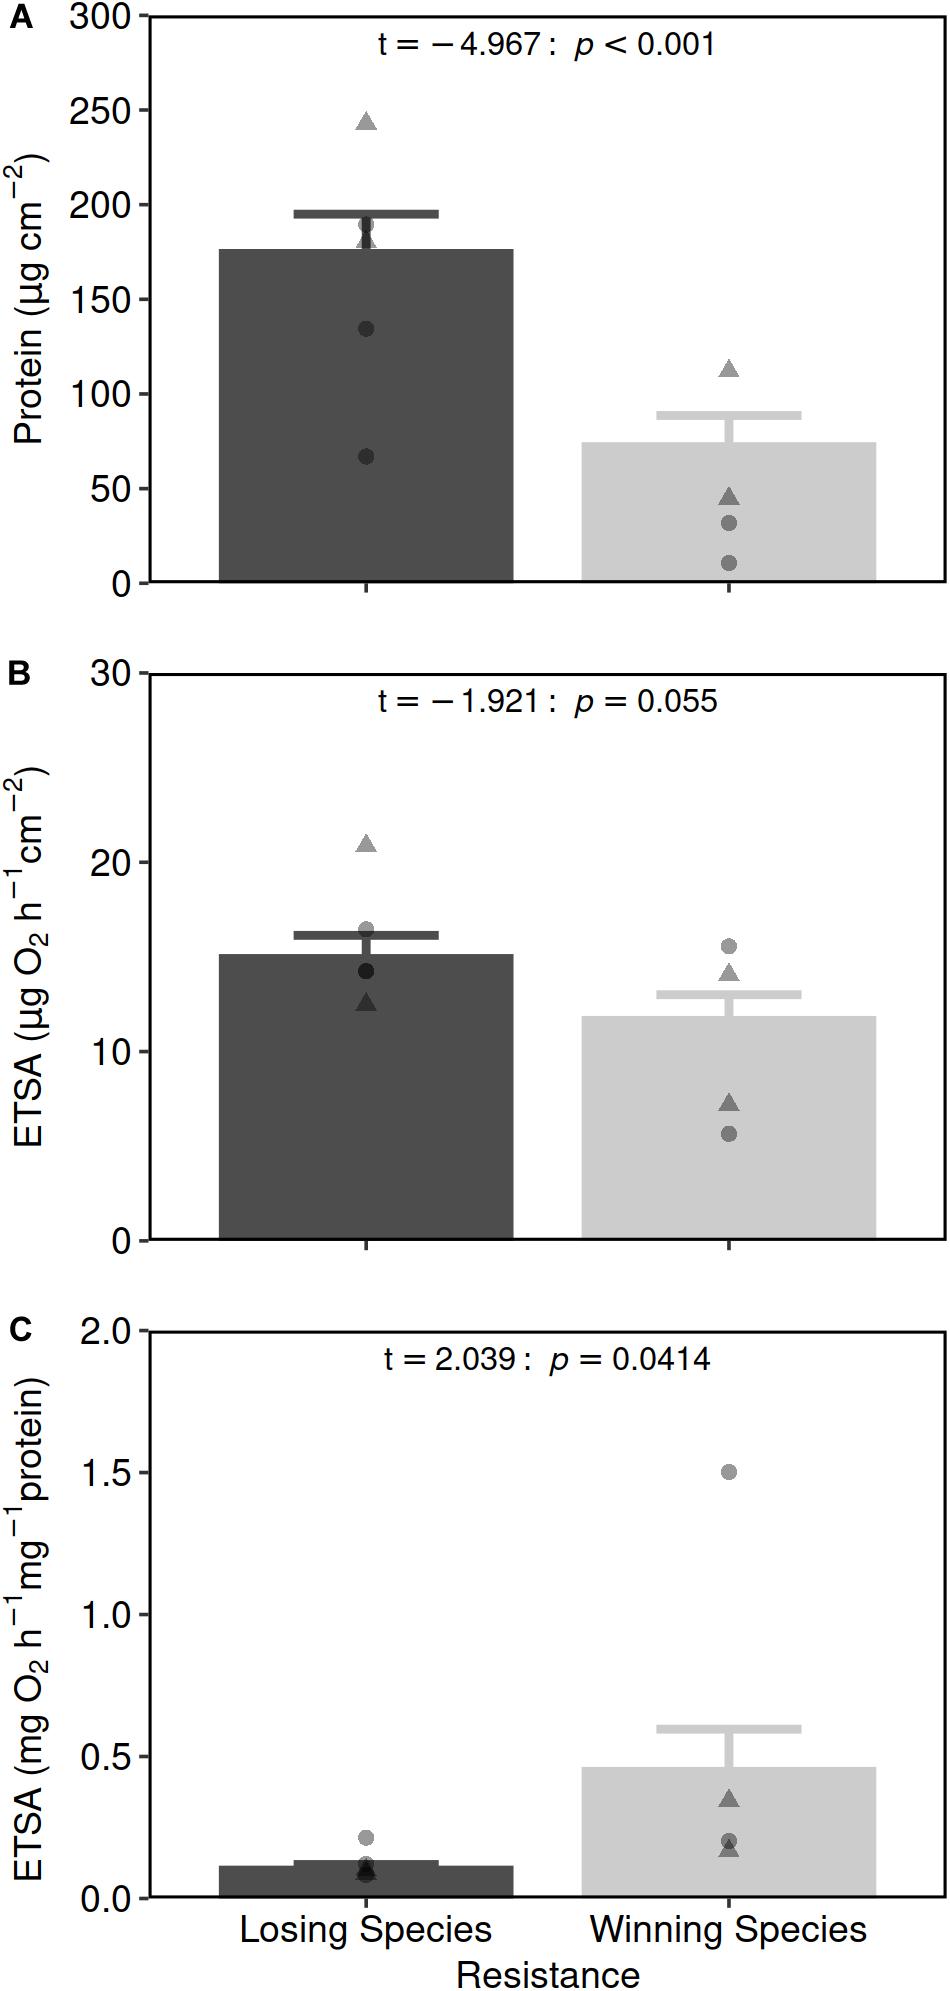
Figure 2. Protein per surface (A), ETSA per coral surface area (B) and ETSA per protein contents (C) (mean ± SE) in losing (black bars, sensitive to OA, n = 26) and winning coral species (gray bars, resistant to OA, n = 21), collected in the control areas. Individual points show the mean value per species with circles for species from the Normanby site and triangles for species from the Shikine site (see Supplementary Table 1). Two-way GLMM (Resistance with Location as a random factor) results are presented in the top-right of each panel (see Supplementary Table 2 for more detailed statistics).
(2) Physiological plasticity as an acclimation response to ocean acidification: Physiological traits of corals transplanted from control areas into control and elevated pCO2 areas
The four losing species tested (Acropora millepora, Acropora tenuis, Acropora florida, and Acropora solitaryensis) on average showed ∼40% decrease in their protein contents (Figure 3A and Supplementary Table 3) following a 4 or 5 months acclimation to elevated pCO2 conditions (from 147 ± 17 μg cm–2 at the control sites to 87 ± 13 μg cm–2 at the elevated pCO2 sites). The two winning species did not exhibit such a decrease, maintaining their protein contents at 87 ± 17 and 97 ± 15 μg cm–2 after transplantation to the control and elevated pCO2 sites, respectively (GLMM: CO2 condition x resistance, t-value = 2.064, p = 0.039; Supplementary Table 4.1).
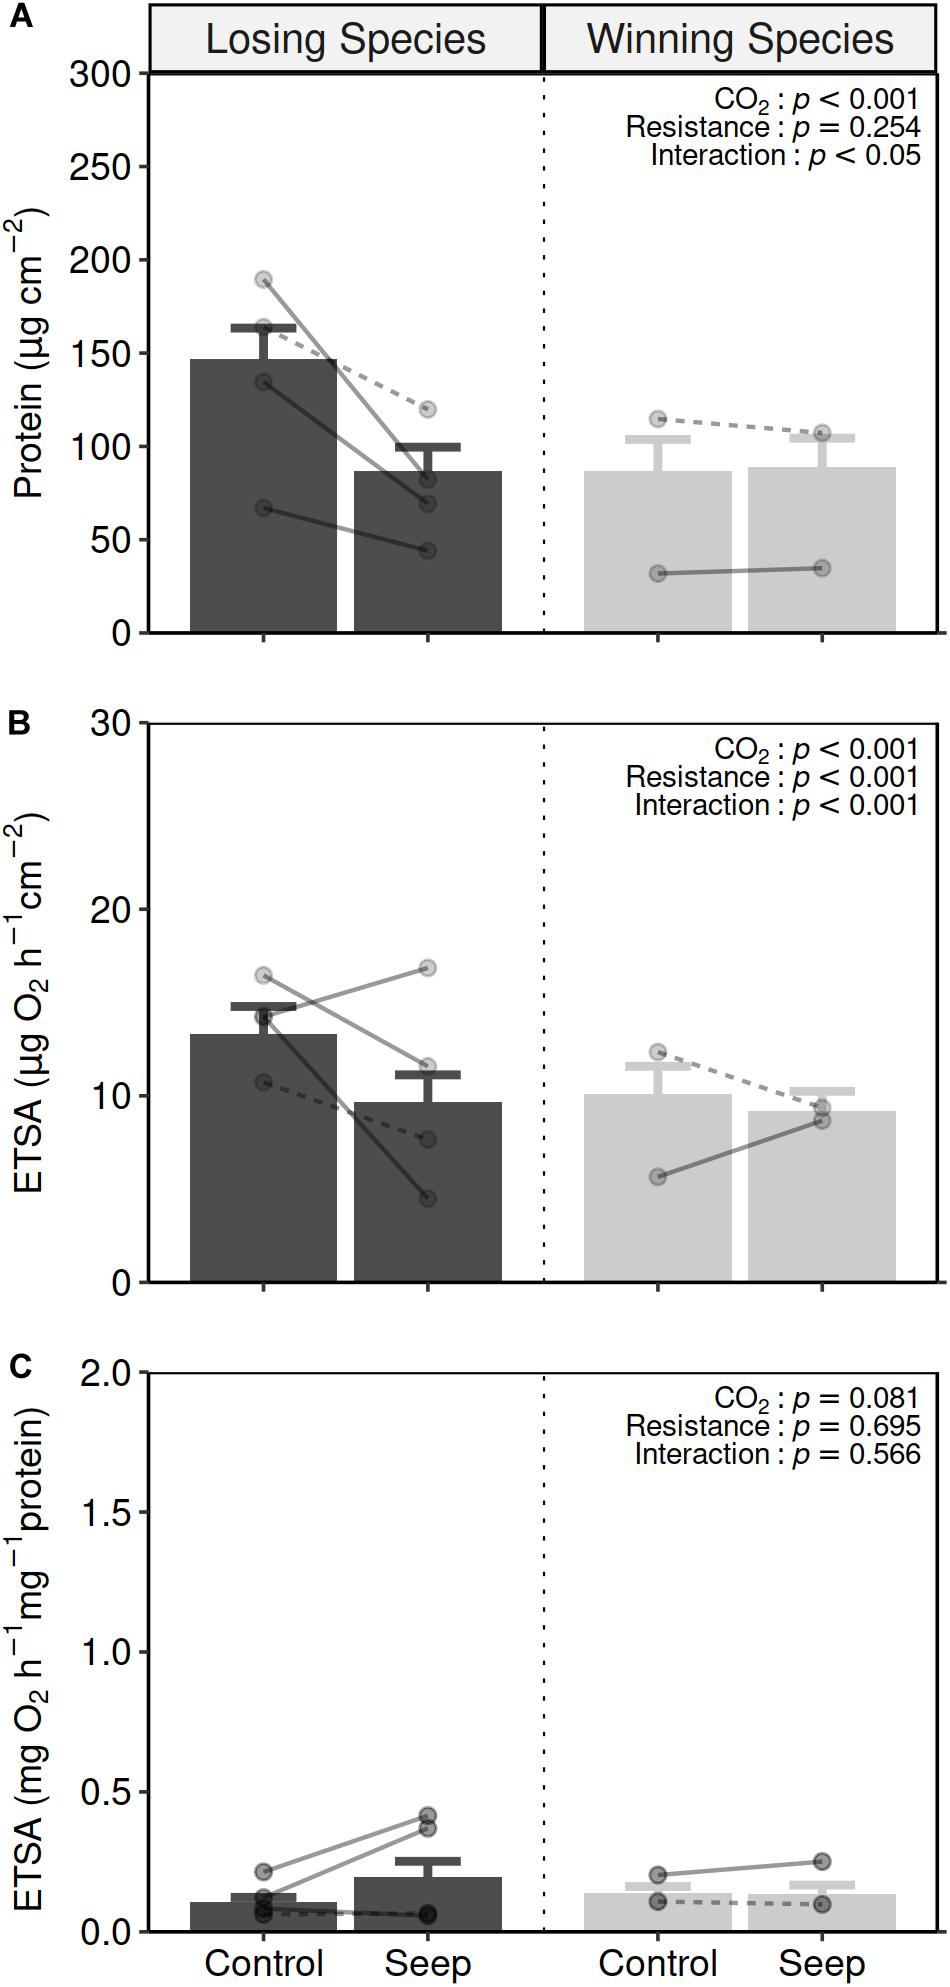
Figure 3. Mean (±SE) protein per surface (A), ETSA per coral surface area (B) and ETSA per protein contents (C) in losing species (black bars), and winning species (gray bars) specimens transplanted from the control areas to the control areas (control) and elevated pCO2 areas (seep) for 4–5 months (losing species specimens: control n = 14, seep n = 5; winning species specimens: control n = 20, seep = 16). Points and lines show the mean and response per species with dashed and plain lines representing species from Shikine and Normanby CO2 seeps, respectively (see Supplementary Table 3). Two-way GLMM: CO2 condition x resistance with Species as a random factor) results are presented in the top-right of each panel (see Supplementary Table 4 for more detailed statistics).
The response of surface area-specific ETSA (Figure 3B and Supplementary Table 3) following a 4–5 months acclimation to elevated pCO2 conditions showed a similar pattern to protein contents, with losing species showing a decrease in activity (from 13.3 ± 1.4 μg O2 h–1 cm–2 at the control areas to 9.6 ± 1.5 μg O2 h–1 cm–2 at the elevated pCO2 areas), and winning species showing relatively little change (10.1 ± 1.5 μg O2 h–1 cm–2 at the control sites to 9.2 ± 1.1 μg O2 h–1 cm–2 at the elevated pCO2 sites). The different responses exhibited by winning and losing species following transplantation into elevated pCO2 conditions resulted in a significant interaction (GLMM: CO2 condition x resistance, t-value = 811.0, p < 0.001; Supplementary Table 4.2).
For biomass-specific ETSA (Figure 3C and Supplementary Table 3), two patterns were observed with either a trend of increasing activity (Acropora tenuis, Acropora florida, and Pocillopora acuta) or remaining at similar levels of activity (Acropora solitaryensis, Dipsastraea speciosa, and Porites heronensis). However overall there was no significant response following transplantation into elevated pCO2 conditions, regardless of the resistance of the species (GLMM: CO2 condition, t-value = 1.747, p = 0.081; resistance, t-value = 0.393, p = 0.695; CO2 condition × resistance, t-value = −0.573, p = 0.567; Supplementary Table 4.3).
(3) Selection or acquisition of resistance to ocean acidification: Physiological traits of corals found naturally in both elevated pCO2 and control areas
For those coral specimens found naturally, only the losing species showed a difference in the amount of protein per surface area between control and elevated pCO2 areas (Figure 4A and Supplementary Table 5). The mean amount of protein for those specimens collected at the elevated pCO2 areas (86 ± 12 μg cm–2) was half that of the specimens collected at the control areas (183 ± 26 μg cm–2). This decrease was consistent for the two losing species tested: A. millepora and A. solitaryensis, at the Normanby and Shikine CO2 seeps, respectively. The mean amount of protein for winning species remained the same between specimens collected at the elevated pCO2 and control areas (GLMM, CO2 condition x resistance, t-value = 2.435, p = 0.015; Supplementary Table 6.1).
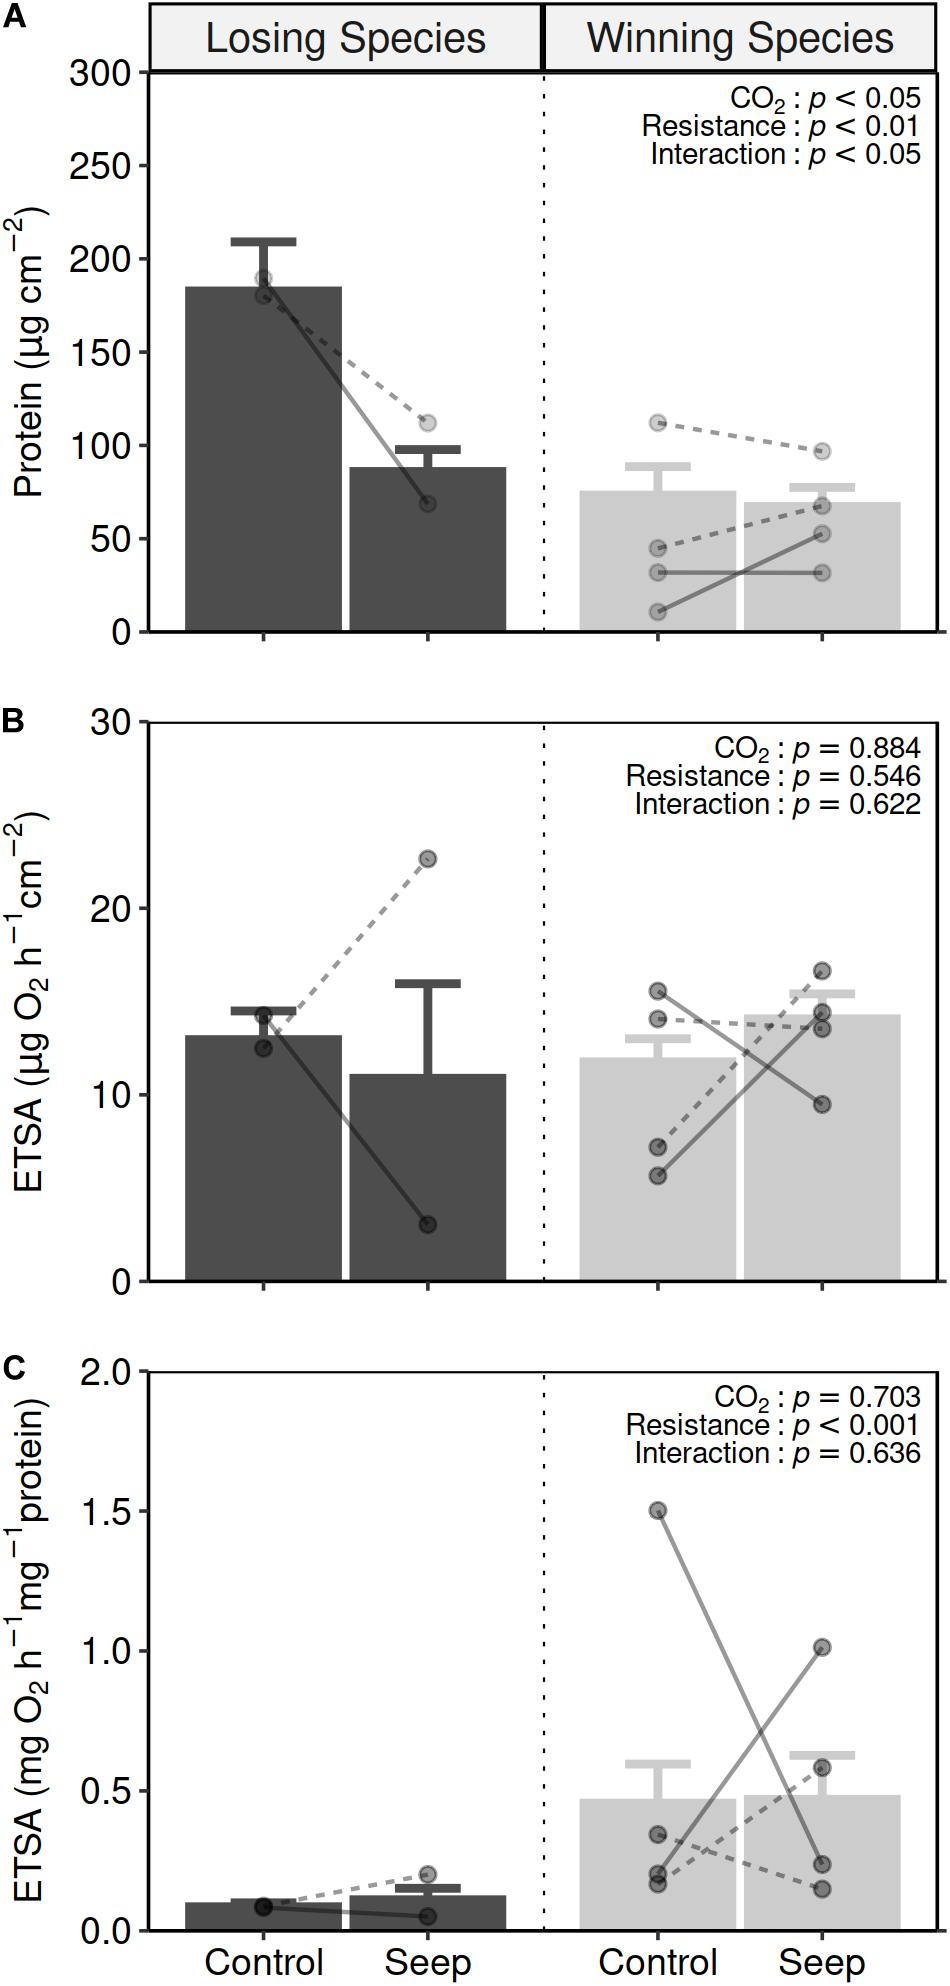
Figure 4. Mean (±SE) protein per surface (A), ETSA per coral surface area (B) and ETSA per protein contents (C) in losing species (black bars) and winning species (gray bars) species sampled at the control areas (control) and elevated pCO2 areas (seep) (losing species specimens: control n = 14, seep n = 5; winning species specimens: control n = 20, seep = 16). Points and lines show the mean and response per species with dashed and plain lines representing species from Shikine and Normanby sites, respectively (see Supplementary Table 5). Two-way GLMM (CO2 condition x resistance with Species as a random factor) results are presented in the top-right of each panel (see Supplementary Table 6 for more detailed statistics).
The response of ETSA in coral specimens exposed to life-long elevated pCO2 conditions varied greatly among species. The amount of surface area-specific ETSA (Figure 4B and Supplementary Table 5) did not differ between specimens sampled in either control or elevated pCO2 areas (GLMM, CO2 condition: t-value = −0.146, p = 0.884) for both the winning nor losing coral species (GLMM, resistance: t-value = −0.603, p = 0.546) with no significant interaction (CO2 condition x resistance: t-value = 0.493, p = 0.622; Supplementary Table 6.2). Biomass-specific ETSA (Figure 4C and Supplementary Table 5) were five times higher in the winning species (0.46 ± 0.14 mg O2 h–1 mg–1 protein) compared to the losing species (0.093 ± 0.014 mg O2 h–1 mg–1 protein) (GLMM, resistance, t-value = 3.519, p = 0.0004) but did not differ between CO2 conditions for neither winning or losing species (GLMM, CO2 condition: t-value = 0.381, p = 0.703; CO2 condition x resistance: t-value = −0.473, p = 0.636; Supplementary Table 6.1).
The response to life-long exposure to elevated pCO2 (hypothesis 3) was consistent with the response observed during the transplantation of specimens from control areas to elevated pCO2 areas (hypothesis 2) (Supplementary Tables 3, 5 and Supplementary Figure 1). No significant differences were observed in the response of coral specimens to the different periods of exposure to elevated pCO2 for the mean amount of protein (GLMM, Exposure Condition, t-value = 0.685, p = 0.4936; Supplementary Figure 1A and Supplementary Table 7.1), surface area-specific ETSA (GLMM, Exposure Condition, t-value = −1.400, p = 0.1615; Supplementary Figure 1A and Supplementary Table 7.2), or biomass-specific ETSA (GLMM, Exposure Condition, t-value = −0.433, p = 0.665; Supplementary Figure 1A and Supplementary Table 7.3), in either losing or winning species (no significant interactions; GLMM, p > 0.05; Supplementary Tables 5, 7).
Discussion
Climate change and ocean acidification will likely transform coral communities leaving only the most resistant species (Hughes et al., 2018) and individuals (Matsuda et al., 2020). Natural analogues such as CO2 seeps can reveal ecological shifts in the composition of coral communities and highlight which physiological traits are associated with a higher resistance to ocean acidification. Here we found that resistant winning species had a lower biomass per coral surface area compared to losing species, while at similar levels of mitochondrial electron transport activities (ETSA). This resulted in a higher ETSA per biomass in the winning species. These traits were interpreted as the capacity of winning species to allocate more energy toward inorganic growth compared to losers which allocate more energy toward somatic growth. These traits are inherent to winning species and were not acquired following exposure to elevated pCO2 since they were observed in specimens that were found in both the control and elevated pCO2 areas. This capacity could generally not be acquired by the losing species, whether through physiological plasticity (following 4–5 months or lifelong acclimation to elevated pCO2 conditions) or through the selection of specimens that show physiological traits associated with resistance to ocean acidification (a high biomass-specific energy production potential) (see Figure 5). The responses following acclimation to elevated pCO2 differed among species, with some winning species showing changes in their energy allocation depending on the pCO2 levels they were maintained under. This demonstrates that winning species are still affected by ocean acidification, with their response either corresponding to some acclimation mechanisms that aims to increase their fitness under elevated pCO2 or a negative impact of ocean acidification on their physiology. This highlights that the dichotomy of “winner” versus “loser” as previously proposed is too restrictive, and while informative, it does not accurately reflect the variety of responses and acclimation strategies of corals to ocean acidification.
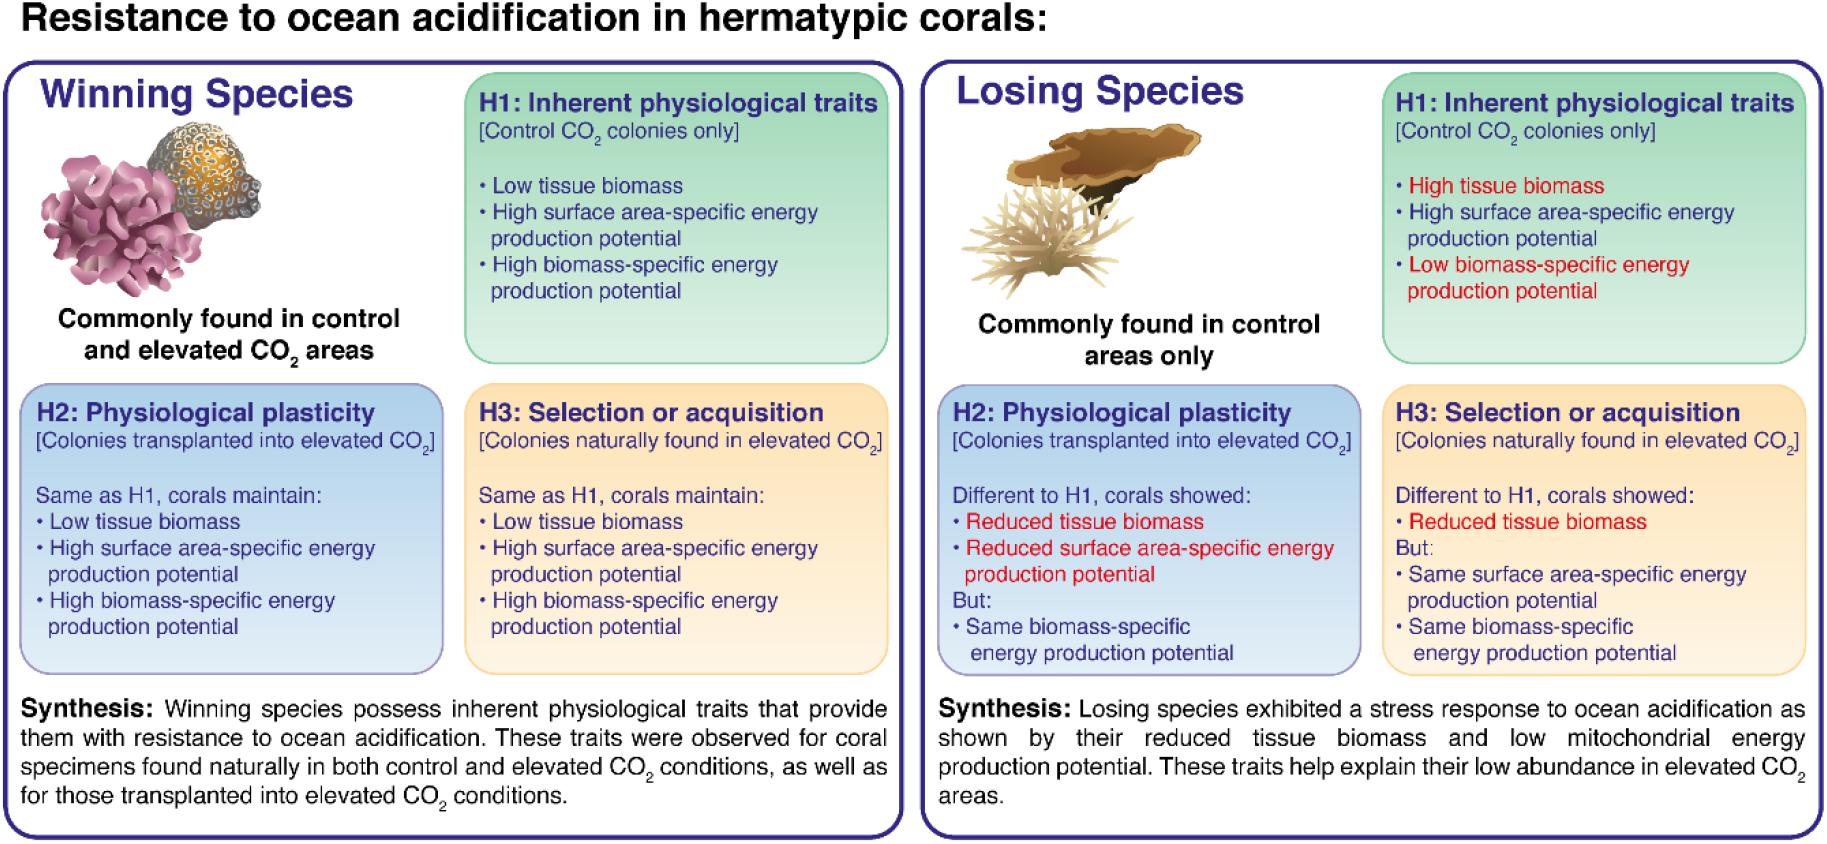
Figure 5. Synthesis and interpretation of the main results for hypothesis (1) Inherent physiological traits of coral species resistant to ocean acidification: Physiological traits of corals in control areas, Hypothesis (2) Physiological plasticity as an acclimation response to ocean acidification: Physiological traits of corals transplanted from control areas into control and elevated pCO2 areas, and Hypothesis (3) Selection or acquisition of resistance to ocean acidification: Physiological traits of corals found naturally in both elevated pCO2 and control areas.
A higher biomass or tissue thickness can provide more protection at the site of calcification (Jokiel, 2011; Rodolfo-Metalpa et al., 2011; Strahl et al., 2015; Kline et al., 2019) which allows for a better control of the aragonite saturation state and maintenance of inorganic growth under elevated pCO2 conditions (Trotter et al., 2011; Holcomb et al., 2014). Individuals that can survive within the naturally acidified environment represent individuals whose physiological traits conferred them with sufficient resistance to ocean acidification as well as being ecologically capable of competing for primary space. In our study, the winning species exhibited a lower biomass in terms of their protein content normalized per coral tissue surface area. For example, despite their imperforated skeleton and low tissue biomass Pocilloporids are considered as resistant to ocean acidification (Comeau et al., 2014). Conversely, the higher protein contents found in losing species suggests that these species may require a larger amount of energy for somatic growth and the maintenance of this biomass (Kaniewska et al., 2015). This suggests that the amount of biomass covering the skeleton does not directly relate to a species’ resistance to ocean acidification, instead the costly maintenance of biomass could reduce the ecological fitness of losing species under elevated pCO2.
The mitochondrial ETSA, which represents the maximum potential rate of the respiratory electron transfer and therefore production of ATP, was similar or even slightly higher (albeit non-significantly) for the losing species compared to winning species when normalized by coral surface area. This finding reinforces the unexpected result that winning coral species do not achieve a greater resistance to ocean acidification through an increased biomass and/or availability of energy. Instead, the lower biomass and similar ETSA per coral surface area resulted in higher ETSA per biomass in the winning species. The resistance of winning coral species to ocean acidification could be linked with a different allocation strategy of energy between inorganic growth and somatic growth, with winning species allocating a greater amount of energy toward inorganic growth. As ocean acidification increases the energetic cost of calcification (Cohen and Holcomb, 2009), a higher energy production potential (ETSA) could allow for a stronger maintenance of the aragonitic saturation state at the site of calcification, enabling the maintenance of inorganic growth even under elevated pCO2 (McCulloch et al., 2012). This increased energetic potential relative to biomass would additionally support other metabolic processes important for the resistance against ocean acidification, such as high fecundity (Albright, 2011), protein synthesis (Edmunds and Wall, 2014), or the maintenance of other anabolic pathways (Kaniewska et al., 2015).
In the present study, coral species that are sensitive to ocean acidification showed a decrease in their biomass regardless of whether they were acclimatized for 4–5 months or exposed for their entire lifetime to elevated pCO2. Similar decreases in biomass have been observed across multiple studies (Edmunds and Wall, 2014; Strahl et al., 2015; Wall et al., 2017) with the response attributed to an impairment of protein anabolism due to elevated pCO2. Two of the losing coral species (A. florida and A. tenuis) transplanted into the elevated pCO2 conditions exhibited similar traits to the winning species, which themselves were unaffected by the change in pCO2. This suggests that certain losing species are capable of demonstrating some physiological plasticity related to energy allocation. However this was not observed for the two other species (A. solitaryensis and A. millepora) tested and this plasticity did not translate into an overall increase in the biomass-specific energy production potential. Our observations support that resistance to ocean acidification cannot be acquired within a single generation (Comeau et al., 2019). Physiological traits of corals transplanted to elevated pCO2 areas did not differ from those exhibited by corals that were found and sampled in the elevated pCO2 areas: losing species exhibited a decrease in biomass which did not translate into an increase in biomass-specific energy production potential compared to winning species that were mostly unaffected by the elevated pCO2. As specimens from losing species are rarely found in the elevated pCO2 areas as well as often being of smaller size, this suggest that such short-term plasticity through the downregulation of metabolic processes may not be viable in the long term.
Although the different acclimation periods to elevated pCO2 altered the specific responses of the species, the general patterns observed here were mostly consistent for corals tested in two radically different biogeographic regions, the coral reefs of Papua New Guinea and the marginal warm-temperate coral communities of Japan. The lower aragonite saturation state found in high latitudes suggests that the coral species there could have a higher tolerance to ocean acidification (Kleypas, 1999; Yara et al., 2012). However, the parameters tested in our study did not reveal a remarkable difference in terms of energy allocation between tropical and temperate coral species. This suggest that other traits, either physiological or ecological, may contribute toward the resistance to ocean acidification.
The importance of calcification and somatic growth in determining the resistance of scleractinian corals to ocean acidification remains poorly understood. Our findings suggest that species resistant to ocean acidification have a lower maintenance cost for biomass compared to more sensitive species. This could allow for more energy to be allocated toward inorganic growth providing them with an ecological advantage under high CO2. The losing species did not exhibit these physiological traits and could not even acquire them through physiological plasticity or the selection of individuals. Instead, losing species exhibit a stress response under elevated pCO2 whereby their biomass cannot be maintained. Taken together, unless adaptation rapidly occurs, losing species will lack the resistance required to survive future acidification, leaving only those species that possess an inherent resistance to ocean acidification. Such radical selection will likely result in a major loss of diversity and associated functioning in coral communities around the world.
Data Availability Statement
The datasets presented in this study can be found in online repositories. The names of the repository/repositories and accession number(s) can be found below: https://gitlab.com/agoremix/oa-resistance and Zenodo repository (https://doi.org/10.5281/zenodo.4415127).
Author Contributions
SA, MM, FH, and RR-M contributed to conception and design of the study. SA, MM, FH, RR-M, and TB conducted the experiment and field survey in Papua New Guinea. SA, BH, RT, JH, and WY conducted the experiment and field survey in Japan. SA wrote the first draft of the manuscript. All authors contributed to manuscript revision, read, and approved the submitted version.
Funding
Fieldwork and analyses at the Shikine and Normanby seeps were supported by JSPS KAKENHI Grant in Aids (Grant No: 17K17621), and by the French National Research Agency (ANR, project CARIOCA no. ANR15CE02-0006-01, 2015). We acknowledge funding support from the Ministry of Environment, Government of Japan (Suishinhi: 4RF-1701).
Conflict of Interest
The authors declare that the research was conducted in the absence of any commercial or financial relationships that could be construed as a potential conflict of interest.
Acknowledgments
We thank Yasutaka Tsuchiya and the technical staff at Shimoda Marine Research Center and aboard RV Tsukuba II, University of Tsukuba for their assistance and the JF agencies of Izu/Shimoda (Shizuoka prefecture) and Nijima/Shikine Island (Tokyo prefecture) for their support. We are grateful to the local populations of Normanby for the access to their reef, and to the National Research Institute, the Milne Bay Provincial Research Committee, and the Conservation and Environment Protection Authority of Papua New Guinea for permits. This publication contributes toward the International Education and Research Laboratory Program, University of Tsukuba. Images used in Figures 1 and 5 are courtesy of the Integration and Application Network, University of Maryland Center for Environmental Science (ian.umces.edu/symbols/).
Supplementary Material
The Supplementary Material for this article can be found online at: https://www.frontiersin.org/articles/10.3389/fmars.2020.600836/full#supplementary-material
Footnotes
References
Agostini, S., Fujimura, H., Fujita, K., Suzuki, Y., and Nakano, Y. (2013). Respiratory electron transport system activity in symbiotic corals and its link to calcification. Aquat. Biol. 18, 125–139. doi: 10.3354/ab00496
Agostini, S., Fujimura, H., Hayashi, H., and Fujita, K. (2016). Mitochondrial electron transport activity and metabolism of experimentally bleached hermatypic corals. J. Exper. Mar. Biol. Ecol. 475, 100–107. doi: 10.1016/j.jembe.2015.11.012
Agostini, S., Harvey, B. P., Wada, S., Kon, K., Milazzo, M., Inaba, K., et al. (2018). Ocean acidification drives community shifts towards simplified non-calcified habitats in a subtropical-temperate transition zone. Sci. Rep. 8:11354. doi: 10.1038/s41598-018-29251-29257
Agostini, S., Wada, S., Kon, K., Omori, A., Kohtsuka, H., Fujimura, H., et al. (2015). Geochemistry of two shallow CO2 seeps in Shikine Island (Japan) and their potential for ocean acidification research. Reg. Stud. Mar. Sci. 2, 45–53. doi: 10.1016/j.rsma.2015.07.004
Albright, R. (2011). Reviewing the effects of ocean acidification on sexual reproduction and early life history stages of reef-building corals. J. Mar. Biol. 2011:473615. doi: 10.1155/2011/473615
Albright, R., Caldeira, L., Hosfelt, J., Kwiatkowski, L., Maclaren, J. K., Mason, B. M., et al. (2016). Reversal of ocean acidification enhances net coral reef calcification. Nature 531, 362–365. doi: 10.1038/nature17155
Bates, D., Mächler, M., Bolker, B., and Walker, S. (2015). Fitting linear mixed-effects models using lme4. J. Statist. Softw. 67:104235. doi: 10.18637/jss.v067.i01
Bhattacharya, D., Agrawal, S., Aranda, M., Baumgarten, S., Belcaid, M., Drake, J. L., et al. (2016). Comparative genomics explains the evolutionary success of reef-forming corals. eLife 5:e13288. doi: 10.7554/eLife.13288
Bradford, M. (1976). A rapid and sensitive method for the quantitation of microgram quantities of protein utilizing the principle of protein-dye binding. Analyt. Biochem. 72, 248–254. doi: 10.1016/0003-2697(76)90527-90523
Cattano, C., Agostini, S., Harvey, B. P., Wada, S., Quattrocchi, F., Turco, G., et al. (2020). Changes in fish communities due to benthic habitat shifts under ocean acidification conditions. Sci. Total Environ. 725:138501. doi: 10.1016/j.scitotenv.2020.138501
Chalker, B. E., and Taylor, D. L. (1975). Light-enhanced calcification, and the role of oxidative phosphorylation in calcification of the coral Acropora cervicornis. Proc. R. Soc. B Biol. Sci. 190, 323–331. doi: 10.1098/rspb.1975.0096
Cohen, A., and Holcomb, M. (2009). Why corals care about ocean acidification: uncovering the mechanism. Oceanography 22, 118–127. doi: 10.5670/oceanog.2009.102
Comeau, S., Cornwall, C. E., DeCarlo, T. M., Doo, S. S., Carpenter, R. C., and McCulloch, M. T. (2019). Resistance to ocean acidification in coral reef taxa is not gained by acclimatization. Nat. Clim. Chang. 9, 477–483. doi: 10.1038/s41558-019-0486-489
Comeau, S., Edmunds, P. J., Spindel, N. B., and Carpenter, R. C. (2014). Fast coral reef calcifiers are more sensitive to ocean acidification in short-term laboratory incubations. Limnol. Oceanogr. 59, 1081–1091. doi: 10.4319/lo.2014.59.3.1081
DeCarlo, T. M., Comeau, S., Cornwall, C. E., and McCulloch, M. T. (2018). Coral resistance to ocean acidification linked to increased calcium at the site of calcification. Proc. R. Soc. B 285:20180564. doi: 10.1098/rspb.2018.0564
Edmunds, P. J., and Wall, C. B. (2014). Evidence that high pCO2 affects protein metabolism in tropical reef corals. Biol. Bull. 227, 68–77. doi: 10.1086/BBLv227n1p68
Enochs, I. C., Manzello, D. P., Donham, E. M., Kolodziej, G., Okano, R., Johnston, L., et al. (2015). Shift from coral to macroalgae dominance on a volcanically acidified reef. Nat. Clim. 5, 1083–1088. doi: 10.1038/nclimate2758
Eyre, B. D., Cyronak, T., Drupp, P., Carlo, E. H. D., Sachs, J. P., and Andersson, A. J. (2018). Coral reefs will transition to net dissolving before end of century. Science 359, 908–911. doi: 10.1126/science.aao1118
Fabricius, K. E., De’ath, G., Noonan, S., and Uthicke, S. (2014). Ecological effects of ocean acidification and habitat complexity on reef-associated macroinvertebrate communities. Proc. R. Soc. B 281:20132479. doi: 10.1098/rspb.2013.2479
Fabricius, K. E., Langdon, C., Uthicke, S., Humphrey, C., Noonan, S., De’ath, G., et al. (2011). Losers and winners in coral reefs acclimatized to elevated carbon dioxide concentrations. Nat. Clim. Chang. 1, 165–169. doi: 10.1038/nclimate1122
Galli, G., and Solidoro, C. (2018). ATP supply may contribute to light-enhanced calcification in corals more than abiotic mechanisms. Front. Mar. Sci. 5:68. doi: 10.3389/fmars.2018.00068
Gattuso, J.-P., Magnan, A., Billé, R., Cheung, W. W. L., Howes, E. L., Joos, F., et al. (2015). Contrasting futures for ocean and society from different anthropogenic CO2 emissions scenarios. Science 349:aac4722. doi: 10.1126/science.aac4722
Hall-Spencer, J. M., Rodolfo-Metalpa, R., Martin, S., Ransome, E., Fine, M., Turner, S. M., et al. (2008). Volcanic carbon dioxide vents show ecosystem effects of ocean acidification. Nature 454, 96–99. doi: 10.1038/nature07051
Harvey, B. P., Agostini, S., Kon, K., Wada, S., and Hall-Spencer, J. M. (2019). Diatoms dominate and alter marine food-webs when CO2 rises. Diversity 11:242. doi: 10.3390/d11120242
Harvey, B. P., Agostini, S., Wada, S., Inaba, K., and Hall-Spencer, J. M. (2018). Dissolution: the achilles’ heel of the triton shell in an acidifying ocean. Front. Mar. Sci. 5:371. doi: 10.3389/fmars.2018.00371
Higuchi, T., Yuyama, I., and Agostini, S. (2018). “Physiology of winter coral bleaching in temperate zone,” in Proceedings of the COAST Symposium, Bordeaux.
Holcomb, M., Venn, A. A., Tambutté, E., Tambutté, S., Allemand, D., Trotter, J., et al. (2014). Coral calcifying fluid pH dictates response to ocean acidification. Sci. Rep. 4:5207. doi: 10.1038/srep05207
Hughes, T. P., Anderson, K. D., Connolly, S. R., Heron, S. F., Kerry, J. T., Lough, J. M., et al. (2018). Spatial and temporal patterns of mass bleaching of corals in the Anthropocene. Science 359, 80–83. doi: 10.1126/science.aan8048
Inoue, S., Kayanne, H., Yamamoto, S., and Kurihara, H. (2013). Spatial community shift from hard to soft corals in acidified water. Nat. Clim. Chang. 3, 683–687. doi: 10.1038/nclimate1855
IPCC (2018). Global Warming of 1.5°C., eds V. Masson-Delmotte, P. Zhai, H. O. Pörtner, D. Roberts, J. Skea, P.R. Shukla, et al. Available online at: http://www.ipcc.ch/report/sr15/ (accessed January 18, 2019).
Jokiel, P. L. (2011). The reef coral two compartment proton flux model: a new approach relating tissue-level physiological processes to gross corallum morphology. J. Exper. Mar. Biol. Ecol. 409, 1–12. doi: 10.1016/j.jembe.2011.10.008
Kaniewska, P., Chan, C.-K. K., Kline, D., Ling, E. Y. S., Rosic, N., Edwards, D., et al. (2015). Transcriptomic changes in coral holobionts provide insights into physiological challenges of future climate and ocean change. PLoS One 10:e0139223. doi: 10.1371/journal.pone.0139223
Kassambara, A. (2020). rstatix: Pipe-Friendly Framework for Basic Statistical Tests. Available online at: https://CRAN.R-project.org/package=rstatix (accessed December 31, 2020).
Kleypas, J. A. (1999). Geochemical consequences of increased atmospheric carbon dioxide on coral reefs. Science 284, 118–120. doi: 10.1126/science.284.5411.118
Kline, D. I., Teneva, L., Okamoto, D. K., Schneider, K., Caldeira, K., Miard, T., et al. (2019). Living coral tissue slows skeletal dissolution related to ocean acidification. Nat. Ecol. Evol. 3, 1438–1444. doi: 10.1038/s41559-019-0988-x
Matsuda, S., Huffmyer, A., Lenz, E. A., Davidson, J., Hancock, J., Przybylowski, A., et al. (2020). Coral bleaching susceptibility is predictive of subsequent mortality within but not between coral species. Front. Ecol. Evol. 8:178. doi: 10.3389/fevo.2020.00178
McCulloch, M., Falter, J., Trotter, J., and Montagna, P. (2012). Coral resilience to ocean acidification and global warming through pH up-regulation. Nat. Clim. 2, 623–627. doi: 10.1038/nclimate1473
McCulloch, M. T., D’Olivo, J. P., Falter, J., Holcomb, M., and Trotter, J. A. (2017). Coral calcification in a changing world and the interactive dynamics of pH and DIC upregulation. Nat. Commun. 8:15686. doi: 10.1038/ncomms15686
Noonan, S. H. C., Kluibenschedl, A., and Fabricius, K. E. (2018). Ocean acidification alters early successional coral reef communities and their rates of community metabolism. PLoS One 13:e0197130. doi: 10.1371/journal.pone.0197130
Packard, T. (1971). The measurement of respiratory electron-transport activity in marine phytoplankton. J. Mar. Res. 29, 235–244.
Pedersen, T. L. (2019). patchwork: The Composer of Plots. Available online at: https://CRAN.R-project.org/package=patchwork (accessed December 31, 2020).
R Core Team (2020). R: A Language and Environment for Statistical Computing. Vienna: R Foundation for Statistical Computing.
Riebesell, U., Fabry, V. J., Hansson, L., and Gattuso, J.-P. (2010). Guide to Best Practices in Ocean Acidification Research and Data Reporting, eds U. Riebesell, V. J. Fabry, L. Hansson, and J.-P. Gattuso (Luxembourg: Publications Office of the European Union).
Rodolfo-Metalpa, R., Houlbrèque, F., Tambutté, É, Boisson, F., Baggini, C., Patti, F. P., et al. (2011). Coral and mollusc resistance to ocean acidification adversely affected by warming. Nat. Clim. Chang. 1, 308–312. doi: 10.1038/nclimate1200
Stimson, J., and Kinzie, R. A. (1991). The temporal pattern and rate of release of zooxanthellae from the reef coral Pocillopora damicornis (Linnaeus) under nitrogen-enrichment and control conditions. J. Exper. Mar. Biol. Ecol. 153, 63–74. doi: 10.1016/S0022-0981(05)80006-80001
Strahl, J., Stolz, I., Uthicke, S., Vogel, N., Noonan, S. H. C., and Fabricius, K. E. (2015). Physiological and ecological performance differs in four coral taxa at a volcanic carbon dioxide seep. Compar. Biochem. Physiol. Part A 184, 179–186. doi: 10.1016/j.cbpa.2015.02.018
Tambutté, E., Allemand, D., Zoccola, D., Meibom, A., Lotto, S., Caminiti, N., et al. (2007). Observations of the tissue-skeleton interface in the scleractinian coral Stylophora pistillata. Coral Reefs 26, 517–529. doi: 10.1007/s00338-007-0263-265
Trotter, J., Montagna, P., McCulloch, M., Silenzi, S., Reynaud, S., Mortimer, G., et al. (2011). Quantifying the pH ‘vital effect’ in the temperate zooxanthellate coral Cladocora caespitosa: validation of the boron seawater pH proxy. Earth Planet. Sci. Lett. 303, 163–173. doi: 10.1016/j.epsl.2011.01.030
Uthicke, S., and Fabricius, K. E. (2012). Productivity gains do not compensate for reduced calcification under near-future ocean acidification in the photosynthetic benthic foraminifer species Marginopora vertebralis. Glob. Chang. Biol. 18, 2781–2791. doi: 10.1111/j.1365-2486.2012.02715.x
Wall, C. B., Mason, R. A. B., Ellis, W. R., Cunning, R., and Gates, R. D. (2017). Elevated pCO2 affects tissue biomass composition, but not calcification, in a reef coral under two light regimes. R. Soc. Open. Sci. 4:170683. doi: 10.1098/rsos.170683
Wickham, H. (2016). ggplot2: Elegant Graphics for Data Analysis, 2nd Edn, New York, NY: Springer-Verlag.
Wickham, H., Averick, M., Bryan, J., Chang, W., McGowan, L., François, R., et al. (2019). Welcome to the Tidyverse. J. Open Source Softw. 4:1686. doi: 10.21105/joss.01686
Witkowski, C. R., Agostini, S., Harvey, B. P., Meer, M. T. J., van der Sinninghe Damste, J. S., and Schouten, S. (2019). Validation of carbon isotope fractionation in algal lipids as a pCO2 proxy using a natural CO2 seep (Shikine Island, Japan). Biogeosci. Discuss. 16, 4451–4461. doi: 10.5194/bg-16-4451-2019
Yara, Y., Vogt, M., Fujii, M., Yamano, H., Hauri, C., Steinacher, M., et al. (2012). Ocean acidification limits temperature-induced poleward expansion of coral habitats around Japan. Biogeosci. Discuss. 9, 7165–7196. doi: 10.5194/bgd-9-7165-2012
Keywords: ocean acidification, hermatypic corals, mitochondrial electron transport activity, biomass, resistance
Citation: Agostini S, Houlbrèque F, Biscéré T, Harvey BP, Heitzman JM, Takimoto R, Yamazaki W, Milazzo M and Rodolfo-Metalpa R (2021) Greater Mitochondrial Energy Production Provides Resistance to Ocean Acidification in “Winning” Hermatypic Corals. Front. Mar. Sci. 7:600836. doi: 10.3389/fmars.2020.600836
Received: 31 August 2020; Accepted: 23 December 2020;
Published: 15 January 2021.
Edited by:
Peng Jin, University of Guangzhou, ChinaReviewed by:
Xiangcheng Yuan, South China Sea Institute of Oceanology (CAS), ChinaFiorella Prada, University of Bologna, Italy
Copyright © 2021 Agostini, Houlbrèque, Biscéré, Harvey, Heitzman, Takimoto, Yamazaki, Milazzo and Rodolfo-Metalpa. This is an open-access article distributed under the terms of the Creative Commons Attribution License (CC BY). The use, distribution or reproduction in other forums is permitted, provided the original author(s) and the copyright owner(s) are credited and that the original publication in this journal is cited, in accordance with accepted academic practice. No use, distribution or reproduction is permitted which does not comply with these terms.
*Correspondence: Sylvain Agostini, YWdvc3Rpbmkuc3lsdmFpbkBzaGltb2RhLnRzdWt1YmEuYWMuanA=