 Gordon D. Blasco1*
 Danielle M. Ferraro1,2,3,4
 Richard S. Cottrell1
 Benjamin S. Halpern1,2
 Halley E. Froehlich5,6
- 1National Center for Ecological Analysis and Synthesis, University of California, Santa Barbara, Santa Barbara, CA, United States
- 2Bren School of Environmental Science and Management, University of California, Santa Barbara, Santa Barbara, CA, United States
- 3Environmental Market Solutions Lab, University of California, Santa Barbara, Santa Barbara, CA, United States
- 4Marine Science Institute, University of California, Santa Barbara, Santa Barbara, CA, United States
- 5Ecology, Evolution, and Marine Biology, University of California, Santa Barbara, Santa Barbara, CA, United States
- 6Environmental Studies, University of California, Santa Barbara, Santa Barbara, CA, United States
Effective management of aquatic resources, wild and farmed, has implications for the livelihoods of dependent communities, food security, and ecosystem health. Good management requires information on the status of harvested species, yet many gaps remain in our understanding of these species and systems, in particular the lack of taxonomic resolution of harvested species. To assess these gaps we compared the occurrence of landed species (freshwater and marine) from the United Nations Food and Agriculture Organization (FAO) global fisheries production database to those in the International Union for Conservation of Nature (IUCN) Red List and the RAM Legacy Stock Assessment Database, some of the largest and most comprehensive global datasets of consumed aquatic species. We also quantified the level of resolution and trends in taxonomic reporting for all landed taxa in the FAO database. Of the 1,695 consumed aquatic species or groups in the FAO database considered in this analysis, a large portion (35%) are missing from both of the other two global datasets, either IUCN or RAM, used to monitor, manage, and protect aquatic resources. Only a small number of all fished taxa reported in FAO data (150 out of 1,695; 9%) have both a stock assessment in RAM and a conservation assessment in IUCN. Furthermore, 40% of wild caught landings are not reported to the species level, limiting our ability to effectively account for the environmental impacts of wild harvest. Landings of invertebrates (44%) and landings in Asia (>75%) accounted for the majority of harvest without species specific information in 2018. Assessing the overlap of species which are both farmed and fished to broadly map possible interactions – which can help or hinder wild populations - we found 296 species, accounting for 12% of total wild landings globally, and 103 countries and territories that have overlap in the species caught in the wild and produced through aquaculture. In all, our work highlights that while fisheries management is improving in many areas there remain key gaps in data resolution that are critical for fisheries assessments and conservation of aquatic systems into the future.
Introduction
Fisheries are critical for livelihoods, nutrition, and food security worldwide (Hicks et al., 2019). Marine and freshwater capture fisheries produced ca. 97 million tons (live weight) of fish and invertebrates for human consumption and indirect uses, and employed over 40 million people in 2018 (FAO, 2020a). Yet in many regions, seafood supply from wild sources is still threatened by mismanagement and overexploitation of wild populations and ecosystems (Pauly et al., 2005; Maxwell et al., 2016; Link and Watson, 2019). While the abundance of many assessed fish stocks has been increasing in the last decade, largely due to the application of effective management strategies (Hilborn et al., 2020), over a third remain overfished (FAO, 2020a). Overfishing not only influences target species but can have wider implications for ecosystem state and function through bycatch of other species, habitat destruction, and the subsequent effects on food web interactions (Davies et al., 2009; Smith et al., 2011; Mumby et al., 2012; Link and Watson, 2019). Of considerable concern is that the vast majority of stocks are not formally assessed and data on many stocks are limited, constraining our understanding of the status of wild populations harvested for food and the ecosystems that support them. As human pressures on aquatic ecosystems increase in response to rising demands for food and other resources (Halpern et al., 2019), these information gaps pose considerable blind-spots for meeting sustainability targets around food security and protecting life below water (United Nations, 2015; Roberson et al., 2020).
Fish and seafood consumption has increased faster than any other animal-sourced food over the last 60 years, and global demand is expected to increase by 18% between 2018 and 2030 as countries urbanize and consumer affluence grows (FAO, 2020a). While aquaculture will be key to meeting this demand, unassessed artisanal fisheries are still the dominant form of fish production and coastal livelihoods in many regions (e.g., West and East Africa, Southeast Asia, Pacific Islands; FAO, 2020a). Without careful accounting of the species harvested for food, overcapacity and mismanagement of aquatic resources could severely threaten food and nutrition security and exacerbate biodiversity loss in the areas most fisheries-dependent (Hicks et al., 2019; Link and Watson, 2019). Moreover, growth in the aquaculture sector highlights a need for a greater understanding of the status of wild populations. Poor planning and management practices in fish farming can lead to negative impacts on fisheries through deoxygenation, genetic introgression, disease transmission, or shifts in local food webs (Alleway et al., 2019; Barrett et al., 2019; Clavelle et al., 2019; Gentry et al., 2019; Theuerkauf et al., 2019). But aquaculture also has the capacity to augment fisheries through stock enhancement, restoration of biogenic habitat, and the replacement of wild capture seafood in some contexts (Asche et al., 2001; Froehlich et al., 2017; Alleway et al., 2019; Gentry et al., 2019; Theuerkauf et al., 2019). Understanding the complex trade-offs among sectors requires greater knowledge of their overlap and interactions (Barrett et al., 2019); a key step in that process is careful accounting of which species are both farmed and fished, and where.
The current data landscape concerning aquatic food species, their extraction, distribution, and status relies on just a handful of key datasets, each with their own strengths and limitations. The United Nations’ Food and Agricultural Organization (FAO) compiles the most complete global account of the quantity of aquatic species harvested for food by synthesizing production statistics from over 200 countries and territories, and is an invaluable resource for understanding trends in global fisheries (Garibaldi, 2012). Others have extended these data to estimate small-scale or illegal, unreported, and unregulated (IUU) fishing and have filled gaps in the FAO data where possible (Pauly and Zeller, 2016; Watson, 2017), however the FAO remains a key dataset used by a variety of stakeholders and across food sectors (Ye et al., 2017).
Data on fisheries landings, as with FAO’s data, however, are a limited proxy for population status due to uncertainty around discards, non-commercial reporting gaps, changes to fishing effort, and/or management implementation (Mutsert et al., 2008; Pauly et al., 2013). Stock assessments go further in providing biomass estimates and management reference points for exploited aquatic populations by combining catch data with indices of stock status including, but not limited to, independent surveys, fishery-dependent catch per unit effort, and age structures (Ricard et al., 2012). But such high resolution data is inherently expensive to acquire and is thus limited to stocks harvested by industrial or commercial fisheries, such as those cataloged in the RAM Legacy Stock Assessment database (Ricard et al., 2012). And while various data-limited approaches to stock assessment methods have been developed, they tend to produce imprecise and biased estimates of stock status relative to data-intensive methods (Free et al., 2020). As a result, the population status of species targeted purely by artisanal, recreational, and subsistence fisheries, which represent more than half of global fishing effort (Rousseau et al., 2019), are not included in stock assessments. Many of these harvested species may not individually represent a large portion of global aquatic food, but prioritizing good management based on fishery yields overlooks the critical role that other species play in food and nutrition security (Hicks et al., 2019).
For unassessed aquatic species harvested for food, the International Union for Conservation of Nature (IUCN) Red List database provides an important resource. The IUCN Red List does not produce limit reference points for fisheries like a stock assessment from RAM; instead the IUCN is primarily concerned with a risk-of-extinction metric deemed the “conservation status.” Conservation status classification requires detailed assessments for various threats to each species such as vulnerabilities to specific fishing gear types, aquaculture development, and habitat loss along with trends in population size (Mace et al., 2008). While the IUCN Red List does not provide an as comprehensive analysis of stock health as a stock assessment from RAM, this dataset provides an important suite of information to help guide decisions in the absence of formal assessments (Gullestad et al., 2017). Moreover, this resource is a valuable supplement to stock assessments where robust estimates of population status are restricted to the spatial contexts of an assessment region. In reality, a species can have a wide geographic range, and while populations in a given region may be well managed, the threat from fisheries exploitation may extend over large, unassessed areas.
Given the differences in species coverage and conservation metrics between these datasets, identifying gaps within and among these data, and across different regions, presents an important opportunity for prioritizing research and policy aimed at ensuring sustainable management of aquatic resources into the future. To identify key gaps in our knowledge and assessment of aquatic (freshwater, brackish, and marine) species used for food, we compare available global data for harvested species across the FAO, RAM, and IUCN Red List databases. While the fact that many fisheries remain unassessed is well known, we illustrate the current state and trajectory of the fisheries data landscape, and define taxonomic and spatial gaps in our knowledge of aquatic food species. In doing so, we hope to help prioritize future research efforts that improve our knowledge, and ultimately support better management of aquatic ecosystems.
Materials and Methods
Selection of Data Types and Target Species
We aimed to harmonize and broadly characterize the data landscape of harvested aquatic species using three of the principle global datasets which use separate criteria important for conservation and management: production, conservation status, and scientific stock assessments. We compared species representation across these datasets to quantify current data gaps, as well as highlight species and taxa with the most comprehensive coverage (those represented across the datasets). The FAO global production database is the backbone from which we define a list of unique harvested species, hereafter “target species,” which are those species that have any reporting of wild catch in any year in the FAO database. We then extracted the available data on these species from the RAM Legacy Database and the IUCN Red List. We excluded mammals and reptiles because a majority of those species are not reported in terms of biomass in the FAO, but instead as the number of individuals harvested, thus complicating analysis of their contribution to global production. Additionally, we are focused on species that contribute to nutrition in this analysis, so we also exclude species listed as ornamental species by the FAO, which includes corals, shells of molluscs, cuttle-bone, and ornamental fish and plants for display purposes.
Our analysis largely focuses on gaps in terms of the number of harvested species rather than weighting a species by its contribution to global production because of differences in the local importance of a given species for ecosystem and human health (Hicks et al., 2019). Firstly, some fish and invertebrates represent important keystones in aquatic food webs that disproportionately influence the integrity of their surrounding ecosystem and that is not reflected in catch data Anderson et al., 2011). And second, the global scale of a fishery does not reflect its nutritional value, for instance, many small-scale tropical fisheries are richer in essential micronutrients such as zinc, calcium, and iron than those of a large global production scale (Hicks et al., 2019). This focus shifts when assessing ‘Not elsewhere included’ classifications, where we analyze the biomass of these groupings rather than the number NEI classifications. See section “Analysis of Not Elsewhere Included Landings.”
Fisheries Production
Fisheries production data were sourced from the FAO global production database, which contains time series of reported freshwater and marine fishery landings and aquaculture production from 247 countries and territories for 2,416 species or taxonomic groups since 1950 (FAO, 2020b). The FAO database is heavily cited in the scientific literature and stands as the principal dataset of global seafood production (Garibaldi, 2012). The data collection relies on voluntary submission from national correspondents asking for the “best scientific estimate” of their annual landings. While the FAO has a thorough data validation process that includes following up with the reporting correspondents for clarification and rejecting and flagging questionable estimates, the FAO has always recognized that their database does not include all fish removals and there are still uncertainties in the reported numbers (Ye et al., 2017). Not all landings are reported to the species level and are instead designated as “Not elsewhere included” (NEI) observations with various levels of specificity, ranging from order, family, genus, or mixed species. NEI groups represent landings that are not taxonomically resolved and they introduce another level of uncertainty to the data, which we highlight here.
For this analysis, we extracted uniquely reported landed species or taxonomic groups from the 2,416 listed in the FAO, aside from those we excluded a priori (mammals, reptiles, and species harvested for ornamental purposes), to generate the list of target species (n = 2,077) that we collected conservation status and stock assessment data on. These target species include NEI groupings as well as individual species.
In order to approximate the extent to which captured species overlap with farmed species at a global level, we evaluated the presence of aquaculture for each target species. Each target species was classified as being produced by aquaculture or not by assessing if it had at least 1 year of aquaculture production recorded in the FAO database, regardless of producing country. For each country, we identified the number of species with any amount of both capture and aquaculture production reported in 2018. Additionally, we evaluated the number of countries per year since 1950 that reported at least one species both produced by aquaculture and captured in the wild.
Conservation Status
To represent the conservation status of target species, we used the IUCN Red List (IUCN, 2020). The Red List provides detailed reports on the conservation status of more than 120,000 species and assigns a global extinction threat score on a seven-point scale from “least concern” to “extinct” using a robust and consistent framework (Mace et al., 2008). The IUCN assesses species against a set of criteria based on the size and decline rate of the population and home range in order to determine its conservation status. Once a species is assessed on a global level, the IUCN then accepts assessments for subspecies and geographically distinct populations, allowing the database to be leveraged for both global trends and local scale analysis, which in turn can be used to inform nuanced fisheries management plans (Gullestad et al., 2017). Although there have been comments on how to improve the assessment methodology (Hayward et al., 2015), the Red List remains a powerful tool for reporting trends in biodiversity, including those that are harvested. For this analysis we extracted the conservation status for the marine (n = 1,571) and freshwater (n = 293) species designated as target species from the FAO landings database.
Stock Assessment
The last dataset we included was the RAM Legacy Stock Assessment Database, the largest global collection of scientific stock assessments (Ricard et al., 2012; RAM Legacy Stock Assessment Database, 2018). These assessments are conducted on a specific geographic and/or genetically distinct population of a species designated as (or part of) a “stock.” A stock assessment is a data intensive method for determining the status of a fishery or fisheries. At minimum, these assessments require data describing an index of abundance, such as catch-per-unit-effort (Hilborn and Ovando, 2014). These outputs allow a comparison to the current stock size (i.e., biomass) or fishing effort in relation to various reference points (e.g., maximum sustainable yield, spawning stock biomass), used for setting management reference points for fisheries managers to work toward and ideally sustain.
The RAM database compiles data from stock assessments of 882 stocks across 360 unique species and has been widely leveraged to evaluate global fisheries’ status and stock improvements over time and space (e.g., Worm et al., 2009; Costello et al., 2012; Hilborn and Ovando, 2014). As noted above, stock assessments are an important tool in fisheries management but can be resource intensive, and as such are typically biased toward high-value, highly landed stocks in developed regions (Neubauer et al., 2018). Despite these drawbacks, there continue to be improvements in spatial and species coverage (Hilborn et al., 2020). For this analysis we considered a species represented in the RAM database if it was listed in RAM’s metadata table, regardless of the year of assessment, assessment type, or number of stocks assessed. We take this conservative approach in order to highlight species that are fully excluded from the database. Of note, 14 multispecies stocks did not have explicit species listed (e.g., Penaeus spp.) and were not included in this analysis.
Taxonomic Alignment
We joined the databases at the species level in order to quantify species coverage and relative taxonomic distribution across the datasets. Discrepancies in the scientific name for a given species may result from differences in data entry across databases, as well as revisions to species classifications that emerge as the field of taxonomy continues to evolve. In order to best match species names among the datasets FishBase (Froese and Pauly, 2000), SeaLifeBase (Palomares and Pauly, 2020), and the World Register of Marine Species (WoRMS Editorial Board, 2020) were used to update synonyms and deprecated names across the three datasets. Because the fishery datasets are built for different purposes, they operate on different spatial resolutions. Landings in the FAO database are attributed to the country reporting the catch of a specific species in large marine regions (i.e., FAO regions), while stock assessments in the RAM database are attributed to area-specific stocks. Importantly, not all stocks of a given species will be assessed. However, if at least one stock of a given species has a stock assessment, we identified the species as represented in the RAM database. In contrast, the conservation status reports of species in the IUCN Red List are generated primarily at the global scale but also less frequently at the population scale. We used the presence of a global assessment, excluding 151 species categorized as “data deficient,” as the criterion for considering a species covered in the IUCN Red List.
Analysis of Database Representation
In order to reconcile these databases in the interest of species coverage, we did not consider the spatial occurrence of a species within each dataset but rather relied on the binary evaluation of presence or absence of any data describing a species in a dataset. In other words, a species is considered better understood if any information is available in the datasets, but does not mean all stocks of that species are accounted for. Therefore, in cases where only a subset of a species fisheries have been assessed in RAM we will be overestimating the assessed biomass coverage of the dataset, this is not so for the IUCN where assessments used in this analysis are based on the status of the global population. We applied this conservative approach to coverage in order to highlight species with zero or incomplete coverage in the databases.
We compared the number of target species from each major taxonomic group (pisces, aquatic invertebrates, molluscs, crustaceans, and aquatic plants) represented by each dataset to highlight gaps in coverage across taxa. While the target list of species was the primary baseline for comparisons of species coverage across databases, we also identified species with stock assessments in RAM that were not listed as captured species in the FAO database. These discrepancies, though few, represent how differences in taxonomic reporting between the databases can contribute to the data landscape gaps described here. We also report the subset of target species that are the most represented, i.e., have both a stock assessment in the RAM database and an entry in the IUCN Red List. In order to better understand the role these species play in food systems, we calculated the proportion of total global landings these species represent. We took a conservative approach where if a species was classified as included in a dataset, based on the criteria laid out above, then we attributed all landed tonnage recorded in 2018, the most recent year published in the FAO, of that species to the datasets that it appears in. Finally, we report the number of target species also produced by aquaculture.
Analysis of Not Elsewhere Included Landings
In order to determine the taxonomic resolution of each of the 2,077 species codes in the FAO fisheries production database considered in this analysis, we first classified each code as either a species level observation or an NEI. This was done by testing if the reported scientific name followed classic binomial nomenclature rules (genus species). Species codes that only reported a higher level taxonomic group (e.g., family or class), or a genus followed by “spp.” were classified as NEI. Additionally, species codes that were composed of more than one explicit species (e.g., Auxis thazard/Auxis rochei for the bullet tunas) were designated as “mixed species” NEI. Next we determined the taxonomic resolution of each NEI observation. To do this we searched for defined text patterns in the reported name of each observation in order to classify the reported name as a genus, family, class, order, or mixed species, e.g., any name ending in “dae” was classified as a family, and any name ending with “spp.” was classified as a genus. The classifications were verified with the Aquatic Sciences and Fisheries Information System List of Species for Fisheries Statistics Purposes (FAO, 2020b).
After defining the classifications of NEIs and the respective taxonomic resolution of those observations, we looked at the trends over time and space for freshwater and marine systems, as identified by FAO. In order to determine the trends in the proportion of total landings categorized as NEI globally and the median of all countries’ proportions over time, we fit a linear model (proportion ∼ year) for the proportion of NEI landings by year. To test if NEIs in one sector were indicative of the quality of reporting in another, we also assessed the correlation between freshwater and marine NEIs and wild capture and aquaculture NEIs per country using Pearson’s correlation coefficient (r). Finally, we compared the NEI reporting across taxonomic groups for the total percentage of reported NEI biomass per major group, as well as the taxonomic specificity of each of the NEIs.
We assess the biomass represented in NEI classifications rather than the number of NEI classifications for two reasons. Firstly, because NEI data are often at very different taxonomic resolutions (as narrow as mixed species and as broad as subphlya), each NEI group can hold a very different level of information on species richness, with highly uncertain implications for biodiversity or food security. And secondly, the number of NEI classifications can be misleading when assessed on temporal scales. For instance, the taxonomic resolution of nei classifications for any given country could plausibly degrade from, for example, the genus level with a handful of closely related species being lumped into one group, to data resolved to order or subphylum that could contain hundreds more species and considerably more biomass, while being represented as a single NEI group. For these reasons we assess the amount of biomass categorized as NEI then assess the level of taxonomic specificity of those reports.
For all data synthesis and analysis, we used R version 3.6.3 (R Core Team, 2020) with the tidyverse collection of packages (Wickham et al., 2019). The RAM database version 4.44 was accessed via the ramlegacy R package (RAM Legacy Stock Assessment Database, 2018), and the IUCN Red List version 2020-2 was accessed via the rredlist R package (Chamberlain, 2020). The taxize and rfishbase R packages were used for taxonomic validation (Boettiger et al., 2012; Chamberlain and Szocs, 2013).
Results
Species Representation Across Datasets
The quantity and types of species covered by FAO, RAM, and IUCN differ substantially (Figure 1). FAO reports 1,695 explicit species (i.e., non-NEI groupings), which account for 60% of wild capture landings in 2018 (57 million tonnes). The IUCN Red List covers 955 of the target species, which account for 40% of 2018 landings (39 million tonnes). The RAM database covers 289 of the target species considered in this analysis, which account for 42% of 2018 landings (41 million tonnes). However, because 40% of the tonnage in the FAO database is not resolved to the species level (Figure 1B), there is uncertainty around what percentage of landed biomass can truly be attributed to each species. The Red List covers more fished species in each of the major groups than RAM does, although some of these are taxonomic groups that are not covered by RAM in general, such as aquatic plants.
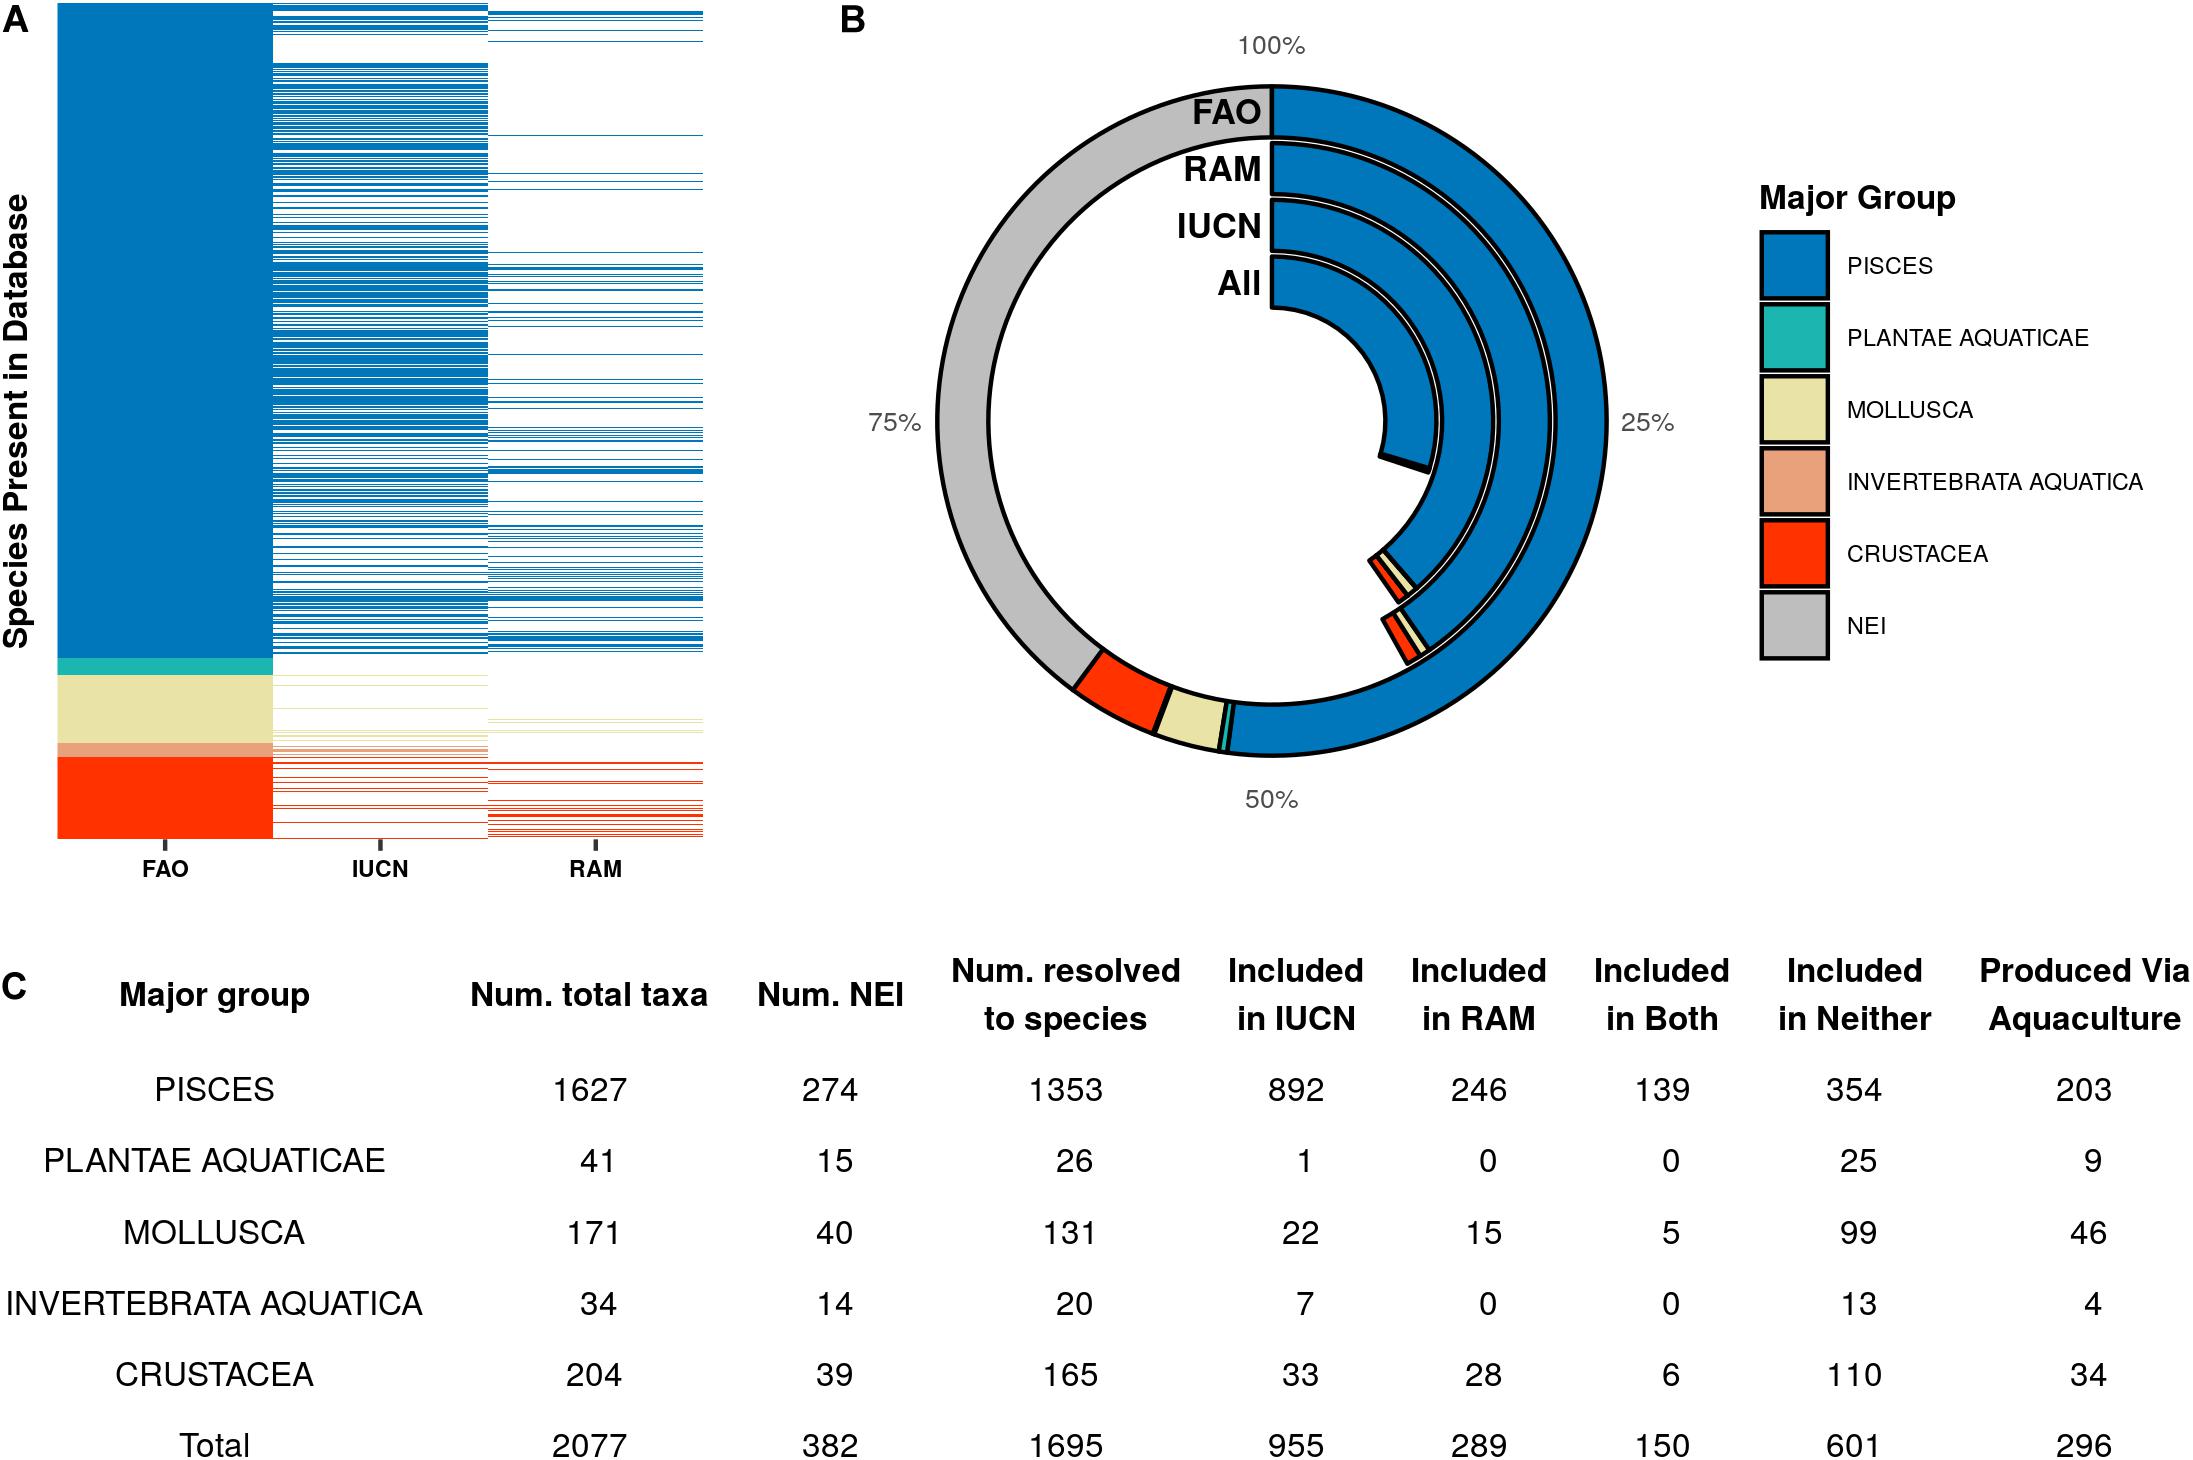
Figure 1. (A) Composition of the FAO target species across major taxonomic groups and the presence or absence of those species in the IUCN Red List and RAM Legacy Stock Assessment databases. (B) Comparison of the landed biomass per major taxonomic group accounted for by the species or groups included in each database. (C) The number of total species or groups, taxa not elsewhere included (NEI), and fully resolved species in the list of FAO target species per major group, as well as the number included in the IUCN Red List and RAM databases, and the number produced by aquaculture.
When looking across data sets for highly represented species, we found 150 target species that have a conservation status record in the IUCN Red List and at least one stock assessment in the RAM database (Figure 1C and Supplementary Table 1). These species only account for 9% of the explicit species in the target list, yet make up 30% of total capture production in 2018 (29 million tonnes). The majority of these species are finfish (n = 139), with sharks, rays, and chimeras being the most represented of the fish group (n = 32). The remaining non-fish species are lobsters (n = 6) and squids and octopuses (n = 5). All other exploited species have either only a scientific assessment in RAM (n = 136), only a conservation status on the IUCN Red List (n = 805), or neither (n = 601) (Figure 1A). The 601 species that appear neither in the IUCN Red List nor the RAM Legacy database make up 35% of unique species harvested from wild systems recorded by the FAO, and made up 8% of landed tonnage in 2018. However, this percentage changes considerably when looking within different taxonomic groups. Most target aquatic plant species (96%) have no representation in either RAM or IUCN, neither do mollusc species (76%) or crustacea (67%), while only 26% of fish species considered in this analysis are unassessed by either database.
Stock assessments are typically conducted on caught species of high volume or value; however, 49 explicit species with stock assessments recorded in the RAM database were notably absent from the list of target species, as well as six species which were reported in the FAO database as produced by aquaculture only, despite having stock assessments which by definition categorize them as caught species (Supplementary Table 2). These species not having any landings records in the FAO could be for two reasons; either the species names used by RAM and FAO were not recognized as valid synonyms of each other in either Fishbase, Sealifebase, or the World Register of Marine Organisms, or landings of these species were never recorded to the species level inside of FAO and instead were lumped into an NEI grouping.
Of the target species, 296 were recorded as produced via aquaculture at some point over the time series. Capture of these species accounted for 12% (12 million tons) of the total wild landings in 2018, while that same year farming of these species accounted for 56% (64 million tons) of the total aquaculture production. Of the species farmed, 55% (n = 164) have their wild counterparts represented in the IUCN Red List, most being fish (n = 150), followed by crustaceans (n = 8). Only 16% (n = 47) of these species’ wild counterparts are represented in RAM, the majority being fish (n = 36), followed by molluscs (n = 4). In order to track possible interactions between wild and farmed species, we report the number of countries that are fishing and farming the same species over time. In 1950 only 27 countries were farming at least one of the species they reported as also captured in the wild, and by 2018 that number rose to 103 countries (Figure 2A). In 2018, Taiwan reported tonnage for 32 species that were produced both via aquaculture and from wild capture methods, the most of any other country (Figure 2B). Other countries or regions with relatively high numbers of both captured and farmed species include Southeast Asia, Europe, Russia, and the United States; the majority of countries in Africa are notable for their lack of any species with both farmed and caught production. However, because 32% of aquaculture production was reported as an NEI group in 2018, the true number of species that are de facto farmed is unknown with the current level of data resolution recorded in the FAO database.
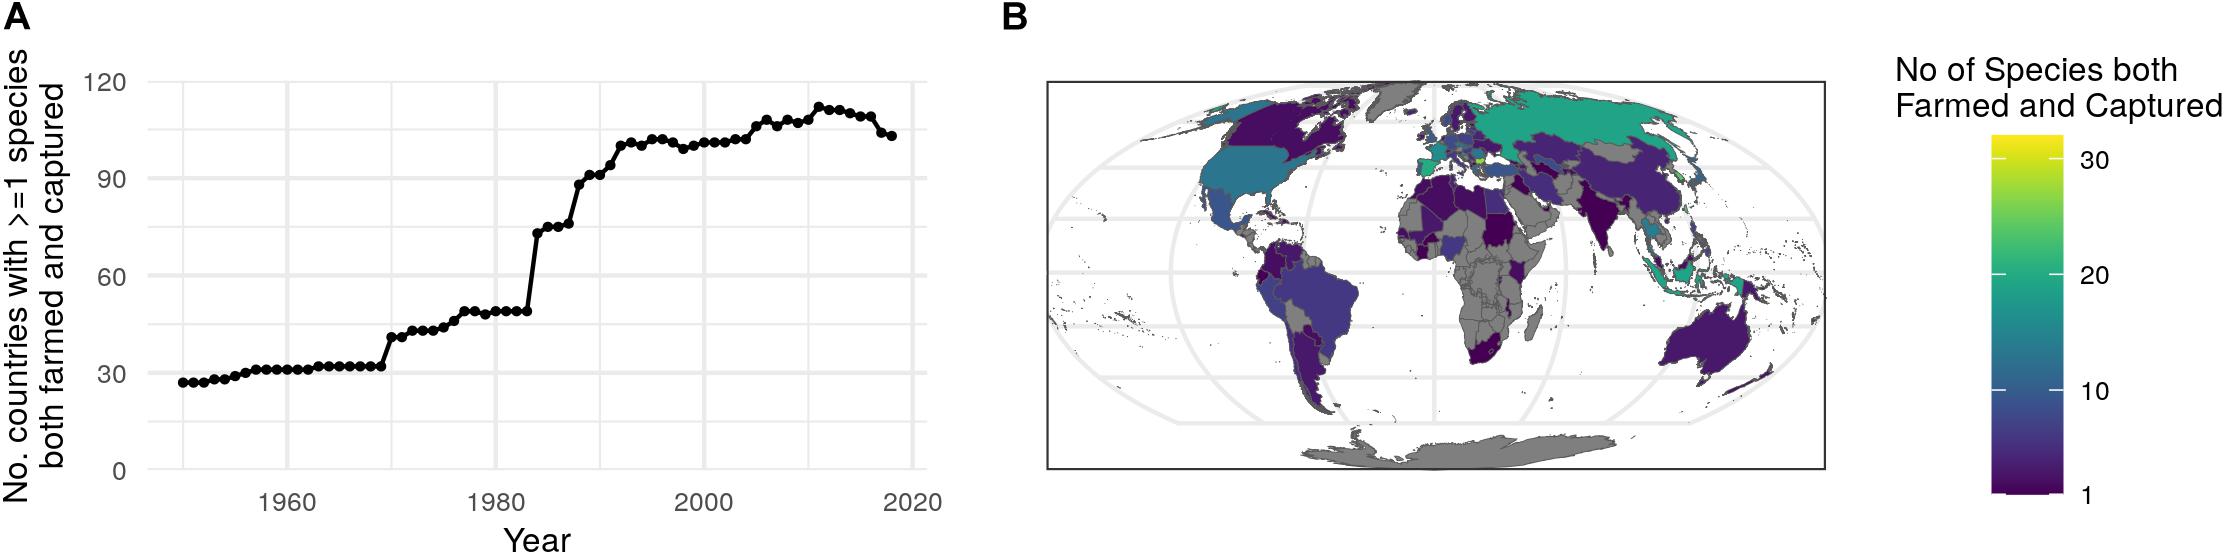
Figure 2. Countries with overlap in aquatic species harvested through wild capture and aquaculture. (A) The number of countries that farm the same species they are catching in the wild over time. (B) Number of species both farmed and captured in the wild in 2018.
Not Elsewhere Included
NEI catch accounts for over a third (35%) of the cumulative fished tonnage (4.8 billion tons) of target species since the earliest reported year (c. 1950) in the FAO production database, and has been present to some degree in every year of the time series. In 2018, 40% of total landed tonnage globally was categorized as NEI (Figure 3A). There has been an increase of approximately 10% (SD = 0.04) in the percentage of total annual landings reported as NEI over the last 70 years [F(1, 67) = 125, p < 2.2e-16, R2adj = 0.65]. While the percentage of NEI landings are increasing at a global scale, the median percentage of national catch classified as NEI for all reporting countries has decreased by more than half from 93% of annual landings in 1950 to 40% in 2018 at a rate of −0.8% (SD = 17.3) per year [F(1, 67) = 1,342, p < 2.2e-16, R2adj = 0.95; Figure 3B]. Across the entire time series, countries in Asia account for more than 50% of all annual global NEI landings, and upwards of 75% starting in 2000. Countries in Africa, the Americas, Europe, and Oceania collectively remained below 25% after 2000 (Figure 3C).
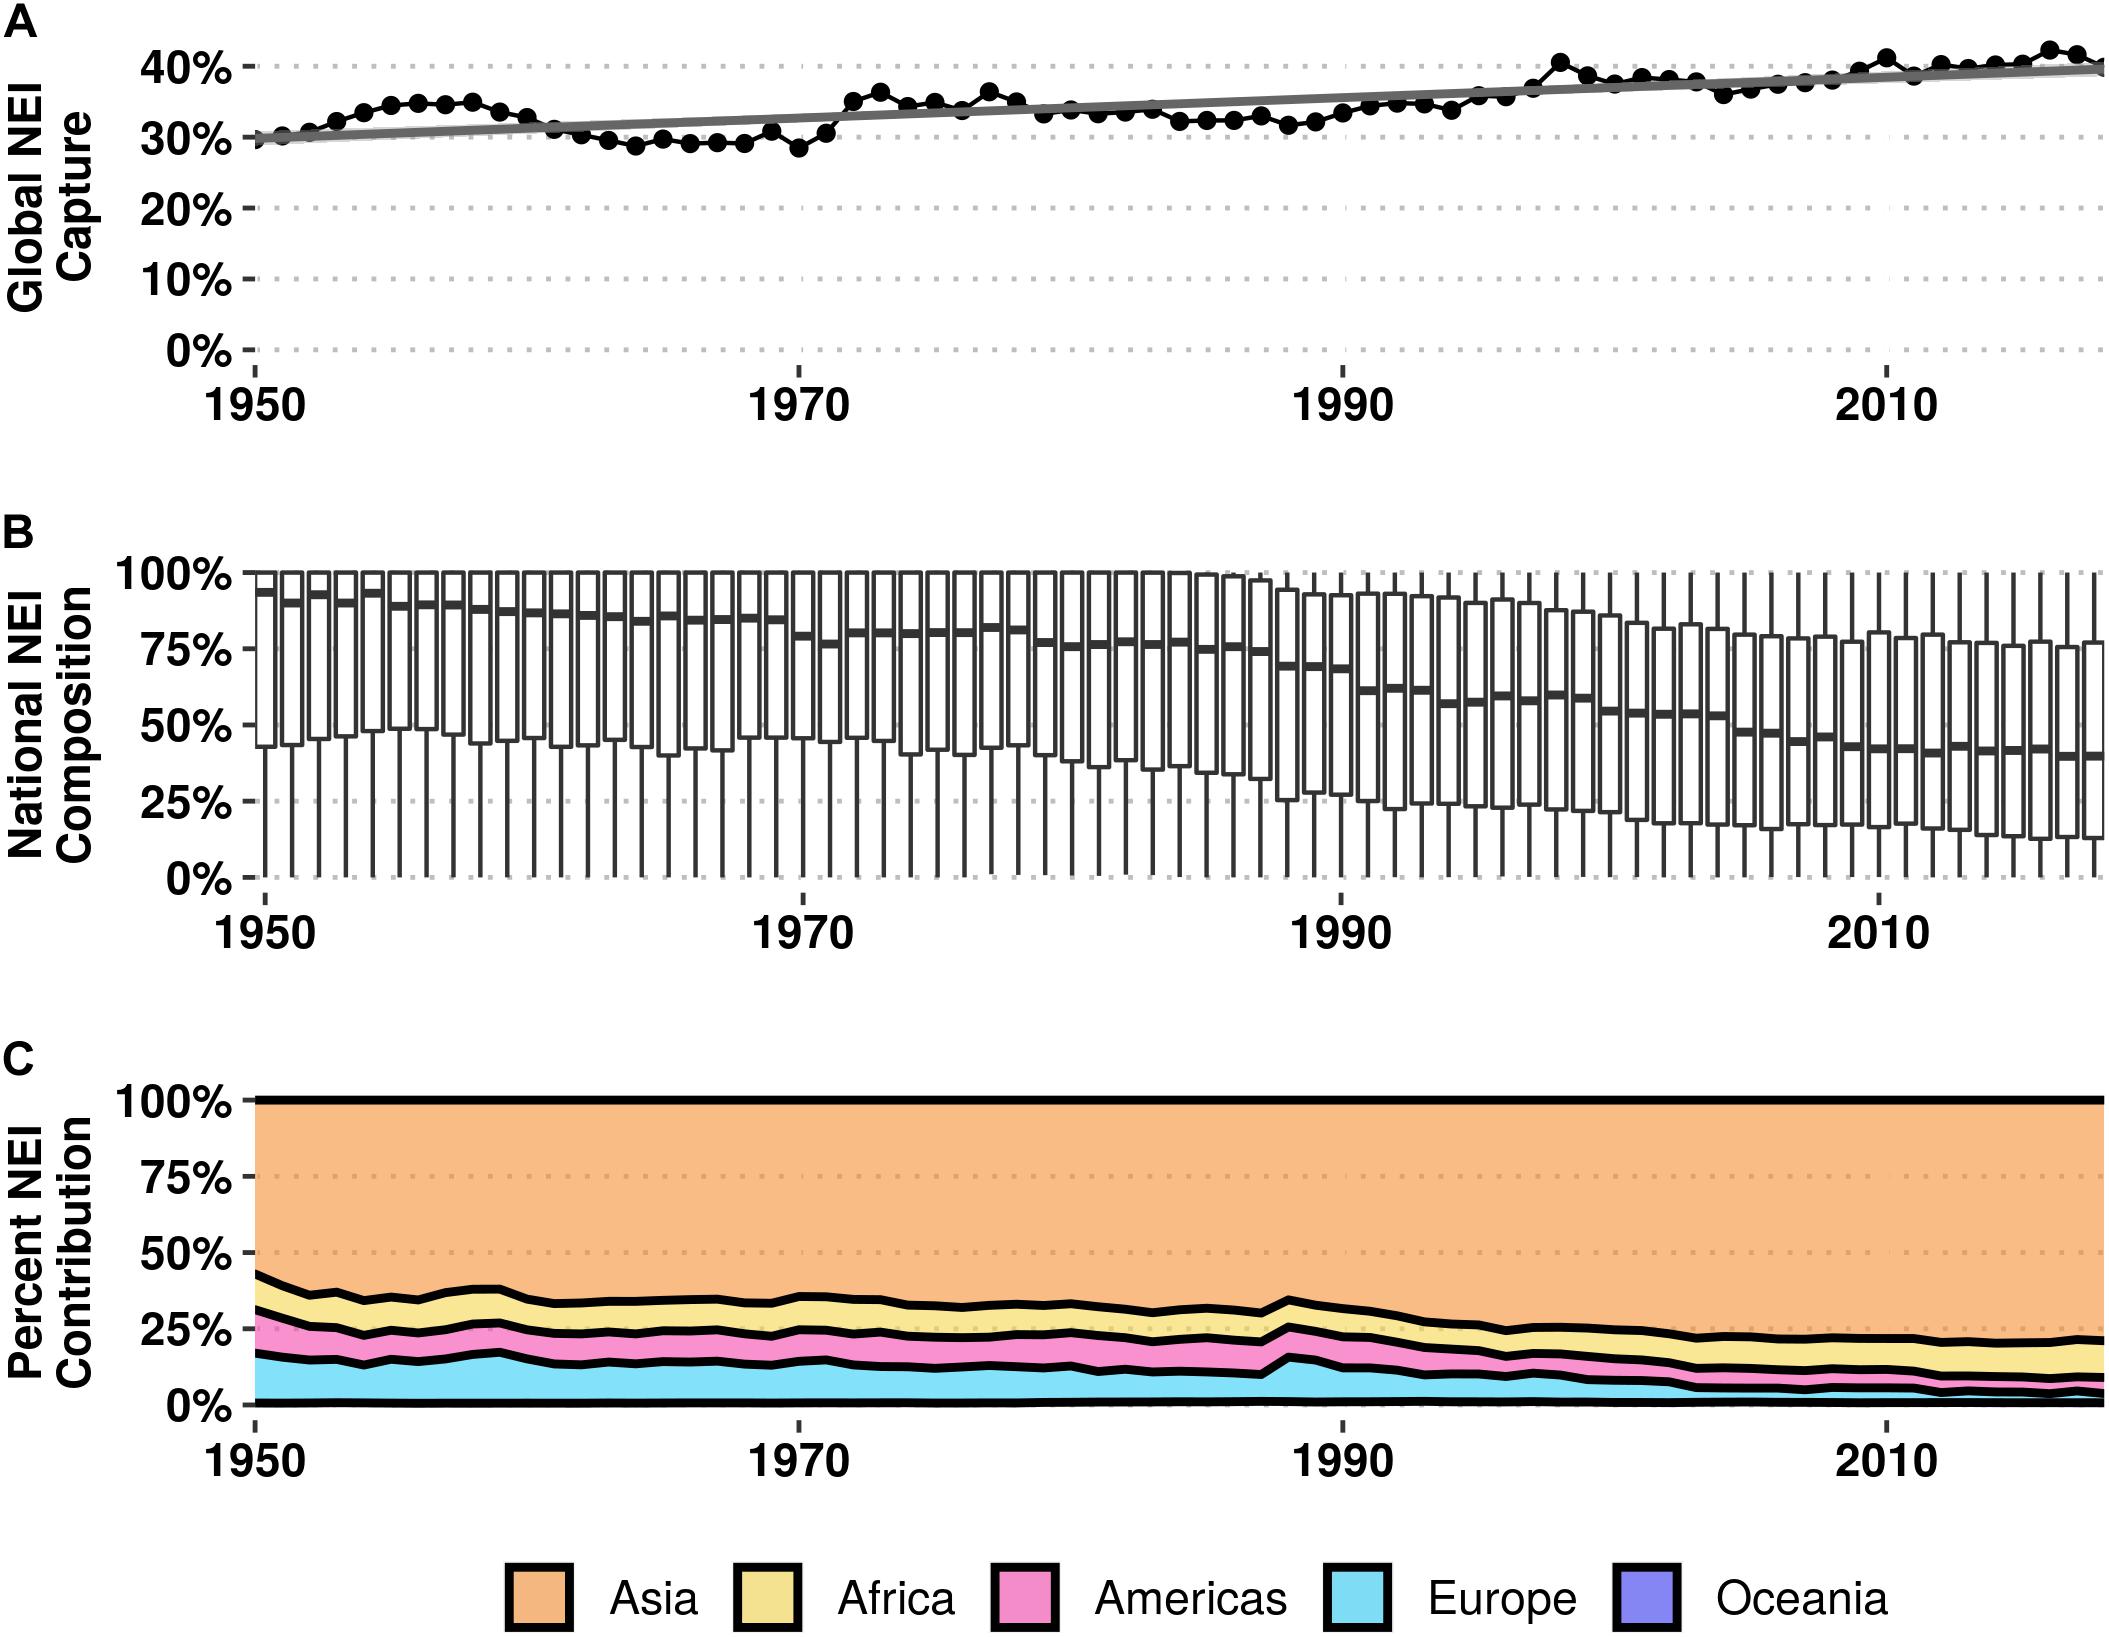
Figure 3. (A) Percentage of global capture landings categorized as not elsewhere included (NEI) from 1950 to 2018; line represents linear regression. (B) Percentage of NEI landings at the national level for 247 countries and territories from 1950 to 2018. (C) Percentage of global NEI landings contributed by geographic region; Oceania contributed < 1% of global NEI landings throughout the entire time series.
Countries with high NEI tonnage in one sector (i.e., marine, freshwater, aquaculture) trend toward reporting higher NEI in other sectors as well (Figure 4). Countries with high levels of marine NEI landings in 2018 tend to also have a high level of freshwater NEI landings (r = 0.70, 95% CI = 0.60–0.78, p < 2.2e-16). And while globally the percentage of aquaculture production reported as NEI (35%) is lower than that of capture landings (40%), countries that have high levels of capture NEI production in 2018 also have high levels of aquaculture NEI production (r = 0.88, CI = 0.83–0.91, p < 2.2e-16).
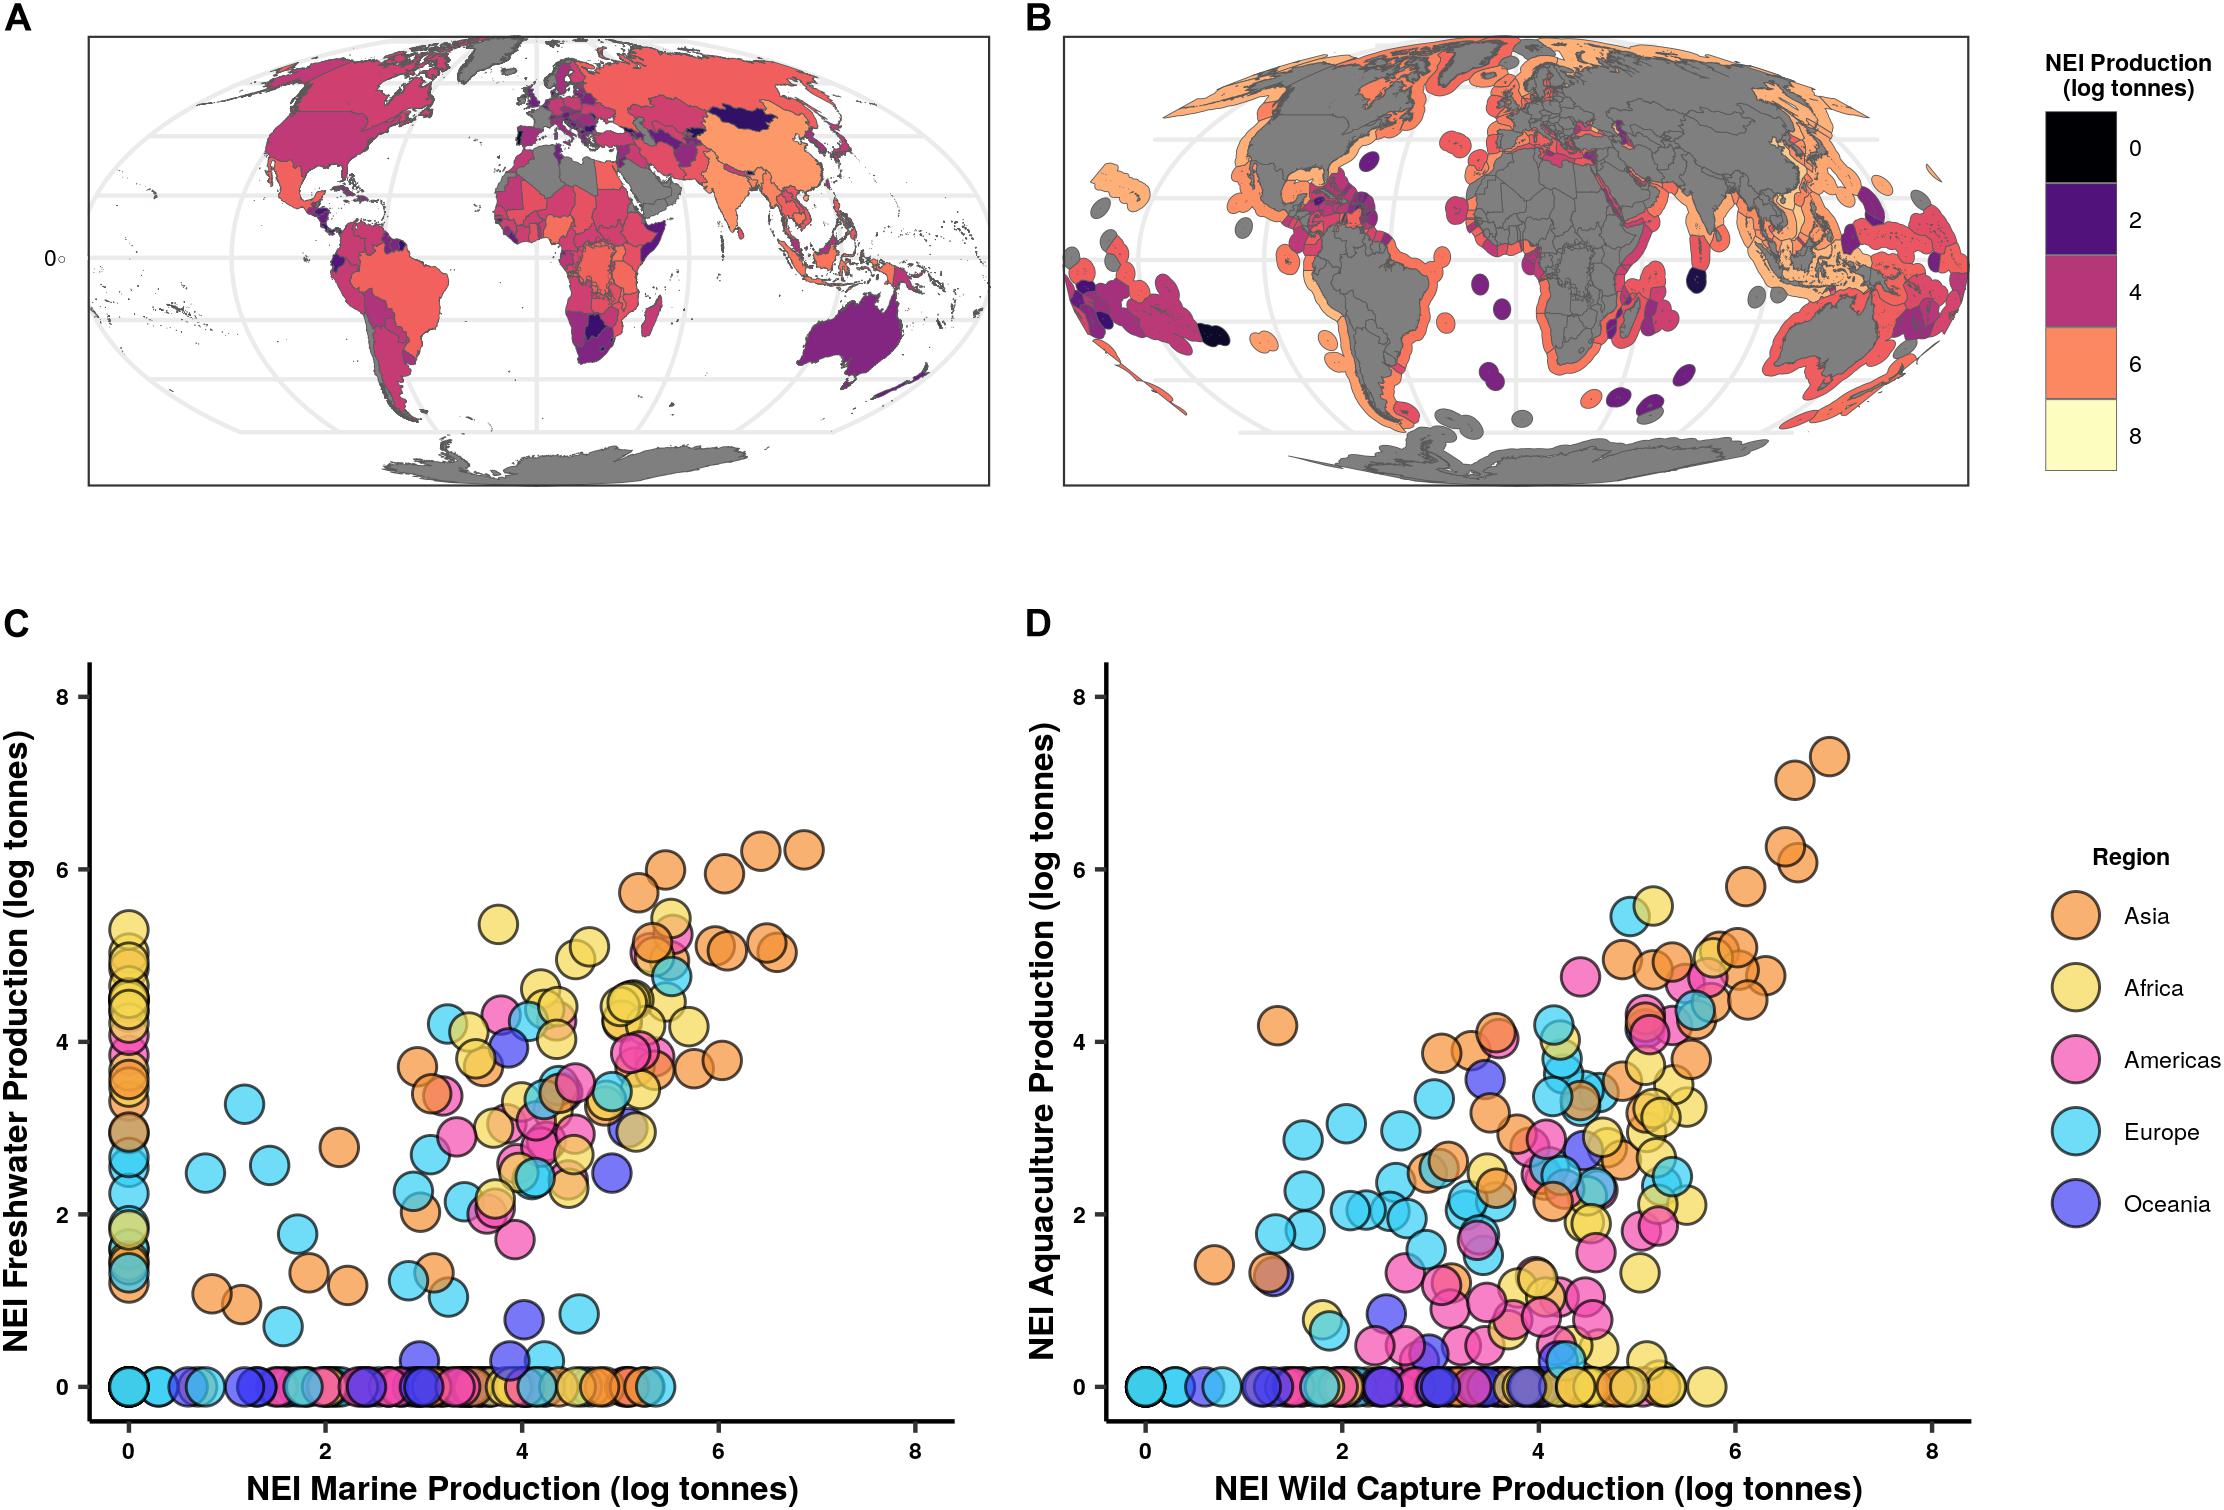
Figure 4. Production designated as not elsewhere included (NEI) by country and sector (A) Total national wild capture NEI freshwater production. (B) Total national wild capture NEI marine production. (C) National freshwater NEI production against marine NEI production. (D) National aquaculture NEI production against wild capture NEI production. Production in all plots is log10 scaled and represents 2018 values.
Of all NEI tonnage landed in 2018, 47% was reported at the major group level, the least taxonomically resolved, while 2% was reported at the mixed species level, the most resolved (Figure 5). The majority of the remaining NEI production was reported at the genus (24%), family (18%), and order (9%) levels. However, there are differences in the resolution of the reporting between the major taxonomic groups. Notably, invertebrates (excluding molluscs and crustaceans) are the group with the largest amount of reported NEI production, with 88% of landings in 2018 not reported at the species level. Within the NEI production of each major taxonomic group, the resolution of the NEI landings can differ greatly; the majority of fish NEI landings are resolved to major group, the least taxonomically resolved level (52%), while the majority of non-mollusc and non-crustacean invertebrates (included in the major group of invertebrata aquatica) NEI landings are resolved to the finer scale genus level (60%).
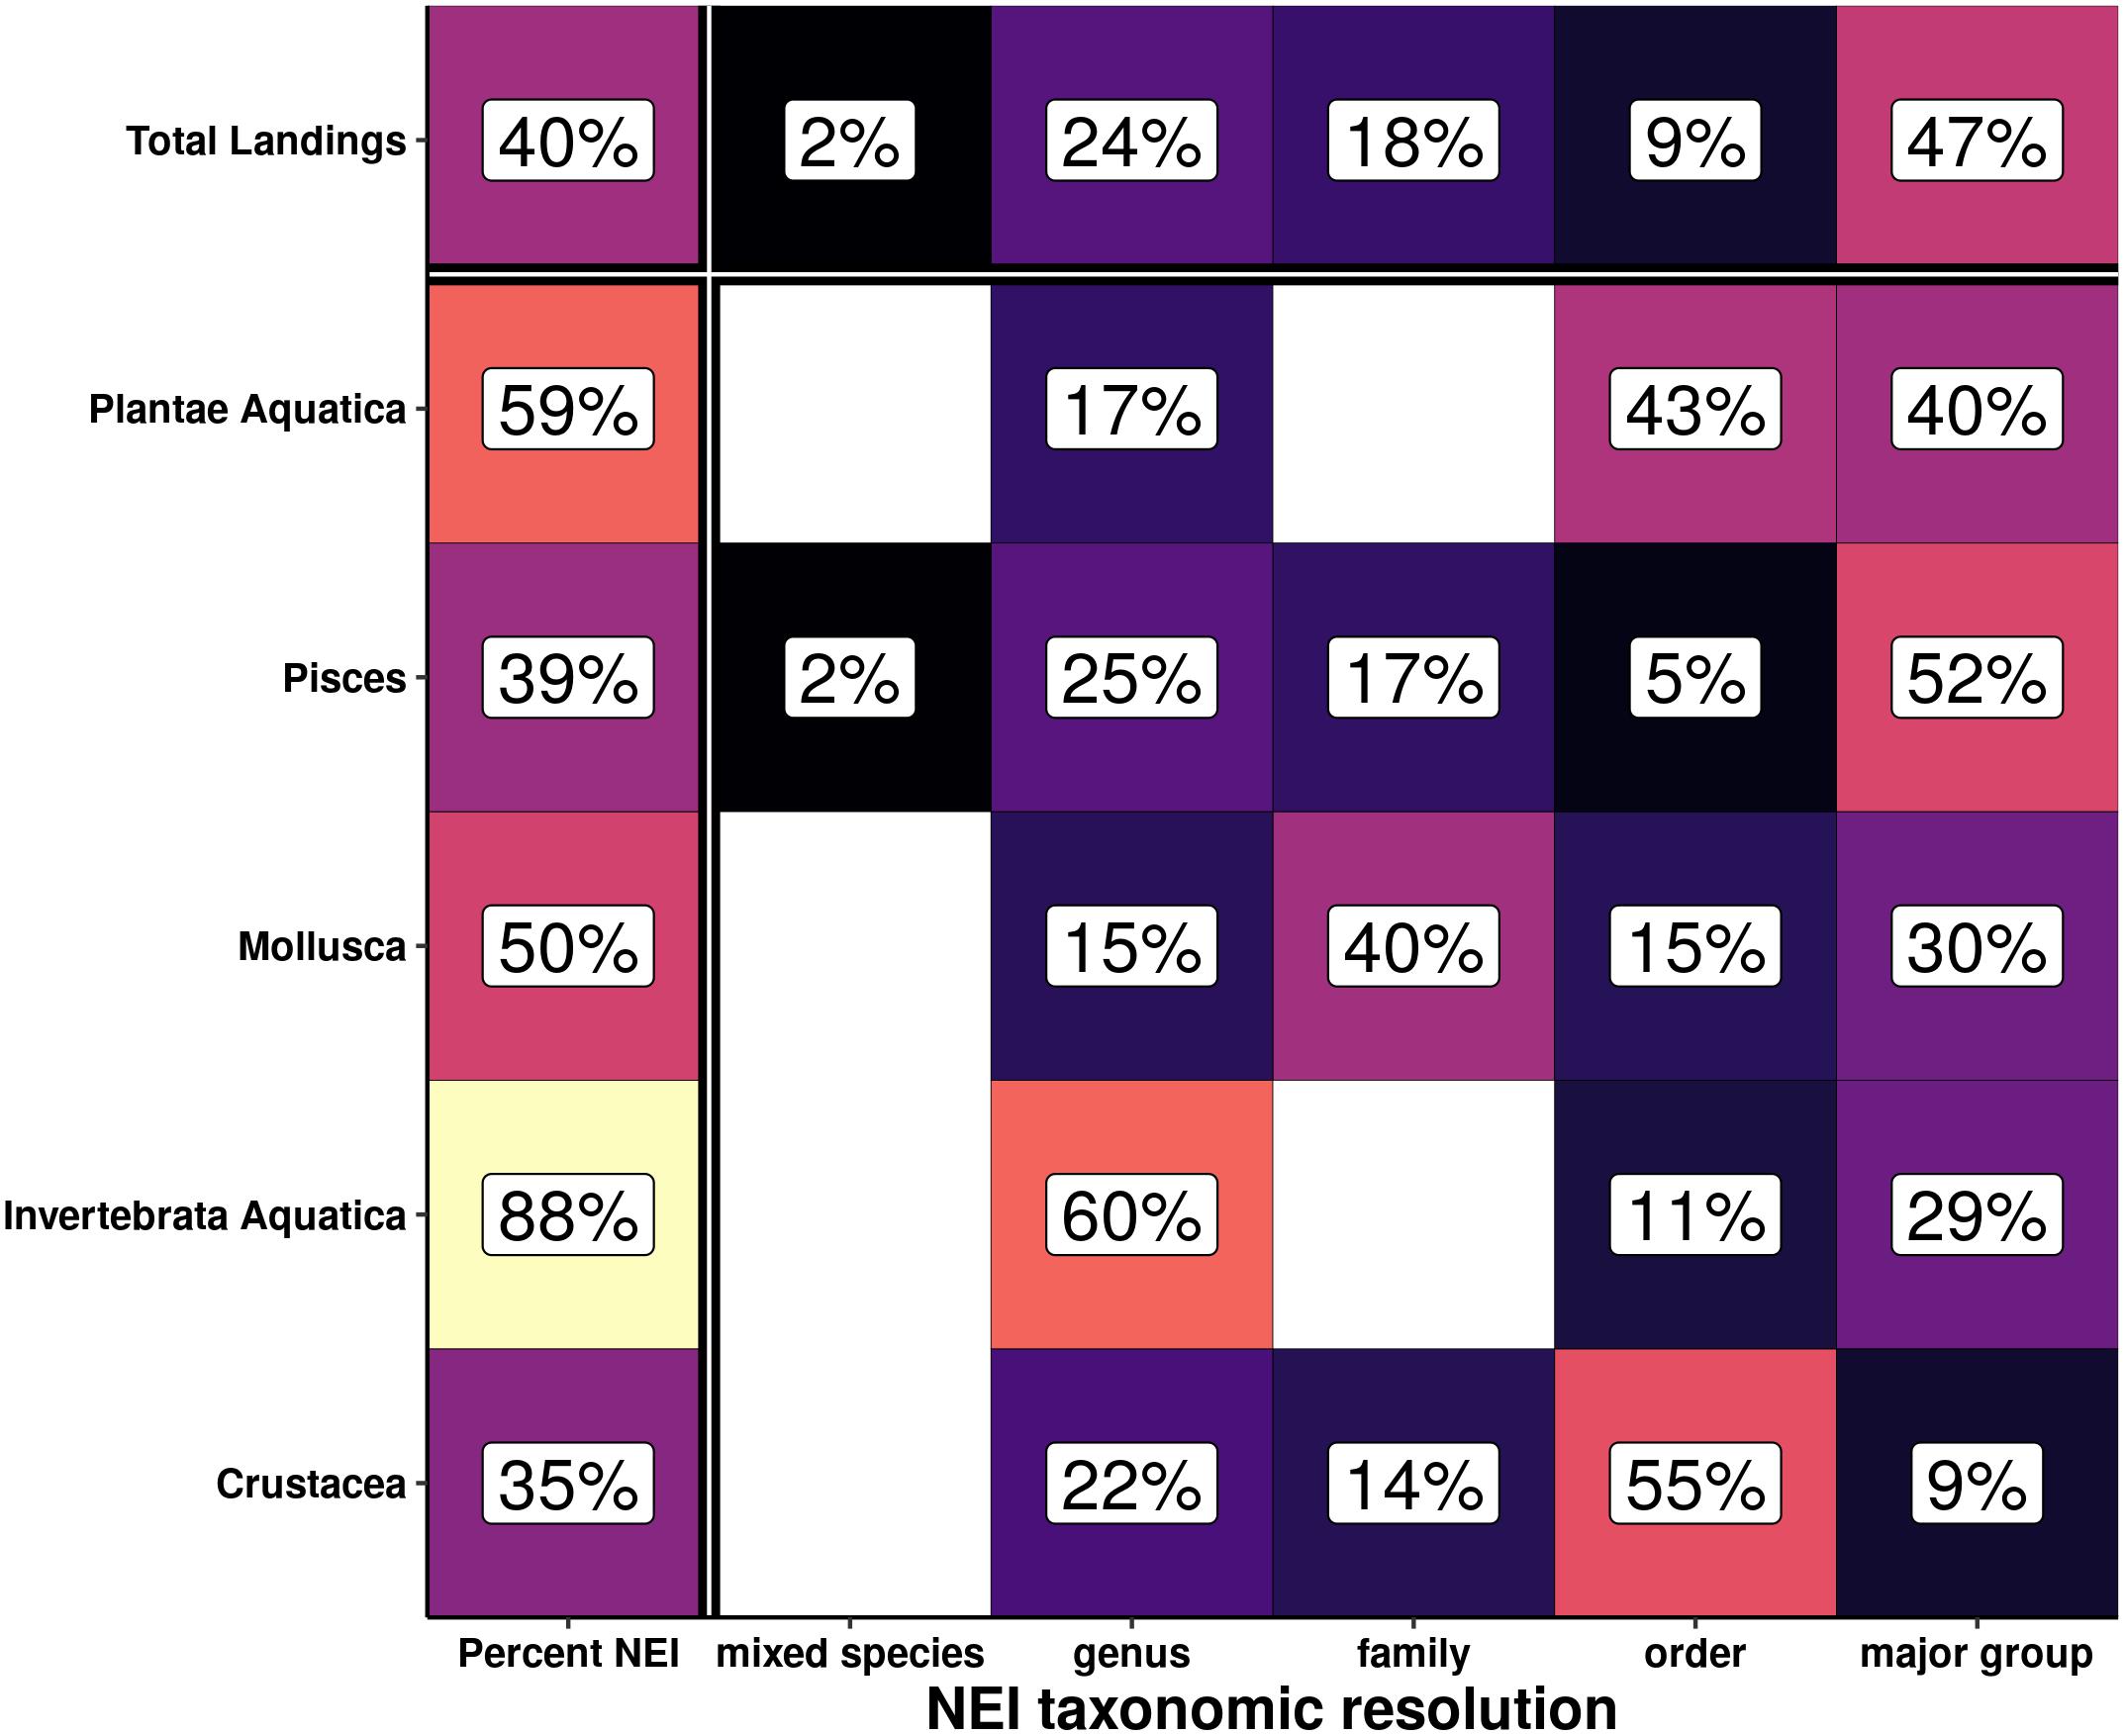
Figure 5. Percentage of not elsewhere included (NEI) capture fisheries landings and the highest level of resolution for the different major groups. Column 1 shows the percentages of all landings and landings per major group that are categorized as NEI. Row 1 shows the percentages of all NEI landings identified to each taxonomic level. The remainder of the boxes show the percentage of NEI landings of the associated major group that are identified to each taxonomic level.
Discussion
A substantial proportion of aquatic species we harvest for food worldwide is not evaluated in terms of their conservation status or through formal stock assessments. Of the 1,695 explicitly identified species reported to the FAO as wild-caught, 601 (35%) of them are not represented by either RAM or IUCN. Furthermore, 40% of wild landings reported to the FAO are not identified to the species level but are aggregated to groups of various taxonomic resolutions ranging from mixed species up to categories as broad as “Pisces.” While species absent from the RAM and IUCN databases comprise a smaller proportion of reported fisheries tonnage, due to regional differences in reporting and regulatory practices, discards, and illegal fishing activity, these figures are unlikely to be representative of the fishing pressure exerted on associated populations. Moreover, proportional representation within fisheries production data does little to fully capture a species’ sensitivity to fishing, particularly where production is reported in groups that may conceal important interspecific differences. Without greater understanding of which species are specifically influenced by fishing, these gaps in data coverage hinder our understanding of the broader impacts of aquatic food production.
Coverage differs among taxonomic groups but invertebrates constitute the largest foundational knowledge gap in fisheries data. Of the non-fish species, 44% are not identified to the species level even when landed. Molluscs are particularly poorly represented; over 40% of global landings are resolved only to family level or broader, and only 12% of the species explicitly identified in landings have data assessments in either RAM and IUCN databases. Given the growing proportion of global landings invertebrates represent, and their importance for human livelihoods, and ecosystem function, these are concerning voids in our knowledge of aquatic foods (Berkes et al., 2006; Anderson et al., 2011; Eddy et al., 2015; Miller et al., 2017). Historic overharvesting of oysters in Chesapeake Bay contributed to increased eutrophication and hypoxia (i.e., low dissolved oxygen), leading to declines in other local fisheries and wildlife (e.g., rays, sharks, river otters) (Jackson, 2001; Randall, 2003), providing a stark example of how overexploitation of important invertebrates can influence the wider ecosystem function and diversity. Looking forward, this knowledge gap is of considerable concern given the trajectory of increasing invertebrate fisheries combined with a greater vulnerability of many calcareous species to ocean acidification occurring under climate change (Marshall et al., 2017; Miller et al., 2017).
Although commercially exploited finfish species are a more widely harvested and well-studied group, there also remain considerable data gaps in our knowledge of these species and their population status. Three-quarters (74%) of finfish species reported in landings to the FAO are missing from either the RAM or IUCN datasets, 26% are missing from both, leaving these species partially or completely unassessed in two of the principle datasets used to manage and monitor our aquatic resources. Notably, one fifth of global finfish landings reported to the FAO are resolved only to broad groupings (e.g., “marine fishes nei,” “freshwater fishes nei,” “Pelagic fishes nei”), which makes it impossible to understand their representation among other data sets and thus the sustainability of their harvest. Although NEI classification is a decreasing proportion of domestic landings for most countries, the global increase in NEI resolved production, driven by landings in Asia and to a lesser extent Africa, is somewhat troubling. Diversification of catch into lesser known species can be an indication of expanding fishing pressure down, up, or across food webs in response to fully exploited or even dwindling resources in more traditionally- or economically preferred stocks (Shen and Heino, 2014; Branch, 2015). With population and fish-dependency set to grow considerably in many tropical Asian and African regions (FAO, 2020a), finding ways to address or account for these resource data gaps is necessary to better manage and support the associated fisheries and livelihoods.
Addressing gaps in harvest and conservation-relevant data is a significant challenge and thus requires a suite of broad and bold tactics at multiple governance scales. Increased support for maintaining and building capacity of existing organizations, such as the FAO, their networks and infrastructure is of critical importance, yet often overlooked and underfunded (Halpern et al., 2019). In doing so, greater harmonization across existing resources becomes of greater possibility. For instance, our analysis identified 55 species with stock assessments represented within the RAM database which are absent from FAO landings (Supplementary Table 2). While these species may potentially be accounted for in FAO landings classified as NEI or otherwise not resolved to the species level, such mismatches in taxonomic resolution challenge the synthesis of these datasets. Further, addressing the growing proportions of NEI tonnage in key regions such as Asia, requires greater transparency across interregional ocean and freshwater commons, and equitable sharing to transition toward better ecosystem-based management and protection of aquatic environments (Visbeck, 2018; Rudolph et al., 2020). For example, with China as a major presence in the South China Sea and being the largest contributor to catch globally (Gephart and Pace, 2015; Crona et al., 2020), it will need to play a pivotal role in the adoption of cooperative practices in the region. Prioritizing additional conservation-relevant data collection must also balance trade-offs in social-ecological impact. Targeting species that comprise a significant proportion of global or regional landings prioritizes a food production perspective, but focusing research and data collection efforts only on groups of species that play the largest roles in the aquatic food system can undermine the ability for managers to make comprehensive policy decisions (Halpern et al., 2019). Ultimately, shifts toward more stable sociopolitical structures and governance strategies, with science-based policy decisions are at the heart of addressing these and many other sustainability targets.
Technological innovation will likely continue to be an important part to improving confidence in fisheries reporting and associated data. For instance, video surveillance technologies on fishing vessels can offer accurate, objective, and cheaper additions or even alternatives to on-board observers for tracking quota, species, and size compliance (Ames et al., 2007; Hold et al., 2015). DNA barcoding is showing promise as a tool that can be used to increase the taxonomic resolution of landings, enforce catch restrictions around threatened species, and reduce seafood fraud in the consumer facing marketplace (Rasmussen and Morrissey, 2008; Ardura et al., 2013). DNA barcoding also can play a role in deterring IUU fishing by empowering ports and landing sites with quick testing for illegal catch of protected species (Ogden, 2008; Ardura et al., 2013). Other efforts to combat IUU fishing have shown promise, like Global Fishing Watch which has been employed to identify suspect or illegal activities via satellite imagery, typically linked to overexploitation, such as the “dark fishing fleets” (Park et al., 2020). Furthermore, data technologies such as blockchains can help traceability of a fished product along the supply chain, and provide a decentralized system for logging catch statistics that does not rely on different national institutions with varying capacity and incentives for accurate reporting (Probst, 2020). It may also encourage fishers to more accurately report species caught if quotas can be traded among vessels and trade information is available from different ports to determine where the best prices for catch may be obtained (Branch, 2009; Probst, 2020). It’s important to highlight that while technological advances such as these have potential to “nudge” fisheries actors toward greater compliance or efficiency, they should be viewed as supplements to, rather than replacements of, robust fisheries management.
Improvements in management and data become increasingly important under the context of an aquaculture sector that continues to expand and cohabit aquatic environments that also produce wild seafood. Better understanding the status of wild fish and invertebrate populations cannot only minimize negative interactions among fisheries and aquaculture sectors, but create opportunities for aquaculture to be used as a tool in fisheries management (Froehlich et al., 2017). For example, culture of extractive species (e.g., bivalves, seaweeds, corals) can provide similar habitat complexity for native species as the natural benthos, and improve water quality with equivalent efficacy as established biogenic reefs (Dumbauld et al., 2009; Humphries et al., 2016), functioning as powerful tools in degraded or overfished environments. Greater knowledge of which species are fished, and where, can also inform whether a farmed equivalent can provide options for stock enhancement of struggling wild populations or whether risks from genetic pollution may be too great from candidate aquaculture species (Froehlich et al., 2017; Clavelle et al., 2019). Nonetheless, given that countries with poorly resolved fisheries data typically experience the same issues with aquaculture reporting, more widespread cooperation and improved coordination across management and reporting agencies is needed if these mutualisms are to be realized.
Currently the knowledge needed to prioritize future conservation and policy interventions is incomplete, with significant gaps surrounding important exploited taxa. Fisheries management for a number of major commercial fisheries stocks and populations has improved through time. However, the lack of conservation-relevant data surrounding a substantial number of species, as well as increasing proportions of taxonomically unresolved landings in some areas, highlights the challenge of correcting aquatic ecosystem degradation and protecting life below water as we aim to feed a growing human population. Our work takes steps toward outlining the scale of the data gaps among three principal datasets relevant to the conservation and resource management, which we hope will help target what and where to focus resources and efforts. And while technology could help lower costs to track and improve accounting for some wild harvested species, there is no substitute for good governance because people are at the heart of better data and management. Filling these data gaps is a considerable challenge for resource managers and the scientific community alike, but addressing these voids in our knowledge is a fundamental aim of the UN Decade for Ocean Science, and critical for meeting sustainability targets by 2030.
Data Availability Statement
The primary datasets used in this study are available publicly. The FAO global production is available at (http://www.fao.org/fishery/statistics/global-production/en), the RAM legacy database at (https://www.ramlegacy.org/database/), and the IUCN Red List at (https://www.iucnredlist.org). All code used in this analysis is available in a public repository at (https://github.com/GordonBlasco/data_landscape).
Author Contributions
HF conceived the idea. GB collected, analyzed the data, and wrote the first draft. All authors contributed to writing and editing of the manuscript.
Funding
All funding for this work comes from the National Philanthropic Trust.
Conflict of Interest
HF sits on the Technical Advisory Board of the Aquaculture Stewardship Council.
The remaining authors declare that the research was conducted in the absence of any commercial or financial relationships that could be construed as a potential conflict of interest.
Acknowledgments
We thank the National Philanthropic Trust & The National Center for Ecological Analysis and Synthesis for financial support.
Supplementary Material
The Supplementary Material for this article can be found online at: https://www.frontiersin.org/articles/10.3389/fmars.2020.612831/full#supplementary-material
Supplementary Table 1 | Target species from the FAO Global Production database that also have at least one assessment recorded in the RAM Legacy Stock Assessment database and IUCN Red List.
Supplementary Table 2 | Species with stock assessments in the RAM Legacy Database that had no landings reported in the FAO Global Capture Production Database.
References
Alleway, H. K., Gillies, C. L., Bishop, M. J., Gentry, R. R., Theuerkauf, S. J., and Jones, R. (2019). The ecosystem services of marine aquaculture: valuing benefits to people and nature. BioScience 69, 59–68. doi: 10.1093/biosci/biy137
Ames, R. T., Leaman, B. M., and Ames, K. L. (2007). Evaluation of video technology for monitoring of multispecies longline catches. N. Am. J. Fish. Manag. 27, 955–964. doi: 10.1577/M06-029.1
Anderson, S. C., Mills Flemming, J., Watson, R., and Lotze, H. K. (2011). Rapid global expansion of invertebrate fisheries: trends, drivers, and ecosystem effects. PLoS One 6:e14735. doi: 10.1371/journal.pone.0014735
Ardura, A., Planes, S., and Garcia-Vazquez, E. (2013). Applications of DNA barcoding to fish landings: authentication and diversity assessment. ZooKeys 365, 49–65. doi: 10.3897/zookeys.365.6409
Asche, F., Bjørndal, T., and Young, J. A. (2001). Market interactions for aquaculture products. Aquac. Econ. Manag. 5, 303–318. doi: 10.1080/13657300109380296
Barrett, L. T., Swearer, S. E., and Dempster, T. (2019). Impacts of marine and freshwater aquaculture on wildlife: a global meta-analysis. Rev. Aquac. 11, 1022–1044. doi: 10.1111/raq.12277
Berkes, F., Hughes, T. P., Steneck, R. S., Wilson, J. A., Bellwood, D. R., Crona, B., et al. (2006). Globalization, roving bandits, and marine resources. Science 311, 1557–1558. doi: 10.1126/science.1122804
Boettiger, C., Temple Lang, D., and Wainwright, P. (2012). rfishbase: exploring, manipulating and visualizing FishBase data from R. J. Fish Biol. 81, 2030–2039. doi: 10.1111/j.1095-8649.2012.03464.x
Branch, T. A. (2009). How do individual transferable quotas affect marine ecosystems? Fish Fish. 10, 39–57. doi: 10.1111/j.1467-2979.2008.00294.x
Branch, T. A. (2015). Fishing impacts on food webs: multiple working hypotheses. Fisheries 40, 373–375. doi: 10.1080/03632415.2015.1059825
Chamberlain, S. (2020). rredlist: “IUCN” Red List Client. Available online at: https://CRAN.R-project.org/package=rredlist (accessed July 10, 2020).
Chamberlain, S., and Szocs, E. (2013). taxize – Taxonomic Search and Retrieval in R. F1000Research. Available online at: http://f1000research.com/articles/2-191/v2 (accessed July 10, 2020).
Clavelle, T., Lester, S. E., Gentry, R., and Froehlich, H. E. (2019). Interactions and management for the future of marine aquaculture and capture fisheries. Fish Fish. 20, 368–388. doi: 10.1111/faf.12351
Costello, C., Ovando, D., Hilborn, R., Gaines, S. D., Deschenes, O., and Lester, S. E. (2012). Status and solutions for the world’s unassessed Fisheries. Science 338, 517–520. doi: 10.1126/science.1223389
Crona, B., Wassénius, E., Troell, M., Barclay, K., Mallory, T., Fabinyi, M., et al. (2020). China at a crossroads: an analysis of china’s changing seafood production and consumption. One Earth 3, 32–44. doi: 10.1016/j.oneear.2020.06.013
Davies, R. W. D., Cripps, S. J., Nickson, A., and Porter, G. (2009). Defining and estimating global marine fisheries bycatch. Mar. Policy 33, 661–672. doi: 10.1016/j.marpol.2009.01.003
Dumbauld, B. R., Ruesink, J. L., and Rumrill, S. S. (2009). The ecological role of bivalve shellfish aquaculture in the estuarine environment: a review with application to oyster and clam culture in West Coast (USA) estuaries. Aquaculture 290, 196–223. doi: 10.1016/j.aquaculture.2009.02.033
Eddy, T. D., Coll, M., Fulton, E. A., and Lotze, H. K. (2015). Trade-offs between invertebrate fisheries catches and ecosystem impacts in coastal New Zealand. ICES J. Mar. Sci. 72, 1380–1388. doi: 10.1093/icesjms/fsv009
FAO. (2020b). Fishery and Aquaculture Statistics. Global Capture Production 1950-2018 (FishstatJ). FAO Fisheries and Aquaculture Department [online]. Rome: FAO.
Free, C. M., Jensen, O. P., Anderson, S. C., Gutierrez, N. L., Kleisner, K. M., Longo, C., et al. (2020). Blood from a stone: performance of catch-only methods in estimating stock biomass status. Fish. Res. 223:105452. doi: 10.1016/j.fishres.2019.105452
Froehlich, H. E., Gentry, R. R., and Halpern, B. S. (2017). Conservation aquaculture: shifting the narrative and paradigm of aquaculture’s role in resource management. Biol. Conserv. 215, 162–168. doi: 10.1016/j.biocon.2017.09.012
Froese, R., and Pauly, D. (2000). FishBase 2000: Concepts Designs and Data Sources. Los Baños: ICLARM.
Garibaldi, L. (2012). The FAO global capture production database: a six-decade effort to catch the trend. Mar. Policy 36, 760–768. doi: 10.1016/j.marpol.2011.10.024
Gentry, R. R., Ruff, E. O., and Lester, S. E. (2019). Temporal patterns of adoption of mariculture innovation globally. Nat. Sustain. 2, 949–956. doi: 10.1038/s41893-019-0395-y
Gephart, J. A., and Pace, M. L. (2015). Structure and evolution of the global seafood trade network. Environ. Res. Lett. 10:125014. doi: 10.1088/1748-9326/10/12/125014
Gullestad, P., Abotnes, A. M., Bakke, G., Skern-Mauritzen, M., Nedreaas, K., and Søvik, G. (2017). Towards ecosystem-based fisheries management in Norway – Practical tools for keeping track of relevant issues and prioritising management efforts. Mar. Policy 77, 104–110. doi: 10.1016/j.marpol.2016.11.032
Halpern, B. S., Frazier, M., Afflerbach, J., Lowndes, J. S., Micheli, F., O’Hara, C., et al. (2019). Recent pace of change in human impact on the world’s ocean. Sci. Rep. 9:11609. doi: 10.1038/s41598-019-47201-9
Hayward, M. W., Child, M. F., Kerley, G. I. H., Lindsey, P. A., Somers, M. J., and Burns, B. (2015). Ambiguity in guideline definitions introduces assessor bias and influences consistency in IUCN Red List status assessments. Front. Ecol. Evol 3:87. doi: 10.3389/fevo.2015.00087
Hicks, C. C., Cohen, P. J., Graham, N. A. J., Nash, K. L., Allison, E. H., D’Lima, C., et al. (2019). Harnessing global fisheries to tackle micronutrient deficiencies. Nature 574, 95–98. doi: 10.1038/s41586-019-1592-6
Hilborn, R., Amoroso, R. O., Anderson, C. M., Baum, J. K., Branch, T. A., Costello, C., et al. (2020). Effective fisheries management instrumental in improving fish stock status. Proc. Natl. Acad. Sci. U.S.A. 117:201909726. doi: 10.1073/pnas.1909726116
Hilborn, R., and Ovando, D. (2014). Reflections on the success of traditional fisheries management. ICES J. Mar. Sci. 71, 1040–1046. doi: 10.1093/icesjms/fsu034
Hold, N., Murray, L. G., Pantin, J. R., Haig, J. A., Hinz, H., and Kaiser, M. J. (2015). Video capture of crustacean fisheries data as an alternative to on-board observers. ICES J. Mar. Sci. 72, 1811–1821. doi: 10.1093/icesjms/fsv030
Humphries, A. T., Ayvazian, S. G., Carey, J. C., Hancock, B. T., Grabbert, S., Cobb, D., et al. (2016). Directly measured denitrification reveals oyster aquaculture and restored oyster reefs remove nitrogen at comparable high rates. Front. Mar. Sci. 3:74. doi: 10.3389/fmars.2016.00074
IUCN (2020). The IUCN Red List of Threatened Species. Version 2020-2. Available online at: https://www.iucnredlist.org (accessed July 10, 2020).
Jackson, J. B. C. (2001). Historical overfishing and the recent collapse of coastal ecosystems. Science 293, 629–637. doi: 10.1126/science.1059199
Link, J. S., and Watson, R. A. (2019). Global ecosystem overfishing: clear delineation within real limits to production. Sci. Adv. 5:eaav0474. doi: 10.1126/sciadv.aav0474
Mace, G. M., Collar, N. J., Gaston, K. J., Hilton-Taylor, C., Akçakaya, H. R., Leader-Williams, N., et al. (2008). Quantification of extinction risk: IUCN’s system for classifying threatened species. Conserv. Biol. 22, 1424–1442. doi: 10.1111/j.1523-1739.2008.01044.x
Marshall, K. N., Kaplan, I. C., Hodgson, E. E., Hermann, A., Busch, D. S., McElhany, P., et al. (2017). Risks of ocean acidification in the California Current food web and fisheries: ecosystem model projections. Glob. Chang. Biol. 23, 1525–1539. doi: 10.1111/gcb.13594
Maxwell, S. L., Fuller, R. A., Brooks, T. M., and Watson, J. E. M. (2016). Biodiversity: the ravages of guns, nets and bulldozers. Nat. News 536, 143–145. doi: 10.1038/536143a
Miller, R. R., Field, J. C., Santora, J. A., Monk, M. H., Kosaka, R., and Thomson, C. (2017). Spatial valuation of California marine fisheries as an ecosystem service. Can. J. Fish. Aquat. Sci. 74, 1732–1748. doi: 10.1139/cjfas-2016-0228
Mumby, P., Steneck, R., Edwards, A., Ferrari, R., Coleman, R., Harborne, A., et al. (2012). Fishing down a Caribbean food web relaxes trophic cascades. Mar. Ecol. Prog. Ser. 445, 13–24. doi: 10.3354/meps09450
Mutsert, K., de, Cowan, J. H., Essington, T. E., and Hilborn, R. (2008). Reanalyses of Gulf of Mexico fisheries data: landings can be misleading in assessments of fisheries and fisheries ecosystems. Proc. Natl. Acad. Sci. U.S.A. 105, 2740–2744. doi: 10.1073/pnas.0704354105
Neubauer, P., Thorson, J. T., Melnychuk, M. C., Methot, R., and Blackhart, K. (2018). Drivers and rates of stock assessments in the United States. PLoS One 13:e0196483. doi: 10.1371/journal.pone.0196483
Ogden, R. (2008). Fisheries forensics: the use of DNA tools for improving compliance, traceability and enforcement in the fishing industry. Fish Fish. 9, 462–472. doi: 10.1111/j.1467-2979.2008.00305.x
Palomares, M. L. D., and Pauly, D. (2020). SeaLifeBase. World Wide Web Electronic Publication. Available online at: www.sealifebase.org (accessed July 10, 2020).
Park, J., Lee, J., Seto, K., Hochberg, T., Wong, B. A., Miller, N. A., et al. (2020). Illuminating dark fishing fleets in North Korea. Sci. Adv. 6:eabb1197. doi: 10.1126/sciadv.abb1197
Pauly, D., Hilborn, R., and Branch, T. A. (2013). Does catch reflect abundance? Nature 494, 303–306. doi: 10.1038/494303a
Pauly, D., Watson, R., and Alder, J. (2005). Global trends in world fisheries: impacts on marine ecosystems and food security. Philos. Trans. 360, 5–12. doi: 10.1098/rstb.2004.1574
Pauly, D., and Zeller, D. (2016). Catch reconstructions reveal that global marine fisheries catches are higher than reported and declining. Nat. Commun. 7:10244. doi: 10.1038/ncomms10244
Probst, W. N. (2020). How emerging data technologies can increase trust and transparency in fisheries. ICES J. Mar. Sci. 77, 1286–1294. doi: 10.1093/icesjms/fsz036
R Core Team (2020). R: A Language and Environment for Statistical Computing. Vienna: R Foundation for Statistical Computing.
RAM Legacy Stock Assessment Database (2018). RAM Legacy Stock Assessment Database v4.44. Available online at: https://cran.r-project.org/web/packages/ramlegacy/citation.html
Randall, C. W. (2003). Potential societal and economic impacts of wastewater nutrient removal and recycling. Water Sci. Technol. 48, 11–17. doi: 10.2166/wst.2003.0004
Rasmussen, R. S., and Morrissey, M. T. (2008). DNA-based methods for the identification of commercial fish and seafood species. Compr. Rev. Food Sci. Food Saf. 7, 280–295. doi: 10.1111/j.1541-4337.2008.00046.x
Ricard, D., Minto, C., Jensen, O. P., and Baum, J. K. (2012). Examining the knowledge base and status of commercially exploited marine species with the RAM legacy stock assessment database. Fish Fish. 13, 380–398. doi: 10.1111/j.1467-2979.2011.00435.x
Roberson, L. A., Watson, R. A., and Klein, C. J. (2020). Over 90 endangered fish and invertebrates are caught in industrial fisheries. Nat. Commun. 11:4764. doi: 10.1038/s41467-020-18505-6
Rousseau, Y., Watson, R. A., Blanchard, J. L., and Fulton, E. A. (2019). Evolution of global marine fishing fleets and the response of fished resources. Proc. Natl. Acad. Sci. U.S.A. 116, 12238–12243. doi: 10.1073/pnas.1820344116
Rudolph, T., Ruckelshaus, M., Swilling, M., Allison, E. H., Österblom, H., Gelcich, S., et al. (2020). A transition to sustainable ocean governance. Nat. Commun. 11:3600. doi: 10.1038/s41467-020-17410-2
Shen, G., and Heino, M. (2014). An overview of marine fisheries management in China. Mar. Policy 44, 265–272. doi: 10.1016/j.marpol.2013.09.012
Smith, A. D. M., Brown, C. J., Bulman, C. M., Fulton, E. A., Johnson, P., Kaplan, I. C., et al. (2011). Impacts of fishing low-trophic level species on marine ecosystems. Science 333, 1147–1150. doi: 10.1126/science.1209395
Theuerkauf, S. J., Morris, J. A., Waters, T. J., Wickliffe, L. C., Alleway, H. K., and Jones, R. C. (2019). A global spatial analysis reveals where marine aquaculture can benefit nature and people. PLoS One 14:e0222282. doi: 10.1371/journal.pone.0222282
United Nations (2015). Transforming Our World: The 2030 Agenda for Sustainable Development. New York, NY: United Nations, Department of Economic and Social Affairs.
Visbeck, M. (2018). Ocean science research is key for a sustainable future. Nat. Commun. 9:690. doi: 10.1038/s41467-018-03158-3
Watson, R. A. (2017). A database of global marine commercial, small-scale, illegal and unreported fisheries catch 1950–2014. Sci. Data 4:170039. doi: 10.1038/sdata.2017.39
Wickham, H., Averick, M., Bryan, J., Chang, W., McGowan, L. D., François, R., et al. (2019). Welcome to the Tidyverse. J. Open Source Softw. 4:1686. doi: 10.21105/joss.01686
Worm, B., Hilborn, R., Baum, J. K., Branch, T. A., Collie, J. S., Costello, C., et al. (2009). Rebuilding global fisheries. Science 325, 578–585. doi: 10.1126/science.1173146
WoRMS Editorial Board (2020). World Register of Marine Species. doi: 10.14284/170 (accessed October 12, 2020).
CrossRef Full Text | https://www.marinespecies.orgatVLIZ | Google Scholar
Keywords: wild capture, overexploited, seafood, data uncertainty, global oceans, knowledge gaps
Citation: Blasco GD, Ferraro DM, Cottrell RS, Halpern BS and Froehlich HE (2020) Substantial Gaps in the Current Fisheries Data Landscape. Front. Mar. Sci. 7:612831. doi: 10.3389/fmars.2020.612831
Received: 30 September 2020; Accepted: 19 November 2020;
Published: 17 December 2020.
Edited by:
Anthony Lee Dellinger, Kepley BioSystems, Inc., United StatesReviewed by:
Dan Ovando, University of Washington, United StatesTim Cashion, University of British Columbia, Canada
Aylin Ulman, Independent Researcher, Fethiye, Turkey
Copyright © 2020 Blasco, Ferraro, Cottrell, Halpern and Froehlich. This is an open-access article distributed under the terms of the Creative Commons Attribution License (CC BY). The use, distribution or reproduction in other forums is permitted, provided the original author(s) and the copyright owner(s) are credited and that the original publication in this journal is cited, in accordance with accepted academic practice. No use, distribution or reproduction is permitted which does not comply with these terms.
*Correspondence: Gordon D. Blasco, Ymxhc2NvQG5jZWFzLnVjc2IuZWR1