 Ryan B. Wallace
 Bradley J. Peterson
 Christopher J. Gobler
- 1Environmental Studies and Sciences, Adelphi University, Garden City, NY, United States
- 2School of Marine and Atmospheric Sciences, Stony Brook University, Stony Brook, NY, United States
Changes in photosynthetic and respiration rates in coastal marine habitats cause considerable variability in ecosystem metabolism on timescales ranging from diel to tidal to seasonal. Here, temporal and spatial dynamics of dissolved oxygen (DO), carbonate chemistry, and net ecosystem metabolism (NEM) were quantified from spring through fall in multiple, distinct, temperate estuarine habitats: seagrass meadows, salt marshes, an open water estuary, and a shallow water habitat dominated by benthic macroalgae. DO and pHT (total scale) measurements were made via high frequency sensor arrays coupled with discrete measurements of dissolved inorganic carbon (DIC) and high-resolution spatial mapping was used to document intra-habitat spatial variability. All habitats displayed clear diurnal patterns of pHT and DO that were stronger than tidal signals, with minimums and maximums observed during early morning and afternoon, respectively. Diel ranges in pHT and DO varied by site. In seagrass meadows and the open estuarine site, pHT ranged 7.8–8.4 and 7.5–8.2, respectively, while DO exceeded hypoxic thresholds and aragonite was typically saturated (ΩAr > 1). Conversely, pHT in a shallow macroalgal and salt marsh dominated habitats exhibited strong diel oscillations in pHT (6.9–8.4) with diel acidic (pHT < 7) and hypoxic (DO < 3 mg L–1) conditions often observed during summer along with extended periods of aragonite undersaturation (ΩAr < 1). The partial pressure of carbon dioxide (pCO2) exceeded 3000 and 2000 μatm in the salt marsh and macroalgal bed, respectively, while pCO2 never exceeded 1000 μatm in the seagrass and open estuarine site. Mesoscale (50–100 m) spatial variability was observed across sites with the lowest pHT and DO found within regions of more restricted flow. NEM across habitats ranged from net autotrophic (macroalgae and seagrass) to metabolically balanced (open water) and net heterotrophic (salt marsh). Each habitat exhibited distinct buffering capacities, varying seasonally, and modulated by adjacent biological activity and variations in total alkalinity (TA) and DIC. As future predicted declines in pH and DO are likely to shrink the spatial extent of estuarine refuges from acidification and hypoxia, efforts are required to expand seagrass meadows and the aquaculture of macroalgae to maximize their ecosystem benefits and maintain these estuarine refuges.
Introduction
Estuaries are among the most biologically productive ecosystems on the planet and serve as critical habitats for early life stage finfish and shellfish (Baird et al., 1991; Sogard and Able, 1991; Able, 2005; Barbier et al., 2010). Estuaries play a vital role by providing important ecosystem services including acting as filtration barriers between terrestrial and marine environments as well as buffer zones, protecting coastal regions and stabilizing shorelines (Valiela, 2006). The habitats within estuaries are biologically and metabolically diverse, ranging from highly productive salt marsh ecosystems to mesotrophic-to-oligotrophic open water estuaries (Caffrey, 2004). Primary production is essential to the functioning of these aquatic ecosystems and, depending on estuarine habitat, can be generated from a variety of sources including macroalgae, seagrasses, salt marsh grasses, benthic microalgae, and phytoplankton. Although primary production (and thus O2 production) within estuarine environments can be elevated on short timescales (hours to days), respiration within these systems catalyzes energy production sourced from allochthonous and autochthonous carbon, making estuaries predominantly net heterotrophic ecosystems (Smith and Mackenzie, 1987; Caffrey, 2004; Cloern et al., 2014). However, there are many examples of net autotrophy where shallow, macrophyte dominated estuaries with minimal organic matter loading can be considered a net CO2 sink (Maher and Eyre, 2012). Microbial metabolic rates driving ecosystem metabolism can vary on hourly time scales in estuarine environments causing rapid changes in dissolved gases (O2, CO2), and changes in estuarine pH over short temporal and spatial scales (Baumann and Smith, 2018).
Salt marshes are highly productive ecosystems well-known for high rates of metabolic activity that increase dramatically from winter to summer months (Nixon and Oviatt, 1973). Tidal fluctuations can also have strong influences on shallow salt marshes with high tides often transporting more oxygenated waters into marshes (O’Boyle et al., 2013; Baumann et al., 2015). Salt marsh-dominated estuaries generally have a detritus-based food web (Odum, 1971) and respiration rates that are highly accelerated, facilitating the net consumption of DO (Nixon and Oviatt, 1973). In contrast to DO, substantially less is known regarding the dynamics of carbonate chemistry in salt marshes (Wang et al., 2016; Wang et al., 2018).
Seagrass meadows are found in the shallow waters of every continent except Antarctica (Duarte et al., 2010) and provide food, habitat, and nursery areas for a variety of invertebrate and vertebrate species (Beck et al., 2001; Heck et al., 2003; Orth et al., 2006). Seagrass beds can be important sources of organic production, sequestering carbon within the surrounding sediment and exporting detritus (Suchanek et al., 1985; Duarte et al., 2005; Orth et al., 2006). Previous studies have shown that low pH can also occur in seagrass beds at night, where periods of undersaturation can cause carbonate-sediment dissolution (Camp et al., 2016; Cyronak et al., 2018). In addition, organic material within seagrass beds can degrade, increasing DIC and enhancing carbonate dissolution in these shallow water habitats (Unsworth et al., 2012). Photosynthetic rates in seagrass beds can also be limited by carbon availability, specifically in the form of CO2 (Beer and Koch, 1996) and this may be especially evident in many northeast United States estuaries as much of the remaining seagrass beds are now restricted to low turbidity areas (Dennison et al., 1993) with minimal shoreline development (Roman et al., 2000; Short et al., 2006; Blake et al., 2014), but also higher salinity and lower CO2 (Wallace et al., 2014). The species of seagrass indigenous to the Northeast United States (Zostera marina) has been well-studied and much of the oxygen produced by this species is released into the surrounding water column (Sand-Jensen and Borum, 1983; Caffrey and Kemp, 1991). Conversely, as a significant carbon sink (Orth et al., 2006) these highly productive seagrass meadows rapidly assimilate CO2 and may provide zones of elevated aragonite saturation (ΩAr), even within eutrophic estuaries (Hendriks et al., 2014; Pacella et al., 2018).
Macroalgae-dominated estuarine regions are common in both tropical and temperate regions around the world and are often dominated by chlorophytes such as Ulva spp. that can form dense blooms referred to as “green tides” (Smetacek and Zingone, 2013). Regions commonly impacted by the accumulation of green macroalgal biomass include the east coast of North America (Ye et al., 2011), the Bohai Sea in China (Liu et al., 2009; Liu et al., 2010), and Brittany, France (Ménesguen and Piriou, 1995) where blooms are often dominated by morphologically indistinguishable species of the genus Ulva (Blomster et al., 2002). Ulva-dominated ecosystems can drive large fluctuations in DO on both diurnal and seasonal timescales via photosynthesis and respiration. Middelboe and Hansen (2007a) found that in a macroalgae-dominated, wave exposed area, DO was supersaturated during the day (125% saturation) and near saturated conditions at night (91% saturation). In more poorly flushed, temperate regions, dense stands of macroalgae and Ulva spp. blooms can promote diurnal and seasonal hypoxia and anoxia (Valiela et al., 1992; Wallace and Gobler, 2015). Despite the well-documented occurrence of hypoxia within macroalgal-dominated communities (Valiela et al., 1992; Valiela, 2006), no study to date has co-currently assessed DO dynamics and carbonate chemistry within such temperate ecosystems, despite previous studies that have shown that Ulva spp. can have negative impacts on multiple calcifying animals (Magre, 1974; Johnson and Welsh, 1985).
Tidal and metabolic variability can drive intense temperature, pH, and DO fluctuations in coastal environments occurring over short time scales (Wootton et al., 2008; Cai et al., 2011; Riche et al., 2014). With recent advances in high frequency in situ sensors (Bergveld, 2003; Hofmann et al., 2011; Fietzek et al., 2014), biogeochemical cycles can be monitored with high temporal resolution. Net metabolism in coastal ecosystems has been studied for decades (Smith and Mackenzie, 1987; Gattuso et al., 1998; Caffrey, 2004; Borges et al., 2008), although most of these efforts lacked the high frequency, high resolution data needed to resolve the temporal and spatial dynamics of rate processes within these systems (Borges et al., 2008). In addition, most studies of ecosystem metabolism in estuaries have focused either on high frequency O2 measurements or less frequent, lower resolution pH or carbon measurements. There has been little focus on high frequency and high-resolution measurements of both O2 and pH (Rosenau et al., 2021) coupled with measurements of carbonate chemistry. Studies that have focused on the monitoring of high frequency carbonate chemistry in coastal environments (Baumann et al., 2015; Saderne et al., 2015; Wang et al., 2015), have lacked simultaneous comparisons of distinct habitats. Such approaches would permit an evaluation of the relative strength and direction (net autotrophic vs. net heterotrophic) of ecosystem metabolism as well as their comparative suitability as habitats for calcifying and other marine organisms.
Therefore, this study was undertaken to compare four common northeast United States coastal habitats within the same general estuarine system, with respect to the dynamics of net ecosystem metabolism (NEM), carbonate chemistry, DO, and pHT. Questions addressed in this study included: How do rates of NEM compare across estuarine habitat types? What are the fine temporal and spatial scales of carbonate chemistry across estuarine habitats? How do specific estuarine habitats compare as refugia from coastal acidification? Continuous measurements were specifically made within multiple salt marshes and seagrass beds, as well as in macroalgae beds and open-water estuarine regions over a 5-year period. Continuous measurements of DO and pHT were complemented with discrete measurements of carbonate chemistry, allowing for a comprehensive assessment of the suitability of the various habitats for calcifying and other marine organisms.
Materials and Methods
Site Description
Four distinct coastal habitat types within a ∼200 km2 region on eastern Long Island were examined for this study; two seagrass meadows in eastern Shinnecock Bay (SG-1; 40.85849, −72.45107 and SG-2; 40.86001, −72.49834; Figure 1), one salt marsh in western Shinnecock Bay (SM-1; 40.81992, −72.56497; Figure 1), two salt marshes in the Peconic Estuary (SM-2; 40.90555, −72.59280 and SM-3; 40.92970, −72.42583; Figure 1), an open water location in the Peconic Estuary (OW-1; 40.97672, −72.46638; Figure 1), and a shallow water ecosystem dominated by benthic macroalgae (Ulva spp.) in the Peconic Estuary (MA-1; 41.01861, −72.47134; Figure 1). In addition, cruises were performed across the Peconic Estuary and Shinnecock Bay to place habitat-specific observations in a larger, estuary-wide perspective.
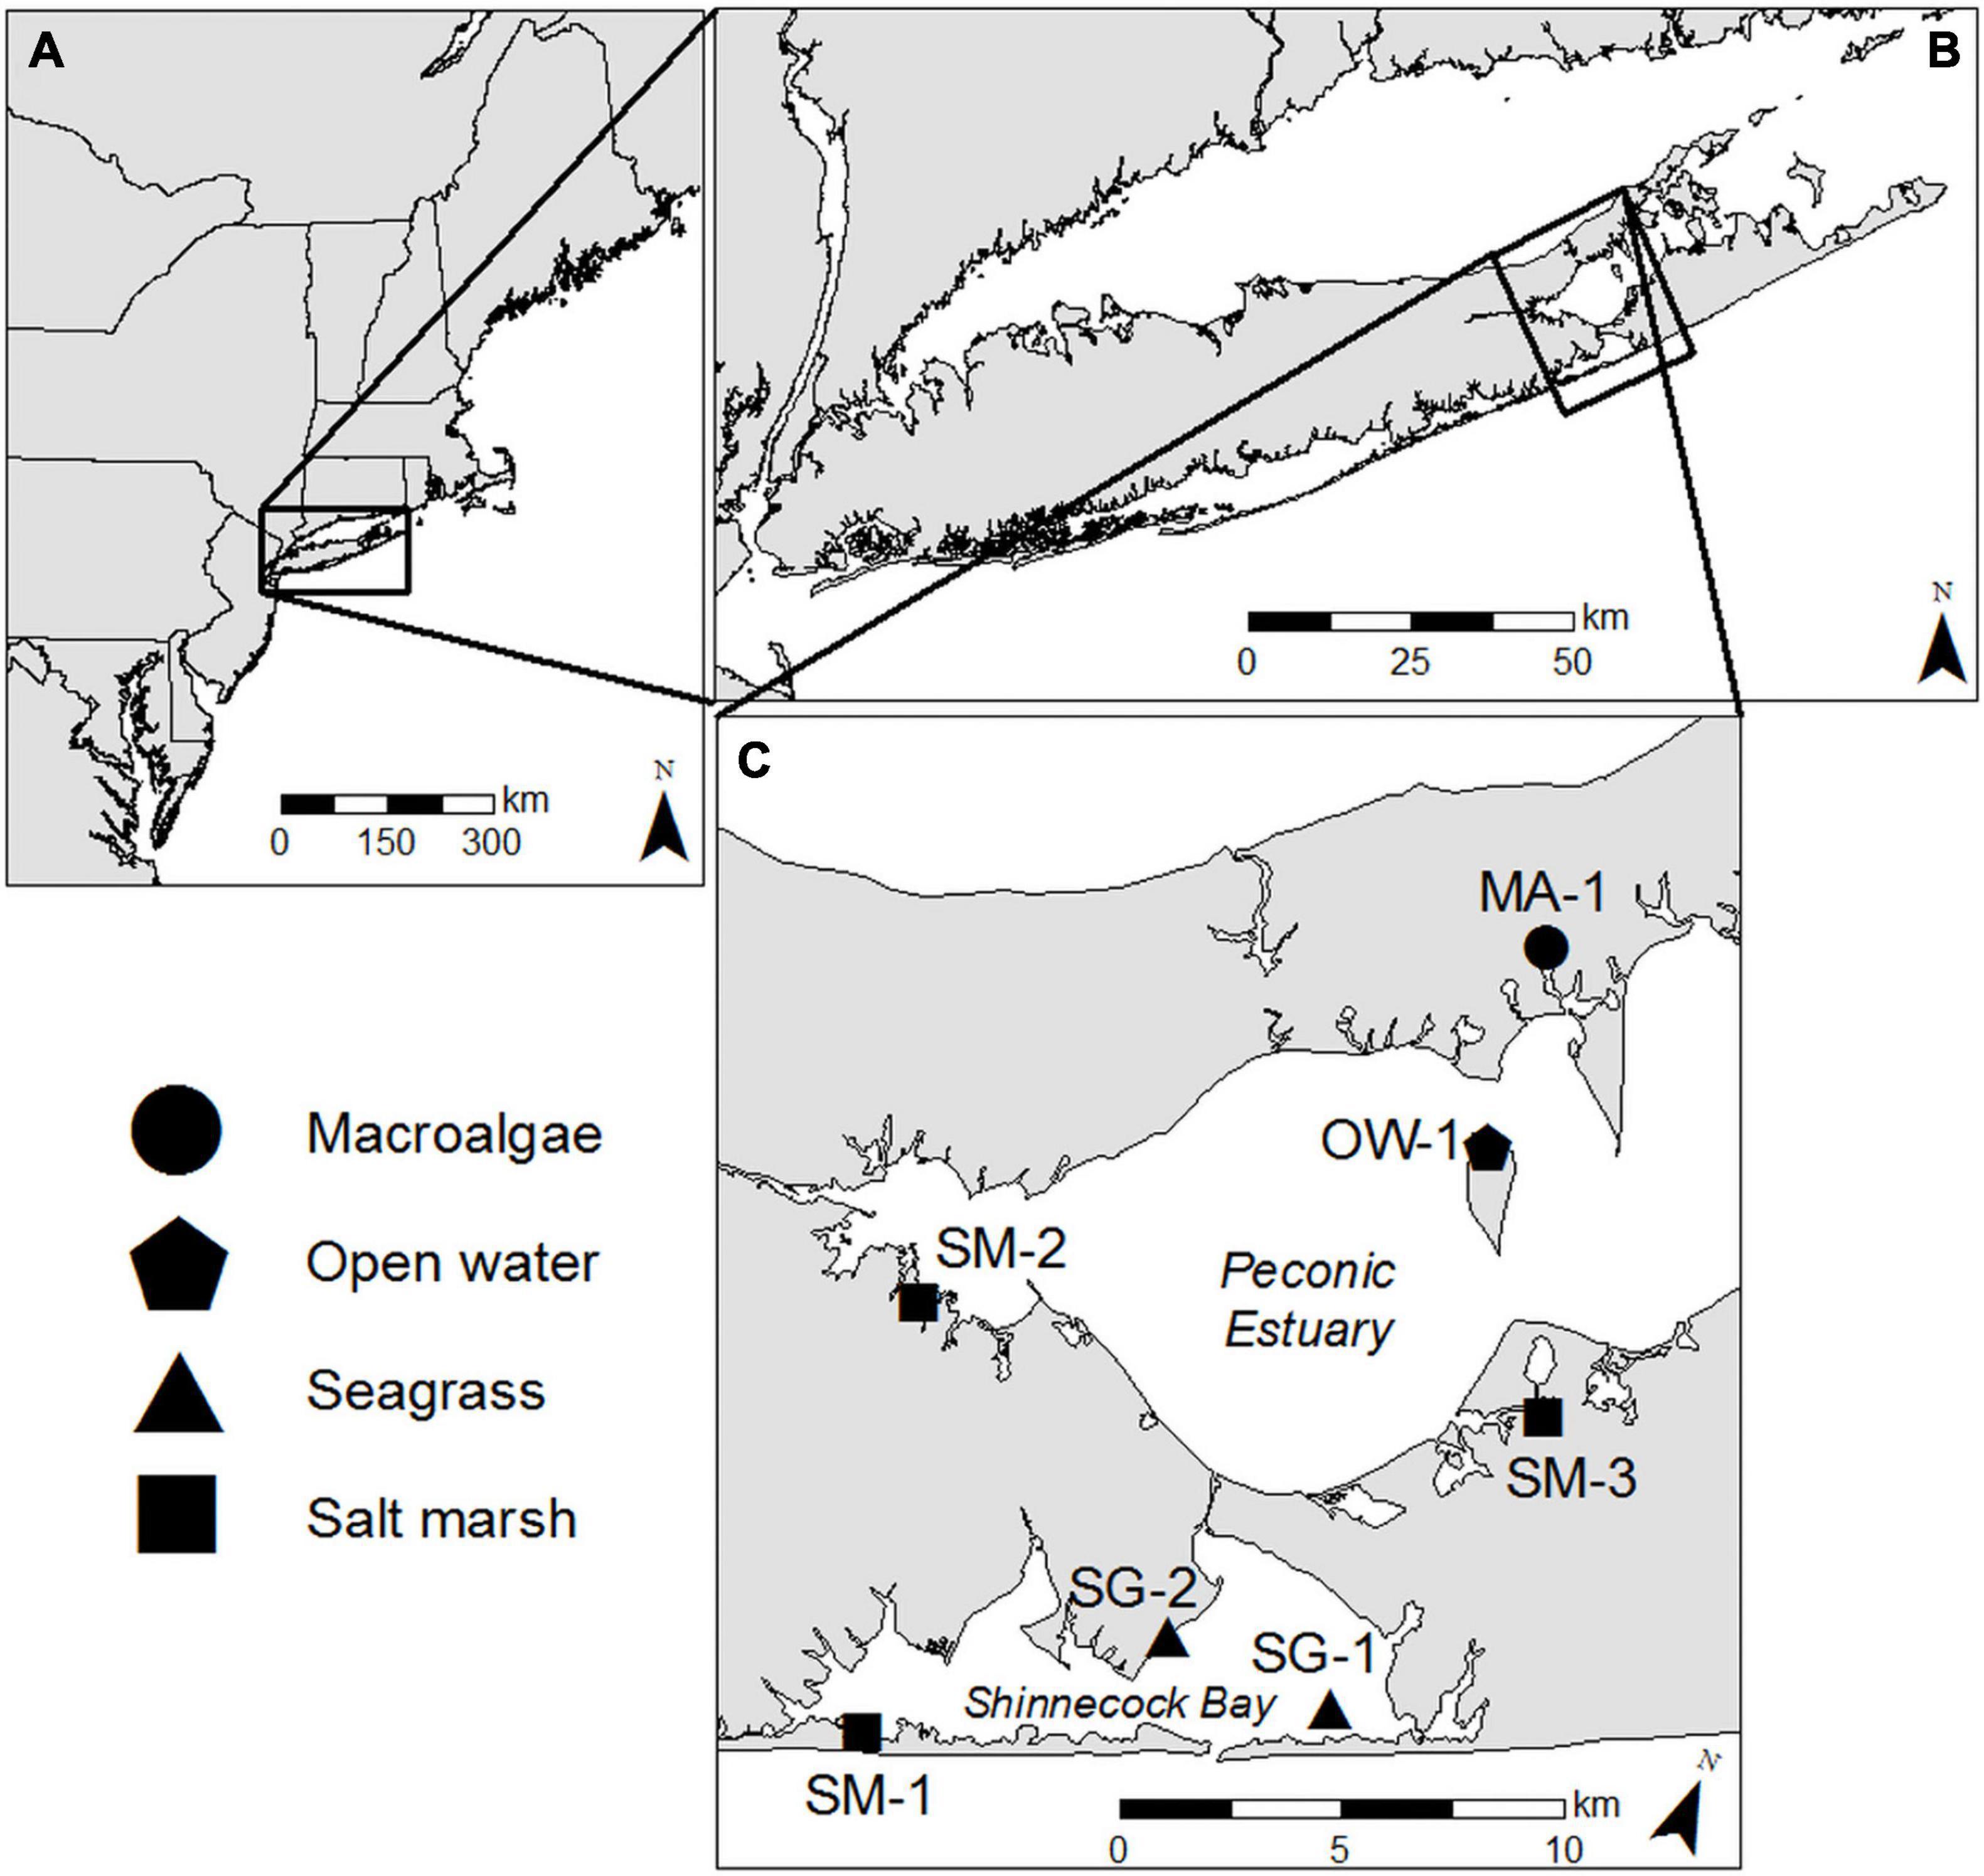
Figure 1. (A) Map of Northeastern United States with (B) Long Island, (C) Shinnecock Bay, and Great Peconic Bay inset. Black shapes indicate sampling locations and shapes correspond to distinct habitats sampled.
The seagrass sites were located at the southeastern extent of Long Island’s South Shore Estuary Reserve, which hosts some of the most expansive seagrass (Z. marina) stands remaining on Long Island (∼81 km2; Carlson et al., 2009). Z. marina shoot density at site SG-1 was 827 shoots m–2 (SD ± 148.3, n = 30) and was 224 shoots m–2 (SD ± 27.9, n = 18) at site SG-2, a density range considered typical of healthy stands (Olesen and Sand-Jensen, 1994). Site SG-1 is a ∼2 km2 seagrass bed located ∼2.6 km ENE of Shinnecock Inlet where water is exchanging with the Atlantic Ocean and SG-2 is a ∼1 km2 bed that runs along the western shoreline located ∼2.5 km NNW of Shinnecock Inlet and has extensive macroalgae interspersed within the seagrass bed. The mean depth at SG-1 was 1.26 m with a mean daily range of 1.02 m and the mean depth at SG-2 was 1.09 m with a mean daily range of 1.06 m. Salt marsh site SM-1 was located along the southwest shore of Shinnecock Bay, where there are dense stands of salt marsh islands and tidal creeks stretching for ∼ 6 km and extending up to 0.8 km wide. The mean depth at SM-1 was 0.59 m with a mean daily range of 0.75 m. The two additional salt marsh sites lie at opposite ends of the Peconic Estuary. Site SM-2 lies along the south shore of Flanders Bay and represents the northern boundary of a 3.23 km2 protected salt marsh known as Hubbard County Park. The mean depth at SM-2 was 0.94 m with a mean daily range of 0.84 m. Site SM-3 is located in the Scallop Pond Preserve, one of Long Island’s least developed coastal wetlands encompassing an area of ∼2 km2. Site SM-3 was slightly deeper than the other two marsh sites with a mean depth of 1.68 and a 1.01 m mean daily range. The open water location is in the north shore of Robin’s Island in a mesotrophic to oligotrophic section of the Peconic Estuary, strongly flushed by tides (Hardy, 1976) and known to host robust bay scallop (Argopecten irradians) populations (Tettelbach et al., 2013). The mean depth at this location was 2 m with a mean daily range of 0.92 m. The macroalgae-dominated site was located in the Haywater Cove, Cutchogue, NY, which receives extensive nutrient loads from adjacent residential and agricultural areas. The study area exhibited 100% benthic coverage with Ulva spp. at 101 ± 13 g–1 DW m–2 during this study and the mean depth was 1.08 m with a mean daily range of 0.84 m.
Time Series
At all locations a Satlantic SeaFET Ocean pH sensor and a YSI EXO2 multiparameter sonde were affixed horizontally atop a 0.3 m polycarbonate cage that permitted complete flow of water and prevented interaction with sediments. The sensor array at the open water location (site OW-1; Figure 1) was suspended from a fixed bulkhead ∼1 m (low tide) above the sediment surface. The EXO2 multiparameter platform had sensors for temperature (°C), conductivity (μS cm–1), DO (optical; mg L–1 and % saturation), pHNBS (National Bureau of Standards), and chlorophyll a fluorescence (RFU) that made measurements at 10 min intervals from ∼May through ∼October, over multiple years, 2014–2018. Copper mesh was fitted over all sensors and a central wiping mechanism was attached to the multiparameter sondes (180 min. wipe interval) to minimize biofouling. The SeaFET pH sensor measured pHT (total H+ scale), is designed specifically for long term field deployments (e.g., Martz et al., 2010; Hofmann et al., 2011) and, like the multiparameter sensors, logged pHT levels every 10 min from ∼May through ∼October. The NBS scale measures H+ activity and the total H+ scale measures H+ concentration where converting between scales can introduce significant error. The differences between scales can range from hundredths to tenths of a pH unit where the total H+ scale is generally considered to be the most appropriate for estuarine and coastal systems (Pimenta and Grear, 2018). Maintenance and data transfer on each sensor array were performed on a weekly to bi-weekly basis during which sensors and brackets were removed, cleaned, and tested. Additionally, discrete sampling and field calibrations were performed on a weekly to bi-weekly basis. Discrete measurements were made using a YSI 600QS fitted with a temperature/conductivity sensor, a rapid pulse polarographic DO sensor, and a pH electrode/Ag/Ag-Cl reference probe that provided pH measurements on the NBS scale. The handheld DO sensor was calibrated on a weekly to bi-weekly basis using a 2-point calibration technique in which the sensor was inserted into a 100% air saturated chamber until the sensor reached temperature equilibrium. Following the air-saturated calibration, the sensor was submersed in a saturated sodium sulfite solution (O2 scavenger) to achieve a zero-point calibration. This two-point calibration technique improves accuracy of DO measurements in estuarine systems that are prone to intense diurnal fluctuations (Baumann et al., 2015). Conductivity sensors were calibrated at the beginning of the field season using a 50,000 μS cm–1 conductivity solution and only calibrated again if significant drift was observed in the data (>0.2 psu). The pH sensor affixed to the EXO2 was calibrated at 25°C on a weekly to bi-weekly basis using a 3-point calibration procedure in which sensors were submerged in three NIST certified pH buffer solutions (4, 7, and 10: ±0.02). In addition, discrete measurements of pHT were made using a Honeywell DuraFET III pH electrode (Ion Selective Field Effect Transistor; ISFET) integrated to a Honeywell Analytical Process Analyzer (APT) 4000PH series. The DuraFET was calibrated seasonally and when significant drift was observed (±0.02) by submersion in a 25°C equimolal Tris buffer in synthetic seawater of salinity 35 prepared by Dr. Andrew Dickson’s lab (University of California San Diego, Scripps Institution of Oceanography; Batch 26). The pHT of field samples were corrected for temperature and salinity as per Martz et al. (2010). Post-processing of data was conducted to account for fouling errors and/or sensor calibration drift. In order to adjust for potential data inconsistencies, data corrections were applied when combined absolute values due to errors exceeded water quality data correction criteria as described by USGS (see Supplementary Table 2; Wagner et al., 2006). Data errors resulting from biofouling were assessed by determining differences between pre- and post-cleaning measurements and a sensor fouling error would then be applied to the data as necessary (Wagner et al., 2006). Similarly, calibration drift was assessed pre- and post-calibration by determining a drift error based on the sensor measurements in standard/buffer solutions and the temperature-compensated value of the standard/buffer solution (Wagner et al., 2006). Data corrections were applied between maintenance intervals where drift corrections are assumed to occur at a constant rate and therefore linearly interpolated between maintenance intervals (Bartholoma, 2003). Generally, a single variable data correction was applied unless the data range was significant relative to the maintenance interval, in which case a second data correction based on percent error was applied (see Supplementary Table 2 descriptions for formulas applied; Wagner et al., 2006). There were a few occasions during this study in which sensors failed due to fouling and other issues in which case data was removed. Spatial and temporal trends in chemical sensor data was assessed using a Spearman rank order correlation.
Discrete Samples
Discrete water samples were collected using a 2-L handheld WildCo® Van Dorn horizontal water sampler and/or peristaltic pump during daylight hours. Dissolved inorganic carbon (DIC) samples were obtained by inserting Tygon® tubing from the Van Dorn bottle into 330 mL borosilicate glass BOD bottles and allowing sample water to overflow with two full volumes of water. All samples were preserved on site by adding 100 μL of saturated HgCl2 solution and were sealed with a glass stopper using Apiezon L ultra-high vacuum grease. Poisoned DIC samples were analyzed by coulometric titration using a UIC Inc. CM5017O coulometer interfaced to a VINDTA 3D delivery system. As a quality assurance measure, certified reference material generated by Dr. Andrew Dickson’s lab (University of California San Diego, Scripps Institution of Oceanography) was analyzed immediately before and after sample titration and yielded full recovery during this entire study (99.99% ± 0.05). Carbonate chemistry parameters were calculated from measured levels of DIC, pHT, temperature, salinity, phosphate, silicate, concentrations of boron (Lee et al., 2010), sulfate (Morris and Riley, 1966), fluorine (Riley, 1965), the dissociation constant of potassium fluoride (Dickson and Riley, 1979), the dissociation constant of potassium sulfate (Dickson, 1990), the solubility coefficient of CO2 (Weiss, 1974), the vapour pressure of H2O above seawater (Weiss and Price, 1980), and the first and second dissociation constants of carbonic acid in seawater (Millero, 2010) using the program CO2SYS.1 Additional water samples were collected for analysis of chlorophyll a, nitrate/nitrite, ammonium, orthophosphate, particulate organic carbon (POC), and particulate organic nitrogen (PON). Chlorophyll a samples were filtered in triplicate through 0.2 μm polycarbonate filters and were extracted via organic solvent (acetone) and quantified using a Turner Designs© Trilogy Laboratory Fluorometer with an excitation wavelength of 485 nm and an emission wavelength of 685/10 nm. Water collected for dissolved inorganic nutrient analyses was filtered on site through pre-combusted (2 h at 450°C) glass fiber filters (GF/F) and filtrate was colorimetrically analyzed via a Hach QuikChem 8500 Flow Injection Analysis system. Water collected for POC/N were processed by collecting particles onto pre-combusted, GF/F and were analyzed using a CE instruments Flash 1112 elemental analyzer (Sharp, 1974). Differences in the chemical characteristics of sites were compared by means of one-way ANOVAs with Bonferroni tests used to assess difference among groups. Non-normal data was transformed prior to statistical tests.
Spatial Mapping
Surface water DO, pHNBS, and pCO2 levels were horizontally profiled across several systems and estuaries during the day to characterize spatial patterns within each distinct habitat. In situ pCO2 levels were measured using a Contros HydroC CO2 sensor. The HydroC measures pCO2 levels via non-dispersive infrared spectrometry (NDIR) after dissolved gasses within seawater permeate a hydrophobic membrane and equilibrate with the inner pumped gas circuit (Fiedler et al., 2012; Fietzek et al., 2014). Surface water mapping cruises encompassed the Peconic Estuary in its entirety, with additional secondary cruises conducted in the Haywater Cove region (site MA-1), and the Scallop Pond region (site SM-3) using a 1″ diameter rigid ram intake (Madden and Day, 1992) affixed to the rear transom of a small vessel, extending 0.5 m below the air-sea interface with 3–4 flow chambers customized to specific sensor arrays. A debubbler was installed in-line where the system was first primed to generate laminar flow. If significant bubbling was detected via pressure sensor, data was removed. In order to examine fine scale variations within the seagrass meadow, a rigid intake was developed for the seagrass sampling location (SG-1) in which water was sampled continuously from 10 cm above the sediment water interface using a laminar flow pump. All sampling locations were geo-referenced using a GPS receiver (GlobalSat BU-353S4; SiRFstar IV) transmitting at 1 Hz. Horizontal survey data was interpolated using the simple kriging method and the semivariogram function was used to relate semivariance to sampling lag (Curran, 1988). Additional point data was interpolated using a diffusion kernel technique with an additive raster barrier. This diffusion interpolation was useful as high resolution data warranted an interpolation that uses a distance metric (optimally varying kernel) that calculates the cost of travel from one cell of a raster to the next (Krivoruchko and Gribov, 2004). This technique yielded predictions based on a grid matrix and accounted for any region with insufficient data or areas that have non-transparent barriers (i.e., coastlines) for chemical propagation (Gribov and Krivoruchko, 2011).
Habitat Metabolism
Ecosystem metabolism was calculated at five sampling locations (SG-1, SG-2, SM-3, MA-1, and OW-1), enabling comparison of distinct metabolic rates throughout the entire field season. Diffusion of oxygen (O2d) across the air-sea interface (kg s–1) was calculated at 10 min intervals using a bulk liquid-phase mass transfer coefficient (Eq. 1) as described in Ro et al. (2007), where DOA is the DO concentration at equilibrium with the atmosphere (kg m–3), DOw is the DO concentration in the water (kg m–3), A is the mass transfer area (m2), and kL is the bulk liquid-phase oxygen mass transfer coefficient (m/s). kL was derived using Eq. 2 as described by Ro et al. (2007) where Sc is the Schmidt number, defined as the kinematic viscosity of water divided by the diffusion coefficient of O2 gas (Wanninkhof, 1992). U10 is the wind speed at a reference height of 10 m (m/s), which was derived from continuous data collected at the Stony Brook Southampton Marine Sciences Center, Southampton, NY, United States which is <15 km from all study sites,2 ρA indicates the density of air, and ρW indicates the density of water.
For each 10 min interval, O2 diffusion (O2d) was subtracted from the change in DO concentrations (g m–3) multiplied by depth (z) of measurement (m), resulting in time-integrated oxygen flux (O2f g m–2) as described in Caffrey (2004) (Eq. 3).
Estimates of daily metabolic rates were calculated by subtracting total respiration from gross production. Oxygen fluxes during daylight hours (net production) were calculated and summed oxygen fluxes at night were multiplied by −1 to determine evening respiration rates (Caffrey, 2004). Gross production and total respiration rates were estimated using net production and evening respiration values (Caffrey, 2004). Day and evening hours for all calculations were determined using daily civil twilight times (Sun is 6° below azimuth; EDT) at each sampling location.
Calculated metabolic rates based on fixed sensor deployments may be susceptible to error due to tidal advection where water masses with distinct DO histories may influence observed DO sensor measurements (Beck et al., 2015). In order to address this issue, we calculated an NEM error range for each site based on the distance between sites sampled and adjacent monitoring arrays (Van Dam et al., 2019). Mean spatial concentration gradients were estimated for each site by dividing the mean DO concentration by the distance between sites in km (x), multiplied by water velocity (v; Van Dam et al., 2019). We used a mean water velocity of 2.5 cm/s for all stations, which was the mean velocity over a tidal cycle at station SG-2. This error range, , was then calculated for each 10 min interval and the summation per day was incorporated into our NEM calculations (Van Dam et al., 2019). Due to the shallow depth at most sites, the impact of gas transfer on water column DO concentrations may also be significant and therefore NEM is subject to additional error related to O2 re-aeration. To account for this re-aeration adjustment, the calculated gas transfer velocity (Eq. 2) was added to the error range and the summation per day was further incorporated into the NEM calculations. Therefore, the resulting uncertainty bounds presented in Figure 5 represent the combined effects of lateral mixing and variability in gas transfer velocities.
Results
Continuous, Multi-Day Deployments in Salt Marshes and Seagrass Beds
During the summer and fall of 2014, high frequency measurements of DO and pHT were made over short temporal scales at seagrass station 1 and salt marsh stations 1 and 2 (SG-1, SM-1, and SM-2; Figures 1, 2). During the mid-summer seagrass deployment, salinity ranged from 27 to 30, DO ranged from 6 to 10 mg L–1, and pHT ranged from 7.7 to 8.1, with minimum DO and pHT values occurring in the early morning (Figure 2A) while maximum values were recorded during the early evening and coincided with a high tide on August 6 (Figure 2A). During the same time period, sensors at the salt marsh detected values that were lower and more dynamic, with DO ranging from 2 to 10 mg L–1, pHT ranging from 7.0 to 8.2 (Figure 2B), with both parameters being tightly coupled with each other (ρ = 0.67; p < 0.0001) and tidal height (ρ = 0.36 and 0.24 for DO and pHT, respectively, p < 0.0001 for both; Figure 2B). During fall, the seagrass meadow displayed a slightly larger pHT and DO range, 7.6–8.1 and 6–11 mg L–1 relative to summer, with similar diurnal patterns (Figure 2C). The fall salt marsh deployment revealed weaker diurnal patterns, higher minimum DO concentrations (min. DO 4–5 mg L–1), but continued low pHT conditions, within a minima of 7.0 and maximum pHT values never exceeding 8.0 (Figure 2D).
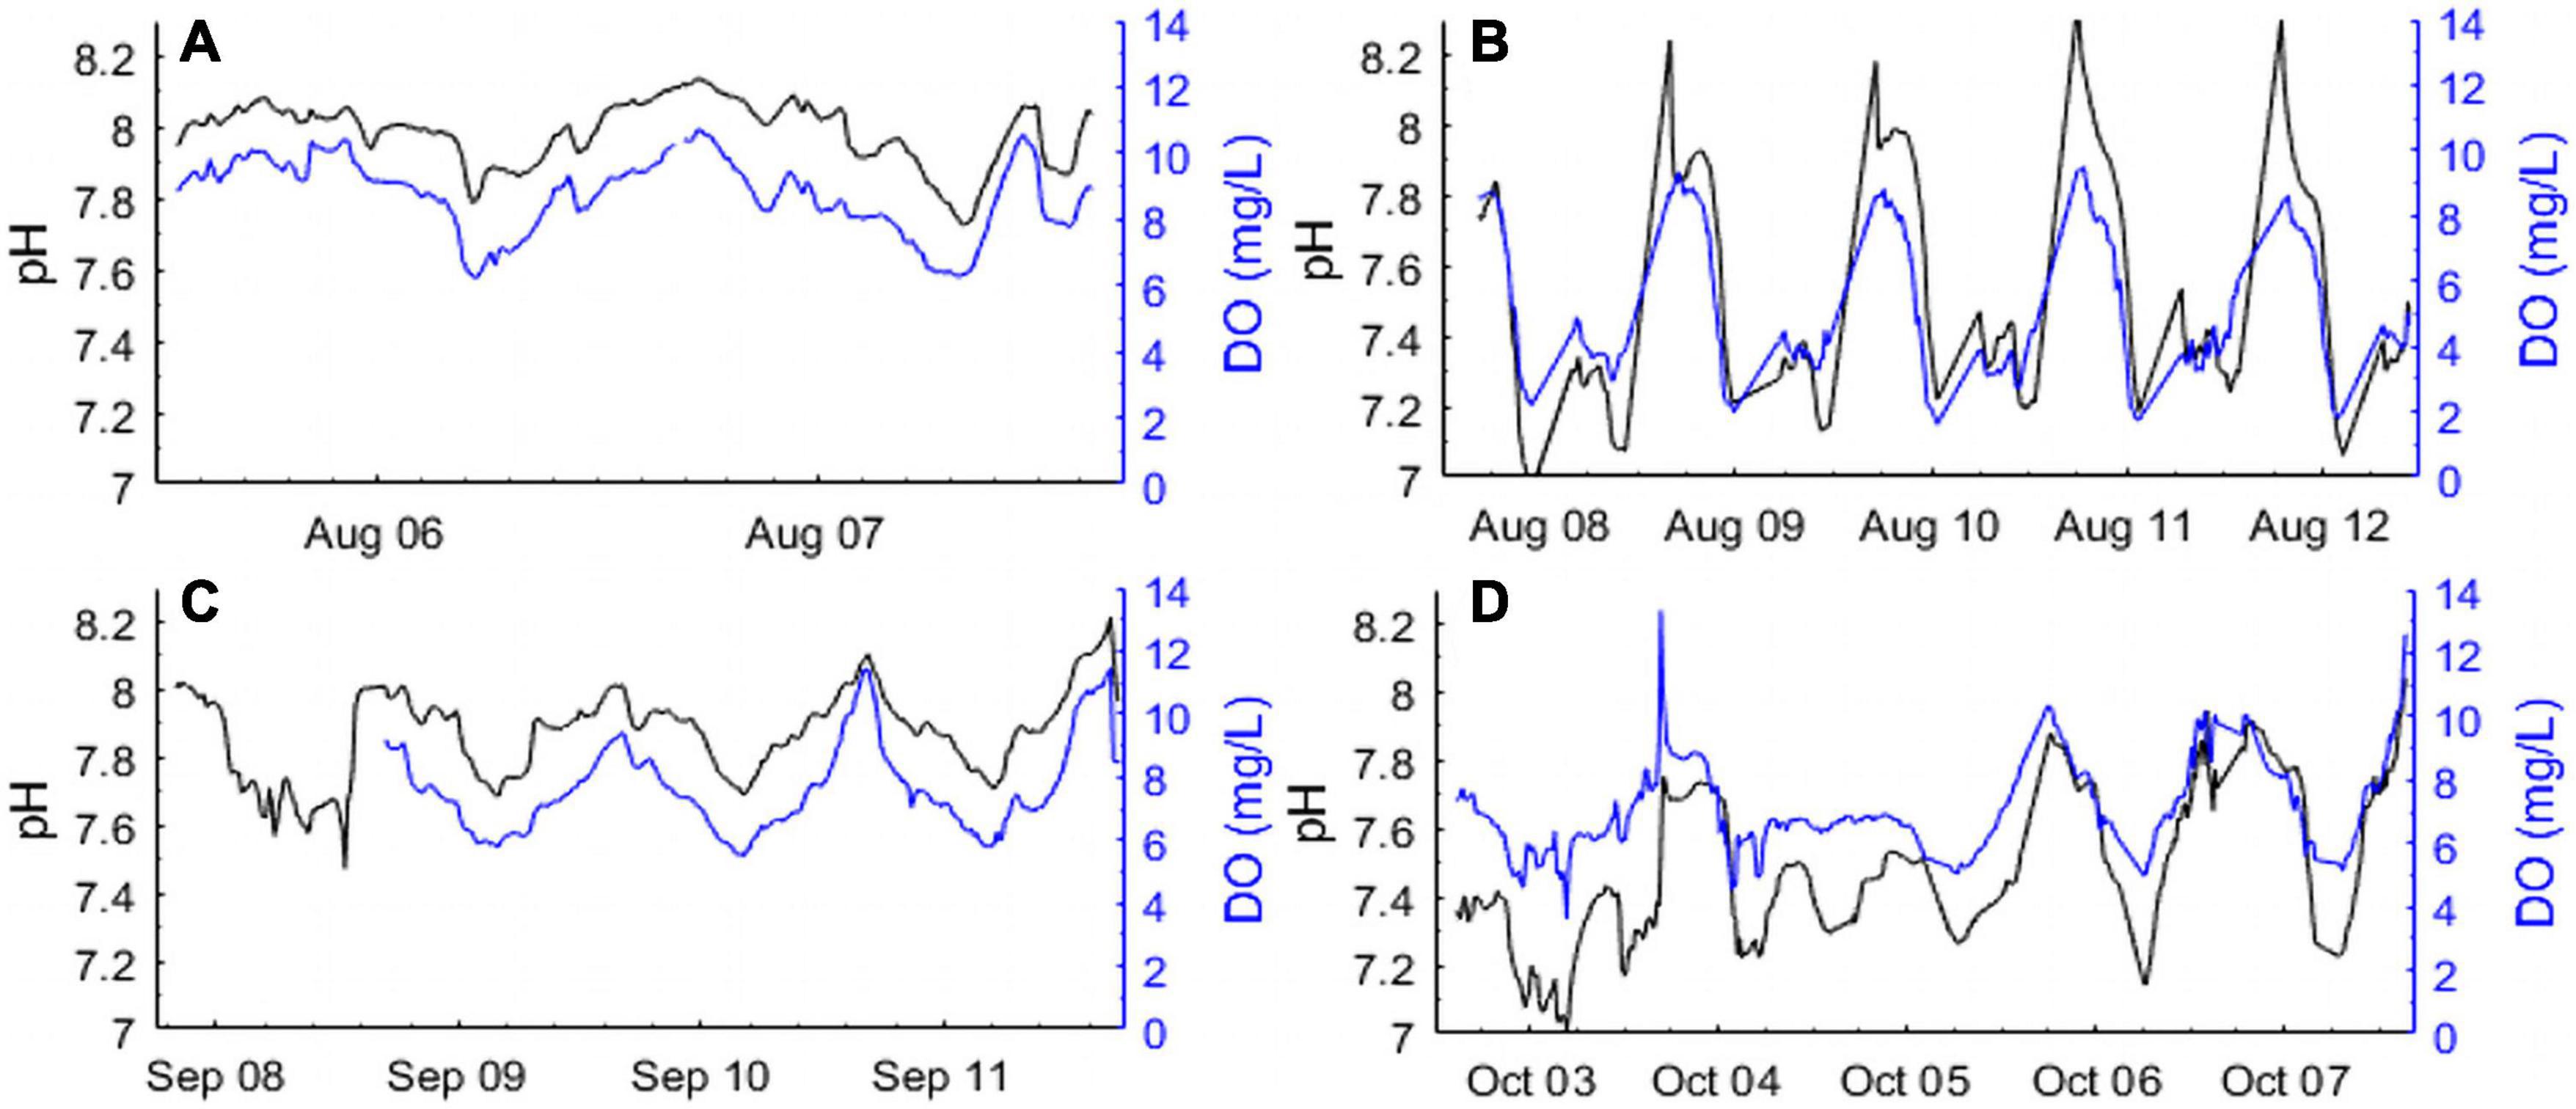
Figure 2. High frequency diurnal measurements of pHT (Black lines; total H+ scale) and dissolved oxygen (Blue lines; DO mg L–1) in (A) a seagrass bed (SG-1) in August, (B) a salt marsh (SM-1) in August, (C) a seagrass bed (SG-1) in September, and (D) a salt marsh (SM-2) in October of 2014.
Continuous, Seasonal Deployments Across Four Habitat Types
In 2015, a multi-habitat study was established from May to early October for three locations: salt marsh station 3 (SM-3), seagrass station 1 (SG-1), and a macroalgae station (MA-1), with an open water station studied from late June to mid-November (OW-1; Figure 1). Analysis of high-frequency DO and pHT data revealed substantial differences in means and variances between sites (Table 1 and Figure 3). Within the salt marsh habitat, DO steadily decreased from ∼7 to ∼5 mg L–1 throughout the summer, before increasing slightly in fall (Figure 3A) while mean pHT values were dynamic but low, ranging from 7.0 to 7.7 from May through October (Figure 3B). Mean DO over the entire sampling season in the salt marsh was 5.3 mg L–1 and mean pHT was 7.4 (Table 1 and Figures 3A,B). Within the macroalgae-dominated system, pHT and DO were highly dynamic over diurnal time scales (Figures 3C,D) with DO supersaturated (DO > 8 mg L–1) and pHT ranging from 7.5 to 8.4 during much of May and June (Figure 3C). During late June and July, this site began to experience nocturnal hypoxia (<3 mg DO L–1; Figure 3C) and acidified conditions (pHT < 7.5; Figure 3D). In September, DO and pHT levels within the macroalgae-dominated site were slightly higher than late summer conditions as mean DO ranged from 4 to 10 mg L–1 and mean pHT ranged from 7.6 to 8.2 (Figure 3D). For the sampling season, the macroalgae station had a mean DO of 8.53 mg L–1 and a pHT of 7.81 (Table 1 and Figures 3C,D). Within the seagrass bed, DO and pHT levels were consistently higher than the salt marsh site and displayed little seasonal variance compared to the macroalgae site. Mean DO throughout the entire season was 7.85 mg L–1 and the mean daily range was 4.5 mg L–1 while the mean pHT was 8.01 with a mean daily range of 0.34 (Table 1 and Figures 3E,F). The open water location exhibited the lowest seasonal variance among the sites with mean values of DO and pHT of 7.34 ± 0.56 mg L–1 and 7.87 ± 0.06, respectively, and mean ranges of 2.19 mg L–1 and 0.25, respectively (Table 1 and Figures 3G,H).
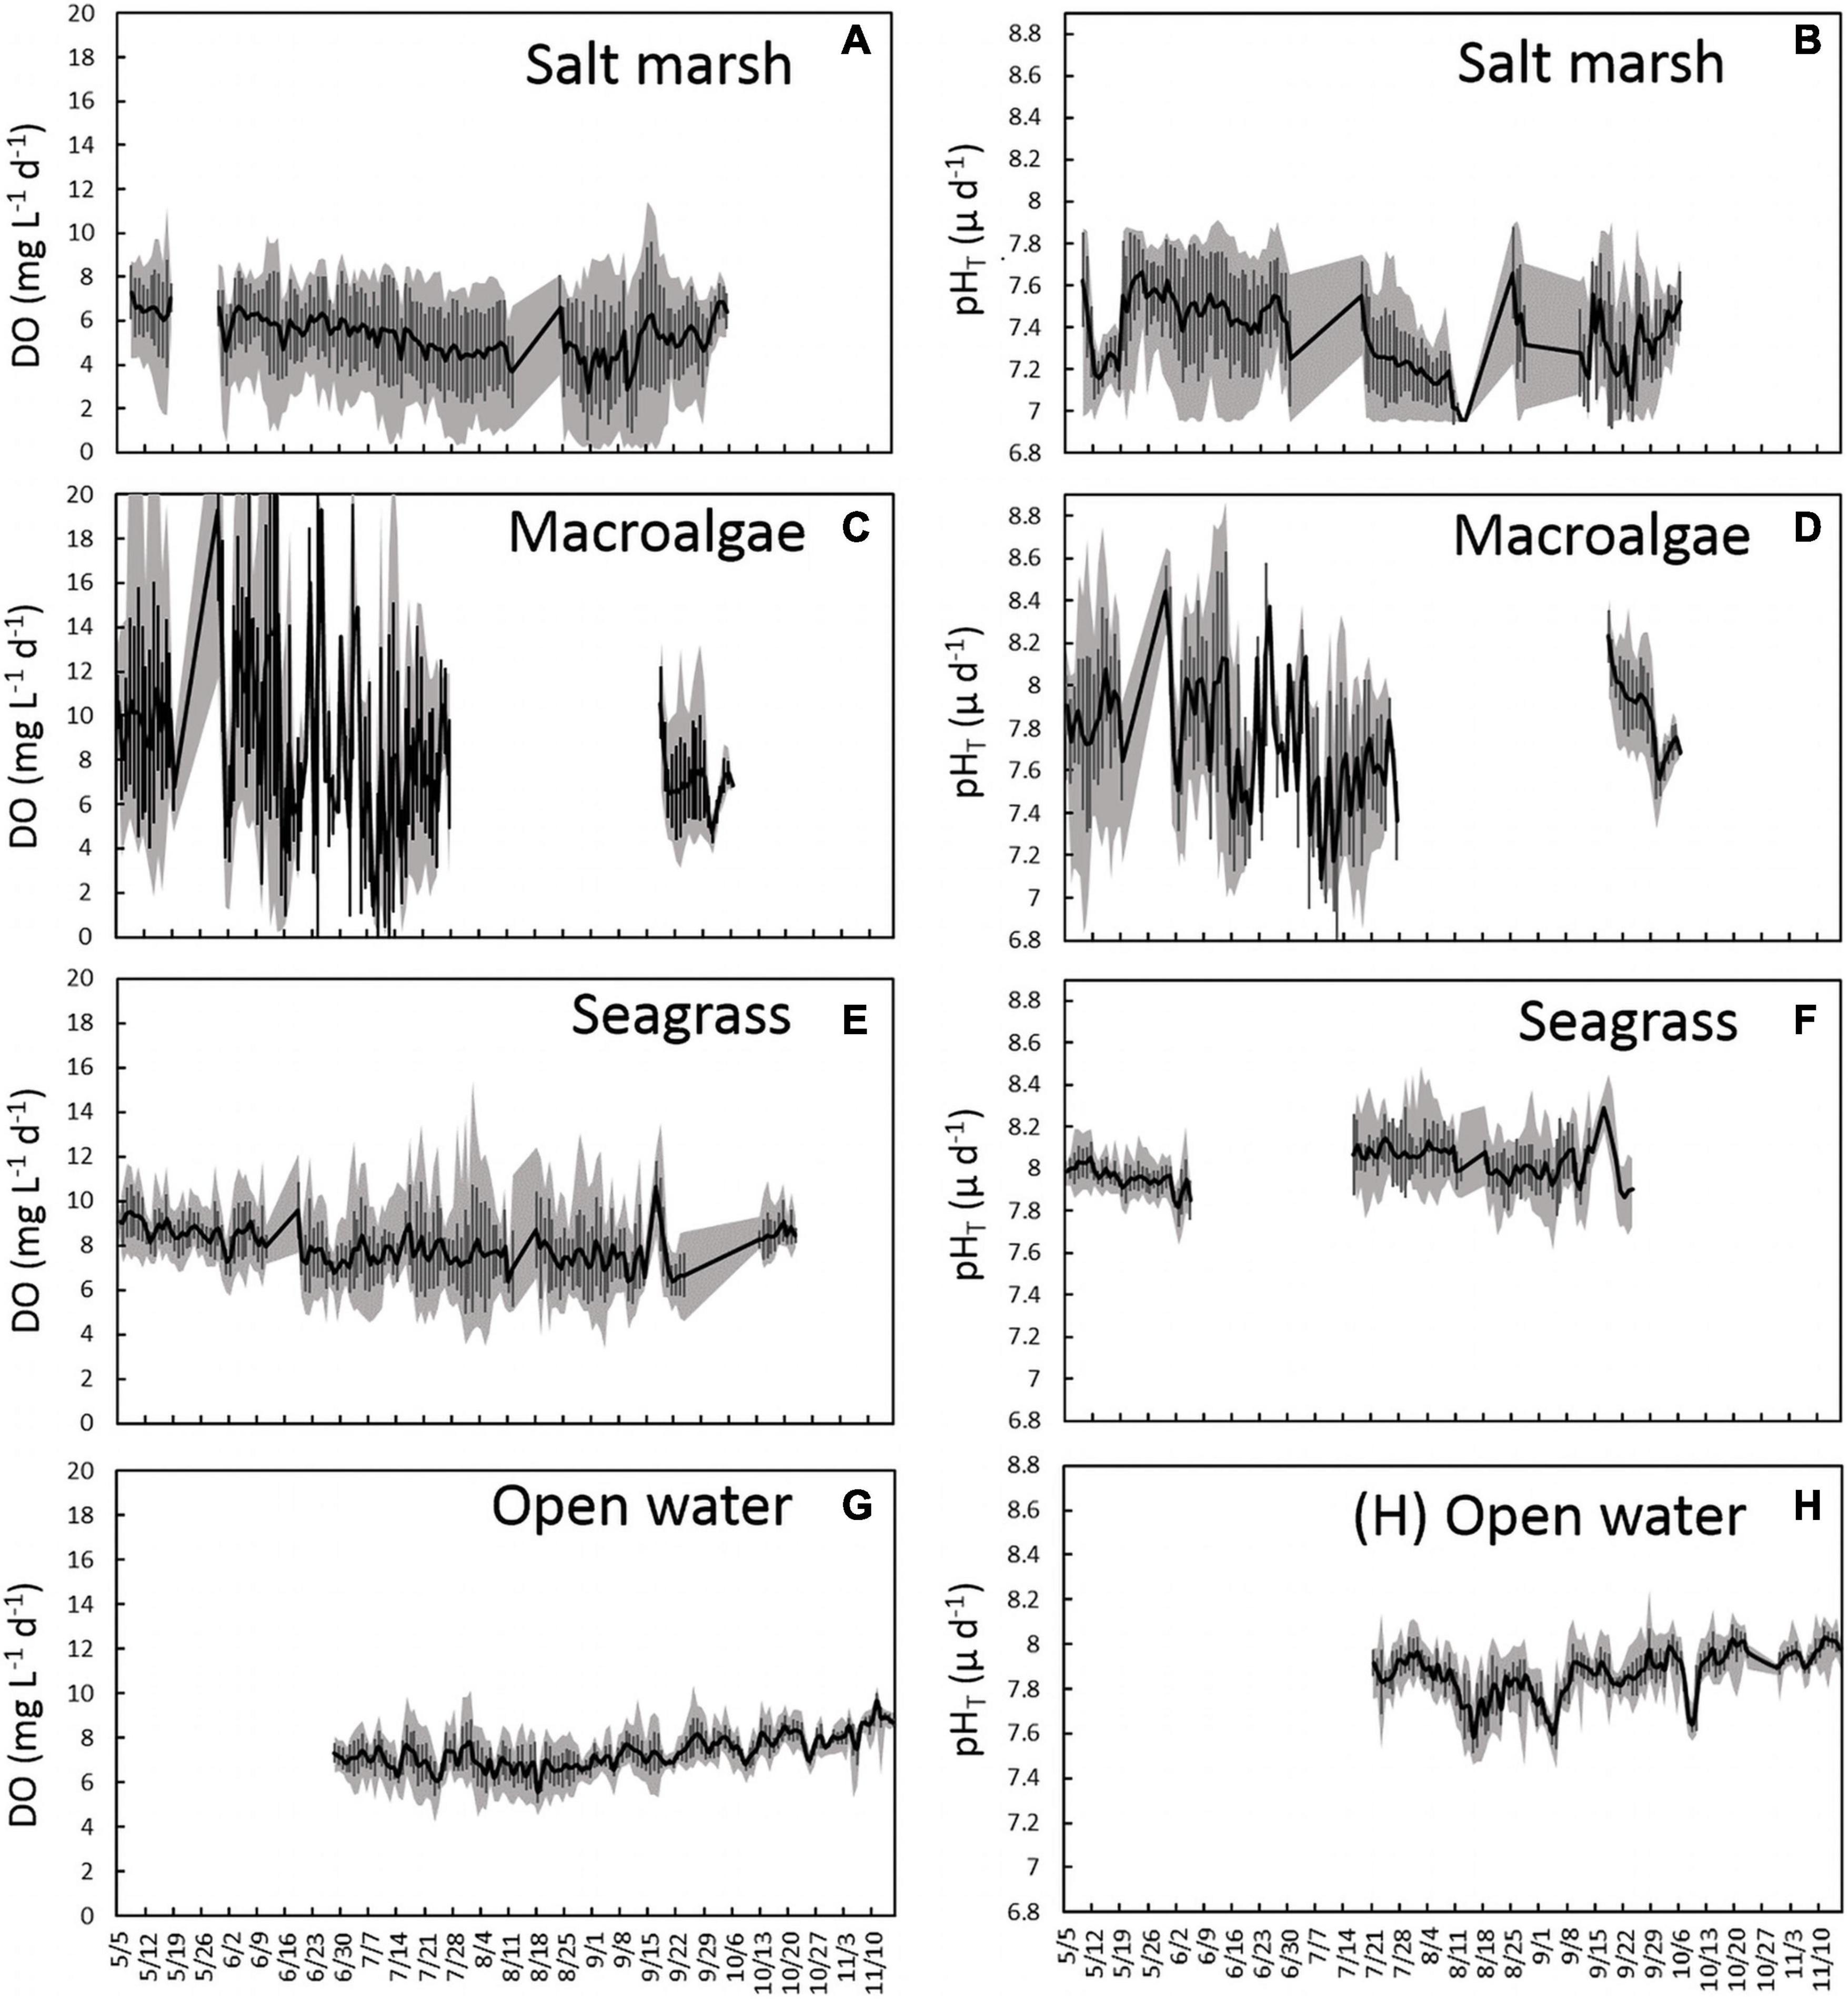
Figure 3. Time series plots representing mean (A) DO mg L–1d–1 ± SD and (B) pHT d–1 ± SD (black lines and error bars) in a salt marsh (SM-3), (C) DO mg L–1d–1 ± SD and (D) pHT d–1 ± SD (black lines and error bars) in a macroalgae-dominated creek (MA-1), (E) DO mg L–1d–1 ± SD and (F) pHT d–1 ± SD (black lines and error bars) in a seagrass bed (SG-1), and (G) DO mg L–1d–1 ± SD and (H) pHT d–1 ± SD (black lines and error bars) in an open water estuary (OW-1). The gray shaded area represents the maximum daily range each day.
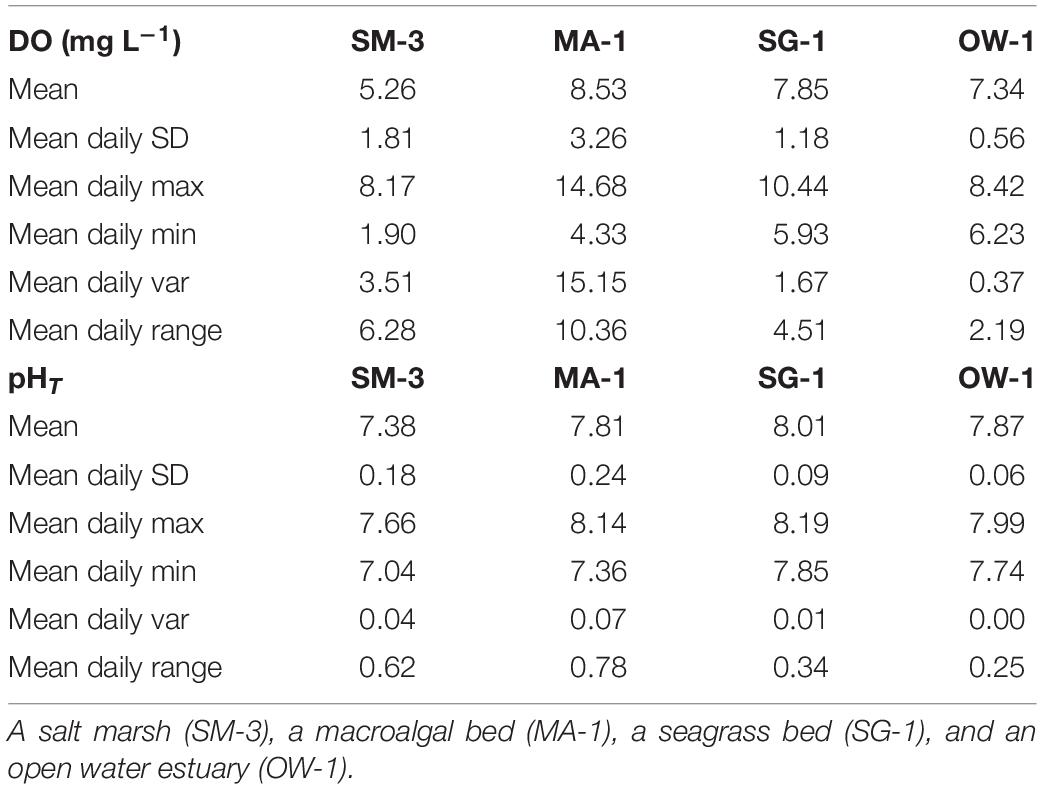
Table 1. Daily mean ± SD, maximum, minimum, variance, and range in four distinct coastal habitats.
All four habitats exhibited similar diurnal patterns in pHT and DO, being lowest during the morning hours (Figure 4; 4:00–8:00 EDT), and highest in the afternoon (Figure 4; 12:00–21:00 EDT). In the salt marsh, acidic (pHT < 7) and hypoxic conditions (DO < 3 mg L–1) were common in the morning hours, with a maximum pHT of up to 7.8 in the evening when DO often exceeded 7 mg L–1 (Figure 4A). The macroalgal dominated ecosystem had the largest pHT and DO range with the pHT ranging from 6.9 to 8.8 and DO ranging from 0 to 20 mg L–1 (Figure 4B). Hypoxic / anoxic events were most commonly observed from 04:00 to 09:00 EDT when pHT values were usually 7.0–7.5 (Figure 4B). In contrast, pHT and DO within the macroalgae site rarely decreased below 7.6 and 7 mg L–1, respectively, from 15:00 to 20:00 EDT, and was often supersaturated with respect to DO at this time (Figure 4B). The seagrass site was less dynamic than the salt marsh and macroalgae-dominated sites with pHT values exceeding 8 and supersaturated DO values commonly observed between 13:00 and 20:00 EDT (Figure 4C). In contrast to the salt marsh and macroalgae site, neither hypoxic nor acidic conditions were observed within the seagrass meadow throughout this study (Figure 4C). The open water location exhibited the lowest diurnal variability as pHT ranged from 7.5 to 8.2 and DO ranged from 5 to 10 mg L–1 with mild afternoon increases in pHT and DO (Figure 4D).
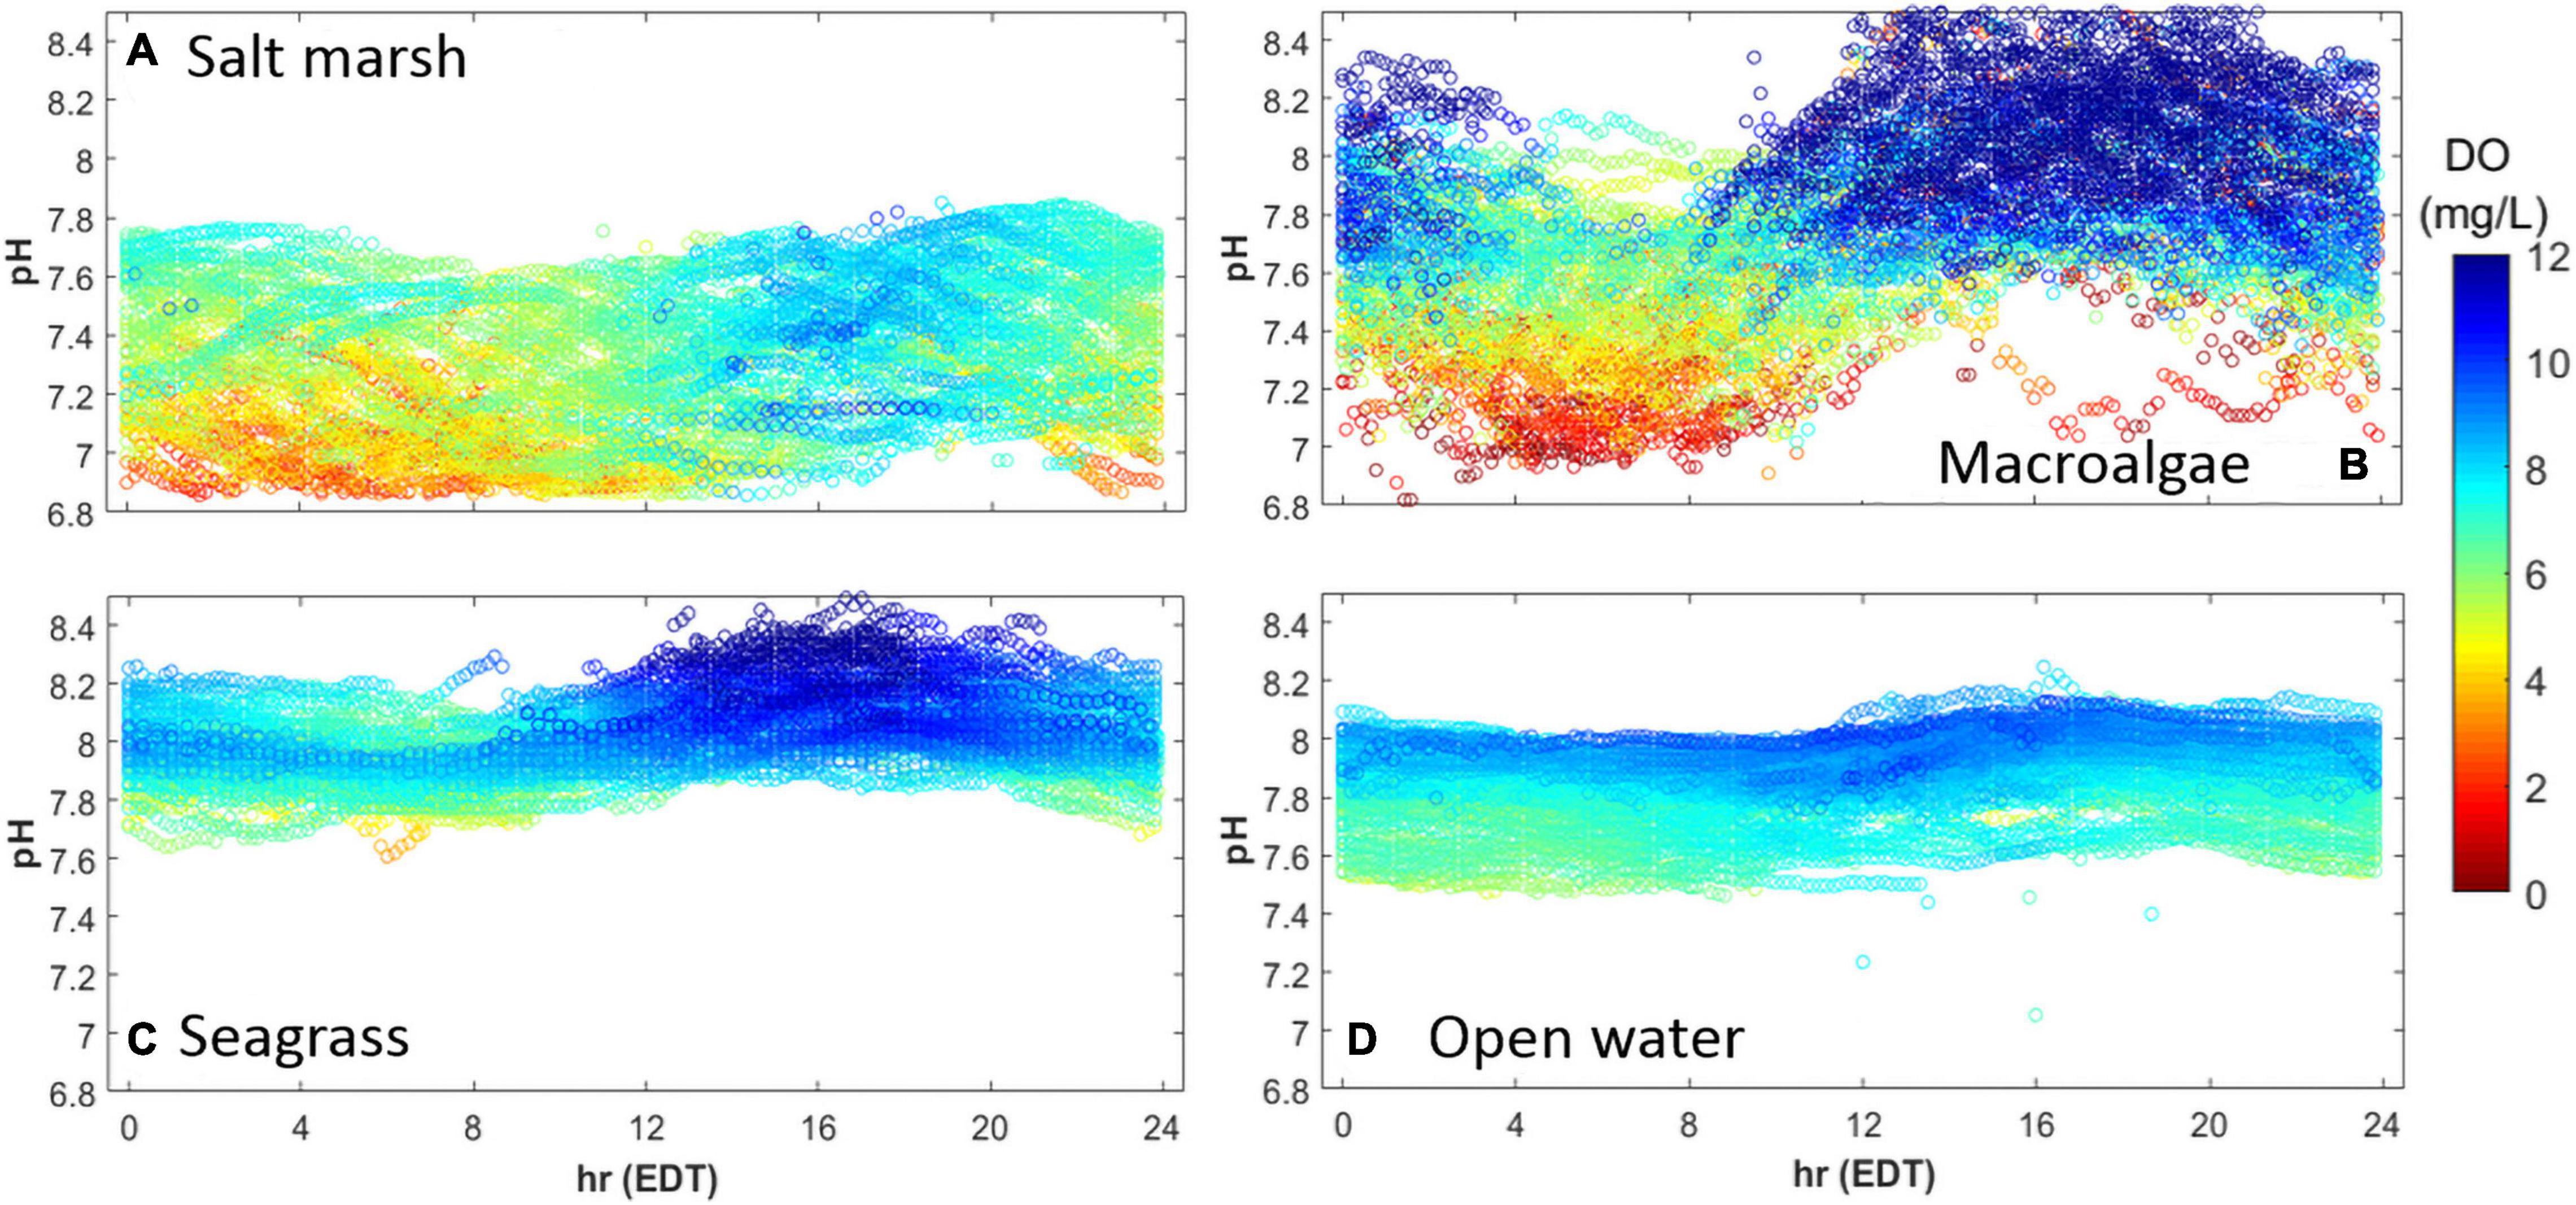
Figure 4. Diurnal patterns of pHT (y-axis) and DO (mg L–1; color) in an (A) salt marsh, (B) macroalgal dominated (Ulva sp.) region, (C) seagrass meadow, and (D) open water estuary, May–October, 2015. Sites identical to Figure 3.
Daily ecosystem metabolism rates further highlighted differences between habitats. The salt marsh was predominantly net heterotrophic (NEM < 0) with production exceeding respiration on only a handful of days over the deployment (Figure 5A). NEM averaged −2.22 ± 3.54 g O2 m–2d–1 within the salt marsh over the entire sampling season (Figure 5A). In contrast, the macroalgae station was primarily autotrophic (NEM > 0), but highly variable, ranging from >20 to −7 g O2 m–2d–1 (Figure 5B). The highest rates of net productivity were observed in June and July before decreasing and becoming slightly net heterotrophic by September (Figure 5B). The seagrass sites exhibited lesser variability than the macroalgae and salt marsh sites and was a more metabolically balanced ecosystem averaging 0.65 ± 1.73 g O2 m–2d–1 through the sampling season (Figure 5C). NEM increased and became slightly more variable during late summer, as the mean NEM before July 15 was 0.40 ± 1.11 and nearly doubled to 0.76 ± 1.93 g O2 m–2d–1 from mid-July through August (Figure 5C). By October, NEM within the seagrass meadow was consistently positive and less variable (Figure 5C). NEM was the least dynamic within the open water site, being slightly net heterotrophic, −0.13 ± 0.85 g O2 m–2d–1 (Figure 5D).
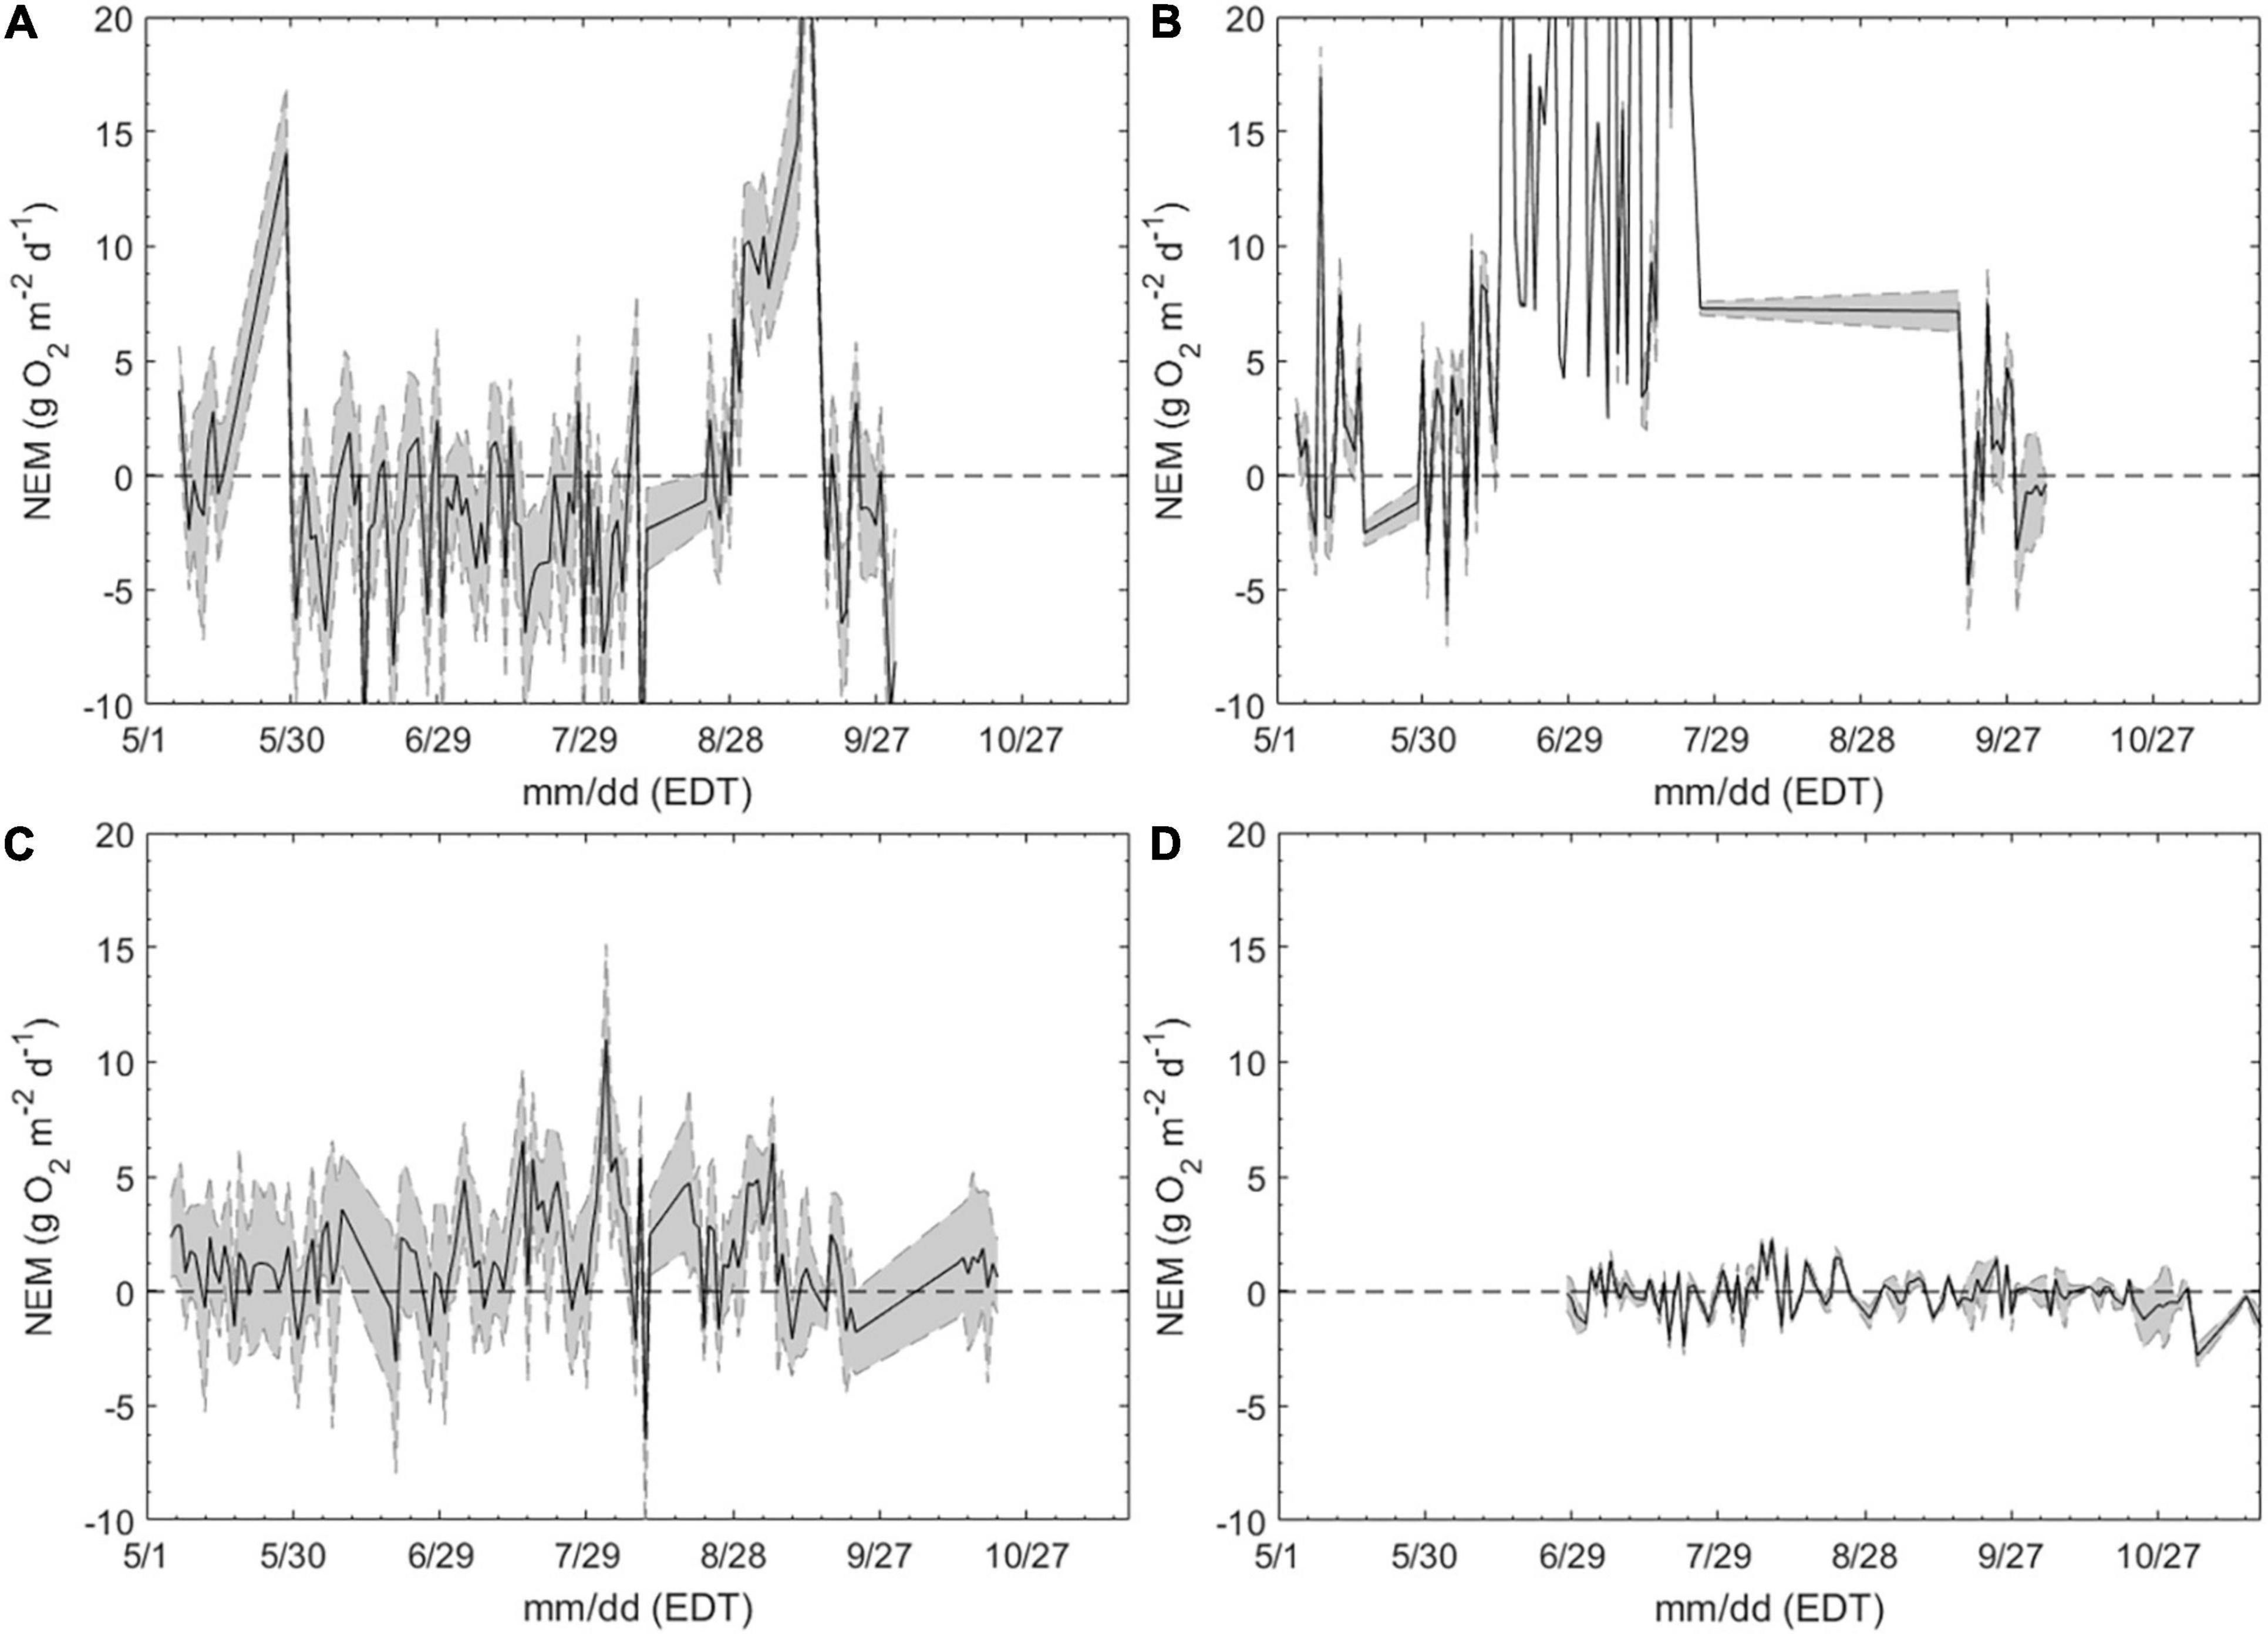
Figure 5. Daily net ecosystem metabolism (NEM; g O2 m−2 d−1) in a (A) salt marsh (SM-3), (B) a macroalgae bed (MA-1), (C) a seagrass bed (SG-1), and (D) an open water estuary (OW-1), May – October, 2015. Sites identical to Figures 3, 4. Shaded region bound by dashed lines indicates the calculated uncertainty due to the combined effects of lateral mixing and variability in gas transfer velocity.
Inter-annual, inter-month, and intra-habitat variability of seagrass metabolism was assessed by comparing month-by-month, diurnal dynamics of DO and pHT in two seagrass meadows (SG-1 in 2015 and SG-2 in 2016; Figure 1). At both sites, DO and pHT showed consistent diurnal patterns that intensified through summer, with site two displaying a larger degree of diel variation during the sampling period (Figure 6). Through the summer, the second seagrass site displayed stronger daytime super-saturation of DO (>10 mg L–1) and during August and September, this site frequently displayed pHT and DO values below 7.7 and 5 mg L–1 in the early morning hours (Figure 6).
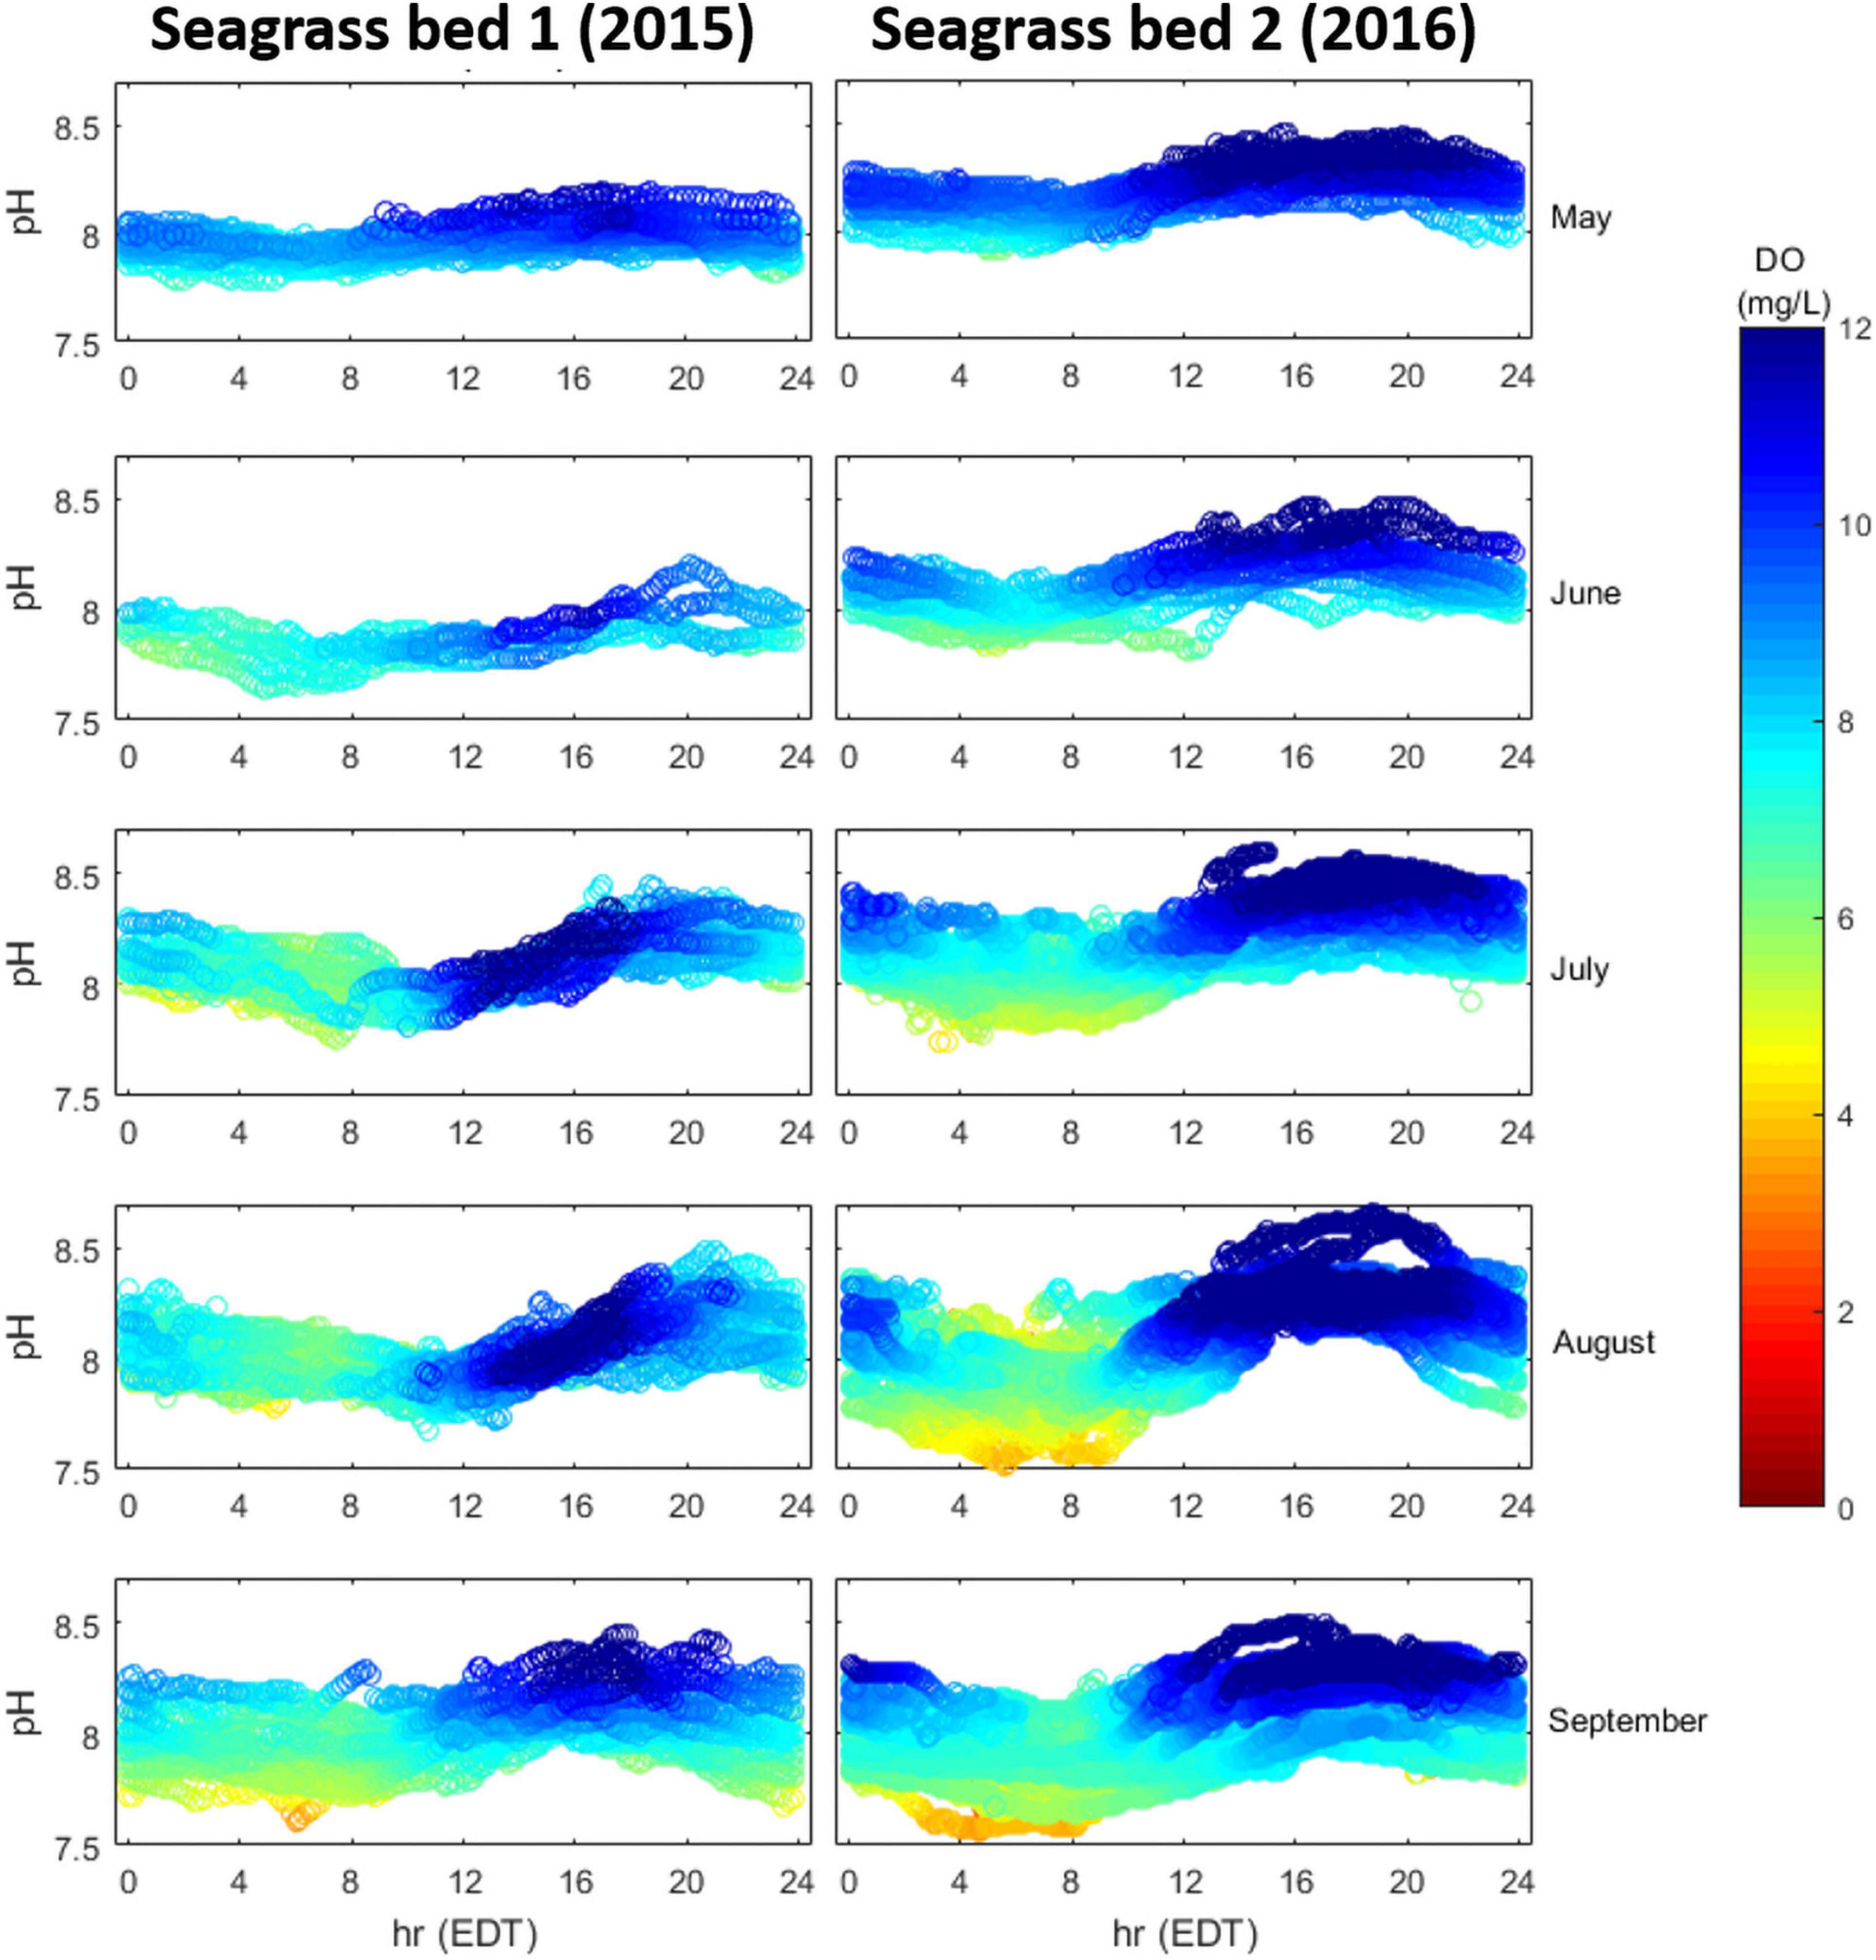
Figure 6. Diurnal patterns of pHT (y-axis) and DO (mg L–1; colormap) in two seagrass meadows (SG-1 and SG-2), May–September, 2015 and 2016, respectively.
Dynamics of Carbonate Chemistry
Distinct differences in the carbonate system and total alkalinity (TA) were apparent across habitats (Figure 7). The salt marsh (n = 15) and seagrass (n = 25) sites had similar medians with respect to TA (∼2150 μmol kg–1 SW) and a large seasonal range (Figure 7A and Supplementary Table 3; 600 and 550 μmol kg–1 SW, respectively) where the seagrass site had a greater salinity range and higher peak salinity (Supplementary Table 3). TA at the macroalgae station was significantly lower (p < 0.001; Supplementary Table 3; Figure 7A; median ∼1850 μmol kg–1 SW, n = 9) and reached a minimum of ∼1600 μmol kg–1 SW (Figure 7A). The macroalgae station also had the lowest salinity compared to all other sites sampled, decreasing to 24 during periods of intense precipitation (Supplementary Table 3). TA at the open water site was more consistent, remaining between ∼1900 and ∼2000 μmol kg–1 SW (Figure 7A; n = 19) and was also significantly lower than the salt marsh and seagrass habitats (p < 0.001; Supplementary Table 3), but the mean was not statistically distinguishable from the macroalgae site (p > 0.05; ANOVA; Bonferroni test; Supplementary Table 3). DIC exhibited patterns similar to TA although the salt marsh had a significantly larger range and higher median than the other three sites (p < 0.0001; Supplementary Table 3; Figure 7B; range ∼700 μmol kg–1 SW, median ∼ 2100 μmol kg–1 SW). The larger DIC range and higher values at the salt marsh site were, at least in part, due to greater metabolic CO2 fluxes emanating from the salt marsh (Figure 7C). Mean pCO2 levels in the salt marsh were 2,315 ± 1,228 μatm, significantly higher than all other sites (p < 0.0001; Supplementary Table 3; Figure 7C). The pCO2 levels displayed large variation at the macroalgae location, fluctuating from <200 to 2,000 μatm (mean = 1,060 ± 637 μatm) and were lowest at the open water and seagrass sites (mean = 500 ± 140 μatm and 498 ± 184 μatm, respectively; Figure 7C). Although the macroalgae site was often undersaturated with respect to aragonite (ΩAr < 1), it also exhibited the largest range (<0.5–>4.5), whereas the seagrass bed was always saturated (ΩAr 1–3.5) and had the highest ΩAr while the site was almost always undersaturated (ΩAr < 1; Figure 7D). Mean ΩAr levels within the seagrass beds and open water sites were significantly higher than the salt marsh site (p < 0.001; Supplementary Table 3) and ΩAr within the seagrass beds was also significantly higher than the macroalgae site (p < 0.01; Supplementary Table 3). The Revelle factor (Rf) can be useful for assessing an environment’s ability to buffer against increasing CO2 with a higher Rf yielding a lower buffering capacity. Increases in Rf indicate a decreased buffer capacity allowing for the fractional change in pCO2 in relation to the fractional change in DIC to increase (Revelle and Suess, 1957; Egleston et al., 2010). The Rf exhibited by the salt marsh and macroalgae-dominated sites were significantly higher than those of seagrass and open water sites (p < 0.05; Supplementary Table 4; Figure 7E). The macroalgae station had a much larger range in which the Rf decreased to <8 and exceeded 18 (Figure 7E). In contrast, the seagrass and open water location were between 10 and 16 (Figure 7E).
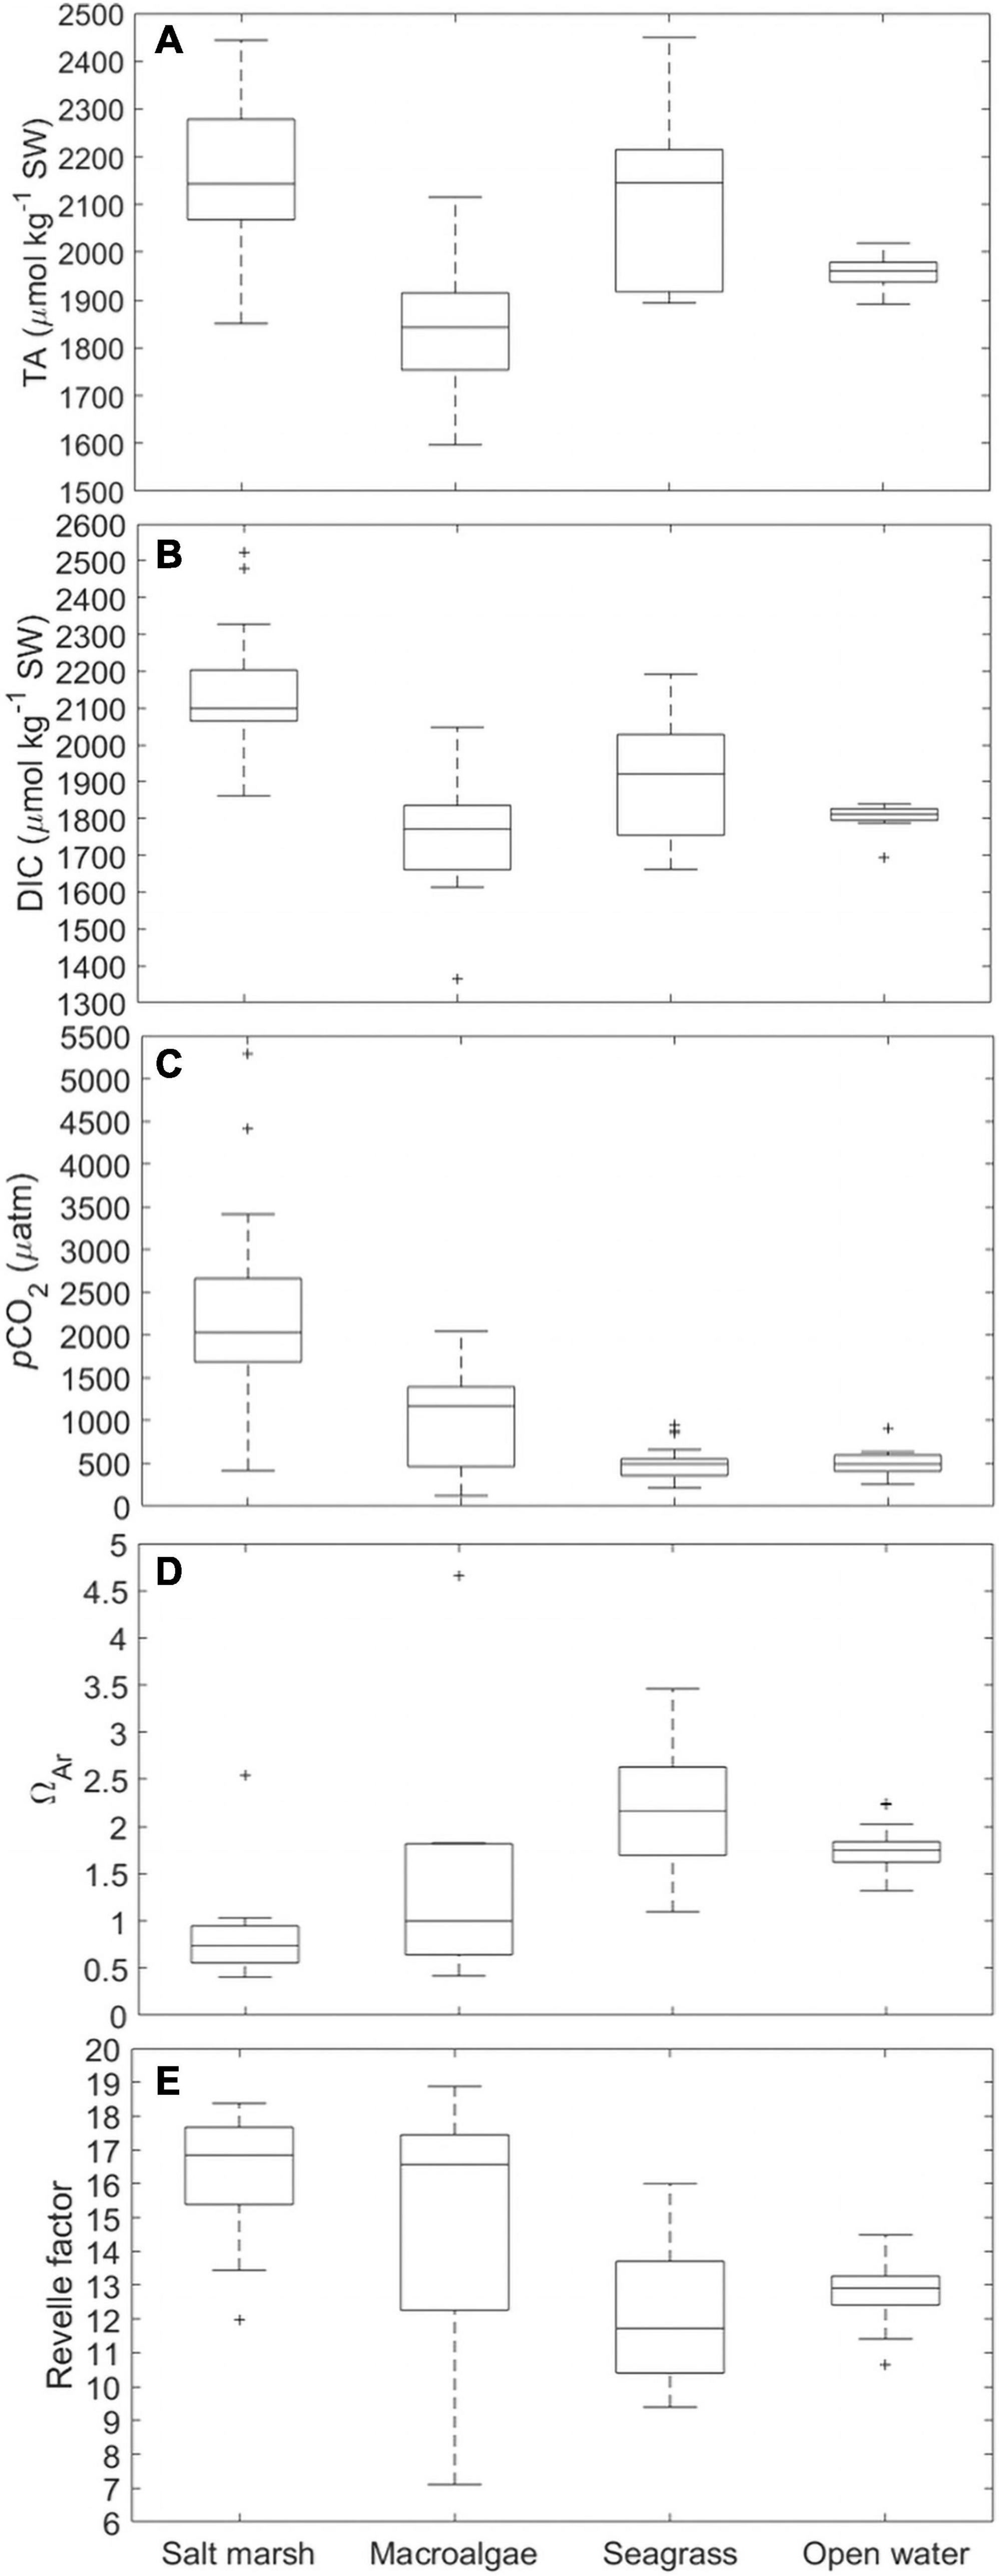
Figure 7. Box and whisker plots of (A) TA (μmol kg–1 SW), (B) DIC (μmol kg–1 SW), (C) pCO2 (μatm), (D) ΩAr, and (E) Revelle factor for four habitat types (SM-3, MA-1, SG-1, OW-1). On each box, the central mark indicates the median, and the bottom and top edges of the box indicate the 25th and 75th percentiles, respectively. The whiskers extend to the most extreme data points not considered outliers, and the outliers are plotted individually using the “+” symbol.
High-Resolution Mapping of Coastal Habitats
The spatial variability within each habitat was examined via high-resolution, horizontal mapping. Across the open waters of the Peconic Estuary (Great Peconic Bay) in August, DO ranged from 6.5 to 8.7 mg L–1, while pHNBS ranged from 7.82 to 7.98 (Figure 8) with values generally increasing from west to east toward the mouth of the estuary. Levels of pCO2 ranged from 580 to 700 μatm (Wallace, unpublished data). In contrast, the macroalgae and salt marsh along the northern and southern shores in the same estuary, respectively, were more spatially heterogeneous. Daytime DO within the macroalgae region ranged from >6.5 mg L–1 at the mouth of the cove to <5 mg L–1 toward the head while daytime pHNBS ranged from 7.48 within the cove to 7.82 at the mouth (Figure 8). Within the salt marsh region, similar spatial differences were detected as daytime DO ranged between 5.6 and 6.2 mg L–1 within the marsh to >7 mg L–1 in the tributary exchanging with the Peconic Estuary, a total distance of only ∼400 m (Figure 8). The pHNBS trends were similar with daytime pHNBS ranging from 7.6 to 7.7 within the marsh and exceeding 7.8 within the deeper navigational channel toward the estuary (Figure 8). The salt marsh pHNBS and DO values during the cruise were slightly elevated compared to the continuous measurements in this system as the salt marsh cruise was conducted during the late afternoon when DO and pHNBS values are generally at their peak (Figure 4A; O’Boyle et al., 2013; Baumann et al., 2015; Wang et al., 2016). In addition, sampling was conducted during a flood tide, two conditions that increase both pHNBS and DO.
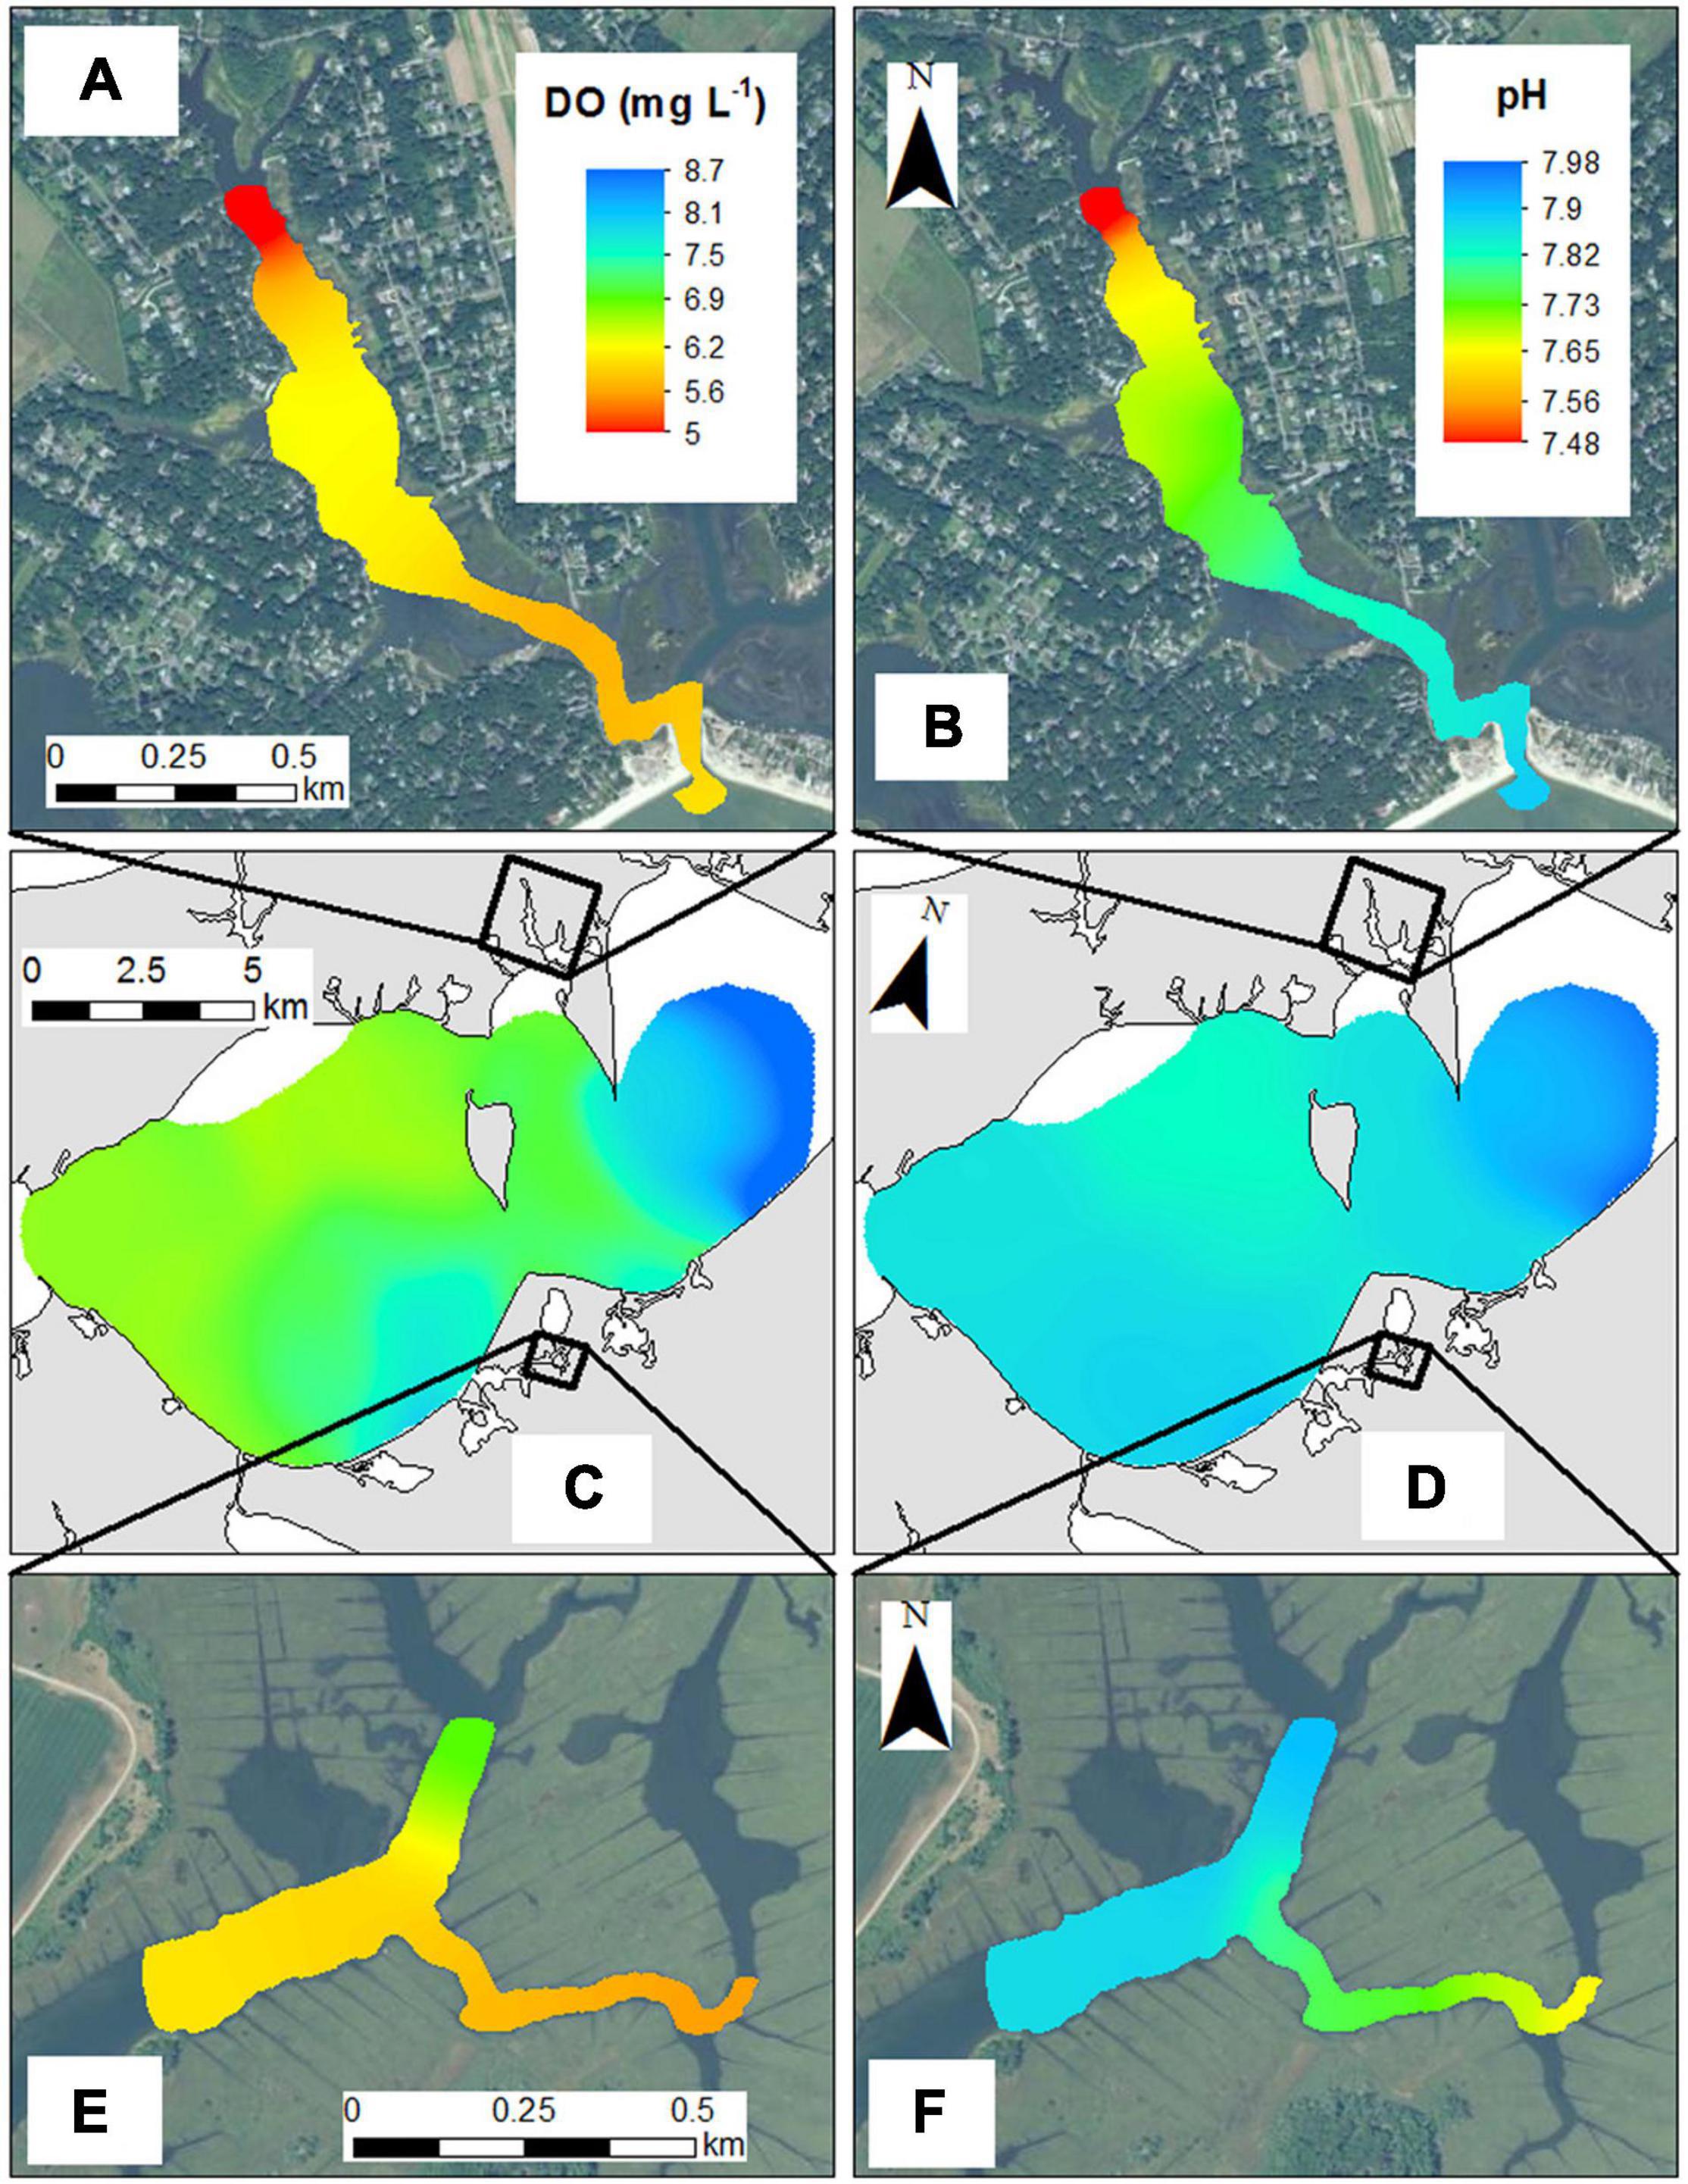
Figure 8. High resolution surveys of (A) DO (mg L–1) within the macroalgae (MA-1) sampling region, (B) pH within the macroalgae (MA-1) sampling region, (C) DO (mg L–1) in the Peconic Estuary (OW-1), (D) pH in the Peconic Estuary (OW-1), (E) DO (mg L–1) within a salt marsh habitat (SM-3), and (F) pH within a salt marsh habitat (SM-3). All cruises were conducted in August.
The seagrass bed (SG-1) in Shinnecock Bay displayed sharp spatial differences in pCO2 (Figure 9). Surface waters of Shinnecock Bay in August had pCO2 levels that ranged from 550 to 600 μatm (Figure 9). Within the seagrass bed, regions with a depth <1 m and dense patches of seagrass had pCO2 levels as low as 400 μatm whereas deeper regions with no seagrass had pCO2 exceeding 700 μatm (Figure 9).
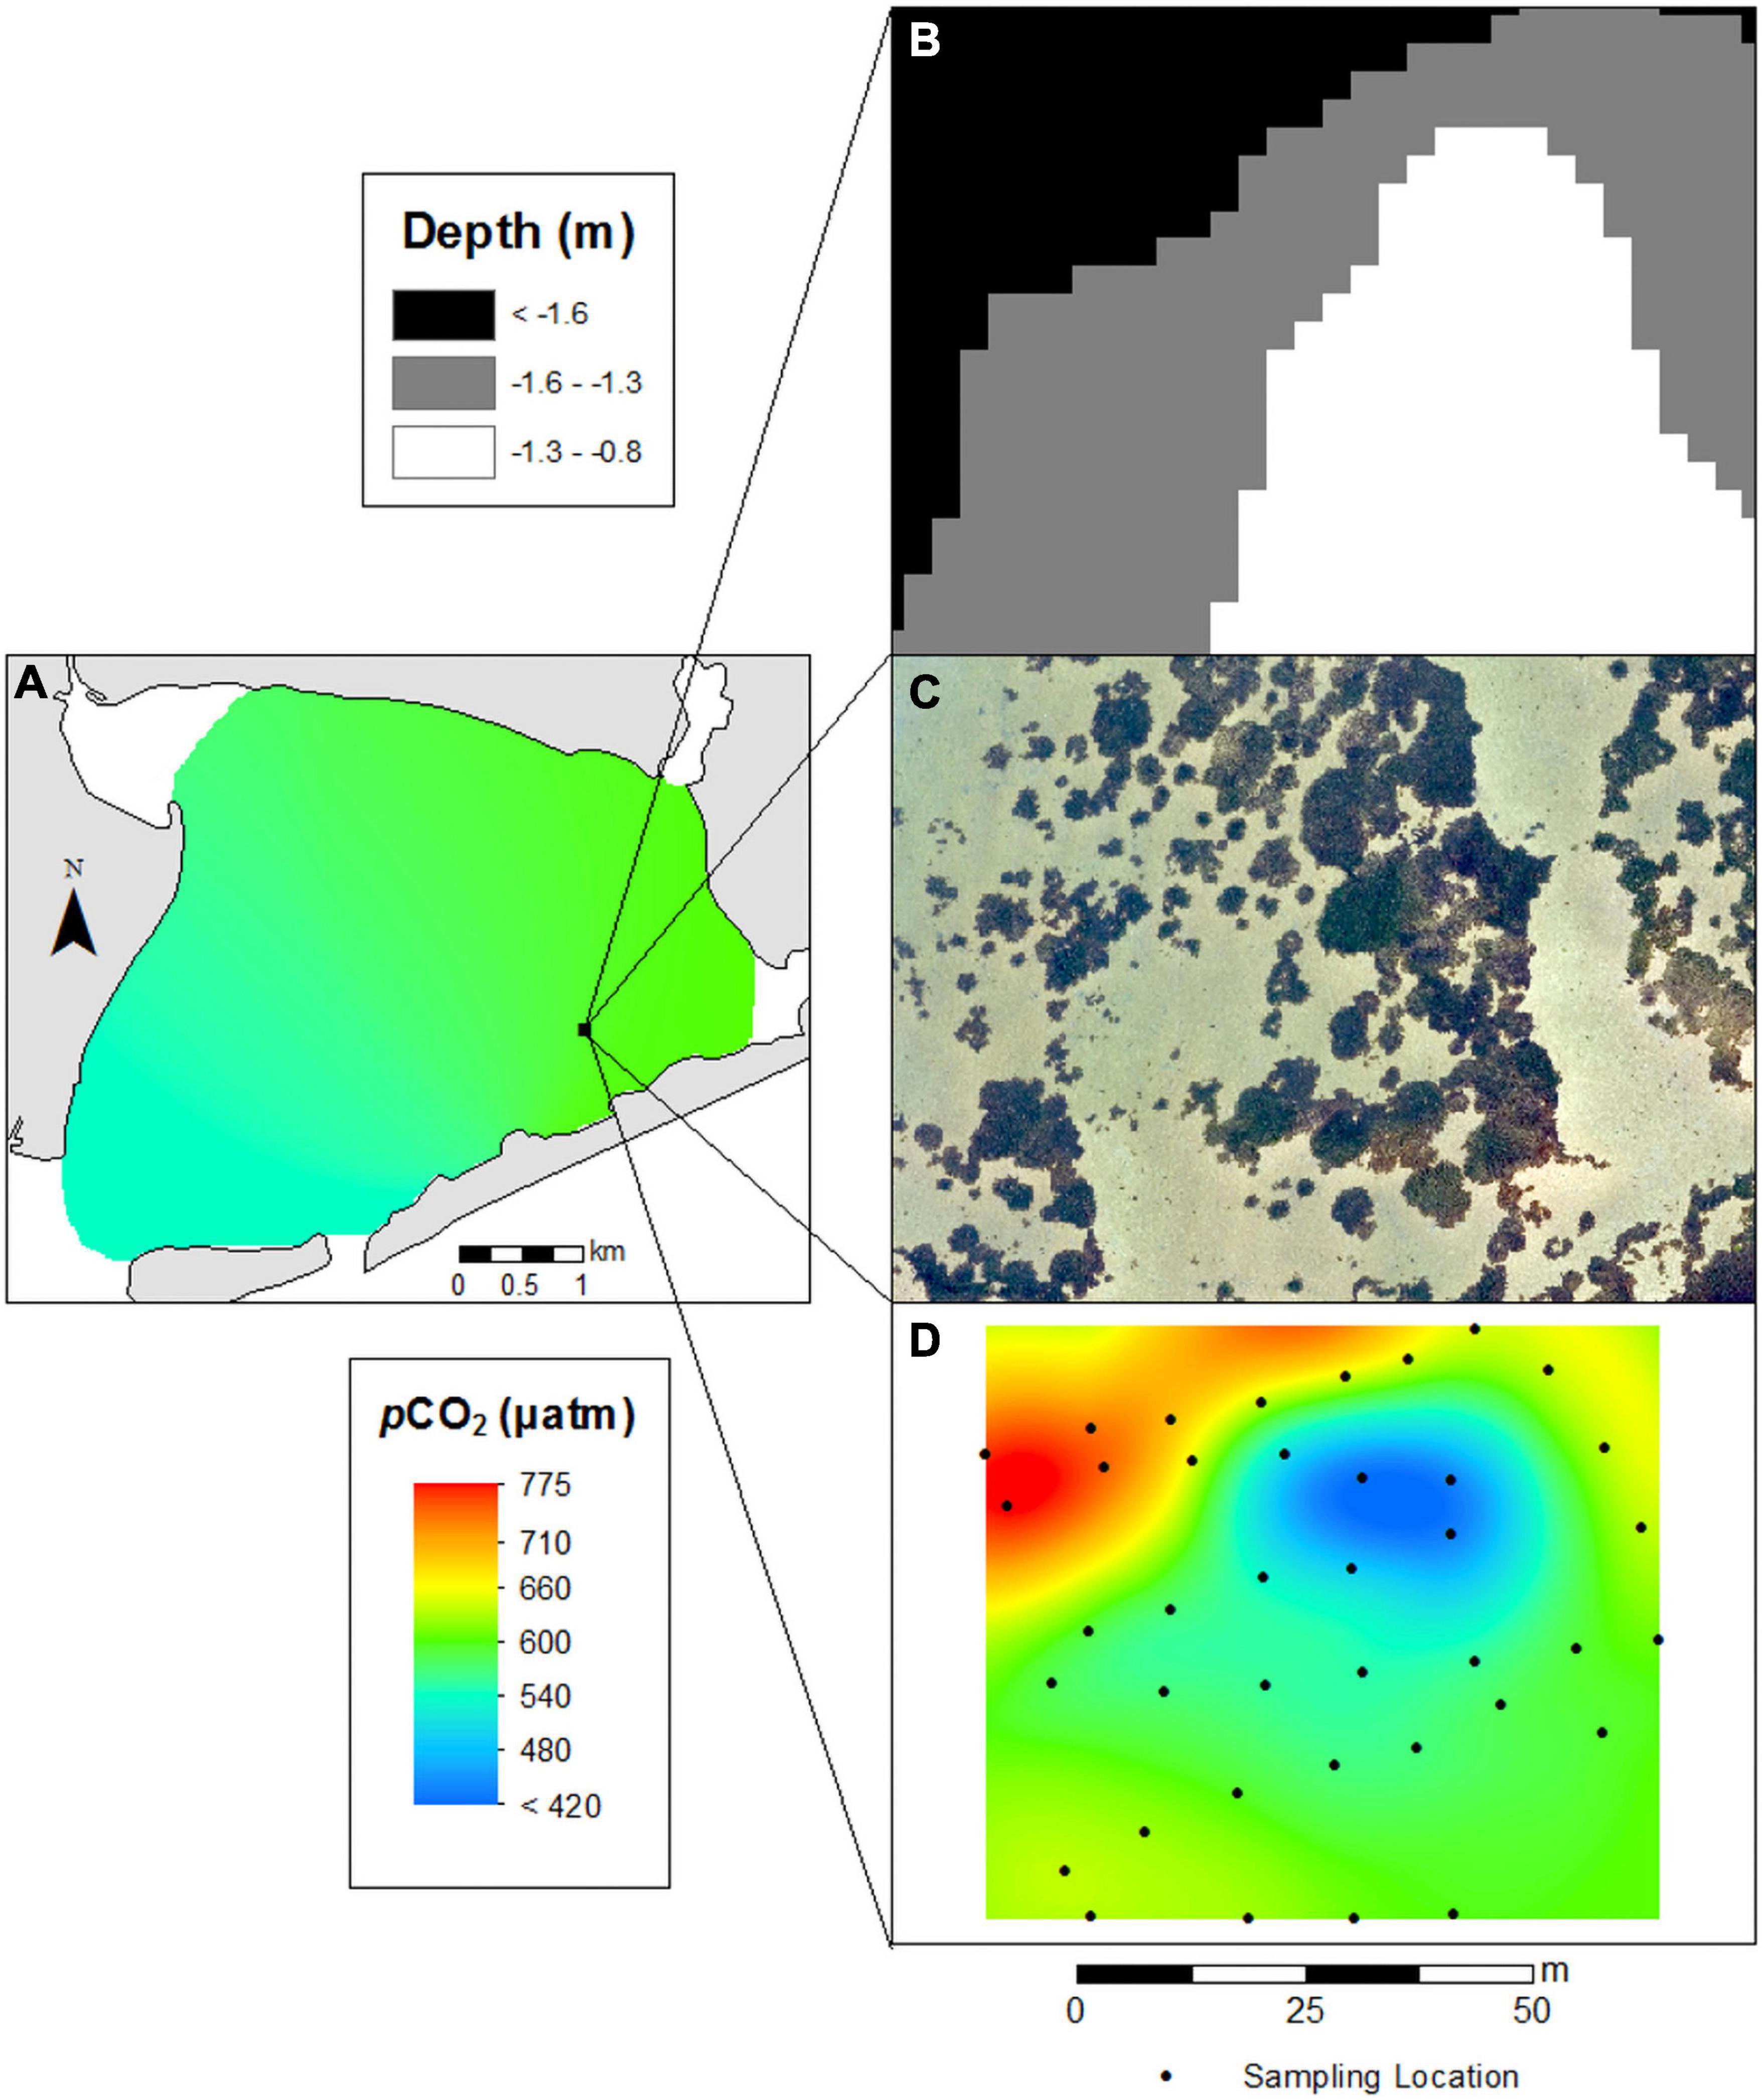
Figure 9. (A) High resolution survey of pCO2 in eastern Shinnecock Bay. (B) High resolution depth measurements (3 m horizontal resolution), (C) high resolution drone imagery, and (D) pCO2 measurements sampled at 10 cm above the sediment-water interface encompassing a 6300 m2 region surrounding seagrass site SG-1.
Discussion
High frequency pHT and DO measurements coupled with discrete sampling across four distinct coastal habitats revealed stark differences in carbonate chemistry and ecosystem metabolism during this study. High-resolution sampling conducted across each habitat highlighted acute spatial variability present within each environment. While each habitat displayed similar relative diurnal patterns of pHT and DO, the intensity of variance of these conditions differed significantly among habitats. Spring through fall is a period of maximal metabolic rates in estuaries (D’Avanzo et al., 1996; Caffrey, 2004; Middelboe and Hansen, 2007b; Baumann et al., 2015). Such rates will interact with other factors such as volume of estuarine waters, residence time, and tidal forcing to shape differing local extrema of DO and pHT. The coastal habitats examined here are representative of many temperate estuaries that harbor juvenile finfish and shellfish (Nixon and Oviatt, 1973; Sogard and Able, 1991; Roman et al., 2000; Beck et al., 2001; Duffy, 2006), making an understanding of the DO and carbonate chemistry dynamics within these systems important for fisheries management and aquaculture practices (Wallace et al., 2014; Tomasetti and Gobler, 2020).
Seasonal Inter-Habitat Variability in Net Ecosystem Metabolism and Carbonate Chemistry
The open water habitat of this study was the most metabolically balanced region (Figure 5D) and displayed temporal stability (Figures 3G,H, 4D) and spatial homogeneity (Figure 8) representative of tidally dominated estuaries where vertical mixing prevents stratification of the water column (Hardy, 1976; Fischer et al., 2013). This system was slightly net heterotrophic over the course of this study (mean NEM = −0.14 ± 0.9) as sampling was conducted primarily during summer months when respiration rates are maximal in temperate coastal systems (D’Avanzo et al., 1996; Iriarte et al., 1997; Tait and Schiel, 2013) and the spring phytoplankton bloom has since subsided in Long Island coastal waters (Riley and Conover, 1967; George et al., 2015). Both pHT and DO ranges were consistent with other estuarine or near-shore environments that have been examined on both the east and west coast of the United States (Caffrey, 2004; Hofmann et al., 2011; Baumann and Smith, 2018), but certainly was greater than open ocean environments (Hofmann et al., 2011; Sutton et al., 2019). Correspondingly, the Rf is in the range expected for this class of environments (Feely et al., 2018).
The seagrass meadows examined here exhibited slightly larger diurnal ranges of both pHT (0.34 vs. 0.25) and DO (4.51 vs. 2.19 mg L–1) compared to the open water site (Table 1 and Figures 4C,D) and were generally net autotrophic over diel timescales from the late spring through the early fall (Table 1 and Figures 5C, 6). The seagrass systems were also distinctive in hosting the lowest levels of pCO2 (<400 μatm) and the highest ΩAr (ΩAr > 3), conditions that would make them localized refuges against coastal ocean acidification (Hendriks et al., 2014; Wallace et al., 2014; Camp et al., 2016; Pacella et al., 2018). During warm and calm conditions, seagrass meadow photosynthesis will locally increase DO and decrease pCO2 levels above and below the solubility in the water column, respectively (Dennison, 2009). This would account for the higher increase in DO and pHT at seagrass bed 2, as this region is more sheltered from prevailing southwesterly winds that are common on Long Island during the summer months (Blumberg and Galperin, 1990). In addition, while both seagrass meadows were the same species (Z. marina), a greater macroalgal biomass at seagrass bed 2 resulted in more elevated community photosynthetic rates thus resulting in higher DO and pHT levels (Jackson, 1987; Beer and Koch, 1996; Chung et al., 2011). Furthermore, the calmer conditions coupled with the seasonal decomposition of this mixed macrophyte community contributed toward the lower DO and pHT levels during the late summer months.
Diel Inter-Habitat Variability in Net Ecosystem Metabolism and Carbonate Chemistry
In contrast to the open water and seagrass sites, the salt marshes and the macroalgae sites exhibited significantly larger diel ranges in both pHT and DO throughout the season (Table 1 and Figures 5A,B) with these parameters being tightly coupled at both sites (ρ = 0.674 and 0.837, p < 0.0001). Although both locations tidally exchange with the adjacent Peconic Estuary, strong metabolic processes within these habitats drove significant variation on diel timescales (Wootton et al., 2008). In addition to rapid rates of photosynthesis and respiration, restricted exchange with the larger Peconic Estuary maximizes the influence of these metabolic processes on water column chemistry (Wallace et al., 2014).
During peak daylight hours, both pHT and DO were consistently depressed within the salt marsh (pHT < 7.8, DO < 8 mg L–1), resulting from the cumulative effects of both biological respiration (Turner, 1978; Burnett, 1997) and tidal exchange (Gardner and Gorman, 1984; Baumann et al., 2015). While the signature of diurnal metabolism was clear, tidal exchange played a lesser, but significant role as pHT and DO tended to increase during increasing tidal height (ρ = 0.242 and ρ = 0.357, p < 0.0001 for both). Similarly, Baumann et al. (2015) reported that during the summer months in a Long Island salt marsh, pHT and DO declined during the ebbing tide whereas the flooding tide increased pHT and DO due to lower biological activity within an adjacent open water estuarine system (Long Island Sound). In addition, hypoxic and acidified conditions are maximized when low tides occur during peak hours of net heterotrophy (Figure 4C; ∼4:00–8:00 EDT). Although photosynthetic rates of Spartina in salt marshes are high, most oxygen within blades is lost to the atmosphere and oxygen produced from the root system is rapidly reduced within the sediment (Gleason et al., 1982). Hence, the net transport of oxygen from the marsh to the water column is small and confined to higher tidal cycles which is distinct from other estuarine submerged aquatic vegetation studied here.
In contrast to salt marshes, the shallow macroalgae-dominated system was net autotrophic throughout most of the season, although periods of net heterotrophy became more common late in the season and under extreme tides. The tidal range at the macroalgae site was ∼2 m (0.4–2.4 m) and as water depth decreased below 1.4 m, both pHT and DO reached extreme values. For example, DO only exceeded 200% saturation and only decreased below 50% saturation when tidal height was <1.4 m (Figure 10). In addition, these lower tidal periods were the only periods in which pHT exceeded 8.4 and when both hypoxic and acidified conditions were observed (DO < 3 mg L–1 and pHT < 7.4; Figure 10). Super saturated O2 conditions and elevated pHNBS (pHNBS > 9) have been synchronously observed in other shallow macroalgal dominated marine ecosystems (Howland et al., 2000; Menéndez et al., 2001; Middelboe and Hansen, 2007b), but such shallow, highly productive habitats are not ordinarily associated with acidification and hypoxia. Coastal macroalgal habitats have long been considered nutrient buffer zones that can alter shallow water biogeochemistry and exchange solutes at the sediment-water interface (Duarte et al., 2013; Sundbäck and McGlathery, 2013). In shallow tidal systems, such as described here, large macroalgal aggregations can intensify water column DO and pHT extremes during lower tide cycles on diel and seasonal timescales. During summer months when macroalgal biomass accumulates in calm, shallow water habitats, DO fluctuations can be large and DO concentrations are high (Middelboe and Hansen, 2007b). At the end of the summer and/or during extreme heat waves, macroalgal communities decay, creating the potential for hypoxia, anoxia, and acidification via respiration (Apinis et al., 1956; Han and Liu, 2014; Lenzi, 2014).
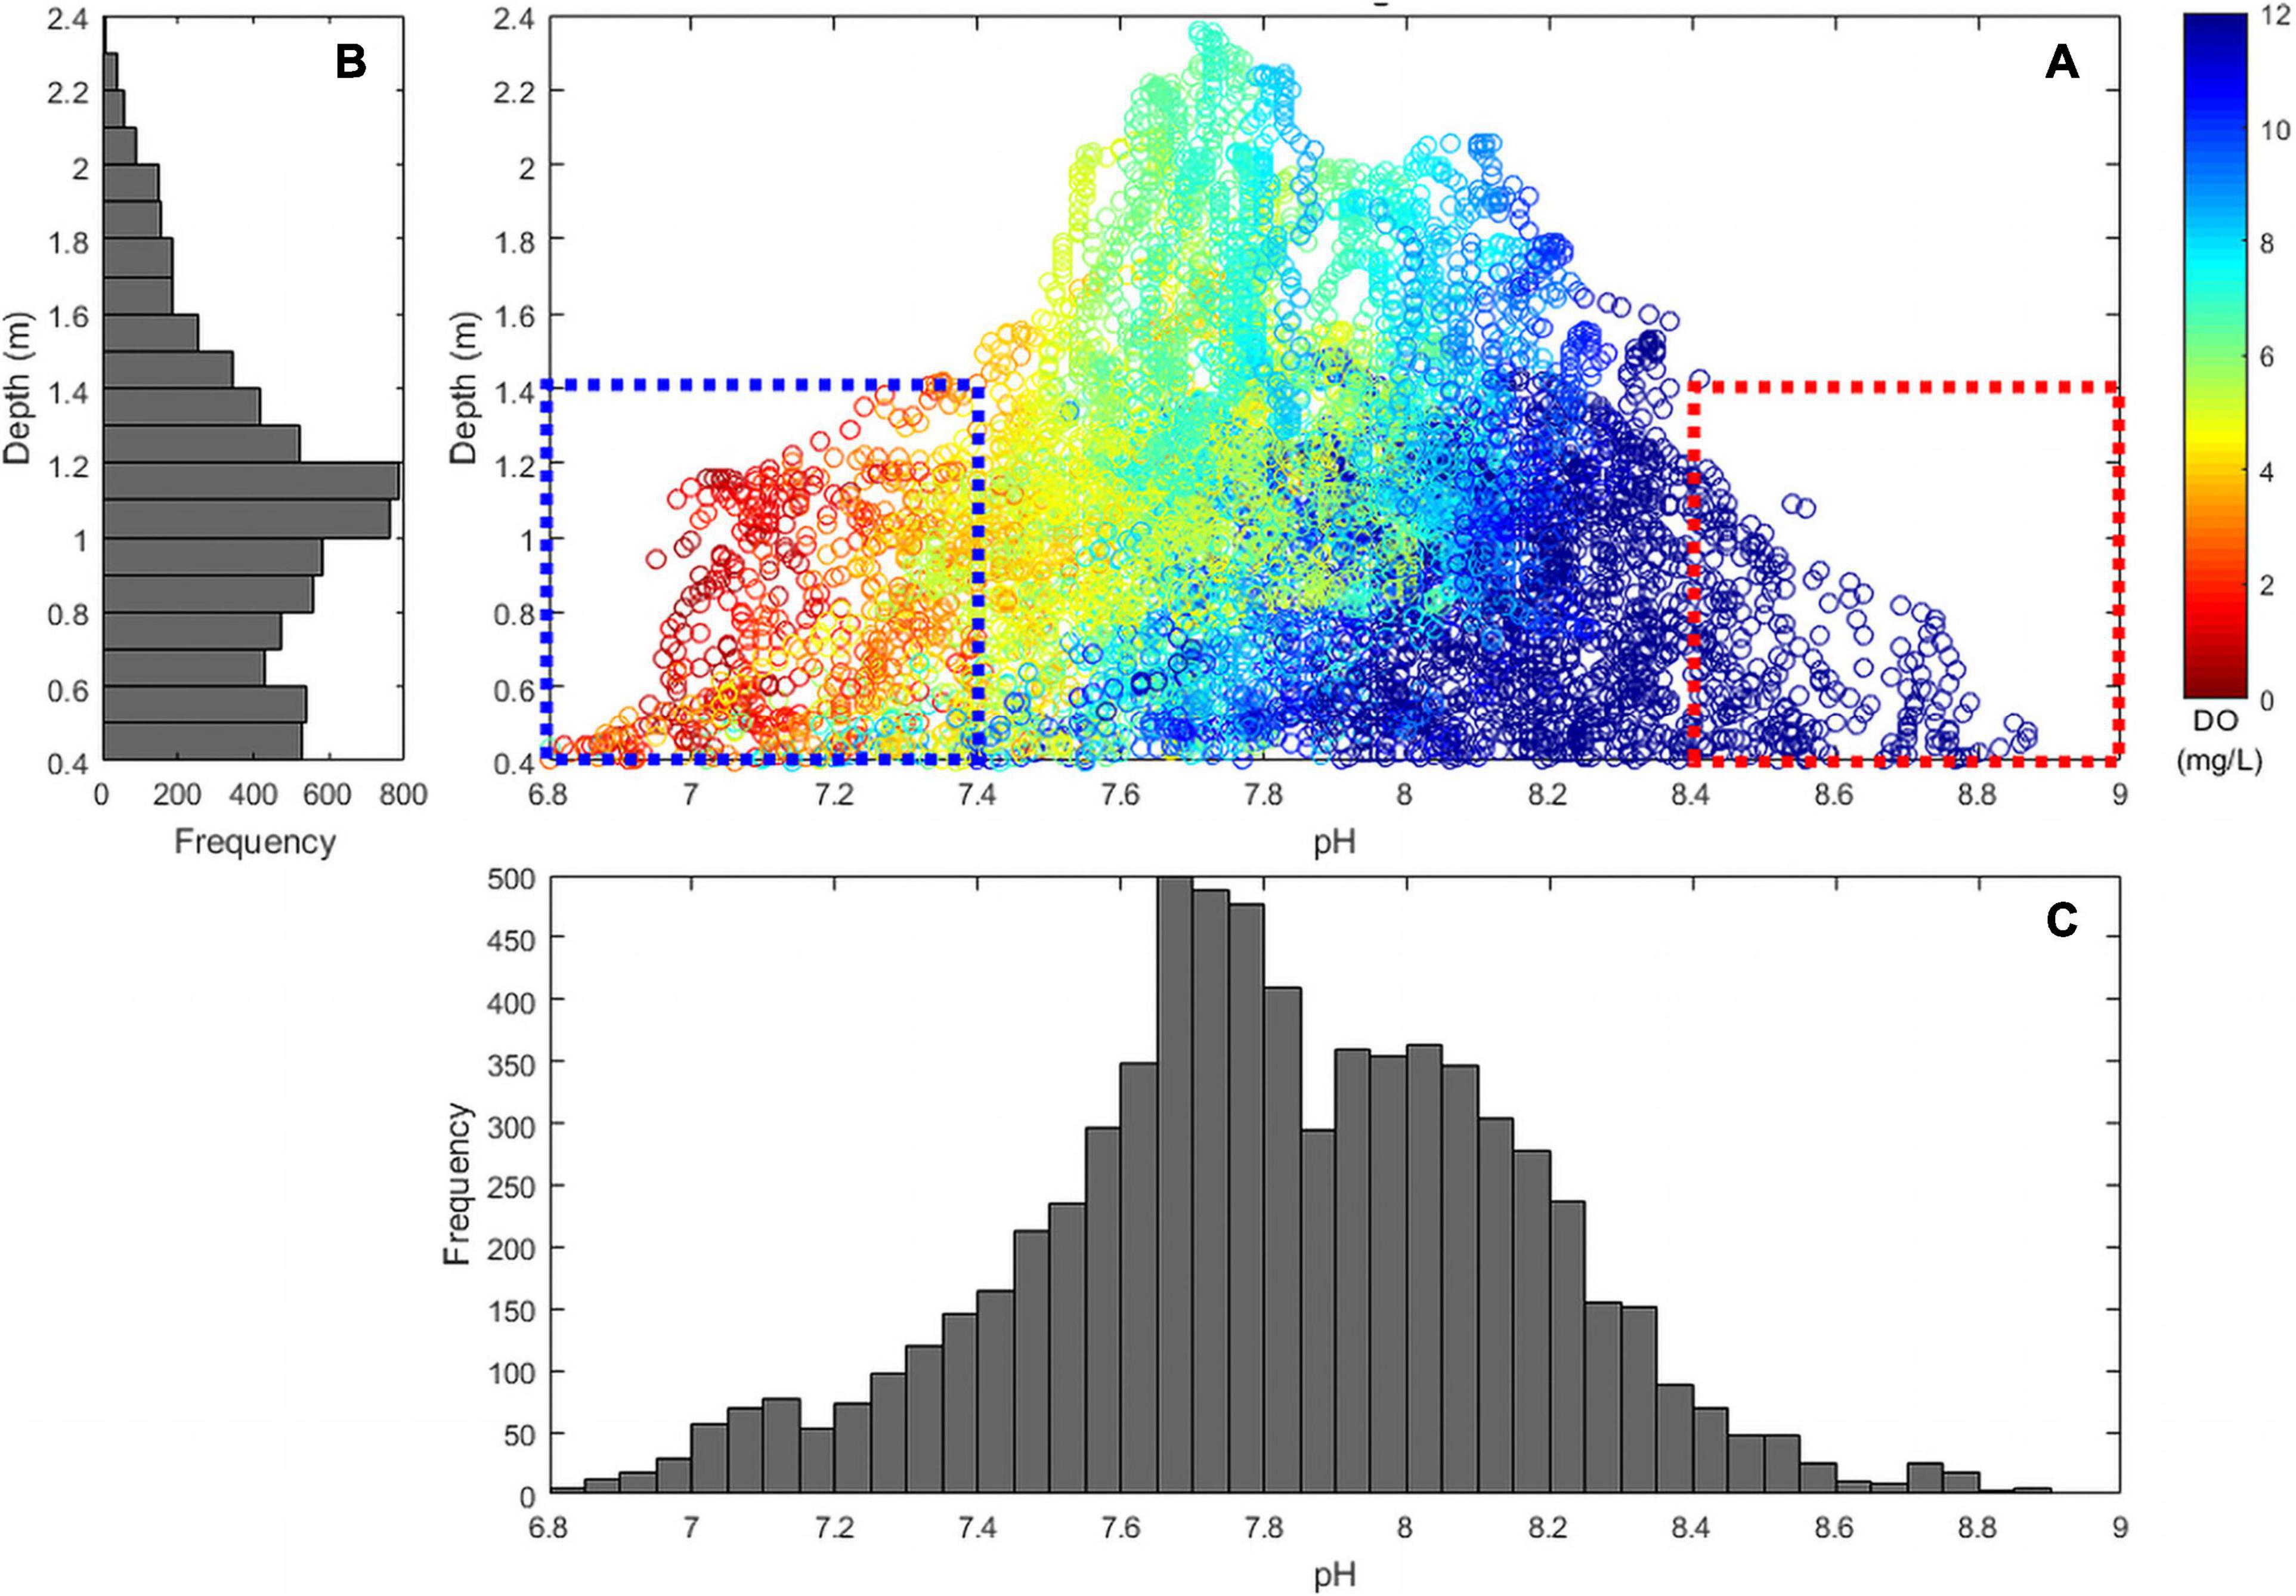
Figure 10. Comparison of (A) depth (y-axis), pHT (x-axis), and DO (mg L–1; color) in a macroalgal dominated (Ulva sp.) region (MA-1), May–October, 2015. Blue dashed box indicates low pHT and DO during low tides and red dashed box indicates high pHT and DO during low tides. Frequency distribution of (B) depth and (C) pHT samples are indicated by adjacent histograms.
Buffer Capacity in Distinct Coastal Habitats
As CO2 concentrations increase seasonally in coastal zones (Wallace et al., 2014), buffering capacity has become an important ecosystem service in estuaries. Each habitat examined here differed in their buffering capacities that changed seasonally and were modified through biological activity, salinity, and variations in TA and DIC. TA was highest within the salt marsh and seagrass locations (TA > 2400 μmol kg–1 SW; Figures 7A,B) with seagrass having significantly lower DIC (DIC < 1700 μmol kg–1 SW) and pCO2 (<400 μatm) due to increased carbon uptake and its closer proximity to ocean water with higher salinity (and thus TA) and lower CO2 concentrations. All sites examined during this study, with the exception of the open water site, had large ranges in Rf likely associated with biologically mediated CO2 uptake and drawdown. The Rf in ocean surface waters generally ranges from 8 to 18 (Feely et al., 2018) and these values can provide valuable insight into the discrete responsiveness of pHT, TA, DIC, and ΩAr when considering future changes in pCO2 (Egleston et al., 2010). Although the mean Rf at the open water site (mean Rf = 13) was lower than both the salt marsh (mean Rf = 17) and macroalgae site (mean Rf = 16.5; p < 0.0001 and p < 0.05, respectively), the open water site never decreased below 11 and exhibited a narrow range (11–14; Figure 7). Considering the lower buffer capacity of the Peconic Estuary and the limited influence of biological activity, increases in CO2 uptake will both accelerate and intensify acidification within this larger, open water system. In addition to the potential for increased CO2 uptake via the atmosphere, further increases in CO2 could emanate via transport of carbon from wetlands and/or areas with dense stands of macrophytes (Cai, 2011; Najjar et al., 2018) and with a lower buffer capacity, as pCO2 increases, Rf would also increase, increasing the likelihood of this estuary being inhospitable for bivalve populations (Grear et al., 2020).
While TA and DIC are key indicators of buffering capacity and are often intimately linked in estuaries (Hagens et al., 2015), intense metabolic activity can decouple these pools, altering habitat buffering and suitability for calcifying organisms. For example, TA and DIC within the salt marshes became decoupled in the late summer (Supplementary Tables 2, 3), likely associated with increased anaerobic activity. Higher TA was observed when samples were collected at lower tidal levels suggesting TA production via anaerobic processes (Wang and Cai, 2004) such as the net production of bicarbonate (HCO3–) by sulfate reducing microorganisms (Berner et al., 1970; Hu and Cai, 2011) and TA generation via denitrification (Hu and Cai, 2011). Although ebbing tides from salt marshes yielded low pHT water, this water will also have a higher buffering capacity compared to higher pHT waters observed during flood tides (Wang et al., 2016). This increased buffering capacity during lower tidal states coupled with increased oxygen production during higher tides when marsh grasses were submerged, resulted in occasional late summer net autotrophy (Figure 5A) and may further buffer against increased acidified conditions commonly observed in Northeast United States estuaries during the late summer (Wallace et al., 2014). A decoupling of DIC and TA was also observed in the late summer/early fall at the macroalgal dominated site during periods of pCO2 undersaturation and decreasing HCO3– concentrations, as CO32– concentrations increased, resulting in a transformed DIC speciation (Supplementary Table 3). When pCO2 levels reached a minimum (<200 μatm), a drawdown in HCO3– was also evident, indicating the potential utilization of HCO3– when pCO2 levels were low to support increased photosynthetic rates (Axelsson et al., 1995; Rautenberger et al., 2015). This seemed to be further enhanced during periods of increased solar radiation when DIC concentrations decreased as light intensity increased, indicating increased photosynthetic rates (Nejrup et al., 2013). TA was consistently lower at the macroalgal location and this was primarily due to the close proximity to the head of the creek where freshwater input decreased both salinity and TA (Supplementary Table 2), especially after heavy precipitation events where TA variations associated with freshwater addition can account for up to 80% of TA variability (Lee et al., 2006). Additionally, increased HCO3– uptake by macroalgae may have contributed to decreased TA via release of H+ by macroalgae via active extrusion pump as pHT in the surrounding water column reaches extreme levels (Uusitalo, 1996; Axelsson et al., 2000).
Intra-Habitat Variation in DO, pH, and pCO2
Beyond inter-habitat differences revealed during this study, high resolution sampling showed significant intra-habitat variation. More restricted regions sampled within the salt marsh and macroalgae-dominated sites exhibited the lowest surface DO (<5.5 and <5 mg L–1, respectively) and pHNBS (<7.65 and <7.5, respectively), indicating that tidal mixing of adjacent waters with higher DO/pHNBS would alleviate these conditions. Conversely, these fringing habits may significantly influence carbonate chemistry within larger adjacent systems via export of low DO - pH, DIC enriched waters (Chu et al., 2018). This inorganic carbon pump is especially evident in salt marsh-dominated systems (Wang and Cai, 2004) and may be a significant contributor of CO2 to the surrounding estuary (Wang et al., 2018). The flux from other habitats such as macroalgal beds can also seasonally contribute DIC to surrounding estuarine systems while sequestering carbon during periods of intense growth (Krause-Jensen et al., 2018). During the summer and fall, temperature marine habitats such as salt marshes and dense macroalgal assemblages, and especially the most restricted regions within these habitats with the lowest DO and pH, are high risk environments for early life stage finfish and shellfish that are known to be highly sensitive to these conditions (Talmage and Gobler, 2010; Baumann et al., 2012; Gobler and Baumann, 2016).
High resolution surface mapping across Shinnecock Bay revealed spatial homogeneity with respect to pCO2 for much of the estuary but a high degree of spatial heterogeneity within the seagrass bed (Figure 9). Specifically, pCO2 levels were reduced by ∼200 μatm below ambient levels within shallow, dense stands of seagrass (Figure 9). These trends were driven by increased production within the dense seagrass beds, drawing down pCO2 levels and increased pCO2 in deeper regions associated with increased bacterial degradation of leaf litter and associated organic matter (Churchill and Riner, 1978; Mateo and Romero, 1996; Liu et al., 2017). It has been hypothesized that as coastal marine systems continue to acidify, seagrass habitats will become increasingly vital for buffering the surrounding water column (Pacella et al., 2018), creating refuges for many marine organisms, acting as potential CO2 sinks in coastal habitats (Smith, 1981; Duarte et al., 2010; Camp et al., 2016). Determination of localized carbon budgets and carbonate chemistry will be of increasing importance as CO2 concentrations in coastal waters continue to rise. The mesoscale variation observed here highlights the complex spatial and temporal patterns in the capacity of coastal habitats to buffer against metabolically driven acidification.
Ecological Implications
Habitats examined during this study harbor wild and aquacultured populations of multiple species of calcifying bivalves (A. irradians, Crassostrea virginica, Mercenaria mercenaria, Mytilus edulis) that are sensitive to low ΩAr values, even when ΩAr is above the thermodynamic calcification/dissolution threshold (ΩAr > 1; Barton et al., 2012; Stevens and Gobler, 2018). Given the expected 0.3–0.4 unit decrease in pH in the world’s oceans by the end of this century (Orr et al., 2005) and the potential for such changes to extinguish local bivalve populations (Grear et al., 2020) management agencies must identify habitats favorable for sustaining wild and aquacultured bivalves. Within the ∼200 km2 coastal region examined during this study, we observed that differing habitats displayed distinct ranges in ΩAr. Seagrass meadows exhibited significantly higher ΩAr (mean ΩAr > 2) compared to the salt marshes (mean ΩAr < 1) and macroalgae dominated habitats (mean ΩAr = 1; p < 0.0001 and p < 0.05, respectively). While the larger Peconic Estuary was never undersaturated during this study, during the late summer and early fall ΩAr values did regularly decrease below 1.7 (Supplementary Table 3), a level known to reduce the growth and survival of larval aragonitic bivalves (Figure 7; Talmage and Gobler, 2010; Barton et al., 2012) whereas these species will transition to precipitation of calcite in juvenile and adult stages (Haley et al., 2018). Chronic exposure to acidified conditions can cause increased mortality and depressed growth in larval bivalve species (Talmage and Gobler, 2010; Gobler and Talmage, 2013) whereas diel exposure to acidified conditions may alleviate some of these negative effects (Gobler et al., 2017). Regardless, if hypercapnia intensifies as anticipated in the future (Pachauri et al., 2014), restricted open water coastal systems such as the Peconic Estuary will be more vulnerable to the assimilation of atmospheric CO2 than waters adjacent to wetlands and macrophyte-dominated regions where acute biological activity modulates carbon fluxes, increasing atmospheric CO2 sinks via increases in productivity (Langley et al., 2009). Given this system hosts a large aquaculture leasing program as well as a large bay scallop (A. irradians) fishery, future acidification could potentially result in significant economic loss (Mangi et al., 2018; Grear et al., 2020).
Recently, multi-trophic ocean farming has been considered as a remedial aquaculture practice whereby macroalgae are, for example, co-cultivated with bivalves (Neori, 2009; Clements and Chopin, 2017). Recent laboratory experiments have shown that bivalves grown under elevated pCO2 conditions experience increased shell and tissue growth when co-cultivated with green algae of the genus Ulva when compared to bivalves grown without exposure to this alga (Young and Gobler, 2018). While Ulva spp. could also acidify the water column on diel timescales if in a period of decay (Figure 4B), multi-trophic systems whereby macroalgae such as kelp or other seaweeds (Chopin et al., 2001; Kim et al., 2015) are grown and harvested prior to decay periods could protect calcifying bivalves and thus may become an increasingly important aquaculture approach in coastal systems as oceans continue to acidify.
In the Northeast United States during summer months, intense diel fluctuations in DO and pH have been documented within salt marshes (Baumann et al., 2015; Wang et al., 2016, this study). The combined effects of hypoxia and acidification on the growth and survival of early life stage shellfish has been documented in recent years (Gobler et al., 2014; Stevens and Gobler, 2018) and the levels and intensity of diel changes in pHT and DO observed in both the salt marshes and the macroalgae site during this study (Figure 4), have been shown to depress growth rates and decrease survival of bivalve larvae (A. irradians., M. mercenaria, C. virginica) in laboratory experiments (Clark and Gobler, 2016; Gobler et al., 2017). Presently, wild populations of A. irradians, C. virginica, and M. mercenaria are primarily restricted to open water habitats or within seagrass beds in the Peconic Estuary and Shinnecock Bay (NYSDEC, 2015). Conversely, salt marshes examined during this study were dominated exclusively by the ribbed mussel (Geukensia demissa), an intertidal species that is able to tolerate extended exposure to the atmosphere, extreme temperatures, and hypoxic conditions (Jost and Helmuth, 2007; Fields et al., 2014). G. demissa specifically relies on anaerobic respiration during periods of atmospheric exposure (Fields et al., 2014), and when submerged, this physiological mechanism would enable this species to be more tolerant of hypoxia and perhaps increased CO2 concentrations when compared to other bivalves. Hence, future bivalve restoration efforts within nearshore habitats that may be vulnerable to current or future acidification may be more successful building populations of G. demissa which is clearly tolerant of a wide range of pH and DO conditions found in salt marshes.
Conclusion
This study highlights the temporal and spatial variation of DO and carbonate chemistry parameters observed during months associated with peak productivity as well as the onset and demise of hypoxia in temperate coastal habitats. Importantly, these are also periods where larval and juvenile stage fish and shellfish are vulnerable to acidification and hypoxia (Clark and Gobler, 2016; Stevens and Gobler, 2018) and are present in these habitats (Chambers and Trippel, 1997; Ishimatsu et al., 2008; Salisbury et al., 2008). While the co-occurrence of hypoxia and acidification within coastal systems has been documented, these conditions are frequently associated with deeper coastal regions that experience intense eutrophication and/or upwelling (Borges and Gypens, 2010; Feely et al., 2010; Cai et al., 2011; Wallace et al., 2014). Concurrent hypoxia and acidification in shallow water habitats that experience moderate nutrient loading is poorly understood and generally related to seasonal and diel ecosystem metabolism (Baumann and Smith, 2018; Lowe et al., 2019). This study highlights the suitability of various habitats as refuges from present and future hypoxia and acidification, as well as regions that are already inhospitable for many resource bivalves. Future efforts that seek to expand seagrass meadows and the aquaculture of macroalgae are likely to expand local refuges from hypoxia and acidification and thus maximize their ecosystem benefits.
Data Availability Statement
The original contributions presented in the study are included in the article/Supplementary Material, further inquiries can be directed to the corresponding authors.
Author Contributions
RW and CG designed the research methodology and wrote the manuscript. RW collected field data, performed the laboratory analysis, and processed and analyzed the data. All authors contributed to the article and approved the submitted version.
Funding
Funding for these experiments was obtained from the New York Sea Grant (award # R-FMB-38), the Laurie Landeau Foundation, and the Simons Foundation.
Conflict of Interest
The authors declare that the research was conducted in the absence of any commercial or financial relationships that could be construed as a potential conflict of interest.
Publisher’s Note
All claims expressed in this article are solely those of the authors and do not necessarily represent those of their affiliated organizations, or those of the publisher, the editors and the reviewers. Any product that may be evaluated in this article, or claim that may be made by its manufacturer, is not guaranteed or endorsed by the publisher.
Acknowledgments
We thank Ryan Anderson, Robert McCabe, Andrew Lundstrom, and Craig Schenone for research assistance during this project. We also thank the staff of the Stony Brook Southampton Marine Sciences Center for their logistical support.
Supplementary Material
The Supplementary Material for this article can be found online at: https://www.frontiersin.org/articles/10.3389/fmars.2021.611781/full#supplementary-material
Footnotes
References
Able, K. W. (2005). A re-examination of fish estuarine dependence: evidence for connectivity between estuarine and ocean habitats. Estuar. Coast. Shelf Sci. 64, 5–17. doi: 10.1016/j.ecss.2005.02.002
Apinis, A., Chesters, C. G. C., and Turner, M. (1956). Studies of the decomposition of seaweeds and seaweed products by micro-organisms. Proc. Linn. Soc. Lond. 166, 87–97. doi: 10.1111/j.1095-8312.1956.tb00753.x
Axelsson, L., Mercado, J. M., and Figueroa, F. L. (2000). Utilization of HCO3– at high pH by the brown macroalga Laminaria saccharina. Eur. J. Phycol. 35, 53–59. doi: 10.1080/09670260010001735621
Axelsson, L., Ryberg, H., and Beer, S. (1995). Two modes of bicarbonate utilization in the marine green macroalga Ulva lactuca. Plant Cell Environ. 18, 439–445. doi: 10.1111/j.1365-3040.1995.tb00378.x
Baird, D., McGlade, J. M., and Ulanowicz, R. E. (1991). The comparative ecology of six marine ecosystems. Philos. Trans. R. Soc. B Biol. Sci. 333, 15–29. doi: 10.1098/rstb.1991.0058
Barbier, E. B., Hacker, S. D., Kennedy, C., Koch, E. W., Stier, A. C., and Silliman, B. R. (2010). The value of estuarine and coastal ecosystem services. Ecol. Monogr. 81, 169–193. doi: 10.1890/10-1510.1
Bartholoma, S. D. (2003). User’s manual for the National Water Information System of the U.S. Geological Survey: automated Data Processing System (ADAPS), Open-File Report, Version 4.3; Supercedes OFR 97-635 ed. Virginia, United States: U.S. Geological Survey
Barton, A., Hales, B., Waldbusser, G. G., Langdon, C., and Feely, R. A. (2012). The Pacific oyster, Crassostrea gigas, shows negative correlation to naturally elevated carbon dioxide levels: implications for near-term ocean acidification effects. Limnol. Oceanogr. 57, 698–710. doi: 10.4319/lo.2012.57.3.0698
Baumann, H., and Smith, E. M. (2018). Quantifying metabolically driven pH and oxygen fluctuations in US nearshore habitats at diel to interannual time scales. Estuaries Coasts 41, 1102–1117. doi: 10.1007/s1223
Baumann, H., Talmage, S. C., and Gobler, C. J. (2012). Reduced early life growth and survival in a fish in direct response to increased carbon dioxide. Nat. Clim. Chang. 2, 38–41. doi: 10.1038/nclimate1291
Baumann, H., Wallace, R. B., Tagliaferri, T., and Gobler, C. J. (2015). Large natural pH, CO2 and O2 fluctuations in a temperate tidal salt marsh on diel, seasonal, and interannual time scales. Estuaries Coasts 38, 220–231. doi: 10.1007/s12237-014-9800-y
Beck, M. W., Hagy, J. D. III, and Murrell, M. C. (2015). Improving estimates of ecosystem metabolism by reducing effects of tidal advection on dissolved oxygen time series. Limnol. Oceanogr. Methods 13, 731–745.
Beck, M. W., Heck, K. L., Able, K. W., Childers, D. L., Eggleston, D. B., Gillanders, B. M., et al. (2001). The identification, conservation, and management of estuarine and marine nurseries for fish and invertebrates: a better understanding of the habitats that serve as nurseries for marine species and the factors that create site-specific variability in nursery quality will improve conservation and management of these areas. BioScience 51, 633–641. doi: 10.1641/0006-3568(2001)051[0633:ticamo]2.0.co;2
Beer, S., and Koch, E. (1996). Photosynthesis of marine macroalgae and seagrasses in globally changing CO2 environments. Mar. Ecol. Prog. Ser. 141, 199–204. doi: 10.3354/meps141199
Bergveld, P. (2003). Thirty years of ISFETOLOGY: what happened in the past 30 years and what may happen in the next 30 years. Sens. Actuators B Chem. 88, 1–20. doi: 10.1016/S0925-4005(02)00301-5
Berner, R. A., Scott, M. R., and Thomlinson, C. (1970). Carbonate alkalinity in the pore waters of anoxic marine sediments. Limnol. Oceanogr. 15, 544–549. doi: 10.4319/lo.1970.15.4.0544
Blake, R. E., Duffy, J. E., and Richardson, J. P. (2014). Patterns of seagrass community response to local shoreline development. Estuaries Coasts 37, 1549–1561. doi: 10.1007/s12237-014-9784-7
Blomster, J., Back, S., Fewer, D. P., Kiirikki, M., Lehvo, A., Maggs, C. A., et al. (2002). Novel morphology in Enteromorpha (Ulvophyceae) forming green tides. Am. J. Bot. 89, 1756–1763. doi: 10.3732/ajb.89.11.1756
Blumberg, A. F., and Galperin, B. (1990). “On the Summer Circulation in New York Bight and Contiguous Estuarine Waters,” in Residual Currents and Long-term Transport, ed. R. T. Cheng (New York, NY: Springer), 451–468. doi: 10.1029/ce038p0451
Borges, A. V., and Gypens, N. (2010). Carbonate chemistry in the coastal zone responds more strongly to eutrophication than ocean acidification. Limnol. Oceanogr. 55, 346–353. doi: 10.4319/lo.2010.55.1.0346
Borges, A. V., Ruddick, K., Schiettecatte, L.-S., and Delille, B. (2008). Net ecosystem production and carbon dioxide fluxes in the Scheldt estuarine plume. BMC Ecol. 8:15. doi: 10.1186/1472-6785-8-15
Burnett, L. E. (1997). The challenges of living in hypoxic and hypercapnic aquatic environments. Am. Zool. 37, 633–640. doi: 10.1093/icb/37.6.633
Caffrey, J. M. (2004). Factors controlling net ecosystem metabolism in U.S. estuaries. Estuaries 27, 90–101. doi: 10.1007/BF02803563
Caffrey, J. M., and Kemp, W. M. (1991). Seasonal and spatial patterns of oxygen production, respiration and root-rhizome release in Potamogeton perfoliatus L. and Zostera marina L. Aquat. Bot. 40, 109–128. doi: 10.1016/0304-3770(91)90090-R
Cai, W.-J. (2011). Estuarine and Coastal Ocean Carbon Paradox: CO2 Sinks or Sites of Terrestrial Carbon Incineration? Ann. Rev. Mar. Sci. 3, 123–145. doi: 10.1146/annurev-marine-120709-142723
Cai, W.-J., Hu, X., Huang, W.-J., Murrell, M. C., Lehrter, J. C., Lohrenz, S. E., et al. (2011). Acidification of subsurface coastal waters enhanced by eutrophication. Nat. Geosci. 4, 766–770. doi: 10.1038/ngeo1297
Camp, E. F., Suggett, D. J., Gendron, G., Jompa, J., Manfrino, C., and Smith, D. J. (2016). Mangrove and seagrass beds provide different biogeochemical services for corals threatened by climate change. Front. Mar. Sci. 3:52. doi: 10.3389/fmars.2016.00052
Carlson, P., Peterson, B., Dennison, W., Heck, K. L., Fonseca, M., Pickerell, C., et al. (2009). Final Report of the New York State Seagrass Task Force: recommendations to the New York State Governor and Legislature. New York, NY: New York Department of State.
Chambers, R. C., and Trippel, E. (1997). Early Life History and Recruitment in Fish Populations. Netherlands: Springer.
Chopin, T., Buschmann, A. H., Halling, C., Troell, M., Kautsky, N., Neori, A., et al. (2001). Integrating seaweeds into marine aquaculture systems: a key toward sustainability. J. Phycol. 37, 975–986. doi: 10.1046/j.1529-8817.2001.01137.x
Chu, S. N., Wang, Z. A., Gonneea, M. E., Kroeger, K. D., and Ganju, N. K. (2018). Deciphering the dynamics of inorganic carbon export from intertidal salt marshes using high-frequency measurements. Mar. Chem. 206, 7–18. doi: 10.1016/j.marchem.2018.08.005
Chung, I. K., Beardall, J., Mehta, S., Sahoo, D., and Stojkovic, S. (2011). Using marine macroalgae for carbon sequestration: a critical appraisal. J. Appl. Phycol. 23, 877–886. doi: 10.1007/s10811-010-9604-9
Churchill, A. C., and Riner, M. I. (1978). Anthesis and seed production in Zostera marina L. from Great South Bay, New York, U.S.A. Aquat. Bot. 4, 83–93. doi: 10.1016/0304-3770(78)90009-8
Clark, H. R., and Gobler, C. J. (2016). Diurnal fluctuations in CO–2 and dissolved oxygen concentrations do not provide a refuge from hypoxia and acidification for early-life-stage bivalves. Mar. Ecol. Prog. Ser. 558, 1–14. doi: 10.3354/meps11852
Clements, J. C., and Chopin, T. (2017). Ocean acidification and marine aquaculture in North America: potential impacts and mitigation strategies. Rev. Aquac. 9, 326–341. doi: 10.1111/raq.12140
Cloern, J. E., Foster, S. Q., and Kleckner, A. E. (2014). Phytoplankton primary production in the world’s estuarine-coastal ecosystems. Biogeosciences 11, 2477–2501. doi: 10.5194/bg-11-2477-2014
Curran, P. J. (1988). The semivariogram in remote sensing: an introduction. Remote Sens. Environ. 24, 493–507. doi: 10.1016/0034-4257(88)90021-1
Cyronak, T., Andersson, A. J., D’Angelo, S., Bresnahan, P., Davidson, C., Griffin, A., et al. (2018). Short-Term Spatial and Temporal Carbonate Chemistry Variability in Two Contrasting Seagrass Meadows: implications for pH Buffering Capacities. Estuaries Coasts 41, 1282–1296. doi: 10.1007/s12237-017-0356-5
D’Avanzo, C., Kremer, J. N., and Wainright, S. C. (1996). Ecosystem production and respiration in response to eutrophication in shallow temperate estuaries. Mar. Ecol. Prog. Ser. 141, 263–274. doi: 10.3354/meps141263
Dennison, W. C. (2009). Seagrasses: biology, ecology and conservation. Botanica Marina 52, 365–366. doi: 10.1515/BOT.2009.009
Dennison, W. C., Orth, R. J., Moore, K. A., Stevenson, J. C., Carter, V., Kollar, S., et al. (1993). Assessing Water Quality with Submersed Aquatic Vegetation: habitat requirements as barometers of Chesapeake Bay health. BioScience 43, 86–94. doi: 10.2307/1311969
Dickson, A. G. (1990). Standard potential of the reaction: AgCl(s) + 12H2(g) = Ag(s) + HCl(aq), and and the standard acidity constant of the ion HSO4- in synthetic sea water from 273.15 to 318.15 K. J. Chem. Thermodyn. 22, 113–127. doi: 10.1016/0021-9614(90)90074-z
Dickson, A. G., and Riley, J. P. (1979). The estimation of acid dissociation constants in sea-water media from potentiometric titrations with strong base. II. The dissociation of phosphoric acid. Mar. Chem. 7, 101–109. doi: 10.1016/0304-4203(79)90002-1
Duarte, C. M., Hendriks, I. E., Moore, T. S., Olsen, Y. S., Steckbauer, A., Ramajo, L., et al. (2013). Is ocean acidification an open-ocean syndrome? Understanding anthropogenic impacts on seawater pH. Estuaries Coasts 36, 221–236. doi: 10.1007/s12237-013-9594-3
Duarte, C. M., Marbà, N., Gacia, E., Fourqurean, J. W., Beggins, J., Barrón, C., et al. (2010). Seagrass community metabolism: assessing the carbon sink capacity of seagrass meadows. Global Biogeochem. Cycles 24:8. doi: 10.1029/2010GB003793
Duarte, C. M., Middelburg, J. J., and Caraco, N. (2005). Major role of marine vegetation on the oceanic carbon cycle. Biogeosciences 2, 1–8. doi: 10.5194/bg-2-1-2005
Duffy, J. E. (2006). Biodiversity and the functioning of seagrass ecosystems. Mar. Ecol. Prog. Ser. 311, 233–250. doi: 10.3354/meps311233
Egleston, E. S., Sabine, C. L., and Morel, F. M. M. (2010). Revelle revisited: buffer factors that quantify the response of ocean chemistry to changes in DIC and alkalinity. Global Biogeochem. Cycles 24:GB1002. doi: 10.1029/2008GB003407
Feely, R. A., Alin, S. R., Newton, J., Sabine, C. L., Warner, M., Devol, A., et al. (2010). The combined effects of ocean acidification, mixing, and respiration on pH and carbonate saturation in an urbanized estuary. Estuar. Coast. Shelf Sci. 88, 442–449. doi: 10.1016/j.ecss.2010.05.004
Feely, R. A., Okazaki, R. R., Cai, W.-J., Bednaršek, N., Alin, S. R., Byrne, R. H., et al. (2018). The combined effects of acidification and hypoxia on pH and aragonite saturation in the coastal waters of the California current ecosystem and the northern Gulf of Mexico. Cont. Shelf Res. 152, 50–60. doi: 10.1016/j.csr.2017.11.002
Fiedler, B., Fietzek, P., Vieira, N., Silva, P., and Bittig, H. C.Körtzinger, A. (2012). In situ CO2 and O2 measurements on a profiling float. J. Atmos. Ocean. Technol. 30, 112–126. doi: 10.1175/JTECH-D-12-00043.1
Fields, P. A., Eurich, C., Gao, W. L., and Cela, B. (2014). Changes in protein expression in the salt marsh mussel Geukensia demissa: evidence for a shift from anaerobic to aerobic metabolism during prolonged aerial exposure. J. Exp. Biol. 217, 1601–1612. doi: 10.1242/jeb.101758
Fietzek, P., Fielder, B., Steinhoff, T., and Körtzinger, A. (2014). In situ quality assessment of a novel underwater pCO2 sensor based on membrane equilibration and NDIR spectrometry. J. Atmos. Ocean. Technol. 31, 181–196. doi: 10.1175/JTECH-D-13-00083.1
Fischer, H. B., List, J. E., Koh, C. R., Imberger, J., and Brooks, N. H. (2013). Mixing in inland and coastal waters. Cambridge, Massachusetts: Academic Press.
Gardner, L. R., and Gorman, C. (1984). The summertime net transport of dissolved oxygen, salt and heat in a salt marsh basin, North Inlet, S.C. Estuar. Coast. Shelf Sci. 19, 331–339. doi: 10.1016/0272-7714(84)90029-5
Gattuso, J.-P., Frankignoulle, M., and Wollast, R. (1998). Carbon and carbonate metabolism in coastal aquatic ecosystems. Annu. Rev. Ecol. Syst. 29, 405–434. doi: 10.1146/annurev.ecolsys.29.1.405
George, J. A., Lonsdale, D., Merlo, L. R., and Gobler, C. J. (2015). The interactive roles of temperature, nutrients, and zooplankton grazing in controlling the winter–spring phytoplankton bloom in a temperate, coastal ecosystem, Long Island Sound. Limnol. Oceanogr. 60, 110–126. doi: 10.1002/lno.10020
Gleason, D. F., Zimmerman, R. J., and Minello, T. J. (1982). Carbon-sources for Penaeid shrimp in a salt-marsh. Am. Zool. 22:964.
Gobler, C. J., and Baumann, H. (2016). Hypoxia and acidification in ocean ecosystems: coupled dynamics and effects on marine life. Biol. Lett. 12:20150976. doi: 10.1098/rsbl.2015.0976
Gobler, C. J., Clark, H. R., Griffith, A. W., and Lusty, M. W. (2017). Diurnal fluctuations in acidification and hypoxia reduce growth and survival of larval and juvenile bay scallops (Argopecten irradians) and hard clams (Mercenaria mercenaria). Front. Mar. Sci. 3:282. doi: 10.3389/fmars.2016.00282
Gobler, C. J., DePasquale, E. L., Griffith, A. W., and Baumann, H. (2014). Hypoxia and acidification have additive and synergistic negative effects on the growth, survival, and metamorphosis of early life stage bivalves. PLoS One 9:e83648. doi: 10.1371/journal.pone.0083648
Gobler, C. J., and Talmage, S. C. (2013). Short- and long-term consequences of larval stage exposure to constantly and ephemerally elevated carbon dioxide for marine bivalve populations. Biogeosciences 10, 2241–2253. doi: 10.5194/bg-10-2241-2013
Grear, J. S., O’Leary, C. A., Nye, J. A., Tettelbach, S. T., and Gobler, C. J. (2020). Effects of coastal acidification on North Atlantic bivalves: interpreting laboratory responses in the context of in situ populations. Mar. Ecol. Prog. Ser. 633, 89–104. doi: 10.3354/meps13140
Gribov, A., and Krivoruchko, K. (2011). Local polynomials for data detrending and interpolation in the presence of barriers. Stoch. Environ. Res. Risk Assess. 25, 1057–1063. doi: 10.1007/s00477-011-0488-2
Hagens, M., Slomp, C., Meysman, F., Seitaj, D., Jerome, H., Borges, A., et al. (2015). Biogeochemical processes and buffering capacity concurrently affect acidification in a seasonally hypoxic coastal marine basin. Biogeosciences 12, 1561–1583. doi: 10.5194/bg-12-1561-2015
Haley, B. A., Hales, B., Brunner, E. L., Kovalchik, K., and Waldbusser, G. G. (2018). Mechanisms to Explain the Elemental Composition of the Initial Aragonite Shell of Larval Oysters. Geochem. Geophys. Geosyst. 19, 1064–1079. doi: 10.1002/2017gc007133
Han, Q., and Liu, D. (2014). Macroalgae blooms and their effects on seagrass ecosystems. J. Ocean Univ. China 13, 791–798. doi: 10.1007/s11802-014-2471-2
Hardy, C. D. (1976). A preliminary description of the Peconic Bay estuary. University, NY: Stony Brook, Marine Sciences Research Center.
Heck, K. L., Hays, G., and Orth, R. J. (2003). Critical evaluation of the nursery role hypothesis for seagrass meadows. Mar. Ecol. Prog. Ser. 253, 123–136. doi: 10.3354/meps253123
Hendriks, I. E., Olsen, Y. S., Ramajo, L., Basso, L., Steckbauer, A., Moore, T. S., et al. (2014). Photosynthetic activity buffers ocean acidification in seagrass meadows. Biogeosciences 11, 333–346. doi: 10.5194/bgd-10-12313-2013
Hofmann, G. E., Smith, J. E., Johnson, K. S., Send, U., Levin, L. A., Micheli, F., et al. (2011). High-frequency dynamics of ocean pH: a multi-ecosystem comparison. PLoS One 6:e28983. doi: 10.1371/journal.pone.0028983
Howland, R. J. M., Tappin, A. D., Uncles, R. J., Plummer, D. H., and Bloomer, N. J. (2000). Distributions and seasonal variability of pH and alkalinity in the Tweed Estuary, UK. Sci. Total Environ. 251-252, 125–138. doi: 10.1016/S0048-9697(00)00406-X
Hu, X., and Cai, W.-J. (2011). An assessment of ocean margin anaerobic processes on oceanic alkalinity budget. Global Biogeochem. Cycles 25:GB3003. doi: 10.1029/2010GB003859
Iriarte, A., Madariaga, I., Diez-Garagarza, F., Revilla, M., and Orive, E. (1997). Primary plankton production, respiration and nitrification in a shallow temperate estuary during summer. J. Exp. Mar. Biol. Ecol. 208, 127–151. doi: 10.1016/S0022-0981(96)02672-X
Ishimatsu, A., Hayashi, M., and Kikkawa, T. (2008). Fishes in high-CO2, acidified oceans. Mar. Ecol. Prog. Ser. 373, 295–302. doi: 10.3354/meps07823
Jackson, G. A. (1987). Modelling the growth and harvest yield of the giant kelp Macrocystis pyrifera. Mar. Biol. 95, 611–624. doi: 10.1007/BF00393105
Johnson, D. A., and Welsh, B. L. (1985). Detrimental effects of Ulva lactuca (L.) exudates and low oxygen on estuarine crab larvae. J. Exp. Mar. Biol. Ecol. 86, 73–83. doi: 10.1016/0022-0981(85)90043-7
Jost, J., and Helmuth, B. (2007). Morphological and ecological determinants of body temperature of Geukensia demissa, the Atlantic ribbed mussel, and their effects on mussel mortality. Biol. Bull. 213, 141–151. doi: 10.2307/25066630
Kim, J. K., Kraemer, G. P., and Yarish, C. (2015). Use of sugar kelp aquaculture in Long Island Sound and the Bronx River Estuary for nutrient extraction. Mar. Ecol. Prog. Ser. 531, 155–166. doi: 10.3354/meps11331
Krause-Jensen, D., Lavery, P., Serrano, O., Marbà, N., Masque, P., and Duarte, C. M. (2018). Sequestration of macroalgal carbon: the elephant in the Blue Carbon room. Biol. Lett. 14:20180236. doi: 10.1098/rsbl.2018.0236
Krivoruchko, K., and Gribov, A. (2004). “Geostatistical Interpolation and Simulation in the Presence of Barriers,” in geoENV IV — Geostatistics for Environmental Applications. Quantitative Geology and Geostatistics, eds X. Sanchez-Vila, J. Carrera, and J. J. Gómez-Hernández (Dordrecht: Springer).
Langley, J. A., McKee, K. L., Cahoon, D. R., Cherry, J. A., and Megonigal, J. P. (2009). Elevated CO2 stimulates marsh elevation gain, counterbalancing sea-level rise. Proc. Natl. Acad. Sci. U. S. A. 106, 6182–6186. doi: 10.1073/pnas.0807695106
Lee, K., Kim, T.-W., Byrne, R. H., Millero, F. J., Feely, R. A., and Liu, Y.-M. (2010). The universal ratio of boron to chlorinity for the North Pacific and North Atlantic oceans. Geochim. Cosmochim. Acta 74, 1801–1811. doi: 10.1016/j.gca.2009.12.027
Lee, K., Tong, L. T., Millero, F. J., Sabine, C. L., Dickson, A. G., Goyet, C., et al. (2006). Global relationships of total alkalinity with salinity and temperature in surface waters of the world’s oceans. Geophys. Res. Lett. 33:LI9605. doi: 10.1029/2006GL027207
Lenzi, M. (2014). What can be Done about Massive Macroalgal Blooms? J. Aquac. Res. Dev. 5:292. doi: 10.4172/2155-9546.1000292
Liu, D., Keesing, J. K., Xing, Q., and Shi, P. (2009). World’s largest macroalgal bloom caused by expansion of seaweed aquaculture in China. Mar. Pollut. Bull. 58, 888–895. doi: 10.1016/j.marpolbul.2009.01.013
Liu, F., Pang, S. J., Xu, N., Shan, T. F., Sun, S., Hu, X., et al. (2010). Ulva diversity in the Yellow Sea during the large-scale green algal blooms in 2008–2009. Physiol. Res. 58, 270–279. doi: 10.1111/j.1440-1835.2010.00586.x
Liu, S., Jiang, Z., Deng, Y., Wu, Y., Zhao, C., Zhang, J., et al. (2017). Effects of seagrass leaf litter decomposition on sediment organic carbon composition and the key transformation processes. Sci. China Earth Sci. 60, 2108–2117. doi: 10.1007/s11430-017-9147-4
Lowe, A. T., Bos, J., and Ruesink, J. (2019). Ecosystem metabolism drives pH variability and modulates long-term ocean acidification in the Northeast Pacific coastal ocean. Sci. Rep. 9:963. doi: 10.1038/s41598-018-37764-4
Madden, C. J., and Day, J. W. (1992). An instrument system for high-speed mapping of chlorophyll a and physico-chemical variables in surface waters. Estuaries 15, 421–427. doi: 10.2307/1352789
Magre, E. J. (1974). Ulva lactuca L. negatively affects Balanus balanoides (L.) (Cirripedia Thoracica) in tidepools. Crustaceana 27, 231–234. doi: 10.1163/156854074X00758
Maher, D. T., and Eyre, B. D. (2012). Carbon budgets for three autotrophic Australian estuaries: implications for global estimates of the coastal air-water CO2 flux. Global Biogeochem. Cycle 26:GB1032.
Mangi, S. C., Lee, J., Pinnegar, J. K., Law, R. J., Tyllianakis, E., and Birchenough, S. N. R. (2018). The economic impacts of ocean acidification on shellfish fisheries and aquaculture in the United Kingdom. Environ. Sci. Policy 86, 95–105. doi: 10.1016/j.envsci.2018.05.008
Martz, T. R., Connery, J. G., and Johnson, K. S. (2010). Testing the Honeywell Durafet® for seawater pH applications. Limnol. Oceanogr. Methods 8, 172–184. doi: 10.4319/lom.2010.8.172
Mateo, M. A., and Romero, J. (1996). Evaluating seagrass leaf litter decomposition: an experimental comparison between litter-bag and oxygen-uptake methods. J. Exp. Mar. Biol. Ecol. 202, 97–106. doi: 10.1016/0022-0981(96)00019-6
Menéndez, M., Martínez, M., and Comín, F. A. (2001). A comparative study of the effect of pH and inorganic carbon resources on the photosynthesis of three floating macroalgae species of a Mediterranean coastal lagoon. J. Exp. Mar. Biol. Ecol. 256, 123–136. doi: 10.1016/S0022-0981(00)00313-0
Ménesguen, A., and Piriou, J.-Y. (1995). Nitrogen loadings and macroalgal (Ulva sp.) Mass Accumulation in Brittany (France). Ophelia 42, 227–237. doi: 10.1080/00785326.1995.10431506
Middelboe, A. L., and Hansen, P. J. (2007a). Direct effects of pH and inorganic carbon on macroalgal photosynthesis and growth. Mar. Biol. Res. 3, 134–144. doi: 10.1080/17451000701320556
Middelboe, A. L., and Hansen, P. J. (2007b). High pH in shallow-water macroalgal habitats. Mar. Ecol. Prog. Ser. 338, 107–117. doi: 10.3354/meps338107
Millero, F. J. (2010). Carbonate constants for estuarine waters. Mar. Freshw. Res. 61, 139–142. doi: 10.1071/mf09254
Morris, A. W., and Riley, J. P. (1966). The bromide/chlorinity and sulphate/chlorinity ratio in sea water. Deep Sea Res. Oceanogr. Abstr. 13, 699–705. doi: 10.1016/0011-7471(66)90601-2
Najjar, R. G., Herrmann, M., Alexander, R., Boyer, E. W., Burdige, D. J., Butman, D., et al. (2018). Carbon budget of tidal wetlands, estuaries, and shelf waters of eastern North America. Global Biogeochem. Cycles 32, 389–416. doi: 10.1002/2017GB005790
Nejrup, L. B., Staehr, P. A., and Thomsen, M. S. (2013). Temperature- and light-dependent growth and metabolism of the invasive red algae Gracilaria vermiculophylla – a comparison with two native macroalgae. Eur. J. Phycol. 48, 295–308. doi: 10.1080/09670262.2013.830778
Neori, A. (2009). Essential role of seaweed cultivation in integrated multi-trophic aquaculture farms for global expansion of mariculture: an analysis. J. Appl. Phycol. 20, 567–570. doi: 10.1007/s10811-007-9206-3
Nixon, S. W., and Oviatt, C. A. (1973). Ecology of a New England salt marsh. Ecol. Monogr. 43, 463–498. doi: 10.2307/1942303
NYSDEC (2015). State Wildlife Action Plan (SWAP) An Approach to Conserve At-Risk Fish and Wildlife Species. Albany, NY: New York Department of State.
O’Boyle, S., McDermott, G., Noklegaard, T., and Wilkes, R. (2013). A Simple Index of Trophic Status in Estuaries and Coastal Bays Based on Measurements of pH and Dissolved Oxygen. Estuaries Coasts 36, 158–173. doi: 10.1007/s12237-012-9553-4
Odum, W. E. (1971). Pathways of energy flow in a south Florida estuary. Bloomington: Indiana University, University of Miami Sea Grant Program.
Olesen, B., and Sand-Jensen, K. (1994). Biomass-density patterns in the temperate seagrass Zostera marina. Mar. Ecol. Prog. Ser. 109, 283–291. doi: 10.3354/meps109283
Orr, J. C., Fabry, V. J., Aumont, O., Bopp, L., Doney, S. C., Feely, R. A., et al. (2005). Anthropogenic ocean acidification over the twenty-first century and its impact on calcifying organisms. Nature 437, 681–686. doi: 10.1038/nature04095
Orth, R. J., Carruthers, T. J. B., Dennison, W. C., Duarte, C. M., Fourqurean, J. W., Heck, K. L., et al. (2006). A global crisis for seagrass ecosystems. BioScience 56, 987–996.
Pacella, S. R., Brown, C. A., Waldbusser, G. G., Labiosa, R. G., and Hales, B. (2018). Seagrass habitat metabolism increases short-term extremes and long-term offset of CO2 under future ocean acidification. Proc. Natl. Acad. Sci. U. S. A. 115, 3870–3875. doi: 10.1073/pnas.1703445115
Pachauri, R. K., Allen, M., Barros, V., Broome, J., Cramer, W., Christ, R., et al. (2014). “Climate Change 2014,” in Synthesis Report. Contribution of Working Groups I, II and III to the Fifth Assessment Report of the Intergovernmental Panel on Climate Change. eds R. Pachauri and L. Meyer (Geneva, Switzerland: IPCC).
Pimenta, A. R., and Grear, J. (2018). Guidelines for Measuring Changes in Seawater pH and Associated Carbonate Chemistry in Coastal Environments of the Eastern United States. Washington, D.C: U.S. EPA Office of Research and Development
Rautenberger, R., Fernández, P. A., Strittmatter, M., Heesch, S., Cornwall, C. E., Hurd, C. L., et al. (2015). Saturating light and not increased carbon dioxide under ocean acidification drives photosynthesis and growth in Ulva rigida. Planta 5, 874–888. doi: 10.1002/ece3.1382
Revelle, R., and Suess, H. E. (1957). Carbon Dioxide Exchange Between Atmosphere and Ocean and the Question of an Increase of Atmospheric CO2 during the Past Decades. Tellus 9, 18–27. doi: 10.3402/tellusa.v9i1.9075
Riche, O., Johannessen, S. C., and Macdonald, R. W. (2014). Why timing matters in a coastal sea: trends, variability and tipping points in the Strait of Georgia, Canada. J. Mar. Syst. 131, 36–53. doi: 10.1016/j.jmarsys.2013.11.003
Riley, G. A., and Conover, S. M. (1967). Phytoplankton of Long Island Sound 1954-1955. Bull. Bingham Oceanogr. Collection 19, 5–34.
Riley, J. P. (1965). The occurrence of anomalously high fluoride concentrations in the North Atlantic. Deep Sea Res. Oceanogr. Abstr. 12, 219–220. doi: 10.1016/0011-7471(65)90027-6
Ro, K. S., Hunt, P. G., and Poach, M. E. (2007). Wind-Driven Surficial Oxygen Transfer. Crit. Rev. Environ. Sci. Technol. 37, 539–563. doi: 10.1080/10934520600754714
Roman, C. T., Jaworski, N., Short, F. T., Findlay, S., and Warren, R. S. (2000). Estuaries of the northeastern United States: habitat and land use signatures. Estuaries 23, 743–764. doi: 10.2307/1352997
Rosenau, N. A., Galavotti, H., Yates, K. K., Bohlen, C. C., Hunt, C. W., Liebman, M., et al. (2021). Integrating High-Resolution Coastal Acidification Monitoring Data Across Seven United States Estuaries. Front. Mar. Sci. 8:679913. doi: 10.3389/fmars.2021.679913
Saderne, V., Fietzek, P., Aßmann, S., Körtzinger, A., and Hiebenthal, C. (2015). Seagrass beds as ocean acidification refuges for mussels? High resolution measurements of pCO2 and O2 in a Zostera marina and Mytilus edulis mosaic habitat. Biogeosci. Discuss. 12, 11423–11461. doi: 10.5194/bgd-12-11423-2015
Salisbury, J., Green, M., Hunt, C., and Campbell, J. (2008). Coastal acidification by rivers: a new threat to shellfish? Eos 89:513. doi: 10.1029/2008EO500001
Sand-Jensen, K., and Borum, J. (1983). Regulation of growth of eelgrass (Zostera marina L.) in Danish coastal waters. Mar. Technol. Soc. J. 17, 15–21.
Sharp, J. H. (1974). Improved analysis for particulate organic carbon and nitrogen from seawater. Limnol. Oceanogr. 19, 984–989. doi: 10.4319/lo.1974.19.6.0984
Short, F. T., Koch, E. W., Creed, J. C., Magalhães, K. M., Fernandez, E., and Gaeckle, J. L. (2006). SeagrassNet monitoring across the Americas: case studies of seagrass decline. Mar. Ecol. 27, 277–289. doi: 10.1111/j.1439-0485.2006.00095.x
Smetacek, V., and Zingone, A. (2013). Green and golden seaweed tides on the rise. Nature 504, 84–88. doi: 10.1038/nature12860
Smith, S. V. (1981). Marine Macrophytes as a Global Carbon Sink. Science 211, 838–840. doi: 10.1126/science.211.4484.838
Smith, S. V., and Mackenzie, F. T. (1987). The ocean as a net heterotrophic system: implications From the carbon biogeochemical cycle. Global Biogeochem. Cycles 1, 187–198. doi: 10.1029/GB001i003p00187
Sogard, S. M., and Able, K. W. (1991). A comparison of eelgrass, sea lettuce macroalgae, and marsh creeks as habitats for epibentic fishes and decapods. Estuar. Coast. Shelf Sci. 33, 501–519. doi: 10.1016/0272-7714(91)90087-R
Stevens, A. M., and Gobler, C. J. (2018). Interactive effects of acidification, hypoxia, and thermal stress on growth, respiration, and survival of four North Atlantic bivalves. Mar. Ecol. Prog. Ser. 604, 143–161. doi: 10.3354/meps12725
Suchanek, T. H., Williams, S. L., Ogden, J. C., Hubbard, D. K., and Gill, I. P. (1985). Utilization of shallow-water seagrass detritus by Carribbean deep-sea macrofauna: δ13C evidence. Deep Sea Res. A Oceanogr. Res. Pap. 32, 201–214. doi: 10.1016/0198-0149(85)90028-7
Sundbäck, K., and McGlathery, K. (2013). “Interactions Between Benthic Macroalgal and Microalgal Mats,” in Interactions Between Macro- and Microorganisms in Marine Sediments, Coastal and Estuarine Studies, eds E. Kristensen, R. R. Haese, and J. E. Kostka (Washington, DC: American Geophysical Union), 7–29. doi: 10.1029/ce060p0007
Sutton, A. J., Feely, R. A., Maenner-Jones, S., Musielwicz, S., Osborne, J., Dietrich, C., et al. (2019). Autonomous Seawater pCO2 and pH Time Series From 40 Surface Buoys and the Emergence of Anthropogenic Trends. Earth Syst. Sci. Data 11, 421–439. doi: 10.5194/essd-11-421-2019
Tait, L. W., and Schiel, D. R. (2013). Impacts of Temperature on Primary Productivity and Respiration in Naturally Structured Macroalgal Assemblages. PLoS One 8:e74413. doi: 10.1371/journal.pone.0074413
Talmage, S. C., and Gobler, C. J. (2010). Effects of past, present, and future ocean carbon dioxide concentrations on the growth and survival of larval shellfish. Proc. Nat. Acad. Sci. U. S. A. 107, 17246–17251. doi: 10.1073/pnas.0913804107
Tettelbach, S. T., Peterson, B. J., Carroll, J. C., Hughes, S. W. T., Bonal, D. M., Weinstock, A., et al. (2013). Priming the larval pump: resurgence of bay scallop recruitment following initiation of intensive restoration efforts. Mar. Ecol. Prog. Ser. 478, 153–172. doi: 10.3354/meps10111
Tomasetti, S. J., and Gobler, C. J. (2020). Dissolved oxygen and pH criteria leave fisheries at risk. Science 368, 372–373. doi: 10.1126/science.aba4896
Turner, R. E. (1978). Community plankton respiration in a salt marsh estuary and the importance of macrophytic leachates. Limnol. Oceanogr. 23, 442–451. doi: 10.4319/lo.1978.23.3.0442
Unsworth, R. K. F., Collier, C. J., Henderson, G. M., and McKenzie, L. J. (2012). Tropical seagrass meadows modify seawater carbon chemistry: implications for coral reefs impacted by ocean acidification. Environ. Res. Lett. 7:024026. doi: 10.1088/1748-9326/7/2/024026
Uusitalo, J. (1996). Uusitalo, Jarmo. “Algal carbon uptake and the difference between alkalinity and high pH (“alkalinization”), exemplified with a pH-drift experiment. Sci. Mar. 60, 129–134.
Valiela, I., Foreman, K., LaMontagne, M., Hersh, D., Costa, J., Peckol, P., et al. (1992). Couplings of watersheds and coastal waters: sources and consequences of nutrient enrichment in Waquoit Bay. Massachusetts. Estuaries 15, 443–457. doi: 10.2307/1352389
Van Dam, B. R., Lopes, C., Osburn, C. L., and Fourqurean, J. W. (2019). Net heterotrophy and carbonate dissolution in two subtropical seagrass meadows. Biogeosciences 16, 4411–4428.
Wagner, R. J., Boulger, R. W. Jr., Oblinger, C. J., and Smith, B. A. (2006). Guidelines and Standard Procedures for Continuous Water-Quality Monitors: station Operation, Record Computation, and Data Reporting. Reston, VA: U.S. Geological Survey, 51.
Wallace, R. B., Baumann, H., Grear, J. S., Aller, R. C., and Gobler, C. J. (2014). Coastal ocean acidification: the other eutrophication problem. Estuar. Coast. Shelf Sci. 148, 1–13. doi: 10.1016/j.ecss.2014.05.027
Wallace, R. B., and Gobler, C. J. (2015). Factors controlling blooms of microalgae and macroalgae (Ulva rigida) in a eutrophic, urban estuary: jamaica Bay, NY, USA. Estuaries Coasts 38, 519–533. doi: 10.1007/s12237-014-9818-1
Wang, S. R., Iorio, D. D., Cai, W.-J., and Hopkinson, C. S. (2018). Inorganic carbon and oxygen dynamics in a marsh-dominated estuary. Limnol. Oceanogr. 63, 47–71. doi: 10.1002/lno.10614
Wang, Z. A., and Cai, W.-J. (2004). Carbon dioxide degassing and inorganic carbon export from a marsh-dominated estuary (the Duplin River): a marsh CO2 pump. Limnol. Oceanogr. 49, 341–354. doi: 10.4319/lo.2004.49.2.0341
Wang, Z. A., Kroeger, K. D., Ganju, N. K., Gonneea, M. E., and Chu, S. N. (2016). Intertidal salt marshes as an important source of inorganic carbon to the coastal ocean. Limnol. Oceanogr. 61, 1916–1931. doi: 10.1002/lno.10347
Wang, Z. A., Sonnichsen, F. N., Bradley, A. M., Hoering, K. A., Lanagan, T. M., Chu, S. N., et al. (2015). An In-situ Sensor Technology for Simultaneous Spectrophotometric Measurements of Seawater Total Dissolved Inorganic Carbon and pH. Environ. Sci. Technol. 49, 4441–4449. doi: 10.1021/es504893n
Wanninkhof, R. (1992). Relationship between wind speed and gas exchange over the ocean. J. Geophys. Res. Oceans 97, 7373–7382. doi: 10.1029/92jc00188
Weiss, R. F. (1974). Carbon dioxide in water and seawater: the solubility of a non-ideal gas. Mar. Chem. 2, 203–215. doi: 10.1016/0304-4203(74)90015-2
Weiss, R. F., and Price, B. A. (1980). Nitrous oxide solubility in water and seawater. Mar. Chem. 8, 347–359.
Wootton, J. T., Pfister, C. A., and Forester, J. D. (2008). Dynamic patterns and ecological impacts of declining ocean pH in a high-resolution multi-year dataset. Proc. Natl. Acad. Sci. U. S. A. 105, 18848–18853. doi: 10.1073/pnas.0810079105
Ye, N. H., Zhang, X. W., Mao, Y. Z., Liang, C. W., Xu, D., Zou, J., et al. (2011). ‘Green tides’ are overwhelming the coastline of our blue planet: taking the world’s largest example. Ecol. Res. 26, 477–485. doi: 10.1007/s11284-011-0821-8
Keywords: acidification, hypoxia, estuary, respiration, carbon dioxide, pH, dissolved oxygen, ecosystem metabolism
Citation: Wallace RB, Peterson BJ and Gobler CJ (2021) Ecosystem Metabolism Modulates the Dynamics of Hypoxia and Acidification Across Temperate Coastal Habitat Types. Front. Mar. Sci. 8:611781. doi: 10.3389/fmars.2021.611781
Received: 29 September 2020; Accepted: 16 November 2021;
Published: 13 December 2021.
Edited by:
Hongjie Wang, Pacific Marine Environmental Laboratory, National Oceanic and Atmospheric Administration (NOAA), United StatesReviewed by:
Xianghui Guo, Xiamen University, ChinaJacob Carstensen, Aarhus University, Denmark
Stephen Roger Pacella, United States Environmental Protection Agency (EPA), United States
Copyright © 2021 Wallace, Peterson and Gobler. This is an open-access article distributed under the terms of the Creative Commons Attribution License (CC BY). The use, distribution or reproduction in other forums is permitted, provided the original author(s) and the copyright owner(s) are credited and that the original publication in this journal is cited, in accordance with accepted academic practice. No use, distribution or reproduction is permitted which does not comply with these terms.
*Correspondence: Ryan B. Wallace, cndhbGxhY2VAYWRlbHBoaS5lZHU=; Christopher J. Gobler, Q2hyaXN0b3BoZXIuZ29ibGVyQHN0b255YnJvb2suZWR1