 Celia Marlowe
 Kieran Hyder
 Martin D. J. Sayer
 Jan Kaiser
- 1Centre for Ocean and Atmospheric Sciences, School of Environmental Sciences, University of East Anglia, Norwich, United Kingdom
- 2Centre for Environment, Fisheries and Aquaculture Science (Cefas), Lowestoft, United Kingdom
- 3Natural Environment Research Council (NERC) National Facility for Scientific Diving, Scottish Association for Marine Science, Dunbeg, United Kingdom
- 4Tritonia Scientific Ltd., Dunstaffnage Marine Laboratories, Dunbeg, United Kingdom
There is a lack of depth-resolved temperature data, especially in coastal areas, which are often commonly dived by SCUBA divers. Many case studies have demonstrated that citizen science can provide high quality data, although users require more confidence in the accuracy of these data. This study examined the response time, accuracy and precision of water temperature measurement in 28 dive computers plus three underwater cameras, from 12 models. A total of 239 temperature response times (τ) were collected from 29 devices over 11 chamber dives. Mean τ by device ranged from (17 ± 6) to (341 ± 69) s, with significant between-model differences found for τ across all models. Clear differences were found in τ by pressure sensor location and material, but not by size. Two models had comparable τ to designed-for-purpose aquatic temperature loggers. 337 mean data points were collected from equilibrated temperatures in hyperbaric chamber (n = 185) and sea (n = 152) dives, compared with baseline mean temperature from Castaway CTDs over the same time period. Mean bias, defined as mean device temperature minus baseline temperature, by model ranged from (0.0 ± 0.5) to (−1.4 ± 2.1) °C and by device from (0.0 ± 0.6) to (−3.4 ± 1.0) °C. Nine of the twelve models were found to have “good” accuracy (≤0.5 °C) overall. Irrespective of model, the overall mean bias of (−0.2 ± 1.1) °C is comparable with existing commonly used coastal temperature data sets, and within global ocean observing system accuracy requirements for in situ temperature. Our research shows that the quality of temperature data in dive computers could be improved, but, with collection of appropriate metadata to allow assessment of data quality, some models of dive computers have a role in future oceanographic monitoring.
Introduction
The oceans have a critical role in climate change, acting as a heat sink and being responsible for the uptake of more than 90% of the excess heat in our climate system between 1971 and 2010 (Pörtner et al., 2019; Johnson and Lyman, 2020). Warming ocean temperatures are intrinsically linked to sea level rise and projections show the rise accelerating because of non-linear thermal expansion (Widlansky et al., 2020). In addition, the number and severity of occurrences of extreme events linked to increased sea temperatures, such as heat waves, are expected to increase with global warming (Bindoff et al., 2019). Global sea surface temperature (SST) is projected to rise by up to 6.4 °C depending on the emission scenario (Aral and Guan, 2016); accordingly, both sea surface and subsurface temperatures are defined as essential climate variables (Bojinski and Richter, 2010; Lindstrom et al., 2012). However, there is regional variability (Kennedy, 2014); for example, SST around the British Isles has been increasing at a rate of up to six times the global average rate (Dye et al., 2013) and at twice the global rate in offshore China since 2011 (Tang et al., 2020). In contrast, parts of the North Atlantic have experienced cooling (Wright et al., 2016). Shifts in biodiversity have been seen in response to variations in temperature between 0.1 and 0.4 °C (Danovaro et al., 2020), with shallow seasonal thermoclines being important to ecosystem dynamics, horizontal and vertical distribution of fish (Aspillaga et al., 2017) and biological production (Palacios et al., 2004). Variation and oscillations in thermocline depth and temperature have been recorded during the stratification period (Bensoussan et al., 2010; Aspillaga et al., 2017).
In situ data are essential to monitor these local variations, supplement satellite sea surface temperature data and validate ocean models (Brewin et al., 2017), but there are a lack of depth-resolved temperature data (Wright et al., 2016) and few time series on localised variations in thermoclines (Bensoussan et al., 2010). This lack in data is especially true in areas near to the coast which research vessels and Argo floats cannot commonly reach (Wright et al., 2016). Citizen science has been shown to provide opportunities for collecting data at broad spatial and temporal scales, which would not be possible by traditional means because of accessibility and financial constraints (Pocock et al., 2014; Wright et al., 2016). Many case studies have shown that citizen science can provide high quality data (Kosmala et al., 2016) with comparable accuracy to dedicated research studies (Vianna et al., 2014; Albus et al., 2019; Krabbenhoft and Kashian, 2020), but with uncertainty regarding the reliability and quality of data (Burgess et al., 2016; Gibson et al., 2019). To address these concerns, and to increase the value of existing datasets, users require more confidence in the accuracy of these data (Burgess et al., 2016; Kosmala et al., 2016). In situ measurements should have associated uncertainty estimates (Barker et al., 2015). Post hoc data quality assessment and error detection have been found to dispel doubts about data quality (Burgess et al., 2016).
SCUBA divers (from here on referred to as divers) have been involved in many marine citizen science projects (Thiel et al., 2014; Hermoso et al., 2019) including marine protected area monitoring (Pocock et al., 2014), reef habitat/biodiversity surveys (Branchini et al., 2015; Hermoso et al., 2019) and marine debris collection (Pasternak et al., 2019). Some areas most frequently accessed by citizen scientist divers are the shallow coastal subtidal areas (e.g., to depths < 40 m; Thiel et al., 2014) where reliable physico-chemical data series are sparse. Within the estimated 6–10 million recreational divers globally (Wright et al., 2016) the use of dive computers may be approaching 100% (Azzopardi and Sayer, 2010). Dive computers are worn with the primary purpose of managing decompression limits via algorithms which calculate the level of nitrogen load in tissues. Most modern dive computers record profiles of temperature and depth, with the latter derived from a dedicated pressure sensor. Temperature data are required to correct for non-linear pressure sensor output as ambient temperature changes (Li et al., 2016), but as temperature does not have the same impact on decompression algorithms as pressure, the same level of accuracy is not required. Consequently, temperature data are obtained from thermal corrections applied to the pressure sensor (Azzopardi and Sayer, 2010; Wright et al., 2016), rather than from a dedicated temperature sensor. Temperature readings are not calibrated, and only have an advertised accuracy (where published by manufacturers) of ± 2 °C (Mares, 2020; Azzopardi and Sayer, 2012), or ± 2 °C within 20 min of temperature change (Suunto, 2018). Previous research has explored the possibility of collecting temperature data from dive computers. Wright et al. (2016) concluded that, with processing, temperature data from dive computers could be a useful resource. Other authors recommend that these data be avoided for scientific study (Azzopardi and Sayer, 2012), or state that dive computers do not have sufficient accuracy to measure ocean temperature changes (Egi et al., 2018).
This study builds on the work carried out by Wright et al. (2016) and investigates a range of dive computers in replicated experiments which aim to mimic real-world scenarios, to quantify the temperature responses of different models; aiming to address some of the concerns regarding the potential use of these data. We focus on three objective measures; the time constant τ, accuracy and precision. Time constants are used to measure a sensor’s response to change; representing the time taken for 63% of the total step change in temperature to have taken place. τ is useful in the context of oceanographic temperature change (such as thermocline identification), and, in conjunction with the sample rate, the potential to gather useful data from relatively short dive profiles. Temperature accuracy is defined as the systematic error in the devices’ temperature measurement when compared with a reference temperature, such as from a calibrated microCTD. By focusing on these measures, this paper investigates the potential of different devices as alternative sources of in situ temperature for oceanographic monitoring. The response to temperature change within and between models and as a function of the dive computer’s body material, size, pressure sensor location and attachment to the diver (i.e., worn on the wrist or hanging freely) are analysed to ascertain whether some models or features may offer potential for higher quality data than others.
Materials and Methods
Equipment
28 dive computers (11 models from 7 brands), along with three Paralenz Dive Camera+ cameras (for the purposes of this study referred to collectively as “dive computers”; see Table 1) were analysed. All devices shared the ability to record full profiles of temperature and depth as a function of time, except Suunto Vypers, which only store a single minimum temperature per dive. All devices were able to sample at intervals of 30 s or less and were set to the highest frequency possible for each model for all dives.
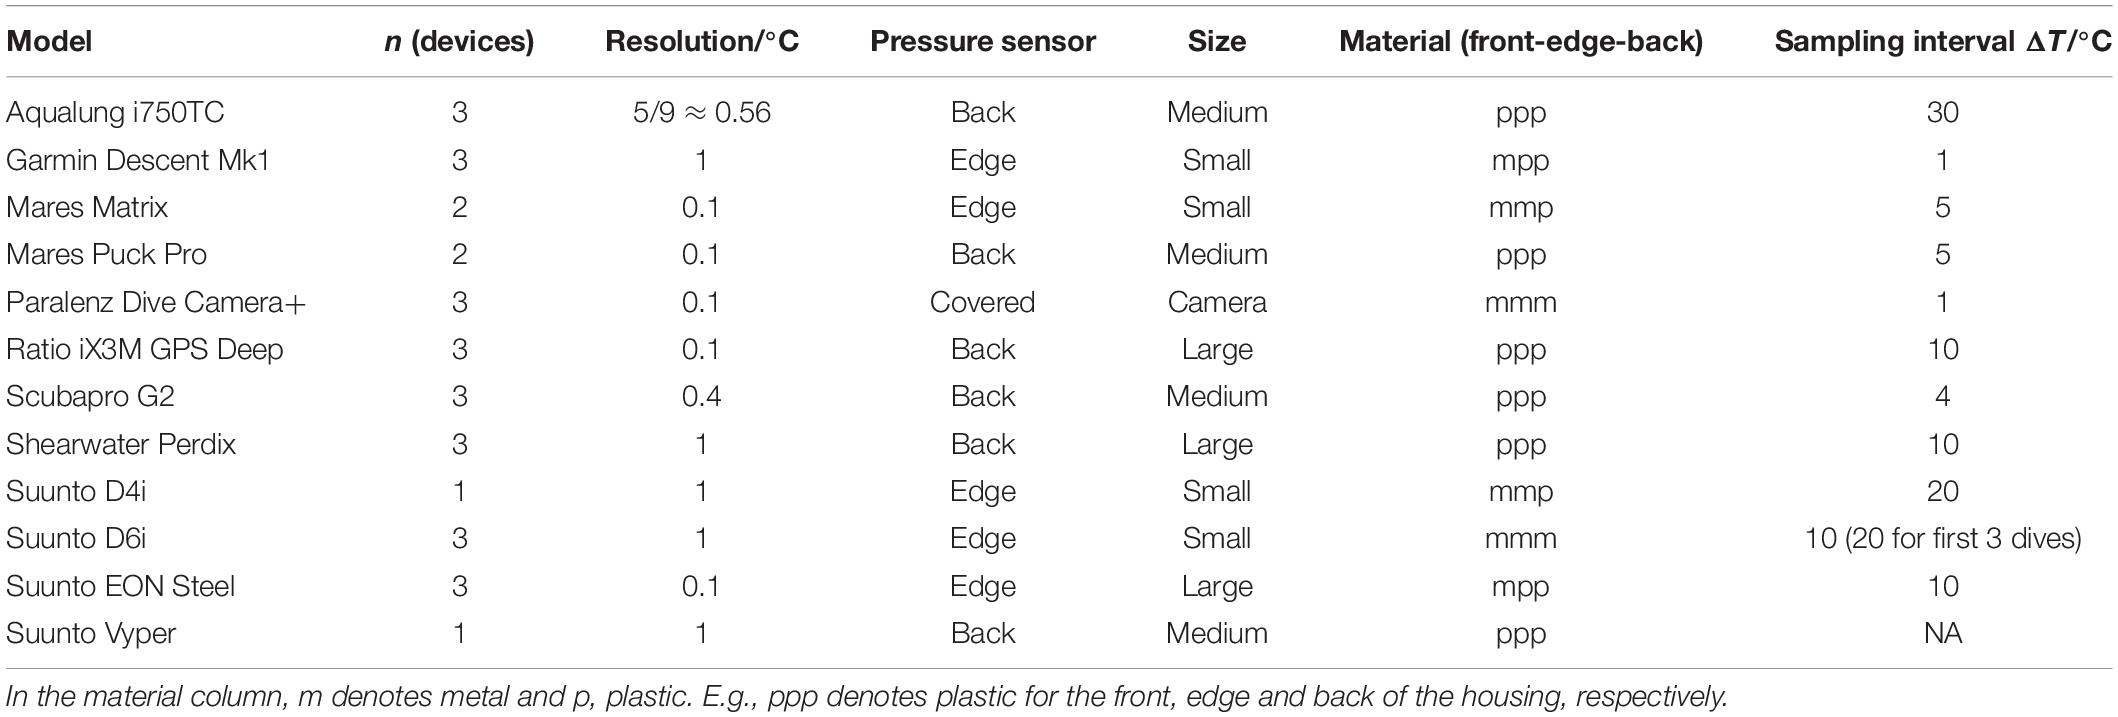
Table 1. Outlines the models used and their categorisations within this study.
Recorded temperature resolution ranged from 0.1 to 1 °C. The devices were categorised into four “sizes”: “Small” (diameter < 5 cm), “Medium” (5 cm < diameter < 7.5 cm), “Large” (diameter > 7.5 cm), and “Camera” and further classified by pressure sensor location based on the identifying small holes in the housing material into “Back” or “Edge” with Paralenzes being defined as “Covered” (Table 1). Material was a composite category based on front, edge and back material being metal (m) or plastic (p).
All hyperbaric tests were carried out in a cylindrical two-compartment, 2,000 mm diameter Divex therapeutic recompression chamber, manually controlled to compress to the simulated nominal depths, as described by Sayer et al. (2014). For all baseline temperature measurements with the exception of water bath trials, three SonTek CastAway CTDs (CTD = Conductivity, Temperature, Depth) with 0.01 °C resolution, ± 0.05 °C accuracy, sampling rate of 5 Hz (SonTek CastAway CTD, 2020) were used. For unpressurised temperature comparison a Grant R4 refrigerated bath with TXF200 heating circulator was used.
Time Constants (τ)
Inside the hyperbaric chamber, all devices and Castaways were immersed to (8.5 ± 2.5) cm in a tub containing 13 litres of cold (10 ± 1) °C fresh water and allowed to acclimatise for 10 min, as high ambient air temperature has been demonstrated to affect temperature profiles for several minutes into a dive. Three further tubs were filled with well-mixed warm water between 18 and 25 °C. Although fitted with an environmental control unit it was not possible to regulate chamber air temperature precisely; varying between 18 and 27 °C over the course of a single dive of 1 h duration, caused by the heating effect of compression and subsequent cooling across the non-insulated chamber walls. To minimise the impact of the changing chamber temperature on tub temperature, warm tubs starting temperatures approximated the mid-point of potential chamber ascent temperatures (as measured with a stick digital thermometer).
Some models allow manual switching between salt and freshwater mode (densities unspecified by manufacturers), but to allow comparison between dive computers which did not have this capability, all dive computers were left in default salt-water mode for all dives with the exception of the Shearwater Perdix which was set to “EN13319” mode (1,020 kg m–3 water density) (Shearwater, 2020). All devices were allowed to automatically start recording temperature profiles according to their default pressure parameters, except for Paralenz Dive Camera+, which were started manually.
After acclimatisation, all tubs were compressed to a maximum simulated depth of between 9 and 10.4 m. Once the simulated depth was reached, one Castaway was moved from the cold bucket to each of the warm tubs and stirred well, followed by a further 2 min of acclimatisation. One Paralenz Dive Camera+ was then moved into each warm tub and stirred well. Early trials established that all devices reached temperature equilibrium before 7 min. Therefore, after 7 min all Paralenz Dive Camera+ were removed and switched off to conserve battery life. Subsequently, a dive computer was moved into each of the warm tubs, stirred well, then left for 7 min, repeated until all the devices had been transferred. This interval approach was designed to minimise any effect of cold-water ingress by the transfer of devices between tubs, without impacting the temperature response of previously added devices. Two dives were carried out with the same depth/tub protocol using only the three Paralenz Dive Camera+ devices, and nine replicates with all devices (Schema in Supplementary Figure 1).
Dive profiles were downloaded from individual devices into the open-source divelog software, Subsurface (Subsurface, 2020). Profiles were then combined in an XML-based format and exported into R Studio for processing. For each dive by device, data were aligned to the start point of the response curve and sliced at the first instance of the maximum temperature, isolating the full temperature response (Figure 1). In contrast to the findings of Egi et al. (2018), not all models’ temperature response had a single exponential form, and linear regression did not consistently produce a good fit. Time constants were ascertained by exponential fitting via numerical integration as defined by Jacquelin (2009), using the area under the curve to calculate τ, allowing linear regression to be applied to non-linear data without estimation of parameters (Jacquelin, 2009).
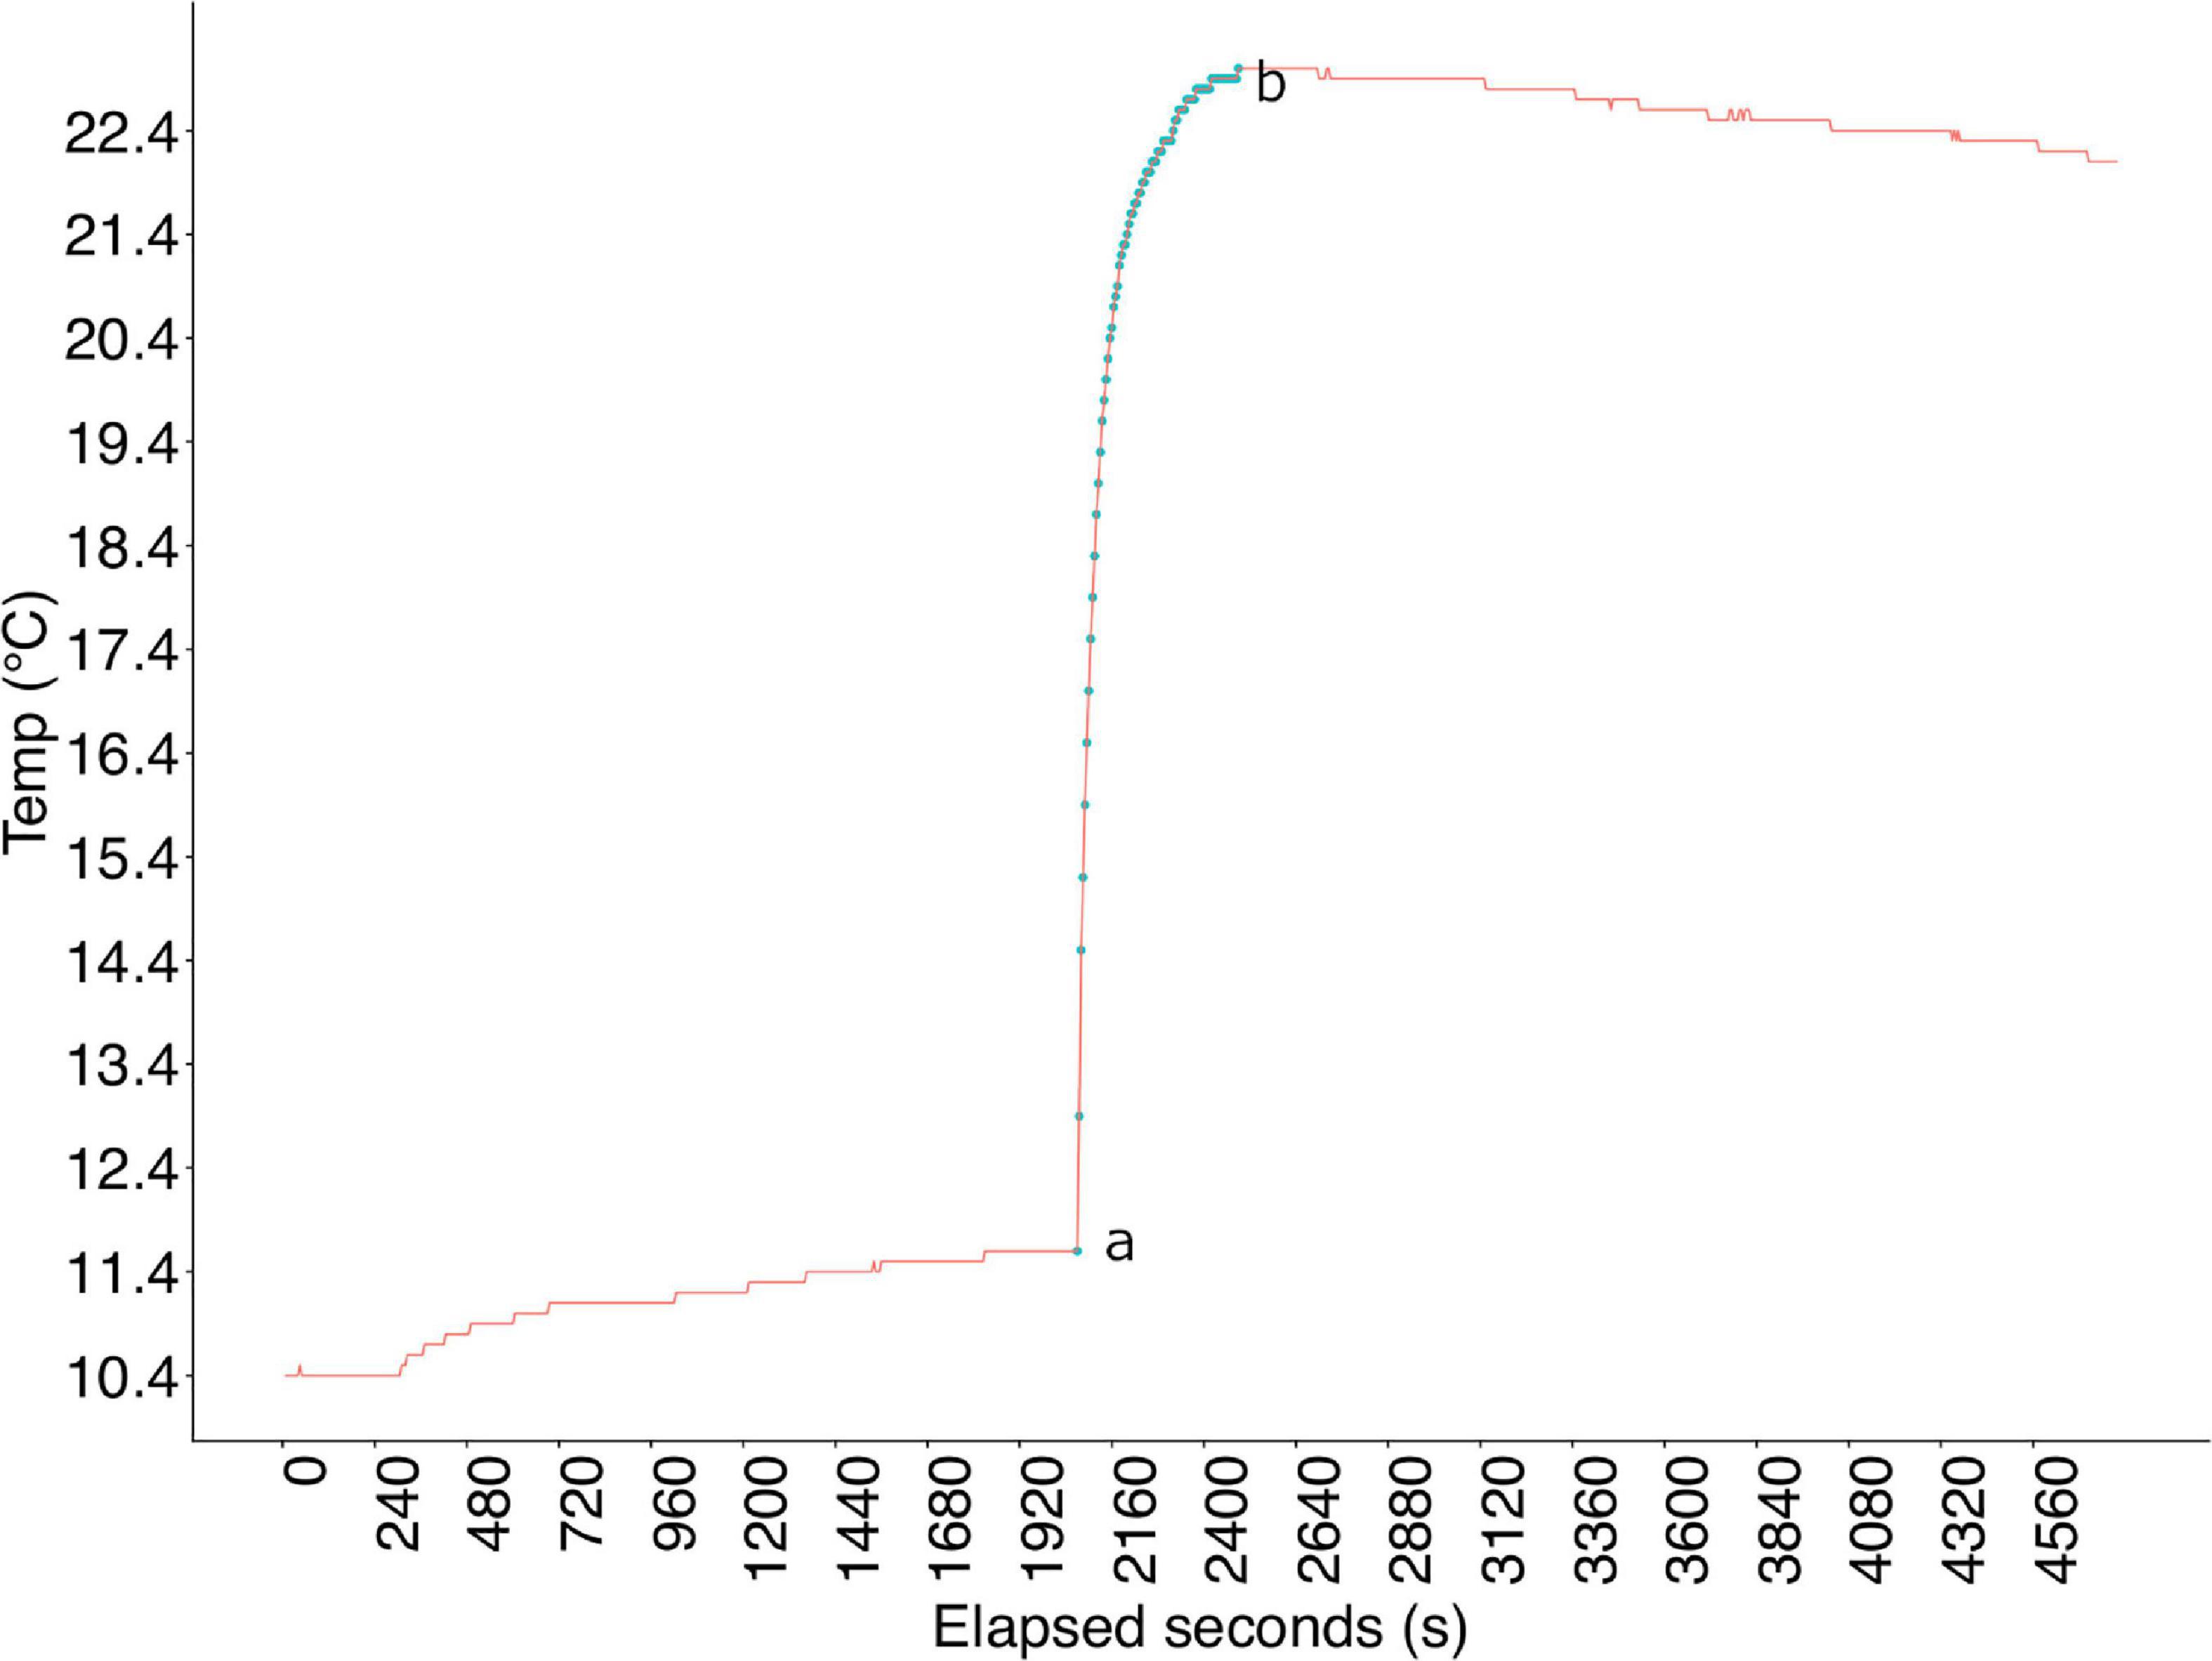
Figure 1. Example of response curve for one dive/device. Elapsed seconds is the entire dive profile during which all devices were moved between cold and warm tub at 7 min intervals.
Accuracy
Three protocols were followed to assess the temperature accuracy and consistency of the dive computers.
Water Bath
Dive computers only start to record profiles once they reach a prescribed pressure, but for safety reasons, it is not possible to put a temperature-controlled water bath in a pressurised chamber environment. Therefore, trials were conducted in an unpressurised environment and the temperatures were visually recorded from the computer displays. Water temperature was controlled using a Grant R4 refrigerated bath filled with deionised water, with the circulation set to maximum and temperature equilibrated to (20.0 ± 0.1) °C. Between 9 and 11 devices could be submerged in the water bath at once, so the experiments were run in a series of batches. An initial batch was submerged in the bath for 15 min (three times the maximum mean model time constant, by which time all devices have equilibrated to final temperature). Temperature was then read from the digital display of each device whilst still submerged, and the device removed from the bath. Once all device temperatures had been read the subsequent batch was submerged for 15 min and the process repeated. The process was then repeated at bath temperatures of 10 and 30 °C. For analysis, the deviation of on-screen temperature display from the water bath temperature was noted. On-screen temperature resolution for all devices is limited to 1 °C, with the exception of the Ratio iX3M GPS Deep which display temperature on-screen at a resolution of 0.1 °C.
Chamber
Six replicate dives were carried out in the outer lock of the Divex chamber, with a maximum simulated depth of (10 ± 1) m. Three dives included a temperature change from a cold to warm environment and three a warm to cold transition, using one tub for the starting temperature and three for the contrast temperature. All devices acclimatised in a single tub for 10 min, unpressurised, to the same starting temperature (cold or warm, depending on dive). Devices were then shared across the three tubs with contrasting temperature; one Castaway CTD in each tub to provide a baseline. All tubs were compressed to the simulated depth for 10 min, then decompressed and removed (Schema in Supplementary Figure 2). Over the six dives, cold tub final temperature ranged from 10.4 to 12.6 °C and warm tub final temperature ranged from 16.8 to 19.5 °C.
Raw data output from the Castaways was used, retaining the full temperature profile as a function of pressure and time. Castaway depth was calculated from pressure using the swDepth function in R (swDepth, 2020), which uses Fofonoff and Millard’s refitted equation (Fofonoff and Millard, 1983). Device profiles were aligned by depth and time with the relevant Castaway from the same tub. Mean device temperature from the final 180 s at > 2.5 m depth was calculated (to compensate for differences in depth at which devices start recording) by which time all devices had equilibrated to the change in temperature (Supplementary Figure 3). The mean from the equivalent 180 s Castaway data were used as baseline temperature for comparison. Mean bias was defined as mean device temperature minus mean Castaway temperature.
Sea Dives
Six sea dives were carried out by RHIB at dive sites local to Oban (56.41535° N, 5.47184° W), with maximum depths ranging from 13.5 to 30.7 m (mean: 18.6 m). For each pair of dives, half the dive computers were carried hanging loosely on a frame made from plastic piping, and half were worn on the arms of two divers (Figure 2). For subsequent dives in each dive pair, each device was switched to the other mounting position. All Paralenz Dive Camera+ were transported on the frame for all dives (as they were not wrist mountable), along with all Castaways for baseline temperature.
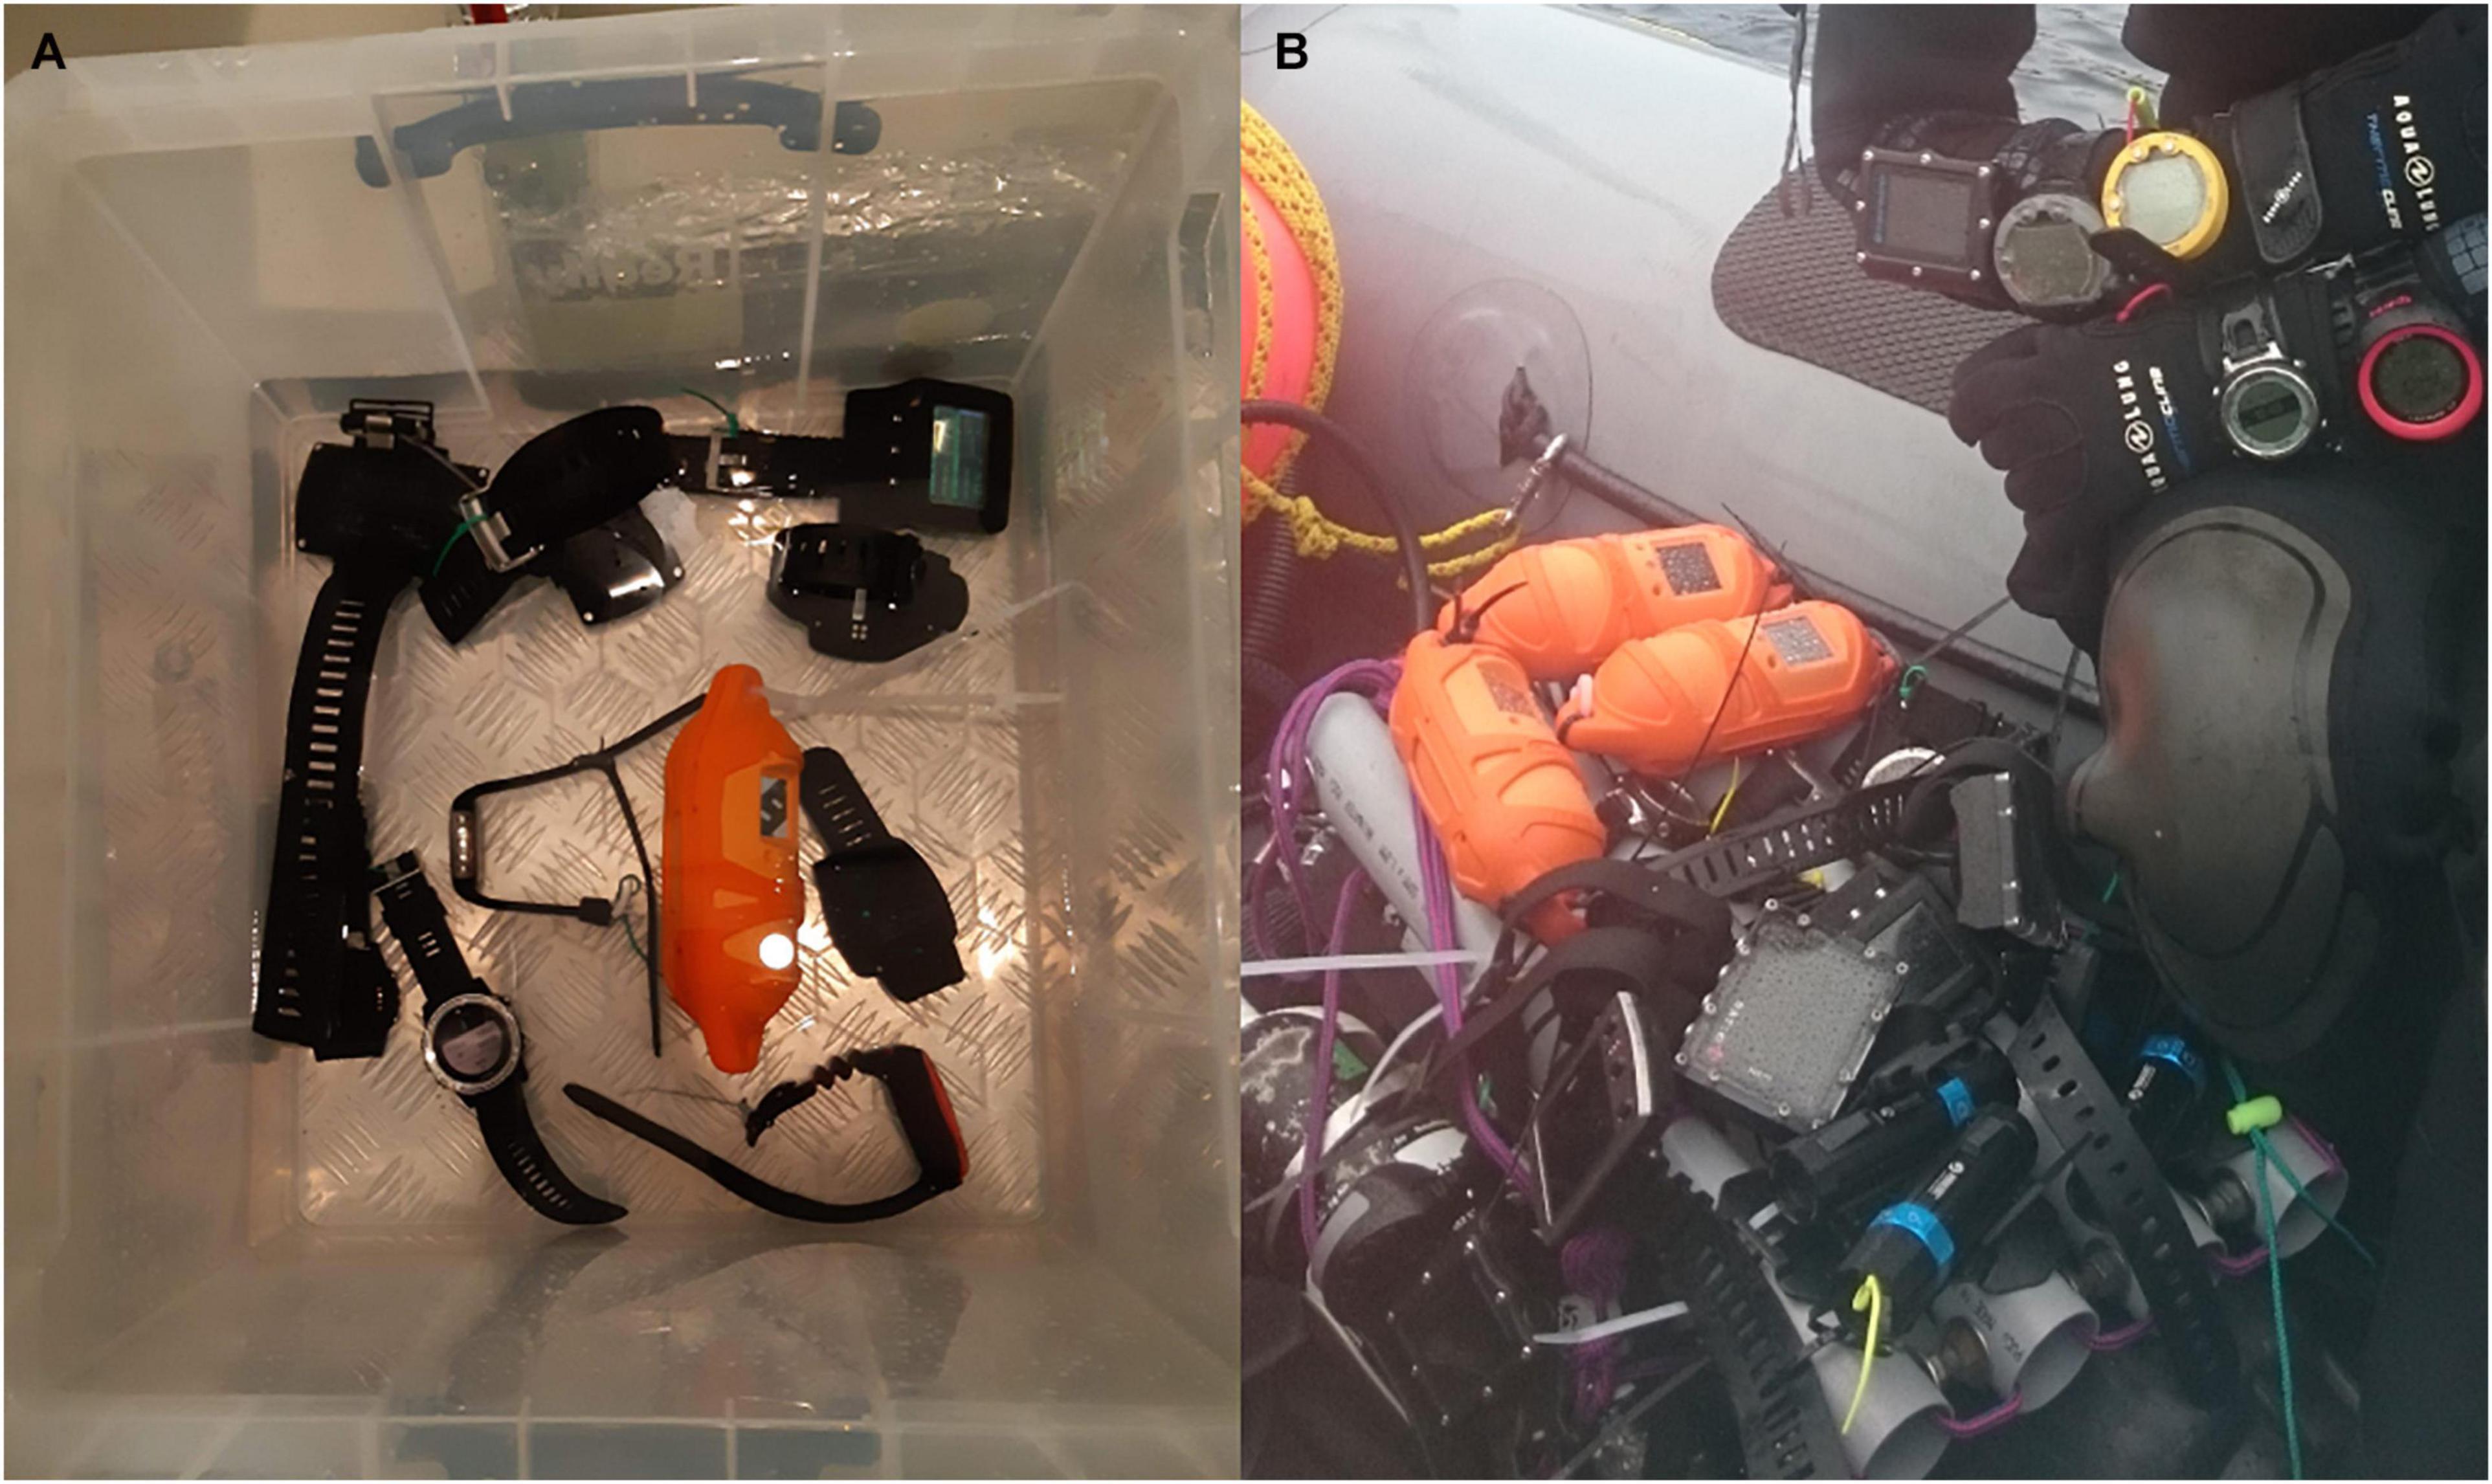
Figure 2. (A) Devices in tub with Castaway in chamber dive. (B) Diver wearing computers on arms, with frame shown in RHIB.
Raw Castaway data was imported, depth calculated as per section “Chamber.” The sea dives had a shallow cold surface thermocline from snow melt run-off. The mean temperature below the depth at which the Castaway temperatures equilibrated (top of the bottom mixed layer) was used as a baseline temperature for comparison for each dive (Supplementary Figure 4). In dive number order this depth was 5, 10, 10, 10, 10, and 12 m. As the frame was carried by divers, and therefore may not have been consistently horizontal, small variations were seen in Castaway depths. Device dive profiles were imported into R Studio and mean temperatures calculated for each device, Castaway and model for the final 180 s below the specified depth (Supplementary Figure 5). Mean bias was defined as mean device/model temperature minus mean Castaway temperature.
Results
As per Wright et al. (2016), devices and models were categorised as accurate if the mean bias from baseline temperature was ≤0.5 °C and as precise if the standard deviation of the mean bias was ≤0.5 °C. Devices were defined as having quick, intermediate or slow response to temperature change (respectively τ < 60 s, 60 s ≤ τ < 120 s, τ ≥ 120 s).
Time Constants
A total of 239 τ values were collected from 26 devices over 9 dives plus three Paralenz Dive Camera+ cameras over 6 dives. 13 τ values were lost because of battery failures or camera recording not initiating correctly. All Ratio iX3M GPS Deep dives and two Shearwater Perdix dives were removed from the analyses because of a poor regression fit (Figure 3).
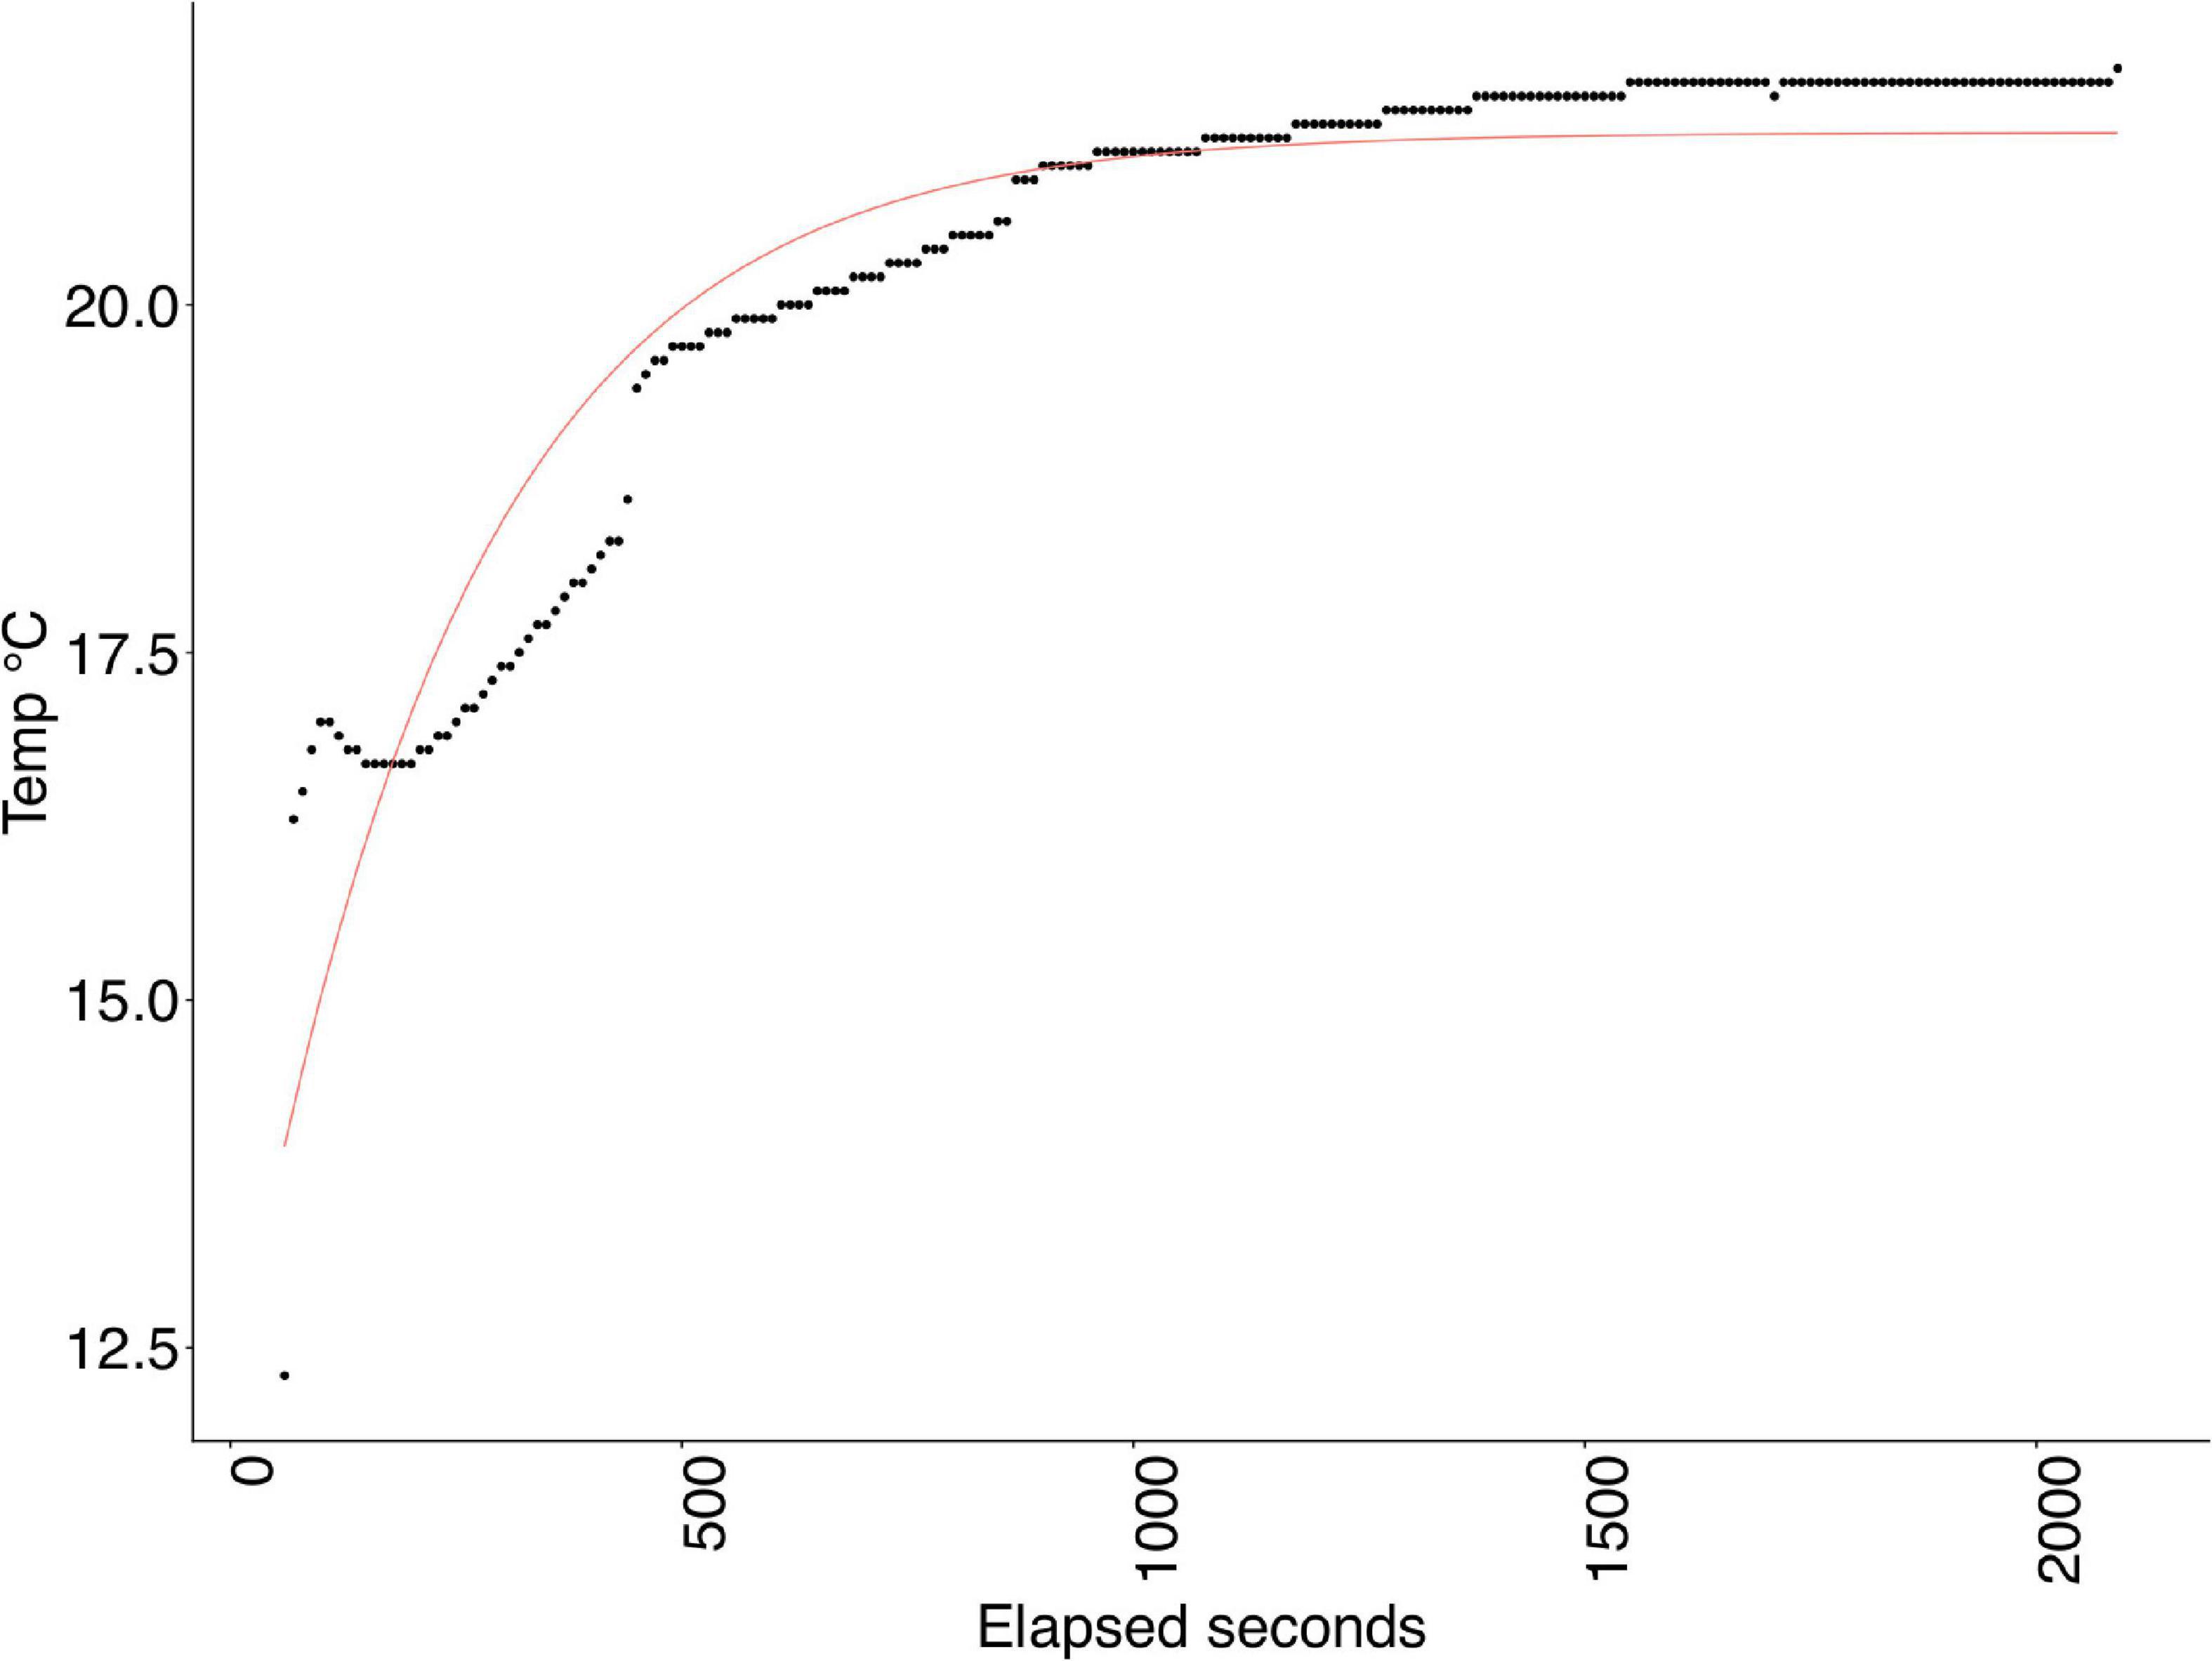
Figure 3. Example of a poor regression fit in Ratio iX3M GPS Deep; devices excluded from further analysis.
Mean τ by model ranged from (18 ± 5) s to (304 ± 45) s (Figure 4 and Supplementary Table 2). Uncertainties represent 1 σ unless otherwise described. Time constants and residuals were not normally distributed; time constants were best fitted to an inverse Gaussian distribution curve. A generalised linear model (GLM) approach was used in R Studio to look for significant differences. Significant between-model differences were found for τ for all models (p < 0.001) [Mares Puck Pro (p < 0.01)]. Mean τ by device ranged from (17 ± 6) to (341 ± 69) s (Figure 5). S(τ fit) represents 95% confidence intervals in the regression fit, based on the standard error of the regression (full data in Supplementary Table 3). S(τ fit) < 10 s was considered to be a good fit and applied to all profiles except for those mentioned in the first paragraph of this section.
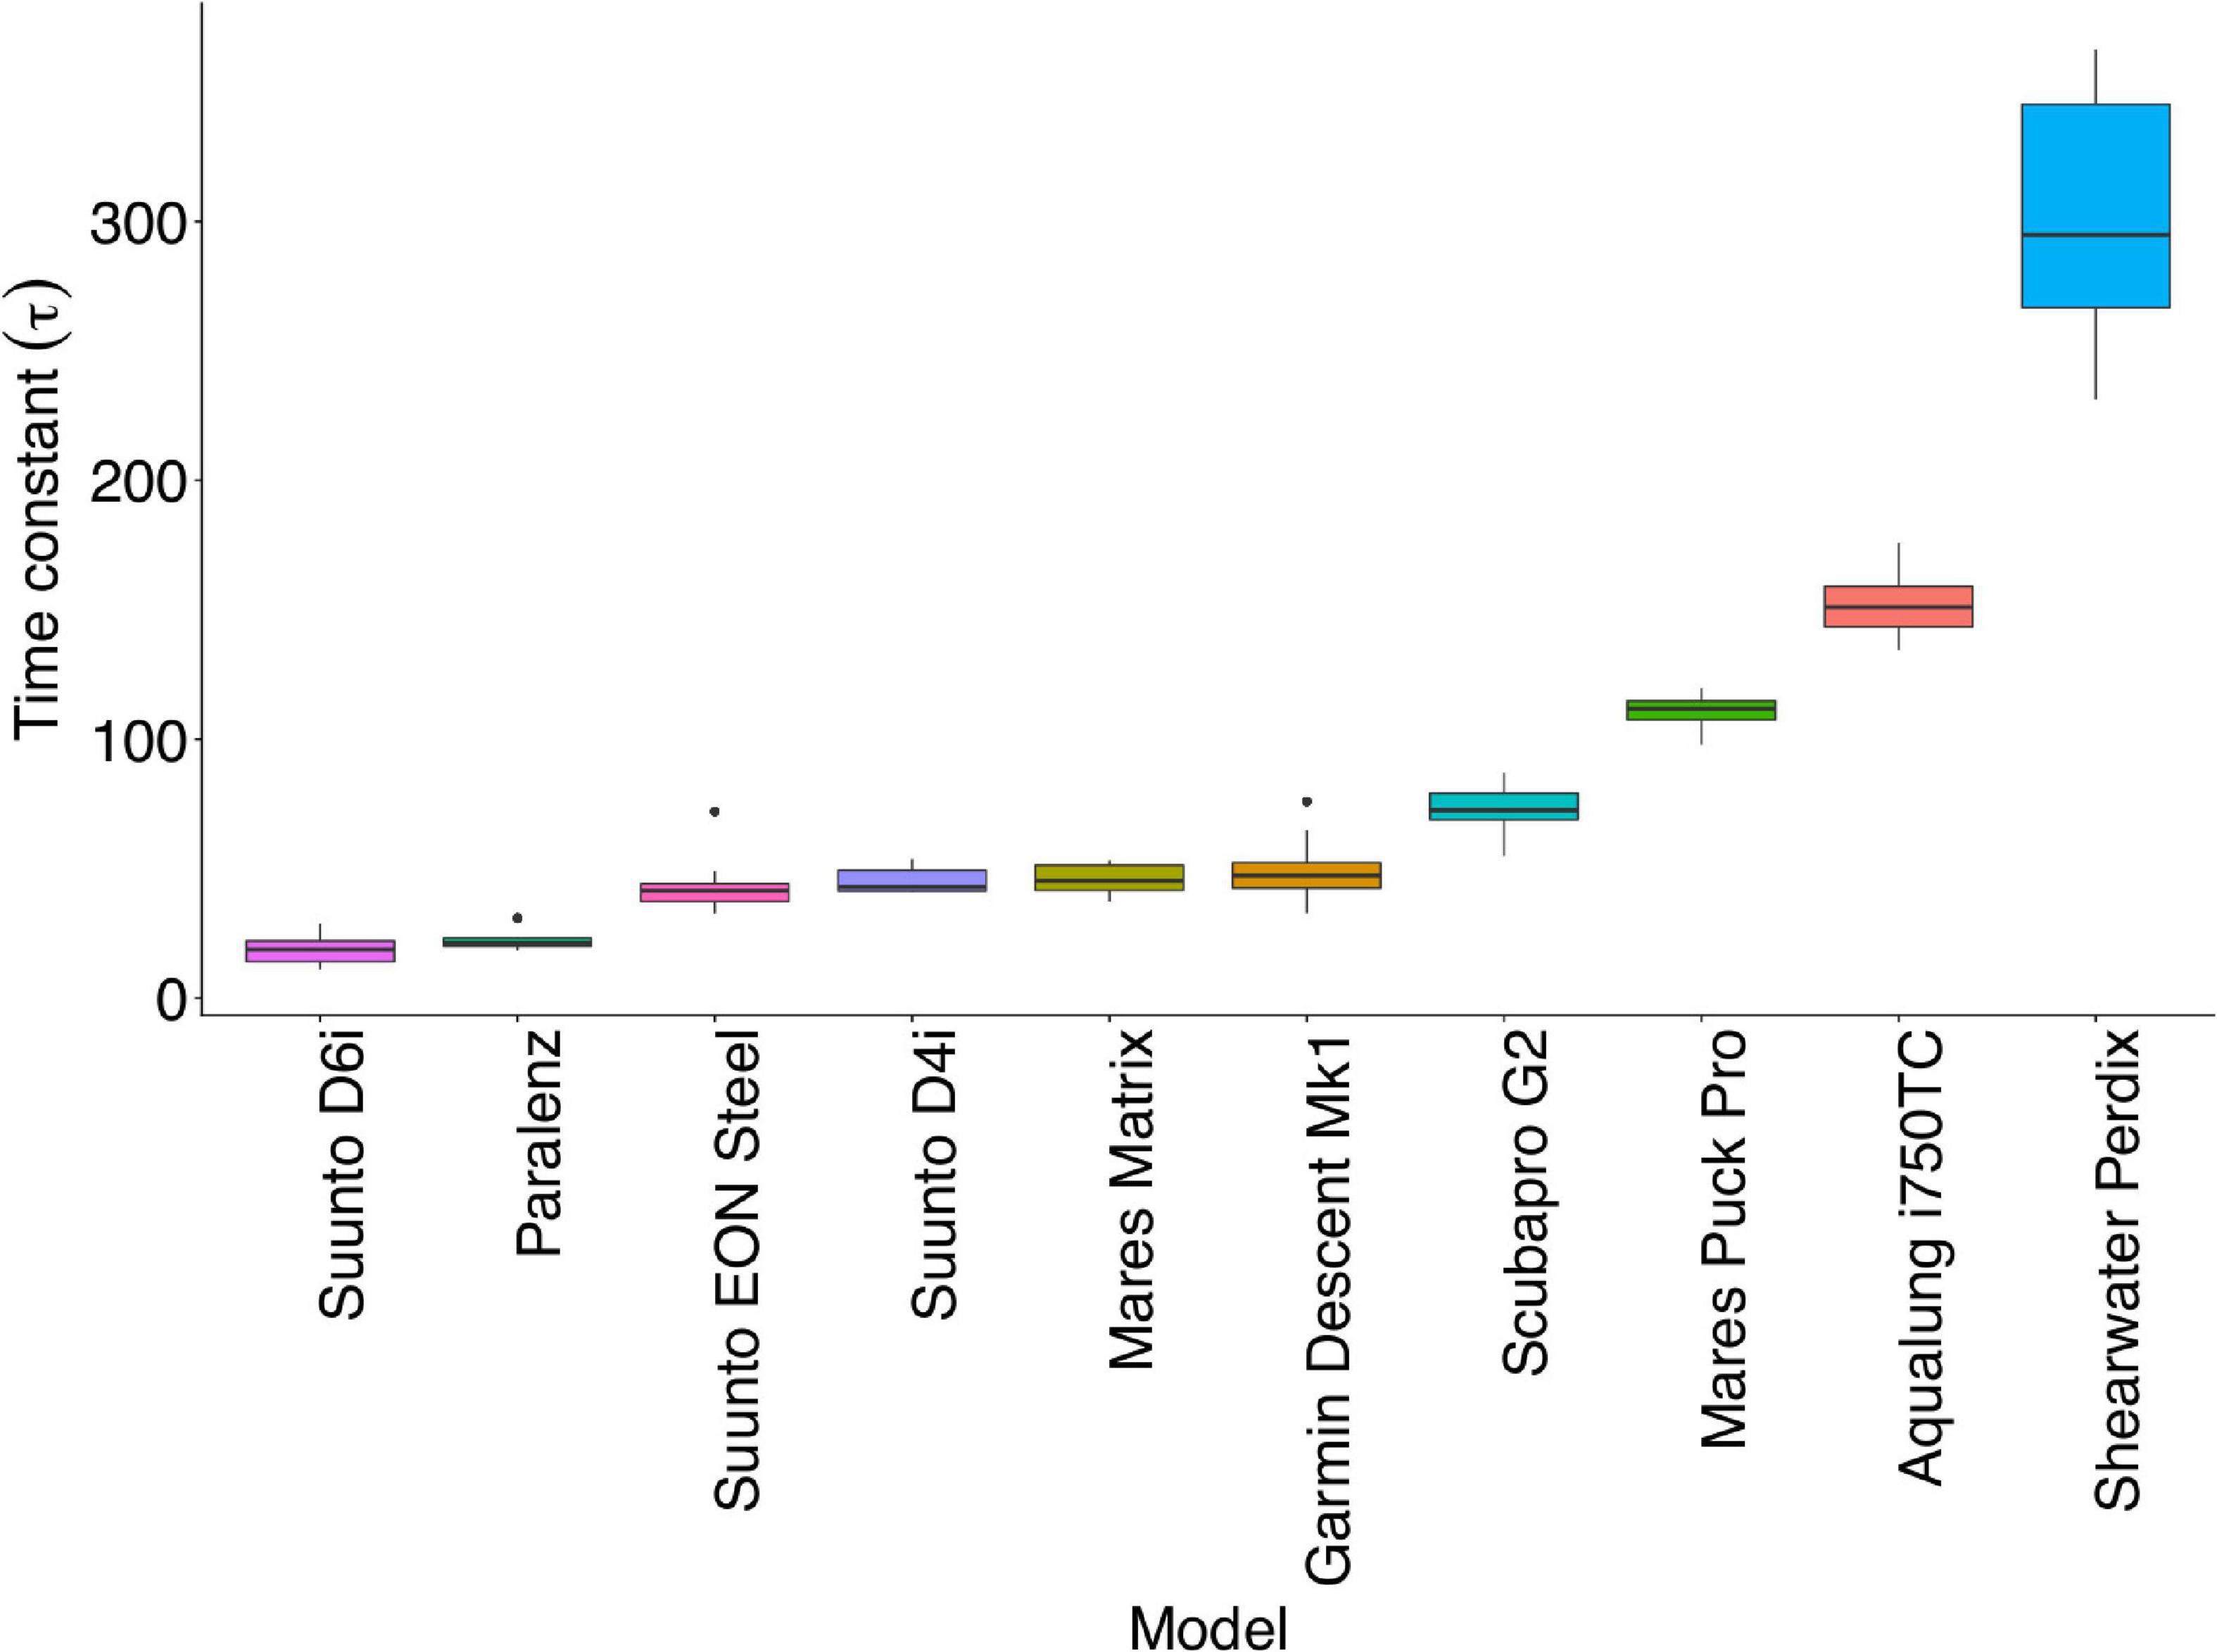
Figure 4. Mean response time (τ) by model. The black line represents the median. The lower and upper hinges correspond to the first and third quartiles (the 25th and 75th percentiles). Upper and lower whiskers extend from the hinge to the largest/smallest value, respectively, no further than 1.5 ∗ inter-quartile range from the hinge. Data beyond the end of the whiskers are plotted individually as outliers.
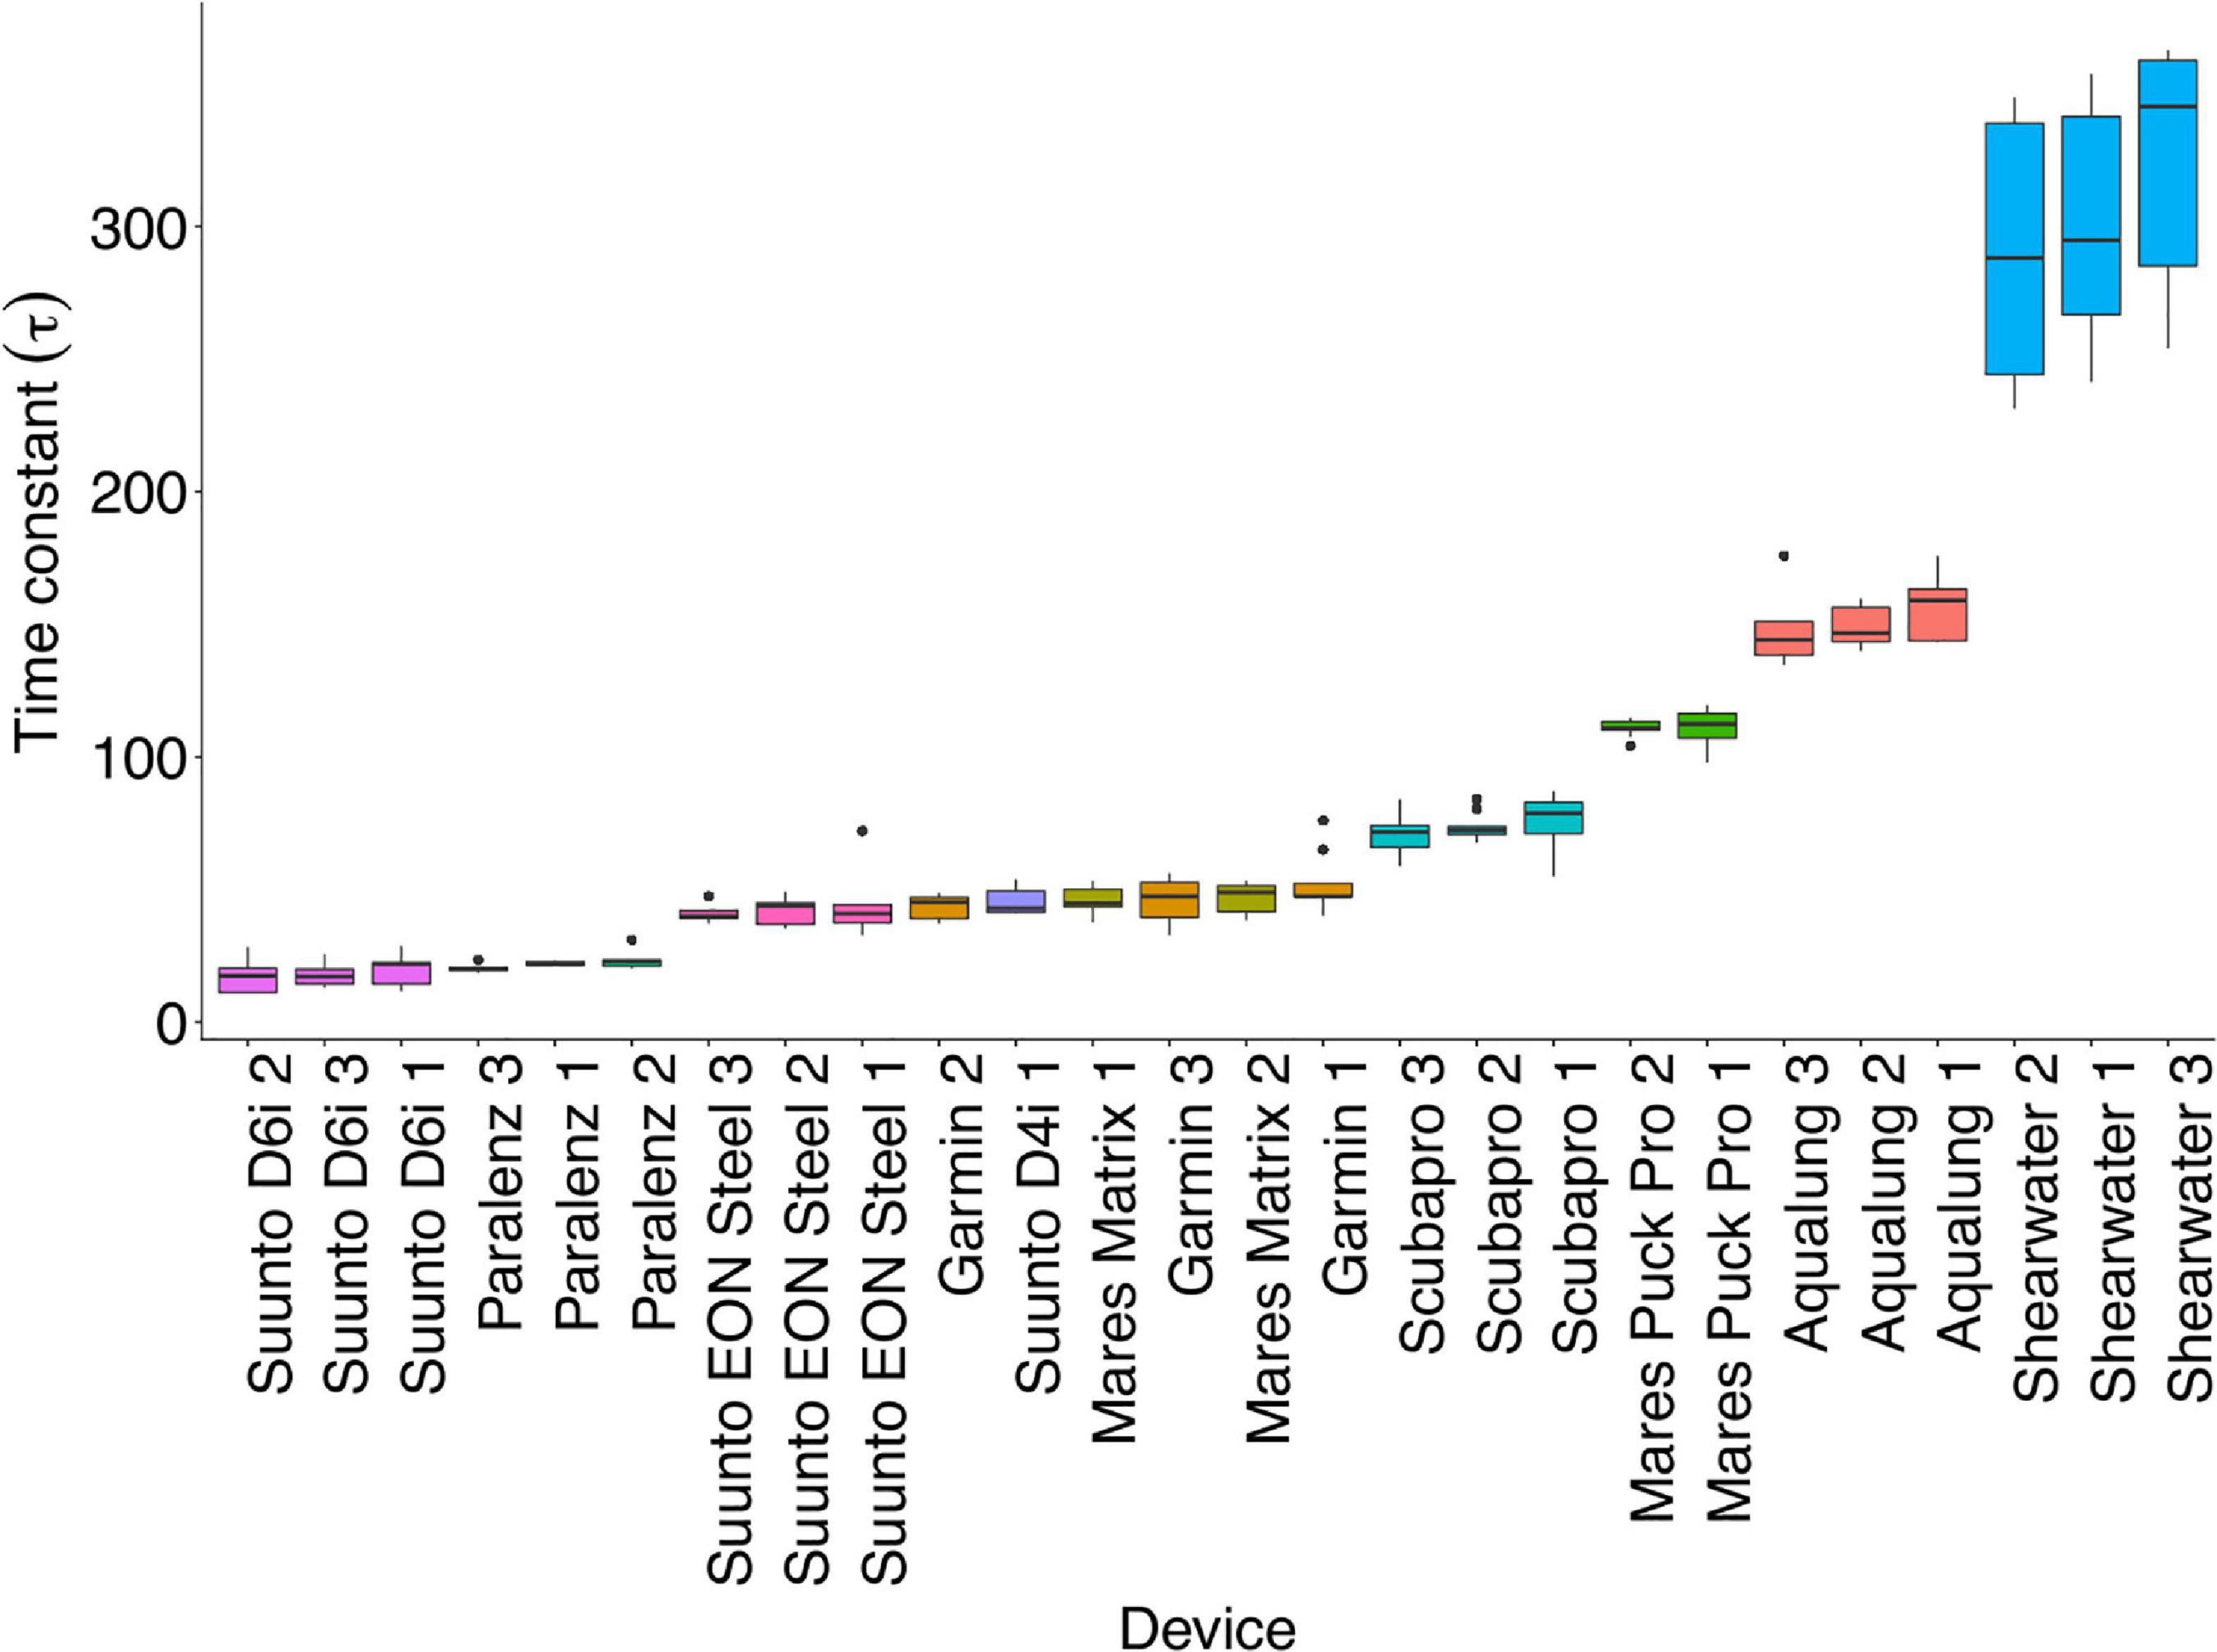
Figure 5. Mean response time (τ) by device. The black line represents the median. The lower and upper hinges correspond to the first and third quartiles (the 25th and 75th percentiles). Upper and lower whiskers extend from the hinge to the largest/smallest value, respectively, no further than 1.5 ∗ inter-quartile range from the hinge. Data beyond the end of the whiskers are plotted individually as outliers.
Clear differences were found in τ by pressure sensor location and material, but not by size (Figure 6). All devices with the pressure sensor at the edge along with the Paralenz Dive Camera+ were defined as having a quick response (17 s ≤ τ < 52 s) and all with a pressure sensor at the back were classified as intermediate or slow responders. Devices with entirely metal housing had quick mean response (17 s ≤ τ < 24 s), part metal/part plastic were intermediate (41 s ≤ τ < 52 s) and all plastic were slowest (70 s ≤ τ < 322 s).
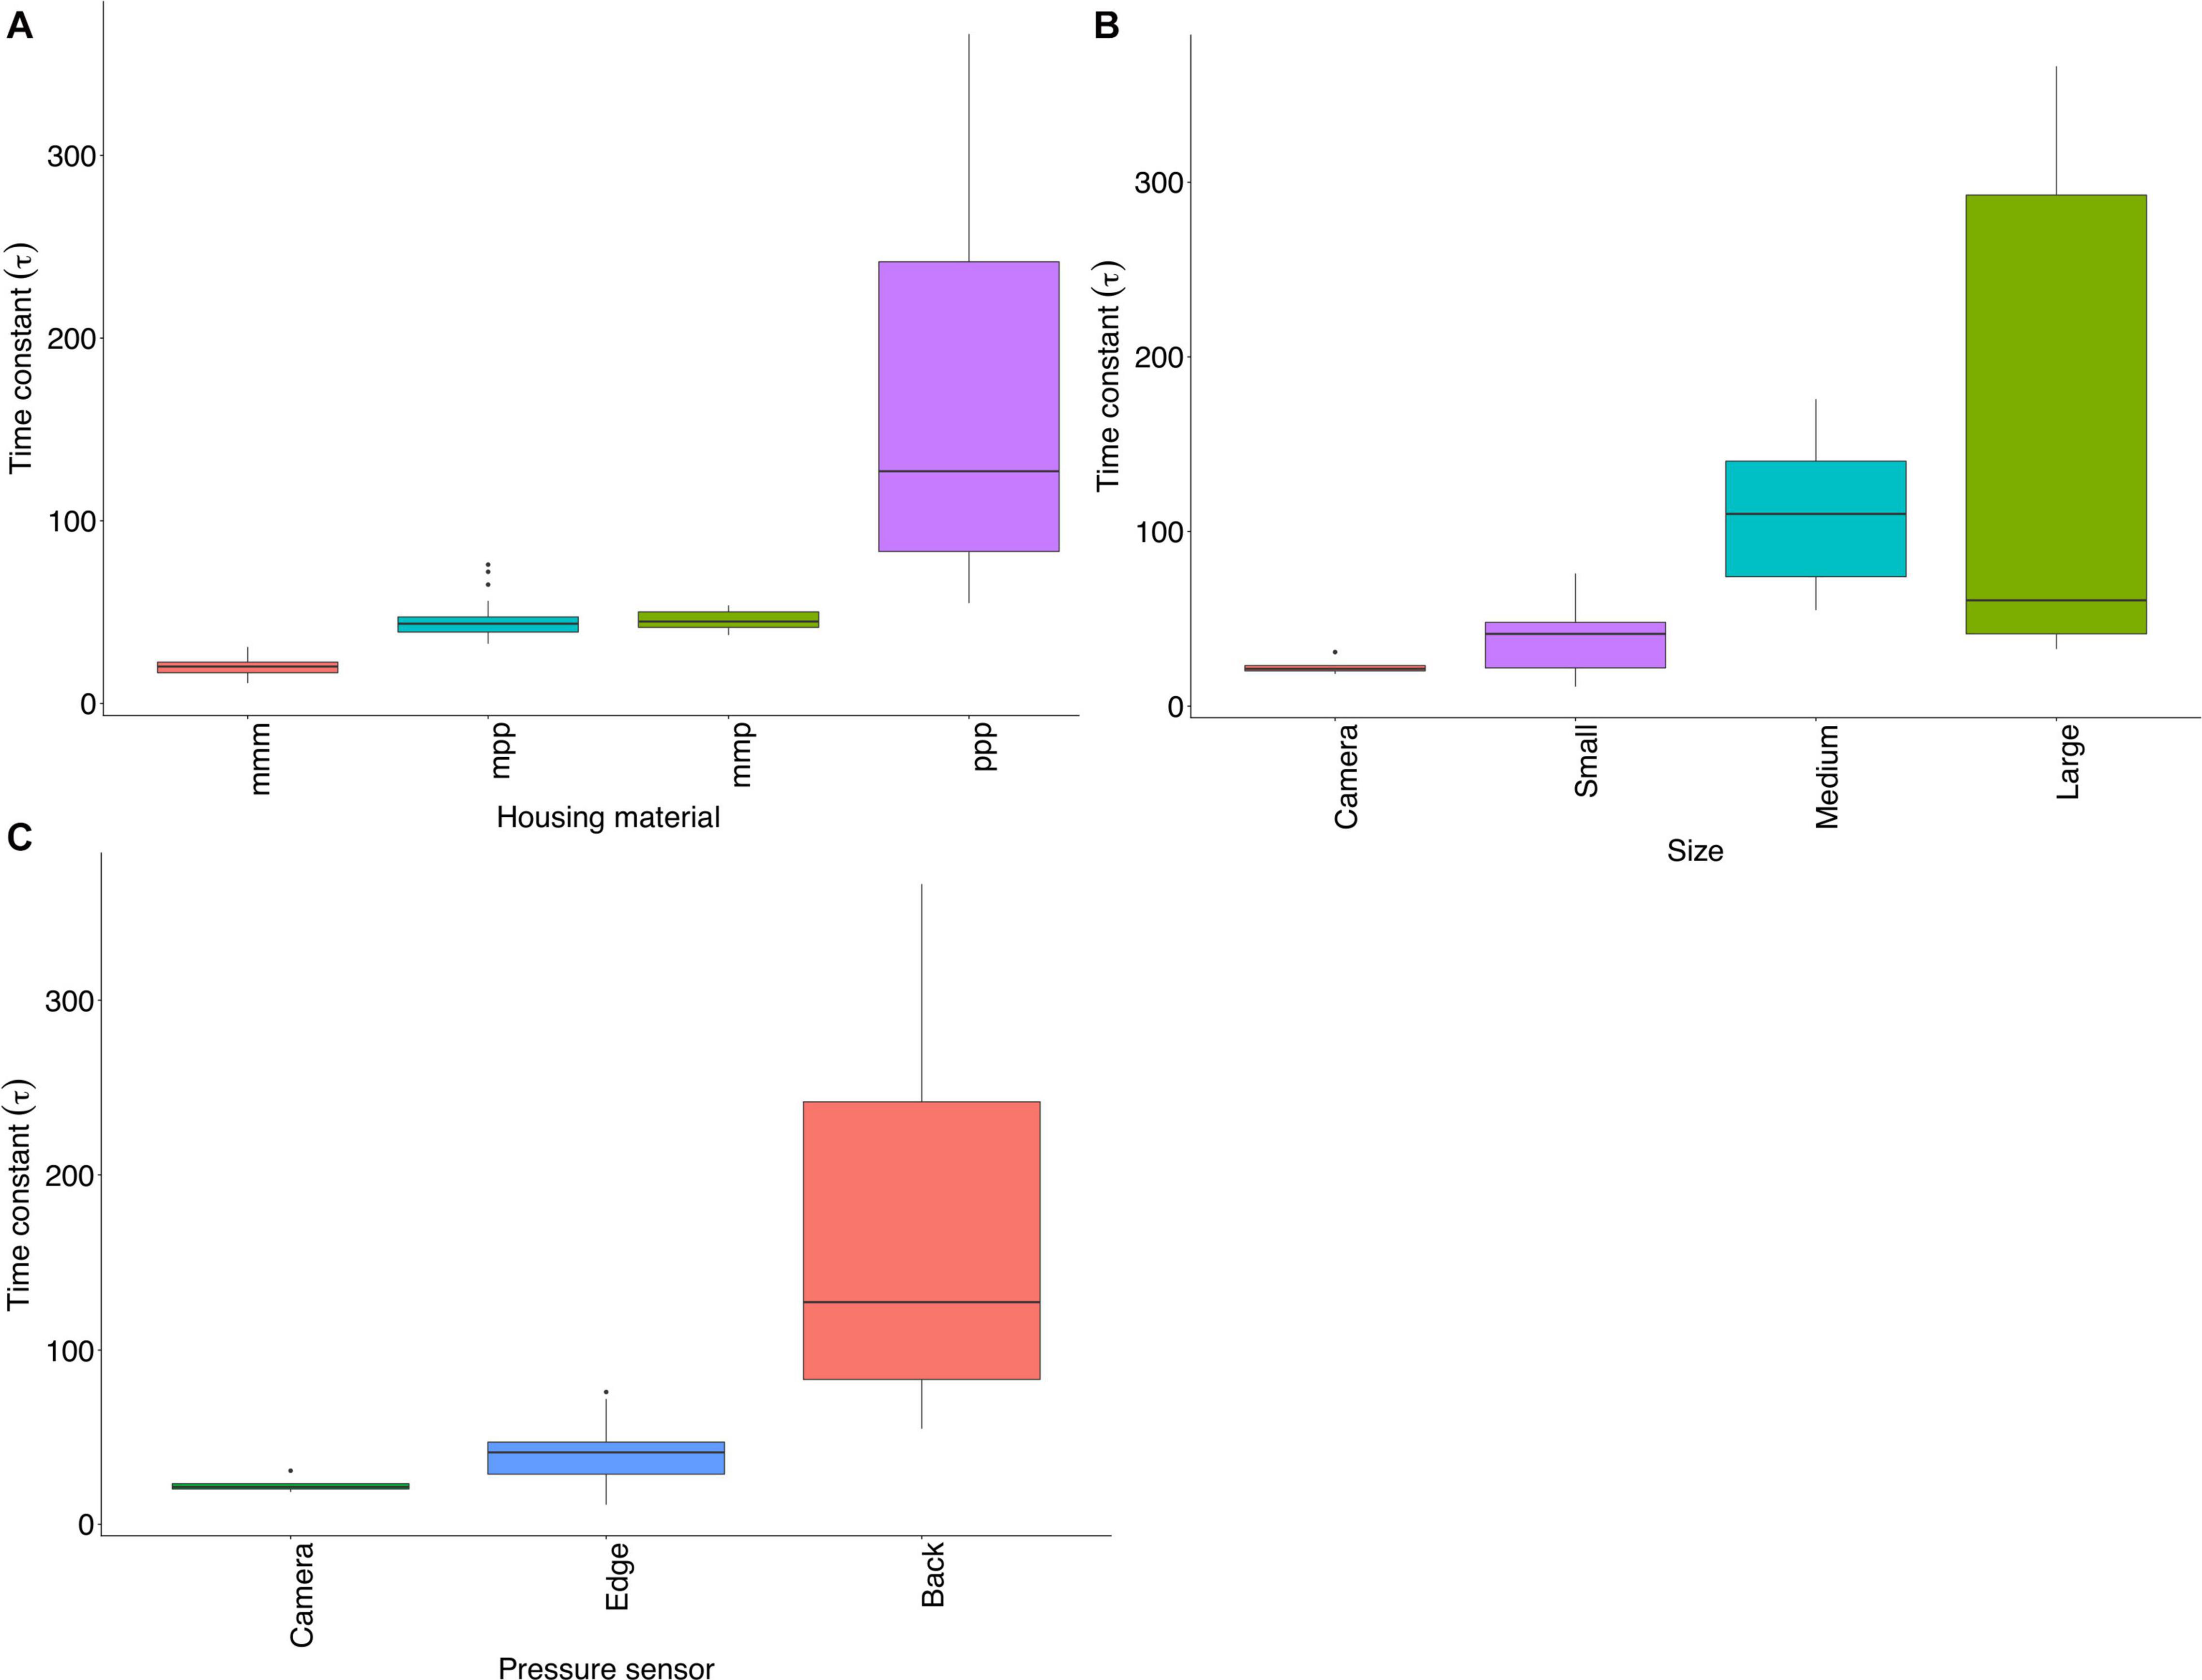
Figure 6. (A) τ by material; m = metal, p = plastic. For example; mmm devices comprise metal front rim, edge and back. (B) τ by size (C) τ by pressure sensor location. The black line represents the median. The lower and upper hinges correspond to the first and third quartiles (the 25th and 75th percentiles). Upper and lower whiskers extend from the hinge to the largest/smallest value, respectively, no further than 1.5 ∗ inter-quartile range from the hinge. Data beyond the end of the whiskers are plotted individually as outliers.
Temperature Accuracy
Water Bath Trials
A total of 78 data points were collected from 29 devices over three conditions (bath temperatures). One Suunto D6i data point was missed because of a dead battery. Paralenz Dive Camera+ were not included in the water bath deployments due to not having an on-screen temperature display. Mean bias is defined as displayed device temperature minus water bath temperature, averaged on a model or device basis. By model, this ranged from 0 to (−1 ± 1.7) °C. The mean bias by device ranged from 0 to (−2.3 ± 1.5) °C (Supplementary Tables 4, 5).
Chamber
The chamber dives investigating accuracy comprised n(devices) = 31 and n(dives) = 185. Mean bias by model ranged from (0.1 ± 0.3) to (−1.4 ± 2.0) °C and by device ranged from (0.1 ± 0.1) to (−3.3 ± 1.4) °C. Full data on accuracy dives across conditions are shown by model (Table 2) and device (Table 3).
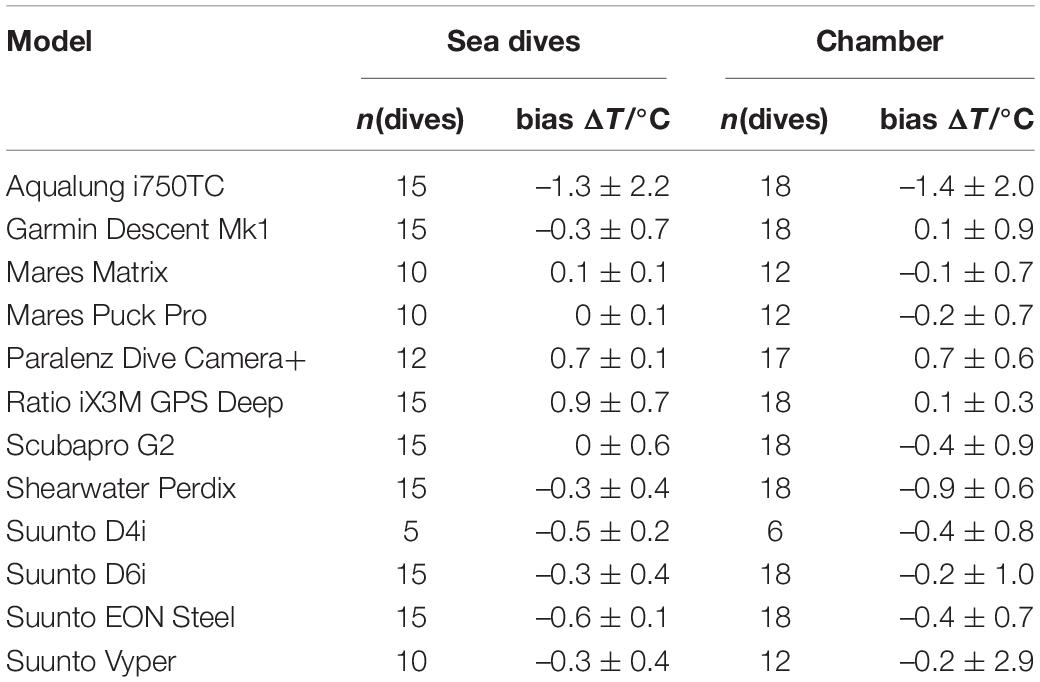
Table 2. Bias by model across the two accuracy conditions.
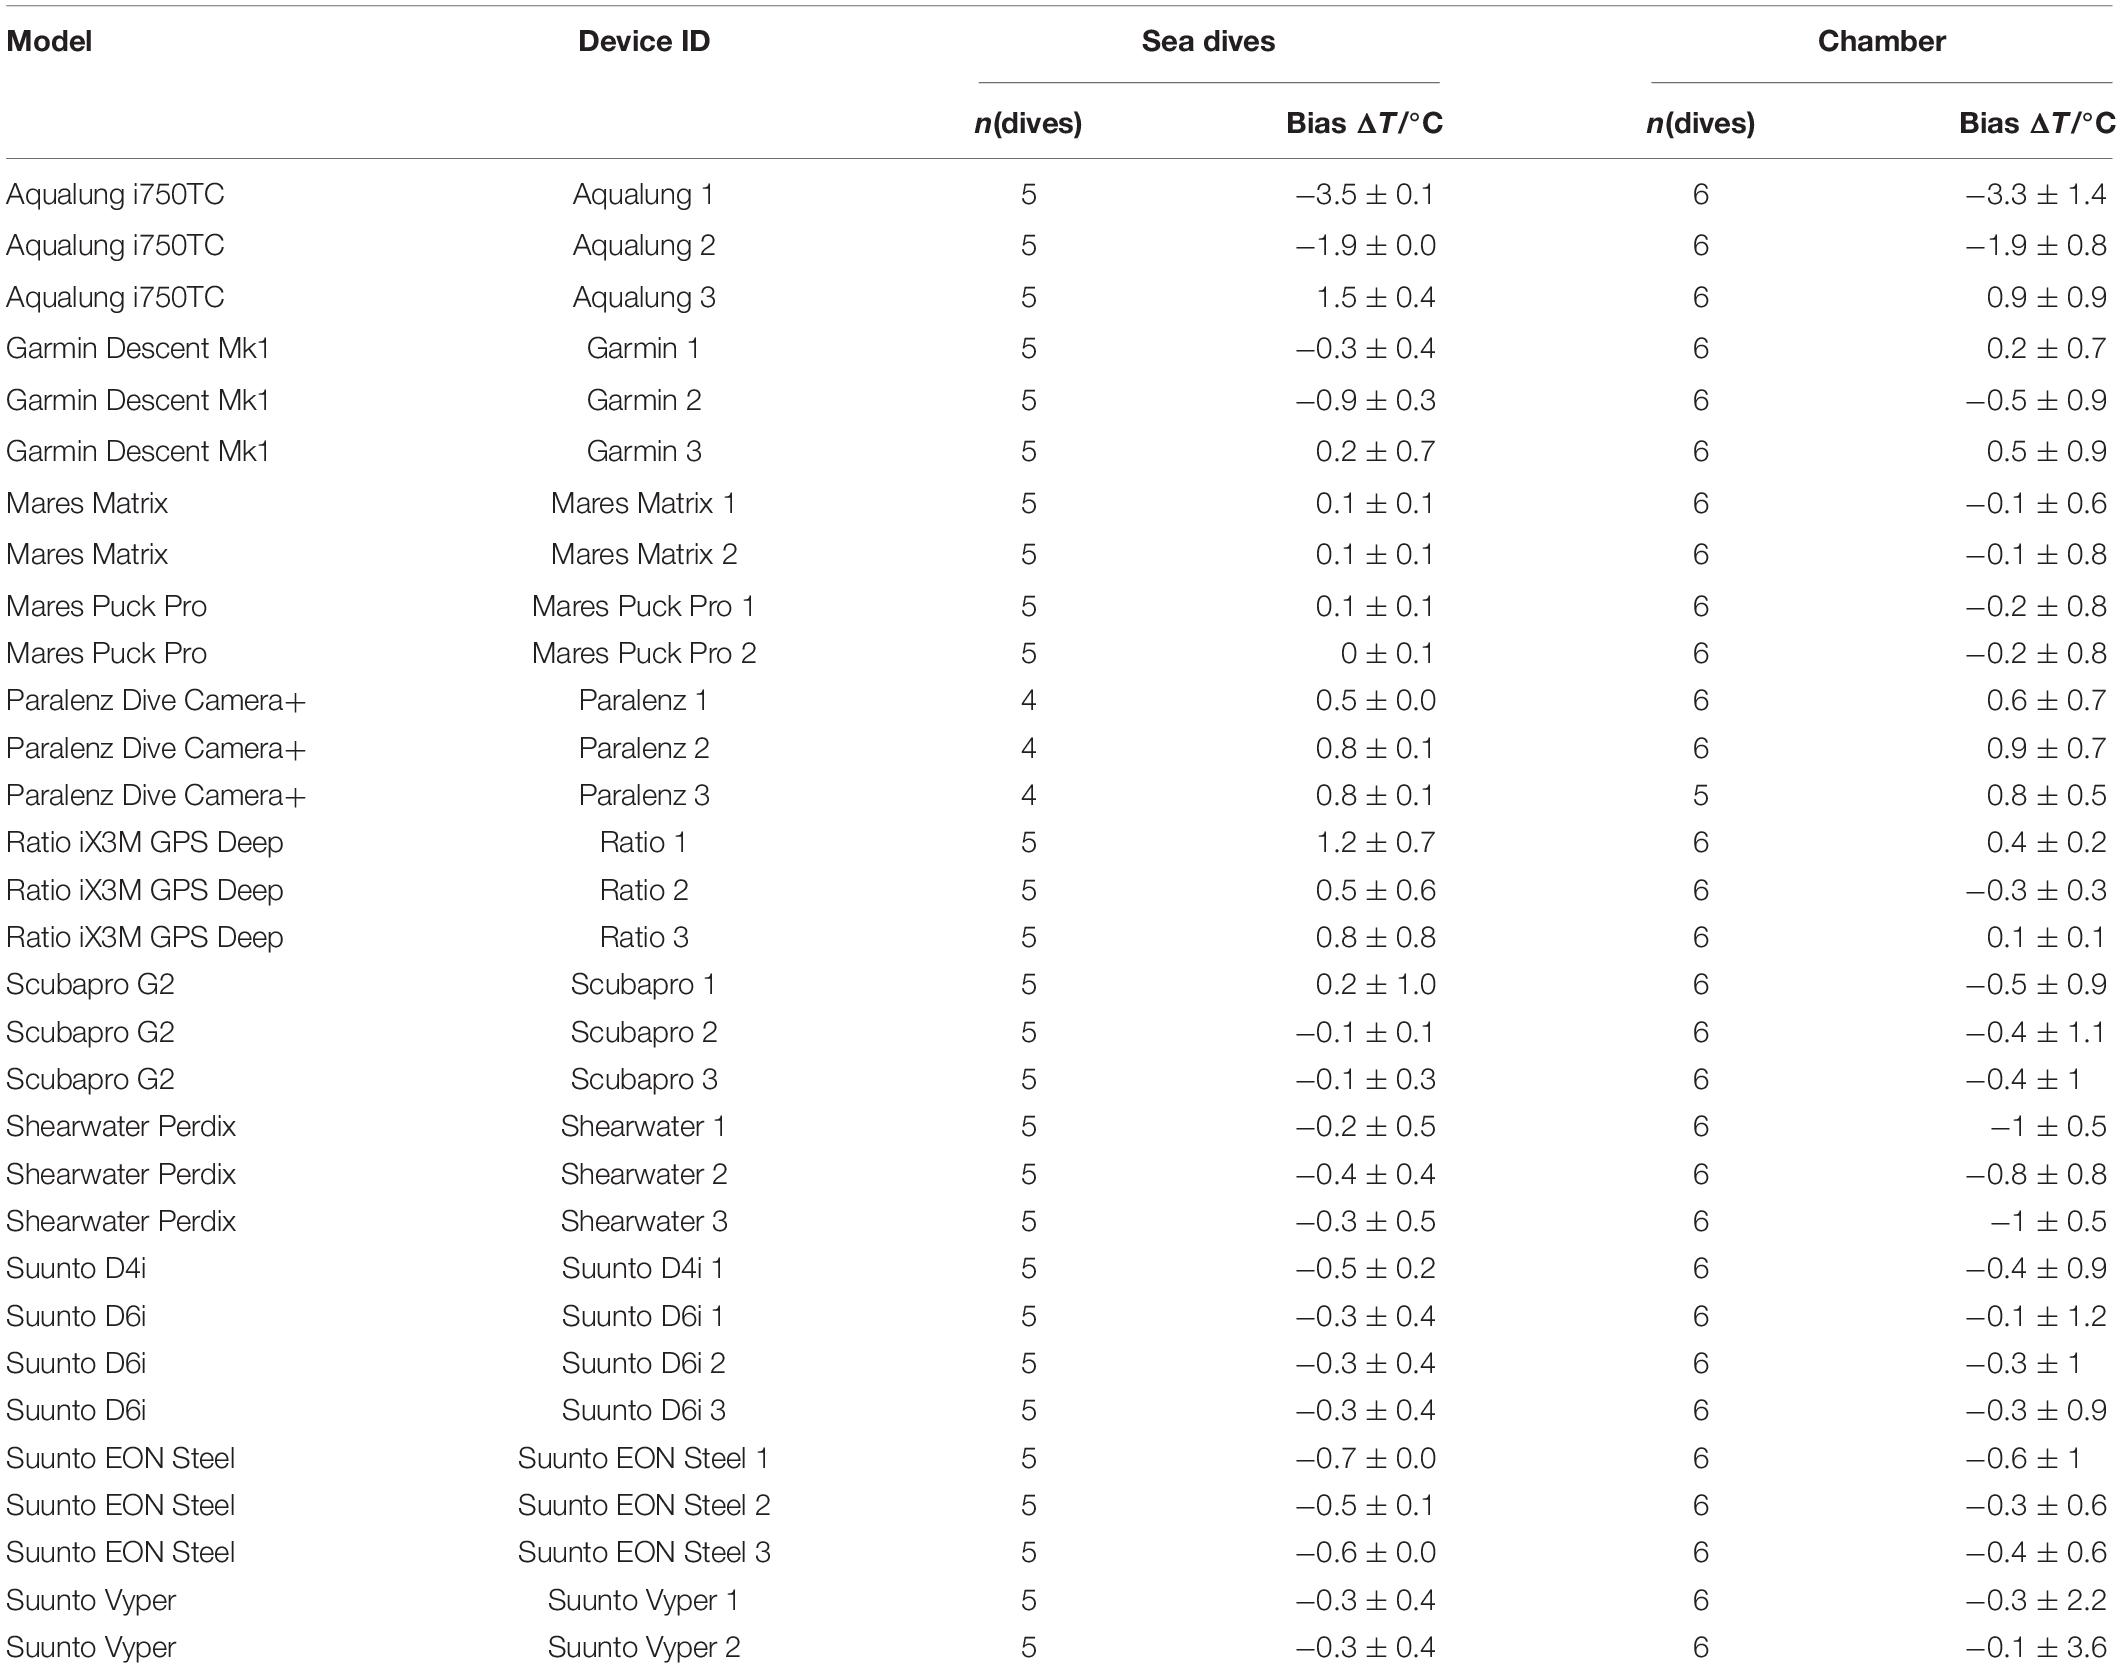
Table 3. Bias by device across the two accuracy conditions.
Sea Dives
A total of 152 mean bias values were collected from 31 devices over five sea dives. Three values are missing due to failure to recover data from Paralenz Dive Camera+. Mean bias by model, without taking into account experimental condition, ranged from (0.0 ± 0.1) to (−1.3 ± 2.2) °C and by device ranged from (0 ± 0.1) to (−3.5 ± 0.1) °C (Tables 2, 3).
“On Frame” vs. “On Arm”
Wearing a computer “on arm” led to a non-negative mean bias across all models (0.0 ± 1.6) °C (Table 4) and devices (0.0 ± 2) °C (Supplementary Table 6) when compared to being carried on the frame (Figure 7). Brand, housing material, shape or response group were not found to be significant for bias in “on arm”/“on frame” data.
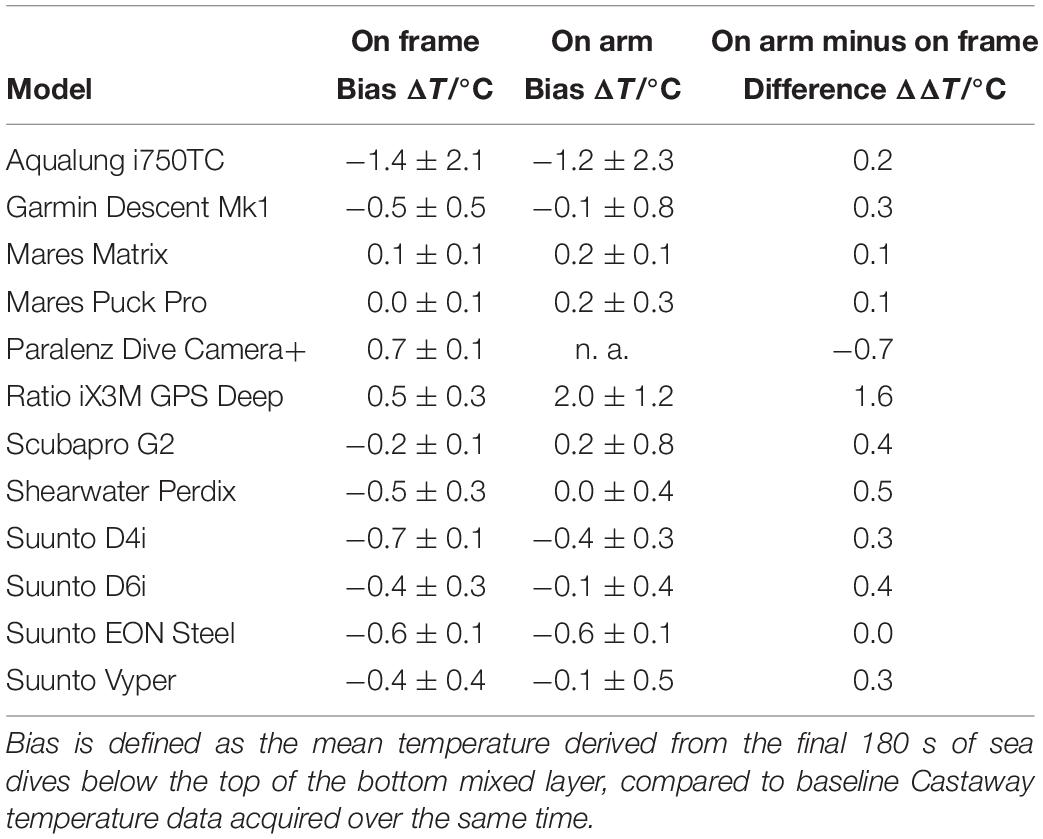
Table 4. Comparison of bias by model worn “on arm” with loose on a frame.
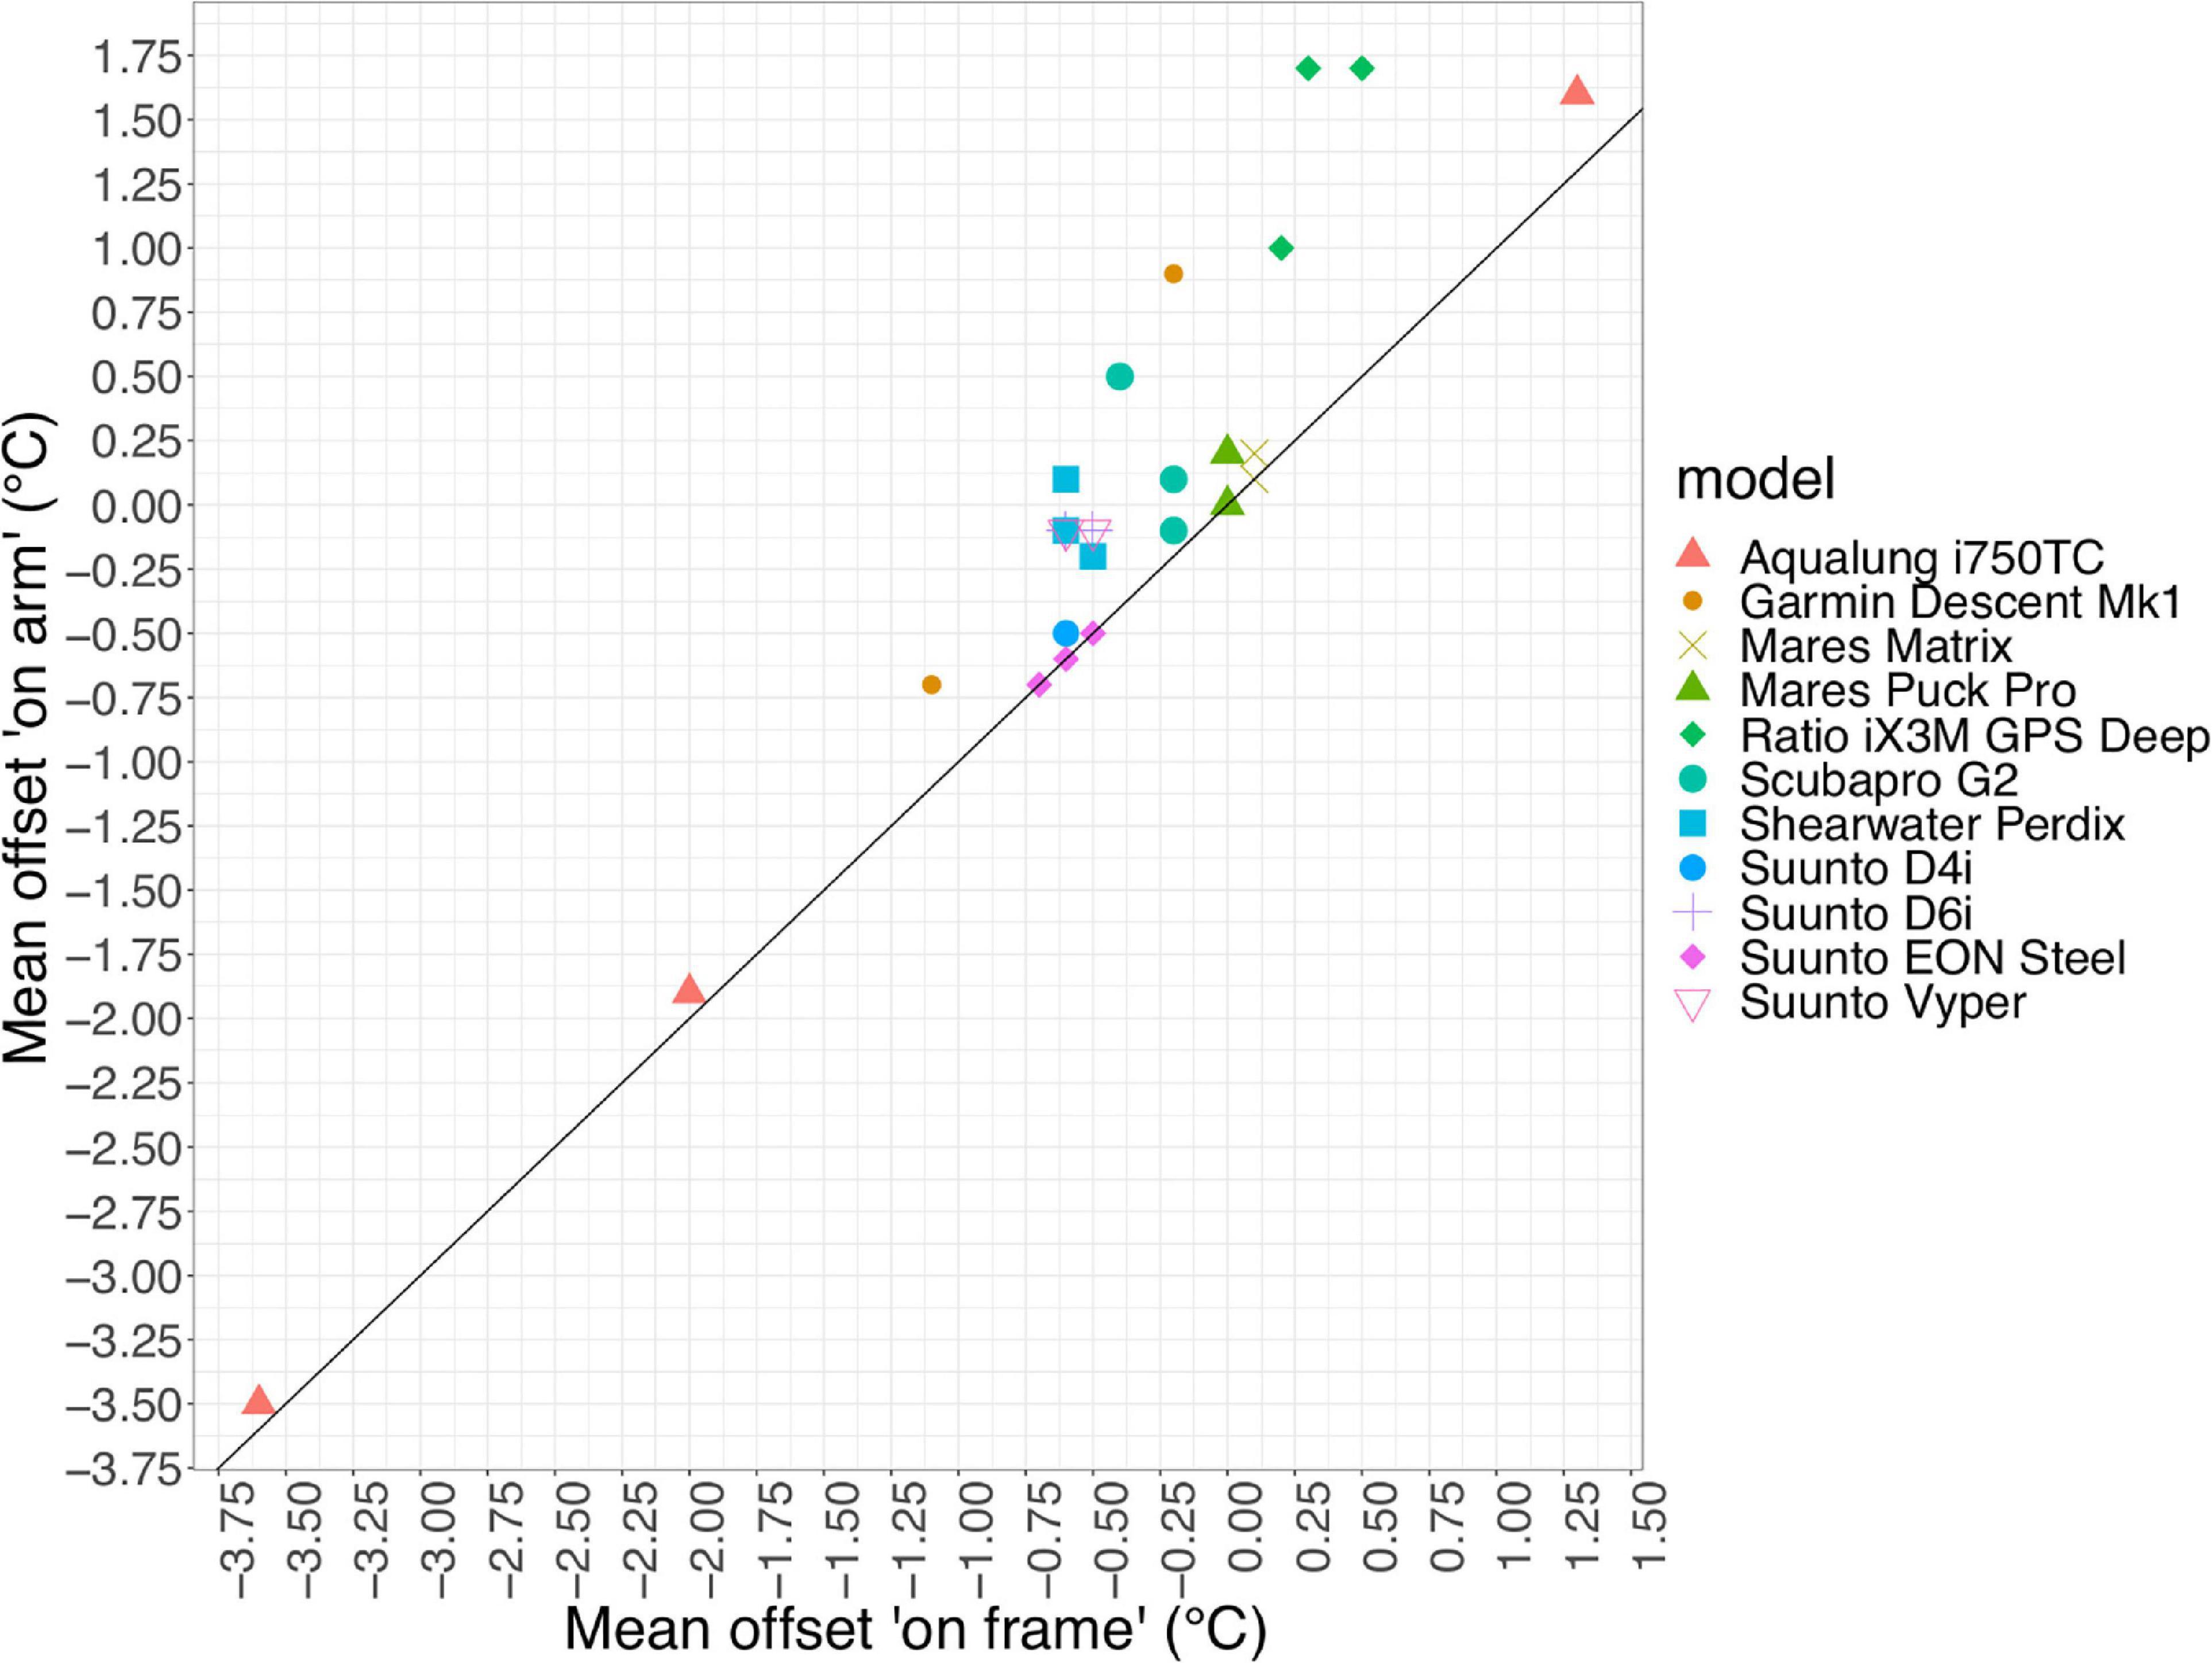
Figure 7. Effect of wearing devices “on arm” vs. “on frame.” Bias from Castaway baseline data by device, black line represents an equal bias in both conditions.
Overall Accuracy
As depth resolved-temperature data are required for scientific interest and collecting temperature data from dive computers in an unpressurised environment would not be recommended, only data from sea and chamber accuracy dives were combined for overall accuracy results. Across the total n = 337 data points from the two accuracy protocols, overall mean bias was (−0.2 ± 1.1) °C. Mean bias by model ranged from (0.0 ± 0.5) to (−1.4 ± 2.1) °C (Figure 8 and Table 5) and by device ranged from (0.0 ± 0.6) to (−3.4 ± 1.0) °C (Supplementary Table 7).
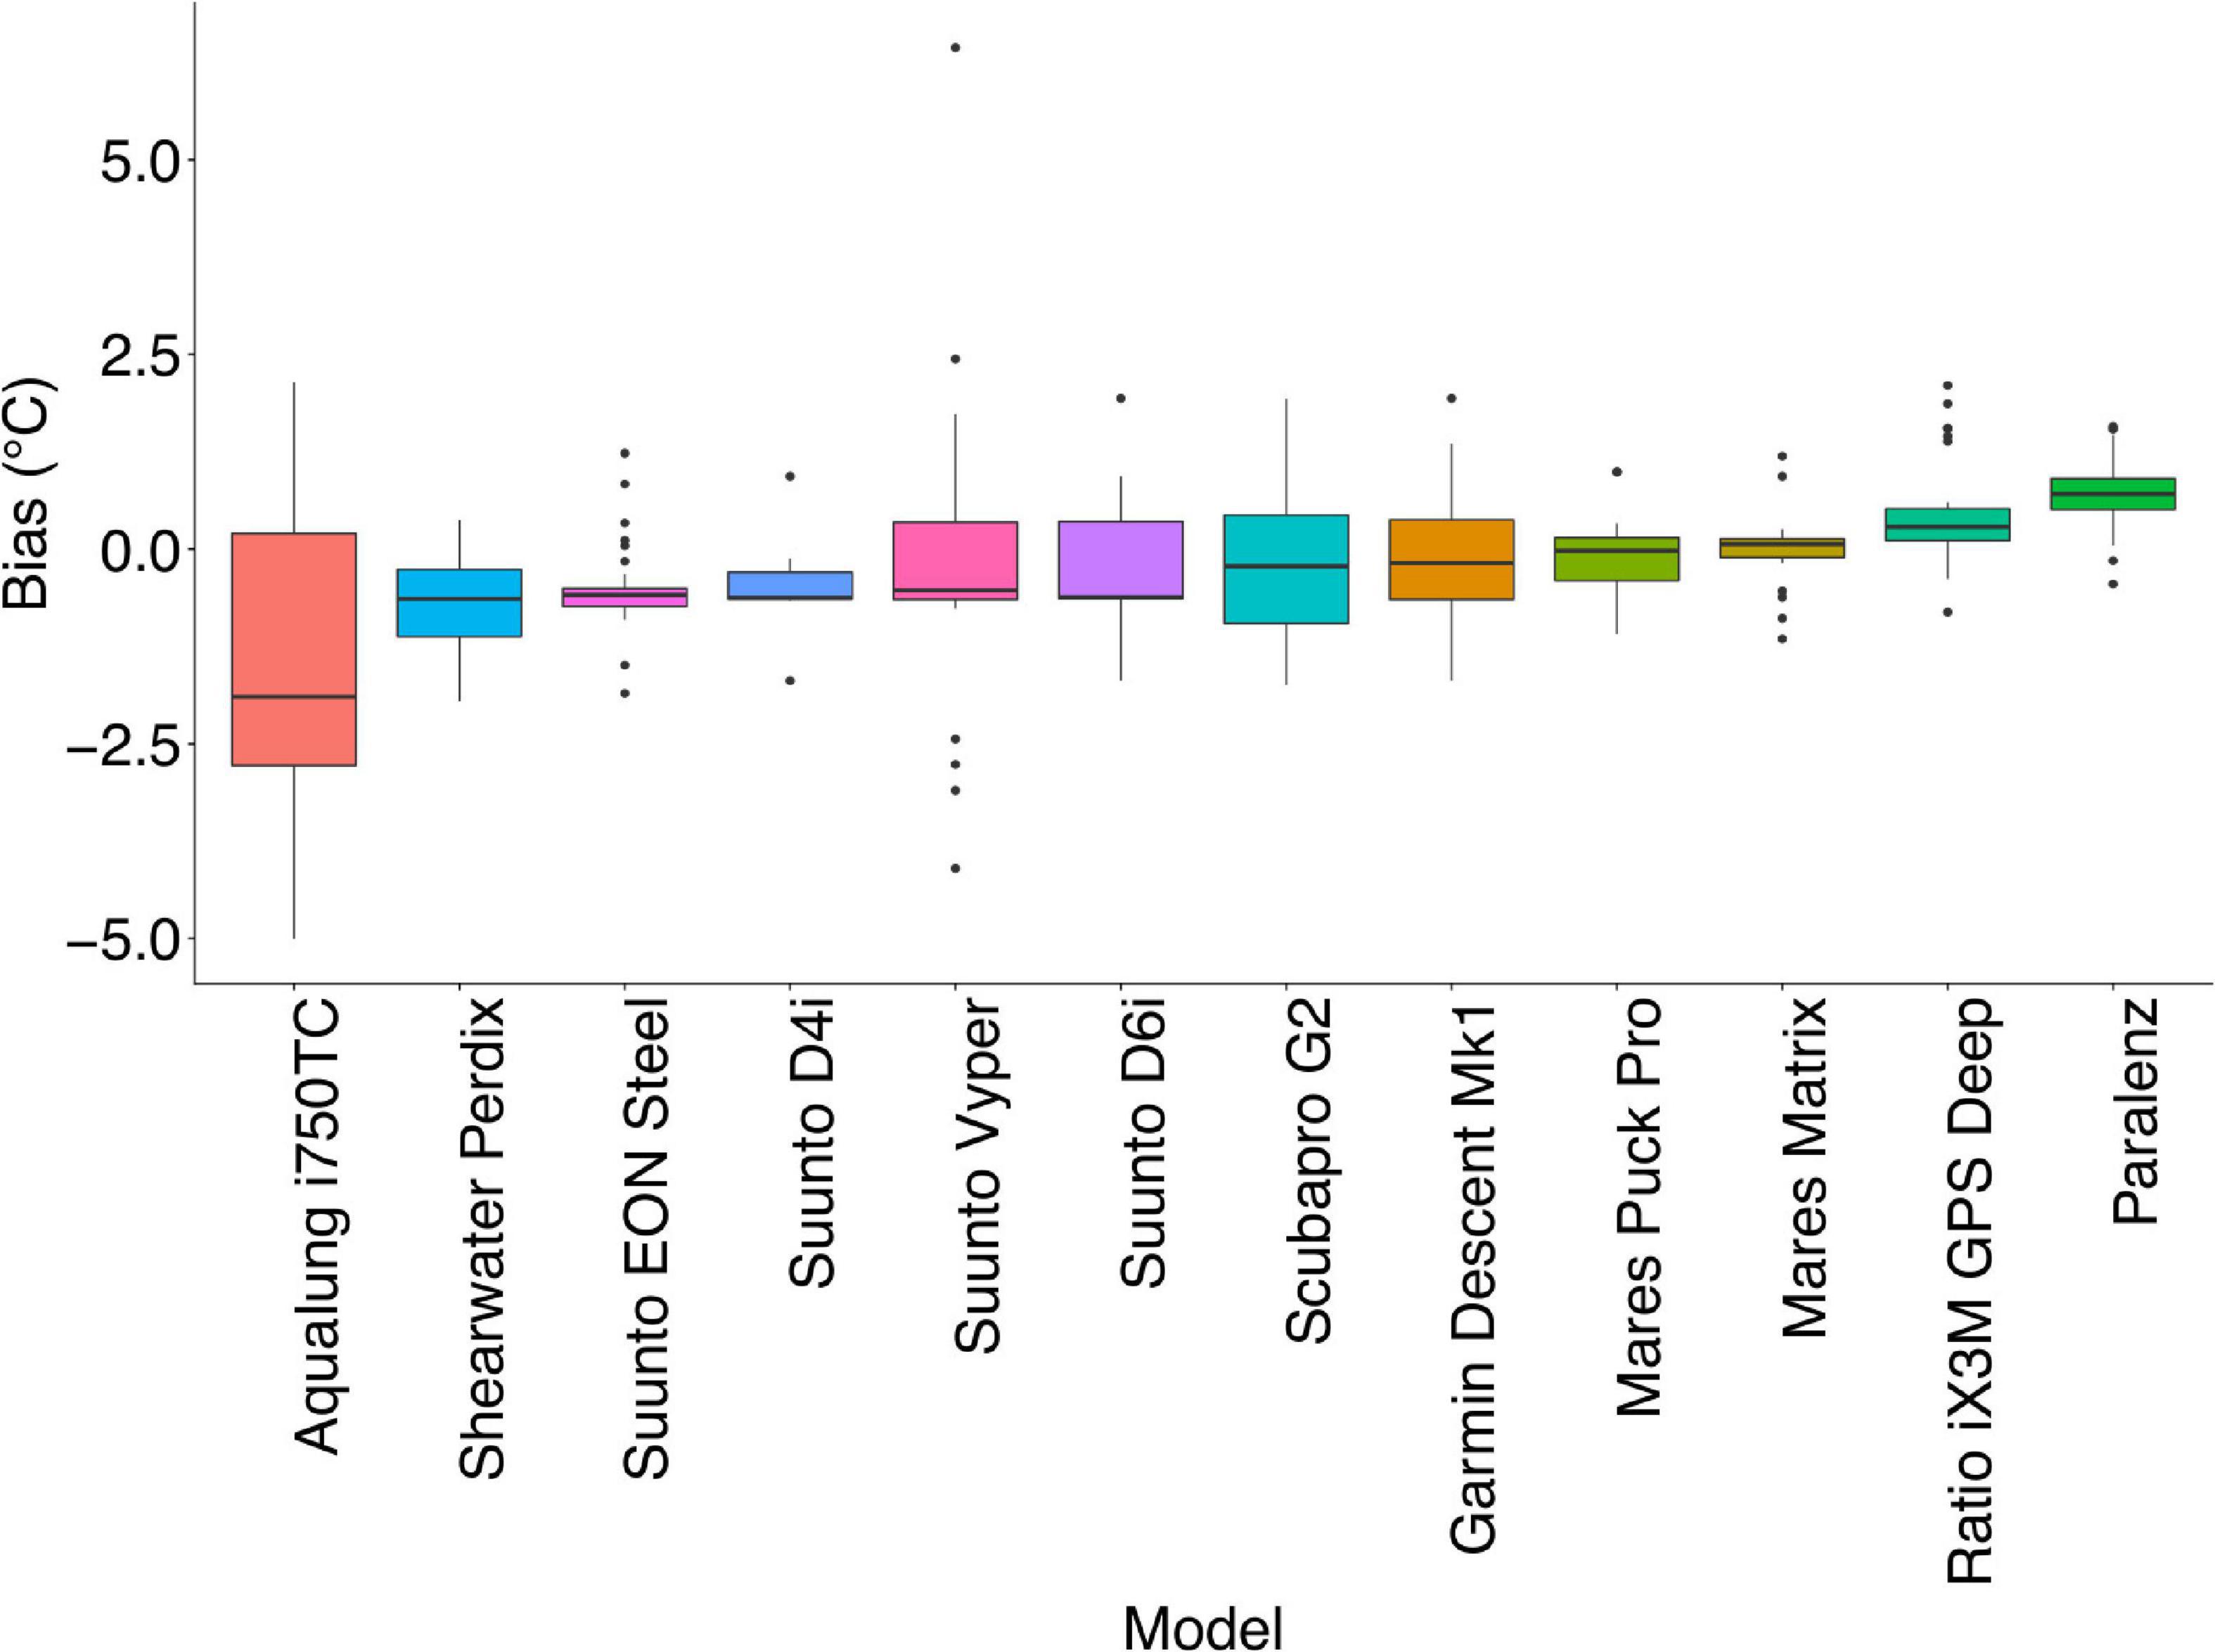
Figure 8. Normalised bias by model across sea and chamber dives. The black line represents the median. The lower and upper hinges correspond to the first and third quartiles (the 25th and 75th percentiles). Upper and lower whiskers extend from the hinge to the largest/smallest value, respectively, no further than 1.5 ∗ inter-quartile range from the hinge. Data beyond the end of the whiskers are plotted individually as outliers.
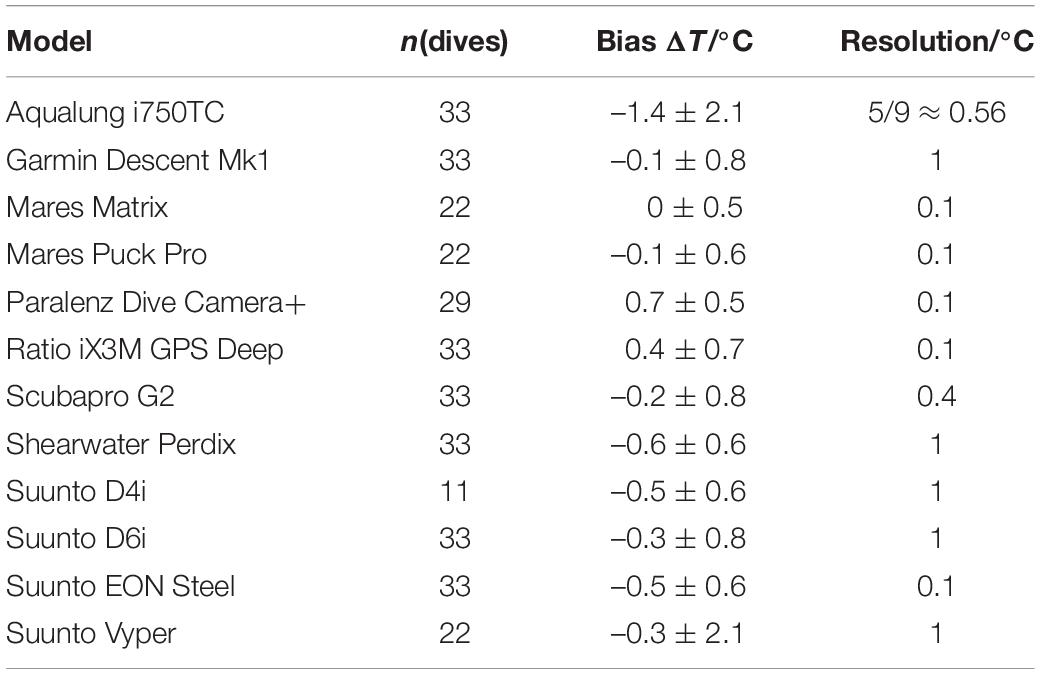
Table 5. Bias by model, averaged across sea and chamber dives.
Discussion
Despite the inherent limitations of the existing technology, our research shows that, while there is wide between-model variation in both temperature bias and τ, there is value in data derived from devices commonly carried by SCUBA divers as a source of subsurface temperature data in coastal areas. We demonstrate that there is sufficient consistency in bias within some models to offer the potential for bias correction by model. In addition, an overall bias of (−0.2 ± 1.1) °C demonstrates that, with sufficient datapoints, valuable data may be produced irrespective of the models from which data were derived. Due to variation in τ, while not all models would be recommended for use in scenarios of temperature change, some models also demonstrate a τ which, in conjunction with a sufficiently high resolution, offer the potential for identification of thermoclines.
Response Time
τ varied widely between models, with less within-model variance than between. We saw less within-device variation in τ than Egi et al. (2018), although a similar mean τ (46 s compared with 52 s) was seen for the only model used in both papers (Mares Matrix). Within-model consistency is promising for the purposes of citizen science, as it offers projects the potential to select specific models based on the project objectives or run post hoc corrections.
Six models were defined as quick responders (τ < 60 s) (Supplementary Table 8). Of these, the two models with the shortest τ [Suunto D6i (18 ± 5) s and Paralenz Dive Camera+ (22 ± 3) s] have τ comparable designed-for-purpose aquatic temperature loggers; the plastic Star-Oddi Starmon mini has an 18 s standard τ. Although more commonly used in moored scenarios, Starmon minis have been used to measure lake temperature profiles, with corrections applied (Jóhannesson et al., 2007).
Exponential fits proved consistent across models, exceptions causing poor fit were errant temperature data points recorded in the temperature profile (Suunto EON Steel) or a sharp rise in temperature followed by a levelling or drop before a further rise (Ratio iX3M GPS Deep). In the case of the Ratios, the response seen could be because of intermittent heating caused by internal electronic functions of the model, or, as a slow responding but higher resolution model, the devices may have been affected by cold water ingress introduced by adding additional devices.
When dive computer model was excluded as a parameter from the generalised linear model, pressure sensor location and housing material were also found to significantly influence τ. As the two features are correlated (e.g., all devices with a pressure sensor at the back are entirely housed in plastic, Table 1), it is not possible to fully separate the effect of the two variables. Also, while pressure sensor location is identifiable (Supplementary Table 1), it is not known whether the temperature sensor is co-located with the pressure sensor in any given model. However, it is logical to postulate that in a small device, or where a sensor is close to the edge of the device housing, a more rapid response to temperature change will be seen than that of a sensor buried deep within a larger housing, where the thermal mass of the dive computer itself may slow the response.
Temperature Accuracy
All models performed well within the ± 2 °C advertised accuracy (Mares, 2020; Azzopardi and Sayer, 2012; Suunto, 2018) overall, with only one model having a mean absolute bias ≥1 °C (Aqualung i750TC), and only two (Aqualung i750TC, Suunto Vyper) having poor precision. The overall mean bias seen [(−0.2 ± 1.1) °C] is comparable with existing commonly used coastal temperature data sets, such as those using handheld digital thermometers for subsurface temperature measurement; Cefas coastal temperature datasets include data from thermometers and data loggers with accuracies of (± 0.2 to ± 0.3 °C) (Morris et al., 2018). A systematic negative bias of −1 °C has been seen in satellite sea surface temperature (satSST) (Brewin et al., 2017) and up to 6 °C bias between coastal satSST and in situ devices (Smit et al., 2013).
Sampling requirements for the global ocean observing system in situ SST temperature are 0.2 to 0.5 °C (Needler et al., 1999), and bias-corrected numerical oceanic models have been shown to still have up to −0.86 °C offset from baseline satellite temperature after corrections have been applied (Macias et al., 2018). As nine of the twelve dive computer models were found to have “good” accuracy (≤0.5 °C) overall (Supplementary Table 8), these requirements and biases indicate that, with sufficient data points, some models of dive computers can offer an additional source of temperature data to contribute to ocean temperature monitoring, numerical models and composite satellite products.
Differences were found in both bias and variance (accuracy and precision) across the two conditions (sea and chamber). Nine models had the same accuracy categorisation in both sea and chamber dives (Supplementary Table 8). Of these, only three models (Aqualung i750TC, Garmin Descent MK1, Scubapro G2) had the same precision across the two conditions. Precision was found to be improved in sea conditions, with eight models categorised as having “good” precision (Supplementary Table 8). Only one model (Ratio iX3M GPS Deep) was found to have good precision in the chamber. The reduced precision found in nine of the models in the chamber is likely caused by differences between tub temperatures in dive repetitions, combined with the effect of a static water environment on the Castaway temperature sensor. Castaway CTDs are designed to work with a steady flow of water of around 1 m s–1 through the sensor channel. Collection of data in real world scenarios will always lead to differences caused by environmental variation for which it is not possible to control. In the present study, all Castaways were positioned on a frame carried by one diver, while all the dive computers were worn on the wrists of two divers. It is therefore possible that, although precision was better than in the chamber, proximity differences combined with local variations in temperature led to additional variation being seen in the sea dives.
With the exception of three devices [Ratio iX3M (n = 1), Garmin Descent Mk1 (n = 1), Suunto EON Steel (n = 1)], all individual devices aligned with their model’s overall accuracy categorisation, demonstrating positive within model consistency. Similarly, only one device had lower precision than its model’s categorisation, with four devices [Suunto EON Steel (n = 2), Aqualung i750TC (n = 2)] having better precision than their model would indicate. This within model consistency is encouraging for post hoc bias correction by model. Across both conditions, all models except three showed overall negative bias to the baseline temperature. In contrast, Mares Matrix had an overall bias of 0, whilst Ratio iX3M GPS Deep and Paralenz Dive Camera+ biased warm. This could be caused by an internal heating effect of the electronics due to additional active functions as both Ratio iX3M GPS Deep and Paralenz DiveCamera are both devices with additional functionality in comparison with some smaller devices.
Diver attachment placement also had significant effect on bias in sea dives, with all models “on arm” having a non-negative mean bias compared with than “on frame” (irrelevant of whether the device was biased colder or warmer than the baseline). These differences could be caused by the heating effect of the diver’s body, an effect of an additional barrier between the ambient water temperature and the temperature sensor (dependent on sensor location within the housing). All divers were wearing drysuits, but the material and thickness varied (neoprene/membrane).
With the exception of two models (Mares Matrix, Suunto EON Steel) there was greater variation in within-model bias in “on arm” conditions. This could be due to differences in positioning of dive computers on arms, the amount of contact between the device and the diver’s arm, or the dive suit material. When collecting or correcting data across different environments, console mounted devices which are mounted on a hose not attached to the diver may be preferable for temperature data accuracy. Alternatively, it is common for divers to have redundancy in kit, carrying two dive computers. The secondary device could be attached safely to the diver but not worn on the arm. It is recommended that attachment mechanism and thermal protection type be noted in data collection from citizen scientist divers so it can be taken into consideration.
Technology Limitations
Accuracy in recorded or displayed temperature, or response to temperature change does not form part of primary dive computer function and dive computer manufacturers are not providing temperature data for oceanographic purposes. The results found are in no way reflective of the performance of any model in the designed purpose as diver safety devices. Whilst dive computers in the United Kingdom must adhere to standards set in British Standard BS EN13319:2020, which covers functional and safety requirements including depth and time, the Standard does not include temperature (British Standard, 2000).
The greatest potential for temperature data from citizen scientist divers is to address the lack of depth-resolved data in coastal regions. To improve the overall use of dive computers as oceanographic monitoring devices in less-well performing models, manufacturers could look at improving the quality of the out of the box measurements. The addition of an accurate dedicated temperature sensor, with considered placement of the sensor would support unbiased detection of water temperature change. Whilst the majority of dive computer models tested by Azzopardi and Sayer (2010) were found to be consistently within 1% of nominal depth, the addition of conductivity sensors to measure salinity would increase the accuracy of depth values, although this would not affect temperature data quality. Inclusion of geolocation ability would allow easy identification of dive locations. The combination of all of the above would maximise the citizen science potential of divers, due to their access to otherwise hard to reach locations.
Within the limitations of the current commercially available devices, a citizen science project dataset could be improved by calibrating individual dive computers in advance, simply, using an iced bucket of water. As evidenced by the water bath trials—this would be greatly improved by an additional significant figure to the unpressurised temperature display, as currently the majority of models display only positive integers, limiting the potential accuracy by introducing truncation effects.
Citizen Science and Use of Data
We need to better understand how model type affects temperature profiles so that citizen science diving projects can help fill gaps in coastal temperature datasets. To standardise data, there should be a focus on the models offering the greatest accuracy and shortest temperature response. Only one model (Aqualung i750TC) was found to have poor accuracy and precision across all conditions, along with a slow response to temperature change. Five of the six models with a quick temperature response (τ < 60 s) were also found to also have good accuracy, with good/moderate precision overall (Figure 9). These comprise Mares Matrix (2/2), Garmin Descent (2/3), Suunto D6i (3/3), Suunto EON Steel (2/3) and Suunto D4i (1/1), all sharing promising characteristics as individual devices.
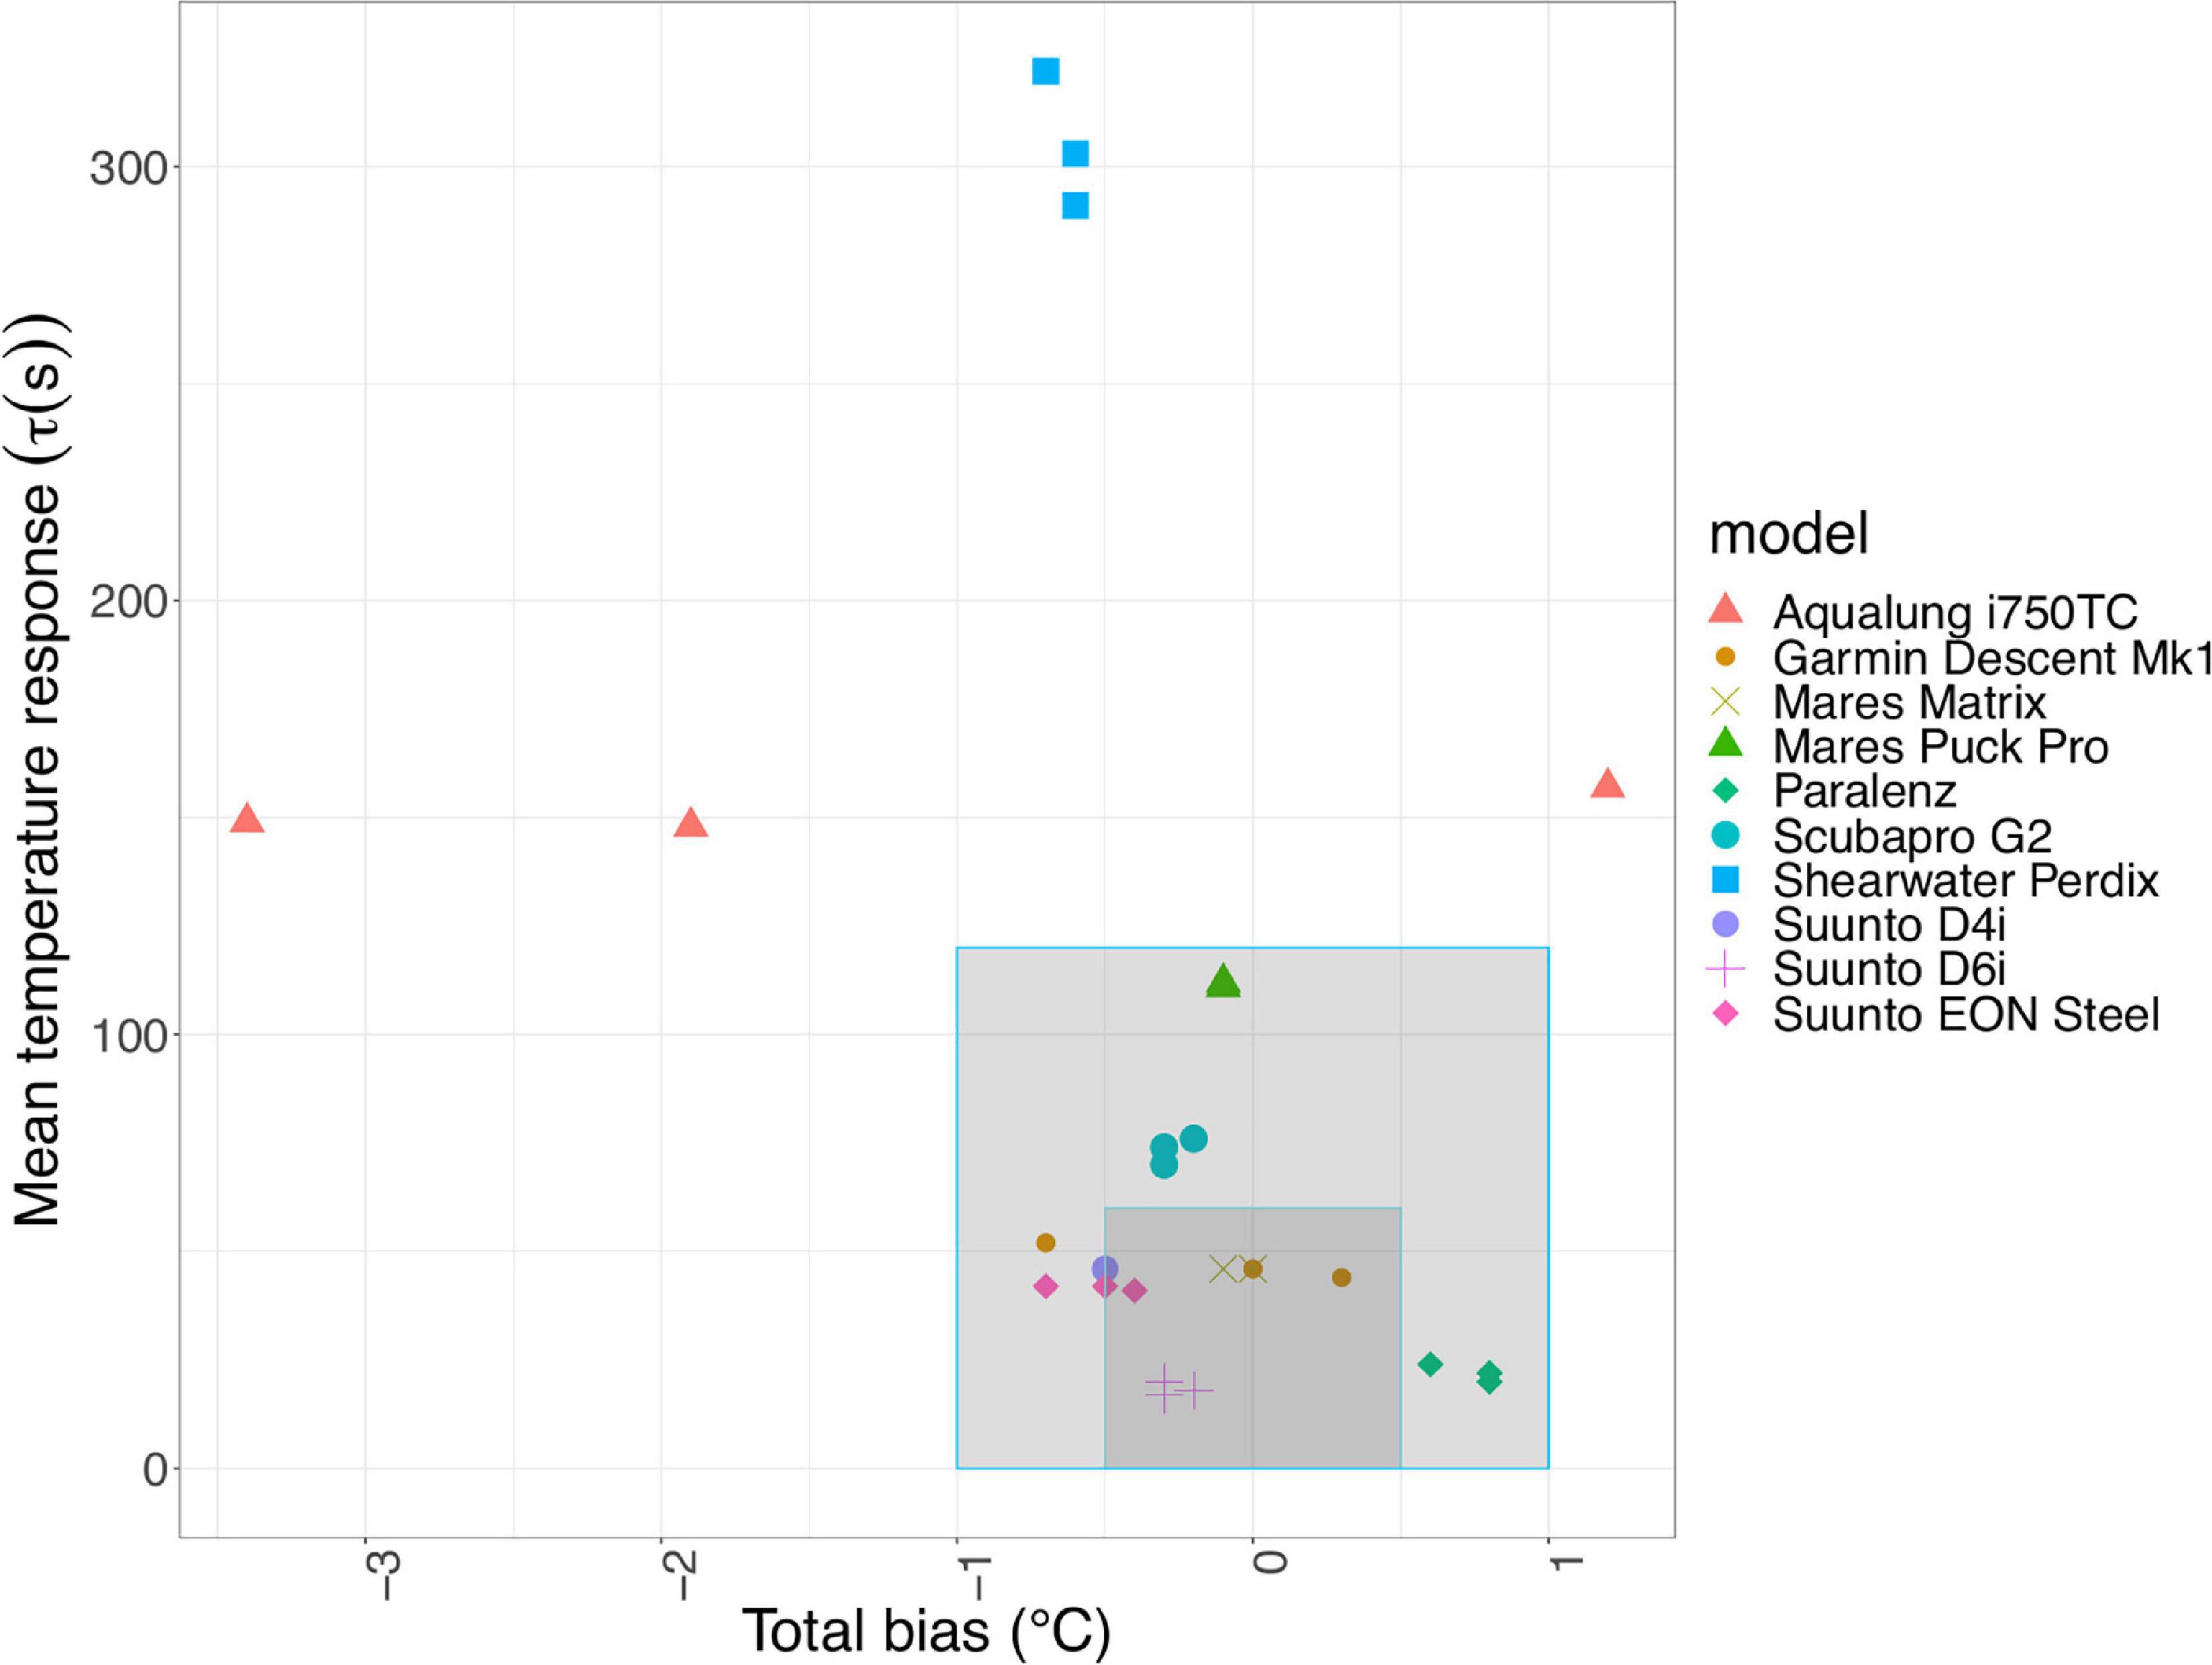
Figure 9. Accuracy against bias for all devices; the inner box highlights 0.5 °C bias with 60 s τ. Devices falling in the inner box are defined as having both a quick response and good accuracy overall. The outer box highlights devices which have up to 1 °C bias and 120 s τ: an intermediate response to temperature change, and moderate accuracy.
When considering models for citizen science data collection, those with the greatest potential have a high sample rate and resolution, are likely to have a pressure sensor located on an edge and have a metal or part-metal housing. In addition, a standardised model could be used by all volunteers in a project and simple corrections applied for systemic model bias. The most promising model tested here for overall use across citizen science projects is the Mares Matrix. This model had consistently good accuracy and precision and a quick response to temperature change; exhibiting an overall mean bias of (0.0 ± 0.4) °C and τ = (46 ± 5) s with a recorded resolution of 0.1 °C and a 5 s sampling rate. A close second is the Suunto EON Steel, which has good accuracy overall, moderate precision and a quick response to temperature change, with a recorded resolution of 0.1 °C and a 10 s sampling rate. Other models have shorter τ (Suunto D6i, Suunto D4i, Garmin Descent), but single degree resolution, making them less useful for monitoring temperature change.
With sufficient data points, we found “good” accuracy, irrespective of originating device. Therefore, data collected by local groups or dive centres in commonly dived, discrete areas, may generate sufficient data points to provide a useful accuracy, irrelevant of model. In addition, not all sampling locations have equal value (Callaghan et al., 2019) and lower quality data may still be of use to support decision making (Buytaert et al., 2016) if uncertainties are quantified. As such, in remote, less widely sampled areas where there are limited pre-existing records, dive computer information may still be of use as indicative data, even with fewer sampling points or from devices with less accuracy/precision.
In addition to the device-related effect, we found that mode of attachment and placement on the diver body had an influence on temperature accuracy. Therefore, for citizen science-derived dive computer profiles to be useful on a wider basis, collection of metadata is crucial. Downloaded profiles already contain metadata such as date, time and model, but diver attachment, placement and diver thermal protection type should be collected in addition, to enable a more comprehensive assessment of data quality on an individual profile basis. An online portal facilitating easy upload of profiles and associated metadata is currently in late-stage development. Ideally, data from different citizen science dive portals should be combined in a global dataset.
Temperature from dive computers could be used to complement biological datasets. For example, thermocline depth affects vertical distribution of fish (Sogard and Olla, 1993), so computer-derived temperature data could contribute to a better understanding of local variability in fish movements. Temperature data can also support regional assessment of hydrological conditions (Morris et al., 2018). In highly dived areas, the data would provide a time series allowing identification of seasonal variation, albeit without complete temporal coverage. They may also be useful for marine recreation (Brewin et al., 2015) or feeding into numerical models and satellite products (Smit et al., 2013) in areas where the accuracy is known to be < 1 °C. They could be especially useful in commonly dived, poorly sampled areas, such as the South Pacific, where the volume of dive profiles could provide data of a useful resolution irrespective of model.
In conclusion, the limitation of divers as citizen scientists for temperature data collection is inherent in the devices themselves. The challenge is to understand the uncertainty in accuracy and precision recorded by the devices rather than the abilities or knowledge of the citizen science diver. Our research shows that the quality of temperature data in dive computers could be improved, but implementation would need to be driven by manufacturers, or by diver demand. As some models of dive computers can demonstrably provide data comparable to that collected by more traditional methods, within required accuracy levels for some monitoring scenarios, they have a role to play in future oceanographic monitoring.
Data Availability Statement
The datasets presented in this study can be found in online repositories. The names of the repository/repositories and accession number(s) can be found below: British Oceanographic Data Centre; doi: 10.5285/b3c2a748-357b-5fb7-e053-6c86abc05126 and https://www.bodc.ac.uk/data/published_data_library/catalogue/10.5285/b3c2a748-357b-5fb7-e053-6c86abc05126/.
Author Contributions
CM carried out the experiments and analysed the data. CM wrote the manuscript with contributions from all authors. All authors set the conceptual framework of this study.
Funding
CM project was part of the Next Generation Unmanned Systems Science (NEXUSS) Centre for Doctoral Training which was funded by the Natural Environment Research Council and the Engineering and Physical Science Research Council (EPSRC) (Grant No: NE/N012070/1). The Ph.D. project was additionally supported by Cefas Seedcorn (DP901D). The diving and chamber tests were supported through a grant from the NERC National Facility for Scientific Diving (Grant No: NFSD/17/02).
Conflict of Interest
MS is employed by the company Tritonia Scientific Ltd. Two Mares Puck Pro and three Paralenz Dive Camera+ were loaned to the study by Mares and Paralenz respectively.
The remaining authors declare that the research was conducted in the absence of any commercial or financial relationships that could be construed as a potential conflict of interest.
Acknowledgments
We acknowledge Mares and Paralenz for loans of dive computers, cameras, and technical information and Benita Maritz for water bath inspiration.
Supplementary Material
The Supplementary Material for this article can be found online at: https://www.frontiersin.org/articles/10.3389/fmars.2021.617691/full#supplementary-material
References
Albus, K., Thompson, R., and Mitchell, F. (2019). Usability of existing volunteer water monitoring data: what can the literature tell us? Citiz. Sci. Theory Pract. 4, 1–10. doi: 10.5334/cstp.222
Aral, M. M., and Guan, J. (2016). Global sea surface temperature and sea level rise estimation with optimal historical time lag data. Water (Switzerland) 8:519. doi: 10.3390/w8110519
Aspillaga, E., Bartumeus, F., Starr, R. M., López-Sanz, À., Linares, C., DIáz, D., et al. (2017). Thermal stratification drives movement of a coastal apex predator. Sci. Rep. 7, 1–10. doi: 10.1038/s41598-017-00576-z
Azzopardi, E., and Sayer, M. D. J. (2010). A review of the technical specifications of 47 models of diving decompression computer. Underw. Technol. 29, 63–72. doi: 10.3723/ut.29.063
Azzopardi, E., and Sayer, M. D. J. (2012). Estimation of depth and temperature in 47 models of diving decompression computer. Underw. Technol. 31, 3–12. doi: 10.3723/ut.31.003
Barker, A., Banks, A., Bell, W., Dowell, M., Fox, N., Green, P., et al. (2015). METROLOGY FOR CLIMATE Metrology priorities for the earth observation and climate community. 21–22.
Bensoussan, N., Romano, J.-C., Harmelin, J.-G., and Garrabou, J. (2010). High resolution characterization of northwest Mediterranean coastal waters thermal regimes: To better understand responses of benthic communities to climate change. Estuar. Coast. Shelf Sci. 87, 431–441. doi: 10.1016/j.ecss.2010.01.008
Bindoff, N. L., Cheung, W. W. L., Kairo, J. G., Arístegui, J., Guinder, V. A., Hallberg, R., et al. (2019). “Changing ocean, marine ecosystems, and dependent communities,” in IPCC Special Report on the Ocean and Cryosphere in a Changing Climate, eds H.-O. Pörtner, D. C. Roberts, V. Masson-Delmotte, P. Zhai, M. Tignor, E. Poloczanska, et al. (Geneva: Intergovernmental Panel on Climate Change), 447–588.
Bojinski, S., and Richter, C. (2010). Prioritizing global observations along essential climate variables. Eos 91:505. doi: 10.1029/2010EO510011
Branchini, S., Pensa, F., Neri, P., Tonucci, B. M., Mattielli, L., Collavo, A., et al. (2015). Using a citizen science program to monitor coral reef biodiversity through space and time. Biodivers. Conserv. 24, 319–336. doi: 10.1007/s10531-014-0810-7
Brewin, R. J. W., de Mora, L., Billson, O., Jackson, T., Russell, P., Brewin, T. G., et al. (2017). Evaluating operational AVHRR sea surface temperature data at the coastline using surfers. Estuar. Coast. Shelf Sci. 196, 276–289. doi: 10.1016/j.ecss.2017.07.011
Brewin, R. J. W., De Mora, L., Jackson, T., Brewin, T. G., and Shutler, J. (2015). On the potential of surfers to monitor environmental indicators in the coastal zone. PLoS One 10:e0127706. doi: 10.1371/journal.pone.0127706
British Standard, (2000). BS EN 13319:2000. Diving accessories – Depth gauges and combined depth and time measuring devices - Functional and safety requirements, test methods. London: British Standard.
Burgess, H. K., DeBey, L. B., Froehlich, H. E., Schmidt, N., Theobald, E. J., Ettinger, A. K., et al. (2016). The science of citizen science: exploring barriers to use as a primary research tool. Biol. Conserv. 208, 113–120. doi: 10.1016/j.biocon.2016.05.014
Buytaert, W., Dewulf, A., De Bièvre, B., Clark, J., and Hannah, D. M. (2016). Citizen science for water resources management: toward polycentric monitoring and governance? J. Water Resour. Plan. Manag. 142, 1–4. doi: 10.1061/(ASCE)WR.1943-5452.0000641
Callaghan, C. T., Rowley, J. J. L., Cornwell, W. K., Pooreid, A. G. B., and Majorid, R. E. (2019). Improving big citizen science data: moving beyond haphazard sampling. PLoS Biol. 17:e3000357. doi: 10.1371/journal.pbio.3000357
Danovaro, R., Fanelli, E., Aguzzi, J., Billett, D., Carugati, L., Corinaldesi, C., et al. (2020). Ecological variables for developing a global deep-ocean monitoring and conservation strategy. Nat. Ecol. Evol. 4, 181–192. doi: 10.1038/s41559-019-1091-z
Dye, S. R., Hughes, S. L., Tinker, J., Berry, D. I., Holliday, N. P., Kent, E. C., et al. (2013). “Impacts of Climate Change on Temperature (Air and Sea). MCCIP Science Review.” Marine Climate Change Impacts Partnership: Science Review, no. November: 1–12. doi: 10.14465/2013.arc01.001-012
Egi, S. M., Cousteau, P. Y., Pieri, M., Cerrano, C., özyigit, T., and Marroni, A. (2018). Designing a diving protocol for thermocline identification using dive computers in marine citizen science. Appl. Sci. 8:2315. doi: 10.3390/app8112315
Fofonoff, N. P., and Millard, R. C. (1983). Algorithms for computation of fundamental properties of seawater. UNESCO Tech. Pap. Mar. Sci. 44:53.
Gibson, K. J., Streich, M. K., Topping, T. S., and Stunz, G. W. (2019). Utility of citizen science data: a case study in land-based shark fishing. PLoS One 14:e0226782. doi: 10.1371/journal.pone.0226782
Hermoso, M. I., Martin, V. Y., Stotz, W., Gelcich, S., and Thiel, M. (2019). How does the diversity of divers affect the design of citizen science projects? Front. Mar. Sci. 6:239. doi: 10.3389/fmars.2019.00239
Jacquelin, J. (2009). Regressions et Equations Integrales, 1–19. Available online at: https://scikit-guess.readthedocs.io/en/latest/_downloads/4cd313a50f7e08ab81758ce0bd661bc3/Regressions-et-equations-integrales.pdf
Jóhannesson, T., Thorsteinsson, T., Stefánsson, A., Gaidos, E. J., and Einarsson, B. (2007). Circulation and thermodynamics in a subglacial geothermal lake under the Western Skaftá cauldron of the Vatnajökull ice cap, Iceland. Geophys. Res. Lett. 34:L19502. doi: 10.1029/2007GL030686
Johnson, G. C., and Lyman, J. M. (2020). Warming trends increasingly dominate global ocean. Nat. Clim. Chang. 10, 757–761. doi: 10.1038/s41558-020-0822-0
Kennedy, J. J. (2014), A review of uncertainty in in situ measurements and data sets of sea surface temperature, Rev. Geophys. 52, 1–32, doi: 10.1002/2013RG000434
Kosmala, M., Wiggins, A., Swanson, A., and Simmons, B. (2016). Assessing data quality in citizen science. Front. Ecol. Environ. 14, 551–560. doi: 10.1002/fee.1436
Krabbenhoft, C. A., and Kashian, D. R. (2020). Citizen science data are a reliable complement to quantitative ecological assessments in urban rivers. Ecol. Indic. 116:106476. doi: 10.1016/j.ecolind.2020.106476
Li, J., Hu, G., Zhou, Y., Zou, C., Peng, W., and Jahangir Alam, S. M. (2016). A temperature compensation method for piezo-resistive pressure sensor utilizing chaotic ions motion algorithm optimized hybrid kernel LSSVM. Sensors (Switzerland) 16:1707. doi: 10.3390/s16101707
Lindstrom, E., Gunn, J., Fischer, A., McCurdy, A., Glover, L. K., and Members, T. T. (2012). A Framework for Ocean Observing. By The Task Team for an Integrated Framework for Sustained Ocean Observing. Paris: UNESCO, 1–28. doi: 10.5270/OceanObs09-FOO
Macias, D., Garcia, E., Alessandro, G., Adolf, D., and Keuler, K. (2018). Obtaining the correct sea surface temperature : bias correction of regional climate model data for the Mediterranean Sea. Clim. Dyn. 51, 1095–1117. doi: 10.1007/s00382-016-3049-z
Mares (2020), Mares Matrix Dive Computer Instruction Manual. Available online at: https://www.mares.com/shop/en-GB/matrix-1.html (accessed December 18, 2020).
Morris, D. J., Pinnegar, J. K., Maxwell, D. L., Dye, S. R., Fernand, L. J., Flatman, S., et al. (2018). Over 10 million seawater temperature records for the United Kingdom Continental Shelf between 1880 and 2014 from 17 Cefas (United Kingdom government) marine data systems. Earth Syst. Sci. Data 10, 27–51. doi: 10.5194/essd-10-27-2018
Needler, G., Smith, N., and Villwock, A. (1999). The Action Plan for GOOS / GCOS and Sustained Observations for CLIVAR.
Palacios, D. M., Bograd, S. J., Mendelssohn, R., and Schwing, F. B. (2004). Long-term and seasonal trends in stratification in the California Current, 1950-1993. J. Geophys. Res. C Ocean. 109, 1–12. doi: 10.1029/2004JC002380
Pasternak, G., Ribic, C. A., Spanier, E., Ariel, A., Mayzel, B., Ohayon, S., et al. (2019). Nearshore survey and cleanup of benthic marine debris using citizen science divers along the Mediterranean coast of Israel. Ocean Coast. Manag. 175, 17–32. doi: 10.1016/j.ocecoaman.2019.03.016
Pocock, M. J. O., Chapman, D. S., Sheppard, L. J., and Roy, H. E. (2014). Choosing and Using Citizen Science: A Guide to When and How to Use Citizen Science to Monitor Biodiversity and the Environment. Wallingford: Centre for Ecology & Hydrology.
Pörtner, H., Roberts, D. C., Masson-Delmotte, V., Zhai, P., Tignor, M., Poloczanska, E., et al. (2019). “Summary for policymakers,” in IPCC Special Report on the Ocean and Cryosphere in a Changing Climate. IPCC Rep. 2019.
Sayer, M. D. J., Azzopardi, E., and Sieber, A. (2014). Decompression management by 43 models of dive computer: single square-wave exposures to between 15 and 50 metres’ depth. Diving Hyperb. Med. 44, 193–201.
Shearwater, (2020). Why Does the Depth Reading on My Perdix Disagree with My Other Computer? – Shearwater Research. Available online at: https://www.shearwater.com/shearwater-product-faq/depth-reading-perdix-disagree-computer/ (accessed October 8, 2020).
Smit, A. J., Roberts, M., Anderson, R. J., Dufois, F., Dudley, S. F. J., Bornman, T. G., et al. (2013). A coastal seawater temperature dataset for biogeographical studies: large biases between in situ and remotely-sensed data sets around the Coast of South Africa. PLoS One 8:e81944. doi: 10.1371/journal.pone.0081944
Sogard, S. M., and Olla, B. L. (1993). Effects of light, thermoclines and predator presence on vertical distribution and behavioral interactions of juvenile walleye pollock, Theragra chalcogramma Pallas. J. Exp. Mar. Biol. Ecol. 167, 179–195. doi: 10.1016/0022-0981(93)90030-R
SonTek CastAway CTD (2020) Available online at: https://www.xylemanalytics.co.uk/sontek-castaway-ctd/ 622 (accessed January 7, 2020).
Subsurface, (2020). Subsurface | An Open Source Divelog. Available online at: https://subsurface-divelog.org/ (accessed December 18, 2020).
Suunto, (2018). Suunto d4i User Guide. Available online at: https://ns.suunto.com/Manuals/D4i/Userguides/Suunto_D4i_UserGuide_EN.pdf (accessed December 18, 2020).
swDepth, (2020). swDepth Function | R Documentation. Available online at: https://www.rdocumentation.org/packages/oce/versions/1.0-1/topics/swDepth (Accessed June 16, 2020).
Tang, Y., Huangfu, J., Huang, R., and Chen, W. (2020). Surface warming reacceleration in offshore China and its interdecadal effects on the East Asia-Pacific climate. Sci. Rep. 10, 1–10. doi: 10.1038/s41598-020-71862-6
Thiel, M., Penna-Diaz, M. A., Luna-Jorquera, G., Salas, S., Sellanes, J., and Stotz, W. (2014). Citizen scientists and marine research: volunteer participants, their contributions, and projection for the future. Oceanogr. Mar. Biol. 52, 257–314. doi: 10.1201/b17143-6
Vianna, G. M. S., Meekan, M. G., Bornovski, T. H., and Meeuwig, J. J. (2014). Acoustic telemetry validates a citizen science approach for monitoring sharks on coral reefs. PLoS One 9:e95565. doi: 10.1371/journal.pone.0095565
Widlansky, M. J., Long, X., and Schloesser, F. (2020). Increase in sea level variability with ocean warming associated with the nonlinear thermal expansion of seawater. Commun. Earth Environ. 1, 1–12. doi: 10.1038/s43247-020-0008-8
Keywords: citizen science, dive computer, sea temperature, accuracy, response time, precision
Citation: Marlowe C, Hyder K, Sayer MDJ and Kaiser J (2021) Divers as Citizen Scientists: Response Time, Accuracy and Precision of Water Temperature Measurement Using Dive Computers. Front. Mar. Sci. 8:617691. doi: 10.3389/fmars.2021.617691
Received: 15 October 2020; Accepted: 28 January 2021;
Published: 09 March 2021.
Edited by:
Eric Delory, Oceanic Platform of the Canary Islands, SpainReviewed by:
Antoine De Ramon N’Yeurt, University of the South Pacific, FijiDaniel Toma, Universitat Politecnica de Catalunya, Spain
Copyright © 2021 Marlowe, Hyder, Sayer and Kaiser. This is an open-access article distributed under the terms of the Creative Commons Attribution License (CC BY). The use, distribution or reproduction in other forums is permitted, provided the original author(s) and the copyright owner(s) are credited and that the original publication in this journal is cited, in accordance with accepted academic practice. No use, distribution or reproduction is permitted which does not comply with these terms.
*Correspondence: Celia Marlowe, Yy5tYXJsb3dlQHVlYS5hYy51aw==