 Alejandro Orfila1*
 Claudia P. Urbano-Latorre2*
 Juan M. Sayol3
 Stephanie Gonzalez-Montes2
 Alejandro Caceres-Euse4
 Ismael Hernández-Carrasco1
 Ángel G. Muñoz5
- 1Marine Technology and Operational Oceanography Group, Global Change and Physical Oceanography Departament, IMEDEA (CSIC-UIB), Esporles, Spain
- 2Área de Oceanografía Operacional, Centro de Investigaciones Oceanográficas e Hidrográficas del Caribe, Cartagena de Indias, Colombia
- 3Department of Applied Mathematics, University of Alicante, Alicante, Spain
- 4Mediterranean Institute of Oceanography (MIO), Université de Toulon, Toulon, France
- 5International Research Institute for Climate and Society (IRI), The Earth Institute at Columbia University, Palisades, NY, United States
The variability of La Guajira upwelling system, in the south-central Caribbean Sea, is strongly influenced by the intensity and location of the atmospheric Caribbean Low-Level Jet (CLLJ), a near-surface branch of the easterlies, as well as by the regional ocean circulation. During favorable conditions (i.e., strong easterlies blowing almost parallel to the coast), upwelling is enhanced and a large amount of primary productivity occurs in La Guajira area. In contrast, during relatively mild wind conditions, the CLLJ is misaligned to the coast and the Caribbean Counter Current (CCC, locally also known as the Darien Current), which forms as a branch from the Panama-Colombia Gyre, flows northeastward over the continental shelf advecting waters from the southwestern Caribbean basin toward La Guajira. The CCC has a clear signature at the surface layer that extends from the Darien Gulf toward La Guajira peninsula during mild wind periods, while disappears during the months of strong winds. The direction and the magnitude of the easterlies, and more specifically of the CLLJ, control the position and pathway of the CCC, which extends more than 900 km in the southern Caribbean Sea during May, June, August, September, and October. The high concentration of chlorophyll-a at the sea surface evidenced by satellite-based color images is semi-seasonally modulated by the CLLJ, which during its relaxation phase allows the irruption of the CCC toward the east up to La Guajira.
1. Introduction
Upwelling systems are of paramount economic and ecological importance due to the influence they have in the development of ecosystems with high primary productivity, which sets the basis for the abundance of fishing resources and the reduction of atmospheric CO2 through the biological pump (Rykaczewski and Checkley, 2008; Chavez and Messié, 2009). They are also of particular scientific interest due to the complex coupling mechanisms between atmospheric forcing, ocean circulation and biogeochemical cycles. The general structure of the oceanic circulation in typical coastal upwelling situations consists of a coast-parallel wind stress component that generates an oceanic geostrophic current in the upper layer, which deflects offshore with depth following an Ekman spiral. By mass conservation, this causes a vertical injection of colder nutrient-rich deeper waters to the euphotic layer.
Coastal upwelling in the southern Caribbean Sea is a well-known process driven by the bi-modal annual variability of the Caribbean Low-Level Jet (hereinafter CLLJ), which is a near-surface branch of the easterlies that blows parallel to the northern coast of Venezuela and Colombia until it reaches the Panama isthmus, when it turns southeastward toward the northern Pacific coast of Colombia. The interaction of these winds with the coast generates a northward Ekman transport and the subsequent upwelling of subsurface waters (Andrade and Barton, 2005; van der Boog et al., 2019). Two main upwelling sub-regions have been identified in the southern Caribbean Sea with different upwelling intensity and variability: the western upwelling zone, from 71 to 74°W, characterized by an intense seasonal upwelling, and an eastern zone, from 60 to 71°W, with more persistent but less intense conditions around the year (Correa-Ramirez et al., 2020). Differences in these two upwelling sub-regions are determined by the location of the maximum wind speed in the CLLJ relative to the coastal orientation, as well as by local differences in the vertical stratification of the water column (Wang, 2007; Amador, 2008; Hidalgo et al., 2015).
This upwelling is especially intense off La Guajira (Colombia) coastline, and its time variability and intermission (or inactivity) periods have been previously studied (Andrade and Barton, 2005; Correa-Ramirez et al., 2020). The upwelling enhances during the dry and windy season (from December to March), and during the also dry and windy month of July, and weakens during the wet season (from August to November). Upwelling in La Guajira is clearly identifiable with sea-surface temperature data since strong cold anomalies appear (Bernal et al., 2006), and it is closely connected with the distribution of high concentrations of chlorophyll-a (hereinafter Chl-a) (Paramo et al., 2011). While the inter-annual upwelling cycle has already been analyzed in detail, semiannual and seasonal variabilities of this phenomenon are still a subject of debate (see Montoya-Sánchez et al., 2018a, and references therein).
On the basis of data obtained from oceanographic campaigns (Andrade and Barton, 2005; Paramo et al., 2011), satellite observations (Castellanos et al., 2002; Paramo et al., 2011; Rueda-Roa and Muller-Karger, 2013), and ocean circulation models (Jouanno et al., 2009; Santos et al., 2016; Montoya-Sánchez et al., 2018b; van der Boog et al., 2019), some authors have tried to describe the atmospheric and oceanic mechanisms associated with upwelling in La Guajira. They found that its variability responds to changes in the CLLJ and to the intense submesoscale activity (mainly in the form of filaments) that develops in the area. Other research studies have pointed out the role of warm and low salinity waters from the Panama-Colombia Gyre in enhancing the upwelling intensity in this region (Beier et al., 2017; Correa-Ramirez et al., 2020). However, the effect of the Caribbean Counter Current on upwelling (CCC, also known as the Panama-Colombia Counter Current), a characteristic eastward ocean current that flows up to a depth of ~ 100 m along the Colombian coast toward La Guajira, is still a subject of debate. It is known that the seasonal variability of the CCC is intimately associated with both the Panama-Colombia Gyre dynamics and the strength of the easterlies (Sheinbaum Pardo et al., 1997). For instance, the CCC is relatively weak from December to March and intensifies during the midsummer drought (June and July). Despite its suggested relevance, only a few studies have attempted to investigate the influence of the CCC on La Guajira upwelling, likely because of the historical scarcity of available information to characterize the magnitude, vertical structure, and variability of this current during the upwelling period.
Against this background, in this work we study the conditions that favor upwelling in the surroundings of La Guajira peninsula for different wind states derived from its seasonal and subseasonal cycles. In particular, we analyze with more detail the role of the CCC in the advection of waters from the southwestern Caribbean Sea basin toward La Guajira coast when mild wind conditions exist. To this end, we analyze in situ data taken in La Guajira sector by two Acoustic Doppler Current Profilers (ADCP) moored during years 2007 and 2008 by Petrobras Colombia (Brazilian Petroleum Corporation) in collaboration with Dimar (Dirección General Marítima, according to its Spanish initials), together with Chl-a satellite concentration images from MODIS/Aqua, ocean currents from the HYbrid Coordinate Ocean Model—HYCOM (Chassignet et al., 2007), and Cross-Calibrated Multi-Platform (CCMP) surface winds (Wentz, 2015). In order to elucidate how the CCC influences La Guajira upwelling system, data are analyzed from complementary Eulerian and Lagrangian perspectives.
This article is structured into three main parts: first, the study area (section 2) an https://www.overleaf.com/projectd data and methods (section 3) are presented. In particular, we provide a brief overview of the Self-Organizing Maps (SOM) technique, which we use to establish the patterns and seasonal dynamics of the southern Caribbean Sea. Section 4 shows and discusses the link between the observed dynamics in La Guajira and the mesoscale activity in the western basin, including an analysis of the Lagrangian pathways between the Panama-Colombia Gyre and La Guajira area. Finally, the main conclusions are summarized in section 5.
2. Study Area
The Caribbean is a semi-enclosed sea in the western Atlantic Ocean, extending between a latitude of 8°N–25°N and a longitude of 85°W–60°W (Figure 1, left panel). The main source of water into the Caribbean is the inflow of relatively warm equatorial south Atlantic waters transported into the eastern edge of the Caribbean Sea by a boundary current along the South American coast, and partly by eddies created by the retroflection area of the North Brazil Current (Schott et al., 1998; Carton and Chao, 1999; Rhein et al., 2005). When the boundary current encounters the Lesser Antilles (Figure 1, left), it divides into a coastal primary jet and a few narrower pathways that circumvent the islands, which mostly rejoin later to form the Caribbean Current (CC).
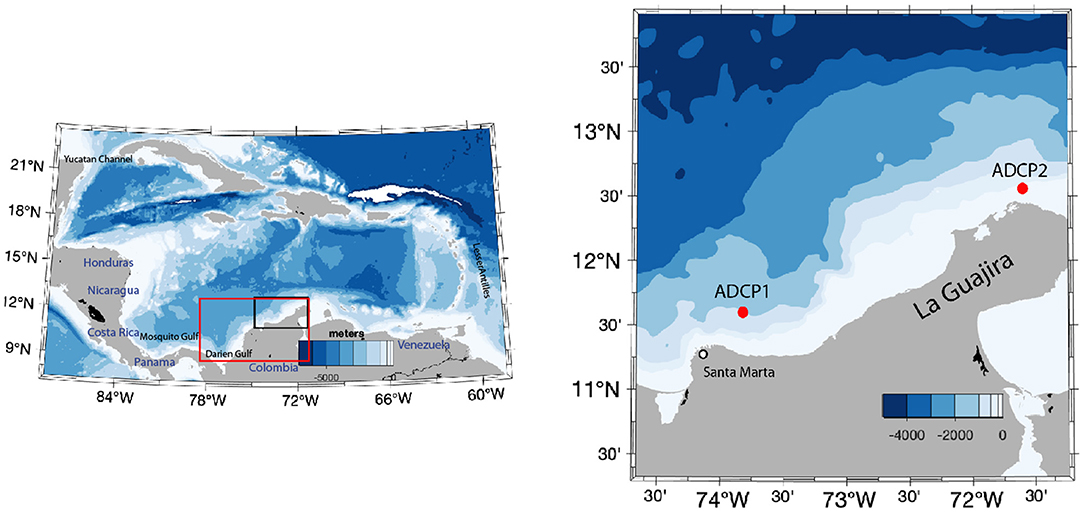
Figure 1. Bathymetry of the Caribbean Sea (left). The black box indicates La Guajira peninsula with the detailed bathymetry in the (right) and the red box the area used for the SOM analysis. Red dots in the right panel indicate location of the two moorings.
The continental shelf in the southern Caribbean Sea is one of the most productive areas in the whole basin due to the continuous upwelling driven by the almost constant easterly winds. Besides, the distribution of wind stress of the easterlies forms a zonal pressure gradient in which the pressure center is located at Central America, thus contributing to enhance the eastward flow (Andrade and Barton, 2000).
The climate in the region is in part modulated by the location of the Intertropical Convergence Zone (ITCZ) and by the American Monsoon System. As a result, there are two marked climatic seasons: the dry (or windy) season from December to March, and the wet season from August to November. During the dry season, northern easterlies dominate the area due to the location of the ITCZ at a latitude between 0 and 5°N. In contrast, during the wet season southern easterlies are able to reach the Colombian basin due to the migration of ITCZ toward higher latitudes (between 10 and 12°N). Moreover, during the so-called transition season (from May to June), easterlies tend to weaken, consistent with the bi-modal variability of the CLLJ (Orejarena-Rondón et al., 2019).
Around 21 identified upwelling sites along the coast of Colombia and Venezuela conforms the so-called Caribbean coastal Upwelling System (CCUS) (Castellanos et al., 2002; Paramo et al., 2011). The spatial and temporal variability of the CCUS mainly depends on the intensification and intermittency of the easterlies in the ITCZ because they contribute to rise isotherms, as well as on the orientation of the coast and the level of stratification of the water column (Andrade et al., 2003), e.g., due to the formation of barrier layers by vertical salinity changes in the upper ocean (Pailler et al., 1999).
La Guajira peninsula is the northernmost area in South America extending from 71.5°W to around the south of Santa Marta at 74°W (Figure 1, right panel). Previous studies developed in the area have explained the disruption of the upwelling in terms of the effect that short term synoptic perturbations have on the wind relaxation (Rueda-Roa and Muller-Karger, 2013), as well as in the change in its direction (Lonin et al., 2010). Here, we show that both, the weakening of the wind as well as the change in its direction allow the CCC to reach the remote areas of La Guajira, advecting continental water masses from the western side of the southern Caribbean Sea that the CCC encounters on its way. In this regard, Beier et al. (2017) demonstrated that due to combined effect of precipitation and runoff Caribbean Sea Water is more diluted in the southwest of the basin, in the region of the Panama-Colombia Gyre, while in the northeast, where the amount of runoff and rain decreases, salinity tends to rise off La Guajira from December to May because of upwelling.
3. Data and Methods
3.1. ADCP Data
The General Maritime Directorate of Colombia (Dimar) in agreement with Petrobras Colombia Limited, through the Woods Hole Group, deployed a series of moorings to study ocean currents off the northern coast of Colombia. One mooring (ADCP1) was located in front of Nazareth at 11°42′25″ N and 73°40′19″ W at a depth of approximately 1,500 m, and another mooring (ADCP2) was deployed in La Guajira area at 12°48′44″ N and 71°40′31″ W at a depth of 800 m (see mooring positions in Figure 1, right panel). Each mooring was equipped with a Teledyne RDI 75 kHz Acoustic Doppler Current Profiler (ADCP) at a depth of about 350 m in an upward looking position. These moorings were originally deployed in April 2007 and redeployed in June and September 2007, and in January 2008. These moorings were recovered in February 2008. Instruments were set to sample currents every 4 s and programmed to obtain one averaged ensemble every 60 min measuring during 731 days.
3.2. Ocean Currents From HYCOM Model
Horizontal ocean currents are obtained from the HYbrid Coordinate Ocean Model, HYCOM (Bleck et al., 2002). HYCOM is a primitive equation, general circulation model with isopycnal coordinates in the open ocean, terrain-following in shallow coastal regions, and z-level coordinates in the mixed layer and unstratified areas. The version we use is the HYCOM + NCODA Global Reanalysis (GLBu0.08/expt_19.1), which covers years 1995–2012 and has 32 vertical levels and yields a uniform grid. Input fields of surface wind stress, heat flux and rainfall used to force the model are based on the 1-hourly National Centers for Environmental Prediction (NCEP) Climate Forecast System Reanalysis (CFSR), which has a horizontal resolution of ~1/3° and allows to reproduce well the diurnal cycle. This simulation includes monthly river runoff and uses a 3D assimilation scheme that includes satellite, and in-situ sea surface temperature as well as in-situ vertical temperature and salinity profiles from XBTs, Argo floats and moored buoys (Cummings, 2005; Cummings and Smedstad, 2013).
In agreement with the initial time of ADCP data, only information for the period 2007–2012 is here used. The selected area covers from 58 to 89°W in longitude and from 7 to 24°N in latitude with a 1/12° resolution (213 × 389 grid points). Moreover, we only use two vertical levels: at the surface and at 90 m. The surface layer yields information on the Caribbean Current, while at 90 m it has been found the average depth of the subsurface salinity maximum (van der Boog et al., 2019) and is a depth that allows to capture well the subsurface Caribbean Counter Current, which is strongest at around 100 m (Andrade et al., 2003). Weekly averages of horizontal currents (u, v) and the original 3-hourly fields are employed to perform Eulerian and Lagrangian analysis in section 4, respectively. HYCOM data is available at: https://tds.hycom.org/thredds/catalog.html.
3.3. Surface Wind Data
Ocean surface winds are based on the cross-calibrated multi platform (CCMP) version 2.0 long-term data record. These data have a spatial resolution of 0.25 × 0.25° in both latitude and longitude coordinates, and are available at 6-h interval from 1988 until near present-day. This product is constructed with the variational analysis method (VAM) (Atlas et al., 1996; Hoffman et al., 2003). CCMP version 2.0 is an improved product that uses accurately intercalibrated winds from Remote Sensing System (Wentz, 2013, 2015), which includes satellite winds obtained from Tropical Rainfall Measuring Mission Microwave Imager (TRMM TMI), QuikSCAT, QuikSCAT (SeaWinds), WindSat, Special Sensor Microwave Imager (SSM/I), SSMIS, Advanced Microwave Scanning RadiometerEarth Observing System (AMSR-E) and other, in situ data from moored buoys, and background winds from the ERA-Interim reanalysis (Dee et al., 2011). CCMP winds are chosen due to its high resolution and long time sequence. They are freely available at: http://data.remss.com/ccmp/v02.0/.
3.4. Chlorophyll-a Satellite-Based Data
Chlorophyll-a (Chl-a) is a photosynthetic pigment commonly present in all phytoplankton species. It is used as a proxy of surface phytoplankton concentration. Chl-a concentration is a standard product from satellite-based optical sensors, usually retrieved through empirical algorithms that combine reflectance ratios at two or more wavebands. Daily MODIS/Aqua NIR-SWIR ocean color images, available from mid 2002, were obtained from https://oceandata.sci.gsfc.nasa.gov/MODIS-Aqua. This product provides surface Chl-a concentration at a spatial resolution of 1km2 by using the shortwave infrared (SWIR)-based atmospheric correction algorithm developed by NOAA/NESDIS. We use images of monthly mean sea surface Chl-a concentration (unit in mg·m−3) to characterize La Guajira area.
3.5. Self-Organizing Maps
A Self-Organizing Map (SOM) is a visualization technique based on an unsupervised learning neural network especially suited to extract patterns in large datasets (Kohonen, 1982, 2001). SOM is a nonlinear mapping implementation method that reduces the high-dimensional feature space of the input data to a lower-dimensional (usually two dimensional) network of units called neurons. In this way, SOM is able to compress the information contained in a large amount of data into a single set of maps. The learning process algorithm consists of a presentation of the input data to a preselected neuronal network, which is modified during an iterative process. Each neuron (or unit) is represented by a weighted vector with a number of components equal to the dimension of the input sample data. In each iteration the neuron whose weighted vector is the closest (more similar) to the presented input sample data vector is called the best-matching unit (BMU). Each BMU is updated together with its topological neighbors located at a distance less than the neighborhood radius Rn toward the input sample through a neighborhood function (see Hernández-Carrasco and Orfila, 2018, for a schematic representation of the SOM algorithm). Therefore, the resulting patterns will exhibit some similarity because the SOM process assumes that a single sample of data (input vector) contributes to the creation of more than one pattern, as the whole neighborhood around the best-matching pattern is also updated in each step of the training. It also results in a more detailed assimilation of particular features that appear on neighboring patterns if the information from the original data enables it to do so. At the end of the training process, the probability density function of the input data is approximated by the SOM, and each unit is associated with a reference pattern that has a number of components equal to the number of variables in the dataset. Therefore, this process can be interpreted as a local summary or a generalization of similar observations. Compared to conventional statistical methods such as the Empirical Orthogonal Functions, SOM is able to introduce nonlinear correlations and it does not require any particular functional relationship or assumption on the data distribution, e.g., distribution normality or equality of the variance (Liu et al., 2006, 2016; Hernández-Carrasco et al., 2018). In this work we compute SOMs in the spatial domain with a map size of 4 × 4 (16 neurons) and a hexagonal map lattice to have equidistant neighbors and do not introduce anisotropic artifacts. Concerning the initialization, we opted for random initialization since it is faster and missing data are accepted. For the training process we use the imputation batch training algorithm adapted for data with missing values and a “Gaussian” type neighborhood function. SOM computations have been performed using the MATLAB toolbox of SOM v.2.0 (Vesanto et al., 1999) provided by the Helsinki University of Technology (http://www.cis.hut.fi/somtoolbox/, accessed October 14, 2020).
3.6. Lagrangian Pathways
Forward in time pathways are computed in section 4.4 with OceanParcels (Lange and van Sebille, 2017; Delandmeter and van Sebille, 2019) using a Runge-Kutta 4th order advection scheme. Because the vertical component is not publicly available in HYCOM dataserver the advection of passive particles will be performed in 2D with u and v 3-hourly velocity fields. Only the advective terms are considered in the computation of trajectories. Advection internal timestep of the RK4 scheme is fixed to 60 min.
4. Results and Discussion
4.1. Characterization of Averaged Surface Circulation and Mesoscale Activity
Mesoscale dynamics in the Caribbean Coastal Upwelling System (CCUS) is assessed through a statistical analysis of the kinetic energy budgets computed from modeled ocean currents and their spatial variability. According to the theory of random processes for turbulent flows, we assume the flow to be statistically stationary (Pope, 2001). This means that while the prognostic variables vary in time, their statistics (mean and variance) are time independent. Under such assumptions, the components of the flow field u(t) = [u(t), v(t)] can be written as the sum of their temporal mean and a time-varying fluctuation u′(t). Therefore, the instantaneous zonal and meridional velocity components at a given time [u(t), v(t)] can be decomposed as:
where overbars represent the time-mean over the 6 years of simulation and primes denote the time-dependent fluctuating part (the eddy component of the flow). From the previous formulation, the time averaged Kinetic Energy of the flow at a given location can be decomposed into the sum of a Mean Kinetic Energy (Km) and a time-averaged Eddy Kinetic Energy (). These terms, per unit volume, are defined as:
The total time-averaged Kinetic Energy, K can be readily obtained from Equations (1)–(2) as:
since the mean flow and turbulent quantities do not correlate, the last two terms inside the parenthesis are zero.
Following the definitions given in Equations (2), maps of surface Km and time-averaged Ke () in the Caribbean Sea are shown in Figure 2 for the period 2007–2012. The larger signature of Km is given by the Caribbean Current (CC), whose origin is associated with the flow of the North Equatorial Current entering into the Caribbean Sea across the Lesser Antilles channels (Figure 2a). This current flows west-northwestwards until exiting to the Gulf of Mexico through the Yucatan Channel. The mesoscale signature given by the Km also reflects at the western side of the basin the deflection of the currents that form the Panama-Colombia Gyre, which arises from an intense interaction between the surface wind stress and heat fluxes (Montoya-Sánchez et al., 2018a). By contrast, shows a more spread distribution with some areas of large activity detached from the mean currents, mainly in the central basin and around the Panama-Colombia Gyre area (Figure 2b). Mesoscale activity is very high in the Caribbean Sea, where eddies tend to increase in size as they move westwards, which enhances the available in the whole basin (van der Boog et al., 2019). The scattered distribution of reveals a high variability in the position and intensity of mesoscale structures over time. In this regard, the CC is known to display a well-defined pathway at the eastern edge of the basin, also depicted by the Km, that becomes more unstable as it moves westwards, when meanders and eddies shed from the initial along-coast current toward the center of the basin, as revealed by the high values of found in the central areas of the basin (Figure 2b).
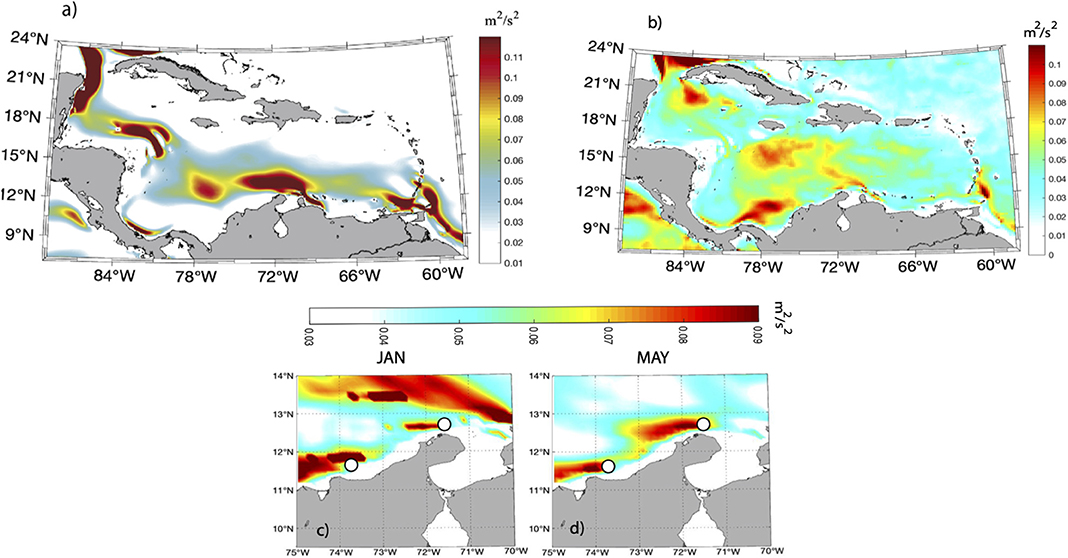
Figure 2. (a) Mean Kinetic Energy (Km) and (b) Mean Eddy Kinetic Energy () for the daily surface velocities for the period between 2007 and 2012. A zoom of the monthly mean values of during (c) January, and (d) May in La Guajira area for the period 2007–2012 where dots indicate location of ADCP. Units in m2·s−2.
At the northern part of La Guajira, Km depicts the signature of the CC (Figure 2a), which is intensified off the western coast of Venezuela). shows large values of around 800cm2·s−2 at the northernmost part of La Guajira because of the strong eddy-detachment from the mean current and values between 400 and 600 cm2·s−2 south of this point indicating the importance of mesoscale features in the dynamics of this area (Figure 2b). As stated by Jouanno and Sheinbaum (2012), easterly winds carried by the CLLJ vary semi-annually with maxima during summer and winter, and minima during fall and spring. The configuration of the pressure system in the basin at the beginning of the year is mainly modulated by the North Atlantic Subtropical High, although the Canadian High, the ITCZ located south of the equator and the Iceland low at higher latitudes also play a role (Lonin et al., 2010). This configuration changes during summer, when the North Atlantic Subtropical High disappears and is replaced by a low pressure system, which results in a northward displacement of the ITCZ; while during the winter-spring transition, abrupt changes in the wind direction appear over the tropics. Unlike Km, which displays the main path of the CC as well as the initial path of the CCC at the coast of Panama, large values of are distributed across the basin showing the mesoscale activity areas in the basin. It is well-known that instabilities in the CC drive the formation and growth of mesoscale eddies in the basin (Andrade and Barton, 2000; Richardson, 2005; Jouanno and Sheinbaum, 2012). Large seasonal differences are found spatially in the time averaged (Figure 2c for January and Figure 2d for May). During January, the spatially averaged wind (over the area shown in Figures 2c,d), is 6.9 m/s and correspond to strong activity on the CC path (Figure 2c). Conversely, during May (spatially averaged winds between 2007 and 2012 of 5.2 m/s), the activity is mainly found around the CCC (Figure 2d).
Regarding the time variability, the spatial average of Eddy Kinetic Energy < Ke> over La Guajira area (black box in Figure 1), depicts a seasonal behavior with values ranging from 200 cm2·s−2 to 1,500 cm2·s−2 (Figure 3). Moreover, < Ke> shows a semi-annual variability that modulates the seasonal cycle (bar-plot in Figure 3). For the period analyzed, the larger monthly values of < Ke> over la Guajira area are obtained during June and October being an indicator of large mixing activity during these months.
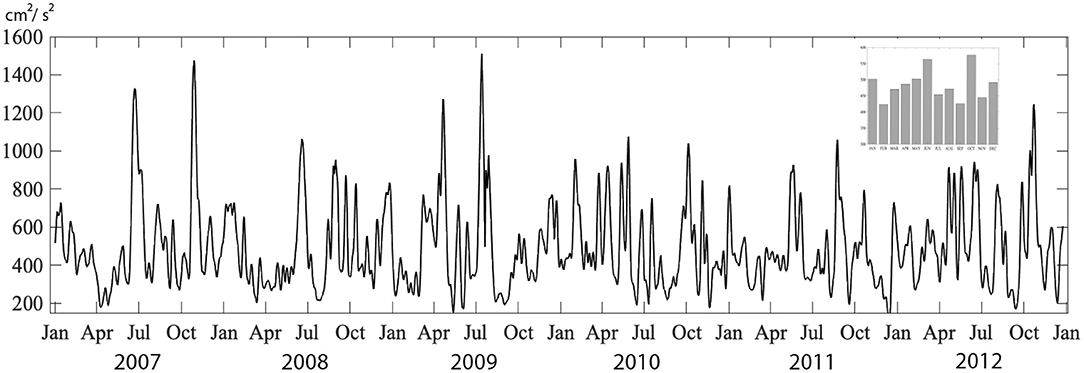
Figure 3. Spatially averaged (over La Guajira, see black box in Figure 1A) Eddy Kinetic Energy, < Ke> between 2007 and 2012. For the sake of clarity a 10-day smoothing has been applied. In the inset panel, the 6-year (2007–2012) monthly mean spatially averaged Eddy Kinetic Energy is shown with bars to better display the semi-annual cycle.
4.2. Seasonal and Semi-Annual Upwelling
To characterize the temporal variability of the potential surface biological productivity in the study area, we analyze 2 years (2007–2008) of daily images taken by MODIS-Aqua sensors in the surroundings of La Guajira peninsula. Figure 4 shows the monthly averages of Chl-a constructed with cloud free daily images. As observed, the most productive months cover from November to March. During these months, easterlies blow almost parallel to the coast, thus favoring an offshore Ekman transport (we refer Supplementary Figure 1 to see the wind seasonality over the Caribbean Sea). The magnitude of monthly wind speed gradients are also shown in Figure 4 by the separation distance between wind speed contours of 6, 8, and 10 m·s−1 As seen, months with large gradients (a smaller separation between isolines) and isolines more aligned to the coast show a higher Chl-a concentration. By contrast, when the ITCZ migrates toward the north the direction of easterlies is more perpendicular to the coast and Chl-a concentration drops drastically, up to almost disappear during April and May. Unsurprisingly, intense upwelling is seen during the rainy season (from December to March, Figure 4). More interesting are findings during June and October, when despite wind conditions do not favor upwelling, a significant amount of Chl-a is observed.
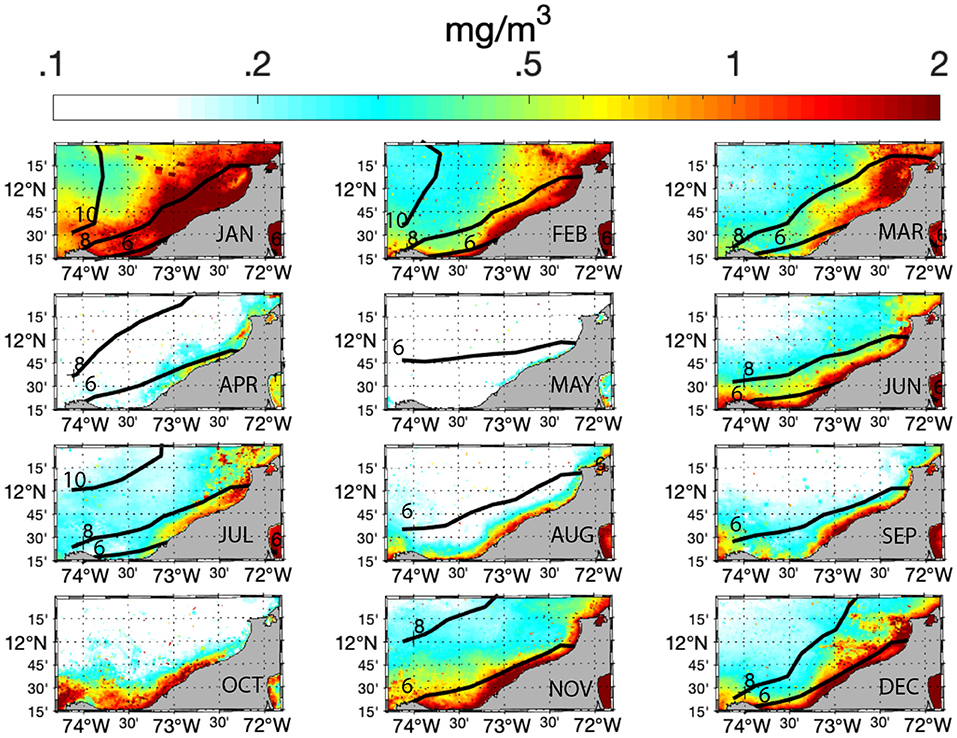
Figure 4. Monthly averaged chlorophyll-a (Chl-a) for La Guajira region for years 2007 and 2008. Black lines indicate the 6, 8, and 10 m·s−1 isolines of surface wind speed. During October wind contours are below the 6 m·s−1 in the area of study.
To further explore the properties of the ocean flow related to the above described phytoplankton growth scenarios, we analyze currents measured by two ADCPs during 2007 for the months of June and December (strong upwelling), and May (weak upwelling). As mentioned in section 3.1, instruments were deployed during almost one year off Santa Marta and La Guajira (ADCP1 and ADCP2 in Figure 1, right panel) at the continental shelf. West-East and South-North u, v currents were rotated following the Euler rotation matrix:
where α ≈ 57° is the angle that the coast forms with respect to the Equator, and (u′, v′) are the parallel and orthogonal velocity components with respect to the coast. Note that u′ has been additionally multiplied by (−1) to more easily identify simultaneous positive (negative) along-shore and cross-shore values as upwelling (downwelling) processes. Positive along-shore velocities are directed southwestward and positive cross-shore velocities move northwestward (offshore). Figures 5, 6 show the along-shore (top panels) and cross-shore (bottom panels) velocity components of the upper ocean layer (y-axis, from 60 m below the surface up to a depth of 160 m) for May (left), June (center), and December (right) of year 2007. Based on ADCP1 measurements taken off Santa Marta (Figure 5), during May along-shore velocities are directed northeastward while cross-shore velocities are onshore (southeastward), suggesting a situation associated with downwelling. In May, average winds in La Guajira are below 6 m·s−1 (see Supplementary Figure 1) and the ocean flow is mainly controlled by the CCC, which flows eastwards along the continental shelf at a depth between 50 and 150 m. During June, currents over 80 m of depth are mostly northeastward and onshore except during 21–23 of June, when the flow reverses and acquires offshore velocities. In parallel, surface winds are of around 8 m·s−1 with a northward shift with respect to the windy season. As mentioned above, this unfavorable upwelling wind is accompanied by a significant Chl-a concentration in the area (Figure 4), which indicates that this high concentration is not directly related with the wind-induced offshore movement of surface water. In contrast, below 100 m of depth and until June 22nd the along-shore component is mostly southwestward and the cross-shore component is offshore (Figure 5). However, these velocities are relatively small with magnitudes below 5 cm·s−1, especially in the along-shore direction.
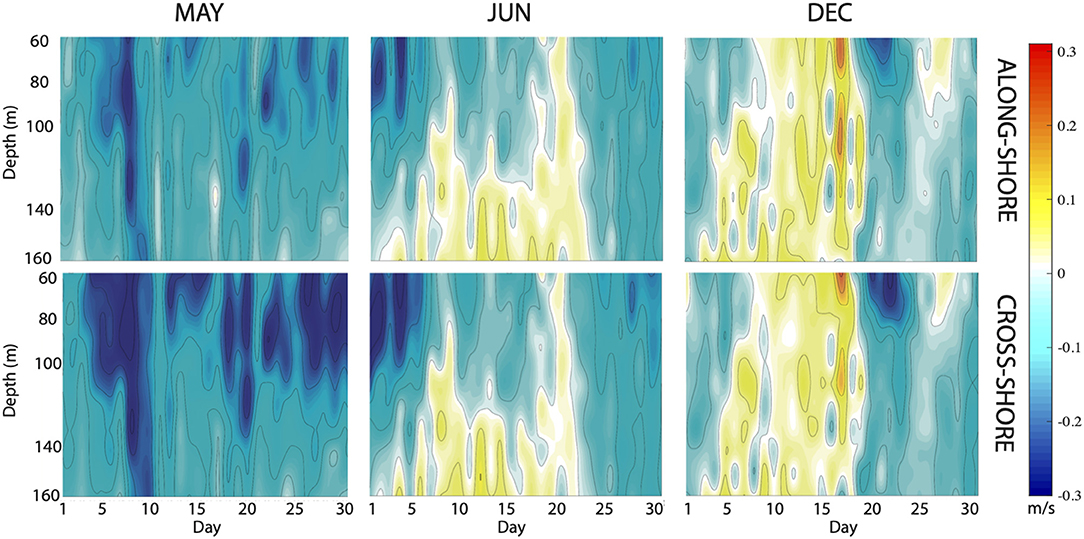
Figure 5. Along-shore (top) and cross-shore (bottom) currents off Santa Marta (ADCP1, Figure 1) between 60 and 160 m of depth for May (left), June (center), and December (right) 2007. Positive (negative) velocities are southwestward (northeastward) and northwestward (southeastward) for along-shore and cross-shore components, respectively.
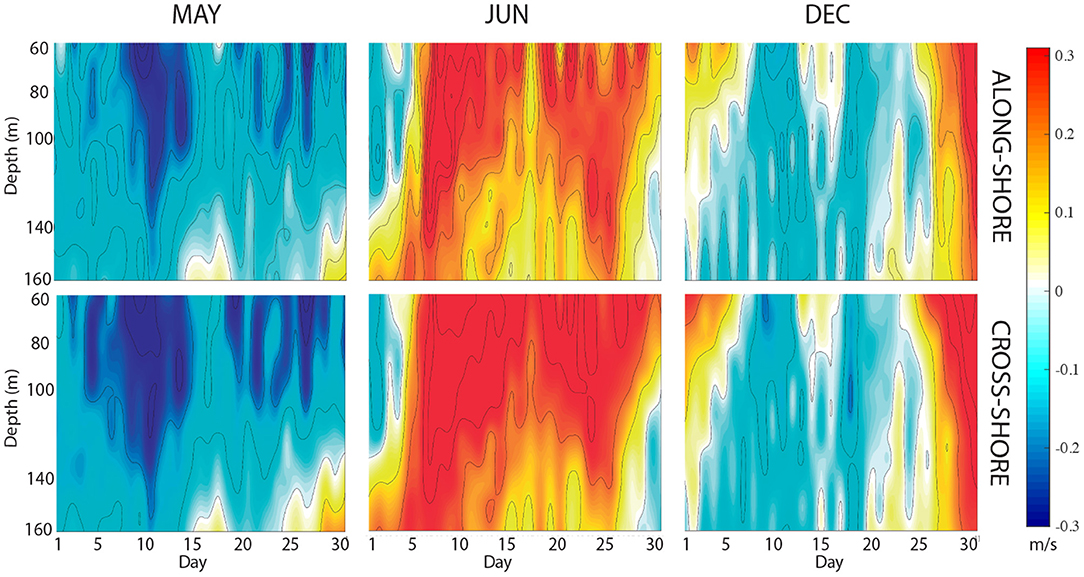
Figure 6. Along-shore (top) and cross-shore (bottom) currents off La Guajira (ADCP2, Figure 1) during May (left), June (center), and December (right) 2007. Positive (negative) velocities are southwestward (northeastward) and northwestward (southeastward) for along-shore and cross-shore components, respectively.
During the first week of December the upper along-shore flow is oriented northeastward and the upper cross-shore flow moves onshore, then reverses for the next two weeks to display intense southwestward along-shore and offshore cross-shore components that reach 30 cm·s−1 at a depth of 60 m (the intense offshore flow indicates favorable upwelling conditions). As expected, the surface concentration of Chl-a increases (see Figure 4, DEC), since the CLLJ moves southward strengthening winds during the dry season.
At ADCP2 (located in the northernmost part of La Guajira peninsula, Figure 1), during May the along-shore and the cross-shore velocity components are also directed northeastward and onshore, respectively. The main difference with respect to the ADCP1 is found in June, when the along-shore and the cross-shore components are southwestward and offshore in the upper layers and during the whole month. Moreover, the magnitude of both components is higher than for ADCP1 with values reaching 0.3 m·s−1. The averaged winds for this month display the maximum intensity in an area adjacent to La Guajira peninsula (see Supplementary Figure 1), close to the location of the mooring, thus showing a distinct situation to the one found to ADCP1. During December, alternating southwestward and northeastward along-shore velocities accompanied by offshore and onshore cross-shore velocities are found. At the end of the month, the flow is strongly upwelling favorable (southwestward and offshore in the along-shore and cross-shore components, respectively) in a situation that typically lasts until the end of the wet season.
The Ekman transport can be readily obtained using the horizontal wind components at 10 m above the sea level (section 3.3) as,
with ρw = 1025 kg m−3 the seawater density, f = 2Ω sin λ the Coriolis parameters being Ω is the angular speed of earth rotation, λ the latitude and the along-shore wind stress component computed as:
where Cd is the wind drag coefficient (set constant as 1.4·10−3), ρa = 1.22 kg·m−3 the density of air and the rotated 10 m wind speed using Equation (4). Figure 7 displays the Ekman transport obtained from Equation (5) (squares) with daily wind values at the location of ADCP1 (red) and ADCP2 (green). This transport is the volume transport per distance unit of an across-shore cross section. Overall both sites have the same seasonal variability with a bi-modal distribution and maximum values in the dry season (Dec–Jan), and a second peak in the transport during July. The two minimum values are found during May and September–October, respectively. Because during all months the Ekman transport at La Guajira (ADCP2) is larger than at Santa Marta (ADCP1), we could expect a larger amount of Chl-a induced by the wind at the location of ADCP2, which is not always the case (Figure 4). Pictures of monthly averaged surface Chl-a are displayed in Figure 4 for Santa Marta (red) and La Guajira (green). As seen, surface Chl-a follows the general tendency shown by the cross-shore transport with higher concentrations from December to March, but with peaks in Santa Marta during June and most notably during October, being this month the period with weaker winds over the area. Upwelling may induce re-suspension and transport elements from lower layers to the surface potentially enhancing primary production (Huhn et al., 2007). The variability of the upwelling processes in La Guajira is mainly driven by the wind stress seasonal and semi-annual cycles, with peaks during the dry and the drought seasons (Fajardo, 1979; Andrade and Barton, 2000, 2005). In the next sections we investigate the role of ocean currents as a potential mechanism to explain the spatial distribution of Chl-a not directly attributed to the wind to reconcile the simple view given by the Ekman transport with observations.
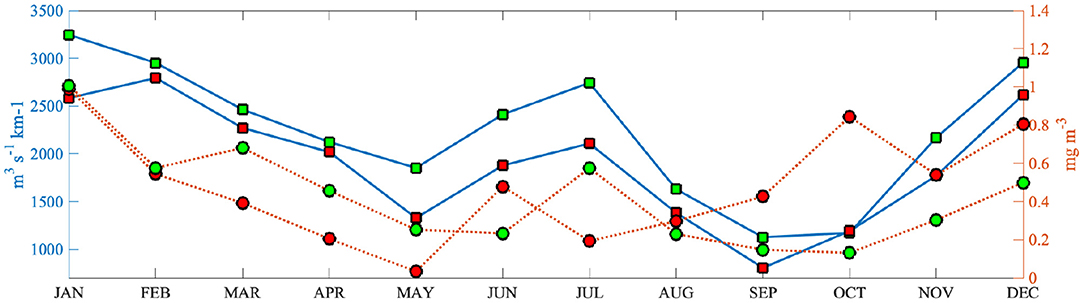
Figure 7. Monthly averaged cross-shore Ekman transport (squares) at ADCP1 (red) and ADCP2 (green) and monthly averaged surface Chl-a (dots) at ADCP1 (red) and ADCP2 (green) for the period between 2007 and 2012. Surface wind data is described in section 3.3.
4.3. Classification of the Eulerian Dynamics Through SOM Analysis
SOM of Surface Currents and Winds
The spatial patterns at the surface over the southern Caribbean Sea (see red box in Figure 1) are obtained by applying a joint SOM over the weekly mean ocean horizontal velocities and surface winds, for the period between 2007 and 2012 (both included). Figures 8, 9 display the coupled 16 patterns obtained from the 4 × 4 SOM neurons of surface velocities and surface winds, respectively. Additionally, the monthly occurrence of the patterns obtained from the best matching units (BMU) are displayed in Figure 10. Occurrence probability is computed through the identification of the BMU for each time step. The BMU is obtained by comparing each sample of the velocity time series with patterns P1–P16 and selecting the pattern more similar to the sample (i.e., has the minimum Euclidean difference). In this way, a time series of BMU can be used to calculate the probability of occurrence of each pattern by dividing the total count of the pattern identified as BMU by the length of the sample time series.
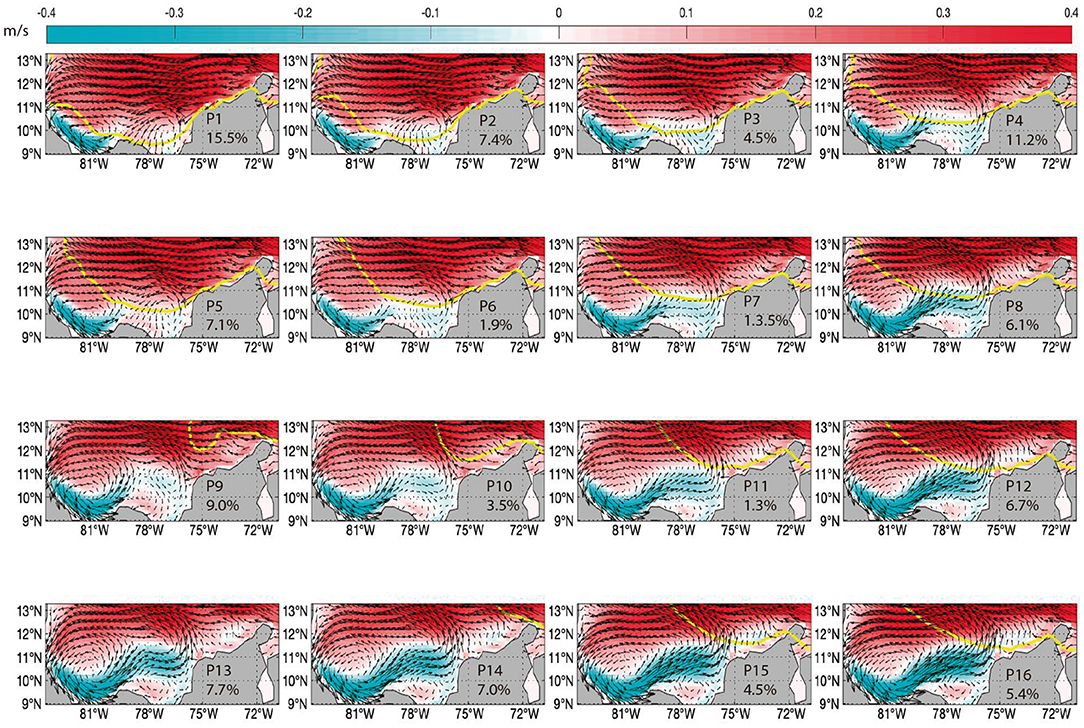
Figure 8. Spatial patterns of surface currents given by a 4 × 4 SOM analysis in the Caribbean Sea computed from weekly mean surface velocities over the time period 2007–2012. The colorbar indicates the magnitude of the zonal velocity in m·s−1 (note that positive values are westwards). Yellow line indicates the corresponding 8 m·s−1 wind contour as obtained from the wind SOM patterns (Figure 9). Each panel shows the probability of occurrence.
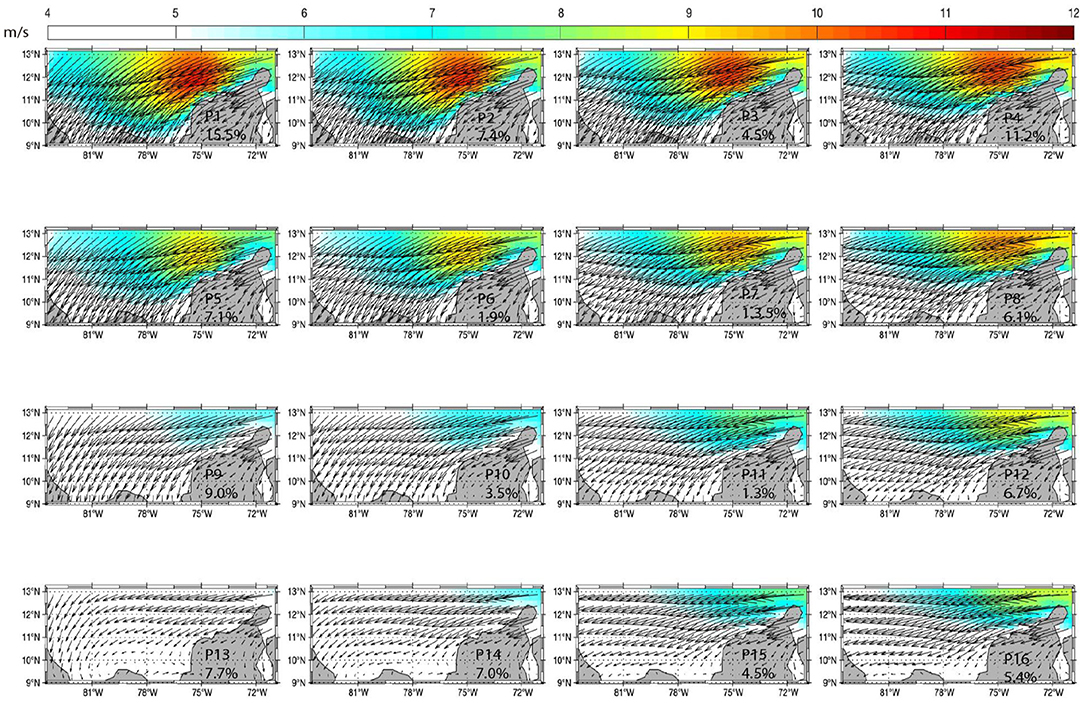
Figure 9. Spatial patterns of surface winds given by a 4 × 4 SOM analysis in the Caribbean Sea computed from weekly surface winds over the time period 2007–2012. The colorbar indicates the wind speed in m·s−1.
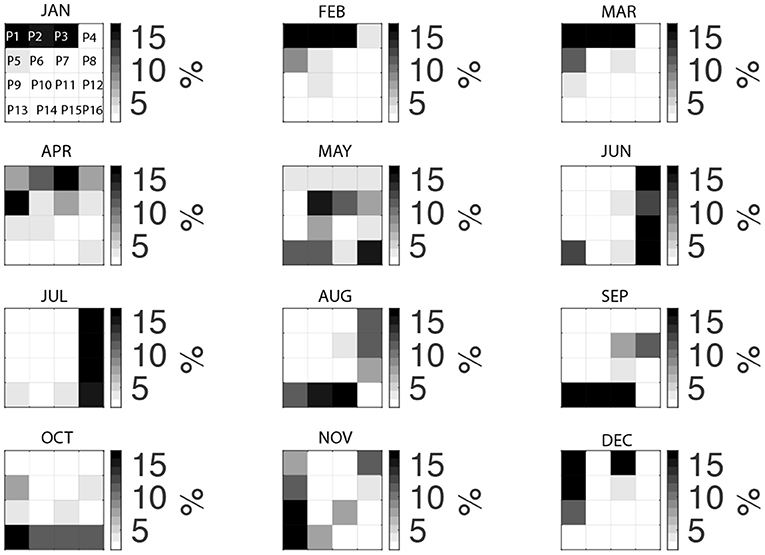
Figure 10. Monthly BMU distribution of SOM patterns for surface currents and winds.
Owing to the topology preservation of the SOM methodology, the resulting patterns are closely distributed in the neural network over four different dynamical situations according to their similarity. We found contrasting situations in the surface circulation and surface winds (Figures 8, 9) represented by the neurons located in the first and last row of the lattice. These can be described by patterns P1 and P13 with probabilities of 15.5 and 7.7%, respectively (at the two left corners) which represent the blocking of the CCC and the developments of the CCC up to La Guajira, respectively. The dominant spatial structure, that is, the common configuration in all the neurons, corresponds to the westward flow of the incoming Atlantic waters fed by the North Equatorial, North Brazil, and Guiana Currents conforming the CC that transports water westward until reaching the Panama isthmus, when it divides into two branches: one that flows northwestward aligned to the Central American coast toward the Yucatan Channel, and another one that recirculates southeastward forming the aforementioned Panama-Colombia Gyre and the CCC, which can extend eastward up to 72°W near La Guajira in the bottom row of the lattice. Note that shading indicates a zonal velocity with positive (red color) values directed westward, and the yellow lines depict the 6 m·s−1 wind speed contour obtained from the corresponding wind pattern (Figure 9). As suggested by the displacements of the wind speed contour in Figure 8, each pattern of surface current is associated with a wind pattern given in Figure 9, thus we can connect dynamical states in surface circulation with surface wind configurations.
As seen in Figures 8, 9, situations in which patterns of currents have a well-defined eastward coastal flow aligned to the Colombian coast are associated to moderate wind intensities (P12–P16), which are infrequent and tend to occur in the transition months (see Supplementary Figure 1). The explanation is that winds are mainly zonal blowing westward with maximum intensities during February and July, thanks to the regional amplification of the North Atlantic easterlies associated with an anticyclone over the subtropical North Atlantic, which intensifies the CLLJ (Munoz et al., 2008). In contrast, this jet weakens during May and October (see wind speed contours in Figure 4), favoring the extension of the CCC toward La Guajira. Moreover, coastal upwelling can be disrupted by changes in wind speed and direction (Enriquez and Friehe, 1995). Indeed there are two well-known physical mechanisms responsible for the divergence in the Ekman transport and that induce upwelling: (i) the coastal inhibition and (ii) the divergence of the current (Fennel and Lass, 2007). In the case of the wind curl (Supplementary Figure 2), it presents high values over La Guajira area from January to April, decreasing during May and June, intensifying again in July, and disappearing from August to November to finally increase again during December thus showing a clear semi-annual cycle that agrees well with the periodicity of upwelling events in the region.
The monthly occurrence of each of the surface currents and wind patterns (Figure 10) shows an arrangement of patterns on those months clearly associated in the literature with intense upwelling (December–March), represented by those patterns that reflect the CCC blocking and intense winds over La Guajira peninsula (Figures 8, 9). August, September, and October, periods where the upwelling is blocked, are mostly represented by patterns in the bottom row with a developed CCC and weaker winds in the area. At this point, we want to remark that due to the conservation of topology, the transition between patterns is smooth, and thus similar patterns are grouped in the same area of the neural network. The situation in May is clearly a mixing of several patterns with predominance of patterns P6 and P16 and, with less occurrence, P7, P13, and P14, all of them being patterns with relatively mild winds (see Figure 9) and intense CCC (Figure 8). In December, when the upwelling season begins, dominant patterns are P1, P3, P5 and with slightly less occurrence P9. At the surface, the first three patterns display a configuration with the maximum wind intensity at the north of La Guajira peninsula (Figure 9), and westward current velocities over La Guajira. Note that winds blow almost parallel to the coast limited by the 6 m·s−1 isoline (Figure 8). Pattern P9 shows a different situation with relaxed wind toward the northeast direction and with near vanishing zonal ocean velocities at La Guajira. In contrast, June is mostly represented by the neurons located in the right side of the lattice (patterns P4, P8, P12, and P15). All these patterns present at the surface in La Guajira either a very small magnitude of westward ocean currents or an eastward component where the flow is part of the CCC. It is worth to note that the 6 m·s−1 wind contour in these patterns follows the coastline in La Guajira, but around Santa Marta it turns toward the interior Caribbean Sea, which supports the lower Ekman transport found in ADCP1 with respect to ADCP2 (Figure 7). The corresponding wind patterns (Figure 9) mostly show moderate winds (76% of occurrence for the sum of patterns P8, P12, P13, and P16).
Moreover, the most intense upwelling occurs during January, February, and March and this period is mostly represented by patterns P1, P2, and P3 characterized by the strongest winds over La Guajira peninsula blowing parallel to the coast (Figure 9), while currents are directed westwards with a magnitude at the surface that reaches 0.4 m·s−1 (Figure 8). The evident seasonality in the surface circulation, which has been already noticed by other authors (Andrade and Barton, 2005; Correa-Ramirez et al., 2019), is here clearly illustrated by the distribution of BMU (Figure 10).
4.3.1. Subsurface Circulation at the Maximum Salinity Depth
It is known that upwelled waters in the southern Caribbean Sea are influenced by mesoscale features (Rueda-Roa Digna et al., 2018). To get a better insight on the role of the Panama-Colombia Gyre in the transport of water masses from the western side of the basin toward La Guajira, we repeat the SOM analysis over the weekly averaged modeled ocean velocities at the depth of maximum salinity, which is on average at around 100 m (see for instance Figure 7 in van der Boog et al., 2019). To this end, we use again the same number of neurons (16). Figure 11 shows the spatial patterns and their corresponding monthly occurrence probability in Figure 12. It can be seen how the CC shifts latitudinally; during January–April, months mostly represented by the patterns located in the lower row (P13, P14, P15, and P16 in Figure 12), it extends toward the south with a southwestwards direction. By contrast, from June to November, the representative patterns are in the top row of the lattice (P1, P2, P3, and P4) and show the northward displacement of the CC. The position, strength, and direction of the CC modulates the eastward flow along the central and south Caribbean Sea. In P1 and P2 the eastward flow is intense forming two well defined eddies: one that rotates cyclonically in the Mosquito Gulf, in front of Nicaragua and Costa Rica coasts, and a second that rotates anticyclonically in the Darien Gulf, within the Panama-Colombia Gyre. Patterns P3 and P4 show a southward displacement of the CC, thus disappearing the first eddy and shifting to the south the Panama-Colombia Gyre, which allows waters from Central America to reach a longitude of around 75°W. Additionally, P8, P12, and P13 show the southernmost position of the CC at this depth. In these patterns the Panama-Colombia Gyre disappears allowing waters from the central Caribbean to reach the northern part of La Guajira. These patterns are representative of June, where the Ekman transport off Santa Marta is lower than the one obtained for April, but the concentration of Chl-a at the surface is larger than in April (see ADCP 1 lines in Figure 7). It has been already suggested that the CCC originates at the surface in the area of the Panama-Colombia Gyre and progressively deepens reaching a depth of approximately 100 m in the Colombian basin (Correa-Ramirez et al., 2020) reaching the Guajira area (Andrade et al., 2003). Our results suggest that this mechanism is responsible for the transport of waters from the western basin toward La Guajira. This region receives freshwater runoff of central America rivers as well as the discharge from Magdalena River (Colombia), which could explain in part the large amount of surface Chl-a concentration during periods of low wind intensity.
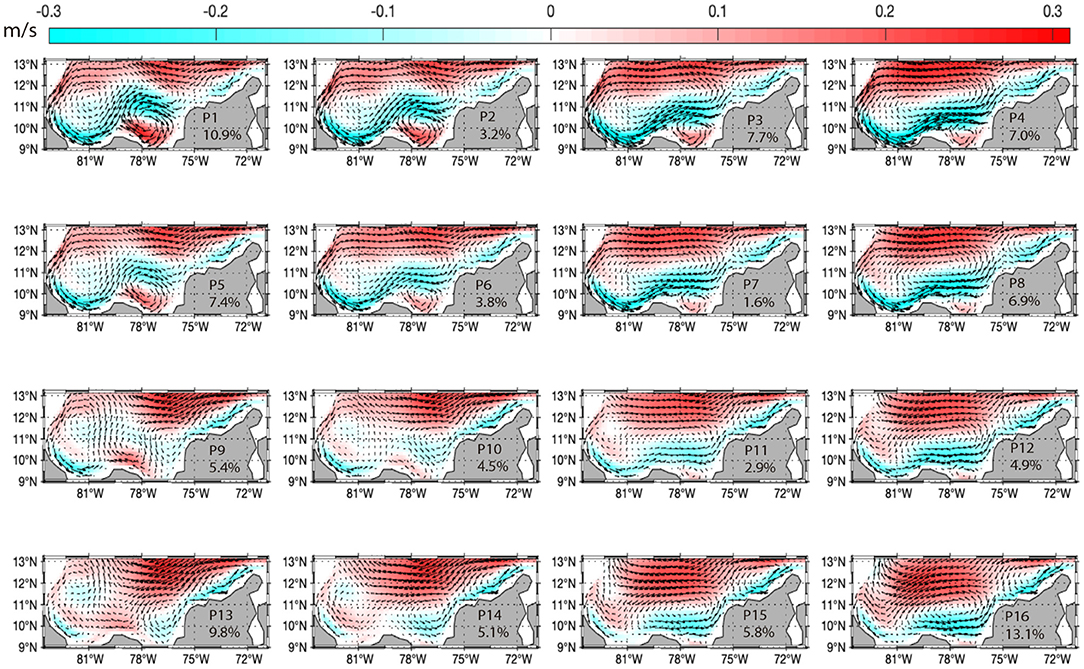
Figure 11. Spatial patterns of HYCOM model ocean currents at 100 m depth given by a 4X4 SOM analysis in the Caribbean Sea computed from weekly mean surface velocities over the time period 2007–2012. The colorbar indicates the magnitude of the zonal component of velocity in m·s−1.
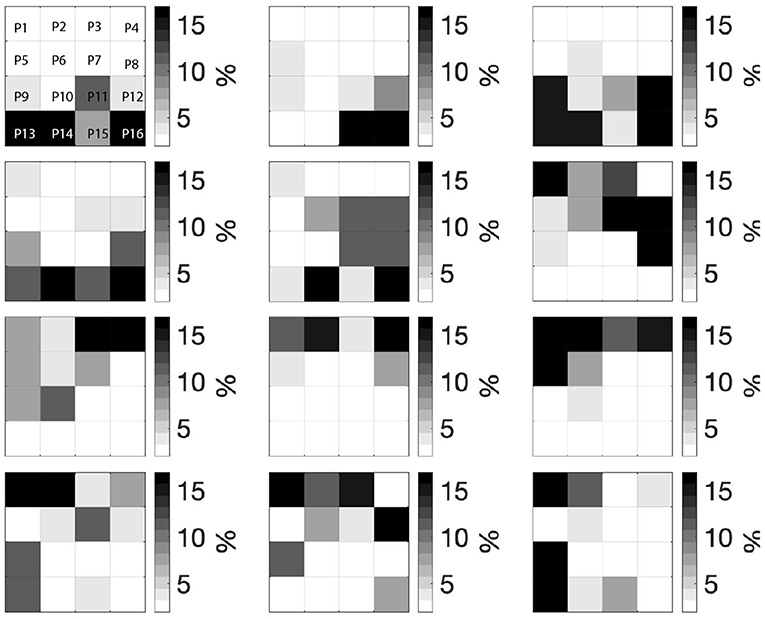
Figure 12. Monthly BMUs distribution of SOM patterns shown in Figure 11 derived from 100 m depth ocean currents.
4.4. Lagrangian Dynamics
As explained above, the CCC seems to play an active role in the advection of more diluted waters from the Colombian basin (including nutrient-richer waters from Magdalena River runoff area) toward the surroundings of La Guajira. Now, we further study the potential impact of a strong CCC on passive tracers from a Lagrangian standpoint. To this end, we deploy massless particles at the 15th day of each month of year 2007 and advect them for a total time of 90 days. More than 6,000 passive particles are initially launched inside the yellow box in the Panama-Colombia Gyre at a model depth of 90 m, near the depth at which the strongest CCC has been found by Andrade and Barton (2000) (Figure 13, top-left panel). Green solid lines in Figure 13 depict the trajectories of those particles able that cross the black box around La Guajira during the 90 days of simulation, being the initial and the final positions indicated by blue and red dots, respectively. As seen, the number of particles that approach the surroundings of La Guajira varies from month to month, being significantly larger for particles deployed in April and May (N = 107 and N = 125 particles, respectively), as well as for those deployed in October (N = 209 particles), than during the rest of the year (N ≤ 12 particles for other months). This result is in good agreement with the strengthening of the eastward CCC found with ADCP measurements which, as earlier discussed, peaks during May (Figure 5, dark blue color) and during November (not shown) because of the weakening of the Caribbean Low-Level Jet, as it has been previously shown with the SOM analysis.
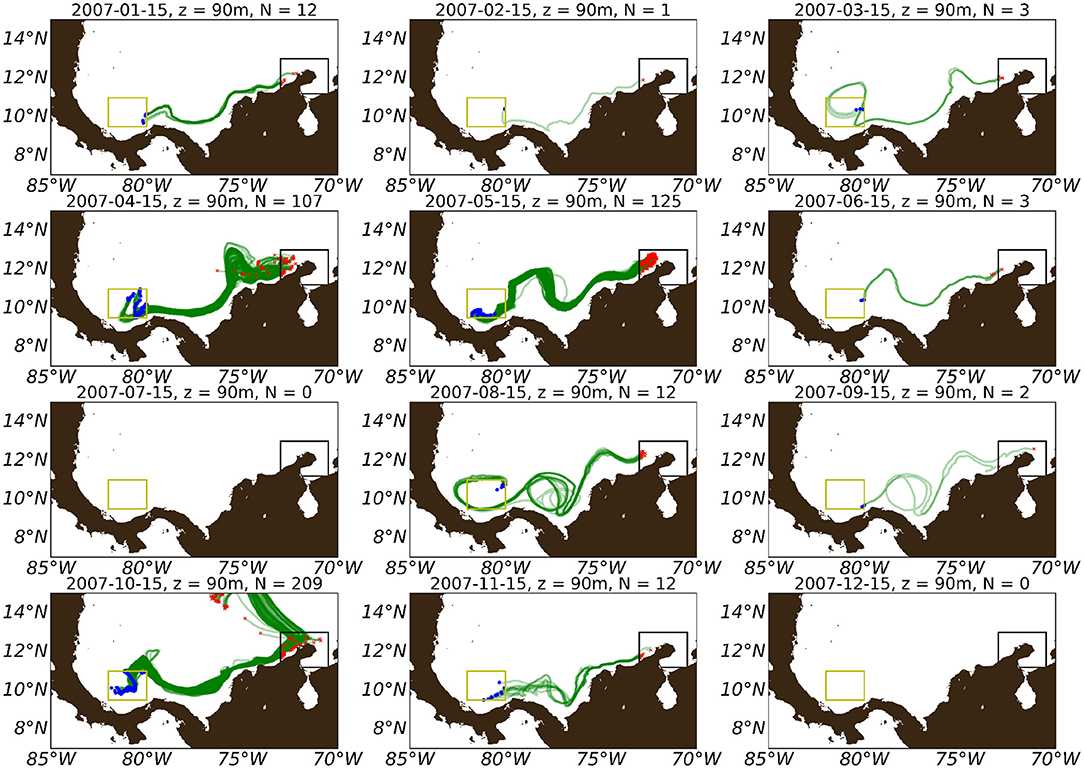
Figure 13. Lagrangian trajectories of particles launched in the yellow box (>6, 000 particles), within the Panama-Colombia Gyre. Pathways are computed forward in time during 90 days. Initial (final) positions of advected particles are denoted by blue (red) dots, respectively. Particles are deployed at the 15th day of each month during year 2007 inside the yellow box at the same positions. Only those that cross at anytime the black box around La Guajira are depicted. Tracking is performed over HYCOM horizontal current velocities at a depth of 90 m.
5. Conclusions
The variability of La Guajira upwelling system is strongly influenced by the ocean mesoscale activity (mainly in the form of filaments), and by the atmospheric Caribbean Low-Level Jet (CLLJ). When the CLLJ blows parallel to the coastline induces an offshore-integrated Ekman transport, thus favoring the upwelling of relatively high nutrient-rich waters in an oligotrophic sea. Surface values of Chlorophyll-a (Chl-a) can reach concentrations of 3 mg·m−3 in the wide and shallow continental shelf mostly during the windy season (Dec–March) in accordance with (Corredor, 1979).
As it is known from other coastal upwelling systems, coastal undercurrents may transport waters with low oxygen and high nutrient concentration. Along the trajectory of such undercurrents, part of the nutrients can be upwelled or mixed with shallower waters. The magnitude and intensity of the upwelling depends on both the magnitude and direction of the wind that induces the vertical transport and the mixing of nutrients that occurs below the Ekman layer. The spatial average of the Eddy Kinetic Energy (< Ke >) presents a clear seasonal signature with maximum values in la Guajira during December-January and July, and minimum during May following the variability of the CLLJ. In the case of La Guajira here analyzed, the rate of upwelling, here described in terms of Ekman transport, also presents a clear seasonality with a bimodal distribution that reach maximum values during the wet season from December to March and during the mid drought season in July. In these periods, strong winds associated with the CLLJ blow almost parallel to the coasts of Venezuela and Colombia with maximum intensity near La Guajira peninsula inducing a cross-shore transport at the Ekman layer that induces the upwelling. Although the main driver for high nutrient concentration at the surface is the seasonal variability of the trade winds, nutrients are also measured in relatively low wind conditions.
At the mooring in Santa Marta (the southernmost part of La Guajira peninsula), currents below the Ekman layer (> 60 m) indicate that the flow is mostly governed by the Caribbean Counter Current (CCC) except when intense winds reverse the flow (almost in the upper 160 m of depth), inducing the upwelling. In the northern part of La Guajira (ADCP2) currents are more intense so as the Km indicates (Figure 2c).
The CCC has a clear signature at the surface layer that extends from the Darien Gulf toward the southern part of La Guajira peninsula during the mild wind periods. The 8 m·s−1 wind contour controls the position and trajectory of the CCC covering more than 900 km in the southern Caribbean Sea during the mild wind seasons (May, June, and August to October mainly). The signature of the CCC is more evident at the depth of maximum salinity (at around 100 m), as during these months subsurface waters can reach La Guajira peninsula transporting lighter waters from the western edge of the basin. A SOM analysis for the HYCOM model data reveals that from the surface up to 90 m depth, the CCC reaches La Guajira when the wind is weaker. This current advects waters from the continental shelf that are visible through the satellite-based color images likely thanks to the high concentration of nutrients and sand particles transported from the rivers to the sea. van der Boog et al. (2019) found by combining model data and observations that most of the waters upwelled in the southern CCUS came from the subsurface CCC, which carries diluted waters. These authors hypothesize that waters seem to come from the Panama-Colombian Gyre traveling toward the east and reaching areas 4,400 km apart. The large amount of rivers are a source of nitrate, nitrite, phosphate and organic matter that are available in these upwelling systems and specifically in La Guajira due to its geographical configuration. Here we have given further evidence with observations and a realistic simulation of the key role that the Panama-Colombia Gyre plays in the advection of nutrient-rich waters toward the east and how its dynamics is modulated by the easterlies.
Next steps should be addressed to the development of submesoscale permitting numerical models in the area to extend the Lagrangian analysis for relevant specific events, and to explore the residence time and age of waters in the southern Caribbean Sea. In addition, due to the importance of the CLLJ in the control of the La Guajira upwelling variability, a combination of skillful seasonal (e.g., Krishnamurthy et al., 2019) and sub-seasonal (~2 weeks to 1–2 months, Vitart et al., 2017) forecasts of the CLLJ can help to co-develop tailored predictions and services for decision makers in the region. From a model diagnostics perspective, the SOM approach used in this study can be applied—in a similar way to that reported by Muñoz et al. (2017)—to different ocean models, and compared against reanalysis or observational data to help to analyse sources of model biases and ways to improve representation of physical processes in numerical models.
Data Availability Statement
The original contributions presented in the study are included in the article/Supplementary Material, further inquiries can be directed to the corresponding author/s.
Author Contributions
AO and CU conceived the idea of the study with the support of ÁM, JS, SG-M, and IH-C. AO developed the methodology with the support of CU, SG-M, JS, and AC-E. AO, CU, JS, and AC-E produced the results with the support of SG-M. AO, CU, and SG-M analyzed the results with the support of JS, IH-C, AC-E, and ÁM. All authors contributed to write the manuscript.
Funding
AO acknowledge financial support from Ministerio de Ciencia, Innovación y Universidad through MOCCA project (RTI2018-095441-B-C21). JS thanks the funding received from Generalitat Valenciana and the European Social Fund (ESF) under Grant APOSTD/2020/254. IH-C was supported by the Vicenç Mut grant funded by the Government of the Balearic Island and the ESF. AC-E wants to thank the University of Toulon—France for the support during his postdoctoral research. ÁM was partially supported by the NOAA grant NA18OAR4310275.
Conflict of Interest
The work here presented is part of the Ph.D. Thesis of CU.
The remaining authors declare that the research was conducted in the absence of any commercial or financial relationships that could be construed as a potential conflict of interest.
Acknowledgments
This work was supported by the General Maritime Directorate (DIMAR), with the provision of the data measured on the anchors, obtained in the agreement on 061-2007 with Petrobras Colombia Limited.
Supplementary Material
The Supplementary Material for this article can be found online at: https://www.frontiersin.org/articles/10.3389/fmars.2021.626823/full#supplementary-material
References
Amador, J. A. (2008). The Intra-Americas Sea low-level jet: overview and future research. Ann. N. Y. Acad. Sci. 1146, 153–188. doi: 10.1196/annals.1446.012
Andrade, C. A., and Barton, E. D. (2000). Eddy development and motion in the Caribbean sea. J. Geophys. Res. 105, 26191–26201. doi: 10.1029/2000JC000300
Andrade, C. A., and Barton, E. D. (2005). The guajira upwelling system. Contin. Shelf Res. 25, 1003–1022. doi: 10.1016/j.csr.2004.12.012
Andrade, C. A., Barton, E. D., and Mooers, C. N. K. (2003). Evidence for an eastward flow along the Central and South American Caribbean Coast. J. Geophys. Res. 108:3185. doi: 10.1029/2002JC001549
Atlas, R., Hoffman, R., Bloom, S., Jusem, J., and Ardizzone, J. (1996). A multiyear global surface wind velocity dataset using SSM/I wind observations. Bull. Am. Meteorol. Soc. 77, 869–882. doi: 10.1175/1520-0477(1996)077<0869:AMGSWV>2.0.CO;2
Beier, E., Bernal, G., Ruiz-Ochoa, M., and Barton, E. (2017). Freshwater exchanges and surface salinity in the Colombian basin, Caribbean sea. PLoS ONE 12:e0182116. doi: 10.1371/journal.pone.0182116
Bernal, G., Poveda, G., Andrade, C., and Roldan, P. (2006). Patrones de variabilidad de las temperaturas superficiales del mar en la costa Caribe Colombiana. Rev. Acad. Colomb. Ciencias Exactas Físicas Nat. 30, 195–208.
Bleck, R., Halliwell, G., Wallcraft, A.S, Carrol Kelly, K., and Rushing, K. (2002). HYbrid Coordinate Ocean Model Userś Manual. Available online at: http://hycom.rsmas.miami.edu
Carton, J. A., and Chao, Y. (1999). Caribbean sea eddies inferred from topex/poseidon altimetry and a 1/6 ° Atlantic ocean model simulation. J. Geophys. Res. 104, 7743–7752. doi: 10.1029/1998JC900081
Castellanos, P., Varela, R., and Muller-Karger, F. (2002). Descripción de las áreas de surgencia al sur del Mar Caribe examinadas con el sensor infrarojo AVHRR. Mem. Fund. Salle Ciencias Nat. 154, 55–76.
Chassignet, E. P., Hurlburt, H. E., Smedstad, O. M., Halliwell, G. R., Hogan, P. J., Wallcraft, A. J., et al. (2007). The hycom (hybrid coordinate ocean model) data assimilative system. J. Mar. Syst. 65, 60–83. doi: 10.1016/j.jmarsys.2005.09.016
Chavez, F. P., and Messié, M. (2009). A comparison of eastern boundary upwelling ecosystems. Prog. Oceanogr. 83, 80–96. doi: 10.1016/j.pocean.2009.07.032
Correa-Ramirez, M., Ángel Rodriguez-Santana, Ricaurte-Villota, C., and Paramo, J. (2020). The southern Caribbean upwelling system off Colombia: water masses and mixing processes. Deep Sea Res. Part I 155:103145. doi: 10.1016/j.dsr.2019.103145
Correa-Ramirez, M., Rodriguez-Santana, A., Ricaurte-Villota, C., and Paramo, J. (2019). Water masses and mixing processes in the southern Caribbean upwelling system off Colombia. Ocean Sci. Discuss. 2019, 1–26. doi: 10.5194/os-2019-17
Corredor, J. E. (1979). Phytoplankton response to low level nutrient enrichment through upwelling in the columbian Caribbean basin. Deep Sea Res. Part A Oceanogr. Res. Pap. 26, 731–741. doi: 10.1016/0198-0149(79)90010-4
Cummings, J. A. (2005). Operational multivariate ocean data assimilation. Q. J. R. Meteorol. Soc. 131, 3583–3604. doi: 10.1256/qj.05.105
Cummings, J. A., and Smedstad, O. M. (2013). Variational Data Assimilation for the Global Ocean. Berlin; Heidelberg: Springer Berlin Heidelberg. 303–343. doi: 10.1007/978-3-642-35088-7_13
Dee, D. P., Uppala, S. M., Simmons, A., Berrisford, P., Poli, P., Kobayashi, S., et al. (2011). The era-interim reanalysis: configuration and performance of the data assimilation system. Q. J. R. Meteorol. Soc. 137, 553–597. doi: 10.1002/qj.828
Delandmeter, P., and van Sebille, E. (2019). The parcels v2.0 Lagrangian framework: new field interpolation schemes. Geosci. Model Dev. 12, 3571–3584. doi: 10.5194/gmd-12-3571-2019
Enriquez, A. G., and Friehe, C. A. (1995). Effects of wind stress and wind stress curl variability on coastal upwelling. J. Phys. Oceanogr. 25, 1651–1671. doi: 10.1175/1520-0485(1995)025<1651:EOWSAW>2.0.CO;2
Fajardo, G. E. (1979). Surgencia costera en las proximidades de la península colombiana de la guajira. Boletín Científico Centro de Investigaciones Oceanográficas e Hidrográficas 7-19. doi: 10.26640/01200542.2.7_19
Fennel, W., and Lass, H. U. (2007). On the impact of wind curls on coastal currents. J. Mar. Syst. 68, 128–142. doi: 10.1016/j.jmarsys.2006.11.004
Hernández-Carrasco, I., and Orfila, A. (2018). The role of an intense front on the connectivity of the western Mediterranean sea: the Cartagena-Tenes front. J. Geophys. Res. 123, 4398–4422. doi: 10.1029/2017JC013613
Hernández-Carrasco, I., Solabarrieta, L., Rubio, A., Esnaola, G., Reyes, E., and Orfila, A. (2018). Impact of HF radar current gap-filling methodologies on the lagrangian assessment of coastal dynamics. Ocean Sci. 14, 827–847. doi: 10.5194/os-14-827-2018
Hidalgo, H. G., Durán-Quesada, A. M., Amador, J. A., and Alfaro, E. J. (2015). The Caribbean low-level jet, the inter-tropical convergence zone and precipitation patterns in the intra-Americas sea: a proposed dynamical mechanism. Geogr. Ann. Ser. A Phys. Geogr. 97, 41–59. doi: 10.1111/geoa.12085
Hoffman, R., Leidner, S., Henderson, J., Atlas, R., Ardizzone, J., and Bloom, S. (2003). A two-dimensional variational analysis method for NSCAT ambiguity removal: methodology, sensitivity, and tuning. J. Atmos. Ocean. Technol. 20, 585–605. doi: 10.1175/1520-0426(2003)20<585:ATDVAM>2.0.CO;2
Huhn, K., Paul, A., and Seyferth, M. (2007). Modeling sediment transport patterns during an upwelling event. J. Geophys. Res. 112:C10003. doi: 10.1029/2005JC003107
Jouanno, J., and Sheinbaum, J. (2012). Seasonal and interannual modulation of the eddy kinetic energy in the Caribbean Sea. J. Phys. Oceanogr. 42, 2041–2055. doi: 10.1175/JPO-D-12-048.1
Jouanno, J., Sheinbaum, J., Barnier, B., Molines, J.-M., Debreu, L., and Lemarié, F. (2009). The mesoscale variability in the Caribbean Sea. Part II: energy sources. Ocean Model. 26, 226–239. doi: 10.1016/j.ocemod.2008.10.006
Kohonen, T. (1982). Self-organized formation of topologically correct feature maps. Biol. Cybern. 43, 59–69. doi: 10.1007/BF00337288
Lakshmi Krishnamurthy, Á. G., Muñoz, G. A., Vecchi, R. M., Wittenberg, A. T., Stern, B., Gudgel, R., et al. (2019). Assessment of summer rainfall forecast skill in the Intra-Americas in GFDL high and low-resolution models. Clim. Dyn. 52, 1965–1982. doi: 10.1007/s00382-018-4234-z
Lange, M., and van Sebille, E. (2017). Parcels v0.9: prototyping a lagrangian ocean analysis framework for the petascale age. Geosci. Model Dev. 10, 4175–4186. doi: 10.5194/gmd-10-4175-2017
Liu, Y., Weisberg, R. H., and Mooers, C. N. K. (2006). Performance evaluation of the self-organizing map for feature extraction. J. Geophys. Res. 111:C05018. doi: 10.1029/2005JC003117
Liu, Y., Weisberg, R. H., Vignudelli, S., and Mitchum, G. T. (2016). Patterns of the loop current system and regions of sea surface height variability in the eastern Gulf of Mexico revealed by the self-organizing maps. J. Geophys. Res. 121, 2347–2366. doi: 10.1002/2015JC011493
Lonin, S. A., Hernández, J. L., and Palacios, D. M. (2010). Atmospheric events disrupting coastal upwelling in the southwestern Caribbean. J. Geophys. Res. 115:C06030. doi: 10.1029/2008JC005100
Montoya-Sánchez, R., Devis-Morales, A., Bernal, G., and Poveda, G. (2018a). Seasonal and interannual variability of the mixed layer heat budget in the Caribbean Sea. J. Mar. Syst. 187, 111–127. doi: 10.1016/j.jmarsys.2018.07.003
Montoya-Sánchez, R., Devis-Morales, A., Bernal, G., and Poveda, G. (2018b). Seasonal and intraseasonal variability of active and quiescent upwelling events in the Guajira system, southern Caribbean Sea. Contin. Shelf Res. 171, 97–112. doi: 10.1016/j.csr.2018.10.006
Mu noz, Á. G., Yang, X., Vecchi, G. A., Robertson, A. W., and Cooke, W. F. (2017). A weather-type-based cross-time-scale diagnostic framework for coupled circulation models. J. Clim. 30, 8951–8972. doi: 10.1175/JCLI-D-17-0115.1
Munoz, E., Busalacchi, A. J., Nigam, S., and Ruiz-Barradas, A. (2008). Winter and summer structure of the Caribbean low-level jet. J. Clim. 21, 1260–1276. doi: 10.1175/2007JCLI1855.1
Orejarena-Rondón, A. F., Sayol, J. M., Marcos, M., Otero, L., Restrepo, J. C., Hernández-Carrasco, I., et al. (2019). Coastal impacts driven by sea-level rise in Cartagena de Indias. Front. Mar. Sci. 6:614. doi: 10.3389/fmars.2019.00614
Pailler, K., Bourlès, B., and Gouriou, Y. (1999). The barrier layer in the western tropical Atlantic Ocean. Geophys. Res. Lett. 26, 2069–2072. doi: 10.1029/1999GL900492
Paramo, J., Correa, M., and Nu nez, S. (2011). Evidencias de desacople fisico-biologico en el sistema de surgencia en la guajira, caribe colombiano. Rev. Biol. Mar. Oceanogr. 46, 421–430. doi: 10.4067/S0718-19572011000300011
Pope, S. B. (2001). Turbulent flows. Meas. Sci. Technol. 12, 2020–2021. doi: 10.1088/0957-0233/12/11/705
Rhein, M., Kirchner, K., Mertens, C., Steinfeldt, R., Walter, M., and Fleischmann-Wischnath, U. (2005). Transport of south Atlantic water through the passages south of Guadeloupe and across 16° n, 2000–2004. Deep Sea Res. Part I Oceanogr. Res. Pap. 52, 2234–2249. doi: 10.1016/j.dsr.2005.08.003
Richardson, P. L. (2005). Caribbean current and eddies as observed by surface drifters. Deep-Sea Res. II 52, 429–463. doi: 10.1016/j.dsr2.2004.11.001
Rueda-Roa Digna, T., Ezer, T., and Muller-Karger, F. E. (2018). Description and mechanisms of the mid-year upwelling in the southern Caribbean Sea from remote sensing and local data. J. Mar. Sci. Eng. 6:2. doi: 10.3390/jmse6020036
Rueda-Roa, D. T., and Muller-Karger, F. E. (2013). The southern Caribbean upwelling system: sea surface temperature, wind forcing and chlorophyll concentration patterns. Deep Sea Res. Part I Oceanogr. Res. Pap. 78, 102–114. doi: 10.1016/j.dsr.2013.04.008
Rykaczewski, R. R., and Checkley, D. M. (2008). Influence of ocean winds on the pelagic ecosystem in upwelling regions. Proc. Natl. Acad. Sci. U.S.A. 105, 1965–1970. doi: 10.1073/pnas.0711777105
Santos, F., Gómez-Gesteira, M., Varela, R., Ruiz-Ochoa, M., and Días, J. M. (2016). Influence of upwelling on SST trends in la Guajira system. J. Geophys. Res. 121, 2469–2480. doi: 10.1002/2015JC011420
Schott, F. A., Fischer, J., and Stramma, L. (1998). Transports and pathways of the upper-layer circulation in the western tropical Atlantic. J. Phys. Oceanogr. 28, 1904–1928. doi: 10.1175/1520-0485(1998)028<1904:TAPOTU>2.0.CO;2
Sheinbaum Pardo, J., Zavala Hidalgo, J., and Candela Pérez, J. (1997). “Modelación numérica del Golfo de México y Mar Caribe,” in Contribuciones a la Oceanografía Física en México, ed M. F. Lavín (Monografía), 243–264.
van der Boog, C. G., Pietrzak, J. D., Dijkstra, H. A., Brüggemann, N., van Westen, R. M., James, R. K., et al. (2019). The impact of upwelling on the intensification of anticyclonic ocean eddies in the Caribbean Sea. Ocean Sci. 15, 1419–1437. doi: 10.5194/os-15-1419-2019
Vesanto, J., Himberg, J., Alhoniemi, E., Parhankangas, J., et al. (1999). “Self-organizing map in matlab: the SOM toolbox,” in Proceedings of the Matlab DSP Conference, Vol. 99 (Espoo), 16–17.
Vitart, F., Ardilouze, C., Bonet, A., Brookshaw, A., Chen, M., Codorean, C., et al. (2017). The subseasonal to seasonal (S2S) prediction project database. Bull. Am. Meteorol. Soc. 98, 163–173. doi: 10.1175/BAMS-D-16-0017.1
Wang, C. (2007). Variability of the Caribbean low-level jet and its relations to climate. Clim. Dyn. 29, 411–422. doi: 10.1007/s00382-007-0243-z
Wentz, F. J. (2013). SSM/I Version-7 Calibration Report. Remote Sensing Systems Tech. Rep, 11012, 1613–1627.
Keywords: Panama-Colombia gyre, La Guajira upwelling system, Caribbean Sea, Caribbean counter current, Lagrangian pathways, self-organizing maps
Citation: Orfila A, Urbano-Latorre CP, Sayol JM, Gonzalez-Montes S, Caceres-Euse A, Hernández-Carrasco I and Muñoz ÁG (2021) On the Impact of the Caribbean Counter Current in the Guajira Upwelling System. Front. Mar. Sci. 8:626823. doi: 10.3389/fmars.2021.626823
Received: 06 November 2020; Accepted: 02 February 2021;
Published: 19 February 2021.
Edited by:
Katrin Schroeder, Institute of Marine Science (CNR), ItalyReviewed by:
Xavier Carton, Université de Bretagne Occidentale, FranceDebora Bellafiore, Institute of Marine Science (CNR), Italy
Copyright © 2021 Orfila, Urbano-Latorre, Sayol, Gonzalez-Montes, Caceres-Euse, Hernández-Carrasco and Muñoz. This is an open-access article distributed under the terms of the Creative Commons Attribution License (CC BY). The use, distribution or reproduction in other forums is permitted, provided the original author(s) and the copyright owner(s) are credited and that the original publication in this journal is cited, in accordance with accepted academic practice. No use, distribution or reproduction is permitted which does not comply with these terms.
*Correspondence: Alejandro Orfila, YW9yZmlsYUBpbWVkZWEudWliLWNzaWMuZXM=; Claudia P. Urbano-Latorre, Y3VyYmFub0BkaW1hci5taWwuY28=