 Javier Almunia
 Patricia Delponti
 Fernando Rosa
- 1Loro Parque Fundación, Puerto de la Cruz, Spain
- 2Aula de Comunicación, Departamento de Ciencias de la Comunicación y Trabajo Social, Facultad de Ciencias Sociales y de la Comunicación, Universidad de La Laguna, La Laguna, Spain
- 3Laboratorio de Bioacústica Física y multi Sensores Distribuidos, Departamento de Ingeniería Industrial, Universidad de La Laguna, La Laguna, Spain
The growing concerns about the negative effects caused by whale watching on wild cetacean populations are evincing the need to measure whale watching effort more precisely. The current alternatives do not provide sufficient information or imply time-consuming and staff-intensive tasks that limit their effectiveness to establish the maximum carrying capacity for this tourist activity. A methodology based on big data analysis, using Automatic Identification System (AIS) messages can provide valuable vessel activity information, which is necessary to estimate whale watching effort in areas with cetacean populations. We used AIS data to automatically detect whale watching operations and quantify whale watching effort with high spatial and temporal resolution in the Canary Islands off the west African coast. The results obtained in this study are very encouraging, proving that the methodology can estimate seasonal and annual trends in the whale watching effort. The methodology has also proved to be effective in providing detailed spatial information about the whale watching effort, which makes an interesting tool to manage spatial regulations and enforce exclusion zones. The widespread use of AIS devices in maritime navigation provides an enormous potential to easily extend this methodology to other regions worldwide. Any public strategy aimed at the sustainable use of marine resources should enhance the use of this kind of information technologies, collecting and archiving detailed information on the activity of all the vessels, especially in marine protected areas.
1. Introduction
There is an increasing number of people who are demanding whale watching boat trips worldwide, fueling a fast-growing industry that already accounted for 3,300 operators by the end of the previous decade (O'Connor et al., 2009). As this activity is not based on lethal or consumptive use of the cetaceans, whale watching has been often labeled as “green,” “eco-friendly,” or “sustainable” tourism (Schuler et al., 2019); however, early in this century, the first evidence about short-term behavioral changes provoked by vessel density appeared (Allen and Read, 2000) and since then many authors have reported negative impacts of whale watching activities in different cetacean species (Erbe, 2002; Constantine et al., 2004; Schaffar et al., 2009; Christiansen et al., 2014). These short-term behavioral changes included the following: surfacing/diving, agonistic behavior, antipredator behavior, acoustic, group size or cohesion, swimming speed, swimming direction, altered feeding or resting, and altered respiratory frequency [refer to Parsons (2012) for a complete review]. Shortly, after the first evidence of the long-term negative impacts produced by whale watching appeared in one of the best-studied dolphin populations (Bejder et al., 2006), confirming the concern of the International Whaling Commission (IWC), which in 1997 created a working group to monitor whale-watching sustainability (International Whaling Commision, 2004). In that sense, whale watching, such as most other human activities, can be considered an evolutionary selection force, which alters the life of the targeted population (Lusseau et al., 2006). The fact that cetacean (whale, dolphin, and porpoise) watching is the greatest business reliant upon cetaceans worldwide (Parsons, 2012), targeting at least 56 (including endangered and threatened) species in all oceans so far (Bejder et al., 2006), urges sustainable ways to be found to perform these activities.
To accomplish this goal, it is essential to determine the carrying capacity, or maximum whale watching effort, that any cetacean population can bear in the least impacting way. The need to evaluate carrying capacity in whale watching activities has been identified early on in the scientific literature (Curtin, 2003; Higham et al., 2008; Andreu et al., 2009) but the intensity or effort of the activity has been rarely considered as a factor in the impact studies. Traditionally, the whale watching effort has been assumed to be proportional to the number of vessels operating in a certain area. But this is a deficient measurement, as it does not consider the different activity budgets of each vessel, its physical characteristics, or the seasonal and geographical variations in the whale watching events. More recently, some studies have used land-based visual observations (with binoculars or theodolite) and also acoustic data in order to measure whale watching intensity, determining the concurrent number of vessels, or the total time spent in the proximity of the animals (Pirotta et al., 2015; Schuler et al., 2019). This methodology is much more precise and appropriate to establish the effect of different whale watching intensities on the short-term behavioral disturbances produced in the cetaceans. But, it is also geographically limited, enormously time-consuming and staff intensive, which makes its application in regional monitoring programs quite unrealistic. Similarly, the need to obtain precise effort measures will be necessary to feed the mathematical models proposed to address the long-term sustainability of tourist interactions with cetaceans (Higham et al., 2008; Lusseau et al., 2009; New et al., 2020), as the quality of the model projections will heavily depend on the amount and quality of the whale watching effort data available.
The Canary Islands (Figure 1) are one of the top whale-watching destinations worldwide. In 1998 Spain, was considered among the three countries that could claim to have taken over one million people whale watching in 1 year (O'Connor et al., 2009), mainly thanks to the visitors registered in the Canaries. Ten years later, despite a visitor reduction due to regulatory measures and weather issues, the Canary Islands were considered the fourth whale watching destination worldwide with 611,500 whale watchers per year (O'Connor et al., 2009). Whale watching in the Canaries is strongly focused on Tenerife Island, which accounts for an estimated 85% of total whale watchers (O'Connor et al., 2009) (and 76 licensed vessels), around a resident population of some 350–450 short-finned pilot whales (Globicephala macrorhynchus), which, along with transient visitors, can be found off the south-west coast of Tenerife (Canary Islands) (Servidio et al., 2019), mainly in water depths from 800 to 2,000 m (Heimlich-Boran and Heimlich-Boran, 1990; Aguilar Soto et al., 2008). The short-finned pilot whales (classified as least concern in the IUCN's red list of endangered species) is the most frequently seen species in the Canary Islands, and it was found during every day survey conducted off Tenerife in a recent study, becoming the main target species for the whale watching vessels off the island (Servidio et al., 2019). The short-finned pilot whale is listed as vulnerable in the Spanish and Canarian catalogues of endangered species, and the marine area off south-west Tenerife has been designated by the European Union as a Site of Community Importance (SCI) and included in the Natura 2000 network (European Council, 1992). Gran Canaria accounts for a smaller percentage of whale watchers, and consequently a smaller number of licensed vessels (15). The ample island platform which extends off south Gran Canaria favors the presence of other cetacean species and, as a result, the sightings of short-finned pilot whales by whale watching vessels are rare (Javier Zaera Comm. pers.). The fact that the Canary Islands is one of the leading whale watching destinations worldwide, and the concentration of this activity is in a well-defined resident species, constitutes an ideal laboratory to study whale watching efforts.
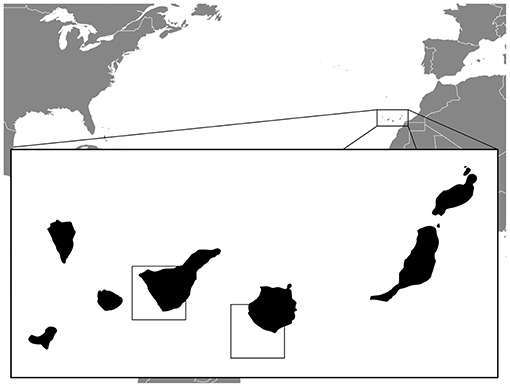
Figure 1. Canary Islands and study sites off south Tenerife and Gran Canaria (squares).
The (AIS) is a location reporting system based on automatic radio messages that were developed for collision avoidance. The AIS transponder automatically broadcasts messages containing information of name, position, course, speed, etc., of the vessel at regular intervals which can be received by AIS stations in the area (Lapinski and Isenor, 2011). The International Maritime Organization mandates the use of AIS in vessels larger than 300 gross tonnes that travel internationally, cargo ships of 500 gross tonnage or more sailing in local waters, and all passenger ships irrespective of size (International Maritime Organization (IMO), 1974). The system was originally designed to extend the radar coverage and vessel traffic services (VTS), but it can be easily used to obtain information about marine traffic in a region. AIS provides basic information with position updates at sample rates varying from 3 s to 3 min dependent on the manoeuvre situation of an individual vessel (Aarsæther and Moan, 2009), but it is not limited to that, and is continuously updated to provide further aids to navigation (Balduzzi et al., 2014). Apart from its original goal, the enormous quantity of AIS data available has proved to be a valuable source of information on human use of marine areas. As a consequence, it has been used for different purposes: from monitoring fishing activity and protected area regulation compliance (Natale et al., 2015; de Souza et al., 2016; Rowlands et al., 2019), or evaluating cetacean-vessel collision risks (Greig et al., 2020; Redfern et al., 2020) to specific risk evaluation associated with different kinds of vessels (McWhinnie et al., 2021). Also, recently two projects, MARCET and WAVES have been explored for its potential to evaluate whale watching effort (Canessa, 2019; Universidad de las Palmas de Gran Canaria, 2020). This study aims to evaluate the potential use of AIS data, combined with an open-source digital terrain model (DTM) to measure automatically the whale watching effort in a specific region.
2. Methodology
2.1. AIS Data
Two specific geographical areas were selected to characterize the whale watching activities off southern Tenerife Island (27.9–28.4°N; 16.5–17.0°W) and off southern Gran Canaria Island (27.5–28.0°N; 15.5–16.0°W). The vessels included in this study were selected searching, at the MarineTrafficTM database, for the names of the ships authorized by the Canary Islands Government to perform whale watching activities in the region. The Maritime Mobile Service Identity (MMSI) numbers of all the authorized ships that were equipped with an AIS transponder, and consequently appeared in the MarineTrafficTM database searches, were included in the study. The search resulted in a total of 23 vessels (out of 120 authorized for whale watching activities in the region) that produced AIS messages between 2016 and 2020.
AIS data were collected by Exmile Solutions Ltd. (proprietary of MarineTrafficTM, London, UK) in the calendar years from 2016 to 2019, and part of 2020, and received either from terrestrial stations or satellite. To ensure effective management of the incoming information in the database, MarineTrafficTM uses proprietary down-sampling techniques not to archive consecutive positions within minutes. This results in a maximum resolution of 1 min for the archived data. All the available archived AIS messages, received from vessels selected for the study, were obtained from the database MarineTrafficTM. The available messages were previously filtered by timestamp between “2016-01-01 00:00” and “2020-03-14 00:00,” and further filtered to select just the operational hours of the whale watching vessels (between 09:30 a.m. and 17:30 p.m.).
2.2. EMODnet DTM
As the original AIS messages do not include information about the depth of the location of the vessel, it was extracted from a DTM. The“EMODnet Digital Bathymetry (DTM)” is a multilayer bathymetric product for sea basins of Europe. The DTM is based upon more than 7,700 bathymetric survey data sets and composite DTMs that have been gathered from 27 data providers from 18 European countries and involving 169 data originators (Consortium, 2016; Thierry et al., 2019). The data grid available for the Canary Islands region had a resolution of 7.5 X 7.5 arcseconds, and was obtained through the common data index (CDI).
2.3. Data Processing
The data were processed using scripts written by the authors utilizing the programming language Python (Van Rossum and Drake, 2009) running in Anaconda Spyder. A preliminary data quality control was performed removing all the positions out of the geographical range of the study. The depth associated with each AIS message was calculated by obtaining the value associated with the DTM grid cell corresponding to the longitude and latitude of the vessel position according to the AIS. As the goal of this study was to characterize whale watching events, all the messages that were broadcasted from positions shallower than 100 m were filtered to eliminate those messages originating from harbors, moorings, proximity to fish farms, and coastal navigation.
A first analysis of the data was aimed to identify the messages that could be produced while the vessels were on a whale sighting, taking into consideration that the ship speed should be reduced to follow the whales during the whale watching event (less than 4 knots according to the local regulations) (Gobierno de Canarias, 2000), and that the species most frequently sighted in the study areas are commonly distributed in water depths from 800 to 2,000 m (Heimlich-Boran, 1993). A density plot of the AIS messages (Figure 2) was produced to evaluate the frequency of messages related to depth and boat speed, and frequency distribution of the AIS messages by depth was calculated for both study areas (Figure 3). The geographical distribution of the AIS messages in both study areas was plotted (Figures 4, 5), and density maps were produced for the locations where the messages indicated that the speed of the vessel was under 2.5 knots and depth more than 100 m, using Seaborn (Waskom et al., 2017). As the main goal of this study was to prove the potential use of AIS to identify whale-watching operations, and due to the low number of data from vessels operating off Gran Canaria, the remaining of the analysis focused only on the data obtained from the vessels operating off Tenerife.
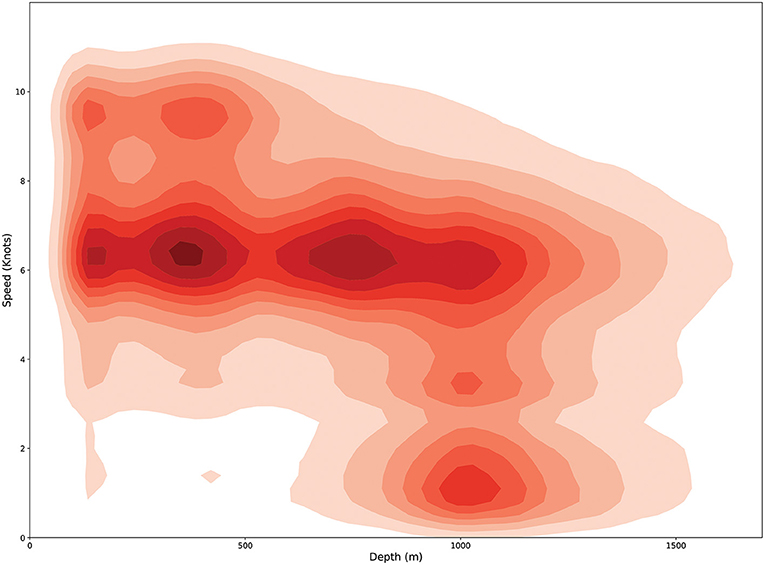
Figure 2. Density plot of the Automatic Identification System (AIS) messages in the data set by speed (knots) and depth (meters).
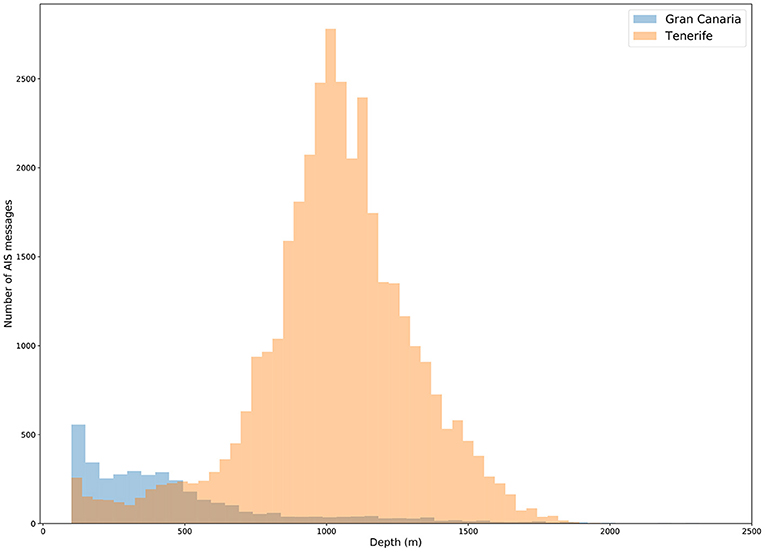
Figure 3. Frequency distribution of the AIS messages broadcasted at different depths in the study areas (Blue tiles Gran Canaria and red tiles Tenerife). All the messages that were broadcasted from positions shallower than 100 m were filtered.
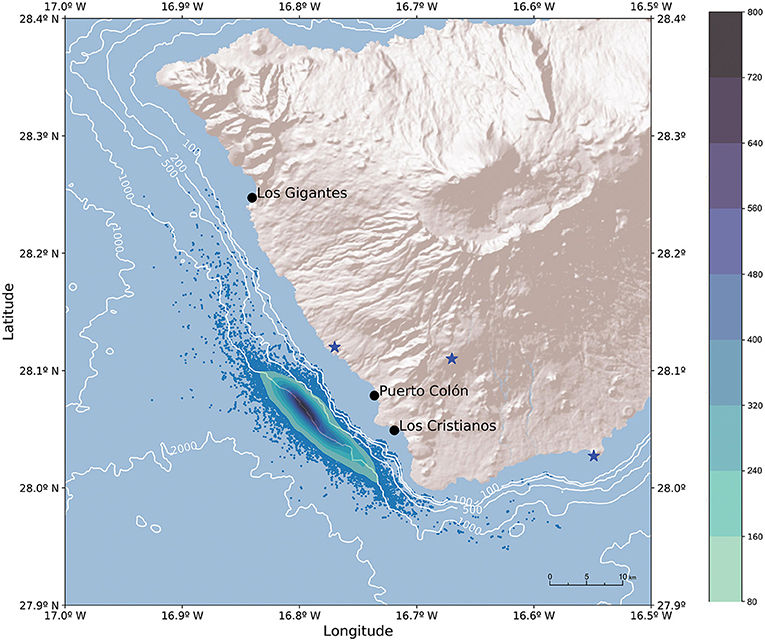
Figure 4. AIS messages broadcasted from potential whale watching events (blue dots) and density map of the potential whale watching events off Tenerife Island. Location of the main harbors (black dots) and the AIS terrestrial stations (blue stars) in the region.White lines represent isobaths in meters.
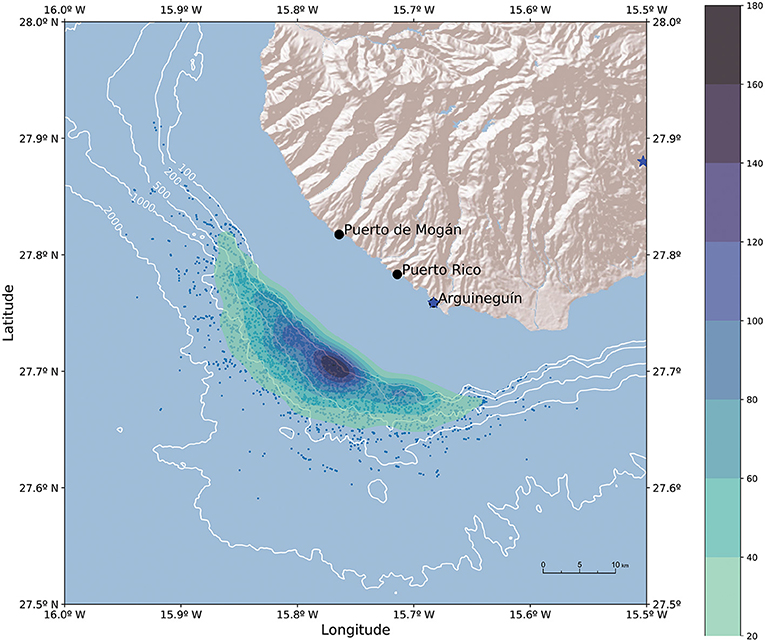
Figure 5. AIS messages broadcasted from potential whale watching events (blue dots) and density map of the potential whale watching events off Gran Canaria Island. Location of the main harbors (black dots) and the AIS terrestrial stations (blue stars) in the region. White lines represent isobaths in meters.
To infer the duration of the whale watching events from the AIS messages, the common behavior observed on the tourist boats visiting the resident population of pilot whales off Tenerife was used as a model. The vessels head to the areas where the whales are frequently resting (with a characteristic depth of 800–2,000) at medium-high speed, reducing speed to approach the animals, and head back to the coast at medium-high speed again after a 20–30 min observation (personal observation). This whale watching pattern is the most frequent off Tenerife Island, despite that it can vary when resident bottle-nose dolphins are found on the way to observe the pilot whales, or other transient whale or dolphin species are present in the area. A Python script was created to detect sequences in the AIS messages that could fit this simple model of pilot whale observation. A data sequence was defined to start when the speed of the boat was under 2.5 knots in areas deeper than 100 m. The sequence was subsequently ended when the boat reached a speed over 5 knots regardless of the depth, assuming that it had left the whales, and was cruising again. These criteria were planned to include, in the same sequence, several short-term ship movements intended to approach separated animals within the same group or to re-position the vessel while the pod was moving. The difference between the timestamp of the first and last messages of the sequence was used to calculate the event duration. The mean depth of the whale watching events was calculated as the mean of the estimated depth in each of the messages of a sequence.
Based on the inference of the duration for each whale watching event, it is possible to estimate the integrated monthly duration of whale watching performed by the vessels included in the study. The integrated monthly duration of the whale watching activities was calculated as the sum of the individual duration of each sequence identified within a month, and it was normalized dividing by the mean active vessels. To exclude the ships stranded for maintenance operations, operating seasonally or out of business, any vessel that did at least one whale watching event per week was considered active and to calculate indexes over the study period, active vessels were averaged monthly (mean active vessels) and every year (yearly average active vessel). The normalized duration of whale watching activities is an estimation of the time that the whale watching vessels were in the proximity of whales and, as a consequence, it could be used as an indication of whale watching effort.
Finally, to find out if the methodology could be useful to elucidate some long-term behavioral effects in the whales, such as signs of avoidance of the whale watching vessels, the AIS information was analyzed to evaluate any spatial trend in the location of the whale watching events. As the distance of the whale watching events to shore could be more biased by the low number of boats (and the fact that, usually, they share the daily positions by radio or simply head to the closest whale watching boats slowly sailing in the area) than the mean water depth at the whale watching events, and the geographical positions, these latter were used instead. The daily mean depth, latitude, and longitude of the whale watching events were calculated, and time series were constructed to analyze temporal, directional or stationary aspects of the data. The augmented Dickey Fuller test (ADFT) (Cheung and Lai, 1995) was used to evaluate stationarity of the time series, and the Durbin-Watson test (White, 1992) was used to detect the presence of auto-correlation. Finally, the auto correlation function (ACF) plot was used to reveal how the correlation between any two depth values changed as the time lag increased (Seabold and Perktold, 2010).
3. Results
The original AIS data received had 729,951 messages (10,558 of them from satellite and the rest from terrestrial stations). The data were not evenly distributed over the years (Table 1), but showed an increasing trend related to the growing number of active vessels equipped with AIS transponders in the region: 2016 (72,751), 2017 (135,158), 2018 (217,457), 2019 (261,619), and 2020 (42,966 just in two and a half months). After the 100 m depth filter was applied, 265,909 (36%) AIS messages remained for subsequent analyses.
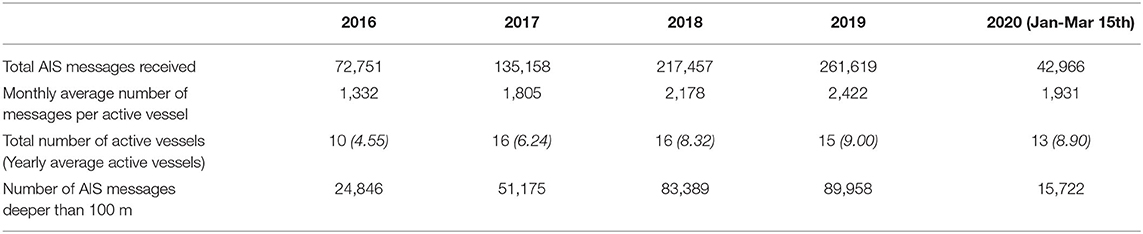
Table 1. Automatic identification system (AIS) messages and yearly average active vessels equipped with AIS transponder off Tenerife Island during the study.
A density plot of the AIS messages in the data set by speed and depth (Figure 2) showed a particular region between 700 and 1,500 m in depth where the vessel speed was consistently under 2.5 knots. This can be considered as an indication of whale watching operations, especially because the figure also illustrates how the vessels typically cruise at 6 knots regardless of the depth. It is also noticeable that AIS messages with speeds lower than 2.5 knots were almost absent in shallower waters, except for two small spots (around 200 and 450 m in depth) that can be seen in the figure.
The histogram of the AIS messages emitted at speeds lower than 2.5 knots (Figure 3) shows a clear peak around 800–1,200 m in depth for the messages from the region off Tenerife Island, while messages emitted off Gran Canaria Island were more frequent in shallower waters. This supports the idea that the AIS messages from the boats operating in Tenerife were emitted while the vessels were performing whale watching operations, as this depth range matches the one described for the most common species in the region (Heimlich-Boran, 1993). Furthermore, the whale-watching operations in Gran Canaria target a broader range of species, as reported by the captains (Javier Zaera pers. comm.).
The geographical distribution (Figure 4) for the whale watching events off south-western Tenerife (blue dots) show a narrow area (approx. 10 km wide) that extends over 50 km along the island slope. This area resembles the published distribution maps of the most frequently seen whale species in south-west Tenerife determined by dedicated surveys (Carrillo et al., 2010). On the other hand, the density map of the whale watching distribution off the south-west coast of Gran Canaria (Figure 5) shows a shallower distribution of the potential whale watching events which is consistent with the fact that whale watching operations off Gran Canaria are focused on multiple species. In both cases, the density maps indicate that whale watching events are more frequent (dark blue in the density map) in a very small space (approximately 1 km2) compared with the total area where the whales were present.
The analysis of the AIS messages broadcasted off Tenerife Island identified a total of 8,745 sequences matching the model proposed for potential whale watching events, with a duration ranging from 1.3 to 95 min. The frequency distribution of the event duration (Figure 6) illustrates that the vast majority of events lasted less than 30 min, with few of them going over 40 min. This distribution is consistent with the fact that most of the whale watching excursions in south-west Tenerife last for 2 h and the time devoted to watching the whales used to be around 20 min (Pers. obs.) and falls within the maximum time allowance of 30 min established in the local whale watching regulations (Gobierno de Canarias, 2000).
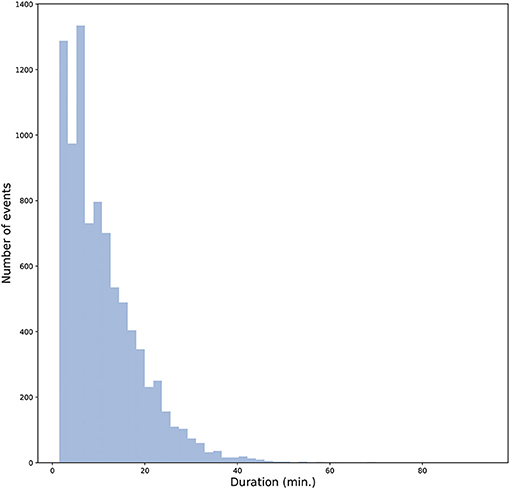
Figure 6. Frequency distribution of the estimated duration for the whale watching events.
The evolution of the integrated monthly duration of whale watching events, normalized by the mean active vessels, varies through the period covered by the study (Figure 7). The graph shows an increase in the whale watching activity in the first half of the study period and also clear seasonal variations with maximum values in summer and minimum in winter. The number of operational whale watching vessels also increased, especially during the first half of the study, but remained fairly constant during its second half (when on average it was a maximum of 9 yearly average active vessels off southwest Tenerife Island, out of 23 equipped with AIS transponders). Consequently, the method seems to be able to detect variations in the intensity of whale watching activities, even when the yearly average active vessels in the area remains fairly constant.
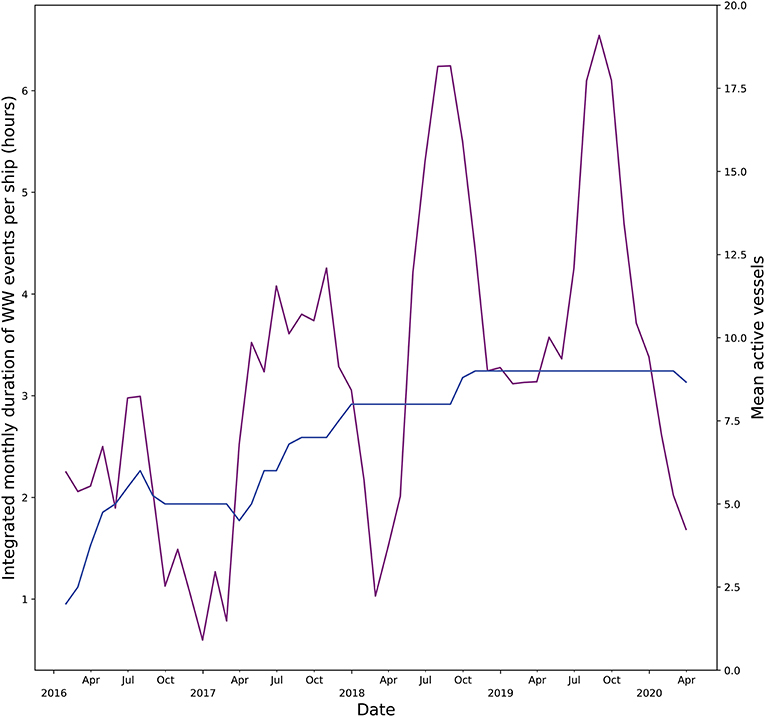
Figure 7. Total integrated monthly duration of whale watching events off south Tenerife normalized by mean active vessels (red line). Mean number of active vessels (blue line).
The ADFT (Cheung and Lai, 1995) of the daily mean depth for the whale watching events indicates that the time series is stationary (p-value = 0.007). This would suggest that the mean depth of the whale watching events in the area do not present a long-term trend. The monthly mean depth of the whale watching events (Figure 8) seems to show a seasonal trend confirmed by the Durbin-Watson (White, 1992) test (value = 0.026), and the auto-correlation function plot shows a positive auto-correlation around a 350 days lag. No other significant auto-correlation lags (lunar cycles or multi-annual trends) could be found in the auto-correlation function plot. Similarly, the longitude and latitude time series were also stationary (ADFT p-values 0.003 and 0.007, respectively) and their auto-correlation function plots did not show significant auto-correlations, suggesting that the seasonal depth change of the whale watching events were the result of very subtle or inconsistent changes in the position (refer to Supplementary Materials).
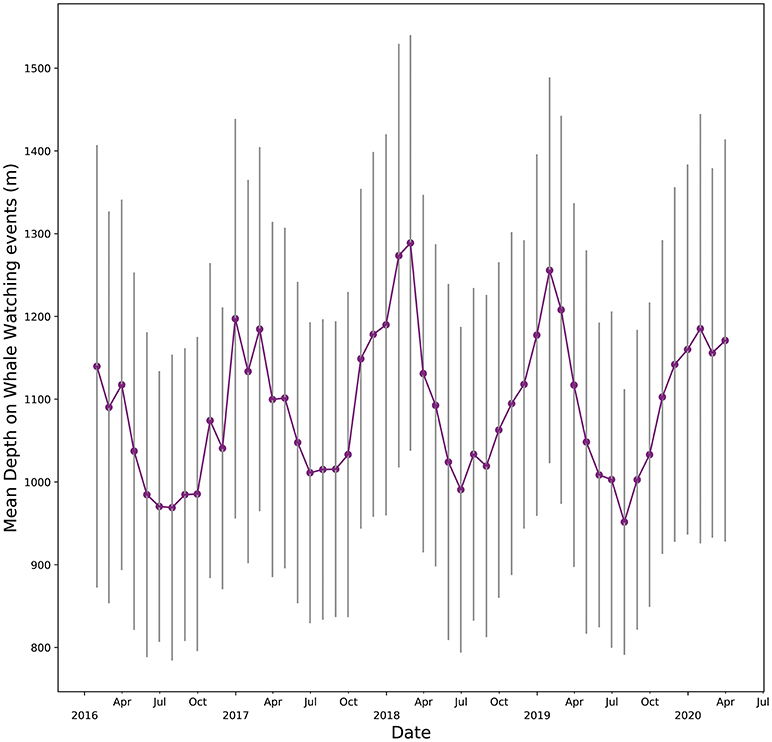
Figure 8. Mean monthly depth of the whale watching activities off south Tenerife during the study period (red line). Gray lines indicate SD.
4. Discussion
The basic model established to identify the whale watching events from the AIS information has proven to be promising, as the results seem to fit the distribution of the population (Carrillo et al., 2010; Servidio et al., 2019) and the fidelity of the species to a certain bathymetric range (Heimlich-Boran and Heimlich-Boran, 1990; Aguilar Soto et al., 2008; Carrillo et al., 2010) as described in the scientific literature for the species most frequently seen in the area, the short-finned pilot whale (Servidio et al., 2019). Notwithstanding the evidence that the criteria seem to be valid to determine the whale-watching operations with short-finned pilot whales in the Canary Islands, its effectiveness and precision should be confirmed by future studies that simultaneously collect AIS information and on board information on the whales sighted. Furthermore, the proposed basic model for short-finned pilot whales should be carefully adapted to the specific characteristics of whale watching operations focusing on different species in other regions. Precise whale watching event measurements are scarce in the scientific literature, and usually related to direct measures (theodolite) (Schaffar et al., 2009; Cecchetti et al., 2018; Schuler et al., 2019), data collected on-board (Robbins and Frost, 2009) or indirect estimations (ship noise) (Houghton et al., 2015). In most cases, the whale watching effort is estimated just by the number of licensed boats that can operate in the area, but this approach lacks information about the amount of time that the animals are perturbed by the vessels, and also the spatial distribution of this disturbance. Obtaining detailed information about whale watching events using the theodolite method implies several observation teams of at least three people each (theodolite operator, computer operator, and 1–2 spotters) (Schuler et al., 2019). In addition, the observations from land can be also influenced by adverse meteorological conditions (fog, dust, swell, etc.), and they are very difficult to perform in extensive or convoluted shores. In this situation, the proposed methodology is clearly advantageous as it could cover vast regions, the data collection could be fully automated, and requires no staff. Actually, the use of big data widens the reach of research possibilities in the information society. In this sense, the importance of big data, as one of the disruptive technologies in the public digital landscape, has been gradually growing, as well as the number of private organizations that in recent years have begun to store and process data to meet the demand of a market that uses and analyzes the data to generate knowledge and create business (Salvador et al., 2017); however, how to deal with information management, how to store it and its accessibility in the big data era are challenges for public endeavors, which should ensure not only that data collection is available but also should ensure storage, interoperability, and accessibility. Consequently, ensuring that AIS data from whale watching and other tourist activities are open and accessible would imply a positive impact on sustainability.
The high site fidelity and bathymetric dependence of G. macrorhynchus (Heimlich-Boran and Heimlich-Boran, 1990; Aguilar Soto et al., 2008; Carrillo et al., 2010) has direct implications on the available optimum habitat for the species, and it can vary dramatically in two islands within the same archipelago. The particular bathymetry of Tenerife Island configures a small distribution area (approx. 150 km2) which supports 350–450 short finned-pilot whales (Heimlich-Boran and Heimlich-Boran, 1990; Aguilar Soto et al., 2008). The relatively small size of the distribution area also implies a higher risk of impact on the population by an oversized whale watching industry. And, at the same time, the potential high presence of animals can also impose a higher collision risk to the ships navigating in the area (Carrillo et al., 2010). On the other hand, the fine detail of whale watching activity obtained using AIS methodology, could be useful to define and enforce more precise low-speed areas to reduce collisions (Silveira et al., 2013; Greig et al., 2020), which has been identified as one of the measures to reduce the ship strikes in the region (Carrillo et al., 2010). In that sense, it is important to consider that the very nature of the whale sighting operations implies that each whale watching ship will preferably observe the animals closest to the shore for purely economic reasons. Similarly, the presence of whales in range areas far from tourist harbors could be underestimated for the very same reason. On the other hand, the recent application of AIS information to evaluate specific risks associated with the presence of vessels of different types (McWhinnie et al., 2021) gives a new perspective to this methodology as a risk assessment tool itself. The enormous amount of detailed information, not only on the presence but also on the daily activity of the whale watching boats provided by the analysis of the AIS messages, could serve as an effective management tool that would allow the managers of a protected area to analyze the cumulative effort on different groups of the population, and even intervene by redirecting the effort to other areas in certain situations.
An appropriate field of vision of the AIS stations and their continuous operation is necessary to establish a system that automatically estimates the whale watching effort, using the proposed methodology. Both study areas have a good AIS coverage, thanks to the number and position of terrestrial stations in the south of Tenerife and Gran Canaria, as proven by the low number of satellite messages in the dataset (1,4%), that were even less prevalent in the final sequences (0,3%). The implementation of a high spatial and temporal resolution methodology based on AIS should be based on terrestrial AIS stations that provide a good coverage of the whale watching areas and ensure a high rate of message reception. Since this navigation system is used worldwide to ensure the safety of life at sea (Wieslaw, 2012), it is very likely that AIS coverage is already available in many regions, where whale watching operations take place, and even historically could be available for retrospective studies; however, the fact that a good AIS coverage is needed to detect the short-time behavior of the vessels does not diminish the importance and potential of the satellite messages to analyze whale watching effort, as they allow the recovery of information from enormous areas out of reach of land-based stations.
The estimation of duration of the whale watching event based on AIS messages seems to be quite accurate, judging by the obtained distribution, which is mainly under the maximum time allowance for a sighting established by the local regulations (Gobierno de Canarias, 2000). It has to be taken into account that the highest possible precision for a whale watching-sequence using MarineTraffic™ archived data is 2 min, but this could be improved to 8 s if a dedicated reception network is used, as all the messages could be stored. This is due to the fact that AIS transducers broadcast a message every 12 s when the ship is sailing at 0–14 knots, or every 4 s if it is changing course (Aarsæther and Moan, 2009). The higher potential to detect and store messages of a dedicated reception network would also allow the detection and storage of detailed course change events, that could be useful to estimate the duration of the whale watching events more precisely but also to infer evasive behaviors on the whales (Schaffar et al., 2009; Christiansen et al., 2014). Although the estimation of the sequences uses a conservative threshold to identify the end of the sighting (speed over 5 knots), it does not seem to produce a significant number of overestimated event lengths. A much more detailed study, collecting and archiving all the available AIS messages from the terrestrial stations, and comparing duration estimated by AIS with the sighting time measured by observers on board (or with theodolite from a land-based station), would be necessary to evaluate the precision of the present method; however, even though an exact duration cannot be calculated for single events, it is reasonable to assume that the errors will cancel when the values are integrated monthly. Hence, monthly integrated values could provide a good indication of the temporal trends in the whale watching intensity.
It has been proven that behavioral disturbance in cetaceans is not only related to the presence/absence or the number of vessels in the vicinity, but also to the amount of time spent in the presence of vessels (Schuler et al., 2019). Multiple vessels simultaneously tracking a whale will accentuate this effect (Holt et al., 2009). Vessel characteristics (e.g., size and engine type) and vessel approach (e.g., angle and speed) are also likely to elicit different responses in whales (Schuler et al., 2019). Consequently, measurement and analysis of the time that the whale watching vessels spend observing cetaceans are essential to understand its long-term consequences on the populations. The integrated duration of the monthly whale watching events calculated in this study has captured the trend of the whale watching effort better than the previous estimations. The number of licensed boats alone is unable to reveal seasonal differences in the whale watching activities, while those are clearly captured using the AIS messages. The maximum intensity detected in the summer season by this study matches the peak in the activity due to the higher frequency of days with better weather conditions. On the other hand, the apparent trend observed in the whale watching effort during the study could be biased by the small number of ships in the analysis and its heterogeneous activity during the whole period. To improve the accuracy of this measure, an increase in the number of whale watching vessels equipped with an AIS transponder should be necessary.
The results also show a clear seasonal trend in the average depth where the sightings were made, which is confirmed by the impressions of some whale watching pilots, who refer to the whales tending to be closer to shore in summer, depending on weather conditions. The simple fact that the analysis of the AIS data has detected this subtle annual cycle gives an insight on the potential sensitivity of this methodology.
In addition to noise, the physical presence of boats may disrupt cetacean activity patterns, particularly when boats seek direct interactions (e.g., whale watching). In these cases, theoretical studies suggest that individuals often perceive boats as a risk, and therefore respond through avoidance and other anti-predatory tactics (Pirotta et al., 2015). Cetaceans may begin to avoid particular areas if the disturbance reaches a certain threshold or if there is little cost to abandoning that location (Wright et al., 2011). It has also been observed that marine mammals may temporarily move away during periods of heavy vessel activity but re-inhabit the same area when traffic is reduced (Bejder et al., 2006). Given the fact that the highest intensity in the whale watching activities in the Canaries happens during summer, one could expect that the whales would move far from the island (deeper waters) to avoid the vessels during this season. But, the monthly mean depth of the whale watching events suggests a clear yearly cycle, where the animals slightly approach to the coast in summer and move to deeper waters in winter. This result, and the fact that the time series is stationary, could be indicating a lack of avoidance in the long-term behavior of whales in the area. however, this observation does not exclude more subtle avoidance effects, such as the displacement of the more sensitive animals from the area of disturbance (Bejder et al., 2006). Similarly, the whale watching effort is not homogeneously distributed across the optimal habitat of the whale most frequently sighted in the area. Hence, there could also be some habitat shift over the distribution area, changing the location of the animals, but not the depth. Although this was not observed in the auto-correlation data of the whale watching positions registered in the study, subtle displacements at a constant depth could be addressed through a much more detailed analysis of the positions. Consequently, to accredit the presence or absence of avoidance effects, more comprehensive studies with individual identification of the cetaceans and their movements within the area of distribution would be necessary. If these avoidance reactions could be found, the concurrent determination of the whale watching effort using the proposed AIS methodology would allow the establishment of sustainable whale watching thresholds where avoidance does not occur.
Finally, the fine spatial resolution of whale watching effort obtained by this methodology is very promising as a component to estimate carrying capacity, not only as a tool to analyze the effects of different whale sighting intensities in future studies but also to enforce the spatial regulation of the activities in a region. The existence of guidelines, regulations, or laws in an area is no guarantee of compliance with these guidelines (Parsons, 2012); the best guidelines can become inefficient if there is a chronic lack of enforcement. The most widespread method for effort regulation is to limit the number of licences but this does not take into account the variable effort of each vessel either in time and space; neither the size nor characteristic propeller noise. The actual scientific methods to measure effort and behavioral effects, such as theodolite observations, could be useful to enforce regulations but are either expensive or time-consuming to cover big areas (Bejder et al., 2006; Schuler et al., 2019). The enforcement of exclusion (or limited effort) areas during sensitive seasons using the AIS-based methodology will be very easy to track, making the identification of any vessel breaching the regulations a fully automated process. The methodology proposed in this study would be able to distinguish automatically when a vessel is just sailing through an exclusion zone, when it is performing a whale watching activity in a prohibited or regulated area, or even send an alert when an unlicensed vessel is performing whale watching in a regulated area. The possibility to determine the position also allows the identification of evidence concurrent vessels with the same group of whales, which could also be useful for the enforcement. To achieve that all the licensed ships in the region should be equipped with an AIS transponder. On the other hand, since this methodology can be used to record whale watching operations regardless of the vessel, it could be also used to detect and identify non-authorized ships performing whale sighting. To detect these illegal whale watching operations, not only should the authorized vessels have an AIS transponder, but also all the tourist vessels operating in the area.
The fact that the vessels were not randomly chosen, and that they were not operating homogeneously during the study, does not allow generalization of the effort indices and trends found in the results of this study. In addition, the size of the sample (19% of the whale watching licensed ships in the region) and the smaller number of active ships during the study (mean active vessels between 2 and 9 in Tenerife) could be introducing some bias in the results. It is also important to consider the bias introduced due to the fact that the sample of vessels with AIS transponders will underestimate small cetacean watching vessels. On the island of Tenerife, the mean length of AIS-equipped whale watching vessels (17.63 m, SD 5) is greater than the mean of all licensed vessels (14.36 m, SD 6.4), mainly because none of the vessels less than 12 m in length were equipped with AIS (refer to Supplementary Materials). A public network of terrestrial stations would be essential to receive and archive high precision data from a large amount of vessels, as the ships sailing at 0–14 knots transmit AIS messages every 12 s, or every 4 s if they are changing course (Aarsæther and Moan, 2009). This high transmission rate, and the possibility to archive all the messages as open data, would allow more accurate calculation of the individual whale watching events that could be used for effort and carrying capacity estimation, but also to regulate enforcement. This is, especially, interesting when the whale watching activities are performed in remote or difficult to access areas (Parsons, 2012). Considering that some of the fastest growing whale-watching industries are in developing countries, and that there is still an enormous potential for considerable growth in whale-watching operations in other developing nations (Parsons, 2012), the possibility to develop an automatic system to assist the enforcement of regulations would be of great help in the future.
5. Conclusions
The proposed methodology to automatically estimate whale watching effort using AIS messages and bathymetry data from EMODNET DTM has proven to be effective off south west Tenerife, in the Canary Islands. The results obtained in this preliminary study are very encouraging, allowing the estimation of seasonal and annual trends in the total amount of exposure placed upon cetaceans by whale watching activities. The results also provide detailed geographical distribution of the whale watching effort, which when coupled with onboard observations of the presence and abundance of whale could be used to analyze subtle movements of the pods within their local distribution range.
As the proposed methodology relies heavily on the percentage of vessels equipped with AIS transponders, to achieve an optimum evaluation of the whale watching effort in a region, the competent authorities should promote its installation at least in all the ships authorized to perform whale watching activities. In addition, to detect illegal operations, any vessel capable of performing tourist activities in the area ideally should have an AIS transponder installed.
To survey effectively the whale watching area, a comprehensive study has to be performed to install enough AIS terrestrial stations to attain complete coverage and ensure the maximum reception of broadcasted messages. The system should be dimensioned by considering the number of vessels to manage the simultaneous incoming messages. Once the system is operational, some level of open data policy should be established to grant transparent access to researchers and other stakeholders.
The methodology based on AIS messages has also proved to be successful in providing detailed spatial information about the whale watching effort. This characteristic is very promising to manage spatial whale watching regulations, especially to verify the enforcement of exclusion zones and areas with limited activity.
Having enough open data sets and making them available to science will contribute to the generation of knowledge and the creation of innovative products and services that have an impact not only on social well-being, but also on sustainability. This is the challenge for the appropriate authorities, which must ensure the relevance of this open data: more quality in the diversity of data and greater reflection to facilitate correlations with each other.
Data Availability Statement
The data analyzed in this study is subject to the following licenses/restrictions: Not for commercial use. Requests to access these datasets should be directed to ZGlyQGxvcm9wYXJxdWUtZnVuZGFjaW9uLm9yZw==.
Author Contributions
JA conducted the analysis and led the project. FR conducted specific data analysis. All authors listed have made a substantial, direct and intellectual contribution to the work, and approved it for publication.
Funding
AIS data acquisition was funded by INTERREG MAC (2014-2020) project MARCET II (project code MAC2/4.6c/392).
Conflict of Interest
The authors declare that the research was conducted in the absence of any commercial or financial relationships that could be construed as a potential conflict of interest.
Publisher's Note
All claims expressed in this article are solely those of the authors and do not necessarily represent those of their affiliated organizations, or those of the publisher, the editors and the reviewers. Any product that may be evaluated in this article, or claim that may be made by its manufacturer, is not guaranteed or endorsed by the publisher.
Acknowledgments
The authors wish to thank the Interreg MAC (2014-2020) Authority for the financial support and assistance to the MARCET II Project (MAC2/4.6c/392), Javier Zaera for his comments on an early version of the manuscript and David Novillo for his assistance in gathering information from the whale watching pilots in Puerto Colón.
Supplementary Material
The Supplementary Material for this article can be found online at: https://www.frontiersin.org/articles/10.3389/fmars.2021.635568/full#supplementary-material
References
International Maritime Organization (IMO) (1974). International Convention for the Safety of Life At Sea, 1 November 1974, 1184 UNTS 3.
Aarsæther, K. G., and Moan, T. (2009). Estimating navigation patterns from AIS. J. Navigat. 62, 587–607. doi: 10.1017/S0373463309990129
Aguilar Soto, N., Johnson, M. P., Madsen, P. T., Díaz, F., Domínguez, I., Brito, A., et al. (2008). Cheetahs of the deep sea: deep foraging sprints in short-finned pilot whales off Tenerife (Canary Islands). J. Anim. Ecol. 77, 936–947. doi: 10.1111/j.1365-2656.2008.01393.x
Allen, M. C., and Read, A. J. (2000). Habitat selection of foraging bottlenose dolphins in relation to boat density near clearwater, Florida. Mar. Mamm. Sci. 16, 815–824. doi: 10.1111/j.1748-7692.2000.tb00974.x
Andreu, E., Gallego, P., and Cervera, J. (2009). Long-Finned Pilot Whale (Globicephala melas) Response to Whale-Watching Vessels in the Strait of Gibraltar. Technical report, International Whaling Commission.
Balduzzi, M., Pasta, A., and Wilhoit, K. (2014). “A security evaluation of AIS automated identification system,” in ACM International Conference Proceeding Series, Vol. 2014 (New York, NY: Association for Computing Machinery), 436–445.
Bejder, L., Samuels, A., Whitehead, H., Gales, N., Mann, J., Connor, R. C., et al. (2006). Decline in relative abundance of bottlenose dolphins exposed to long-term disturbance. Conserv. Biol. 20, 1791–1798. doi: 10.1111/j.1523-1739.2006.00540.x
Carrillo, M., Pérez-Vallazza, C., and Álvarez-Vázquez, R. (2010). Cetacean diversity and distribution off Tenerife (Canary Islands). Mar. Biodivers. Rec. 3, 1–9. doi: 10.1017/S1755267210000801
Cecchetti, A., Stockin, K. A., Gordon, J., and Azevedo, J. M. (2018). Short-term effects of tourism on the behaviour of common dolphins (Delphinus delphis) in the Azores. J. Mar. Biol. Assoc. UK 98, 1187–1196. doi: 10.1017/S0025315417000674
Cheung, Y.-W., and Lai, K. S. (1995). Lag order and critical values of the augmented Dickey–Fuller test. J. Bus. Econ. Stat. 13, 277–280. doi: 10.1080/07350015.1995.10524601
Christiansen, F., Rasmussen, M. H., and Lusseau, D. (2014). Inferring energy expenditure from respiration rates in minke whales to measure the effects of whale watching boat interactions. J. Exp. Mar. Biol. Ecol. 459, 96–104. doi: 10.1016/j.jembe.2014.05.014
Constantine, R., Brunton, D. H., and Dennis, T. (2004). Dolphin-watching tour boats change bottlenose dolphin (Tursiops truncatus) behaviour. Biol. Conserv. 117, 299–307. doi: 10.1016/j.biocon.2003.12.009
Curtin, S. (2003). Whale-watching in Kaikoura: sustainable destination development? J. Ecotour. 2, 173–195. doi: 10.1080/14724040308668143
de Souza, E. N., Boerder, K., Matwin, S., and Worm, B. (2016). Improving fishing pattern detection from satellite AIS using data mining and machine learning. PLoS ONE 11:e0158248. doi: 10.1371/journal.pone.0158248
Erbe, C. (2002). Underwater noise of whale-watching boats and potential effects on killer whales (Orcinus orca), based on an acoustic impact model. Mar. Mamm. Sci. 18, 394–418. doi: 10.1111/j.1748-7692.2002.tb01045.x
European Council (1992). Council Directive 92/43/EEC of 21 May 1992 on the Conservation of Natural Habitats and of Wild Fauna and Flora.
Gobierno de Canarias (2000). Decreto 178/2000, de 6 de septiembre, por el que se regulan las actividades de observación de cetáceos. Bol. Canarias 133, 15840–15851. Available online at: http://www.gobiernodecanarias.org/boc/2000/133/boc-2000-133-002.pdf
Greig, N. C., Hines, E. M., Cope, S., and Liu, X. (2020). Using satellite AIS to analyze vessel speeds Off the Coast of Washington State, U.S., as a risk analysis for cetacean-vessel collisions. Front. Mar. Sci. 7:109. doi: 10.3389/fmars.2020.00109
Heimlich-Boran, J. R. (1993). Social organisation of the short-finned pilot whale, Globicephala macrorhynchus, with special reference to the comparative social ecology of delphinids (Ph.D. thesis). (Cambridge). p. 197.
Heimlich-Boran, J. R., and Heimlich-Boran, S. (1990). Occurrence and group structure of short-finned pilot whales Globicephala macrorhynchus off the western coast of Tenerife. Eur. Res. Cetaceans 4, 102–104.
Higham, J. E., Bejder, L., and Lusseau, D. (2008). An integrated and adaptive management model to address the long-term sustainability of tourist interactions with cetaceans. Environ. Conserv. 35, 294–302. doi: 10.1017/S0376892908005249
Holt, M. M., Noren, D. P., Veirs, V., Emmons, C. K., and Veirs, S. (2009). Speaking up: killer whales (Orcinus orca) increase their call amplitude in response to vessel noise. J. Acoust. Soc. Am. 125, EL27–EL32. doi: 10.1121/1.3040028
Houghton, J., Holt, M. M., Giles, D. A., Hanson, M. B., Emmons, C. K., Hogan, J. T., et al. (2015). The relationship between vessel traffic and noise levels received by killer whales (Orcinus orca). PLoS ONE 10:e0140119. doi: 10.1371/journal.pone.0140119
International Whaling Commision (2004). Report of the Workshop on the Science for Sustainable Whalewatching. Technical report, International Whaling Commission.
Lapinski, A. L. S., and Isenor, A. W. (2011). Estimating reception coverage characteristics of AIS. J. Navig. 64, 609–623. doi: 10.1017/S0373463311000282
Lusseau, D., Bain, D., Williams, R., and Smith, J. (2009). Vessel traffic disrupts the foraging behavior of southern resident killer whales Orcinus orca. Endanger. Spec. Res. 6, 211–221. doi: 10.3354/esr00154
Lusseau, D., Lusseau, S. M., Bejder, L., and Williams, R. (2006). “An individual-based model to infer the impact of whalewatching on cetacean population dynamics,” in 58th International Whaling Commission, SC/58/WW7:19. (Kittian).
McWhinnie, L. H., O'Hara, P. D., Hilliard, C., Le Baron, N., Smallshaw, L., Pelot, R., et al. (2021). Assessing vessel traffic in the Salish Sea using satellite AIS: an important contribution for planning, management and conservation in southern resident killer whale critical habitat. Ocean Coast. Manage. 200:105479. doi: 10.1016/j.ocecoaman.2020.105479
Natale, F., Gibin, M., Alessandrini, A., Vespe, M., and Paulrud, A. (2015). Mapping fishing effort through AIS data. PLoS ONE 10:e0130746. doi: 10.1371/journal.pone.0130746
New, L., Lusseau, D., and Harcourt, R. (2020). Dolphins and boats: when is a disturbance, disturbing? Front. Mar. Sci. 7:353. doi: 10.3389/fmars.2020.00353
O'Connor, S., Campbell, R., Cortez, H., and Knowles, T. (2009). Whale Watching Worldwide: Tourism Numbers, Expenditures and Expanding Economic Benefits, a Special Report From the International Fund for Animal Welfare. Technical report, International Fund for Animal Welfare, Yarmouth, MA, United States.
Parsons, E. C. M. (2012). The negative impacts of whale-watching. J. Mar. Biol. 2012, 1–9. doi: 10.1155/2012/807294
Pirotta, E., Merchant, N. D., Thompson, P. M., Barton, T. R., and Lusseau, D. (2015). Quantifying the effect of boat disturbance on bottlenose dolphin foraging activity. Biol. Conserv. 181, 82–89. doi: 10.1016/j.biocon.2014.11.003
Redfern, J. V., Becker, E. A., and Moore, T. J. (2020). Effects of variability in ship traffic and whale distributions on the risk of ships striking whales. Front. Mar. Sci. 6:793. doi: 10.3389/fmars.2019.00793
Robbins, J., and Frost, M. (2009). “An on-line database for world-wide tracking of commercial whale watching and associated data collection programs,” in Scientific Committee Meeting of the International Whaling Commission (Funchal), 2–3.
Rowlands, G., Brown, J., Soule, B., Boluda, P. T., and Rogers, A. D. (2019). Satellite surveillance of fishing vessel activity in the Ascension Island Exclusive Economic Zone and Marine Protected Area. Mar. Policy 101, 39–50. doi: 10.1016/j.marpol.2018.11.006
Salvador, J., Ruiz, Z., and Garcia-Rodriguez, J. (2017). A review of infrastructures to process big multimedia data. Int. J. Comput. Vision Image Process. 7, 54–64. doi: 10.4018/IJCVIP.2017070105
Schaffar, A., Madon, B., Garrigue, C., and Constantine, R. (2009). “Avoidance of whale watching boats by humpback whales in their main breeding ground in New Caledonia,” in International Whaling Commission, SC/61/WW6:9. (Funchal).
Schuler, A. R., Piwetz, S., Di Clemente, J., Steckler, D., Mueter, F., and Pearson, H. C. (2019). Humpback whale movements and behavior in response to whale-watching vessels in Juneau, AK. Front. Mar. Sci. 6:710. doi: 10.3389/fmars.2019.00710
Seabold, S., and Perktold, J. (2010). “statsmodels: Econometric and statistical modeling with python,” in 9th Python in Science Conference (Austin, TX).
Servidio, A., Pérez-Gil, E., Pérez-Gil, M., Cañadas, A., Hammond, P. S., and Martín, V. (2019). “Site fidelity and movement patterns of short-finned pilot whales within the Canary Islands: evidence for resident and transient populations,” Aquat. Conserv. Mar. Freshw. Ecosyst. 29, 227–241. doi: 10.1002/aqc.3135
Silveira, P., Teixeira, A., and Soares, C. G. (2013). Use of AIS data to characterise marine traffic patterns and ship collision risk off the coast of Portugal. J. Navigat. 66, 879–898. doi: 10.1017/S0373463313000519
Thierry, S., Dick, S., George, S., Benoit, L., and Cyrille, P. (2019). “EMODnet Bathymetry a compilation of bathymetric data in the European waters,” in OCEANS 2019 - Marseille (Marseille: IEEE), 1–7.
Waskom, M., Botvinnik, O., O'Kane, D., Hobson, P., Lukauskas, S., Gemperline, D. C., et al. (2017). mwaskom/seaborn: v0.8.1 (September 2017).
White, K. J. (1992). The durbin-watson test for autocorrelation in nonlinear models. Rev. Econ. Stat. 74:370. doi: 10.2307/2109675
Wieslaw, T. (2012). Origins of ship safety requirements formulated by international maritime organization. Proc. Eng. 45, 847–856. doi: 10.1016/j.proeng.2012.08.249
Keywords: automatic identification system, cetacean, whale watching, carrying capacity, sustainability
Citation: Almunia J, Delponti P and Rosa F (2021) Using Automatic Identification System (AIS) Data to Estimate Whale Watching Effort. Front. Mar. Sci. 8:635568. doi: 10.3389/fmars.2021.635568
Received: 30 November 2020; Accepted: 08 June 2021;
Published: 26 July 2021.
Edited by:
Tomaso Fortibuoni, Istituto Superiore per la Protezione e la Ricerca Ambientale (ISPRA), ItalyReviewed by:
Carmen Ferrá, National Research Council (CNR), ItalyBlake E. Feist, National Oceanic and Atmospheric Administration (NOAA), United States
Copyright © 2021 Almunia, Delponti and Rosa. This is an open-access article distributed under the terms of the Creative Commons Attribution License (CC BY). The use, distribution or reproduction in other forums is permitted, provided the original author(s) and the copyright owner(s) are credited and that the original publication in this journal is cited, in accordance with accepted academic practice. No use, distribution or reproduction is permitted which does not comply with these terms.
*Correspondence: Javier Almunia, ZGlyQGxvcm9wYXJxdWUtZnVuZGFjaW9uLm9yZw==