 Anett Endrédi
 Katalin Patonai
 János Podani
 Simone Libralato
 Ferenc Jordán
- 1Department of Community Ecology, Institute of Aquatic Ecology, Centre for Ecological Research, Budapest, Hungary
- 2Evolutionary Systems Research Group, Centre for Ecological Research, Budapest, Hungary
- 3Eötvös Loránd University, Budapest, Hungary
- 4Istituto Nazionale di Oceanografia e di Geofisica Sperimentale, Trieste, Italy
- 5Stazione Zoologica Anton Dohrn, Naples, Italy
- 6Democracy Institute, Central European University, Budapest, Hungary
Networks of trophic interactions provide a lot of information on the functioning of marine ecosystems. Beyond feeding habits, three additional traits (mobility, size, and habitat) of various organisms can complement this trophic view. The combination of traits and food web positions are studied here on a large food web database. The aim is a better description and understanding of ecological roles of organisms and the identification of the most important keystone species. This may contribute to develop better ecological indicators (e.g., keystoneness) and help in the interpretation of food web models. We use food web data from the Ecopath with Ecosim (EwE) database for 92 aquatic ecosystems. We quantify the network position of organisms by 18 topological indices (measuring centrality, hierarchy, and redundancy) and consider their three, categorical traits (e.g., for mobility: sessile, drifter, limited mobility, and mobile). Relationships are revealed by multivariate analysis. We found that topological indices belong to six different categories and some of them nicely separate various trait categories. For example, benthic organisms are richly connected and mobile organisms occupy higher food web positions.
Introduction
In order to sustain the proper functioning of ecosystems, we need to better understand the simple question of Lawton (1994): What species do in ecosystems? Since ecological roles and food web positions are not independent (Luczkovich et al., 2003), we address the question what kind of species occupy certain kinds of network positions.
Since the very first attempts to identify keystone species (Paine, 1966, 1969), there has been an interest in their place in food webs (Mills et al., 1993; Power et al., 1996). First they were suggested to have been top predators, then also plants, herbivores, and parasites (Bond, 1994; Marcogliese and Cone, 1997). For both community ecology and conservation biology, it would be very useful to know where are they in complex trophic networks.
While it is clear that the relative importance of organisms varies with time and space, looking at a large database may provide some general insight into the problem. If certain types of organisms occupy certain types of network positions, results can increase the predictability of food web modeling. Comparisons of centrality indices with each other (the similarity of DC and CC: Jordán et al., 2007; K predicts KSI better than s: Endrédi et al., 2018b) and centrality indices with trophic level (most high-centrality species at medium trophic levels: Scotti and Jordán, 2010) were done to better understand critically important positions of organisms in food webs. Extending this interest by adding trait data to trophic groups helps the biological interpretation of the results. Relationships between centrality indices have been studied for other network types as well, including habitat networks (Baranyi et al., 2011; Pereira et al., 2017).
With large databases and new statistical analyses, these questions can be re-investigated and our knowledge can be updated. In this article, we consider a large database of trophic networks, described by standard methodology for both data collection and network construction, making them comparable. We (1) characterize the network position of each trophic component by a variety of topological indices, quantifying centrality, hierarchy, redundancy, keystoneness, and trophic level, (2) characterize each trophic component by three traits, and (3) use multivariate methods for comparisons between various topological indices and between topological indices and traits.
Materials and Methods
Data from 92 Ecopath with Ecosim (EwE) aquatic food web models were compiled using the EcoBase online database repository (Colléter et al., 2013) and previously published sources (Heymans et al., 2014). These networks have varying number of nodes (ranging from 8 to 63) but were assembled using comparable methodology of the EwE framework (Christensen and Walters, 2004; Heymans et al., 2016). For models of the same ecosystem described in different years, we used the most recent one (considering the year of publication). The compiled data represent five global regions with diverse ecosystems: 14 models from Africa, 14 from Australasia, 29 from Europe, 27 from North America, and 8 from South America (Supplementary Material A).
The network position of each trophic component in each trophic network was characterized by 18 topological indices (see Table 1 for description of computed indices). Centrality was quantified by six indices (four binary and two weighted), we used eight indices for hierarchy (i.e., centrality in DAGs), two indices for redundancy (topological overlap), one for keystoneness (KSI, Libralato et al., 2006) and also the measure of trophic level as it is used in EwE. The last two indices were retrieved from previous publications (see Heymans et al., 2014 and the references in Supplementary Material A). All other topological indices were computed using programs UCINET (Borgatti et al., 2002) and CoSBiLab (Valentini and Jordán, 2010).
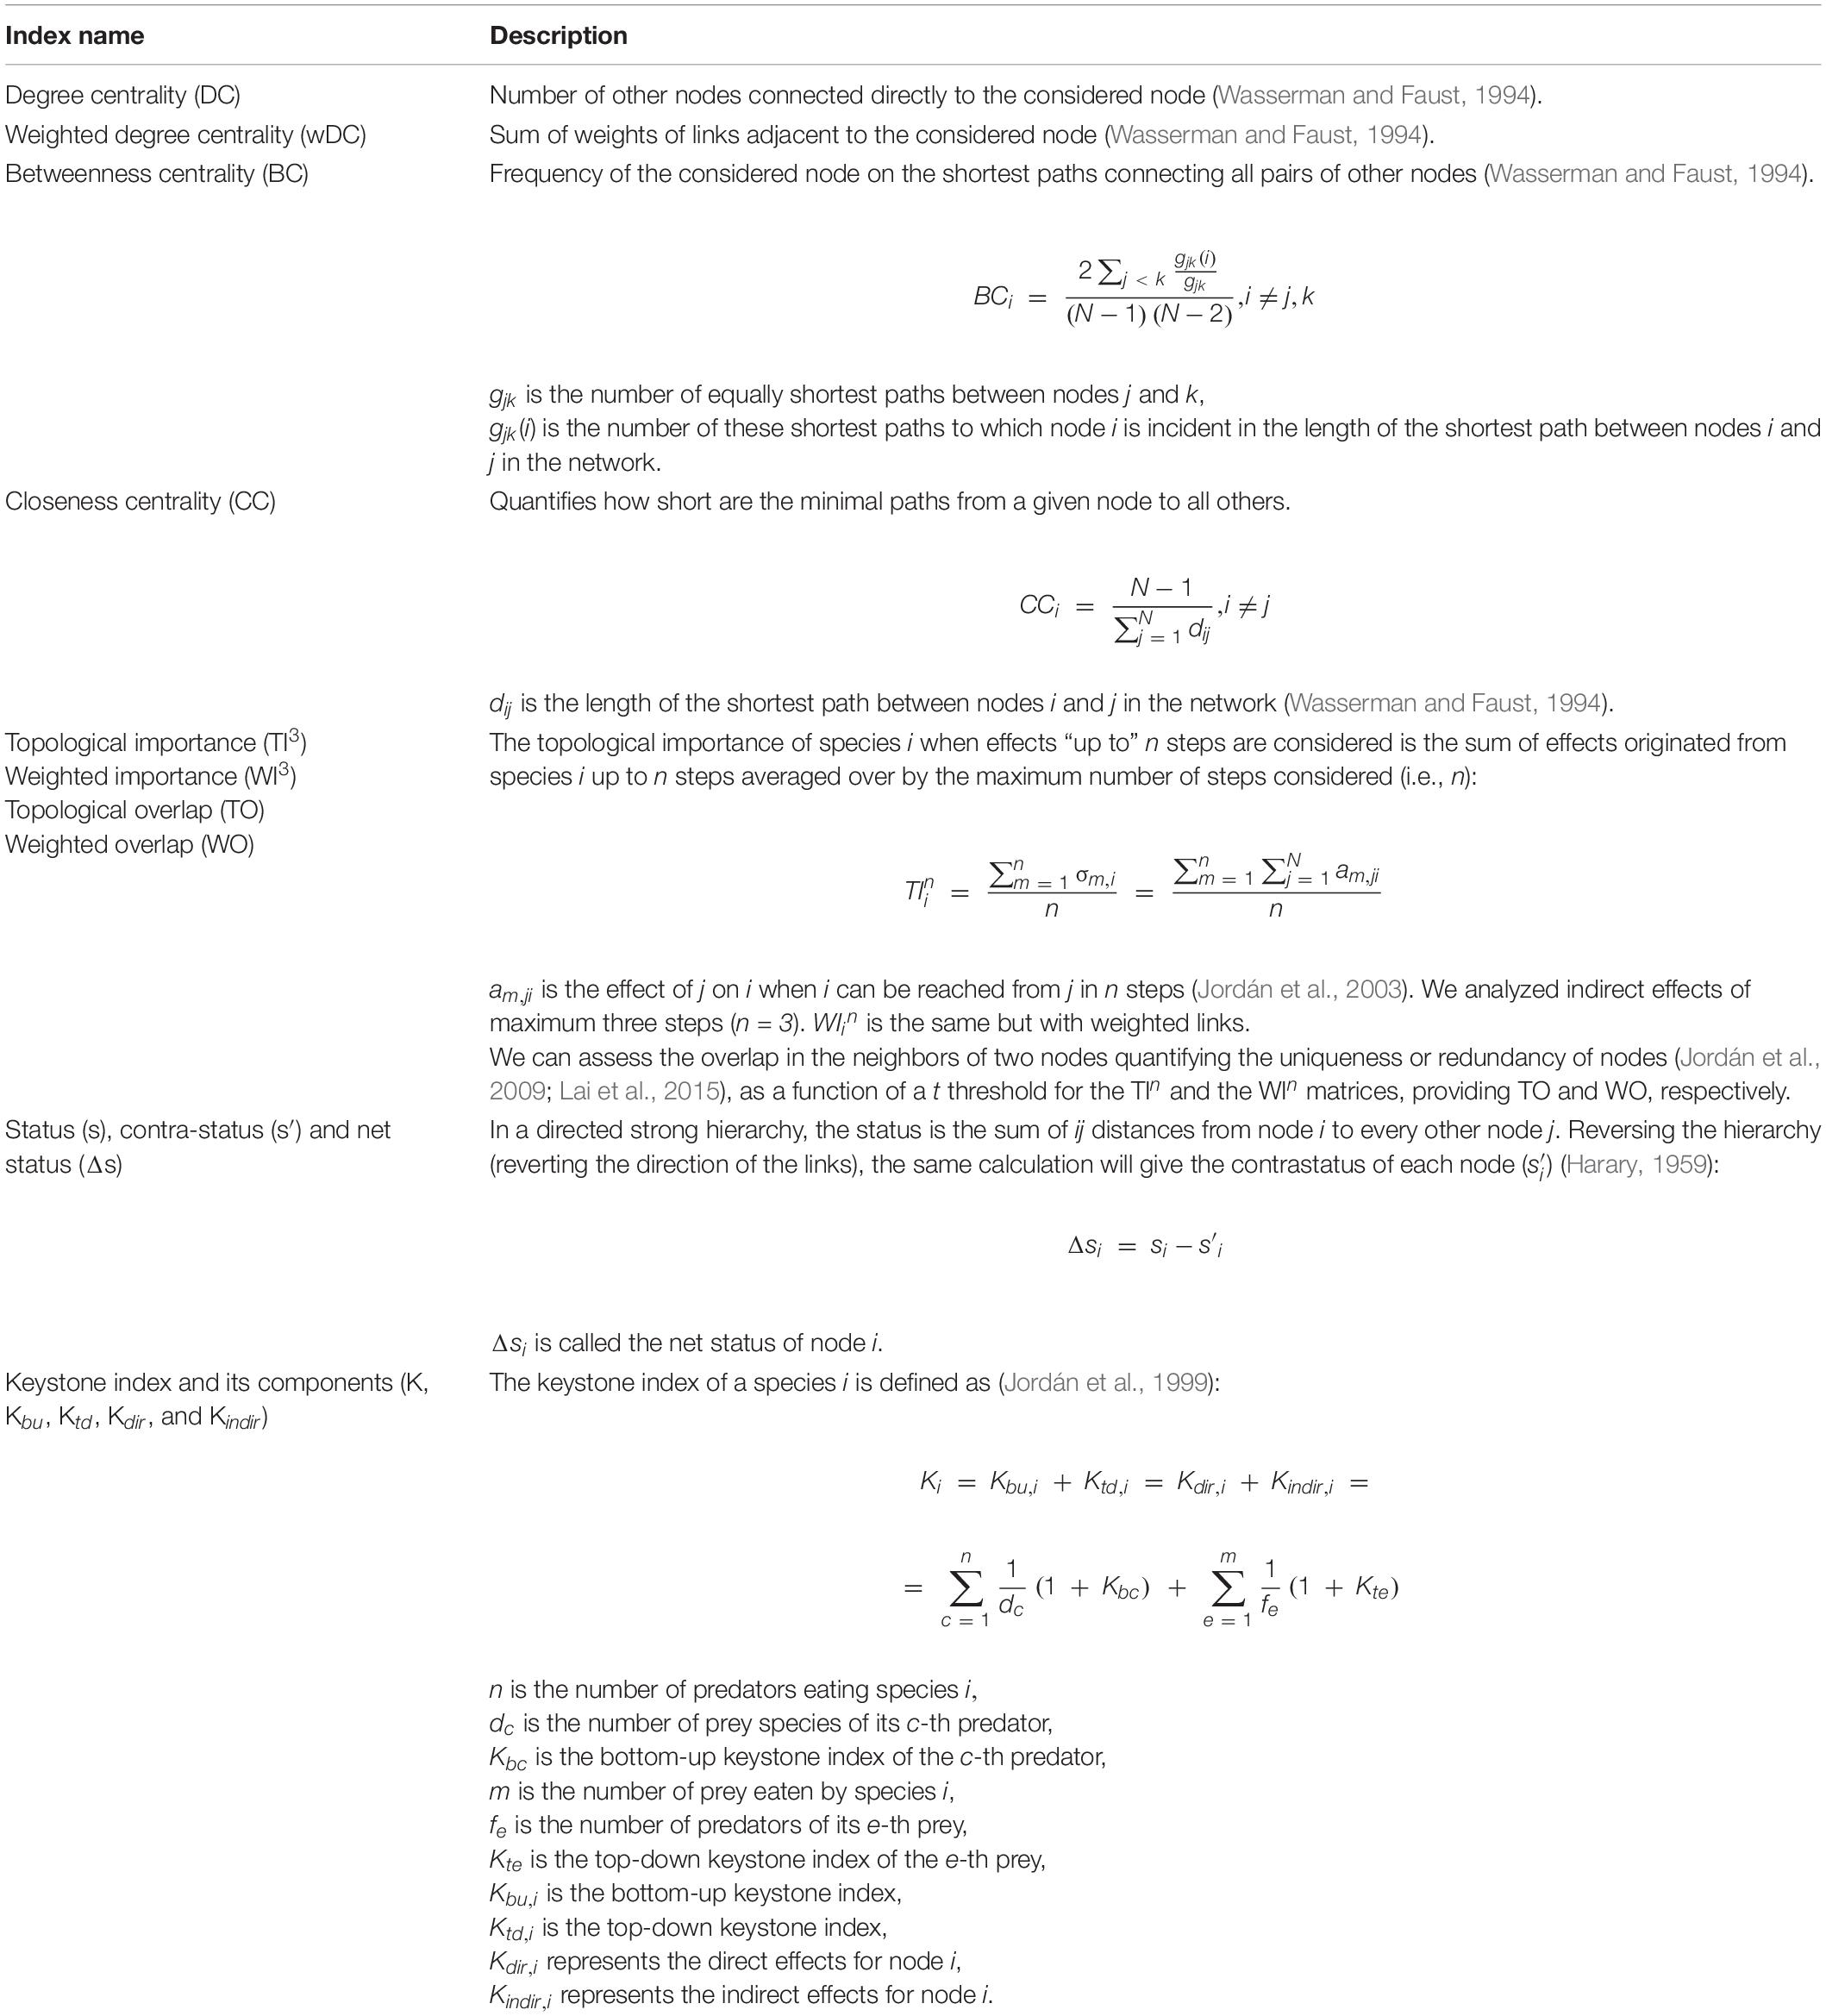
Table 1. List of topological indices.
In order to be able to use a wide range of topological indices, some of them with specific requirements, it was necessary to pre-process the database in a few steps. This ensured the applicability of indices and the comparability of the results. Since we focus on the interactions among living organisms, we deleted (1) non-living network components (e.g., DOM) and (2) living components that became isolated nodes after deleting the non-living ones (e.g., holothuroids in the Kuosheng Bay network). From an energetic point of view, detritus and cycling are clearly crucial to ecosystem dynamics, however, topological indices (who interacts with whom) may provide biased results and artifacts if non-living components are not deleted (e.g., detritus can simply be connected to each living component). We double-checked if this data processing had a major effect on the KSI and TL index values and found the difference only minimal and safely negligible (TL was changed highly consistently across the networks, as almost the same trophic groups were removed from almost the same positions, while KSI-values still quantify nodes in the original networks but their re-calculation is not possible for the modified networks – from a comparative perspective, neither makes real difference). This process rendered one small network (Maspalomas Lagoon) without primary producers, thus not usable for our study. Altogether this resulted in the deletion of 150 network components (127 non-living and 23 living) (Supplementary Material A). On average, this means 1.63 node (6%) per network. One additional node, Stellar Sea Lion pup (“SSL pup”) from the Aleutian Islands model was an outlier (due to asymmetric connections of only having one predator and no prey) and was omitted. Before computing non-hierarchical indices, networks were symmetrized by summing the interactions’ strengths. All loops were eliminated from 57 food webs to be able to compute hierarchical indices (detailed methods can be found in Supplementary Material B).
Functional groups were assigned to three categorical traits (i.e., feeding habitat, mobility, and size category, Table 2) and one continuous trait (maximum body size). In general, the trait for the foraging adult form was considered, unless age (e.g., juvenile) or size (e.g., small) was specifically noted. Species-level habitat preference and maximum length measurements (in cm) were extracted from the FishBase (FishBase, 2020) and SeaLifeBase (SeaLifeBase, 2020) online databases and assigned to larger functional groups.
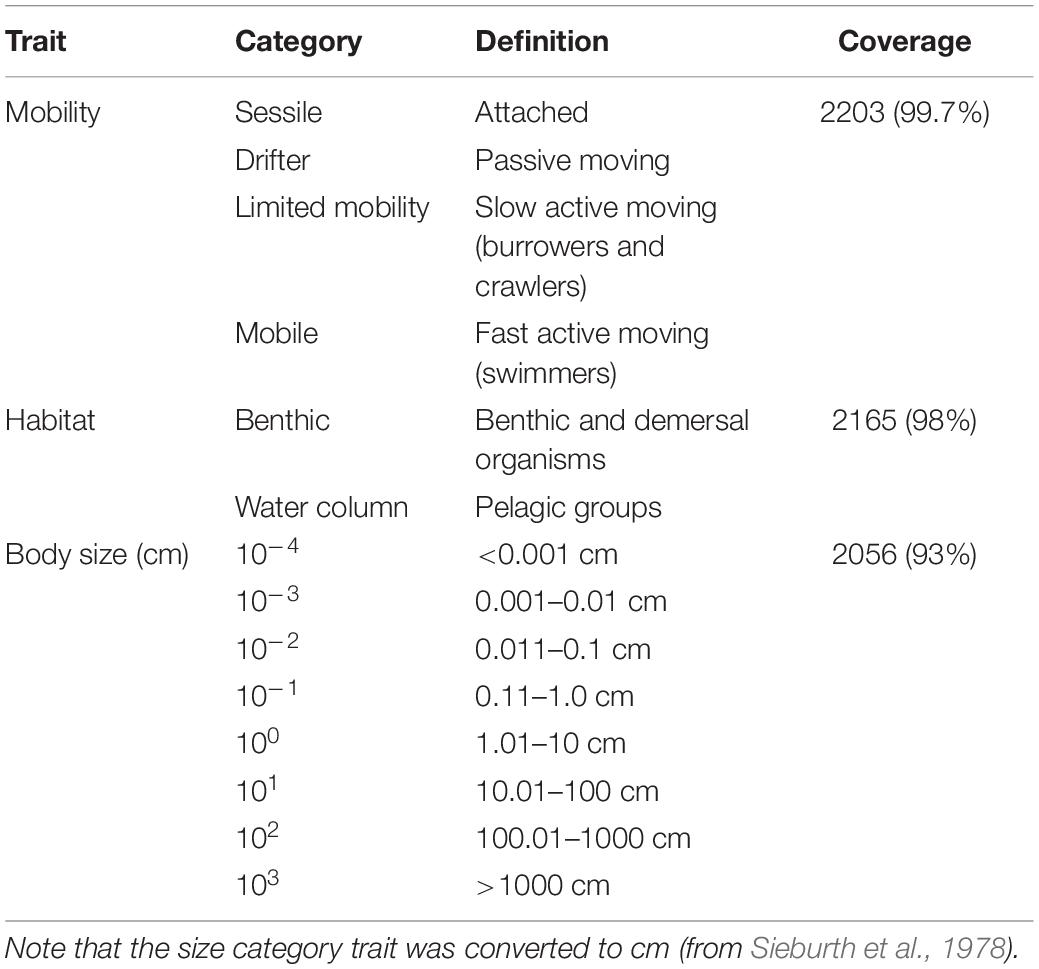
Table 2. List of categorical traits (mobility, habitat, and size), categories used, definitions, and data coverage of the data set (n = 2210).
Generalizations are inevitable where species are not listed or are aggregated into functional groups (common practice in food web studies). Below we describe the generalizations we encountered and the methods used for trait assignments. First it is noted that we needed to work with a small number of relatively large categories in order to keep the cross-ecosystem analysis feasible (more detailed classifications would reduce comparability). Several traits can be defined only for a smaller range of organisms, like “pigments” for phytoplankton (Weithoff and Beisner, 2019) or “dive duration” for the megafauna (Tavares et al., 2019). We tried to maintain the coverage of trait data for the possibly largest set of trophic groups (Kremer et al., 2017). For the habitat preference trait, benthic organisms included all of those associated with the benthos (infauna and epifauna) as well as demersal species (e.g., flatfish and rays) or those otherwise described living near the bottom (e.g., sandy or muddy surfaces) – all available in FishBase’s species environment and biology descriptions. For other, non-specified fishes and sharks, we defaulted to the water column habitat. Phytoplankton, zooplankton, jellyfish, sea birds, sea turtles, and cetaceans were also assigned to the water column habitat. Other important categories (mesopelagic) were not considered for maintaining comparability and wide coverage among different ecosystem models, even if their importance is clear (Agnetta et al., 2019). The mobility trait was organized into four categories: sessile (attached), drifter (passive movers), limited mobility (slow active movers, including burrowers, and crawlers), and mobile (fast active movers and swimmers) (Costello et al., 2015). Sessile (e.g., macrophytes and barnacles) and drifter (e.g., plankton, bacteria, and fish larvae) organisms are biologically well-defined. Limited mobility organisms were mainly macroinvertebrates (e.g., echinoderms, gastropods, and annelids) and juvenile fish, whereas vertebrates capable of swimming (e.g., adult fish, turtles, birds, and marine mammals) were mobile. For non-species-specific size data (e.g., microzooplankton), we used Sieburth et al. (1978) plankton size fractions to extract maximum length (cm). Our data range from bacteria (0.0002 cm) to blue whales (3300 cm). Based on Sieburth’s size fractions, functional groups were assigned to one of eight size categories (each category increasing by a factor of 10) (see Table 2).
Data coverage was relatively even (>93%) for the three categorical traits (Table 2). The continuous trait, maximum length, had the lowest data coverage (71%) and was not analyzed separately in this study, however, it was used to assign the nodes to body size classes. Distinction into trait categories was not always clear-cut due to ontogenetic shift in diet and habitat preferences (e.g., bathypelagic species) or food web aggregation problems (mixed groups or broad categories). For these functional groups, we made a case-by-case evaluation based on the detailed metadata (description based on original EwE publications) or left the trait blank (“NA”). If available from the metadata description, one representative was selected and categorized accordingly. Overall, our data sets are comparable in the sense that they have low resolution at the bottom (e.g., phytoplankton as a single group) and higher resolution at the top (e.g., fish species listed).
First, the relationship between topological indices was investigated using Spearman’s rank correlation and multivariate analyses [Principal Component Analysis (PCA), hierarchical clustering, and Nonmetric Multidimensional Scaling (NMDS)]. PCA and hierarchical clustering were used as metric exploratory methods to reveal groups and correlations amongst the 18 indices. The results were compared with those obtained via ordinal methods (Spearman rank correlation and NMDS). PCA works well for linearly correlated data and requires few assumptions (e.g., accepts negative index values such as in s’ or KS). Standardized PCA was applied to ensure commensurability of indices. Data for hierarchical clustering were standardized by the standard deviation of variables and then the indices were classified using Euclidean distance and the unweighted pair group method with arithmetic mean (UPGMA or group average method). While other clustering methods do exist, UPGMA was selected based on the highest cophenetic correlation value, which measures how closely the original distances are reproduced by distances in the dendrogram (Sokal and Rohlf, 1962). These methods are able to maintain much of the original metric information in the data, i.e., differences between the scores. Ordinal methods operate by reducing data to ranks thereby disregarding metric properties. From the Spearman’s rank correlation coefficients (ρ), a dissimilarity semi-matrix was calculated according to the formula d = 1 − ρ, effectively converting the correlations to the interval [0,2]. Thus, d = 0 means complete similarity corresponding to identical rank orders, and d = 2 reflects complete dissimilarity, i.e., reverse rank orders. The matrix thus obtained was used as input to NMDS. Spearman’s correlations were visualized by a matrix plot, while the dissimilarity values were subjected to NMDS to provide an ordination of indices. Analyses were computed and results were displayed using R software [R Core Team, 2020; packages: “stat” and “ggcorrplot” (Kassambara, 2019)], and the SYNTAX-2000 package (Podani, 2001).
Second, for testing the independence of the three categorical traits, Pearson’s Chi-squared test and Fisher’s exact tests were performed with simulated p-values, using the “stat” package in R (R Core Team, 2020).
Finally, the relationship between topological indices and functional traits was visualized in R (“ggpubr” package, see Kassambara, 2020) and analyzed using linear mixed-effects models, with the traits as fix effects and the networks as random effects (thereby accounting for network variability in the models). Before building the models, ten indices required transformation due to their positively skewed distribution (square-root transformation for moderate skew: BC, TO, Kbu, WO, and Ktd; and log transformation for greater skew: wDC, WI3, K, Kdir, and Kindir), and all indices were studentized within their network. The latter means that all index values were subtracted from the sample mean (mean value of the index in its network) and divided by the standard deviation of the sample. The transformations did not change the trends of the relationships between the indices and the traits but helped meet the model assumptions and make the values more independent from the network features. Mixed-effect models were built in R, using “lme4” (Bates et al., 2015) and “lmerTest” (Kuznetsova et al., 2017) packages.
Results
In the dendrogram resulting from the hierarchical classification of indices, six clusters are recognized at the level of 50 (Figure 1, right). Centrality indices (DC, CC, BC, TI3, and TO) are grouped into the first cluster. The keystone index (KSI) is a singleton. The indirect component of the K index (Kindir) and K are the closest pair and comprise group three together with Kdir, Kbu, and WI3. These two latter indices are related by both emphasizing bottom-up groups. The fourth cluster is somewhat mixed, containing two hierarchical indices (s and Δs) and a weighted index (WO). Weighted degree centrality (wDC) was found separately in group five. The sixth group is made up of three classical top-down indices (s′, TL, and Ktd). The discussion of indices and traits will be based on the groups classified in this dendrogram (Figure 1), since it had a high cophenetic correlation (r = 0.8267) indicating minimum distortion compared to the input Euclidean distances.
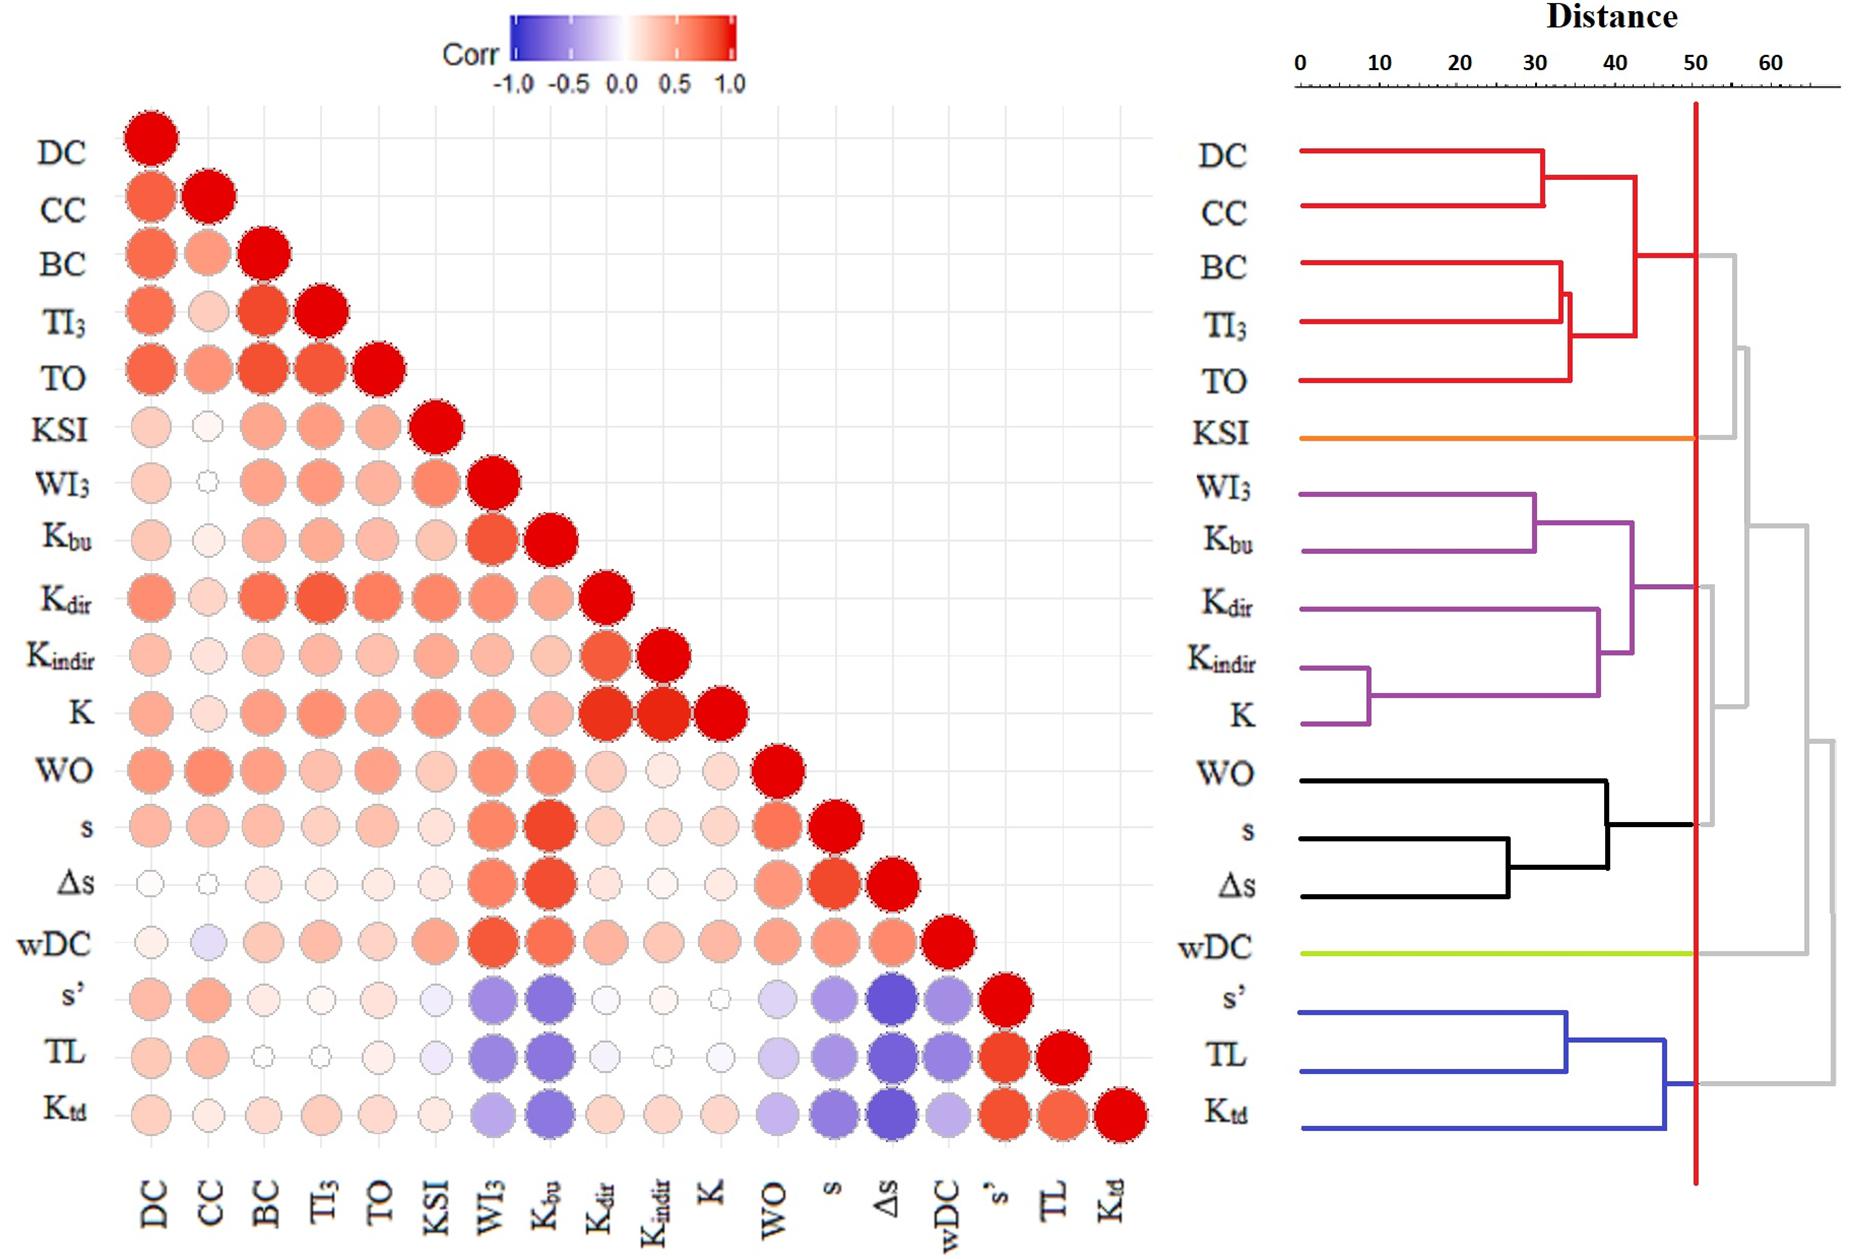
Figure 1. Matrix plot of Spearman rank correlations among the 18 topological indices (left) and the UPGMA dendrogram based on Euclidean distances for standardized data. Negative correlations (e.g., between s′ and s) are shown in blue, while positive correlations (e.g., between DC and CC) are shown in red. The larger and darker the circle, the stronger the correlation. For the dendrogram, red vertical line denotes Euclidean distance at the level of 50, creating six clusters of indices ranking network nodes similarly in each cluster.
The NMDS ordination (Figure 2), even though an ordinal approach, identified largely the same clusters (stress = 0.08). The major difference is that Kbu and WI3 fall away from the other three K components (K, Kdir, and Kindir) with which they formed a cluster in metric analysis, showing the inconsistent behavior of these K components. This pattern can also be observed on the matrix plot of Spearman rank correlations (Figure 1, left). In this diagram, rank correlations are contrasted with metric clustering, showing that the cluster membership of Kdir is the most ambiguous. The results of PCA can be found in Supplementary Material C. All four methods agree on the correlation of these indices, except for the above-mentioned K components (which are emphasized differently in metric versus ordinal approaches).
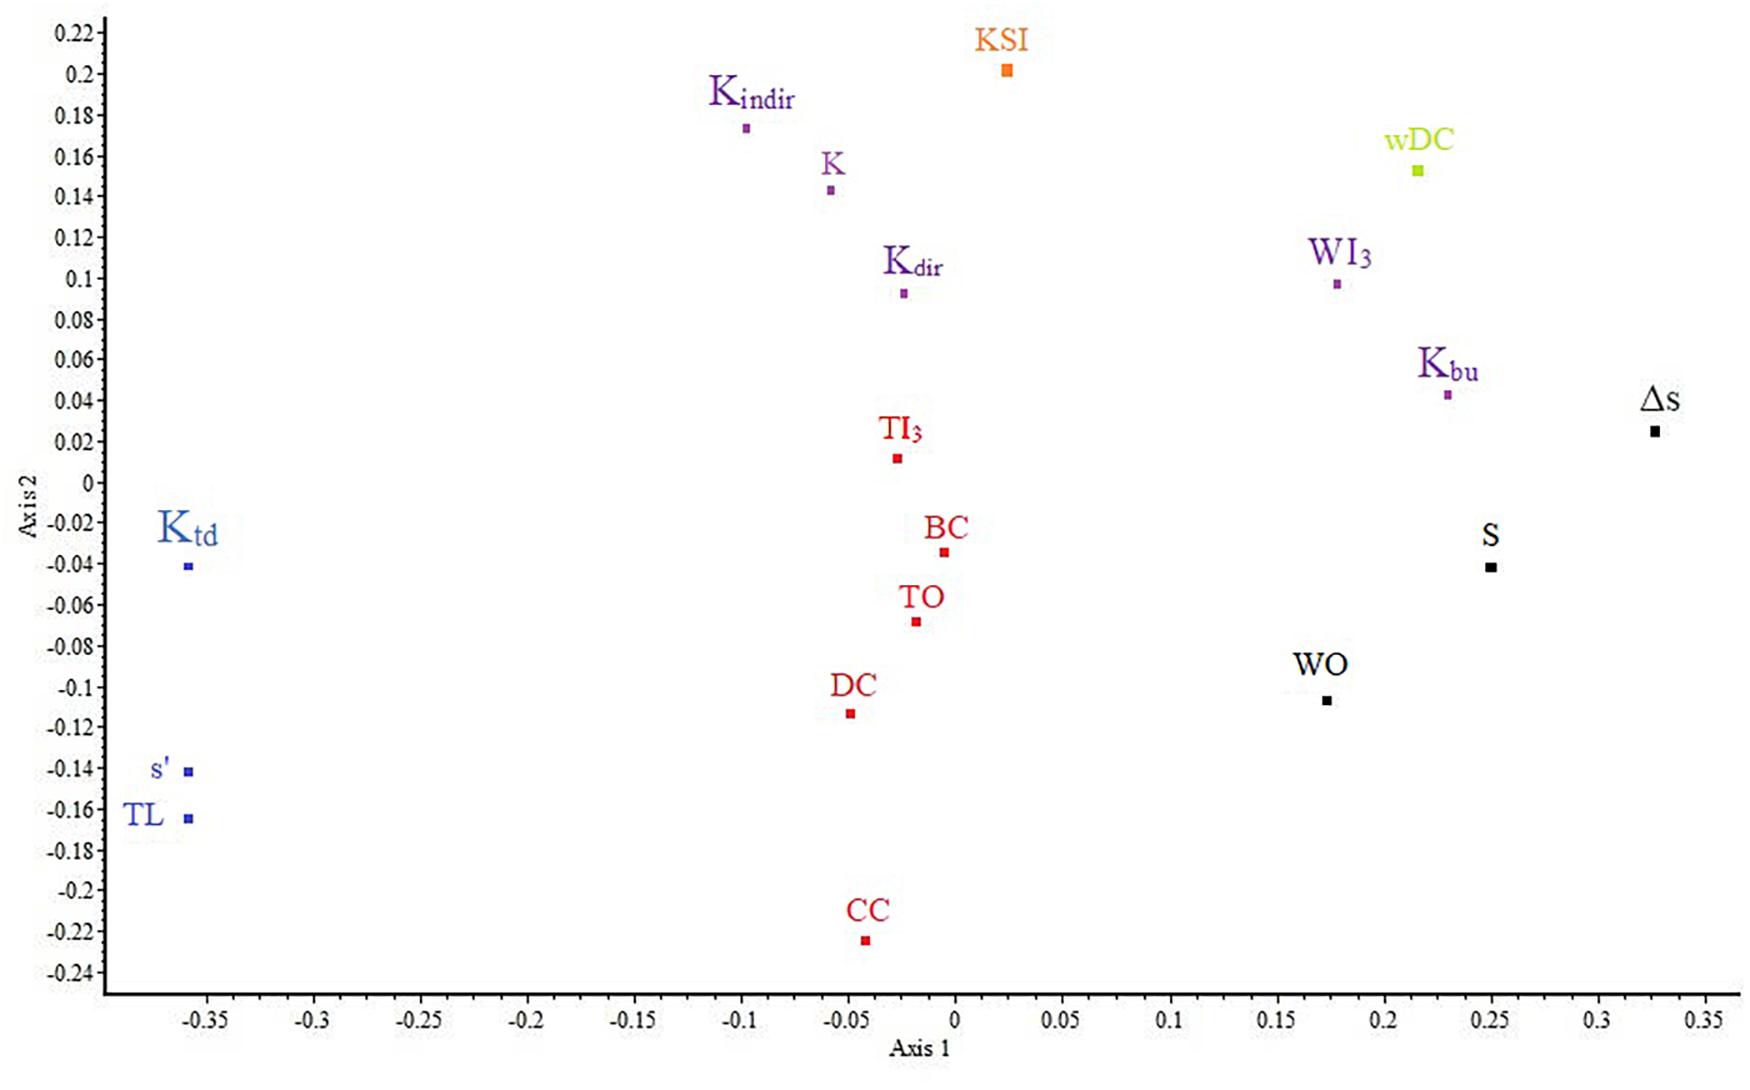
Figure 2. Nonmetric Multidimensional Scaling ordination of the 18 topological indices (stress = 0.08) with the six-group classification of Figure 1 superimposed. Although the ordination is nonmetric, the correspondence between the two results is remarkable, except for the positions of K-related indices.
Next, we assessed the relationships of three common categorical traits (mobility, habitat, and size) with the 18 indices. We were interested in finding out which trait has predictive power in these aquatic ecosystems and which is negligible. We ran mixed-effects models on the combination of these traits to predict the importance of specific trophic groups in the networks (see Supplementary Material E). An example network for the food web of Bay of Calvi is shown for visualizing the relationships of the mobility trait with the indices WI3 (Figure 3A) and Ktd (Figure 3B). The former emphasizes bottom-up groups (e.g., sessile and drifters) and the latter brings attention to mobile groups at the top of the food web. Figure 4 shows the relationship of the three traits with one representative index per dendrogram group, while Figure 5 summarizes the results of all pair-wise comparisons based on the mixed-effect models.
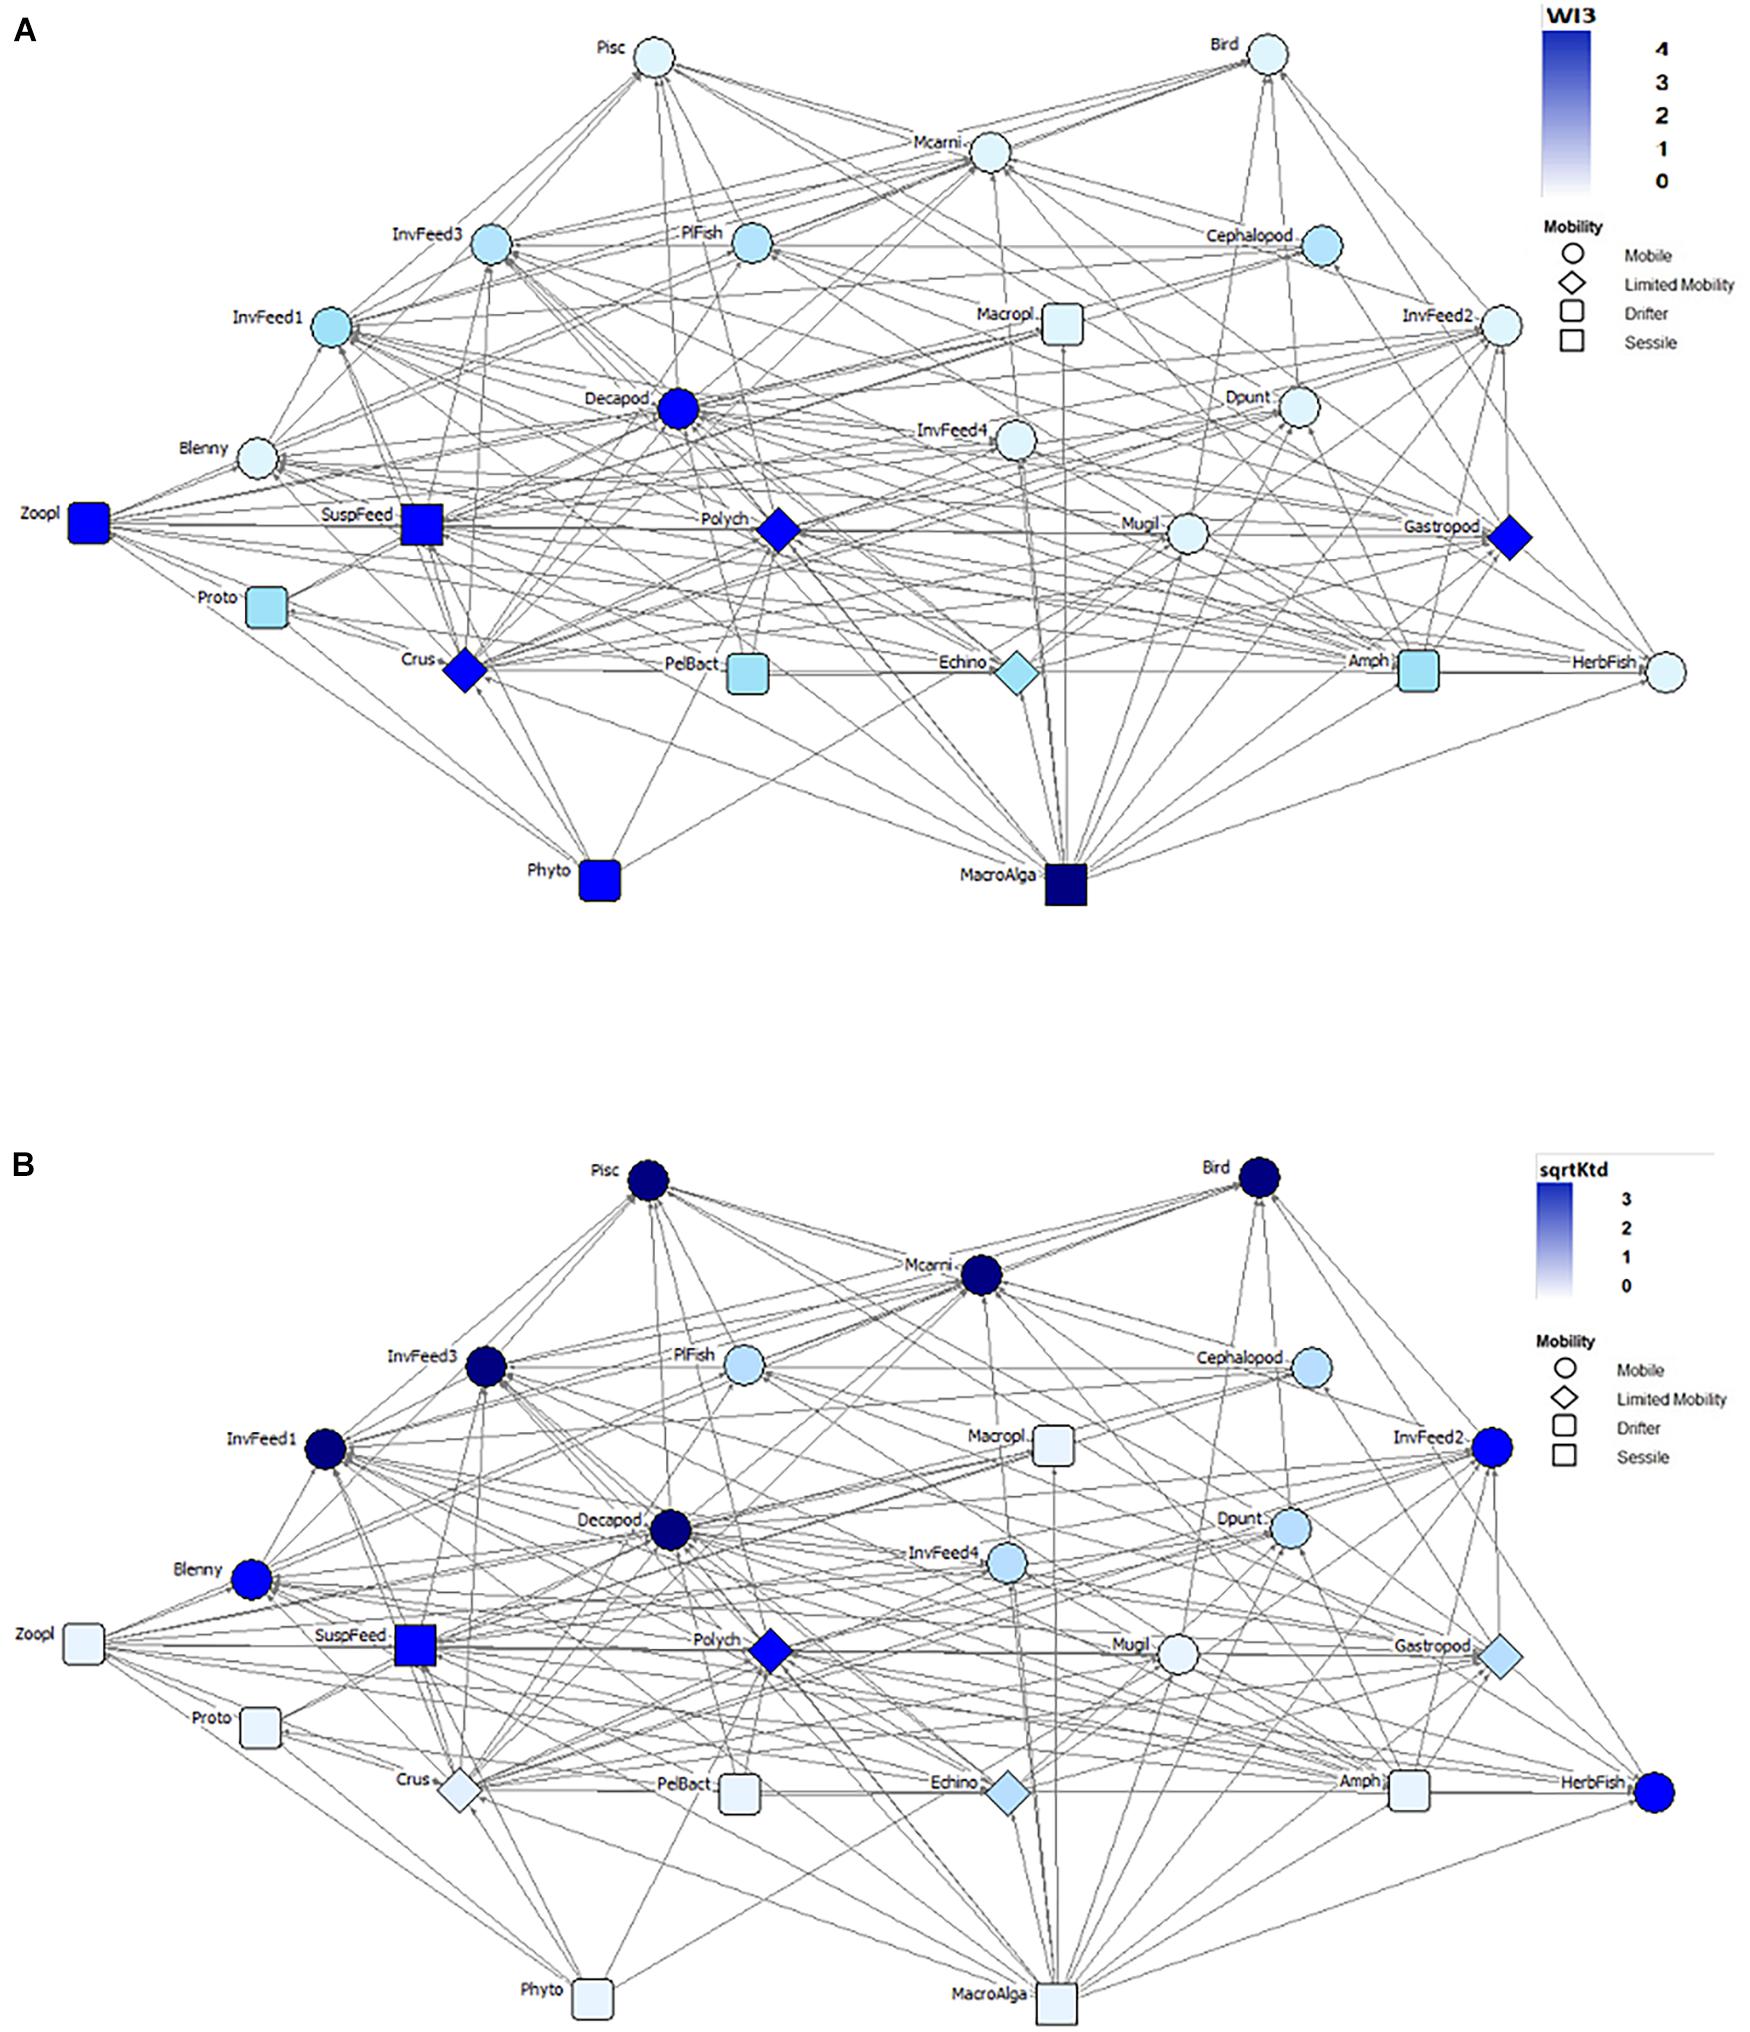
Figure 3. The food web of Bay of Calvi (Pinnegar and Polunin, 2004) showing the relationship between the topological position of nodes (node color, see values in the inset) for logWI3 (A) and sqrtKtd (B) and their mobility values (node shape, see categories in the inset). The abbreviations for the n = 26 trophic groups are: Phyto, phytoplankton; MacroAlga, macroalgae; Proto, pelagic protozoa; Crus, Crustacea; PelBact, pelagic bacteria; Echino, Echinoderms; Amph, Amphipods; HerbFish, herbivorous fish; Zoopl, zooplankton; SuspFeed, suspension feeders; Polych, polychaetes; Mugil, Mugilidae; Gastropod, gastropods; Blenny, omnivorous blennies; Decapod, decapods; Dpunt, Diplodus puntazzo; Macropl, macroplankton; PlFish, planktivorous fish; Cephalopod, cephalopods; Mcarni, macrocarnivorous fish; Pisc, piscivorous fish; Bird, seabirds; InvFeed1 through InvFeed4, benthic invertebrate feeders (groups 1–4).
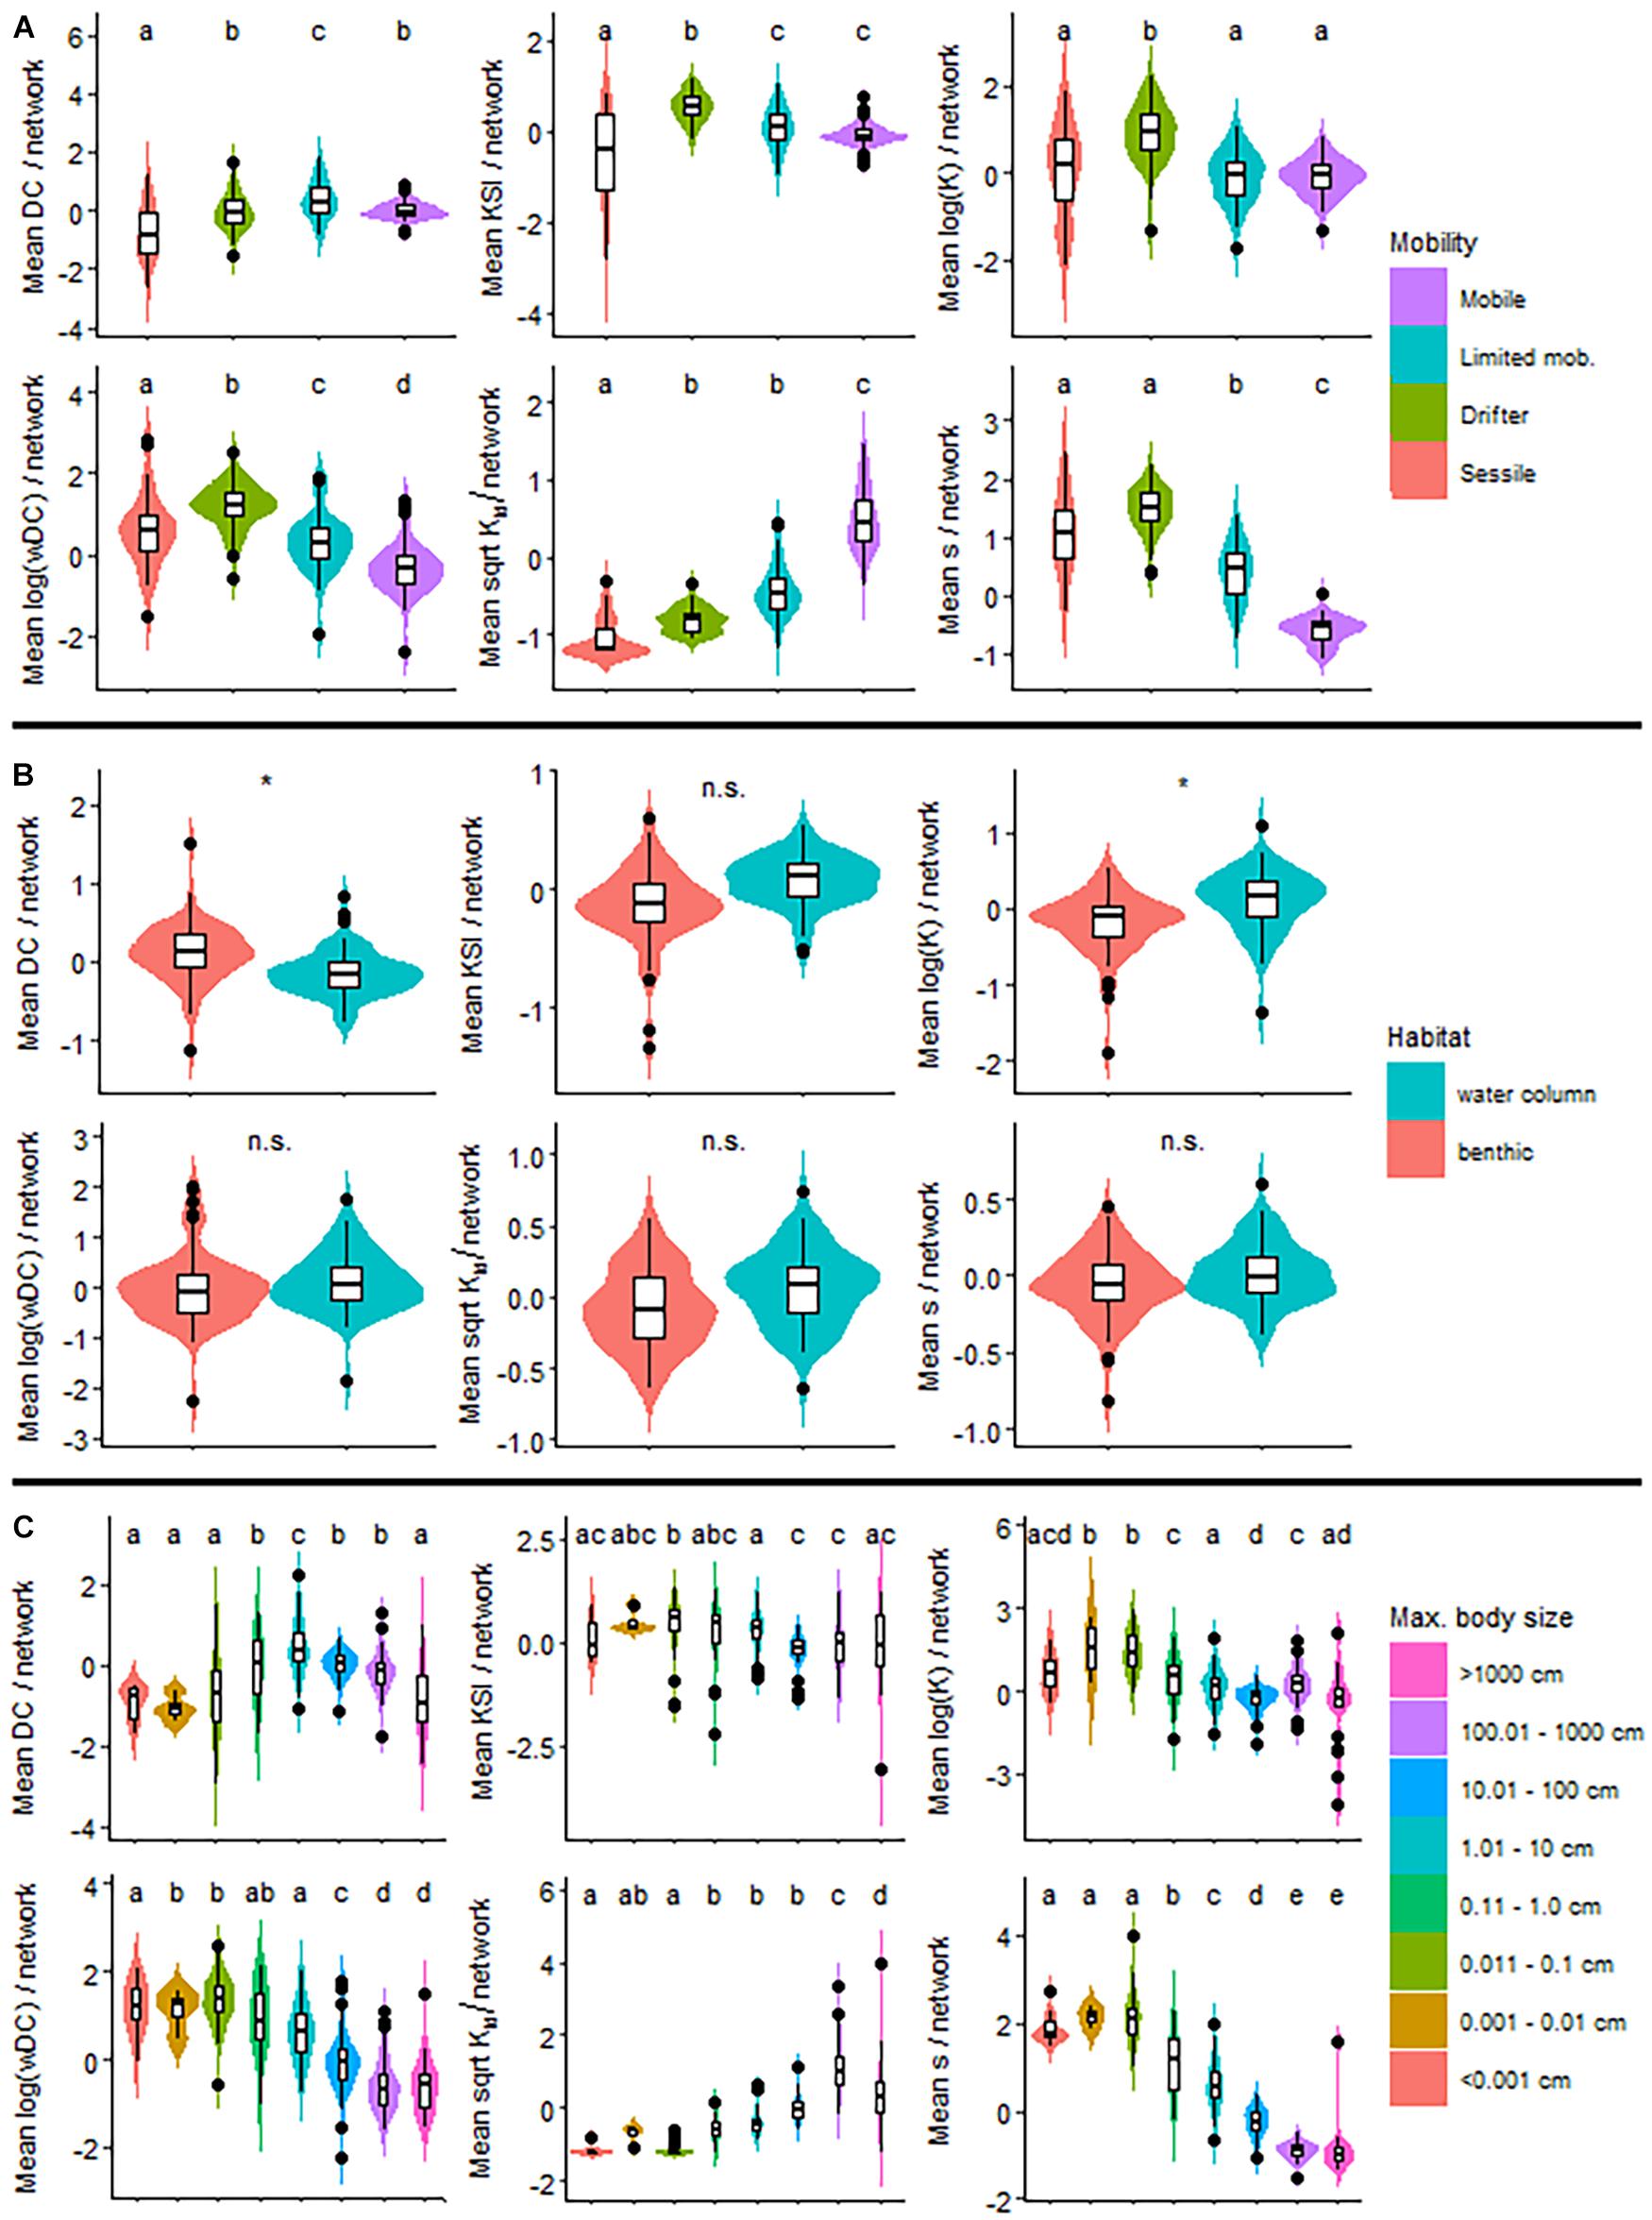
Figure 4. The distribution of index values for trait categories. One representative index (DC, KSI, logK, logwDC, sqrtKtd, and s) is used for each of the six clusters in the dendrogram on Figure 1. Traits are mobility (A), habitat (B), and size (C). * indicates significant difference between habitat categories. For each of the 18 indices, separately, see the same information in Supplementary Material D.
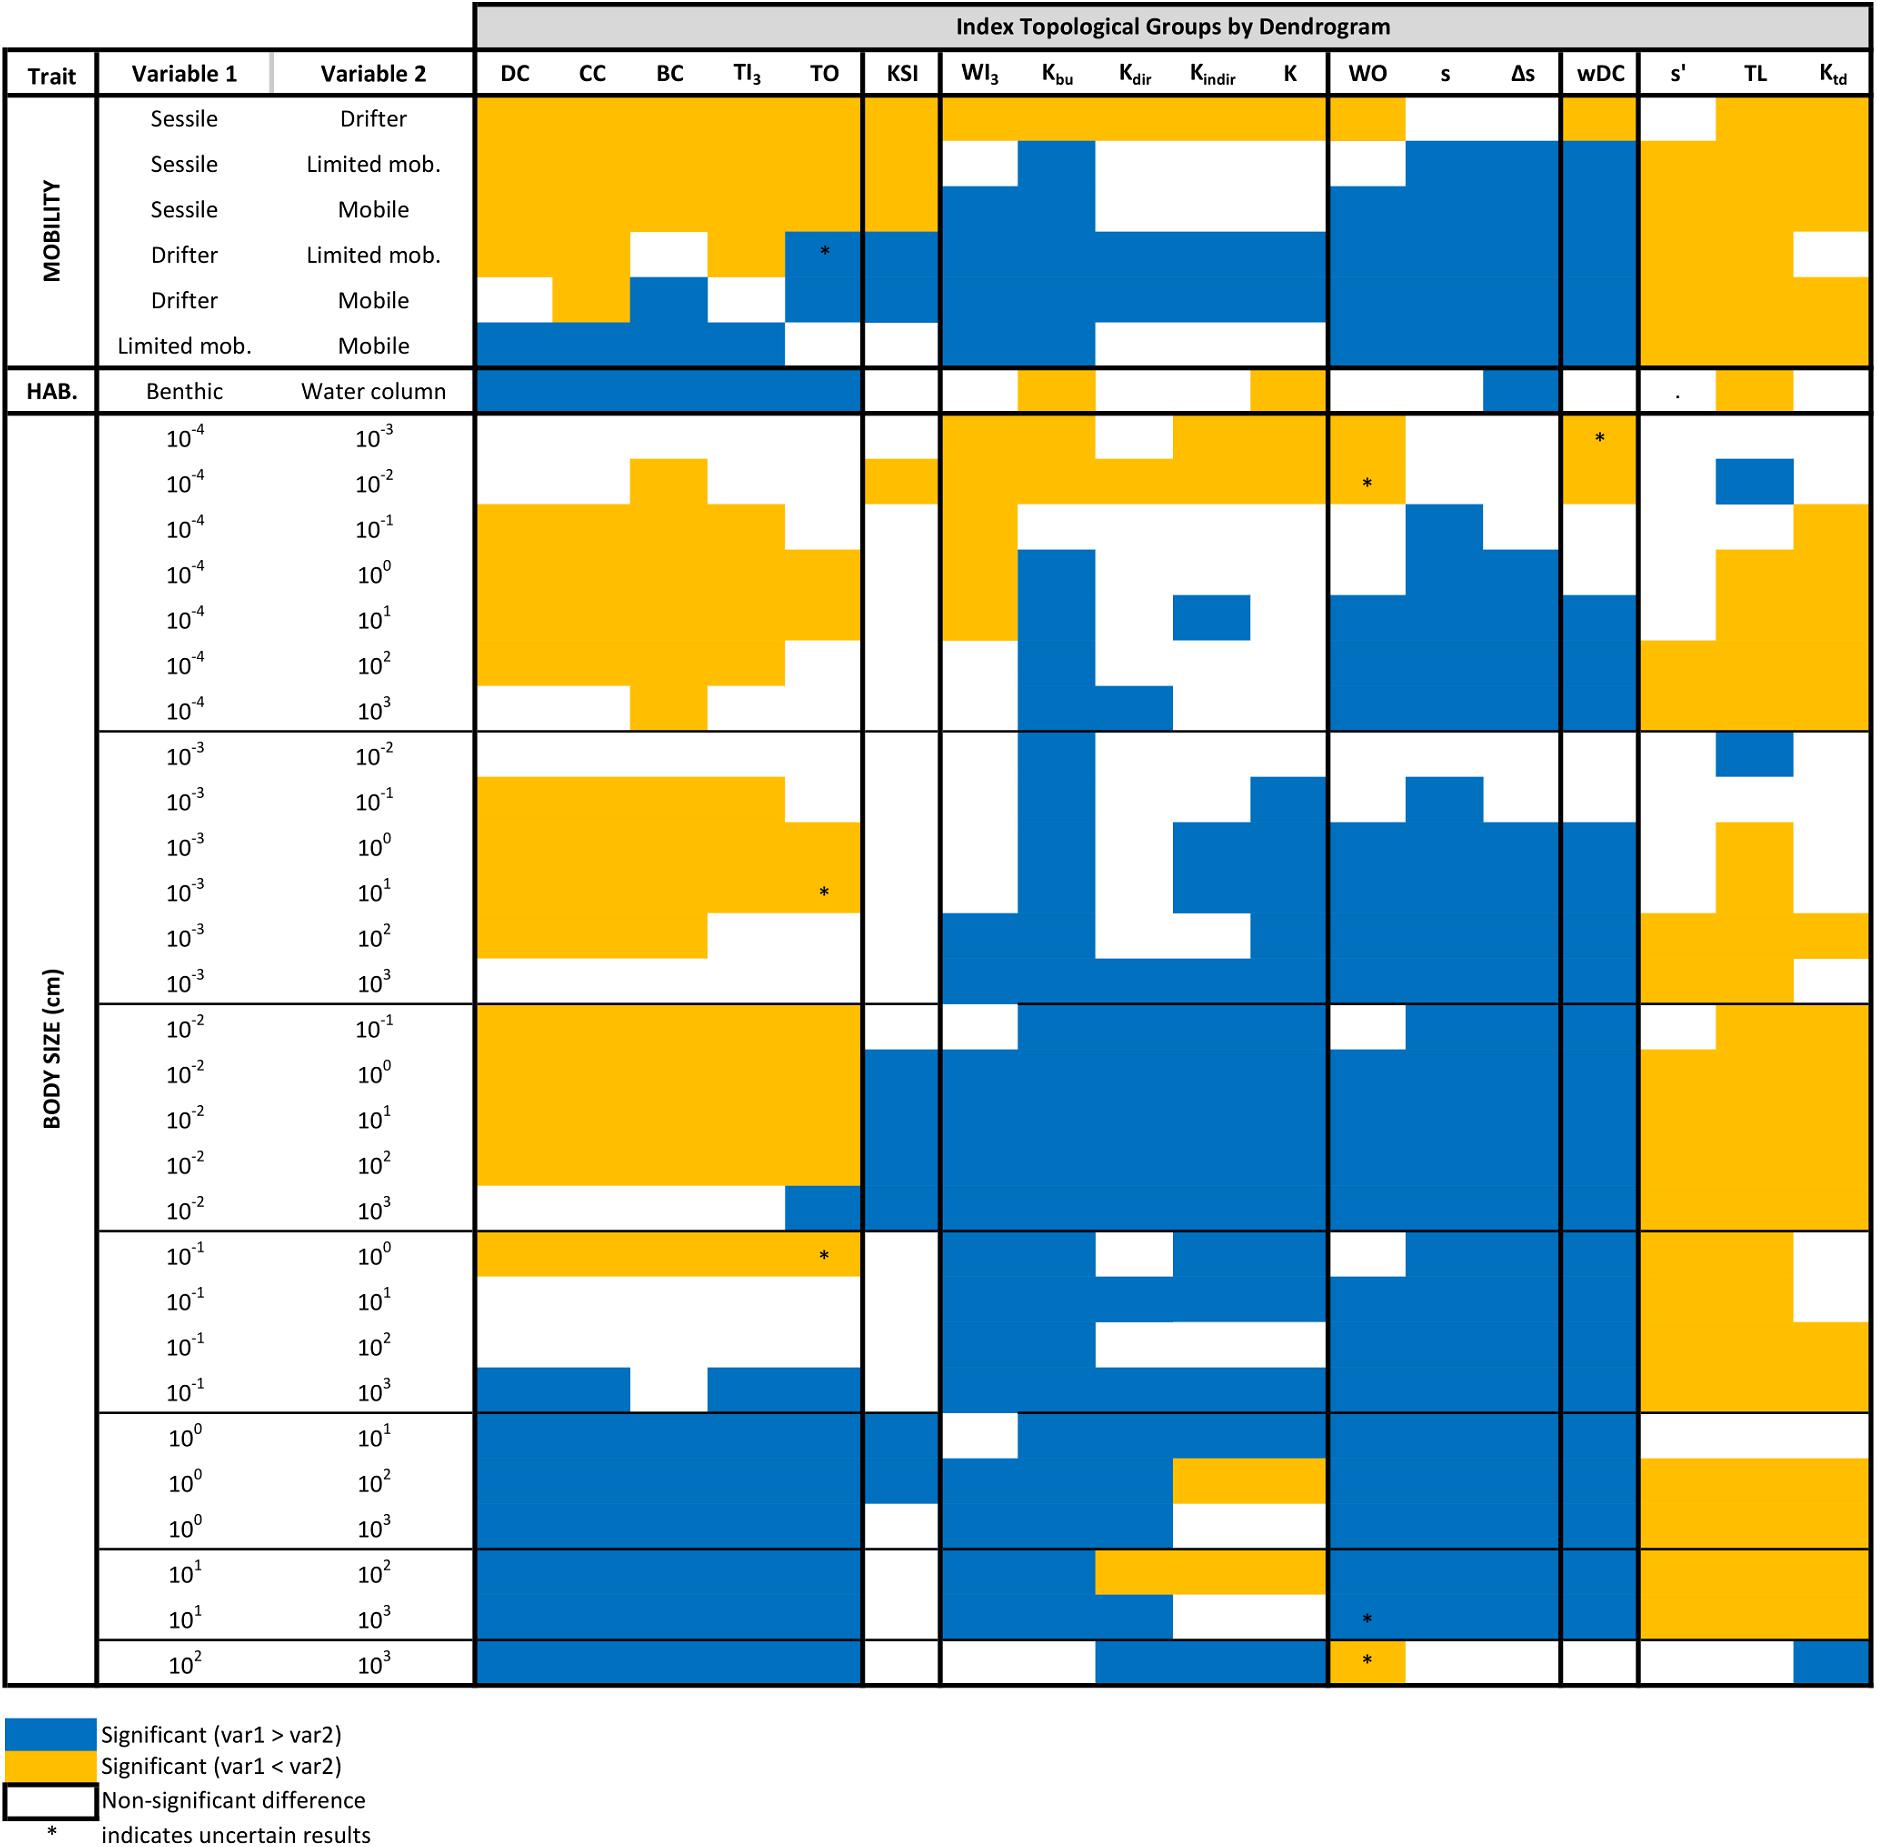
Figure 5. The relevance of each topological index for separating each possible pair of trait values. Significant differences between the topological positions of nodes with different trait categories are marked by colors. For example, the first row shows that DC is different for sessile and drifter organisms but does not separate them.
For mobility, pairwise comparisons are almost always significant, especially for weighted (wDC and WI3) and top-down indices (TL, ss′, and Ktd) (Figure 5). Weighted indices emphasize drifter organisms, while top-down indices draw attention to mobile organisms. This is nicely visible in Figure 4A and in the violin plots of Supplementary Material D. Centrality indices highlight limited mobility animals. All other groups suggest the importance of drifters. Therefore, depending on what index we utilize, we can predict different groups with the mobility trait. Naturally, a balanced description of a network using one-two indices from each of the six groups is the best. For the mobility trait, groups 3, 4, and 5 are very similar and could be combined in the functional sense (see violin plots in Supplementary Material D).
The habitat trait only had two categories and is less useful in predicting the difference between groups (Figure 4B). Centrality indices were significantly larger values in the benthic than in the water column habitat (Figure 5). The TL, K, and Kbu indices were the opposite (benthic < water column). All other indices had no significant difference between habitat preference of the organisms (Figure 5 and Supplementary Material D). It is somewhat difficult to interpret the biological meaning of these results. With too few, or too many categories, it becomes difficult to interpret the results. Simple traits, such as this one could be useful combined with other studies.
The third categorical trait, size had the opposite problem (with having many, eight categories). This trait behaved in a similar manner as the mobility trait (Figure 4C). Weighted indices along with the third and fourth index clusters highlight small organisms (0.001–0.1 cm), most likely a reiteration of the drifter mobility category. The keystoneness index (KSI) is not significant in relation to differences in size categories. The centrality cluster seems to favor medium-sized categories (1–10 cm) and top-down indices points out the large-sized groups (>10 cm) (Figure 4C and Supplementary Material D).
To summarize, mobility was the most reliable trait (>80% pairwise comparisons showing significant differences) and worked best combined with top-down (TL and Ktd) or weighted indices (wDC). The size trait showed significant differences between 70% of pairs. Finally, habitat trait was only significant about 50% of the time (although works well for all centrality indices) (Figure 5). Regarding the relationships between the analyzed traits, all trait-combinations were significantly dependent (Chi-squared test and Fisher’s exact test, p < 0.001).
Conclusion
The major component of sustainability is proper ecosystem functioning and different organisms play their distinct roles in ecosystems. Ecological roles and positions are interdependent, so studying food web position can help to assess functional importance. We addressed the question what kind of organisms (in terms of various traits) occupy what kinds of food web positions (in terms of various centrality indices).
Earlier work on the relationships between food web properties and ecosystem types provided valuable information on the use of indicators at the system level (Heymans et al., 2014). Here, we elaborated this kind of approach at the local level of organisms (trophic groups). The combination of a rich description of network position and the parallel analysis of multiple traits offers a way to improve ecological indication and predictive food web modeling.
For our analysis, it was crucial to set high standards for comparability. The EwE food web database is based on a constant and rigorous modeling approach (similar trophic components across food webs), the way of aggregation is also consistent (stronger at lower levels, e.g., phytoplankton) and mixed-effect models showed that networks (as random effects in the models) had zero or negligible explanatory power due to variance being around zero in most cases (n = 13 indices). The variance due to random effects (networks) was largest for five indices (BC, TO, WO, wDC, and Kindir), but still of minor importance (<0.30).
Our findings agree with the suggestions of Costello et al. (2015) that mobility and size should be included in describing aquatic systems. Some of the results are thus quite intuitive (e.g., more mobile organisms at the top of the food web): these are only confirmed and quantified by the present, large-scale statistical analysis. Other results may be more surprising, like the importance of benthic organisms in the food webs. These species or groups of species are fundamental for transferring matter and energy from the sea bottom to the water column through trophic flows contrasting the natural gravity-related flows and thus contributing to the cycling of energy and matter. Quantification and statistical significance are the ways for robust predictions.
Our study connects theoretical, network-based indicators of ecological role (i.e., topological position) and practical, ecologically meaningful categorizations (i.e., traits). Exploring this bridge is essential for giving the appropriate value to theoretical works also in supporting practical applications (Longo et al., 2015). Notably, the importance of such bridge is testified by the large discussions going on for finding the appropriate measures (Tam et al., 2017) to use in evaluating good environmental status for descriptor D4 (food webs) in the Marine Strategy Framework Directive (EU MSFD, 2008).
Certain pairs of centrality indices are consistently similar in different studies. For example, the weighted indices tend to provide similar node ranks (Jordán et al., 2006; Lai et al., 2015) with only a few exceptions (see Jordán et al., 2007). Closeness centrality is less predictable: it can be quite close (Jordán et al., 2006) or quite far (Lai et al., 2015) from degree. The classification depends also on whether it is based on ranks or distributions (Bauer et al., 2010).
It remains important to investigate what other traits are of potential significance in aquatic ecosystems (e.g., diet) and if the index-trait relationships vary by ecosystems (e.g., estuary versus reef). Research in trait-based aquatic food webs is ongoing (Boukal, 2014) and effort should be made that trait databases are standardized (Kremer et al., 2017) and comparable across environments like freshwater to marine plankton (Weithoff and Beisner, 2019) and scales like megafauna (Tavares et al., 2019). The identification of relevant traits is an ongoing process. Simple, yet descriptive traits (as demonstrated here) can successfully supplement food web research. The choice and the relevance of traits largely depend on the resolution of the food web: for more resoluted networks, a number of traits can be used that make no sense or cannot be obtained for highly aggregated trophic networks. Yet, aggregation and using only the most basic traits make cross-system comparison feasible. Very sophisticated traits cannot be defined for a large number of species, only for a smaller taxonomic neighborhood.
With large databases, both biological information on organisms (e.g., size) and their characterization in a system context (e.g., centrality) can be richly described. Novel algorithms (e.g., machine learning) can further help in the future to provide quantitative analyses and to reveal hidden patterns. This way, trait-based analyses have a chance to offer more than just re-discovering biological knowledge in silico (Endrédi et al., 2018a). Combinations of traits, as a major future task, can be more informative than looking at them separately.
Contributing to the predictive power of food web modeling, by combining biological information and systems analysis, may help to understand and support the management of invasive species. Their trophic and other properties are partly known and but can also be adapted to some extent during invasion. The rules and their limits can be better understood by the present research.
Although the database we used is the largest one in community ecology, described by the highest standards for comparability, it is still loaded by the traditional problems of food web research. Aggregation (defining the nodes) and weighting (defining the links) are always problematic. It will be a interesting question for future research, whether and how omics data can provide larger, more reliable information (Lima-Mendez et al., 2015; Guidi et al., 2016; D’Alelio et al., 2019) and whether this can completely replace or only complement the information we have today.
Data Availability Statement
The original contributions presented in the study are included in the article/Supplementary Material, further inquiries can be directed to the corresponding author/s.
Author Contributions
FJ, AE, and KP designed and evaluated the results, and wrote the manuscript. SL, AE, and KP managed the database. AE performed network analysis. KP and JP performed the statistical analysis. JP and SL provided comments on the manuscript. All authors contributed to the article and approved the submitted version.
Funding
Research of AE and FJ was supported by the National Research, Development and Innovation Office – NKFIH, grant GINOP-2.3.2-15-2016-00057. FJ and SL acknowledge funding received from the European Union’s Horizon 2020 Research and Innovation Program as part of the AtlantECO project under grant agreement no. 862923.
Author Disclaimer
This output reflects only the author’s view and the European Union cannot be held responsible for any use that may be made of the information contained therein.
Conflict of Interest
The authors declare that the research was conducted in the absence of any commercial or financial relationships that could be construed as a potential conflict of interest.
Publisher’s Note
All claims expressed in this article are solely those of the authors and do not necessarily represent those of their affiliated organizations, or those of the publisher, the editors and the reviewers. Any product that may be evaluated in this article, or claim that may be made by its manufacturer, is not guaranteed or endorsed by the publisher.
Acknowledgments
We thank Imre Sándor Piross for valuable comments related to the data analysis.
Supplementary Material
The Supplementary Material for this article can be found online at: https://www.frontiersin.org/articles/10.3389/fmars.2021.636042/full#supplementary-material
References
Agnetta, D., Badalamenti, F., Colloca, F., D’Anna, G., Di Lorenzo, M., Fiorentino, F., et al. (2019). Benthic-pelagic coupling mediates interactions in mediterranean mixed fisheries: an ecosystem modeling approach. PLoS One 14:e0210659. doi: 10.1371/journal.pone.0210659
Baranyi, G., Saura, S., Podani, J., and Jordán, F. (2011). Contribution of habitat patches to network connectivity: redundancy and uniqueness of topological indices. Ecol. Indic. 11, 1301–1310. doi: 10.1016/j.ecolind.2011.02.003
Bates, D., Maechler, M., Bolker, B., and Walker, S. (2015). Fitting linear mixed-effects models using lme4. J. Statist. Soft. 67, 1–48. doi: 10.18637/jss.v067.i01
Bauer, B., Jordán, F., and Podani, J. (2010). Node centrality indices in food webs: rank orders versus distributions. Ecol. Compl. 7, 471–477. doi: 10.1016/j.ecocom.2009.11.006
Bond, W. J. (1994). “Keystone species,” in Biodiversity and Ecosystem Function, eds E. D. Schulze and H. A. Mooney (Berlin: Springer).
Borgatti, S. P., Everett, M. G., and Freeman, L. C. (2002). Ucinet for Windows: Software for Social Network Analysis. Cambridge, MA: Analytic Technologies, Harvard.
Boukal, D. (2014). Trait- and size-based descriptions of trophic links in freshwater food webs: current status and perspectives. J. Limnol. 73, 171–185.
Christensen, V., and Walters, C. J. (2004). Ecopath with ecosim: methods, capabilities andlimitations. Ecol. Mod. 172, 109–139. doi: 10.1016/j.ecolmodel.2003.09.003
Colléter, M., Valls, A., Guitton, J., Morissette, J., Arreguín-Sánchez, F., Christensen, V., et al. (2013). EcoBase: a repository solution to gather and communicate information from EwE models. Fish. Centre Res. Rep. 2013:60.
R Core Team (2020). R: A Language and Environment for Statistical Computing. Vienna: R Foundation for Statistical Computing.
Costello, M. J., Claus, S., Dekeyzer, S., Vandepitte, L., Tuama, E. O., Lear, D., et al. (2015). Biological and ecological traits of marine species. PeerJ 3:e1201. doi: 10.7717/peerj.1201
D’Alelio, D., Eveillard, D., Coles, V. J., Caputi, L., Ribera d’Alcalà, M., and Iudicone, D. (2019). Modelling the complexity of plankton communities exploiting omics potential: from present challenges to an integrative pipeline. Curr. Opin. Syst. Biol. 19, 68–74. doi: 10.1016/j.coisb.2018.10.003
Endrédi, A., Jordán, F., and Abonyi, A. (2018a). Trait-based paradise - or only feeding the computer with biology? Commu. Ecol. 19, 319–321. doi: 10.1556/168.2018.19.3.13
Endrédi, A., Senánszky, V., Libralato, S., and Jordán, F. (2018b). Food web dynamics in trophic hierarchies. Ecol. Mod. 368, 94–103. doi: 10.1016/j.ecolmodel.2017.11.015
EU MSFD (2008). Directive 2008/56/EC of the European Parliament and of the Council of 17 June 2008 Establishing a Framework for Community Action in the Field of Marine Environmental Policy (Marine Strategy Framework Directive). Brussels: Official Journal of the European Union.
FishBase (2020). eds R. Froese and D. Pauly. www.fishbase.org.
Guidi, L., Chaffron, S., Bittner, L., Eveillard, D., Larhlimi, A., Roux, S., et al. (2016). Plankton networks driving carbon export in the oligotrophic ocean. Nature 532, 465–470. doi: 10.1038/nature16942
Heymans, J. J., Coll, M., Libralato, S., Morissette, L., and Christensen, V. (2014). Global patterns in ecological indicators of marine food webs: a modelling approach. PLoS One 9:e95845. doi: 10.1371/journal.pone.0095845
Heymans, J. J., Coll, M., Link, J. S., Mackinson, S., Steenbeek, J., Walters, C., et al. (2016). Best practice in Ecopath with Ecosim food-web models for ecosystem-based management. Ecol. Mod. 331, 173–184. doi: 10.1016/j.ecolmodel.2015.12.007
Jordán, F., Benedek, Z., and Podani, J. (2007). Quantifying positional importance in food webs: a comparison of centrality indices. Ecol. Mod. 205, 270–275. doi: 10.1016/j.ecolmodel.2007.02.032
Jordán, F., Liu, W. C., and Davis, A. J. (2006). Topological keystone species: measures of positional importance in food webs. Oikos 112, 535–546. doi: 10.1111/j.0030-1299.2006.13724.x
Jordán, F., Liu, W. C., and Mike, Á (2009). Trophic field overlap: a new approach toquantify keystone species. Ecol. Mod. 220, 2899–2907. doi: 10.1016/j.ecolmodel.2008.12.003
Jordán, F., Liu, W. C., and van Veen, F. J. F. (2003). Quantifying the importance of species and their interactions in a host-parasitoid community. Commun. Ecol. 4, 79–88. doi: 10.1556/comec.4.2003.1.12
Jordán, F., Takács-Sánta, A., and Molnár, I. (1999). A reliability theoretical quest for keystones. Oikos 86, 453–462. doi: 10.2307/3546650
Kassambara, A. (2019). ggcorrplot: Visualization of a Correlation Matrix Using ‘ggplot2’. R Package Version 0.1.3.
Kremer, C. T., Williams, A. K., Finiguerra, M., Fong, A. A., Kellerman, A., Paver, S. F., et al. (2017). Realizing the potential of trait-based aquatic ecology: new tools and collaborative approaches. Limnol. Oceanogr. 62, 253–271. doi: 10.1002/lno.10392
Kuznetsova, A., Brockhoff, P. B., and Christensen, R. H. B. (2017). lmerTest package: tests in linear mixed effects models. J. Statist. Soft. 82, 1–26.
Lai, S. M., Liu, W. C., and Jordán, F. (2015). A trophic overlap-based measure for species uniqueness in ecological networks. Ecol. Mod. 299, 95–101. doi: 10.1016/j.ecolmodel.2014.12.014
Libralato, S., Christensen, V., and Pauly, D. (2006). A method for identifying keystonespecies in food web models. Ecol. Mod. 195, 153–171. doi: 10.1016/j.ecolmodel.2005.11.029
Lima-Mendez, G., Faust, K., Henry, N., Decelle, J., Colin, S., Carcillo, F., et al. (2015). Determinants of community structure in the global plankton interactome. Science 348:1262073.
Longo, C., Hornborg, S., Bartolino, V., Tomczak, M. T., Ciannelli, L., Libralato, S., et al. (2015). Role of trophic models and indicators in current marine fisheries management. Mari. Ecol. Prog. Ser. 538, 257–272. doi: 10.3354/meps11502
Luczkovich, J. J., Borgatti, S. P., Johnson, J. C., and Everett, M. G. (2003). Defining and measuring trophic role similarity in food webs using regular equivalence. J. Theor. Biol. 220, 303–321. doi: 10.1006/jtbi.2003.3147
Marcogliese, D. J., and Cone, D. K. (1997). Food webs: a plea for parasites. Trends Ecol. Evolu. 12, 320–325. doi: 10.1016/s0169-5347(97)01080-x
Mills, L. S., Soulé, M. E., and Doak, D. F. (1993). The keystone-species concept in ecology and conservation. BioScience 43, 219–224. doi: 10.2307/1312122
Paine, R. T. (1966). Food web complexity and species diversity. Am. Nat. 100, 65–75. doi: 10.1086/282400
Paine, R. T. (1969). The pisaster-tegula interaction: prey patches, predator food preference, and intertidal community structure. Ecology 50, 950–961. doi: 10.2307/1936888
Pereira, J., Saura, S., and Jordán, F. (2017). Single-node versus multi-node centrality in landscape graph analysis: key habitat patches and their protection for twenty birds in NE Spain. Methods Ecol. Evolu. 8, 1458–1467. doi: 10.1111/2041-210X.12783
Pinnegar, J. K., and Polunin, N. V. C. (2004). Predicting indirect effects of fishing in Mediterranean rocky littoral communities using a dynamic simulation model. Ecol. Modell. 172, 249–267. doi: 10.1016/J.ECOLMODEL.2003.09.010
Podani, J. (2001). SYNTAX 2000. Computer Programs for Data Analysis in Ecology and Systematics. Budapest: Scientia Publishing.
Power, M. E., Tilman, D., Estes, J. A., Menge, B. A., Bond, W. J., Mills, L. S., et al. (1996). Challenges in the quest for keystones: identifying keystone species is difficultbut essential to understanding how loss of species will affect ecosystems. BioScience 46, 609–620.
Scotti, M., and Jordán, F. (2010). Relationships between centrality indices and trophic positions in food webs. Commun. Ecol. 11, 59–67. doi: 10.1556/comec.11.2010.1.9
SeaLifeBase (2020). eds M. L. D. Palomares and D. Pauly. www.sealifebase.org.
Sieburth, J. McN, Smetacek, V., and Lenz, J. (1978). Pelagic ecosystem structure: heterotrophic compartments of the plankton and their relationship to plankton size fractions. Limnol. Oceanogr. 23, 1256–1263. doi: 10.4319/lo.1978.23.6.1256
Sokal, R. R., and Rohlf, F. J. (1962). The comparison of dendrograms by objective methods. Taxon 11, 33–40. doi: 10.2307/1217208
Tam, J. C., Link, J. S., Rossberg, A. G., Rogers, S. I., Levin, P. S., Rochet, M. J., et al. (2017). Towards ecosystem-based management: identifying operational food-web indicators for marine ecosystems. ICES J. Mari. Sci. 74, 2040–2052. doi: 10.1093/icesjms/fsw230
Tavares, D. C., Moura, J. F., Acevedo-Trejos, E., and Merico, A. (2019). Traits shared by marine megafauna and their relationships with ecosystem functions and services. Front. Mari. Sci. 6:262.
Valentini, R., and Jordán, F. (2010). CoSBiLab graph: the network analysis module of CoSBiLab. Environ. Mod. Soft. 25, 886–888. doi: 10.1016/j.envsoft.2010.02.001
Wasserman, S., and Faust, K. (1994). Social Network Analysis: Methods and Applications. New York: Cambridge University Press.
Keywords: food web, traits, network position, centrality, keystones, Ecopath with Ecosim
Citation: Endrédi A, Patonai K, Podani J, Libralato S and Jordán F (2021) Who Is Where in Marine Food Webs? A Trait-Based Analysis of Network Positions. Front. Mar. Sci. 8:636042. doi: 10.3389/fmars.2021.636042
Received: 30 November 2020; Accepted: 23 August 2021;
Published: 22 September 2021.
Edited by:
Heliana Teixeira, University of Aveiro, PortugalReviewed by:
Nathalie Niquil, Centre National de la Recherche Scientifique (CNRS), FranceMauro Sinopoli, Stazione Zoologica Anton Dohrn Napoli, Italy
Copyright © 2021 Endrédi, Patonai, Podani, Libralato and Jordán. This is an open-access article distributed under the terms of the Creative Commons Attribution License (CC BY). The use, distribution or reproduction in other forums is permitted, provided the original author(s) and the copyright owner(s) are credited and that the original publication in this journal is cited, in accordance with accepted academic practice. No use, distribution or reproduction is permitted which does not comply with these terms.
*Correspondence: Ferenc Jordán, am9yZGFuLmZlcmVuY0BnbWFpbC5jb20=
†These authors share first authorship