 Stefanie M. Colombo1*
 Mohamed Emam2
 Brian C. Peterson3
 Jennifer R. Hall4
 Gary Burr3Zeyu Zhang1
 Matthew L. Rise2
- 1Department of Animal Science and Aquaculture, Dalhousie University, Truro, NS, Canada
- 2Department of Ocean Sciences, Memorial University of Newfoundland, St. John’s, NL, Canada
- 3United States Department of Agriculture, Agriculture Research Service, National Cold Water Marine Aquaculture Center, Orono, ME, United States
- 4Aquatic Research Cluster, CREAIT Network, Ocean Sciences Centre, Memorial University of Newfoundland, St. John’s, NL, Canada
Selection efforts focused on adaptation to plant-based diets, particularly the ability to synthesize polyunsaturated fatty acids (PUFA), are now emerging in aquaculture. Landlocked salmon (Grand Lake population; GL) may differ from the commercial Saint John River (SJR) strain in terms of PUFA metabolism. The objective of this study was to determine if GL salmon can contribute toward broodstock selection for enhanced PUFA synthesis. Two diets containing either fish oil (FO) or plant-based oil (FO-free) were fed to the SJR and GL strains (∼58 g/fish) for 16 weeks. Growth, liver, and muscle fatty acid (FA) content, and transcript expression of lipid metabolism and inflammation-related genes were evaluated. GL salmon fed the FO diet showed reduced growth compared to SJR salmon (fed either diet); however, GL salmon fed the FO-free diet, growth was not significantly different compared to any group. In liver, SJR salmon fed the FO-free diet had higher levels of n-6 PUFAs (21.9%) compared to GL fed the same diet (15.9%); while GL salmon fed the FO-free diet had higher levels of monounsaturated FAs (48.9%) compared with SJR salmon fed the same diet (35.7%). 20:5n-3 and 22:6n-3 were the same in GL and SJR salmon liver and muscle, respectively, fed the FO-free diet. In liver, GL salmon fed the FO-free diet had higher acac and acly compared to all treatments and had higher fasb compared to both strains fed the FO-diet. GL salmon fed the FO-free diet had higher cd36c and fabp3b in liver compared to GL salmon fed the FO diet and SJR salmon fed either diet. GL salmon fed the FO-free diet had higher lect2a and pgds in liver compared to SJR salmon fed the FO-free diet. In muscle, GL salmon fed the FO-free diet had higher fadsd5 and fadsd6b compared with both strains fed the FO diet. These results suggest there is a genetic basis behind the potential for GL salmon to utilize FO-free diets more efficiently than SJR salmon, with regards to FA metabolism.
Introduction
In North America, the Saint John River (SJR) strain of Atlantic salmon (Salmo salar L.) has been developed commercially since 1984 (Friars et al., 1995; Gjøen and Bentsen, 1997). Broodstock selection efforts have focused on genetic improvement of this anadromous strain, for pertinent production traits such as harvest weight and growth (Schaeffer et al., 2018), disease resistance (Holborn et al., 2018; Holborn et al., 2020), and late sexual maturation (Boulding et al., 2019). However, selection of other traits, such as improved nutrient utilization, has yet to be included in commercial broodstock programs. The generation of SJR salmon that more efficiently utilize the nutrients provided in the diet is important from an aquaculture sustainability perspective.
Diets for farmed Atlantic salmon have evolved considerably over the past 30 years, for environmental and economic reasons, from ones that were largely composed of wild-sourced fish meal (FM) and fish oil (FO), to ones that are much higher (>70% of the diet) in plant-based proteins and lipids (Ytrestøyl et al., 2015; Colombo, 2020). Dietary FO typically supplies the omega-3 (n-3) long chain polyunsaturated fatty acids (LC-PUFA), namely eicosapentaenoic acid (EPA; 20:5n-3) and docosahexaenoic acid (DHA; 22:6n-3), which are essential for vertebrates. They play an important role in various physiological and biochemical processes, with EPA involved in inflammation and DHA involved in neural development and functioning (Arts et al., 2001; Tocher, 2015). These are normally acquired in the diet of wild Atlantic salmon and are required at 1–2% of the diet for farmed salmon (National Research Council [NRC], 2011; Bou et al., 2017; Qian et al., 2020). FO derived from wild fisheries is rich in EPA and DHA, hence why it is the major source of these essential LC-PUFA in commercial salmon feeds. Terrestrial plants do not naturally produce n-3 LC-PUFA (Hixson et al., 2015). This is problematic for a carnivorous, anadromous species like Atlantic salmon, as these essential nutrients, that are normally provided by fish prey (in the wild) and FO (in aquafeeds), are lacking in plant-based ingredients (Tocher, 2015; Colombo, 2020). In aquaculture, this creates a mismatch between the nutrients in the diet (particularly the lack of n-3 LC-PUFA) and what is required by the fish for health and growth. With little to no opportunity to naturally adapt to this change, this presents an opportunity to explore the genetic potential to improve the SJR strain to better adapt to sustainable, plant-based diets without compromising health, growth, and other production traits. Production of superior farmed fish that thrive on sustainable, plant-based diets, without the need to source n-3 LC-PUFA from the wild, is a next logical research area in salmon aquaculture.
In nature, the SJR population is an anadromous strain, with migratory patterns beginning from hatch in the Saint John River in New Brunswick, Canada, followed by smoltification and migration to the Bay of Fundy before they return to the Saint John River to spawn (McCormick et al., 1998; Marshall, 2014). However, for some populations of Atlantic salmon, anadromy became impossible thousands of years ago; when glaciers retreated, rates of isostatic rebound were high, rendering these populations stuck within newly formed lakes, without access to marine waters (Lumme et al., 2016). Native populations of these landlocked Atlantic salmon are distributed in northeastern North America and northern Europe (Hutchings et al., 2019). These populations are comparatively identified by the lake to which landlocked salmon inhabit or migrate to feed (Hutchings et al., 2019). It has been described that the life history and phenotypic variation of wild, naturally reproducing landlocked Atlantic salmon is extreme for a vertebrate, compared to their wild, anadromous counterparts (Hutchings et al., 2019). Wild anadromous and non-anadromous (i.e., landlocked) Atlantic salmon differ considerably in terms of life history, natural diet, and environmental conditions (Groot, 1996; Hutchings et al., 2019).
One of the main differences in diet between landlocked and wild anadromous salmon is that freshwater environments have been characterized as possibly poorer in lipid and fatty acid quality than marine environments (Pickova et al., 1999). It is generally known that marine environments are richer in proportion of EPA and DHA, while freshwater environments are richer in proportion of omega-6 (n-6) PUFA (Hixson et al., 2015; Colombo et al., 2017; Parzanini et al., 2020). These differences are indicative of the food sources that are available to salmon among marine and freshwater environments, such as algae, zooplankton, other fish, as well as the influence of terrestrial dietary sources (Gladyshev et al., 2018; Parzanini et al., 2020). Consequently, marine and freshwater fish have specific dissimilarities in their FA profiles (Parzanini et al., 2020). For example, higher EPA and DHA contents in muscle are known to be characteristic of anadromous salmon, in part due to their role as activators of muscle cell metabolism to support fast continuous swimming, especially during long migrations (Gladyshev et al., 2018). On the other hand, freshwater fish (in general) are characterized by relatively high contents of 18:2n-6 (linoleic acid, LNA) and 20:4n-6 (arachidonic acid, ARA) (Parzanini et al., 2020). Generally, the FA composition of fish tissue is determined not only by the type of dietary lipid ingested, but also the ability of the fish to modify that dietary input, by oxidation and/or bioconversion (Tocher, 2010). Thus, the ability of landlocked salmon populations to adapt to a freshwater environment, with a diet that is lower in n-3 LC-PUFA and higher in n-6 PUFA, is of interest as a selectable trait that may prove useful for improving the commercial SJR strain, when fed plant-based diets.
Previous studies suggest that landlocked salmon can synthesize and store more LC-PUFA in muscle tissue compared with their commercial strain counterparts when fed plant-based diets. For example, significantly higher n-3 and n-6 PUFA conversion capacities were found in landlocked parr (Penobscott strain from Maine, United States) than in commercial, anadromous parr (Ormsary strain from Ormsary, Scotland) when fed experimental diets containing various plant oils in place of FO (Rollin et al., 2003). In a follow up study, in which a 42-day feeding trial was conducted using the same strains fed a commercial diet, landlocked salmon fry exhibited a higher growth rate and feed conversion than the commercial anadromous strain, due to higher fat retention (Peng et al., 2003). The results of the study also indicated that DHA in phospholipid is under strong genetic control and that the synthesis and storage capacity is higher in the landlocked strain (Peng et al., 2003). Another study found that landlocked parr (Lake Vanern/Gullspång Swedish strain) had a higher capacity to synthesize n-3 LC-PUFA than the commercial anadromous strain (Aquagen strain, Norwegian national farmed strain), regardless of whether they were fed a FO-based or rapeseed oil-based diet (Betancor et al., 2016). However, the increased biosynthesis activity did not mean the enhancement of n-3 LC-PUFA storage, but notably, the 8-week study may not have captured the full extent of storage potential (Betancor et al., 2016). Taken together, these studies suggest that landlocked populations could provide a highly valuable genetic resource for enhancing farmed Atlantic salmon stocks when fed plant-based diets. However, these studies all investigated various comparisons of commercial European strains with landlocked from different populations; there has yet to be an assessment of the commercial North American SJR strain with a North American landlocked strain.
The objective of this study was to determine if the North American landlocked Atlantic salmon have a better capacity to synthesize and store n-3 LC-PUFA, in the absence of dietary FO, in comparison to the SJR strain. To investigate this, a 2 × 2 factorial nutritional trial was designed using two feeds containing fish oil (FO) or plant-based oil (FO-free) as the added lipid and was tested over 16 weeks in two populations of Atlantic salmon, the commercial Canadian SJR strain and the landlocked strain from Grand Lake, ME, United States (GL strain). Transcript levels of lipid metabolism-relevant genes, FA content of liver and muscle, and fish growth were determined.
Materials and Methods
Experimental Diets
Diets were formulated as isonitrogenous (51.7–51.8%), isolipidic (17.8–18.4%) and isoenergetic, and were produced at the Faculty of Agriculture, Dalhousie University (Truro, NS, Canada). Two experimental diets were produced: a FO control diet and a FO-free diet (Table 1). All diets were extruded using a laboratory extruder to produce 2 mm pellets and stored at −20°C. Diets were analyzed for proximate composition by the Nova Scotia Department of Agriculture (Truro, NS, Canada; Table 1). The FA content of the diets (% of total FA methyl esters, FAME) is presented in Table 2. Overall, the FA profile was significantly different between diets, with the range in FA content (% FAME) dependent on FO inclusion. Total saturated FAs (SFA) were higher in the FO diet (25%) than the FO-free diet (13%), while total monounsaturated FAs (MUFA) were higher in the FO-free diet (57%) compared with the FO diet (38%). Total PUFA was not different between diets. The LC-PUFA (EPA, DHA, ARA) were higher in the FO diet than the FO-free diet, while the 18-carbon PUFA (ALA, LNA) as well as oleic acid (OA; 18:1n-9) were higher in the FO-free diet. The n-3/n-6 ratio was higher in the FO diet (1.33) compared with the FO-free diet (0.37). The EPA/ARA ratio was higher in the FO diet (13.1) compared with the FO-free diet (2.96).
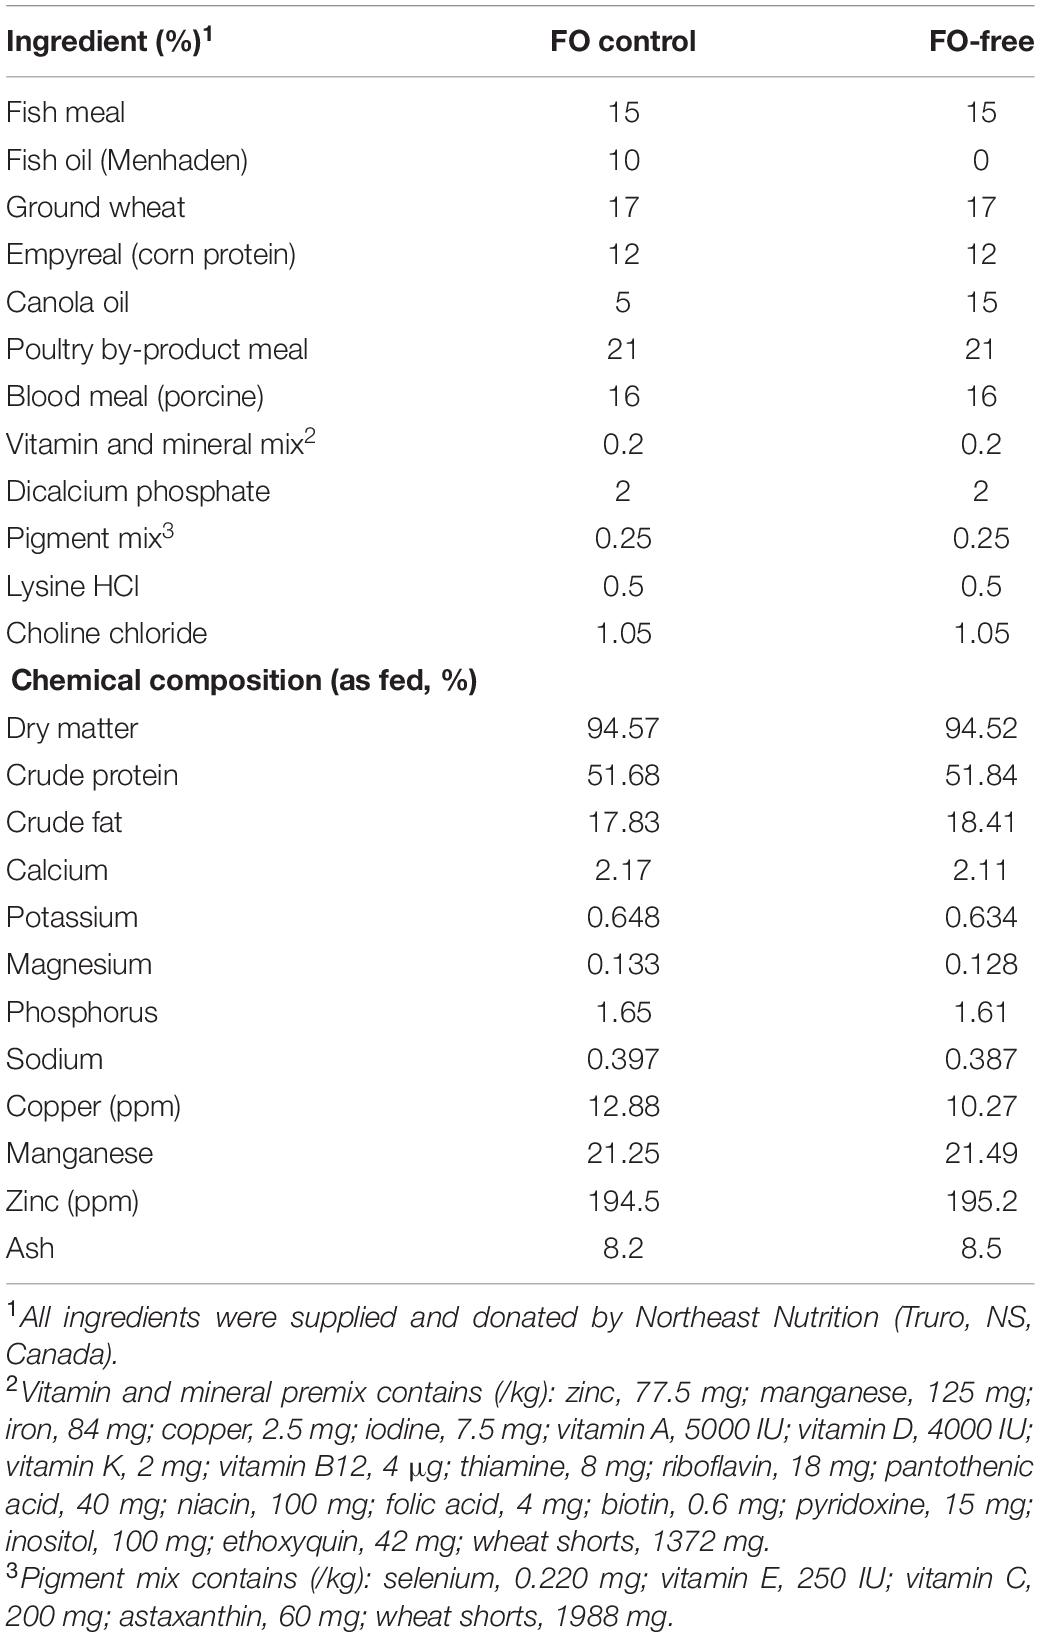
Table 1. Formulation of diets fed to each salmon strain for 16 weeks.
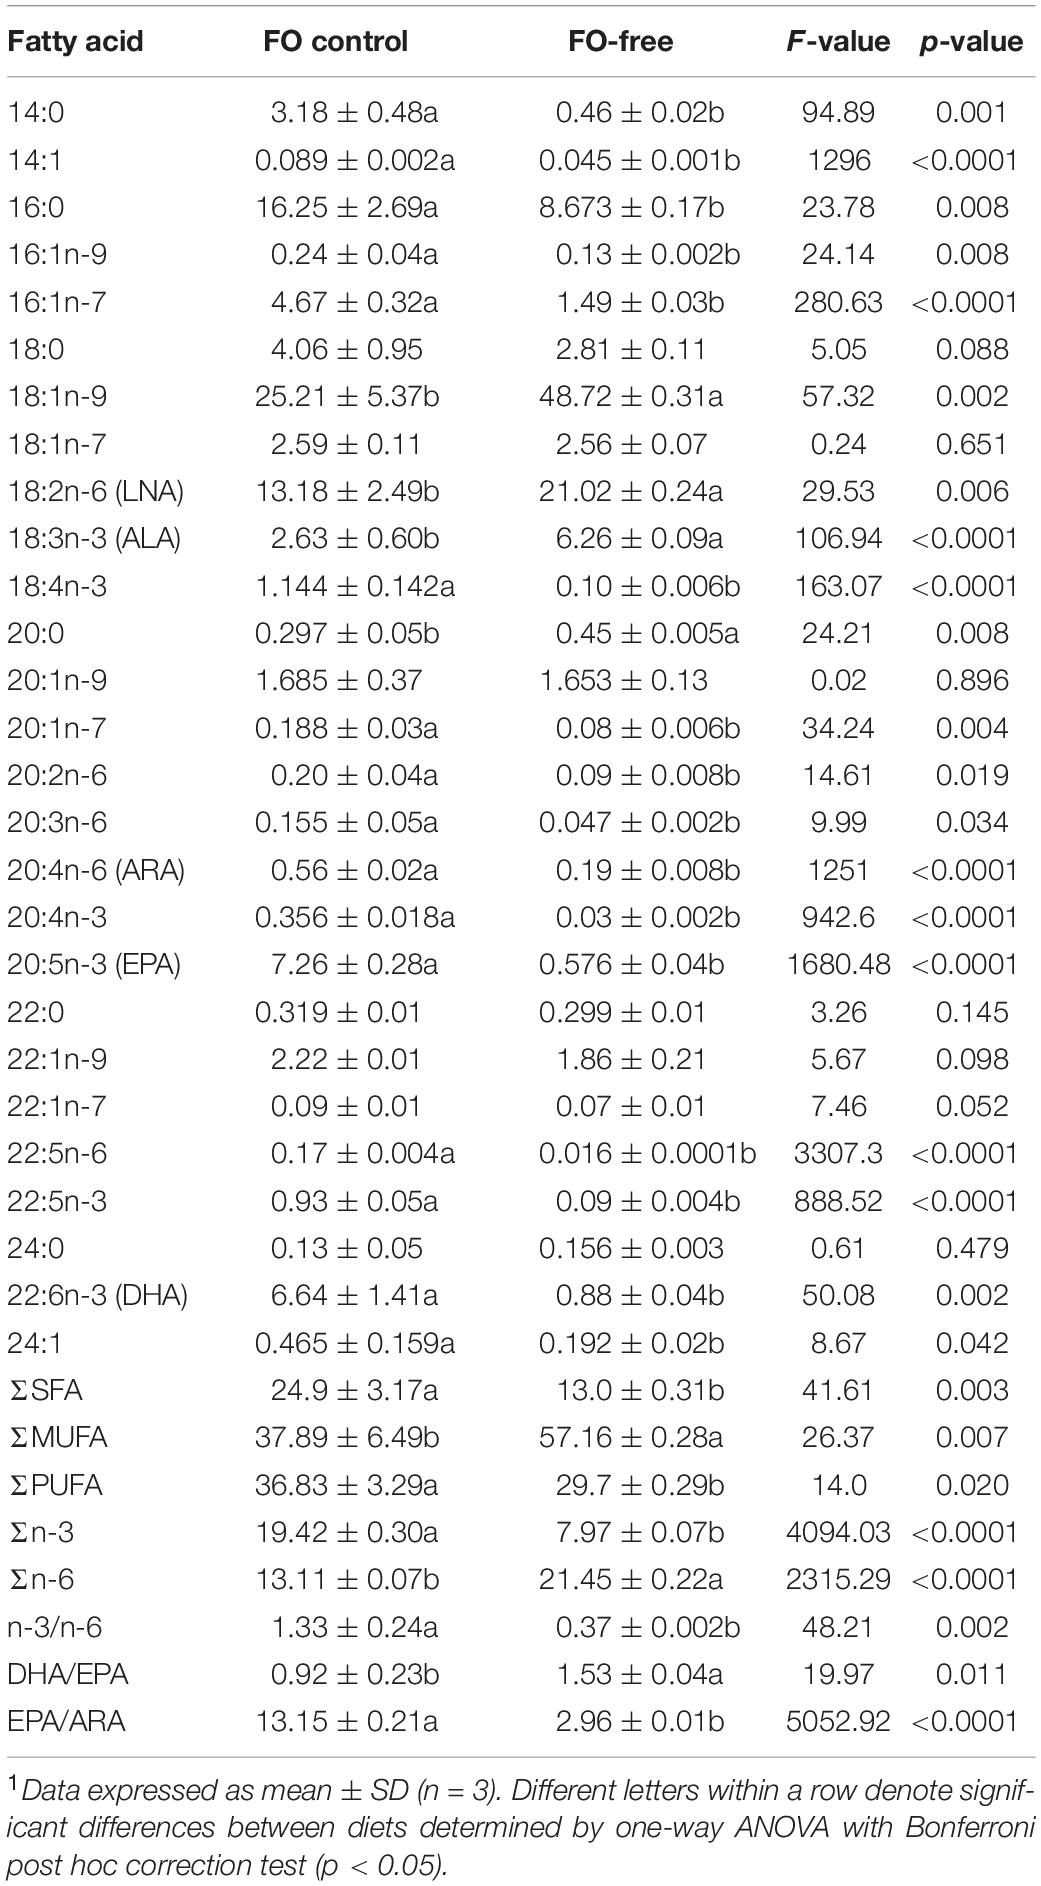
Table 2. Fatty acid profiles (area% FAMES, dry weight) of diets fed to each salmon strain.
Experimental Fish and Feeding Trial
The landlocked strain is from the Grand Lake Stream State Fish Hatchery collected from 2003 to 2005. This is an unselected strain of Atlantic salmon that is used to stock landlocked lakes in Maine by the Maine Department of Inland Fisheries and Wildlife. The current Grand Lake fish are located at the National Cold Water Marine Aquaculture Center (United States Department of Agriculture, Franklin, ME, United States). The commercial SJR strain was originally obtained as eyed eggs from industry stocks from 2003 to 2013. The current stocks have been selected for weight and used in the National Cold Water Marine Aquaculture Center (United States Department of Agriculture, Franklin, ME, United States) broodstock program. The heritability of LC-PUFA production for this stock has been estimated from 0.14 to 0.19, based on three spawns estimating the breeding values. All fish were fed BioTrout (BioOregon, Westbrook, ME, United States) prior to the experiment, and subsequently fed either the FO or FO-free diet. The experiment was set up as 4 strain/diet treatments (2 strains × 2 diets per strain) × 6 tanks per treatment × 40 fish (mean initial weight 57 to 60 g) per tank (n = 960 fish total) and were fed for 16 weeks (to ensure sufficient growth, at least double the initial weight, and tissue turnover to assess fatty acid storage). Salmon were randomly distributed among the 24 experimental tanks (500-L volume), each tank with 40 fish, in the flow-through system. The SJR and GL strain were separated into different tanks. Fish were fed multiple times daily by automatic feeders, at a rate of 1.5% body weight per day. The flow rate was 2–3 L/min, and the photoperiod was natural day length. The dissolved oxygen and water temperature were maintained at 10 mg/L and 12°C, respectively, and monitored daily. Fish were held at a maximum density of 12 kg/m3 by the end of the experiment. Fish were cared for and handled in accordance with the guidelines of the Canadian Council of Animal Care (Dalhousie Institutional approved protocol #2019-010) and the USDA Institutional Animal Care (approved protocol #2019-001).
Fish Sampling
Ten fish per tank were randomly sampled at Week 0 and Week 16. Fish were fasted for 24 h prior to sampling to empty gut contents for accurate weight measurement. Fish were euthanized with an overdose of tricaine methane sulfonate at 150 mg/L (MS222; Syndel, Ferndale, WA, United States), then fork length and weight were measured. Skinless, dorsal white muscle and liver were sampled from each fish (samples were stored in separate vials for subsequent FA and transcript expression analyses), immediately flash-frozen in liquid nitrogen, and then stored at −80°C. Tissue samples were transported on dry ice directly from the USDA lab to Dalhousie University Agricultural Campus (Truro, NS, Canada) and then stored at −80°C. Tissue samples for transcript expression analyses were later shipped on dry ice to the Ocean Sciences Centre, Memorial University of Newfoundland (St. John’s, NL, Canada) and directly stored at −80°C until RNA extraction.
Growth Performance
Weight and fork length were measured at week 0 and week 16. Weight gain was calculated as final weight – initial weight (g) and specific growth rate (SGR) was calculated as:
Thermal growth coefficient (TGC) was calculated as:
Recorded feed intake (weekly, dry matter) and weight gain in each tank were used to calculate the feed conversion ratio (FCR), according to the following formula:
Individual final weight and fork lengths were used to calculate the condition factor (CF), according to the following formula:
Tanks 17 (GL strain, FO diet) and 9 (SJR strain, FO-free diet) were eliminated from growth and downstream analyses due to poor growth; they were considered outliers (Grubb’s test) compared with the other tanks in their given group.
Fatty Acid Analysis
In addition to tanks 17 and 9, tanks 16 (GL strain, FO-free diet) and 22 (SJR strain, FO diet) were also eliminated (at random; i.e., the highest numbered tank from each group was eliminated) to keep the number of tanks per treatment group consistent. For the week 0 fish, lipid was extracted from liver and muscle of the first sampled fish (with the exception of tank 12 due to poor quality of the liver sample) from each of the remaining 5 tanks (n = 10 per strain × 2 strains = 20). For the week 16 fish, lipid was extracted from liver and muscle of the first two sampled fish [n = 2 fish per tank × 5 tanks per treatment × 4 treatments (i.e., 2 strains × 2 diets) = 40].
Muscle and liver tissues were freeze-dried and individually ground to a fine powder in liquid nitrogen using a ceramic mortar and pestle [which were washed with soap and water and lipid-cleaned three times with 2 mL of chloroform:methanol (2:1; v/v) between each sample], and the resulting powder was subsampled and weighed to the nearest microgram. Total lipid was extracted using a modified Folch method (Folch et al., 1957), as in Hixson et al. (2017). Briefly, each sample was extracted three times, using 2 mL of chloroform/methanol (2:1; v/v) and then pooled (total 6 mL). Polar impurities were removed by adding 1.6 mL of KCl solution (0.9% w/v). The organic layer was removed using a lipid-cleaned glass pipette and pooled. The resulting lipid-containing solvent was concentrated to 2 mL by evaporating with nitrogen gas. The lipid extract was then prepared for gas chromatography by derivatizing into FAME using the Hildich reagent (1.5 H2SO4: 100 anhydrous MeOH) as the catalyst (Christie, 2003). Reagents were added in the proportion of 1.5 mL of reagent per 4–16 mg of lipid. Samples were heated at 90°C for 90 min and vortexed halfway through the derivatization reaction. The FAME were extracted twice using hexane: diethyl ether (1:1; v/v), then dried under a gentle stream of nitrogen. The dry FAME extract was re-dissolved in hexane and individual FAME were separated using a gas chromatograph (GC). All solvents used in the extraction and FAME derivatization procedures were of high purity HPLC grade (>99%). A known concentration of 5 alpha-cholestane (C8003, Sigma-Aldrich, St. Louis, MI, United States) was added to each sample prior to extraction to act as the internal standard to estimate extraction and instrument recovery efficiency. FAME were analyzed by GC (SCION 436, SCION Instruments, Livingston, United Kingdom) at the Marine Lipids Lab at Dalhousie University (Halifax, NS, Canada).
RNA Preparation
The fish/tissues subjected to transcript expression analyses were the same as those subjected to lipid analyses (see Fatty acid analysis section for samples that were eliminated). For the 60 liver samples, approximately 100 mg tissue was added to a 1.5 mL RNase-free tube containing 400 μL of TRIzol reagent (Invitrogen/Thermo Fisher Scientific, Burlington, ON, Canada) and homogenized using a motorized Kontes RNase-Free Pellet Pestle Grinder (Kimble Chase, Vineland, NJ, United States). An additional 400 μL of TRIzol was added and mixed by pipetting. For the 60 muscle samples, approximately 100 mg tissue was added to a 2 mL RNase-free tube containing 400 μL of TRIzol and a 5 mm stainless steel bead (QIAGEN, Mississauga, ON), and then homogenized using a TissueLyser (QIAGEN) set at a frequency (1/s) of 25 for 2.5 min. An additional 400 μL of TRIzol was added to the tube and the homogenization step repeated. Thereafter, for both tissues, the homogenates were frozen on dry ice and stored at −80°C. They were further disrupted by thawing them on wet ice and then passing them through QIAshredder (QIAGEN) spin columns following the manufacturer’s instructions. Next, 200 μL of TRIzol was added to each sample to make a total homogenate volume of approximately 1 mL. The TRIzol total RNA extractions were then completed following the manufacturer’s instructions.
The TRIzol-extracted liver RNA samples had low A260/230 ratios, which interferes with column purification. Therefore, subsamples (150 μg) were re-extracted using the phenol-chloroform phase separation method. Briefly, to separate the TRIzol-extracted RNA from organic materials, an equal volume of acid phenol:chloroform:isoamyl alcohol (125:24:1) (pH 4.5) (AM9720; Ambion/Thermo Fisher Scientific) was added to each sample, vortexed for 30 sec and centrifuged at 16,100 × g at 4°C for 20 min. The RNA was then recovered from the aqueous layer from the previous step by precipitation with 0.1 volumes of 3 M sodium acetate (pH 5.5) (AM9740; Ambion/Thermo Fisher Scientific) and 2.5 volumes of anhydrous ethyl alcohol (Commercial Alcohols Inc., Brampton, ON) at −80°C for 1 h, followed by centrifugation at 16,100 × g at 4°C for 30 min. To wash the resulting RNA pellet, 1 ml of 75% ethanol was added and centrifuged at 16,100 × g at 4°C for 20 min. The ethanol was removed, and the RNA pellet was air-dried at room temperature for 10 min and resuspended in nuclease-free water (Invitrogen/Thermo Fisher Scientific).
The acid phenol:chloroform:isoamyl alcohol extracted liver and the TRIzol extracted muscle RNA samples (45 μg) were then each treated with 6.8 Kunitz units of DNaseI (RNase-Free DNase Set, QIAGEN) with the manufacturer’s buffer (1X final concentration) at room temperature for 10 min to degrade any residual genomic DNA. DNase-treated RNA samples were column-purified using the RNeasy Mini Kit (QIAGEN) following the manufacturer’s instructions. RNA integrity was verified by 1% agarose gel electrophoresis, and RNA purity was assessed by A260/280 and A260/230 NanoDrop UV spectrophotometry for both the pre-cleaned and the column-purified RNA samples. Column-purified liver RNA samples had A260/280 ratios between 2.08 and 2.13 and A260/230 ratios between 1.85 and 2.39, and column-purified muscle RNA samples had A260/280 ratios between 2.06 and 2.14 and A260/230 ratios between 1.87 and 2.33.
Real-Time Quantitative Polymerase Chain Reaction (qPCR)
qPCR Overview
Expression levels of transcripts with functional annotations related to lipid metabolism including elongation or desaturation (elovl2, elovl5a, elovl5b, fadsd5, fadsd6a and fadsd6b), de novo FA synthesis (acac, acly, scdb and fasb), Krebs cycle (csb), oxidation (acox1), transcription regulation (srebp1 and pparaa), transport (cd36c, fabp3a, fabp3b and fabp10a), cholesterol metabolism (cyp7a1b) and inflammation (lect2a and pgds) were measured in individual liver and muscle samples using qPCR. For each tissue, a preliminary qPCR analysis was performed in which levels of 35 (liver) and 32 (muscle) transcripts were measured in cDNA pools representing the six groups (i.e., GL week 0 and SJR week 0, and GL week 16 FO diet, GL week 16 FO-free diet, SJR week 16 FO diet and SJR week 16 FO-free diet) in this study (Supplementary Figures 1, 2, respectively). This analysis was performed to help select the transcripts to be assessed in individual samples. In a second qPCR analysis, transcript expression levels of the same 21 genes were measured in both liver and muscle tissues of 60 individual salmon (n = 10 per each of the six groups).
cDNA Synthesis and qPCR Parameters
First-strand cDNA templates for qPCR were synthesized in 20 μL reactions from 1 μg of DNaseI-treated, column-purified total RNA using random primers (250 ng; Invitrogen/Thermo Fisher Scientific), dNTPs (0.5 mM final concentration; Invitrogen/Thermo Fisher Scientific), M-MLV reverse transcriptase (200 U; Invitrogen/Thermo Fisher Scientific) with the manufacturer’s first strand buffer (1X final concentration) and DTT (10 mM final concentration) at 37°C for 50 min. To generate the cDNA pools, a subsample of each individual cDNA template (n = 10) from a given group (n = 6) was included in that pool.
Polymerase chain reaction amplifications were performed in 13 μL reactions using 1X Power SYBR Green PCR Master Mix (Applied Biosystems/Thermo Fisher Scientific), 50 nM of both the forward and reverse primers, and the indicated cDNA quantity (see below). Amplifications were performed using the QuantStudio 6 Flex Real Time PCR system (384-well format) (Applied Biosystems/Thermo Fisher Scientific). The real-time analysis program consisted of 1 cycle of 50°C for 2 min, 1 cycle of 95°C for 10 min and 40 cycles of 95°C for 15 sec and 60°C for 1 min, with fluorescence detection at the end of each 60°C step, and was followed by dissociation curve analysis.
Primer Design and Quality Assurance Testing
The sequences of all primer pairs used in qPCR analyses are presented in Supplementary Table 1. Many of these primers were designed previously (see references in Supplementary Table 1); primers new to the current study were designed following the same parameters. However, as the GL strain studied herein was different from the SJR strain, which has been studied in our lab previously (i.e., Xue et al., 2015; Hixson et al., 2017; Caballero-Solares et al., 2018, 2017; Katan et al., 2019; Emam et al., 2020), all primers pairs were (re)-subjected to quality control (QC) testing, due to the possibility of single nucleotide polymorphisms (SNPs) either within the primer sequence or amplicon. This was performed separately for both liver and muscle tissues from the same individual fish. Amplification efficiencies (Pfaffl, 2001) were calculated for cDNA pools representing the two strains studied herein to ensure they were comparable. Briefly, cDNAs were synthesized for two individual RNA samples from each of the three groups (i.e., Week 0, Week 16 FO diet, Week 16 FO-free diet) from GL and from SJR. The 6 cDNAs from each strain were then pooled and standard curves generated using a 5-point 1:3 dilution series starting with cDNA representing 10 ng of input total RNA. For a given tissue, for all transcripts, the efficiencies for both GL and SJR were comparable; therefore, the average of the two values was utilized for data analyses. Testing was also performed to ensure that a single product with identical melting temperature between the two geographical locations was amplified (dissociation curve analysis) and that there was no primer-dimer present in the no-template control. Amplicons were electrophoretically separated on 2% agarose gels and compared with a 1 kb plus ladder (Invitrogen/Thermo Fisher Scientific) to verify that the correct size fragment was being amplified.
Endogenous Control (Normalizer) Selection
Endogenous control selection was performed as described below for both liver and muscle separately. Expression levels of the transcripts of interest (TOIs) were normalized to transcript levels of two endogenous controls. These endogenous controls were selected from six candidate normalizers [60S ribosomal protein L32 (rpl32; BT043656), β-actin (actb; BG933897), elongation factor 1-alpha 1 (ef1a1; AF321836), elongation factor 1-alpha 2 (ef1a2; BT058669), eukaryotic translation initiation factor 3 subunit D (etif3d; GE777139) and polyadenylate-binding protein 1 (pabpc1; EG908498)]. Briefly, the fluorescence threshold cycle (CT) values of 30 samples (i.e., 5 samples from each of the six groups) were measured (in duplicate) for each of these transcripts using cDNA representing 4 ng of input total RNA, and then analyzed using geNorm (Vandesompele et al., 2002). Based on this analysis, ef1a1 (geNorm M = 0.193) and rpl32 (geNorm M = 0.214) were selected as the two endogenous controls for liver; ef1a1 (geNorm M = 0.244) and pabpc1 (geNorm M = 0.259) were selected as the two endogenous controls for muscle.
Experimental qPCR Analyses
In both the pooled sample screen and individual sample experimental qPCR analyses, cDNA representing 4 ng of input RNA was used as template in the PCR reactions. On each plate, for every sample, the TOIs and endogenous controls were tested in triplicate and a no-template control was included. In the individual sample qPCR study, since expression levels of a given TOI were assessed across three plates, a plate linker sample (i.e., a sample that was run on all plates in a given study) was also included to ensure there was no plate-to-plate variability. The relative quantity (RQ) of each transcript was determined using the QuantStudio Real Time PCR Software (version 1.3) (Applied Biosystems/Thermo Fisher Scientific) relative quantification study application, with normalization to both ef1a1 and rpl32 (liver) or ef1a1 and pabpc1 (muscle) transcript levels, and with amplification efficiencies incorporated. For each TOI, the sample with the lowest normalized expression (mRNA) level was set as the calibrator sample (i.e., assigned an RQ value = 1.0).
Statistical Analysis
For growth data (n = 6; mean ± SD), a one-way analysis of variance (ANOVA) was conducted and where significant differences occurred (p < 0.05), treatment means were differentiated using the Tukey HSD multiple comparison. A two-way ANOVA was also performed using the general linear model to determine the explanatory power of diet factor and strain factor, as well as the ‘diet × strain’ interaction. For FA analysis, raw data were converted to percentages and Anderson-Darling test was used to evaluate normality and Levene’s test was used to evaluate equal variances. For diet and tissue FA composition at week 0 and 16 (considered separately), a one-way ANOVA was performed, followed by Bonferroni post hoc confidence intervals with appropriate correction of the α-level for multiple comparisons to determine differences among treatments. Residuals of the tests were examined for homogeneity of variance and normality. Statistical analyses were conducted using the general linear model in Minitab (Minitab 16 Statistical Software, State College, PA, United States).
For transcript expression data, the week 0 and week 16 transcript expression data were considered separately. For week 0, as there were some cases where values did not exhibit homogeneity of variance, the Mann-Whitney test was used to assess if there were any significant differences in expression levels of a given TOI between the GL and SJR groups. For week 16, with the exception of transcript expression data for elovl2 and elovl5b in muscle (not expressed in fish 77 so untransformed data were analyzed), data were log10 transformed, and a one-way and two-way ANOVA, followed by Tukey’s B post hoc test, were used to assess expression levels of a given TOI among the four treatments. In all cases, p < 0.05 was considered statistically significant, and treatments are referred to as different if a statistical difference was found, unless otherwise stated. All data are expressed as mean ± SD. To compare the magnitude of relative expression of transcripts between strains, fold-change was calculated for each strain, where the RQ value for the FO-free treatment was divided by the RQ value of the FO treatment. Fold-change values were compared using a t-test.
Principal Coordinate Analysis (PCoA) was used to provide a representation of FA and transcript expression among treatments at week 16, and permutational MANOVA (PERMANOVA) were performed to study strength and significance level of variation due to diet and strain factors. Vectors were included in the plot that showed correlations > 0.75 (Pearson correlation). PERMANOVA analyses were performed on resemblance matrices, which were built upon the Bray-Curtis similarity matrix. Multivariate statistics (i.e., PCoA and PERMANOVA) were performed using Primer 7 with the PERMANOVA + add on package (Primer-E version 7, Aukland, New Zealand).
Pearson correlation analyses were used to relate transcript expression RQ data with tissue FA data. Strains were considered separately to determine which strain had stronger relationships between transcript expression and FA storage. Transcripts directly involved in LC-PUFA synthesis (elovl2, elovl5a, elovl5b, fadsd5, fadsd6a, fadsd6b) in the liver and muscle were compared with n-3 and n-6 FA in the liver and muscle, respectively. In addition, the same comparisons were made for liver RQ data and muscle FA data, to relate liver FA synthesis to muscle FA storage. Correlations were performed using SigmaPlot 14.0 (Systat Software, Inc., San Jose, CA, United States).
Results
Growth Performance
Considering final weight, weight gain, weight increase and TGC, one-way ANOVA indicated that there were significant differences among the 4 treatments (Table 3). More specifically, for all of these measurements, the GL strain fed the FO diet had significantly lower levels than the SJR strain (fed either diet); however, in the GL strain that were fed the FO-free diet, levels were not significantly different compared to any group. Notably, the GL strain fed the FO-free diet grew slightly more (final weight 180.1 g/fish) than those fed the FO diet (167.5 g/fish), although this difference was not significant. Results of the two-way ANOVA showed that strain was a significant factor that affected weight gain, weight increase and TGC (Table 3). Diet, or the interaction between strain and diet, were not significant factors in growth performance.
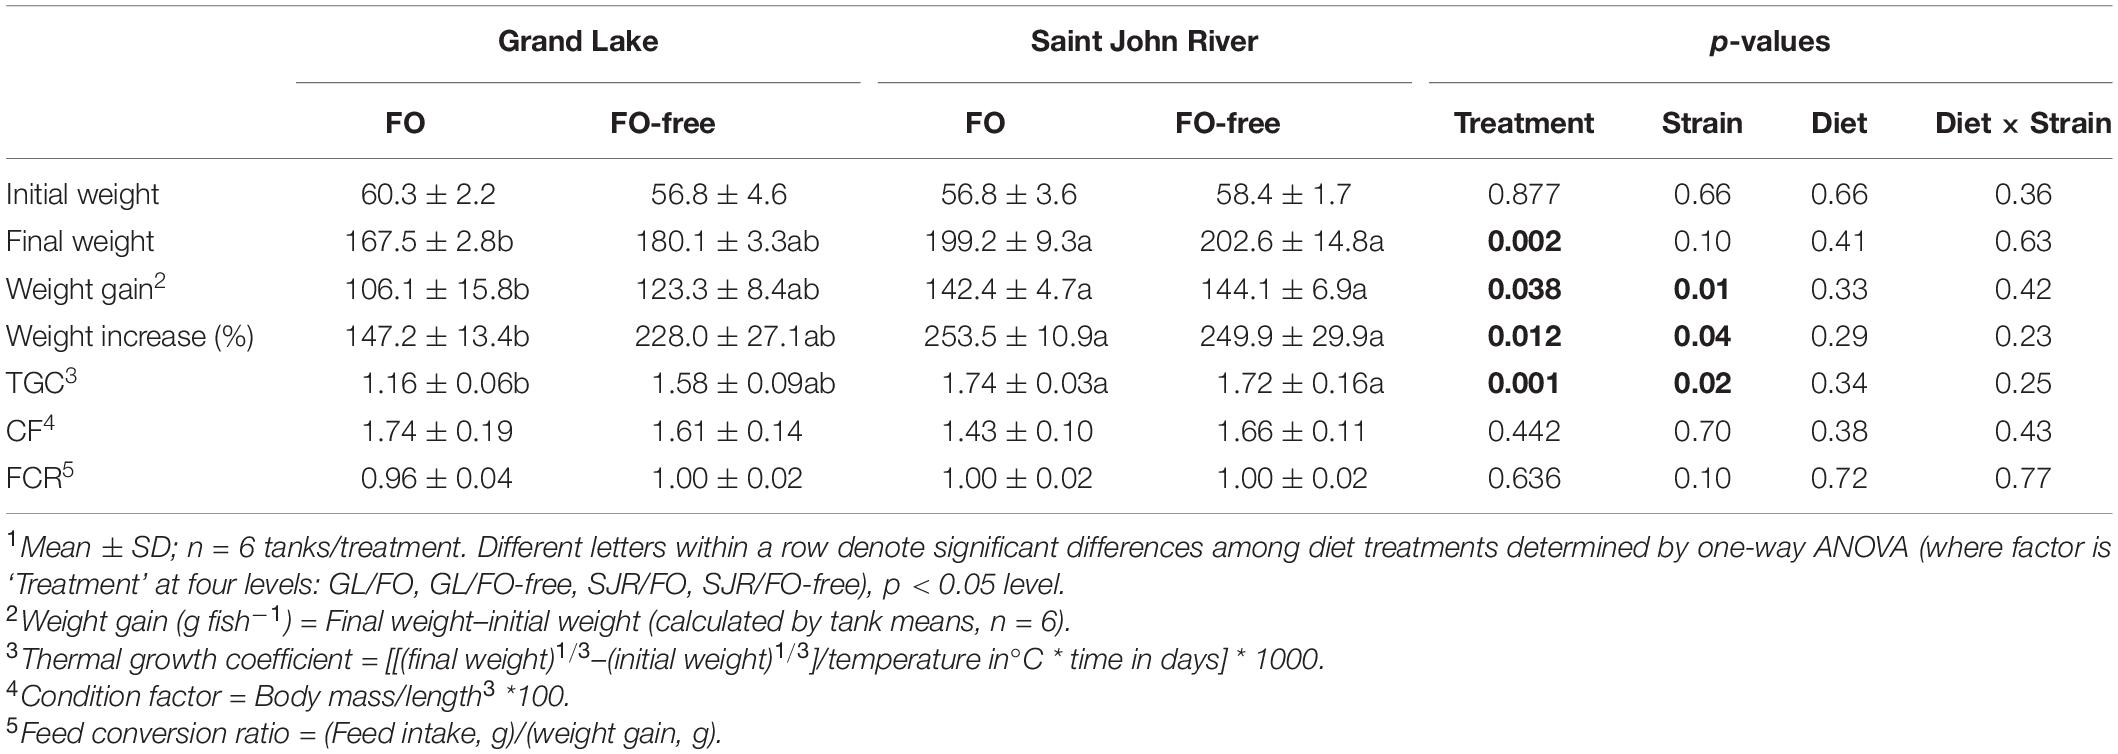
Table 3. Growth performance of the landlocked Grand Lake (GL) strain and commercial anadromous Saint John River (SJR) strain fed FO- and FO-free diets for 16 weeks1.
Tissue Fatty Acids
At week 0 in the liver, prior to feeding experimental diets, there were significant differences in FA content due to strain (diet was the same since post-hatch, prior to week 0 sampling; Table 4). Liver FAs that were higher in proportion in the GL strain compared to the SJR strain were: 14:0, 16:1n-7, 18:1n-9, 18:2n-6, 18:3n-3, 20:1n-9, 20:1n-7, 20:2n-6, 20:4n-3, MUFA, and the DHA/EPA ratio. Conversely, liver FAs that were higher in proportion in the SJR strain compared to the GL strain were: 16:0, ARA, EPA, 24:1, SFA, and the n-3/n-6 ratio. In the muscle at week 0, 20:3n-6 was higher in the SJR strain compared to the GL strain; however, there were no significant differences for the rest of the FA profile (Table 5).
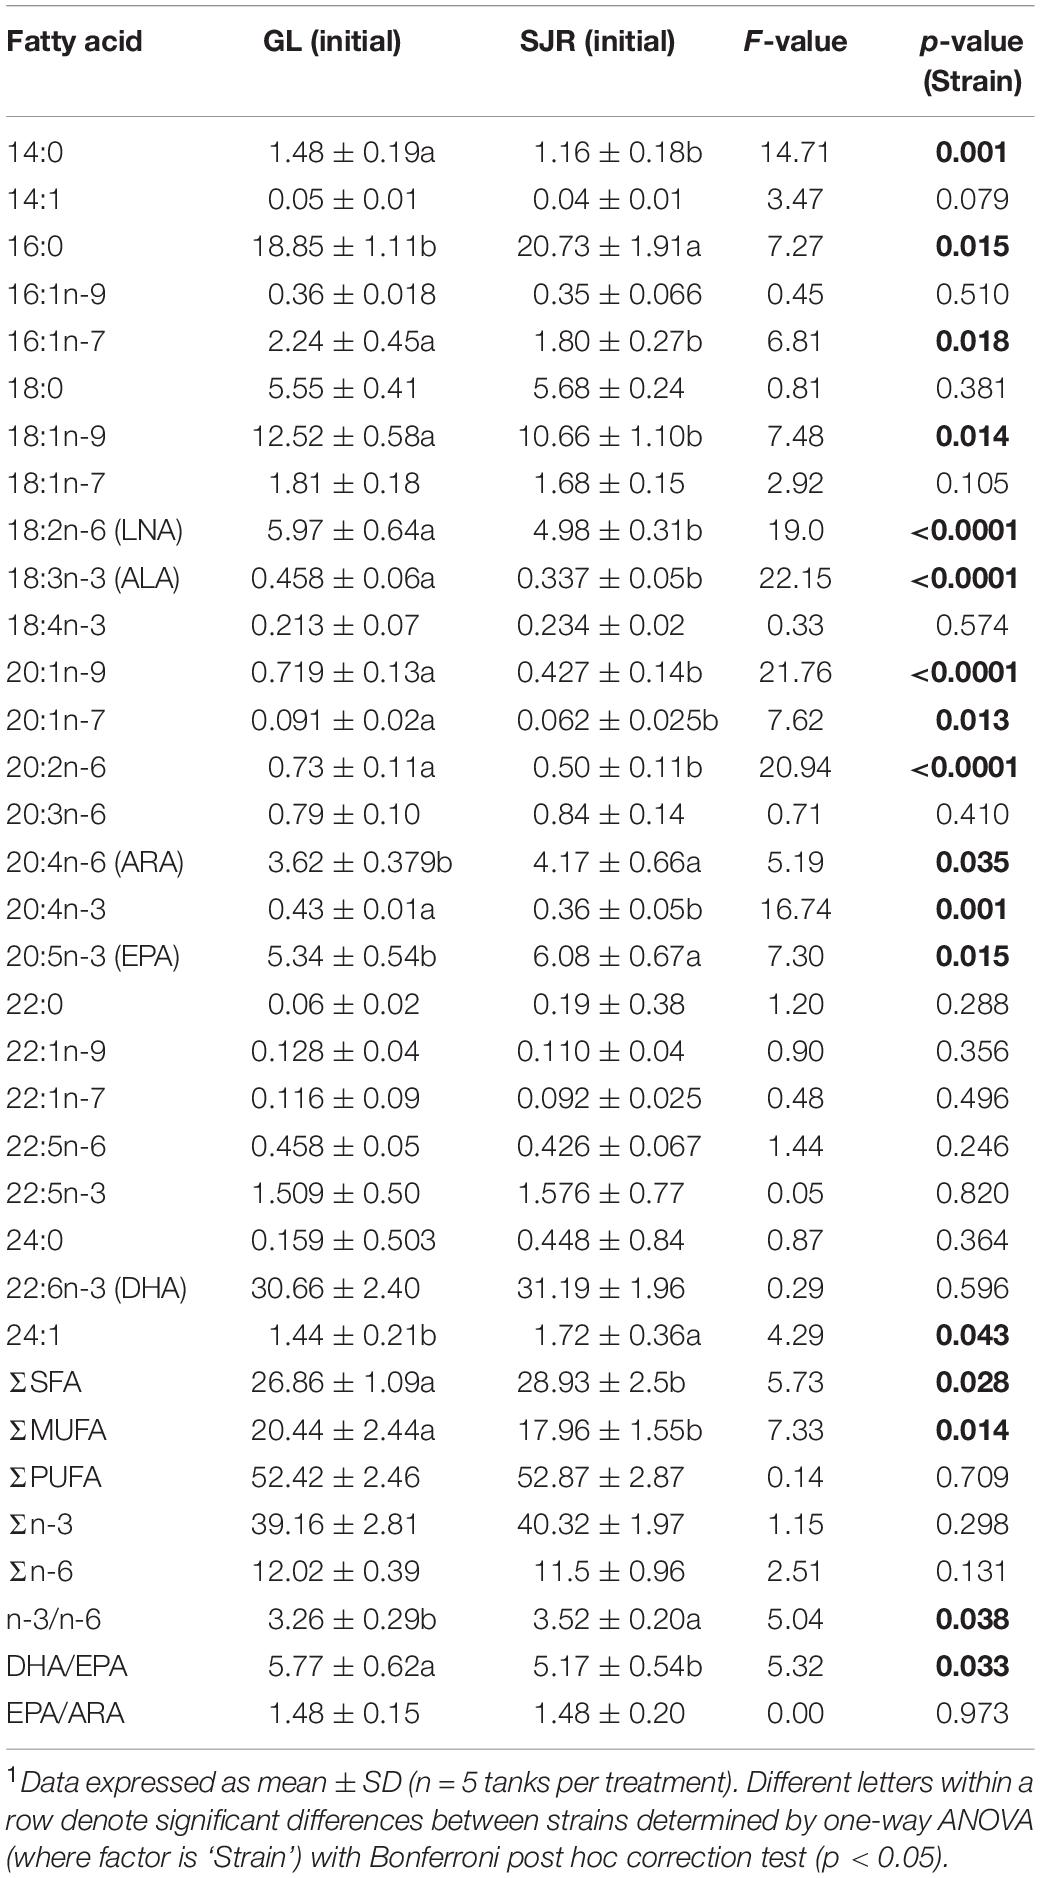
Table 4. Liver fatty acid content (area% FAMES, dry weight) of the Grand Lake (GL) strain and Saint John River (SJR) strain at week 0 prior to feeding experimental diets.
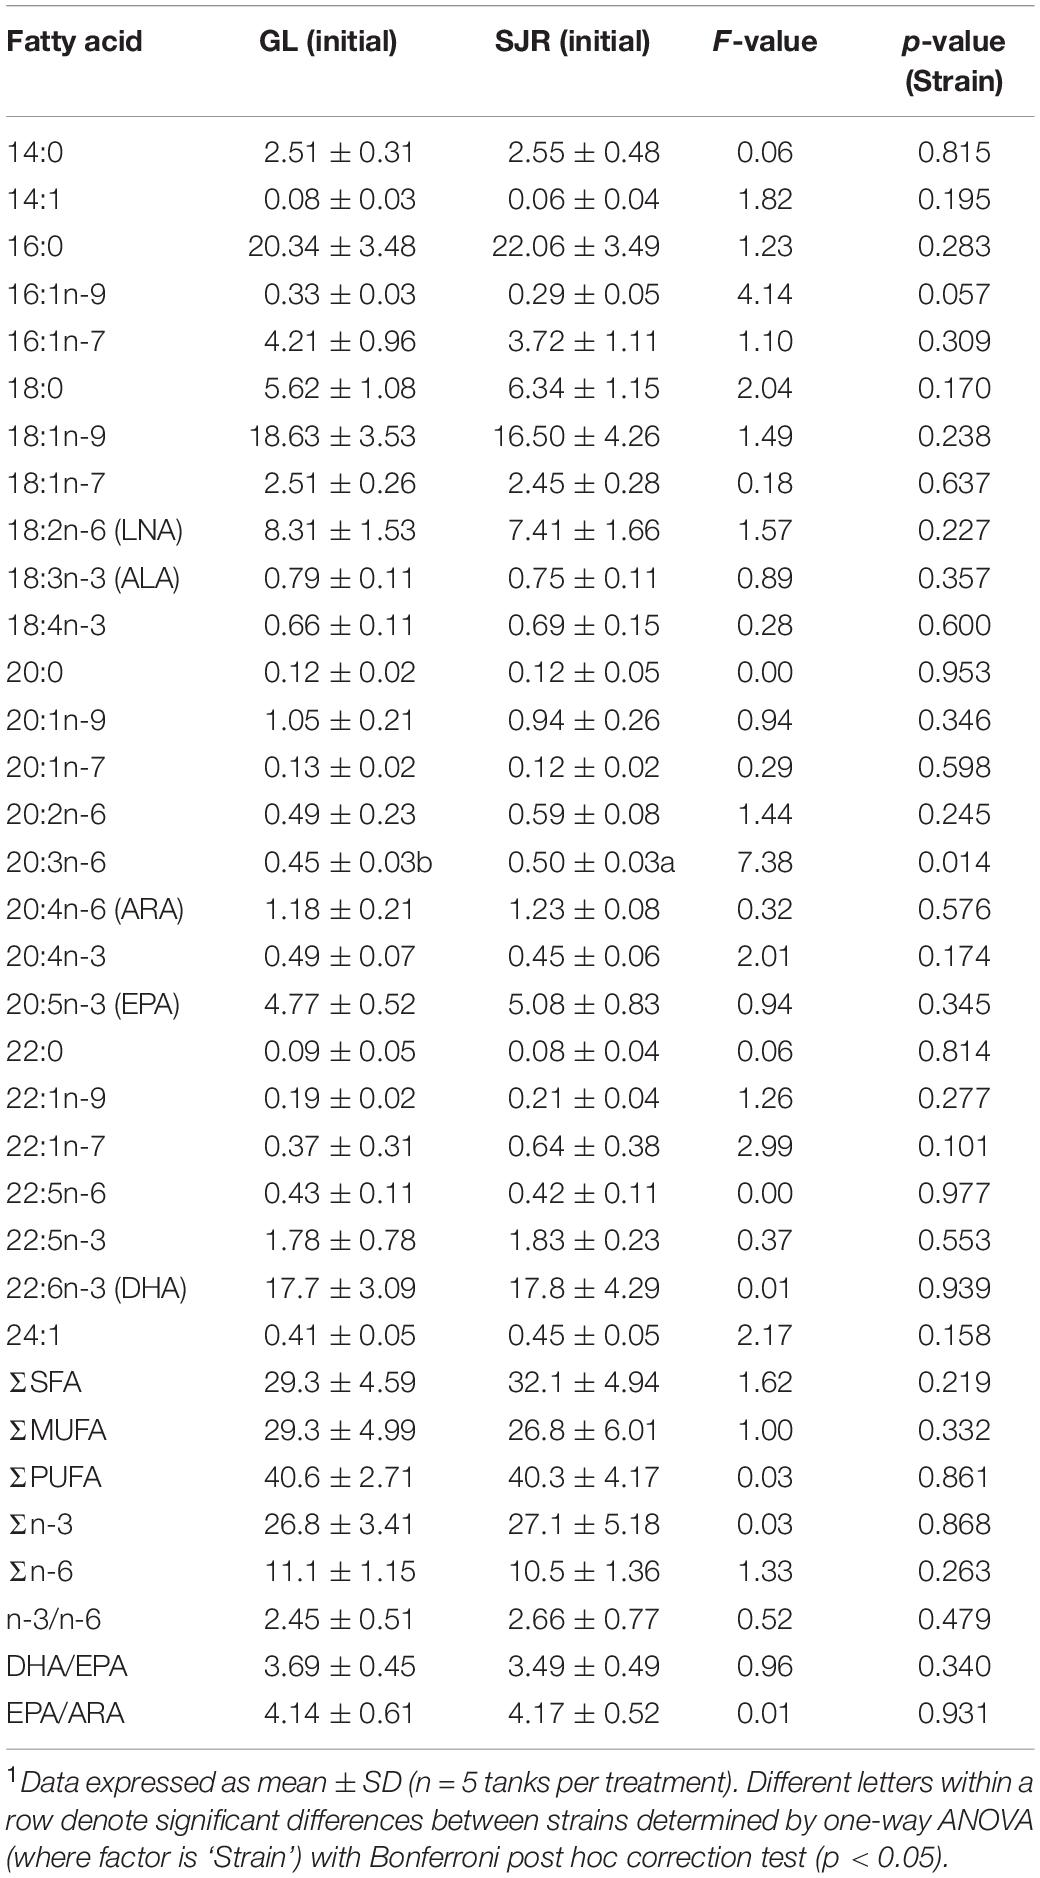
Table 5. Muscle fatty acid content (area% FAMES, dry weight) of the Grand Lake (GL) strain and Saint John River (SJR) strain at week 0 prior to feeding experimental diets.
Overall, at week 16 in the liver, most of the differences in FA were due to diet (∼70% of reported FA), although some FA were different due to strain (∼40% of reported FA; Table 6). Considering treatment effect only (one-way ANOVA results), 14:0, EPA, DHA, n-3 and n-3/n-6, were all significantly higher in salmon that were fed the FO diet compared to salmon fed the FO-free diet (both strains). Total n-6 was highest in the SJR strain fed the FO-free diet, followed by the GL strain fed the FO-free diet, and lowest in both the SJR and GL strains fed the FO diet. ARA was highest in the SJR strain fed the FO-free diet compared to any other treatment. Total SFA were higher in the SJR strain fed the FO diet compared to any other treatment. Total MUFA were highest in the GL strain fed the FO-free diet, followed by the SJR strain fed the FO-free diet, and the GL and SJR strains fed the FO diet were both lowest in MUFA. Total PUFA was lowest in the GL strain fed the FO-free diet compared to any other treatment.
Table 6. Liver fatty acid content (area% FAMES, dry weight) of the Grand Lake strain and Saint John River strain after being fed FO- and FO-free diets for 16 weeks1,2.
There were also significant differences in FA profiles that were affected by diet, strain, and the interaction between diet and strain (two-way ANOVA results; Table 6). The level of 16:1n-9, 18:1n-9, ARA, 22:5n-6, DHA, MUFA, PUFA, n-3, n-6, and the DHA/EPA ratio in the liver all depended on the interaction between strain and diet. The level of 14:1, 16:0, 16:1n-7, 20:3n-6 in the liver all depended on the strain and diet factor, independently. The level of LNA, 18:4n-3, 20:4n-3, EPA, 22:5n-3 and 24:1 depended on the diet factor alone. The level of 18:0 and 18:3n-3 were the only FAs that depended on strain only.
Muscle FA content at week 16 largely depended on diet (∼88% of reported FA), while some depended on both diet and strain (∼20% of reported FA; Table 7). Based on treatment effect only (one-way ANOVA results), the following FA were higher in salmon that were fed the FO diet (both strains), compared to salmon that were fed the FO-free diet (both strains): 14:0, 16:1n-7, 18:1n-9, 20:3n-6, EPA, 22:5n-3, and n-3/n-6. The following FA were higher in salmon that were fed the FO-free diet (both strains), compared to salmon that were fed the FO diet (both strains): ALA, LNA, 18:4n-3, ARA, MUFA, and n-6. DHA was highest in the GL strain fed FO diets compared to any other treatment.
Table 7. Muscle fatty acid content (area% FAMES, dry weight) of the Grand Lake strain and Saint John River strain after being fed FO- and FO-free diets for 16 weeks1,2.
There were a few muscle FAs that were dependent on the strain × diet interaction (two-way ANOVA results; Table 7), including 14:0, 20:3n-6, ARA, 22:5n-6, DHA, and the EPA/ARA ratio. There were also a few FAs that were significantly different due to both diet and strain, which included 16:1n-9, 18:0, 20:4n-3, 22:5n-6, and the DHA/EPA ratio. Most muscle FAs were significantly different depending on diet only.
Liver Transcript Expression Analyses
At week 0, transcript levels of elovl5b, acac, scdb, acox1, pparaa, cd36c, fabp3b, fabp10a and pgds were significantly higher in the GL strain compared to the SJR strain; whereas levels of fadsd6a were significantly lower in the GL strain compared to the SJR strain (Figure 1 and Supplementary Table 2). The remaining transcripts were not significantly different between strains at week 0.
Figure 1. qPCR analyses of transcripts with functional annotations related to lipid metabolism, cholesterol metabolism, eicosanoid pathways and inflammation in liver of individual fish from Grand Lake (GL) and Saint John River (SJR) strains at week 0. These transcripts include those involved in fatty acid (FA) elongation or desaturation (panel A), de novo FA synthesis (panel B), Krebs cycle or oxidation (panel C), transcription factors (panel D), fatty acid transport (panel E), cholesterol metabolism (panel F), and inflammation (panel G). Transcript levels are presented as mean ± SD relative quantity (RQ) values (i.e., values for the transcript of interest were normalized to both ef1a1 and rpl32 transcript levels and were calibrated to the individual with the lowest normalized expression level of that given transcript). *Indicates a significant difference in expression levels between fish from GL and SJR. In all cases, n = 10 and p < 0.05 was considered statistically significant.
At week 16, some transcripts related to elongation or desaturation (i.e., elovl2, fadsd5, fadsd6a, and fadsd6b) were higher in salmon fed the FO-free diet compared to the FO diet, in both strains (Figure 2A). The two-way ANOVA results showed a significant diet effect for elovl2, elovl5a and elovl5b, fadsd5, fadsd6a, and fadsd6b (Supplementary Table 3). Strain was a significant factor for elovl5b and fadsd6a. Strain and diet were not interacting factors for these transcripts (Supplementary Table 3).
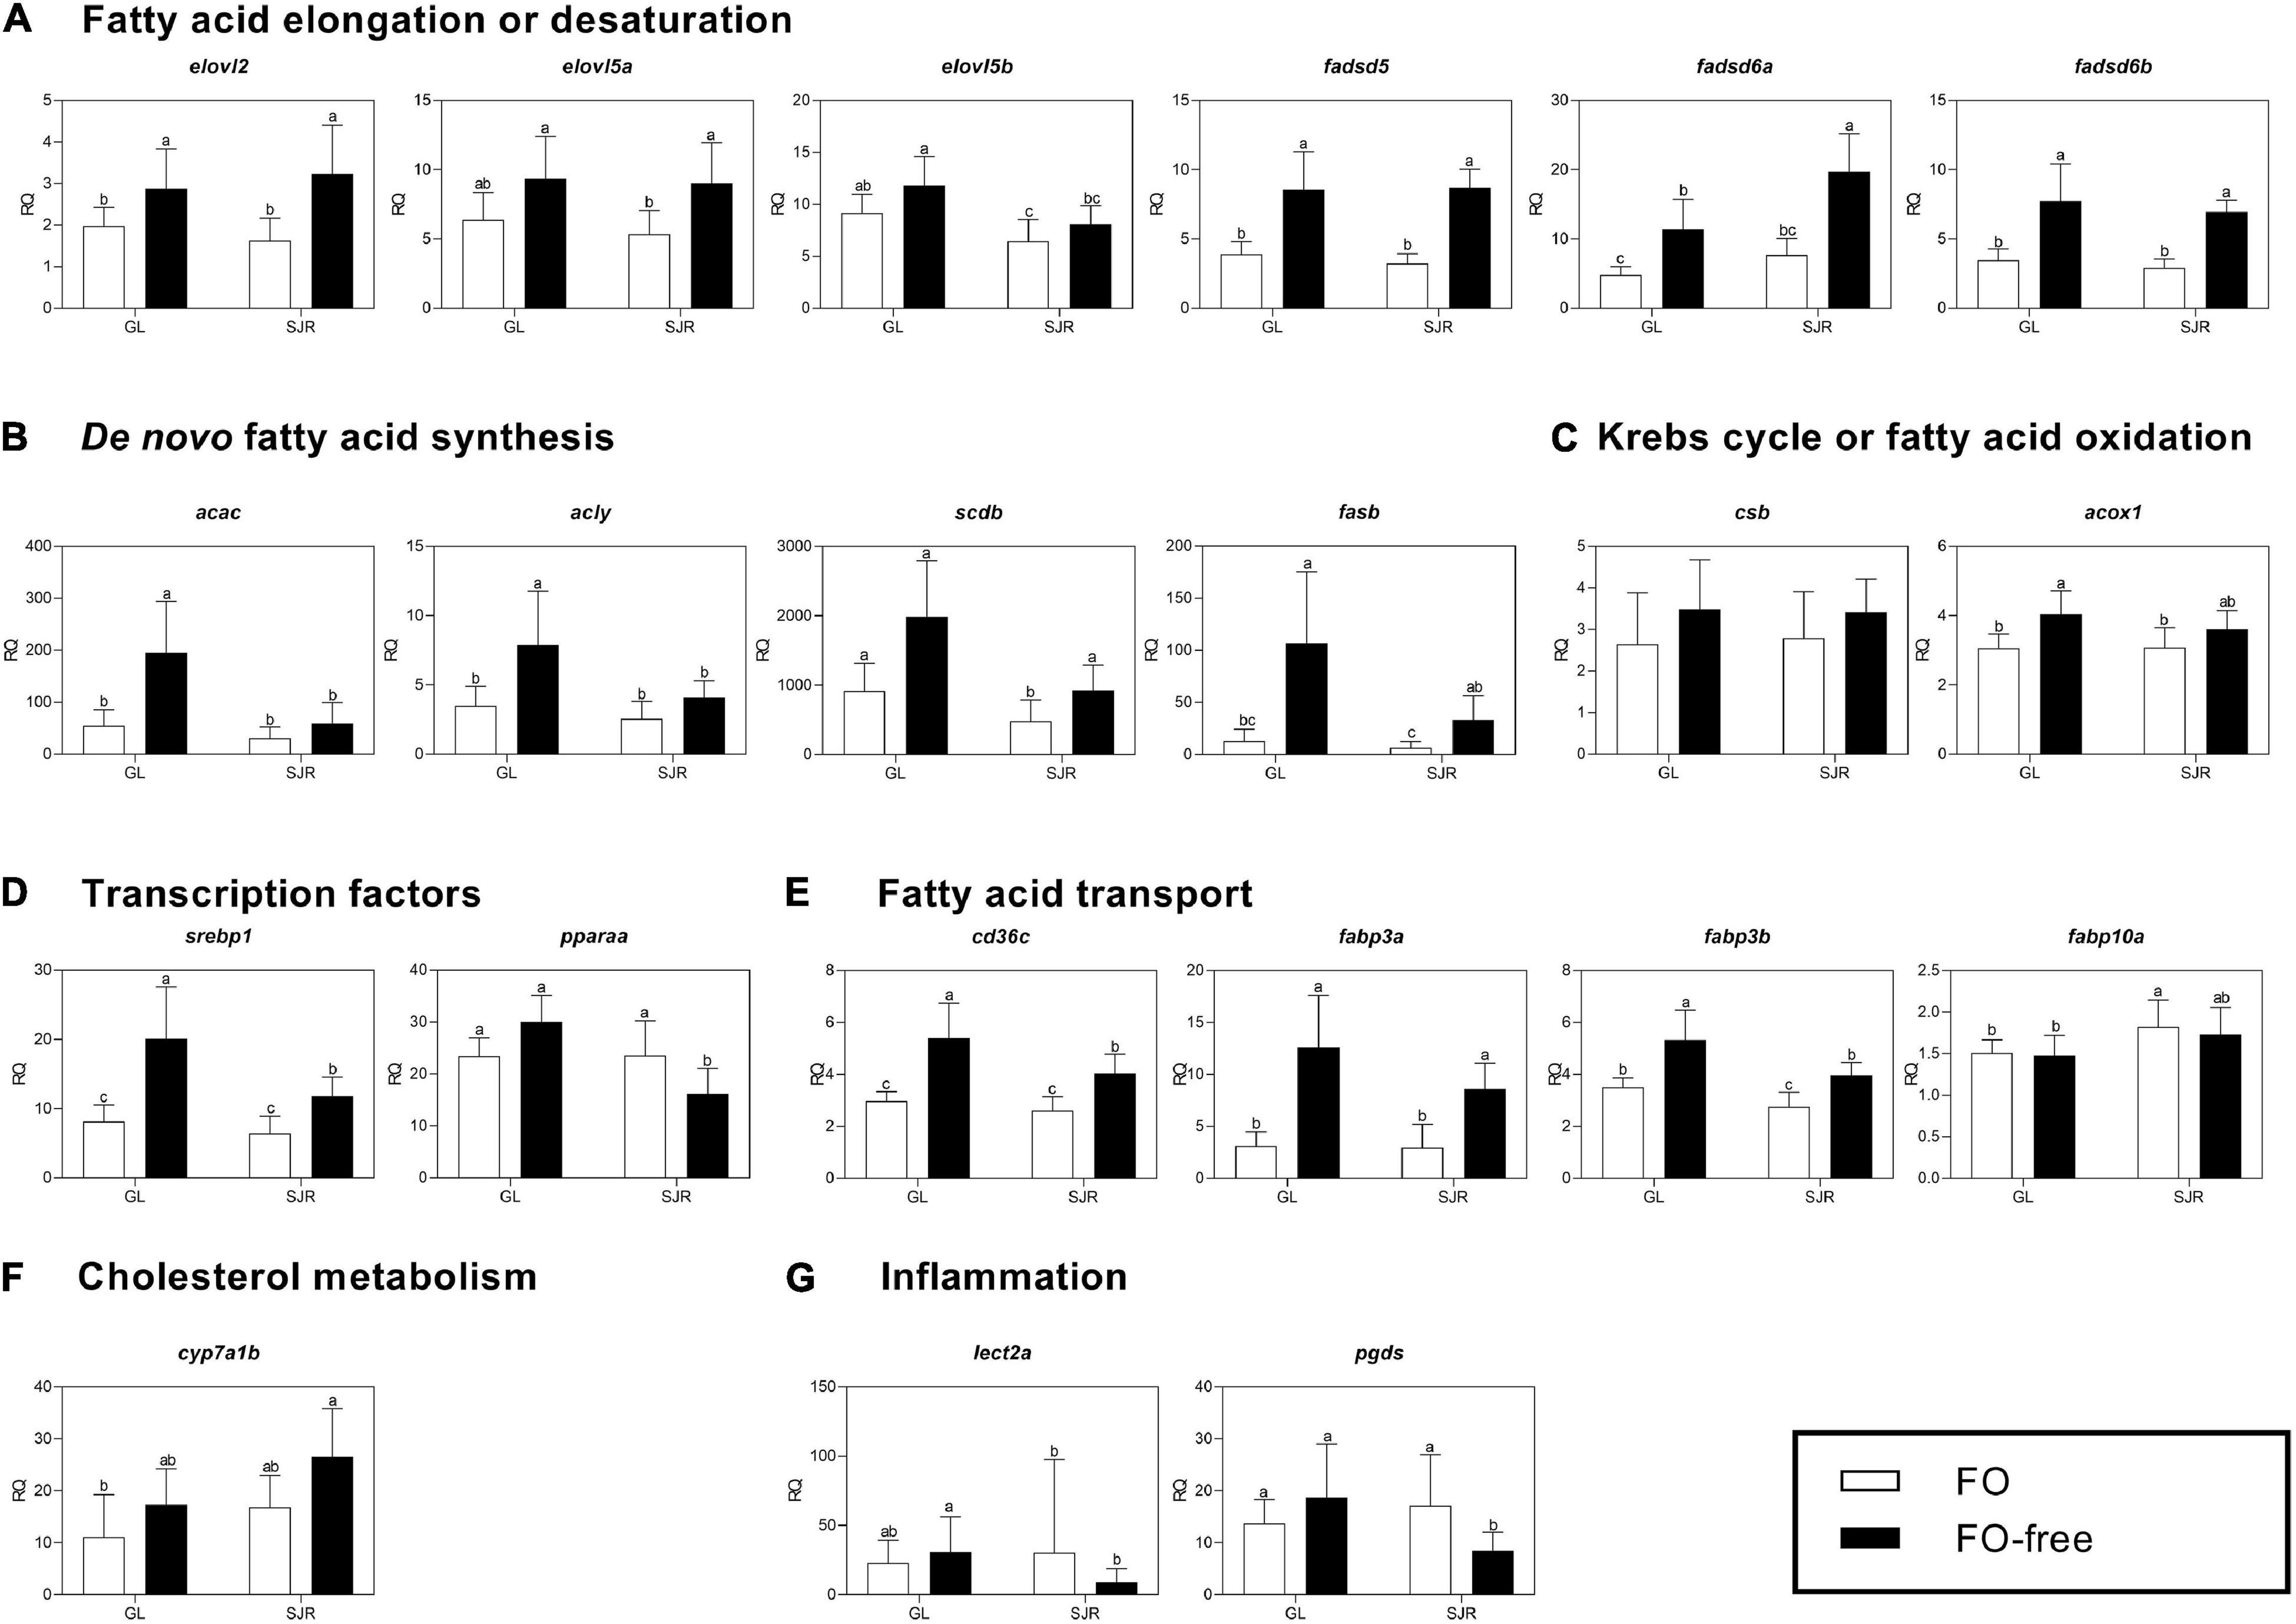
Figure 2. qPCR analyses of transcripts with functional annotations related to lipid metabolism, cholesterol metabolism, eicosanoid pathways and inflammation in liver of individual fish from Grand Lake (GL) and Saint John River (SJR) strains fed two different diets [fish oil (FO) or FO-free] for 16 weeks. These transcripts include those involved in fatty acid (FA) elongation or desaturation (panel A), de novo FA synthesis (panel B), Krebs cycle or oxidation (panel C), transcription factors (panel D), fatty acid transport (panel E), cholesterol metabolism (panel F), and inflammation (panel G). Transcript levels are presented as mean ± SD relative quantity (RQ) values (i.e., values for the transcript of interest were normalized to both ef1a1 and rpl32 transcript levels and were calibrated to the individual with the lowest normalized expression level of that given transcript). Letters indicate Tukey’s HSD groupings. In all cases, n = 10 and p < 0.05 was considered statistically significant.
Levels of transcripts related to de novo FA synthesis, acac and acly, were higher in GL strain salmon fed the FO-free diet compared to those fed the FO diet, and compared to the SJR strain fed either diet (Figure 2B). Scdb transcript levels were lower in the SJR strain fed the FO diet compared to all of the remaining groups. Fasb transcript levels were higher in both strains fed the FO-free diet. Strain and diet were both significant factors across the de novo FA synthesis transcripts (Supplementary Table 3). Strain and diet were not interacting factors for these transcripts (Supplementary Table 3).
Levels of the Krebs cycle related transcript, csb, were not different across groups in both strains, however, diet was a significant factor in the two-way ANOVA (Supplementary Table 3). Levels of the oxidation transcript, acox1, were higher in the GL strain fed the FO-free diet compared to those fed the FO diet in both strains (Figure 2C and Supplementary Table 3). The levels of acox1 in the SJR strain fed the FO-free diet were not different compared to all other groups. The diet effect was significant for acox1 in the two-way ANOVA (Supplementary Table 3). The transcription factor, srebp1, was higher in the GL strain fed the FO-free diet compared to all other groups, while the SJR strain fed the FO-free diet was higher than both strains fed the FO diet (Figure 2D). Levels of the transcription factor, pparaa, were lower in the SJR strain fed the FO-free diet compared to any other group (Figure 2D). For both transcription factor encoding transcripts, strain was a significant factor, while diet was only significant for srebp1, and the interaction between strain and diet was only significant for pparaa (Supplementary Table 3).
Levels of transcripts related to FA transport, cd36c and fabp3b, were higher in both salmon strains fed the FO-free diet compared to those fed the FO diet, and also higher in the GL strain compared to the SJR strain fed the FO-free diet (Figure 2E). Levels of fabp3a were higher in salmon fed the FO-free diet compared to those fed the FO diet in both strains. Transcript levels of fabp10a were higher in the SJR strain fed the FO diet compared to the GL strain, regardless of diet. The diet and strain factors were significant for cd36c and fabp3b, while fabp3a was only significant for the diet factor and fabp10a was only significant for the strain factor (Supplementary Table 3).
Cyp7a1b, involved in cholesterol metabolism, was higher in the SJR strain fed the FO-free diet compared to the GL strain fed the FO diet (Figure 2F). Both the diet and strain factors were significant in the two-way ANOVA (Supplementary Table 3). Transcript levels of the inflammation-relevant transcript, lect2a, were higher in the GL strain fed the FO-free diet compared to the SJR strain, regardless of diet (Figure 2G), and strain was a significant factor in the two-way ANOVA (Supplementary Table 3). Transcript expression levels of another inflammation-relevant gene, pgds, showed lower levels in the SJR strain fed the FO-free diet compared to all other groups (Figure 2G), with diet and strain being interacting factors (Supplementary Table 3).
Transcript fold-changes compared between strains (where the RQ value of the FO-free treatment was compared to the RQ value of the FO treatment) were significantly higher in the GL strain compared to the SJR strain for pparaa, lect2a and pgds (Supplementary Table 6). Other transcripts showed numerical differences in fold-change values between strains, but they were not statistically different. For example, fasb was expressed 4-fold higher in the GL strain comparing the FO-free to the FO treatment, whereas in the SJR strain, the difference between treatments was 5-fold.
Muscle Transcript Expression Analyses
At week 0, levels of transcripts related to elongation or desaturation (elovl5a, fadsd5, and fadsd6b; Figure 3A), de novo FA synthesis (acac, scdb, fasb; Figure 3B) and transcription (srebp1 and pparaa; Figure 3D) were higher in the GL strain compared to the SJR strain; whereas levels of cd36c were lower (Figure 3E and Supplementary Table 4). The remaining transcripts were not different between strains (Figures 3C,F,G).
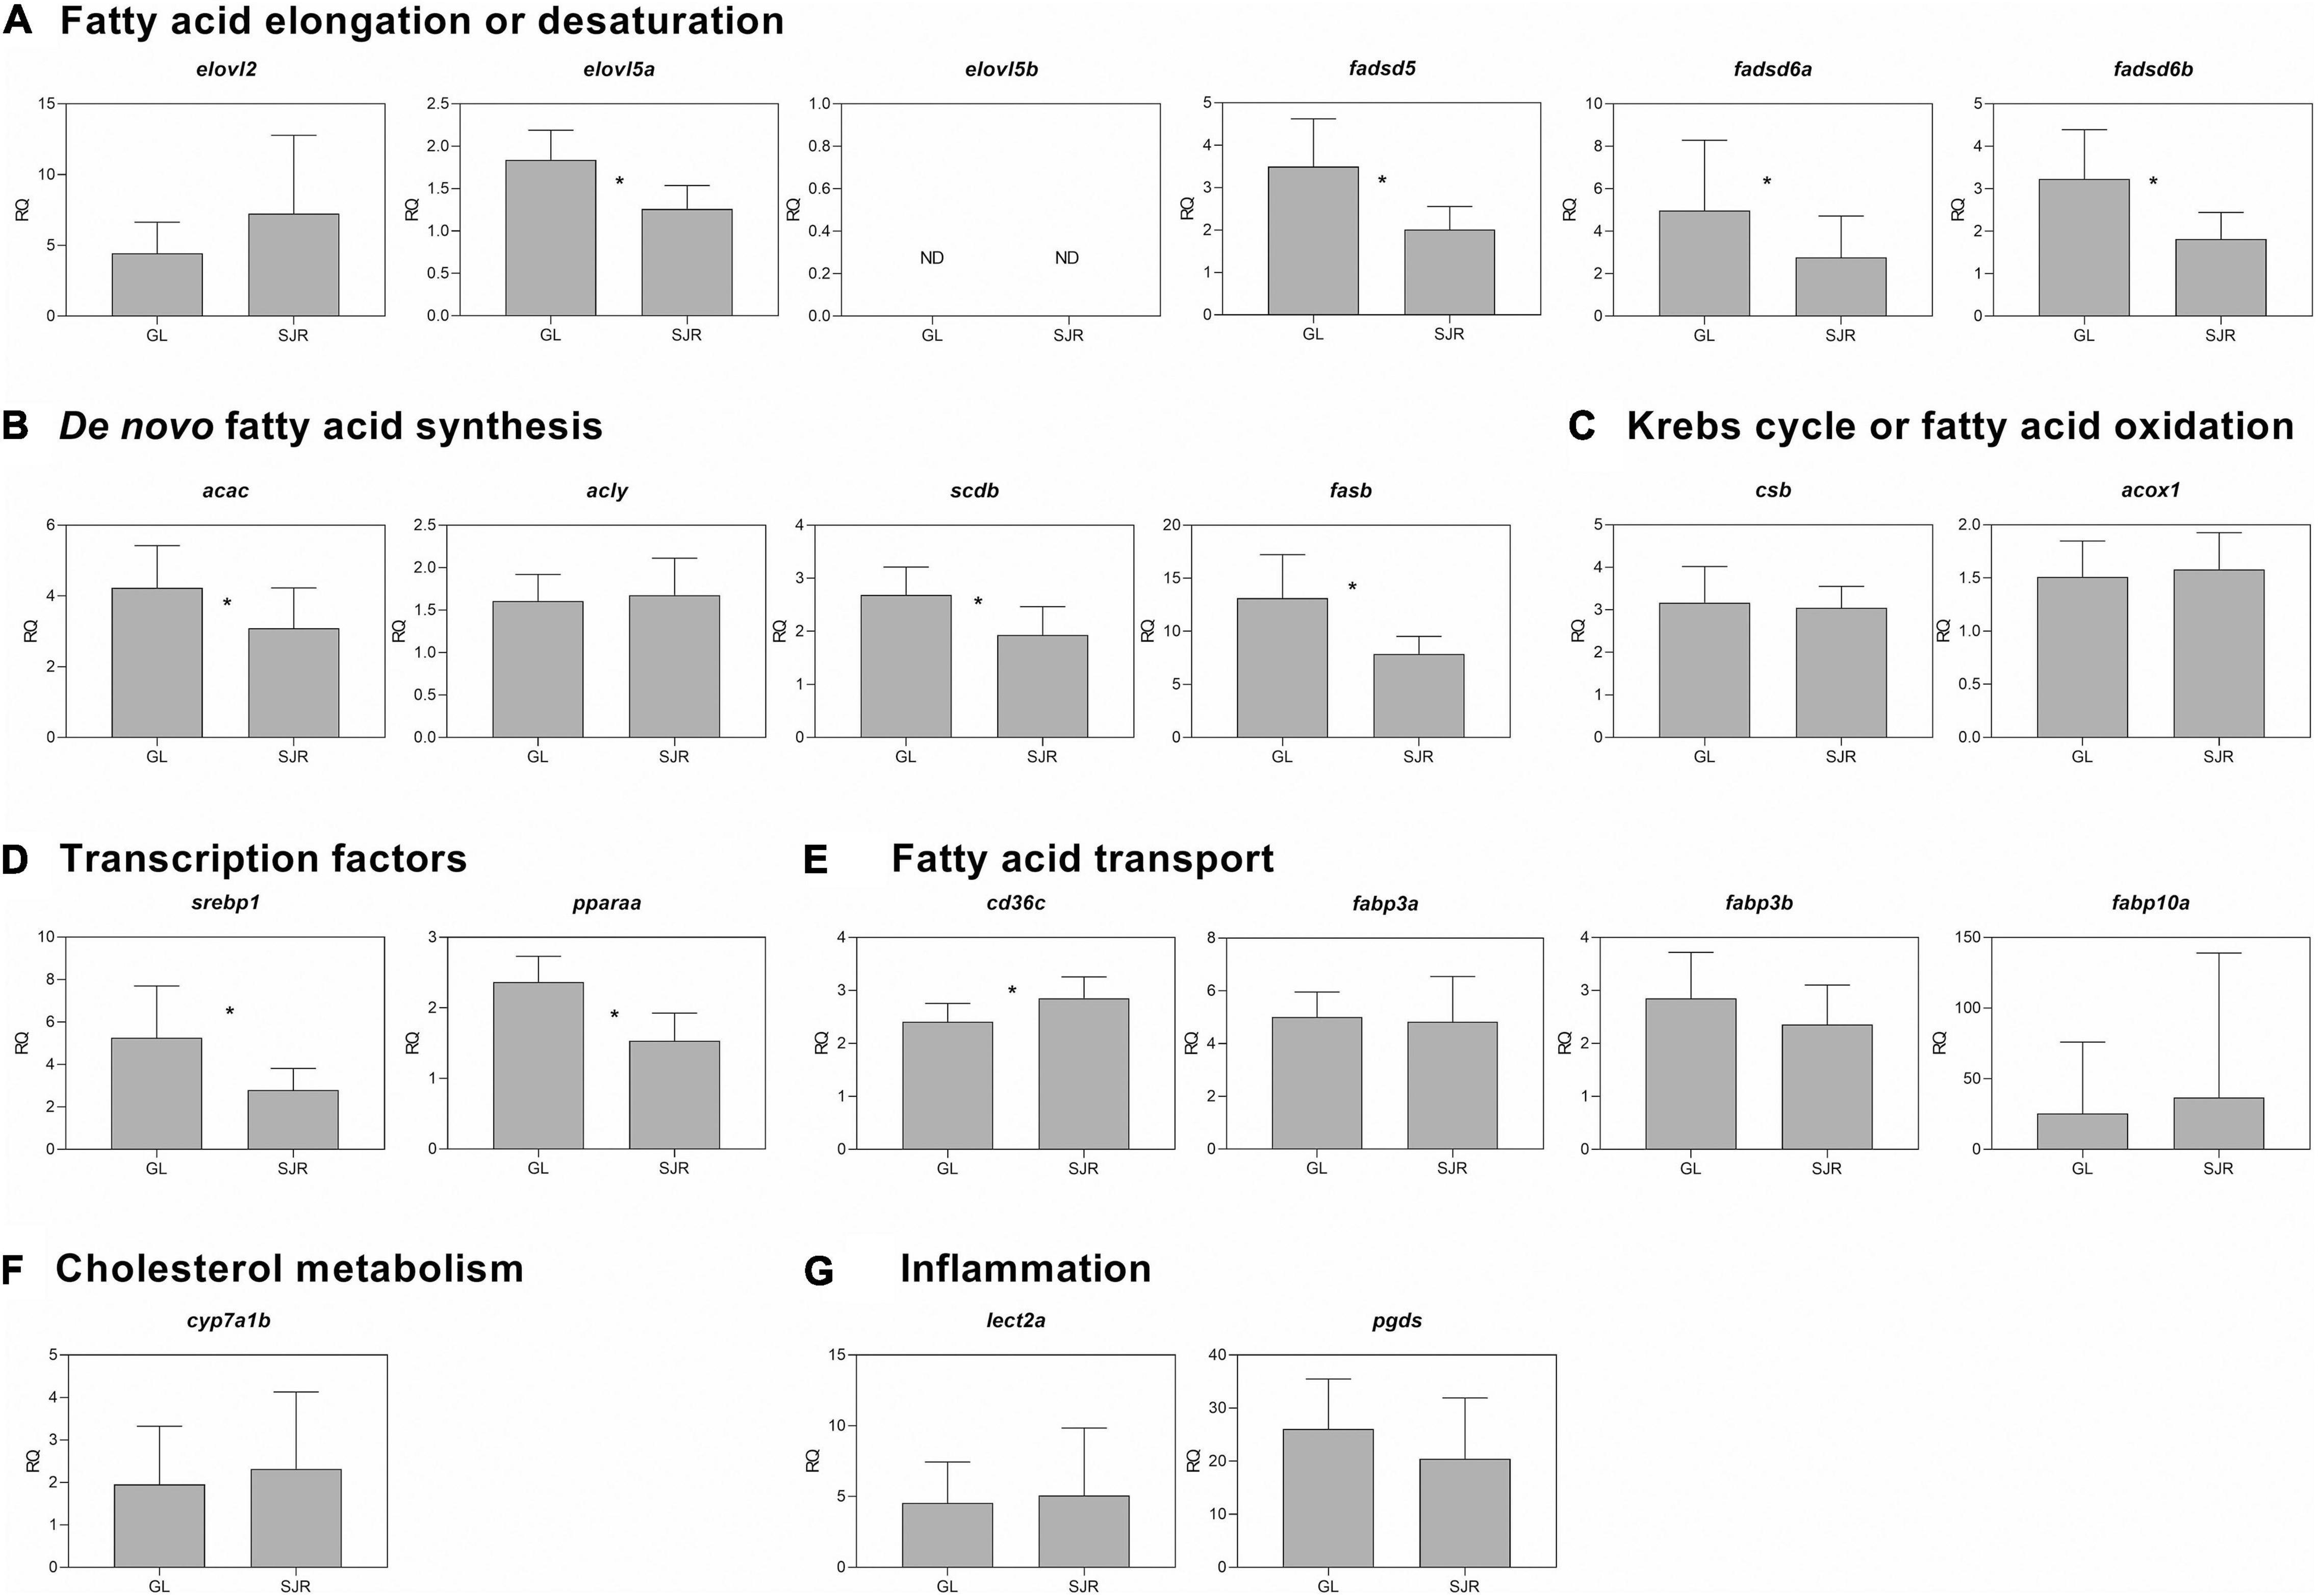
Figure 3. qPCR analyses of transcripts with functional annotations related to lipid metabolism, cholesterol metabolism, eicosanoid pathways and inflammation in muscle of individual fish from Grand Lake (GL) and Saint John River (SJR) strains at week 0. These transcripts include those involved in fatty acid (FA) elongation or desaturation (panel A), de novo FA synthesis (panel B), Krebs cycle or oxidation (panel C), transcription factors (panel D), fatty acid transport (panel E), cholesterol metabolism (panel F), and inflammation (panel G). Transcript levels are presented as mean ± SD relative quantity (RQ) values (i.e., values for the transcript of interest were normalized to both ef1a1 and pabpc1 transcript levels and were calibrated to the individual with the lowest normalized expression level of that given transcript). ND indicates that this transcript (elovl5b) was not expressed at detectable levels at week 0. *Indicates a significant difference in expression levels between fish from GL and SJR. In all cases, n = 10 and p < 0.05 was considered statistically significant.
At week 16, levels of the desaturation transcript, fadsd5, were higher in the GL strain fed the FO-free diet compared to those fed the FO diet in both strains (Figure 4A and Supplementary Table 5). Fadsd6a was only higher in the SJR strain fed the FO-free diet compared to the SJR strain fed the FO diet (Figure 4A). Fadsd6b was higher in the GL strain fed the FO-free diet compared to the remaining groups (Figure 4A). The two-way ANOVA results showed that strain and diet were significant factors for fadsd5 and fadsd6b (Supplementary Table 5). Diet was also a significant factor for elovl2, elovl5a, and fadsd6a. A significant interaction between diet and strain was only observed in fadsd6b (Supplementary Table 5).
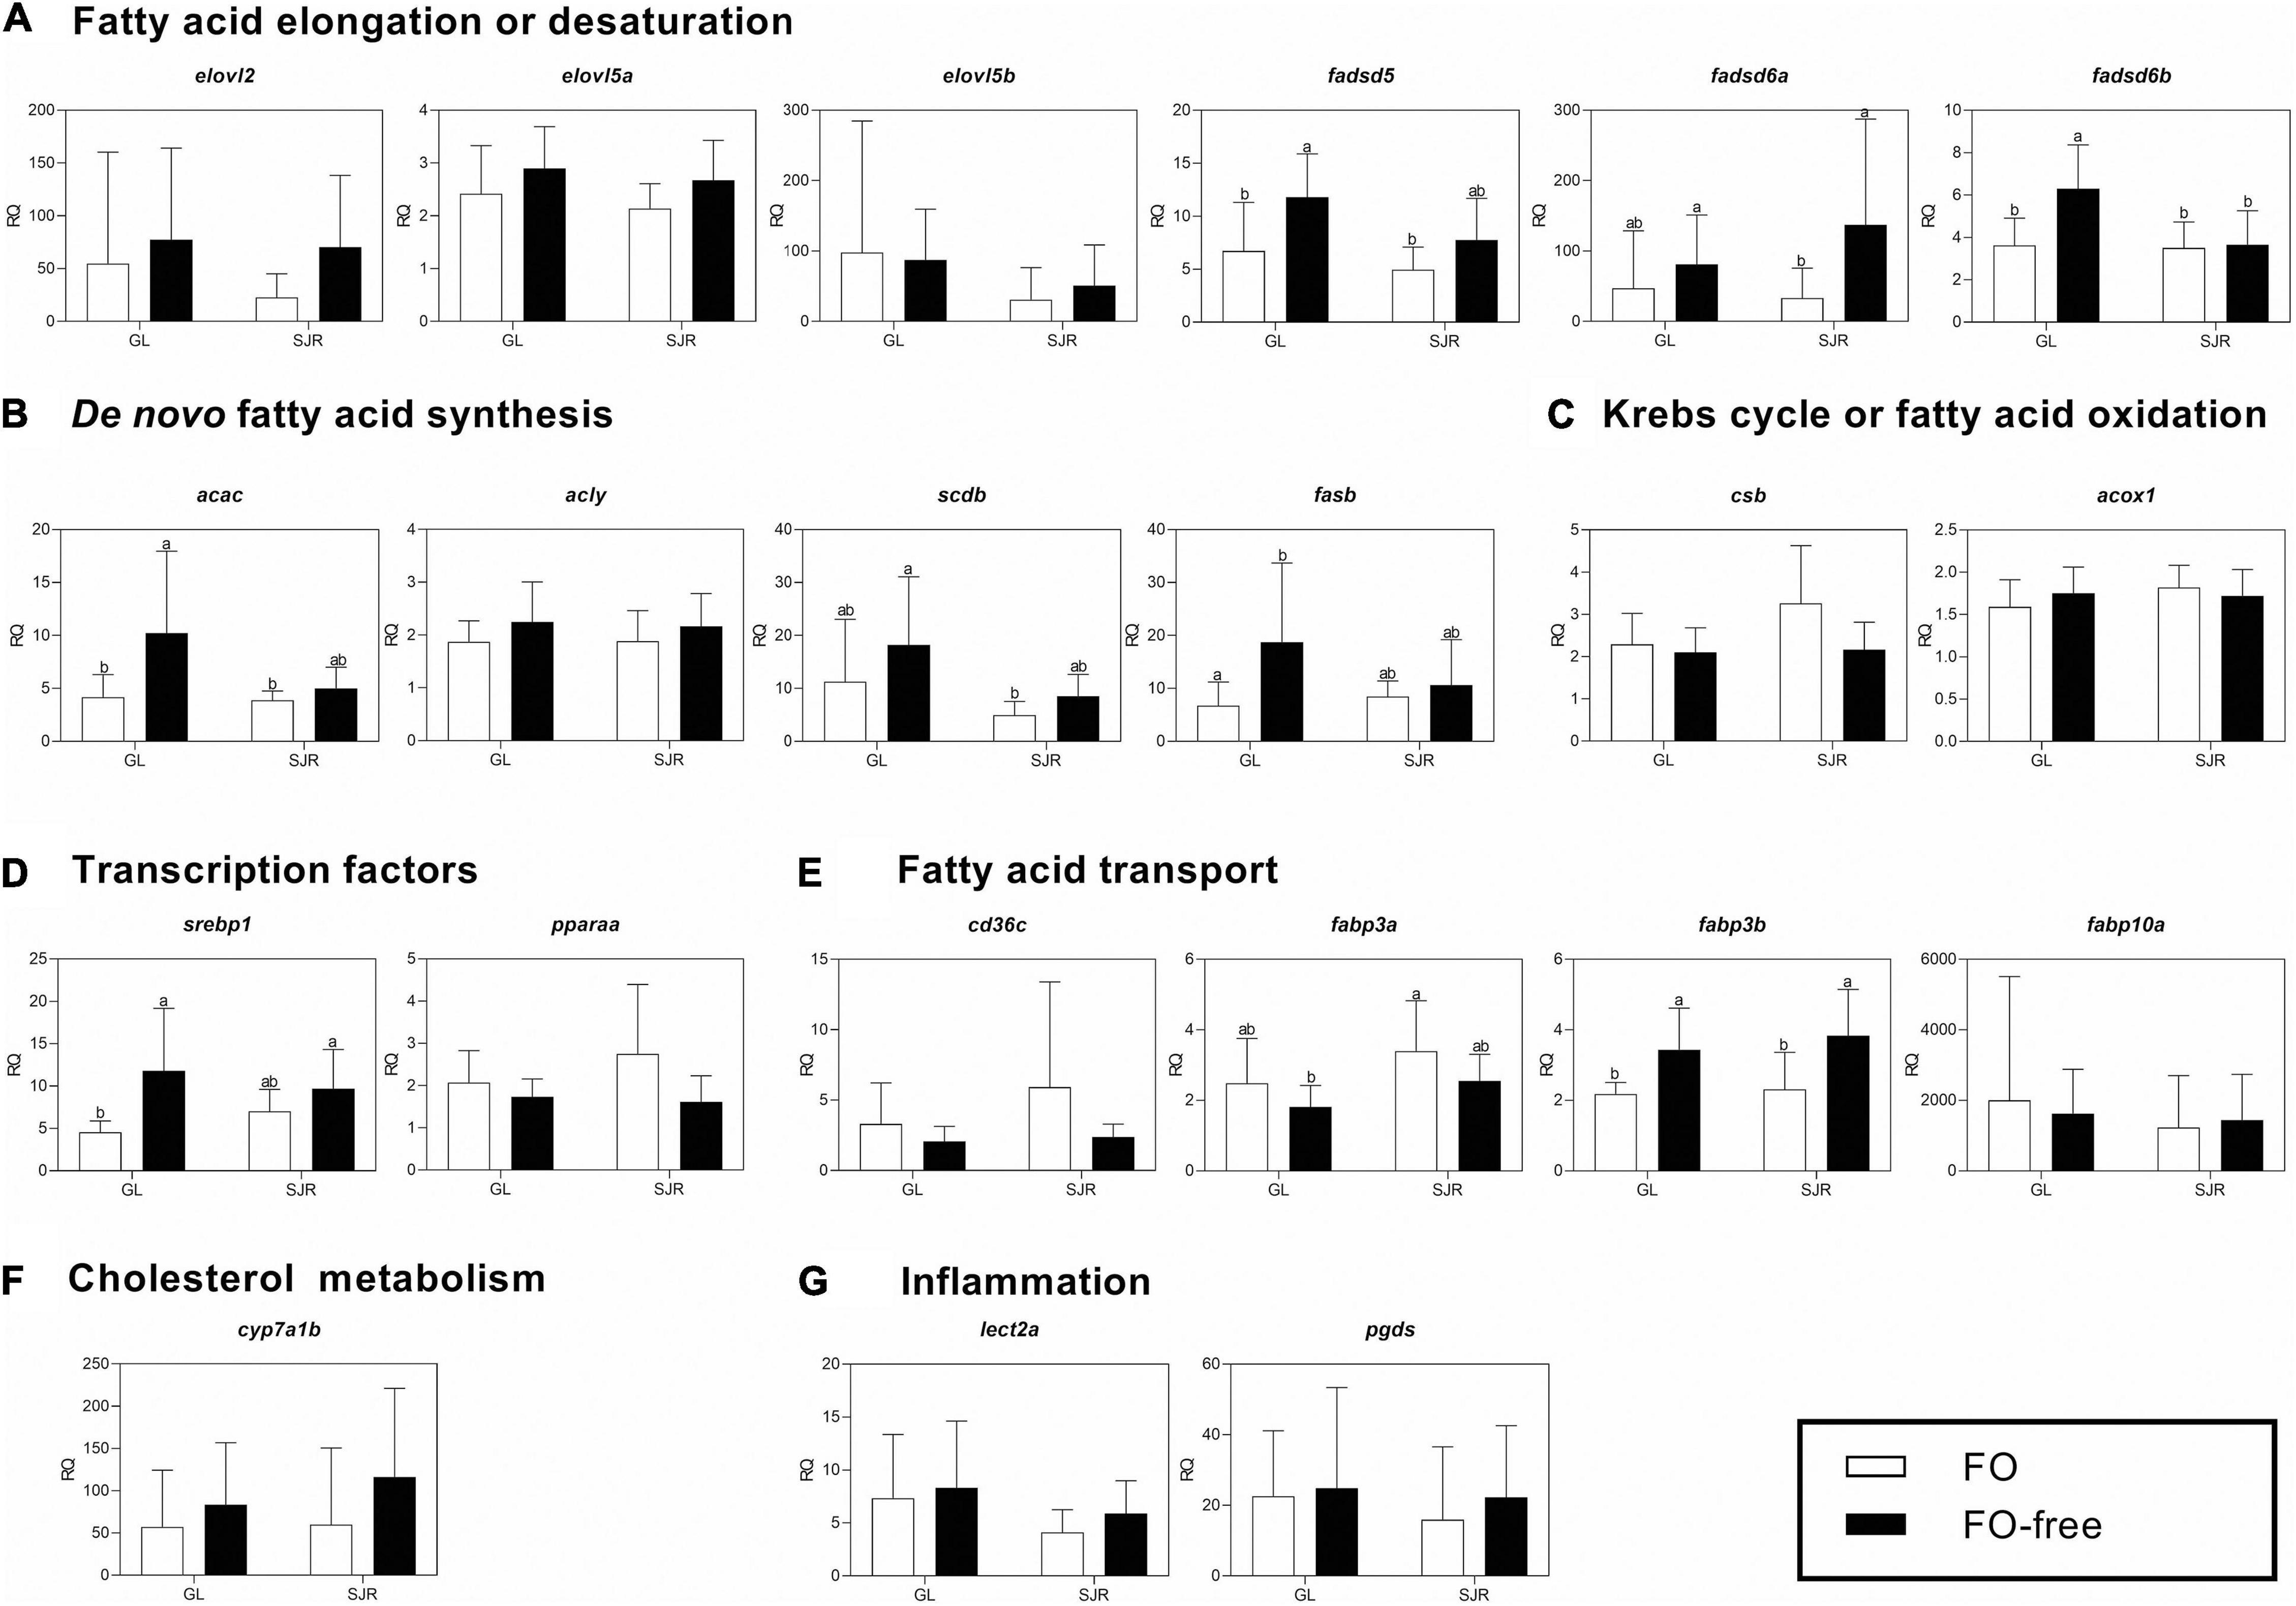
Figure 4. qPCR analyses of transcripts with functional annotations related to lipid metabolism, cholesterol metabolism, eicosanoid pathways and inflammation in muscle of individual fish from Grand Lake (GL) and Saint John River (SJR) strains fed two different diets [fish oil (FO) or FO-free] for 16 weeks. These transcripts include those involved in fatty acid (FA) elongation or desaturation (panel A), de novo FA synthesis (panel B), Krebs cycle or oxidation (panel C), transcription factors (panel D), fatty acid transport (panel E), cholesterol metabolism (panel F), and inflammation (panel G). Transcript levels are presented as mean ± SD relative quantity (RQ) values (i.e., values for the transcript of interest were normalized to both ef1a1 and pabpc1 transcript levels and were calibrated to the individual with the lowest normalized expression level of that given transcript). Letters indicate Tukey’s HSD groupings. In all cases, n = 10 and p < 0.05 was considered statistically significant.
The de novo FA synthesis transcripts, acac and fasb, were higher in the GL strain fed the FO-free diet compared to those fed the FO diet (either strain; Figure 4B). The two-way ANOVA showed a significant strain effect for scdb and significant diet effect for all of the targeted transcripts, except for acly (Supplementary Table 5). The Krebs cycle transcript, csb (Figure 4C), showed a significant diet effect for the two-way ANOVA (Supplementary Table 5). The transcription factor, srebp1, was higher in the GL strain fed the FO-free diet compared to those fed the FO diet (Figure 4D). Strain was a significant factor in the two-way ANOVA for both srebp1 and pparaa (Supplementary Table 5).
The transport transcript, fabp3b, was higher in salmon fed the FO-free diet compared to salmon fed the FO diet, in both strains (Figure 4E). Diet was a significant factor in the two-way ANOVA (Supplementary Table 5). Fabp3a was higher in the SJR strain fed the FO diet compared to the GL strain fed the FO free diet (Figure 4E). Strain and diet were both significant factors in the two-way ANOVA for fabp3a (Supplementary Table 5). There were no significant differences in transcript expression among treatments for transcripts related to cholesterol metabolism (Figure 4F) or inflammation (Figure 4G).
Transcript fold-changes between strains (where the RQ value of the FO-free treatment was compared to the RQ value of the FO treatment) were significantly higher in the GL strain compared to the SJR strain for fadsd6b, csb, and srebp1 (Supplementary Table 7). Other transcripts showed numerical differences in fold-change values between strains but were not statistically different. For example, fadsd6a was expressed 4-fold higher in the SJR strain comparing the FO-free to the FO treatment, whereas in the GL strain, the difference between treatments was <2-fold.
Principle Coordinate Analysis
For liver, the PCoA revealed three distinct clusters showing a dispersion due to diet and strain differences at week 16 (Figure 5). The PCoA explained 75% of the total variation in the data matrix, with PCO1 accounting for most of the variance (65%). Clustering showed distinct groups that segregated data points based on diet, separated by PCO1. PERMANOVA confirmed that diet was a significant factor in the variation (Pseudo F-value = 28.5; p(perm)-value = 0.001). Strain was also a significant factor (Pseudo F-value = 9.99; p(perm)-value = 0.001), which is observable among salmon fed the FO-free diet, where there is a separation between the GL strain and the SJR strain by PCO2. Strain and diet were not interacting factors. FA vectors such as DHA, EPA, total n-3, n-3/n-6, 14:0, 15:0 correlated (> 0.75) with data points from salmon clustered in the FO diet treatment. FAs and TOIs such as MUFA, 18:1n-9, elovl5b, acac, scdb, acly, fasb, csb, acox1, elovl5a, fabp3b, srebp1, cd36c, fabp3a, elovl2, fadsd5, fadsd6a, 20:3n-6, 22:5n-6, 18:3n-6, total n-6 and 22:4n-6 were correlated with data points from the GL strain fed the FO-free diet.
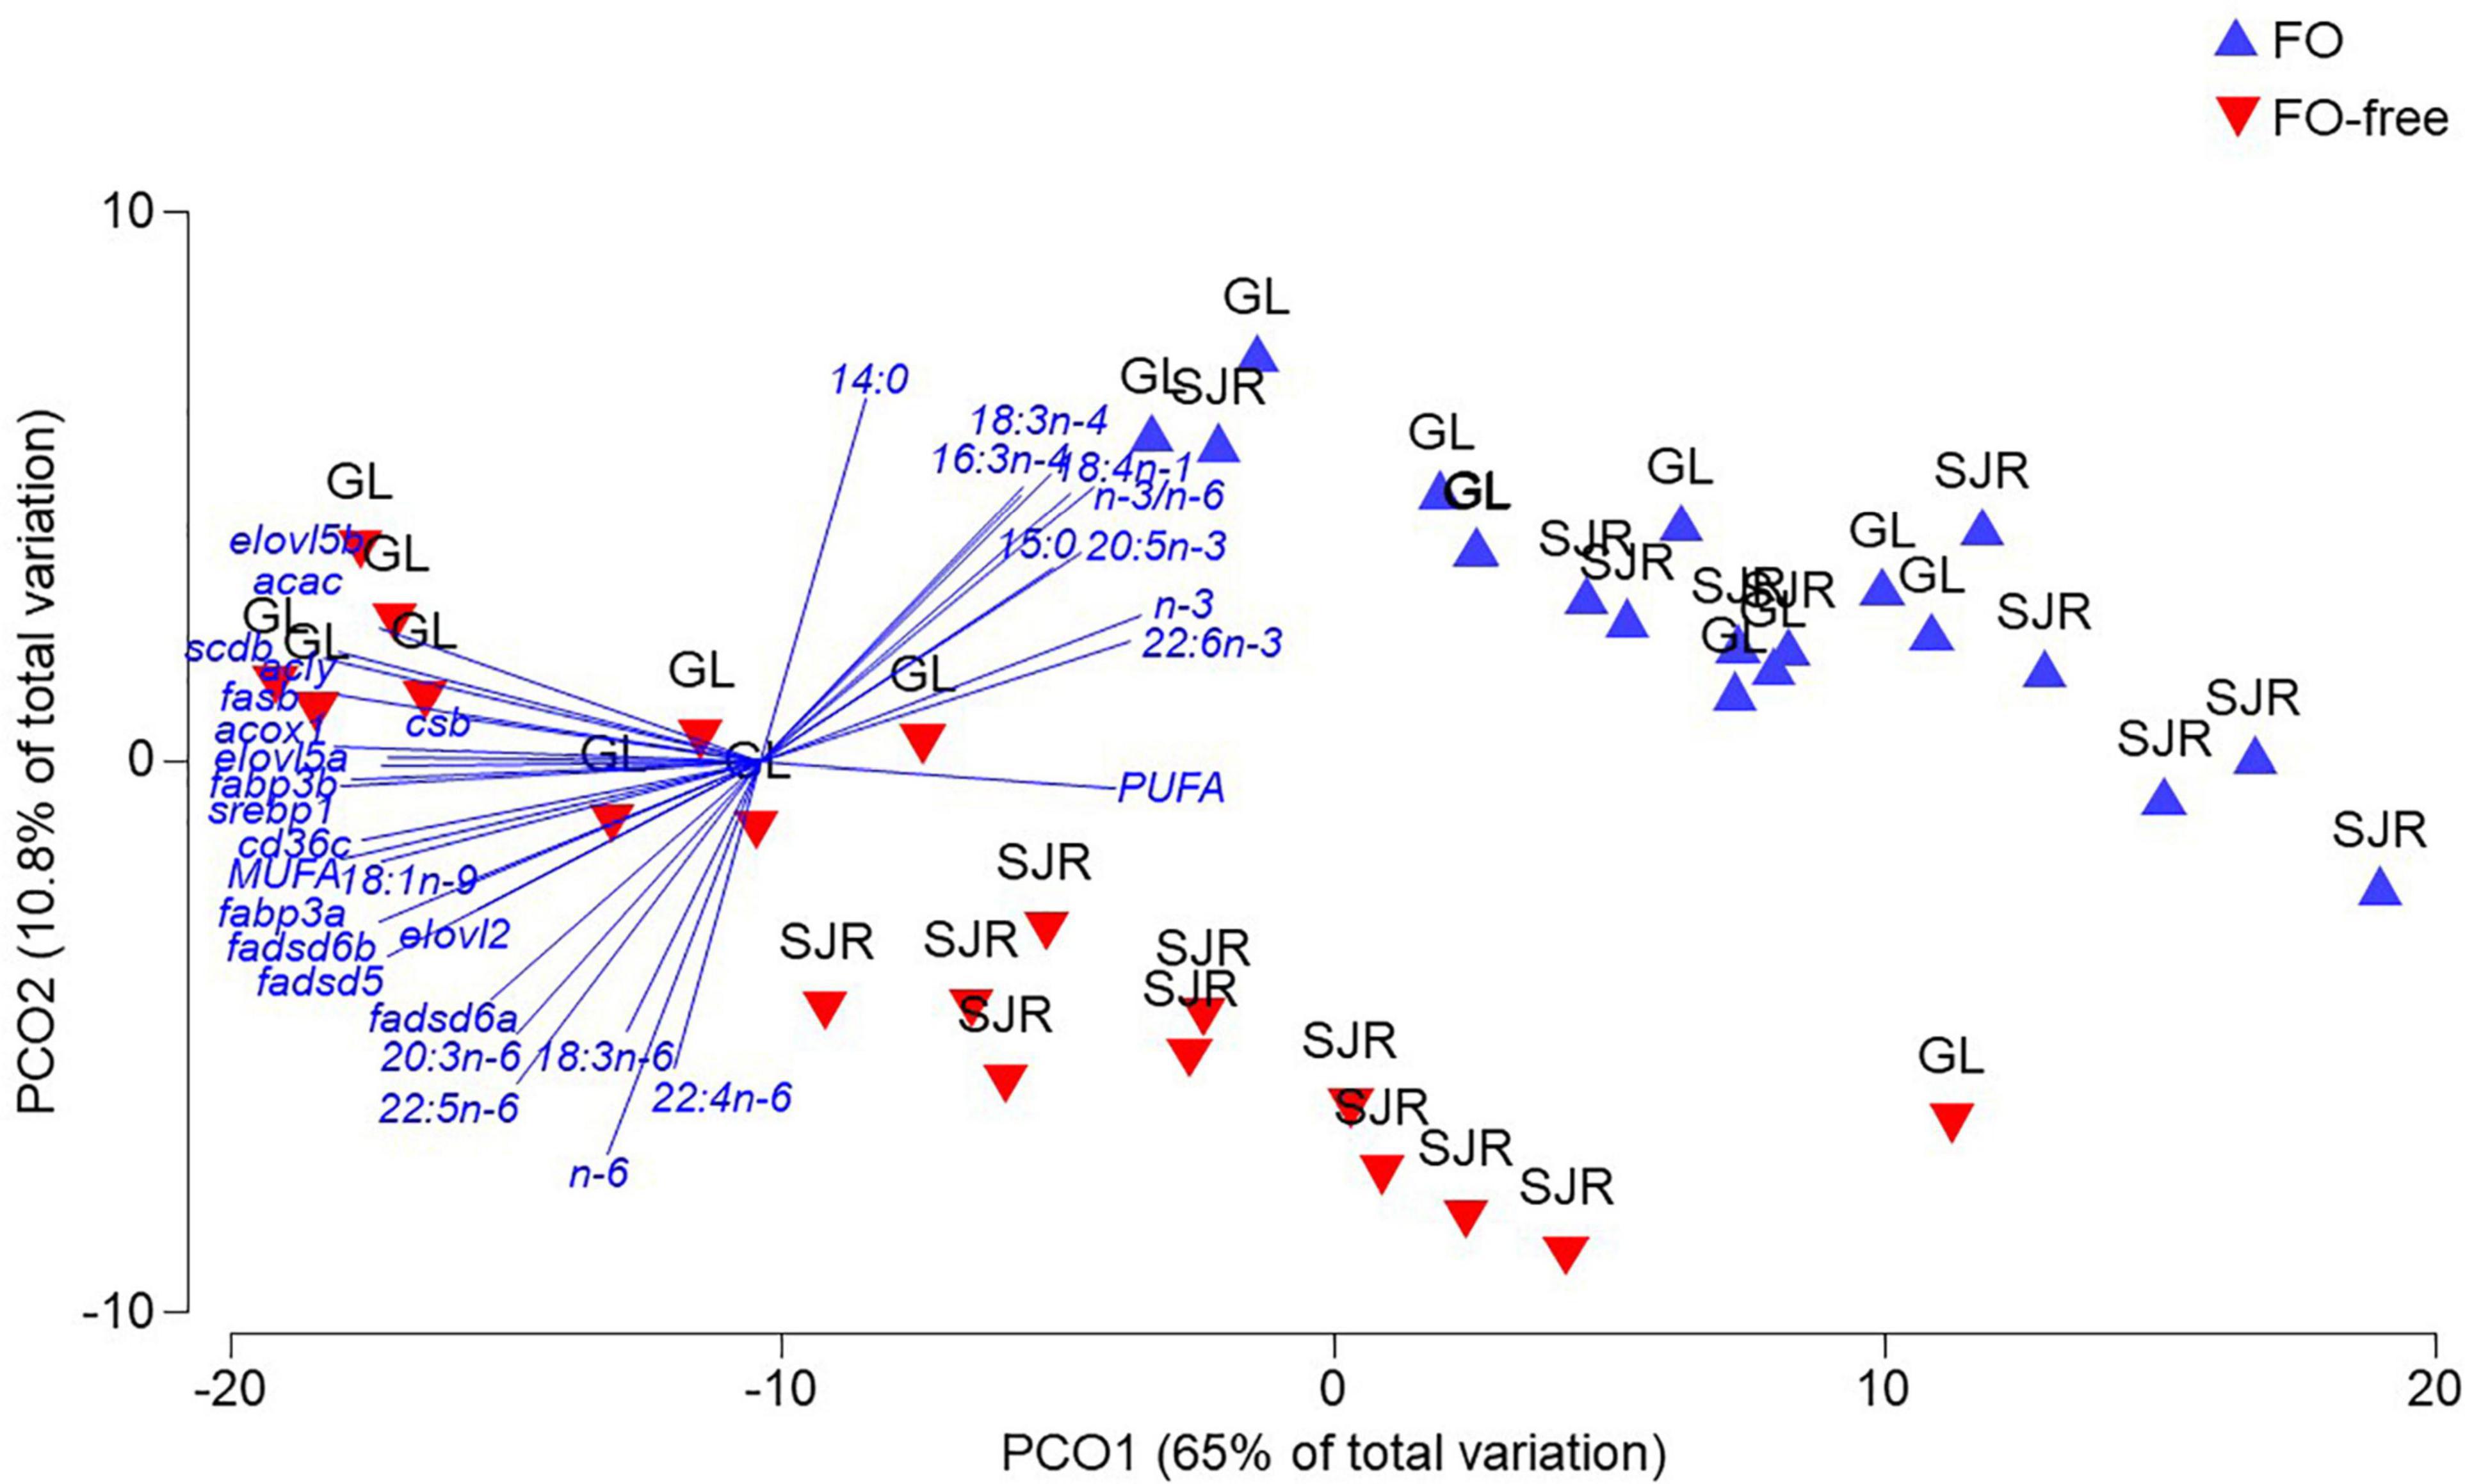
Figure 5. Principal Coordinate Analysis (PCoA) of fatty acid (FA) and transcript expression in liver of salmon after 16 weeks, fed either fish oil (FO) or FO-free diets, and either Grand Lake (GL) or Saint John River (SJR) strain. A permutational MANOVA (PERMANOVA) was performed to determine strength and significance level of variation due to diet (p = 0.001) and strain factors (p = 0.001). Data were square root transformed to ensure data normality and homogeneity of variance prior to analysis.
For muscle, the PCoA revealed two distinct clusters showing a difference in dispersion due to diet (Figure 6). The PCoA explained 79% of the total variation in the data matrix, with PCO1 accounting for most of the variance (63.5%). Clustering showed two distinct groups that segregated data points based on diet separated by PCO2, and PERMANOVA confirmed that diet was a significant factor in the variation (Pseudo F-value = 6.0882; p(perm)-value = 0.007). Strain (p = 0.409) and the diet × strain interaction (p = 0.604) were not significant. FA vectors such as LNA, 18:3n-6, 20:3n-6, ARA, total n-6, 16:1n-9, 18:1n-9, total MUFA and DHA/EPA correlated (> 0.75) with data points from salmon clustered in the FO-free diet treatment, separated by PCO2. TOIs including fabp10a, elovl5b, elovl2, cyp7a1b, elovl5a, fadsd6a, scdb, and fadsd5 were correlated with salmon fed the FO-free diet.
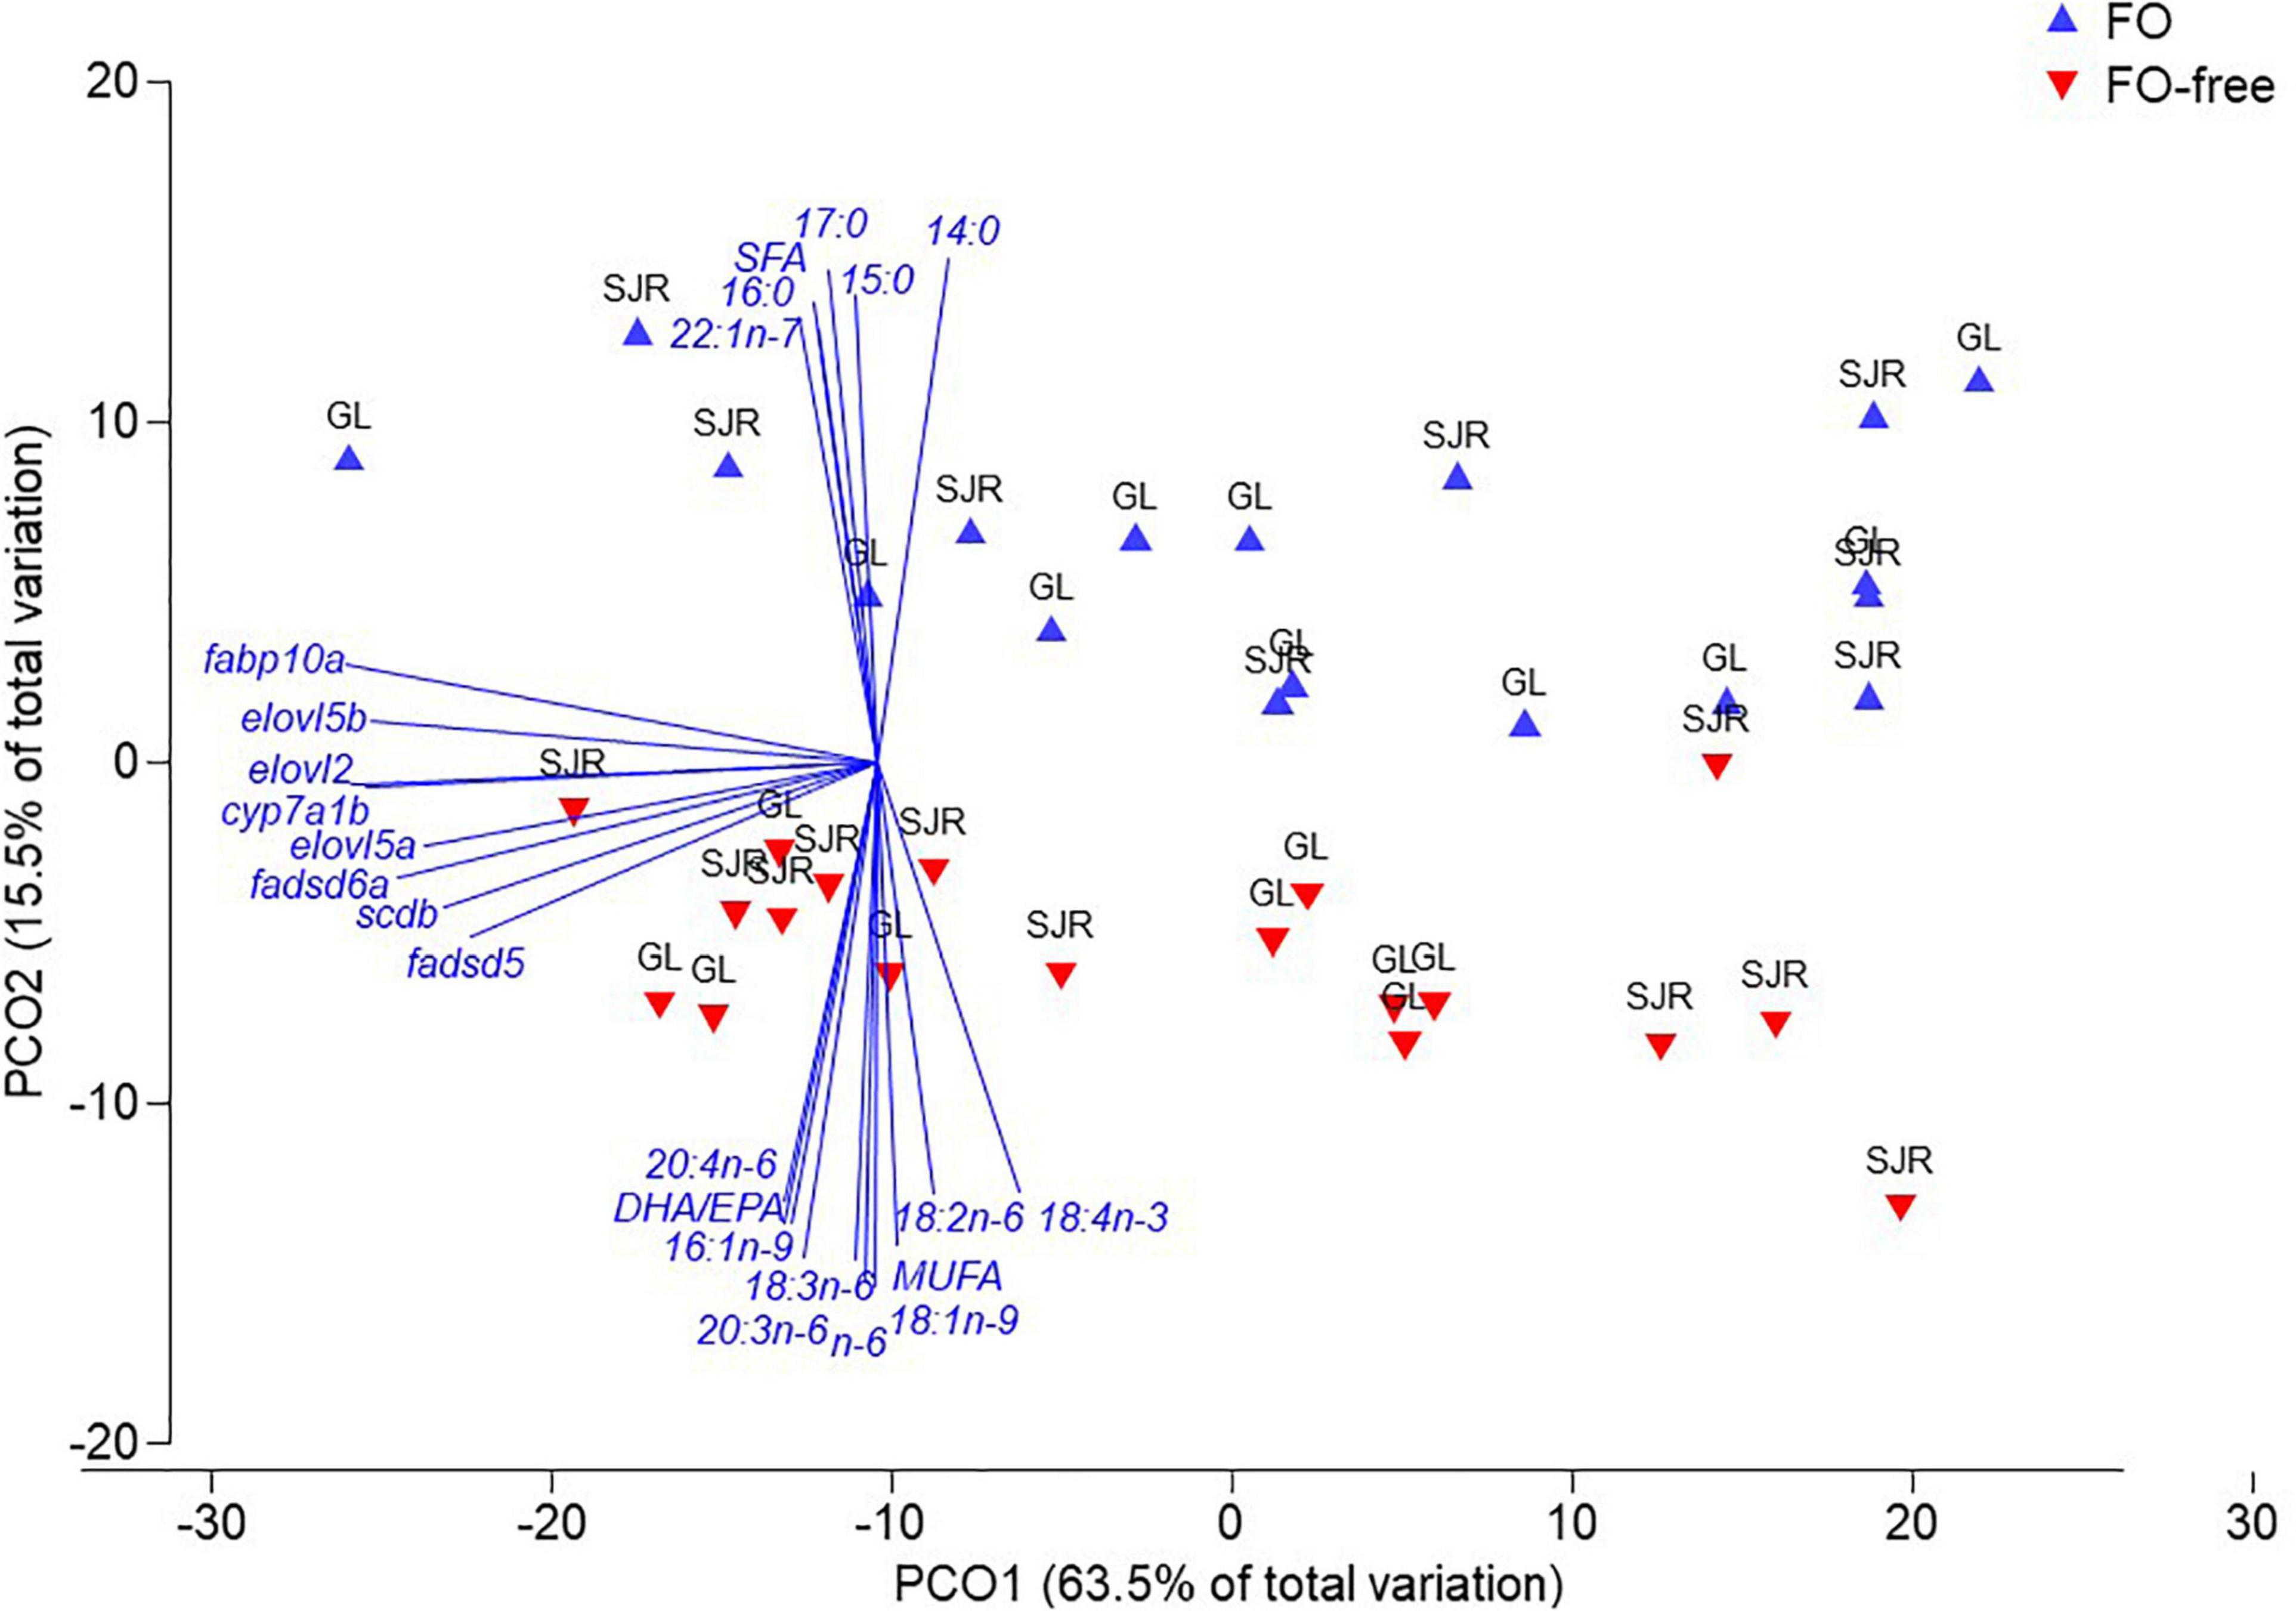
Figure 6. Principal Coordinate Analysis (PCoA) of fatty acid (FA) and transcript expression in muscle of salmon after 16 weeks, fed either fish oil (FO) or FO-free diets, and either Grand Lake (GL) or Saint John River (SJR) strain. A permutational MANOVA (PERMANOVA) was performed to determine strength and significance level of variation due to diet (p = 0.001) and strain factors (p = 0.001). Data were square root transformed to ensure data normality and homogeneity of variance prior to analysis.
Correlations Between Transcript Expression and Tissue FAs
In liver, considering the relationship between transcript expression levels and FA storage, n-3 PUFA were negatively correlated with the RQ values of elovl2, elovl5a, elovl5b, fadsd5, fadsd6a, fadsd6b, and n-6 PUFA were positively correlated with the RQ values of these transcripts (Table 8). The GL strain showed overall more significant relationships between the RQ values and liver FA, particularly with n-3 PUFA, but the SJR strain showed more significant relationships with n-6 PUFA. In muscle, the SJR strain did not show any significant relationships between the RQ values and FA (Table 8). However, for the GL strain, significant relationships were observed comparing fadsd5 and fadsd6a to several FAs, including DHA, EPA, ARA, total n-3, total n-6, 20:4n-3, 22:5n-3, 18:3n-6, and 20:3n-6. There were more significant relationships comparing liver transcript expression to muscle FA, than comparing muscle transcript expression to muscle FA (Table 8). The GL strain showed more significant relationships between liver transcript expression and muscle FA than the SJR strain.
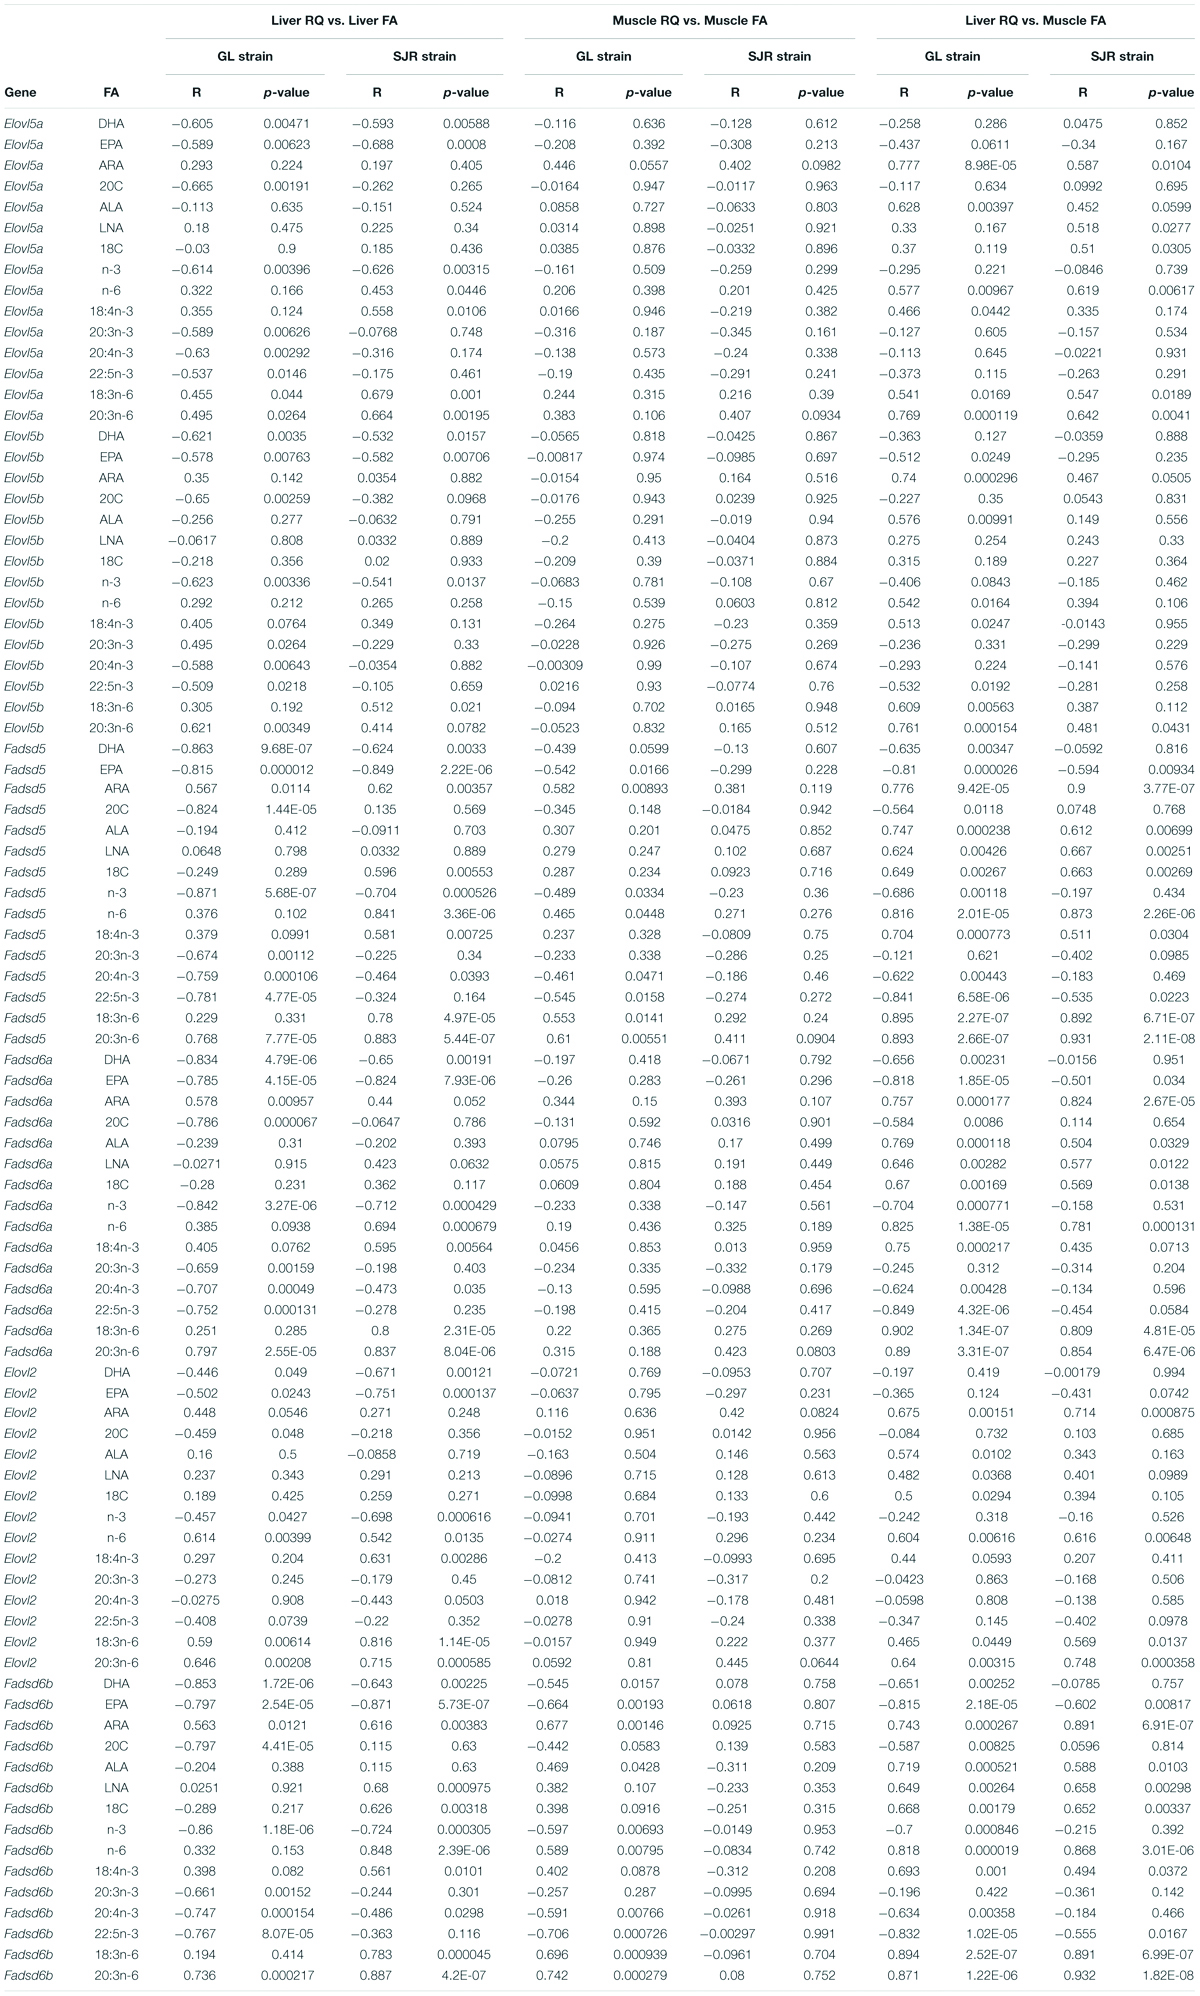
Table 8. Correlation analyses (Pearson correlation coefficient, R) comparing relationships among transcript expression (RQ values) of LC-PUFA synthesis-relevant genes with relevant n-3 and n-6 PUFA in liver and muscle for each strain (GL; Grand Lake, SJR; Saint John River).
Discussion
Broodstock selection efforts for the commercial SJR strain have focused on genetic improvement of production traits such as size and growth, disease resistance, and late sexual maturation (Holborn et al., 2018, 2020; Schaeffer et al., 2018; Boulding et al., 2019). Selection efforts focused on adaptation to plant-based diets, particularly the ability to synthesize LC-PUFA, are now emerging (Ruyter et al., 2015). Previous studies have shown potential that landlocked salmon can synthesize and store more LC-PUFA compared with their commercial anadromous strain counterparts (Peng et al., 2003; Rollin et al., 2003; Betancor et al., 2016). To determine if landlocked Atlantic salmon could be a potential broodstock strain in commercial production for the enhancement of LC-PUFA synthesis, a 2 × 2 factorial nutritional study testing two feeds containing either FO or plant-based oil (FO-free) as the added lipid was conducted over 16 weeks in two populations of Atlantic salmon, the commercial SJR strain and the GL landlocked strain. Overall, there were clearly strain-related differences in growth performance, fatty acid content and transcript expression in liver (and to a lesser extent in the muscle) comparing the GL strain to the SJR strain. Diet influenced transcript expression differently for the GL strain compared to the SJR strain regarding FA metabolism. The results suggest that the GL strain adapted to the FO-free diet differently than the SJR strain.
Growth Performance
Growth performance of GL strain salmon fed the FO diet was poorer compared to the SJR strain (regardless of the diet the SJR strain was fed). However, the GL strain fed the FO-free diet grew slightly more (final weight 180.1 g/fish) than those fed the FO diet (167.5 g/fish), and did not differ from the SJR strain fed the FO-free diet. This suggests that the GL strain may be better capable of using diets with very low levels of LC-PUFA, which may have been more evident over a longer duration of testing. This could be due to their adaptation to the freshwater environment, where the availability of n-3 LC-PUFA is lower than in the marine environment. Our results indicate inherent differences in growth between the strains; this difference may be more distinct as the SJR strain has been selected for fast growth over several generations (Schaeffer et al., 2018).
In previous experiments, it has been shown that landlocked strains showed a higher growth rate than anadromous strains of the same age, regardless of diet (Peng et al., 2003; Rollin et al., 2003; Betancor et al., 2016). Peng et al. (2003) suggested that this was explained by a higher fat retention capacity in landlocked fry than in its anadromous counterpart, which may reflect an adaptation to the freshwater environment, where the food chain is possibly poorer in lipids and FAs than in the marine environment (Pickova et al., 1999). In the present study, the GL strain fed the FO-free diet did not outperform the SJR strain, but rather showed similar growth performance. In comparison to other studies, the growth of the SJR strain likely has improved since these studies (e.g., Peng et al., 2003; Rollin et al., 2003) were conducted > 20 years ago, and different commercial and landlocked strains were tested.
Also, differential expression in several metabolic pathways was found between farmed and wild salmon populations at early life stages, suggesting that domestication may influence transcriptomic responses (Roberge et al., 2006, 2008; Bicskei et al., 2014). Even among different (wild) landlocked strains, there is a high variability in growth, depending on the population, which may be the reason why our study with the GL strain showed different results than European landlocked strains which have been studied previously (e.g., Rottiers, 1993; Betancor et al., 2016). For example, analysis of the life history traits of 64 populations of landlocked Atlantic salmon strains revealed high variability in maximum size (where maximum length and maximum age were strongly, significantly correlated), ranging from a maximum of 13 cm in one population, to a maximum of 108.5 cm in another, at maximum age (Hutchings et al., 2019). Key determinants of body size include surface area of the lake and abundance of prey, primarily rainbow smelt (Osmerus mordax) for North American populations (Hutchings et al., 2019). Another important point about size: almost all wild anadromous salmon mature at lengths greater than 50 cm, while almost all landlocked salmon mature at less than 50 cm (Hutchings et al., 2019). Size at maturity is an important consideration for future broodstock programs involving landlocked salmon.
Liver and Muscle Fatty Acid Content
At week 0, prior to feeding the experimental diets, there were already differences in the liver FA profiles, despite all salmon being fed the same commercial diet since first feeding, indicating that these FA differences are inherently due to strain. The C18 FAs (ALA, LNA, and OA) were higher in the GL strain in the liver, while C20 FAs (EPA and ARA) were higher in the SJR strain. The FA profiles of muscle, however, were very similar between strains at week 0. The only difference in the muscle was in 20:3n-6, which was higher in the SJR strain. As found in the present study, many studies have shown that salmon muscle closely reflects dietary FA composition (e.g., Tocher, 2003; Bell et al., 2004; Torstensen and Tocher, 2011; Hixson et al., 2017), while liver FA composition reflects the higher metabolic activity, including LC-PUFA biosynthesis, de novo lipogenesis, lipoprotein metabolism, FA oxidation, and cholesterol metabolism (Jordal et al., 2005). Because we observed differences in liver FA composition between the SJR strain and GL strain even before experimental diets were introduced, this highlights the natural, inherent difference in lipid metabolism and storage between strains. When there are no dramatic changes in dietary lipids, the FA composition of its tissues is not controlled by diet, but mostly by strain-specific factors (Sheridan et al., 1985; Viga and Grahl-Nielsen, 1990). Previous studies have reported greater TAG deposition in landlocked salmon fry than in the anadromous Atlantic salmon fry (Peng et al., 2003). However, it has yet to be determined whether such a greater TAG retention capacity is accompanied by a genetic adaptation to the different lipid composition found in the freshwater vs. marine environment. It also depends on the strains that are being compared.
After 16 weeks of feeding, both liver and muscle showed differences due to treatment effect, strain, and diet. In terms of LC-PUFA, EPA and DHA were lower in both strains fed the FO-free diet, but both strains fed the FO-free diet showed similar levels of EPA and DHA in liver and muscle. Interestingly, total n-6 and ARA were highest in the SJR strain fed the FO-free diet. Because the FO-free diet had lower ARA than the FO diet, storage of ARA in the SJR strain suggests synthesis from dietary LNA. This was not the case in the GL strain fed the FO-free diet. In terms of the LC-PUFA precursors, LNA storage was lower in both strains fed FO diets, but SJR salmon fed the FO-free did not differ among any treatment groups. ALA storage in the liver depended on strain, not diet, and was higher in the GL strain than in the SJR strain that were fed FO-free diets. Total MUFA, OA and C18 PUFA were higher in the liver of GL salmon compared to SJR salmon, both fed FO-free diets. Interestingly, total PUFA was higher in the liver of SJR salmon than that of GL salmon fed FO-free diets, perhaps as a result as higher n-6 (particularly ARA), since total n-3 did not differ between SJR and GL salmon fed FO-free diets. Together, these results suggest an affinity for the SJR strain toward n-6 PUFA synthesis, under circumstances where dietary n-3 LC-PUFA are lacking (i.e., FO-free diets). However, both strains showed similar results for EPA and DHA: lack of dietary FO reduced storage of EPA and DHA in liver and muscle tissue, and the level of EPA and DHA stored in either strain were not different when fed an FO-free diet. These results are similar to that observed in Betancor et al. (2016) comparing muscle tissue n-3 LC-PUFA contents between a landlocked strain and commercial population.
However, in the study by Peng et al. (2003), their results suggest higher synthesis and storage of the n-3 LC-PUFA in the anadromous strain compared to the landlocked strain. In that study, whole body phospholipids of the anadromous fry were characterized by higher n-3 LC-PUFA, total n-3 PUFA, total PUFA levels, as well as the n-3/n-6 ratio, in the anadromous fry compared to the landlocked strain (Peng et al., 2003). In our study, total n-3 PUFA was higher in the GL strain in the liver and total n-6 PUFA was higher in the SJR strain. While the results of our study indicate that the conversion of dietary ALA to n-3 LC-PUFA and LNA to n-6 LC-PUFA was carried out in both strains, it was in a different pattern. This was also previously reported by Rollin et al. (2003).
Collectively, the results in the present study suggest that GL salmon have a higher affinity or capacity for MUFA synthesis and/or storage, while SJR has more affinity or capacity for n-6 PUFA synthesis and storage. Although EPA and DHA storage was generally the same between GL and SJR strains fed FO-free diets, based on FA liver and muscle storage, GL seems to have overall greater n-3 PUFA storage compared to SJR, as well as C18 PUFA synthesis and storage, while SJR appears to have greater n-6 PUFA storage. The liver FA composition can reflect higher metabolic activity (including LC-PUFA biosynthesis), and was clearly more influenced due to strain, rather than diet, while the muscle was clearly more influenced by diet. However, transcript expression in liver can affect the FA composition of muscle (Xue et al., 2015; Betancor et al., 2016; Hixson et al., 2017). This highlights the bottleneck between increased biosynthetic capacity to produce n-3 LC-PUFA in liver toward increased storage of n-3 LC-PUFA in muscle. This is of interest for future work for SJR salmon to store higher EPA and DHA in filets for consumers.
Transcript Expression in Liver
At week 0, prior to the introduction of the experimental diets, there were constitutive transcript expression level differences between the SJR and the GL strains, demonstrating the inherent, biological differences between strains, as was observed in the FA profiles (see Figure 1). For example, the GL strain showed significantly higher levels of elovl5b, acac, scdb, acox1, pparaa, fabp3b, fabp10a, and pgds compared to the SJR strain. On the other hand, fadsd6a was higher in the SJR strain. The significantly higher levels of de novo FA synthesis transcripts (i.e., acac and scdb) were also reflected in MUFA levels in the liver of the GL strain at week 0 (see Figure 1B and Table 4). Elovl5b has been previously shown to have a role in MUFA synthesis, besides C18 PUFA elongation (Morais et al., 2009; Tripathy et al., 2014). This result could indicate a higher lipogenic and possible higher glycolytic activity in the GL strain compared to the SJR strain, which could suggest a better use of carbohydrate as a source of energy and adapting to lower dietary LC-PUFA using carbohydrate or protein. In fact, there is evidence to suggest that landlocked salmon have improved metabolic capacity to utilize dietary carbohydrates compared to the commercial strain, based on post-prandial plasma glucose levels after feeding a high starch diet (Betancor et al., 2018). Although these results suggest higher lipogenesis and de novo FA synthesis in the GL strain, the peroxisomal FA oxidation transcript, acox1 (which assists in breaking down lipids and fatty acids), was also more highly expressed in the GL strain, which is slightly contradicting. However, this could explain the lower levels of ARA and EPA at week 0 in the liver of the GL strain compared to the SJR strain, as 22:5n-6 and DHA may have been retro-converted via acox1, especially with its known affinity toward very long chain FA. The SJR strain showed a higher level of the FA desaturation transcript, fadsd6a, which could support the observation of higher levels of ARA and EPA in liver.
At week 0, liver transcript expression levels of master regulator pparaa were 3-fold higher in the GL strain compared to the SJR strain (see Figure 1D). Pparaa is one of the primary regulators of LC-PUFA biosynthesis through fadsd2 (the first step of elongating C18 FAs; Dong et al., 2017). Unfortunately, fadsd2 transcript levels were not determined in this study. However, the higher levels of FA transport transcripts, fabp3b and fabp10a, in the GL strain may suggest a higher ability of FA uptake, intracellular transport, and metabolism of LC-PUFA in the GL strain compared to the SJR strain. Pgds, encoding prostaglandin D2 (PGD2) synthase, was expressed at 3-fold higher levels in the liver of the GL strain compared to the SJR strain at week 0, suggesting higher basal levels of PGD2 mediators in the GL strain. This suggests that there may be underlying differences in the inflammatory state of these two strains at week 0, prior to feeding experimental diets. Previous research has shown that Atlantic salmon (SJR strain) fed a terrestrial-based diet (based on animal byproducts and vegetable oil) showed lower hepatic EPA/ARA which correlated with increased expression of hepatic pgds (Caballero-Solares et al., 2020). Another study found negative correlations between the transcript expression of hepatic pgds with DHA and the sum of EPA + ARA + DHA (Katan et al., 2019). While both of these previous studies indicate dietary impacts on hepatic pgds expression, in the present study, the fact that both strains were fed the same commercial diet prior to week 0, and yet had different pgds expression, is interesting and warrants further investigation.
At week 16, both strains of salmon fed the FO-free diet showed higher expression levels of transcripts involved in elongation or desaturation, and de novo FA synthesis pathways (i.e., elovl2, fadsd5, fadsd6a, fadsd6b, and fasb) compared to the FO treatment (see Figures 2A,B). This is likely in response to lower dietary EPA and DHA content, as it has been well characterized for Atlantic salmon, that feeding diets with low dietary EPA and DHA content causes higher expression levels of transcripts involved in the LC-PUFA biosynthetic pathway (e.g., Thomassen et al., 2012; Glencross et al., 2015; Xue et al., 2015; Hixson et al., 2017; Mock et al., 2019). In the liver, the SJR strain showed higher expression levels of fadsd6a compared to the GL strain when fed the FO-free diet. However, the GL strain fed the FO-free diet showed higher transcript expression levels of elovl5b compared to the SJR strain fed both diets. Both fadsd6a and elovl5b showed a significant strain effect in this study. Interestingly, ARA levels in the liver were higher in the SJR strain compared to the GL strain fed the FO-free diet, but there were no differences in EPA and DHA levels between strains fed the FO-free diet. This raises questions with regard to the role of fadsd6a compared to fadsd6b in n-6 LC-PUFA biosynthesis, since only fadsd6a transcript expression differed between the strains fed the FO-free diet. This is an interesting result because there are three potentially functional fadsd6 gene paralogs in Atlantic salmon, and each appeared to show a different pattern of regulation in response to a diet that was primarily vegetable oil-based in a farmed salmon stock (Monroig et al., 2010). The results in the present study regarding the LC-PUFA biosynthesis pathway are quite different than those found by Betancor et al. (2016). In that study, in liver of landlocked salmon, expression levels of transcripts involved in desaturation or elongation were higher than the commercial anadromous strain, regardless of diet. That study also found that the landlocked population did not show the same response to a rapeseed oil diet as the commercial strain, because the landlocked strain did not show a difference in expression of hepatic transcripts involved in LC-PUFA biosynthesis, regardless if they were fed the FO-free diet or a FO-based diet (Betancor et al., 2016). Our study clearly indicates that both the SJR strain and the GL strain responded differently to the FO-free diet compared to the FO diet. The contrasting results between the present study and that of Betancor et al. (2016) suggest genetic and metabolic adaptational differences among various landlocked salmon populations.
On the other hand, in liver, the GL strain fed the FO-free diet appeared to show higher expression levels of transcripts involved in de novo FA synthesis (acac and acly), as well as higher fold-change differences between FO-free and FO diets groups, compared to the SJR strain. For example, this was clear for acac and acly, which were higher in the GL strain fed the FO-free diet compared to the SJR strain fed the FO-free diet. For acac, the GL strain showed a > 3-fold significant difference between the FO-free and FO treatments, compared to the SJR strain, which showed a 2-fold difference (not significant) between diet treatments. For fasb, although the comparison between strains fed the FO-free diet was not significant, there was a significant difference within the GL strain, which showed a > 8-fold difference comparing the FO-free and FO treatments, as well as a significant difference within the SJR strain, which showed a 5-fold difference. This is further supported with a significant strain effect in all of the targeted de novo FA synthesis transcripts (see Supplementary Table 3). This is also evident in the higher levels of MUFA in the liver of the GL strain fed the FO-free diet compared to the SJR strain fed FO-free diets. These results suggest that the GL strain shows a stronger association with MUFA synthesis when fed the FO-free diet than the SJR strain. It is also worth noting that de novo lipogenesis plays an important role in carbohydrate metabolism in salmonids, with excess glucose transformed into fatty acids through de novo lipogenesis (Polakof et al., 2011). With the GL strain showing greater expression of transcripts related to de novo FA synthesis in this study, this may suggest improved utilization of dietary carbohydrates compared to the SJR strain. This was found previously, where landlocked salmon performed better than the commercial strain when fed a high-carbohydrate diet (Betancor et al., 2018).
Fatty acid desaturation, either by MUFA biosynthesis via scdb, or by LC-PUFA biosynthesis via fadsd, may be an attempt to balance cell membrane fluidity and structure in salmon that have been fed the FO-free diet. Additionally, MUFA has a known role in immunity in mammals (Yaqoob, 2002) and can be considered as anti-inflammatory, at least when compared with SFA (Rocha et al., 2017). Also, the desaturation and the elongation pathway (i.e., elovl and fadsd) helps to maintain balance within anti- and pro-inflammatory eicosanoid production in the liver through EPA, DHA and ARA levels stored in the liver. EPA, DHA, and ARA are precursors of eicosanoids that are part of the inflammatory and immune response of salmon (Sissener et al., 2020). Pparaa, a key negative regulator of inflammation (Bishop-Bailey, 2000; Bocher et al., 2002), was more highly expressed in the GL strain fed the FO-free diet compared to the SJR strain fed the FO-free diet. A major role of pparaa is in controlling the reversible induction of β-oxidation, especially in liver, as a response to changing energy requirements and nutritional status (Leaver et al., 2007). Pparaa has also been shown to induce expression of target genes involved in FA oxidation and stimulated FA oxidation in mice (Goto et al., 2011). In addition, the GL strain in this study fed the FO-free diet also showed significantly higher levels of acox1, which encodes a protein that oxidizes LC-PUFA, compared to the GL strain and the SJR strain fed the FO diet. Regarding inflammation, this suggests that the GL strain may be upregulating pparaa and acox1 to oxidize ARA in order to resolve possible inflammation in the liver, due to the lack of dietary FO. The SJR strain, on the other hand, showed lower expression levels of pgds (inflammation-related transcript) when fed the FO-free diet (compared to all other treatments), which may be part of their adaptation to lack of dietary FO. With higher levels of ARA (pro-inflammatory) in the liver of the SJR strain fed FO-free diet, the downregulation of pgds could help balance the possible pro-inflammatory status. Together, these results may suggest that the two strains responded to the FO-free diet differently: the GL strain possibly preferred oxidation of LC-PUFA (ARA) to counteract inflammation, while the SJR strain downregulated pgds to help reduce inflammation. While these are different strategies, both pathways may be in response to balance the inflammatory status that may have been caused by the FO-free diet, which warrants further investigation.
Both pparaa and srebp1 have a major influence in regulating LC-PUFA biosynthesis. The response of pparaa to dietary FA could be a factor in the LC-PUFA biosynthesis abilities among fish (Dong et al., 2017). In the current study, srebp1 was upregulated in salmon fed the FO-free diet in both strains. However, this upregulation was significantly higher in the GL strain compared to the SJR strain, fed the FO free diet. Higher levels of EPA and DHA decreased srebp1 transcript levels in a salmon cell line (Davidson, 2005), and a similar observation was previously reported in a study exploring the genotype effect on Atlantic salmon that were fed diets where FO was replaced (Morais et al., 2011). It is possible that the higher upregulation of srebp1 (which influences regulation of LC-PUFA biosynthesis) in the GL strain (and higher fold-change compared to the SJR strain) might help to overcome the effect of acox1 (oxidation of longer chain FA); however, this was not reflected in the liver EPA and DHA content, since the GL strain and SJR strain were not different. Interestingly, another landlocked salmon population fed a rapeseed oil diet showed stimulation in lipogenic gene expression (fas, pparg, g6pd) as well as an inhibition in lipolysis pathways (cpt2, hoad, aco), indicating a higher capacity for lipogenesis together with limited lipolysis (Betancor et al., 2016). This is somewhat different than our results, again, suggesting that different landlocked populations with different genetic backgrounds respond to FO-free diets differently. Further studies are required to understand the impact of diet and strain differences on phospholipid and cholesterol metabolism.
The FA transport transcripts responsible for FA uptake, intracellular metabolism, and transport of LC-PUFA, fabp3a and fabp3b, were expressed at higher levels in both strains of salmon in this study fed the FO-free diet compared to the FO diet. These transcripts were also significantly upregulated in salmon fed diets that were primarily terrestrial-based in a previous study (Caballero-Solares et al., 2018). Another FA transport transcript, cd36c, was also expressed at higher levels in the GL strain compared to the SJR strain, fed the FO-free diet. In another study, cd36c was highly expressed in Atlantic salmon that were fed a diet that replaced 70% of FO and 80% of FM in the diet (Torstensen et al., 2011). These results may indicate a higher FA turnover in tissues of fish fed FO-free diets compared to the FO diet, which also reflects the major role of the master regulator, pparaa (Fruchart et al., 1999).
Transcript Expression in Muscle
At week 0, prior to introduction of the experimental diets, expression levels of several transcripts were higher in muscle from the GL strain compared to the SJR strain: elovl5a, fadsd5, fadsd6a and fadsd6b (involved in FA elongation or desaturation), as well as acac, scdb and fasb (involved in de novo FA synthesis), and transcription factors (pparaa and srebp1). In contrast, the transport-related transcript biomarker, cd36c, was higher expressed in the SJR strain compared to the GL strain. This indicates constitutive differences in muscle transcript expression between the strains.
After 16 weeks, the FA desaturation-related transcript, fadsd6b, was significantly higher expressed in the GL strain fed the FO-free diet compared to the SJR strain fed the FO-free diet, and was expressed at the same level in both strains fed the FO diet. Fadsd6a, on the other hand, was not significantly differentially expressed in the GL strain compared to the SJR strain fed either diet. The different results observed between fadsd6a and fadsd6b are not surprising, since it has been shown that Atlantic salmon show a different pattern of regulation for these genes in response to a diet that was primarily vegetable oil-based (Monroig et al., 2010).
With the exception of acly. the targeted de novo FA synthesis transcripts were significantly impacted by diet, as shown in the two-way ANOVA (see Supplementary Table 5). Strain was also a significant factor for acac and scdb. Considering the diet effect within the GL strain, acac expression levels were significantly higher in those fed the FO-free diet than the FO diet (although the fold-change difference was not significantly higher), but non-responsive to the FO-free diet in the SJR strain. Although fasb expression levels were not different among all treatments, there was a significant strain effect, and it was > 2-fold induced by the FO-free diet in muscle of GL strain salmon, but non-responsive to FO-free diet in the SJR strain. These results suggest that both strain and diet affect acac and scdb expression levels in the muscle. In comparison, the liver more clearly demonstrated that the GL strain upregulated the targeted de novo FA synthesis transcripts to a greater degree than the SJR strain when challenged with a FO-free diet, which was also found in a previous study that compared hepatic transcript expression between a landlocked salmon strain and a commercial strain (Betancor et al., 2016, 2018).
A major regulator of FA metabolism, srebp1, showed a similar expression level between the GL strain and SJR strain fed the FO-free diet. However, for srebp1, GL fish muscle tissue responded significantly to the FO-free diet (> 2-fold up-regulated compared with FO diet), whereas SJR fish muscle tissue did not. Typically, the liver is known as the main site for lipid metabolism, however, the fold-change differences of srebp1 in the muscle due to diet suggest its relevance in FA metabolism and FA storage directly in the muscle, particularly in the GL strain, where the effect of the FO-free diet was more impactful.
The transport-related transcript, fabp3b was significantly and similarly higher in muscle of both strains of salmon fed the FO-free diet compared to the FO diet. This diet effect was different than in liver, where FA transport differed between strains. Unlike liver, expression of inflammation-related transcripts, pgds and lect2a, were not differentially expressed among treatments in muscle.
Multivariate and Correlation Analyses
The PCoA of the liver revealed a clear separation due to diet treatment. For the FO group, the two strains are intermixed. But for the FO-free group, there is a separation between the GL and SJR strain (see Figure 5). The correlated vectors indicate that the separation is due to several transcripts and several n-6 FA. For example, the GL strain was associated with the expression of elovl5a, elovl5b, elovl2, fadsd6b, fadsd5, as well as storage of MUFA, specifically OA, in the liver. This suggests that the GL strain is working to metabolize dietary FA to synthesize longer, more unsaturated chains. The SJR strain was more closely associated with 18:3n-6, 20:3n-6, 22:5n-6 and 22:4n-6. The separation between strains is not as evident in muscle (see Figure 6) as it is in the liver, indicating that diet is still the strongest factor in determining muscle FA content. Similarly, in the Rottiers (1993) study, commercial anadromous and landlocked Atlantic salmon strains could not be separated by discriminant analysis into separate groups. In another study, LC-PUFA biosynthesis-related transcripts, other than fadsd6, clustered with n-3 PUFA in landlocked salmon, whereas in the commercial farmed strain, all the transcripts clustered with n-6 PUFA (Betancor et al., 2016). These previous studies are similar to our results regarding the cluster of n-6 PUFA in association with the SJR strain. The relationship of n-6 PUFA with the SJR strain was also evident in the number of significant correlations between liver transcript expression of elovl5a, elovl5b, elovl2, fadsd5, fadsd6a, and fadsd6b with liver and muscle n-6 PUFA (see Table 8), compared with the GL strain which showed more significant correlations with n-3 PUFA.
Eicosapentaenoic acid and DHA were negatively correlated with transcripts involved in LC-PUFA synthesis (elovl5a, elovl5b, elovl2, fadsd5, fadsd6a, and fadsd6b) in the liver in both strains (see Table 8), indicating that low levels of these FA in the liver causes upregulation of these transcripts, and vice versa; high levels of these FA result in down regulation of these transcripts. This type of feedback loop has been reported in other studies (e.g., Glencross et al., 2015; Betancor et al., 2016; Colombo et al., 2018). However, this was not the case for ARA (the n-6 LC-PUFA end-product) which was positively correlated with transcript expression. Total n-6, 18:3n-6 and 20:3n-6 were also positively correlated with these transcripts, for both strains, suggesting that high levels of precursors induce LC-PUFA biosynthesis pathways. This could mean that high tissue levels of n-6 PUFA result in upregulation of transcripts involved in LC-PUFA biosynthesis for synthesizing n-3 LC-PUFA, when n-6 is already abundantly stored in the muscle and liver.
Conclusion
Overall, there were clear, strain-related differences in growth performance, fatty acid content and transcript expression in liver (and to a lesser extent in muscle) comparing the GL strain to the SJR strain. Diet affected transcript expression differently for the GL strain compared to the SJR strain regarding FA metabolism. Growth performance of salmon fed the FO diet was poorer in the GL strain compared to the SJR strain. The conversion of dietary ALA to n-3 LC-PUFA and LNA to n-6 LC-PUFA were carried out in both strains; however, storage of EPA and DHA in the muscle tissue was not different between strains when they were fed the FO-free diet. The GL strain showed relatively higher transcript expression levels in the liver with regard to de novo FA synthesis compared to the SJR strain when fed the FO-free diet. The results of this study suggest there is a genetic basis behind the potential for GL salmon to utilize the FO-free diet differently than SJR salmon, with regard to lipid metabolism and FA synthesis, for further broodstock development of the commercial SJR strain. The next stage in being able to fully realize the potential that the GL strain has toward FA synthesis is improving this trait through selection.
Data Availability Statement
The original contributions presented in the study are included in the article/Supplementary Material, further inquiries can be directed to the corresponding author/s.
Ethics Statement
The animal study was reviewed and approved by Canadian Council of Animal Care (Dalhousie University Institutional Animal Care) and the USDA Institutional Animal Care.
Author Contributions
SC contributed to conceptualization, funding acquisition, project administration, supervision, roles/writing – original draft, and writing – review and editing. ME contributed to formal analysis and roles/writing – original draft. BP contributed to conceptualization, funding acquisition, resources, and writing – review and editing. JH contributed to formal analysis, investigation, and writing – review and editing. GB contributed to conceptualization, resources, and writing – review and editing. ZZ contributed to formal analysis, investigation, and roles/writing – original draft. MR contributed to conceptualization, funding acquisition, project administration, supervision, and writing – review and editing. All authors contributed to the article and approved the submitted version.
Funding
Research funding was provided by the Ocean Frontier Institute, through an award from the Canada First Research Excellence Fund. SC and MR research programs were also supported by Natural Sciences and Engineering Research Council of Canada (NSERC) Discovery Grants.
Conflict of Interest
The authors declare that the research was conducted in the absence of any commercial or financial relationships that could be construed as a potential conflict of interest.
Acknowledgments
The authors would like to thank Suzanne Budge for use of the gas chromatograph in the Marine Lipids Lab at Dalhousie University.
Supplementary Material
The Supplementary Material for this article can be found online at: https://www.frontiersin.org/articles/10.3389/fmars.2021.641824/full#supplementary-material
Supplementary Figure 1 | qPCR analyses of transcripts with functional annotations related to lipid metabolism, cholesterol metabolism, eicosanoid pathways and inflammation in liver of pooled samples representing the 6 groups in this study. As an initial screen to help select transcripts to analyze in individual samples, qPCR analysis was performed to measure transcript expression levels in cDNA pools (n = 10 individuals per pool) generated for each of the 6 groups in this study [i.e., Grand Lake (GL) Week 0 and Saint John River (SJR) Week 0 (A), and GL Week 16 [fish oil (FO) diet and FO free-diet] and SJR Week 16 (FO diet and FO-free diet)] (B). These transcripts include those involved in fatty acid (FA) elongation or desaturation (panel A), de novo FA synthesis (panel B), Krebs cycle or oxidation (panel C), transcription factors (panel D), transport (panel E), cholesterol metabolism (panel F), and inflammation (panel G). Transcript levels are presented as relative quantity (RQ) values (i.e., values for the transcript of interest were normalized to both ef1a1 and rpl32 transcript levels and were calibrated to the pooled sample with the lowest normalized expression level of that given transcript). ∗Indicates the 21 transcripts that were assessed in individual samples.
Supplementary Figure 2 | qPCR analyses of transcripts with functional annotations related to lipid metabolism, cholesterol metabolism, eicosanoid pathways and inflammation in muscle of pooled samples representing the 6 groups in this study. As an initial screen to help select transcripts to analyze in individual samples, qPCR analysis was performed to measure transcript expression levels in cDNA pools (n = 10 individuals per pool) generated for each of the 6 groups in this study [i.e., Grand Lake (GL) Week 0 and Saint John River (SJR) Week 0 (A), and GL Week 16 [fish oil (FO) diet and FO free-diet] and SJR Week 16 (FO diet and FO-free diet)] (B). These transcripts include those involved in fatty acid (FA) elongation or desaturation (panel A), de novo FA synthesis (panel B), Krebs cycle or oxidation (panel C), transcription factors (panel D), transport (panel E), cholesterol metabolism (panel F), and inflammation (panel G). Transcript levels are presented as relative quantity (RQ) values (i.e., values for the transcript of interest were normalized to both ef1a1 and pabpc1 transcript levels and were calibrated to the pooled sample with the lowest normalized expression level of that given transcript). ND indicates that this transcript (elovl5b) was not expressed at detectable levels at week 0. The ∗ indicates the 21 transcripts that were assessed in individual samples.
Supplementary Table 1 | Primers used in qPCR studies.
References
Arts, M. T., Ackman, R. G., and Holub, B. J. (2001). “Essential fatty acids” in aquatic ecosystems: a crucial link between diet and human health and evolution. Can. J. Fish. Aquat. Sci. 58, 122–137. doi: 10.1139/f00-224
Bell, G., Henderson, J., Tocher, D., and Sargent, J. (2004). Replacement of dietary fish oil with increasing levels of linseed oil: modification of flesh fatty acid compositions in Atlantic salmon (Salmo salar) using a fish oil finishing diet. Lipids 39, 223–231. doi: 10.1007/s11745-004-1223-5
Betancor, M. B., Olsen, R. E., Marandel, L., Skulstad, O. F., Madaro, A., Tocher, D. R., et al. (2018). Impact of dietary carbohydrate/protein ratio on hepatic metabolism in land-locked Atlantic salmon (Salmo salar L.). Front. Physiol. 9:1751. doi: 10.3389/fphys.2018.01751
Betancor, M. B., Olsen, R. E., Solstorm, D., Skulstad, O. F., and Tocher, D. R. (2016). Assessment of a land-locked Atlantic salmon (Salmo salar L.) population as a potential genetic resource with a focus on long-chain polyunsaturated fatty acid biosynthesis. Biochim. Biophys. Acta 1861, 227–238. doi: 10.1016/j.bbalip.2015.12.015
Bicskei, B., Bron, J. E., Glover, K. A., and Taggart, J. B. (2014). A comparison of gene transcription profiles of domesticated and wild Atlantic salmon (Salmo salar L.) at early life stages, reared under controlled conditions. BMC Genomics 15:884. doi: 10.1186/1471-2164-15-884
Bishop-Bailey, D. (2000). Peroxisome proliferator-activated receptors in the cardiovascular system. Br. J. Pharmacol. 129, 823–834. doi: 10.1038/sj.bjp.0703149
Bocher, V., Chinetti, G., Fruchart, J.-C., and Staels, B. (2002). Role of the peroxisome proliferator-activated receptors (PPARS) in the regulation of lipids and inflammation control. J. Soc. Biol. 196, 47–52.
Bou, M., Berge, G. M., Baeverfjord, G., Sigholt, T., Østbye, T. K., Romarheim, O. H., et al. (2017). Requirements of n-3 very long-chain PUFA in Atlantic salmon (Salmo salar L): effects of different dietary levels of EPA and DHA on fish performance and tissue composition and integrity. Br. J. Nutr. 117, 30–47. doi: 10.1017/s0007114516004396
Boulding, E. G., Ang, K. P., Elliott, J. A., Powell, F., and Schaeffer, L. R. (2019). Differences in genetic architecture between continents at a major locus previously associated with sea age at sexual maturity in European Atlantic salmon. Aquaculture 500, 670–678. doi: 10.1016/j.aquaculture.2018.09.025
Caballero-Solares, A., Hall, J. R., Xue, X., Eslamloo, K., Taylor, R. G., Parrish, C. C., et al. (2017). The dietary replacement of marine ingredients by terrestrial animal and plant alternatives modulates the antiviral immune response of Atlantic salmon (Salmo salar). Fish Shellfish Immunol. 64, 24–38. doi: 10.1016/j.fsi.2017.02.040
Caballero-Solares, A., Xue, X., Cleveland, B. M., Foroutani, M. B., Parrish, C. C., Taylor, R. G., et al. (2020). Diet-induced physiological responses in the liver of Atlantic Salmon (Salmo salar) inferred using multiplex PCR platforms. Mar. Biotechnol. 22, 511–525. doi: 10.1007/s10126-020-09972-5
Caballero-Solares, A., Xue, X., Parrish, C. C., Foroutani, M. B., Taylor, R. G., and Rise, M. L. (2018). Changes in the liver transcriptome of farmed Atlantic salmon (Salmo salar) fed experimental diets based on terrestrial alternatives to fish meal and fish oil. BMC Genomics 19:796. doi: 10.1186/s12864-018-5188-6
Christie, W. W. (2003). Lipid Analysis: Isolation, Separation, Identification and Structural Analysis of Lipids. (Bridgwater: Oily Press), 416.
Colombo, S. M. (2020). “Chapter 2: Physiological considerations in shifting carnivorous fishes to plant-based diets,” in Fish Physiology, 38th Edn, eds T. Benfey, C. Brauner, and T. Farrell (Cambridge, MA: Academic Press), 53–82. doi: 10.1016/bs.fp.2020.09.002
Colombo, S. M., Parrish, C. C., Wacker, A., Kainz, M. J., and Arts, M. T. (2017). A functional dichotomy in the production, distribution, and abundance of long-chain omega-3 polyunsaturated fatty acids between marine and terrestrial ecosystems. Environ. Rev. 25, 163–174. doi: 10.1139/er-2016-0062
Colombo, S. M., Parrish, C. C., and Wijikoon, M. (2018). Optimizing long chain-polyunsaturated fatty acid synthesis in Salmonids by balancing dietary inputs. PLoS One 13:e0205347. doi: 10.1371/journal.pone.0205347
Davidson, M. H. (2005). Mechanisms for the hypotriglyceridemic effect of marine omega-3 fatty acids. Am. J. Cardiol. 98, 27–33. doi: 10.1016/j.amjcard.2005.12.024
Dong, X., Tan, P., Cai, Z., Xu, H., Li, J., Ren, W., et al. (2017). Regulation of FADS2 transcription by SREBP-1 and PPAR-α influences LC-PUFA biosynthesis in fish. Sci. Rep. 7:40024.
Emam, M., Katan, T., Caballero-Solares, A., Taylor, R. G., Parrish, K. S., Rise, M. L., et al. (2020). Interaction between ω6 and ω3 fatty acids of different chain lengths regulates Atlantic salmon hepatic gene expression and muscle fatty acid profiles. Philos. Trans. R. Soc. Lond. B Biol. Sci. 375:20190648. doi: 10.1098/rstb.2019.0648
Folch, J., Lees, M., and Stanley, G. S. (1957). A simple method for the isolation and purification of total lipides from animal tissues. J. Biol. Chem. 226, 497–509. doi: 10.1016/s0021-9258(18)64849-5
Friars, G. W., Bailey, J. K., and O’Flynn, F. M. (1995). Applications of selection for multiple traits in cage-reared Atlantic salmon (Salmo salar). Aquaculture 137, 213–217. doi: 10.1016/0044-8486(95)01101-3
Fruchart, J. C., Duriez, P., and Staels, B. (1999). Peroxisome proliferator-activated receptor-alpha activators regulate genes governing lipoprotein metabolism, vascular inflammation and atherosclerosis. Curr. Opin. Lipidol. 10, 245–257. doi: 10.1097/00041433-199906000-00007
Gjøen, H. M., and Bentsen, H. B. (1997). Past, present, and future genetic improvement in salmon aquaculture. ICES J. Mar. Sci. 54, 1009–1014. doi: 10.1016/s1054-3139(97)80005-7
Gladyshev, M. I., Sushchik, N. N., Tolomeev, A. P., and Dgebuadze, Y. Y. (2018). Meta-analysis of factors associated with omega-3 fatty acid contents of wild fish. Rev. Fish Biol. Fish. 28, 277–299. doi: 10.1007/s11160-017-9511-0
Glencross, B. D., De Santis, C. D., Bicskei, B., Taggart, J. B., Bron, J. E., Betancor, M. B., et al. (2015). A comparative analysis of the response of the hepatic transcriptome to dietary docosahexaenoic acid in Atlantic salmon (Salmo salar) post-smolts. BMC Genomics 16:684. doi: 10.1186/s12864-015-1810-z
Goto, T., Lee, J.-Y., Teraminami, A., Kim, Y.-I., Hirai, S., Uemura, T., et al. (2011). Activation of peroxisome proliferator-activated receptor-alpha stimulates both differentiation and fatty acid oxidation in adipocytes. J. Lipid Res. 52, 873–884. doi: 10.1194/jlr.m011320
Groot, C. (1996). “Salmonid life histories,” in Developments in Aquaculture and Fisheries Science, Principles of Salmonid Culture, Vol. 29, eds W. Pennell and B. A. Barton (Amsterdam: Elsevier Science), 97–218. doi: 10.1016/s0167-9309(96)80006-8
Hixson, S. M., Parrish, C. C., Xue, X., Wells, J. S., Collins, S. A., Anderson, D. M., et al. (2017). Growth performance, tissue composition, and gene expression responses in Atlantic salmon (Salmo salar) fed varying levels of different lipid sources. Aquaculture 467, 76–88. doi: 10.1016/j.aquaculture.2016.04.011
Hixson, S. M., Sharma, B., Kainz, M. J., Wacker, A., and Arts, M. T. (2015). Production, distribution, and abundance of long-chain omega-3 polyunsaturated fatty acids: a functional dichotomy between freshwater and terrestrial ecosystems. Environ. Rev. 23, 414–424. doi: 10.1139/er-2015-0029
Holborn, M. K., Ang, K. P., Elliott, J. A., Powell, F., and Boulding, E. G. (2018). Genome wide association analysis for bacterial kidney disease resistance in a commercial North American Atlantic salmon (Salmo salar) population using a 50 K SNP panel. Aquaculture 495, 465–471. doi: 10.1016/j.aquaculture.2018.06.014
Holborn, M. K., Ang, K. P., Elliott, J. A. K., Powell, F., and Boulding, E. G. (2020). Genome wide analysis of infectious salmon anemia resistance in commercial Saint John River Atlantic salmon. Aquaculture 514:734514. doi: 10.1016/j.aquaculture.2019.734514
Hutchings, J. A., Ardren, W. R., Barlaup, B. T., Bergman, E., Clarke, K. D., Greenberg, L. A., et al. (2019). Life-history variability and conservation status of landlocked Atlantic salmon: an overview. Can. J. Fish. Aquat. Sci. 76, 1697–1708. doi: 10.1139/cjfas-2018-0413
Jordal, A.-E. O., Torstensen, B. E., Tsoi, S., Tocher, D. R., Lall, S. P., and Douglas, S. E. (2005). Dietary rapeseed oil affects the expression of genes involved in hepatic lipid metabolism in Atlantic salmon (Salmo salar L.). J. Nutr. 135, 2355–2361. doi: 10.1093/jn/135.10.2355
Katan, T., Caballero-Solares, A., Taylor, R. G., Rise, M. L., and Parrish, C. C. (2019). Effect of plant-based diets with varying ratios of ω6 to ω3 fatty acids on growth performance, tissue composition, fatty acid biosynthesis and lipid-related gene expression in Atlantic salmon (Salmo salar). Comp. Biochem. Physiol. Part D Genomics Proteomics 30, 290–304. doi: 10.1016/j.cbd.2019.03.004
Leaver, M., Ezaz, M., Fontagne, S., Tocher, D., Boukouvala, E., and Krey, G. (2007). Multiple peroxisome proliferator-activated receptor β subtypes from Atlantic salmon (Salmo salar). J. Mol. Endocrinol. 38, 391–400. doi: 10.1677/jme-06-0043
Lumme, J., Ozerov, M. Y., Veselov, A. E., and Primmer, C. R. (2016). “The formation of landlocked populations of Atlantic salmon,” in Evolutionary Biology of the Atlantic Salmon, eds T. Vladic′ and E. Petersson (New York, NY: CRC Press), 26–43.
Marshall, T. L. (2014). Inner Bay of Fundy (iBoF) Atlantic salmon (Salmo salar) marine habitat: proposal for important habitat. DFO Can. Sci. Advis. Sec. Res. Doc. 2013/071:69.
McCormick, S. D., Hansen, L. P., Quinn, T. P., and Saunders, R. L. (1998). Movement, migration, and smolting of Atlantic salmon (Salmo salar). Can. J. Fish Aquat. Sci. 55, 77–92. doi: 10.1139/d98-011
Mock, T. S., Francis, D. S., Jago, M. K., Glencross, B. D., Smullen, R. P., and Turchini, G. M. (2019). Endogenous biosynthesis of n-3 long-chain PUFA in Atlantic salmon. Br. J. Nutr. 121, 1108–1123. doi: 10.1017/s0007114519000473
Monroig, Ó., Zheng, X., Morais, S., Leaver, M. J., Taggart, J. B., and Tocher, D. R. (2010). Multiple genes for functional Δ6 fatty acyl desaturases (Fad) in Atlantic salmon (Salmo salar L.): gene and cDNA characterization, functional expression, tissue distribution and nutritional regulation. Biochim. Biophys. Acta 1801, 1072–1081. doi: 10.1016/j.bbalip.2010.04.007
Morais, S., Monroig, Ó., Zheng, X., Leaver, M., and Tocher, D. (2009). Highly unsaturated fatty acid synthesis in Atlantic salmon: characterization of ELOVL5- and ELOVL2-like elongases. Mar. Biotechnol. 11, 627–639. doi: 10.1007/s10126-009-9179-0
Morais, S., Pratoomyot, J., Taggart, J. B., Bron, J. E., Guy, D. R., Bell, J. G., et al. (2011). Genotype-specific responses in Atlantic salmon (Salmo salar) subject to dietary fish oil replacement by vegetable oil: a liver transcriptomic analysis. BMC Genomics 12:255. doi: 10.1186/1471-2164-12-255
National Research Council [NRC] (2011). Nutrient Requirements of Fish and Shrimp. National Academy of Sciences. (Washington, DC: NRC), 108–110.
Parzanini, C., Colombo, S. M., Kainz, M. J., Wacker, A., Parrish, C. C., and Arts, M. T. (2020). Discrimination between marine and freshwater fish using fatty acids: ecological implications and future perspectives. Environ. Rev. 28, 546–559. doi: 10.1139/er-2020-0031
Peng, J., Larondelle, Y., Pham, D., Ackman, R. G., and Rollin, X. (2003). Polyunsaturated fatty acid profiles of whole body phospholipids and triacylglycerols in anadromous and landlocked Atlantic salmon (Salmo salar L.) fry. Comp. Biochem. Physiol. B Biochem. Mol. Biol. 134, 335–348. doi: 10.1016/s1096-4959(02)00263-4
Pfaffl, M. W. (2001). A new mathematical model for relative quantification in real-time RT-PCR. Nucleic Acids Res. 29:e45.
Pickova, J., Kiessling, A., Pettersson, A., and Dutta, P. C. (1999). Fatty acid and carotenoid composition of eggs from two nonanadromous Atlantic salmon stocks of cultured and wild origin. Fish Physiol. Biochem. 21, 147–156.
Polakof, S., Medale, F., Larroquet, L., Vachot, C., Corraze, G., and Panserat, S. (2011). Regulation of de novo hepatic lipogenesis by insulin infusion in rainbow trout fed a high-carbohydrate diet. J. Anim. Sci. 89, 3079–3088. doi: 10.2527/jas.2010-3733
Qian, C., Hart, B., and Colombo, S. M. (2020). Re-evaluating the dietary requirement of EPA and DHA for Atlantic salmon in freshwater. Aquaculture 518:734870. doi: 10.1016/j.aquaculture.2019.734870
Roberge, C., Einum, S., Guderley, H., and Bernatchez, L. (2006). Rapid parallel evolutionary changes of gene transcription profiles in farmed Atlantic salmon. Mol. Ecol. 15, 9–20. doi: 10.1111/j.1365-294x.2005.02807.x
Roberge, C., Normandeau, E., Einum, S., Guderley, H., and Bernatchez, L. (2008). Genetic consequences of interbreeding between farmed and wild Atlantic salmon: insights from the transcriptome. Mol. Ecol. 17, 314–324. doi: 10.1111/j.1365-294x.2007.03438.x
Rocha, D. M., Bressan, J., and Hermsdorff, H. H. (2017). The role of dietary fatty acid intake in inflammatory gene expression: a critical review. Sao Paulo Med. J. 135, 157–168. doi: 10.1590/1516-3180.2016.008607072016
Rollin, X., Peng, J., Pham, D., Ackman, R. G., and Larondelle, Y. (2003). The effects of dietary lipid and strain difference on polyunsaturated fatty acid composition and conversion in anadromous and landlocked salmon (Salmo salar L.) parr. Comp. Biochem. Physiol. B Biochem. Mol. Biol. 134, 349–366. doi: 10.1016/s1096-4959(02)00264-6
Rottiers, D. V. (1993). Elemental composition of a migratory and a landlocked strain of Atlantic salmon Salmo salar. Comp. Biochem. Physiol. A Comp. Physiol. 104, 93–100. doi: 10.1016/0300-9629(93)90014-u
Ruyter, B., Østbye, T.-K., Kjaer, M. A., Sonesson, A., and Mørkøre, M. B. (2015). Can levels of EPA and DHA in Feed in Early Life Phases Affect Salmon’s Health and Composition in Later Life Phases? Nofima Final Report. Available Online at: https://www.fhf.no/prosjekter/prosjektbasen/900770/ (accessed June 9, 2021).
Schaeffer, L. R., Ang, K. P., Elliott, J. A. K., Herlin, M., Powell, F., and Boulding, E. G. (2018). Genetic evaluation of Atlantic salmon for growth traits incorporating SNP markers. J. Anim. Breed. Genet. 135, 349–356. doi: 10.1111/jbg.12355
Sheridan, M. A., Allen, W. V., and Kerstetter, T. H. (1985). Changes in the fatty acid composition of steelhead trout, Salmo gardinerii Richardson, associated with parr–smolt transformation. Comp. Biochem. Physiol. Part B 80, 671–676. doi: 10.1016/0305-0491(85)90444-4
Sissener, N. H., Araujo, P., Saele, Ø., Rosenlund, G., Stubhaug, I., and Sanden, M. (2020). Dietary 18:2n-6 affects EPA (20:5n-3) and ARA (20:4n-6) content in cell membranes and eicosanoid production in Atlantic salmon (Salmo salar L.). Aquaculture 522:735098. doi: 10.1016/j.aquaculture.2020.735098
Thomassen, M. S., Rein, D., Berge, G. M., Ostbye, T. K., and Ruyter, B. (2012). High dietary EPA does not inhibit Δ5 and Δ6 desaturases in Atlantic salmon (Salmo salar L.) fed rapeseed oil diets. Aquaculture 360, 78–85. doi: 10.1016/j.aquaculture.2012.07.001
Tocher, D. R. (2003). Metabolism and functions of lipids and fatty acids in teleost fish. Rev. Fish. Sci. 11, 107–184. doi: 10.1080/713610925
Tocher, D. R. (2010). Fatty acid requirements in ontogeny of marine and freshwater fish. Aquac. Res. 41, 717–732. doi: 10.1111/j.1365-2109.2008.02150.x
Tocher, D. R. (2015). Omega-3 long-chain polyunsaturated fatty acids and aquaculture in perspective. Aquaculture 449, 94–107. doi: 10.1016/j.aquaculture.2015.01.010
Torstensen, B. E., Espe, M., Stubhaug, I., and Lie, Ø. (2011). Dietary plant proteins and vegetable oil blends increase adiposity and plasma lipids in Atlantic salmon (Salmo salar L.). Br. J. Nutr. 106, 633–647. doi: 10.1017/s0007114511000729
Torstensen, B. E., and Tocher, D. R. (2011). “The effects of fish oil replacement on lipid metabolism of fish,” in Fish Oil Replacement and Alternative Lipid Sources in Aquaculture Feeds, eds G. M. Turchini, W. K. Ng, and D. R. Tocher (Boca Raton, FL: CRC Press), 209–244.
Tripathy, S., Lytle, K. A., Stevens, R. D., Bain, J. R., Newgard, C. B., Greenberg, A. S., et al. (2014). Fatty acid elongase-5 (Elovl5) regulates hepatic triglyceride catabolism in obese C57BL/6J mice. J. Lipid Res. 55, 1448–1464. doi: 10.1194/jlr.m050062
Vandesompele, J., De Preter, K., Pattyn, F., Poppe, B., Van Roy, N., De Paepe, A., et al. (2002). Accurate normalization of real-time quantitative RT-PCR data by geometric averaging of multiple internal control genes. Genome Biol. 3:research0034.1.
Viga, A., and Grahl-Nielsen, O. (1990). Genotypic and phenotypic fatty acid composition in the tissues of salmon Salmo salar. Comp. Biochem. Physiol. Part B 96, 721–727. doi: 10.1016/0305-0491(90)90220-n
Xue, X., Hixson, S. M., Hori, T. S., Booman, M., Parrish, C. C., Anderson, D. M., et al. (2015). Atlantic salmon (Salmo salar) liver transcriptome response to diets containing Camelina sativa products. Comp. Biochem. Physiol. D 14, 1–15. doi: 10.1016/j.cbd.2015.01.005
Yaqoob, P. (2002). Monounsaturated fatty acids and immune function. Eur. J. Clin. Nutr. 56(Suppl. 3), S9–S13.
Keywords: Atlantic salmon (Salmo salar L.), Grand Lake strain, Saint John River strain, Landlocked salmon, fatty acid synthesis, omega-3, fish oil
Citation: Colombo SM, Emam M, Peterson BC, Hall JR, Burr G, Zhang Z and Rise ML (2021) Freshwater, Landlocked Grand Lake Strain of Atlantic Salmon (Salmo salar L.) as a Potential Genetic Source of Long Chain Polyunsaturated Fatty Acids Synthesis. Front. Mar. Sci. 8:641824. doi: 10.3389/fmars.2021.641824
Received: 15 December 2020; Accepted: 31 May 2021;
Published: 07 July 2021.
Edited by:
Kang-le Lu, Jimei University, ChinaReviewed by:
Binbin Shan, South China Sea Fisheries Research Institute (CAFS), ChinaDizhi Xie, South China Agricultural University, China
Copyright © 2021 Colombo, Emam, Peterson, Hall, Burr, Zhang and Rise. This is an open-access article distributed under the terms of the Creative Commons Attribution License (CC BY). The use, distribution or reproduction in other forums is permitted, provided the original author(s) and the copyright owner(s) are credited and that the original publication in this journal is cited, in accordance with accepted academic practice. No use, distribution or reproduction is permitted which does not comply with these terms.
*Correspondence: Stefanie M. Colombo, c2NvbG9tYm9AZGFsLmNh