 J. Severino P. Ibánhez
 Xosé Antón Álvarez-Salgado
 Carlos Rocha
- 1Biogeochemistry Research Group, School of Natural Sciences, Trinity College, Dublin, Ireland
- 2Instituto de Investigacións Mariñas, Consejo Superior de Investigaciones Científicas (IIM-CSIC), Vigo, Spain
Due to the widespread pollution of coastal groundwaters with fertilizers, submarine groundwater discharge (SGD) is often thought to be a large dissolved inorganic nitrogen (DIN) source to the ocean. Whether this N is autochthonous or allochthonous to the subterranean estuary (STE), the availability of large quantities of DIN can nevertheless interact with the cycling of other elements, such as carbon (C). In previous studies, we documented the discharge of large quantities of freshwater and NO3– from the mouth of an STE into the Ria Formosa lagoon (SW Iberian Peninsula). For the period covered in this study (2009–2011), the same STE site was dominated by recirculating seawater due to a prolonged fall in piezometric head in the coupled coastal aquifers. Total SGD rates remained similarly high, peaking at 144 cm day–1 at the lower intertidal during fall. We observed a progressive increase of NO3– availability within the STE associated with the recovery of piezometric head inland. Interestingly, during this period, the highest SGD-derived dissolved organic C and DIN fluxes (112 ± 53 and 10 ± 3 mmol m–2 day–1, respectively) originated in the lower intertidal. NO3– enrichment in the STE influences the benthic reactivity of fluorescent dissolved organic matter (FDOM): when seawater recirculation drives STE dynamics, only small changes in the benthic distribution of recalcitrant humic-like FDOM are observed (from −2.57 ± 1.14 to 1.24 ± 0.19 10–3 R.U. “bulk” sediment h–1) in the absence of DIN. However, when DIN is available, these recalcitrant fractions of FDOM are actively generated (from 1.32 ± 0.15 to 11.56 ± 3.39 10–3 R.U. “bulk” sediment h–1), accompanied by the production of labile protein-like FDOM. The results agree with previous studies conducted with flow-through reactor experiments at the same site and suggest that DIN enrichment in the STE enhances the metabolic turnover of sedimentary organic matter up to the point of discharge to surface waters. DIN pollution of coastal aquifers may therefore promote a contraction of the residence time of particulate organic C within the STE, driving carbon from continental storage into the sea.
Introduction
The discovery and industrial application of the Haber-Bosch process for fertilizer production from atmospheric N2 has completely changed the global N cycle. Fertilizer usage, the cultivation of N-fixing crops or biomass, and fossil fuel combustion and subsequent deposition have turned human activities into the largest source of bioavailable N to the biosphere (Vitousek et al., 1997; Galloway et al., 2008). This anthropogenic N enrichment of Earth’s ecosystems has dramatically increased N content in freshwater ecosystems and exponentially enhanced N fluxes to the coastal zone (Mackenzie et al., 2002; Boyer et al., 2006; Rivett et al., 2008). There, N enrichment triggers eutrophication, coastal acidification, or environmental degradation (Erisman et al., 2008; Gruber and Galloway, 2008) and interferes with the cycling of other elements such as C and O (Bauer et al., 2013).
The indiscriminate use of fertilizers, together with wastewater and septic tank leaks, industrial spillage, or the use of manure and sewage sludge inland has led to the widespread N pollution of groundwaters (Rivett et al., 2008). Up to 10% of the total 150 Tg N year–1 human-derived reactive N applied on the land surface ends in groundwater reservoirs (Schlesinger, 2009). The issue is that continental groundwaters will discharge to the coast whenever a hydraulic connection with a positive pressure head seaward exists (Johannes, 1980; Santos et al., 2012). This discharge of continental groundwater is included in submarine groundwater discharge (SGD; i.e., any source of water with origin in the sediments irrespectively of its origin and composition; Burnett et al., 2003), now recognized as a large source of water to the coastal zone (Kwon et al., 2014; Luijendijk et al., 2020). Land-ocean N fluxes associated with SGD are larger than N transported into the sea by rivers (Cho et al., 2018) on a global scale. Notwithstanding the difficulties in identifying and quantifying this diffusive source of water to the coast, SGD has already been recognized as the dominant source of N to several coastal ecosystems (e.g., Paytan et al., 2006; Leote et al., 2008; Tamborski et al., 2017), and associated with environmentally adverse local effects (Moore, 2010).
During their transit toward the coast, groundwaters can mix with saline groundwaters prior to discharge, developing the subterranean estuary (STE; Moore, 1999). Even if these environments have been largely ignored in coastal monitoring and management (Rocha et al., 2021), they play a crucial role in modulating continental solute transfer to the sea. The sandy exit sites of STEs are locus of a high variety of biogeochemical processes capable of significantly changing solute loads associated with SGD prior to discharge (Moore, 1999; Slomp and Van Cappellen, 2004; Robinson et al., 2018). Due to the need to quantify, predict, and control the SGD-borne N flux to the coastal zone, substantial research has focused on understanding natural N attenuation processes in STEs worldwide (Kroeger and Charette, 2008; Rocha et al., 2009; Erler et al., 2014; Couturier et al., 2017; Ibánhez and Rocha, 2017; Wong et al., 2020).
The availability and quality of organic C is key to understand N cycling in STEs. Low C stocks and the refractory nature of both particulate and dissolved organic matter in the sub-surface land-ocean continuum limit heterotrophic NO3– reduction processes and can explain the large NO3– concentrations reaching STEs (Hartog et al., 2004; Rivett et al., 2008). On the other hand, fresh marine organic matter brought into the STE at the seepage face fuels a spatially heterogeneous cascade of biogeochemical processes that can determine final N loads to the coast (Ibánhez et al., 2013; Pain et al., 2019; Calvo-Martin et al., 2021). Due to the high mobility of N compounds in the environment and the role N plays in microbial and primary producer metabolism, anthropogenic N enrichment of STEs could also promote alterations on the cycling of other elements such as C. Hence, mobilization of organic C from high residence time reservoirs like peat bogs (Bragazza et al., 2006), the Artic tundra (Mack et al., 2004), or alpine steppes (Chen et al., 2020) is increasingly linked to the enhancement of microbial and enzymatic activity caused by anthropogenic N enrichment. Nevertheless, to our knowledge, the effect of N enrichment on the transformation of organic matter in STEs has only been explored to date in incubation experiments (Ibánhez and Rocha, 2014a). In this study, we use an extensive field dataset collected in an STE seepage face to explore the effects of changing N enrichment within the STE over the quantity and quality of the fluorescent dissolved organic matter (FDOM). The labile and recalcitrant fractions of FDOM are then used as proxies of microbial organic C mineralization at the seepage face.
Materials and Methods
Study Site and Sampling Strategy
Five field surveys (from December 2009 until January 2011) were conducted at different times of the year at a seepage face located in the inner intertidal area of the Ancão peninsula (37°00′04″N, 7°58′57″W), in the mesotidal Ria Formosa coastal lagoon (Figure 1). NO3–-rich SGD was documented in the area in a previous series of monthly sampling surveys taking place between 2005 and 2007 (Leote et al., 2008). High NO3– concentrations (up to 190 μM) associated with brackish water (16.8 lowest salinity recorded) were identified seeping out at the lower intertidal area of the permeable barrier of the lagoon during low tide (Leote et al., 2008; Rocha et al., 2009). Water stable isotope signatures confirmed that these NO3–-rich brackish waters derive from mixing of continental groundwater from the Campina de Faro unconfined aquifer system bordering the lagoon (Figure 1) and coastal seawater (Rocha et al., 2016). This coastal aquifer was classified as nitrate vulnerable zone in 2005 under the EU’s nitrate directive due to large anthropogenic NO3– pollution (130 mg NO3– L–1 in 2010; Rocha et al., 2016). The sampling site was selected within the area previously identified as affected by SGD. The beach is tide-dominated, with a tidal range of 1.5–3.0 m and an averaged beach slope of 10.4% (Figure 1).
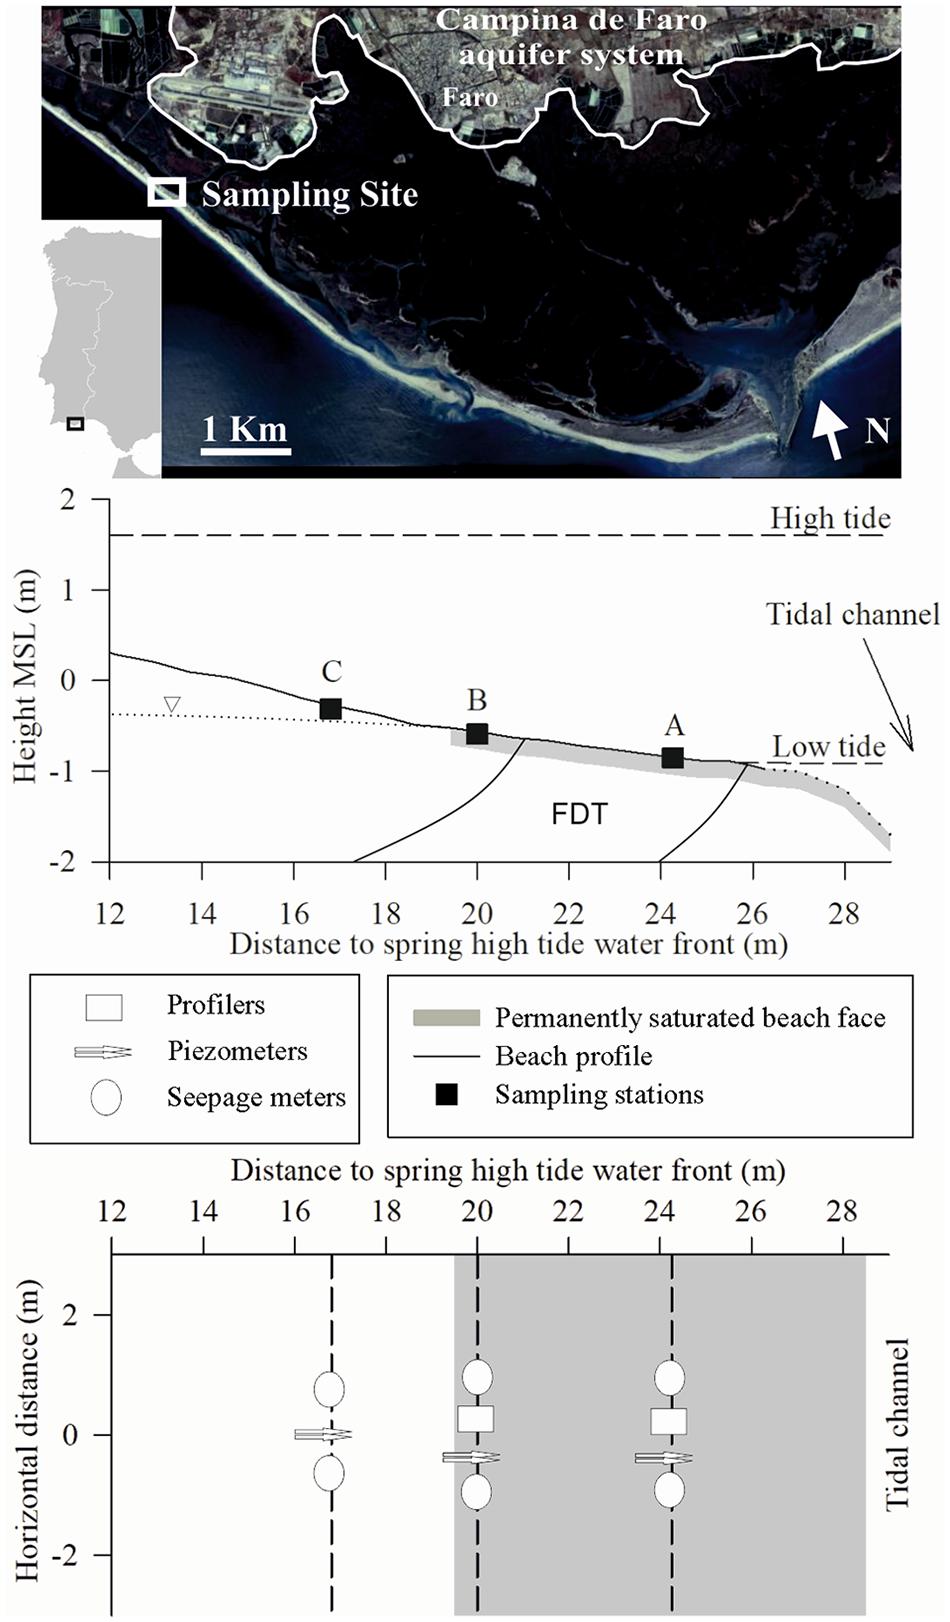
Figure 1. Sampling site location at Ria Formosa coastal lagoon (SW Iberian Peninsula). The location of the three sampling stations (stations A and B within the permanently saturated beach face and station C upward) within the intertidal area of the inner part of Ancão peninsula and the distribution of samplers per station (seepage meters, piezometers, and profilers) are shown. A schematic view of beach water table during low tide, low and high tide marks, and the location of the NO3–-rich freshwater discharge tube (FDT) observed during the period 2005–2007 (Rocha et al., 2009) at our site are also shown.
Extensive characterization of sediments at the sampling site has been made elsewhere (Rocha et al., 2009; Ibánhez et al., 2011; Ibánhez and Rocha, 2014a, 2016). Sediments at the seepage face are classified as medium-coarse sand (dp = 0.5 mm) with high permeability (1 × 10⁻³ cm s–1). Porosity peaks close to the sediment–water interface (always >0.3), and then approaches a quasi-asymptotic value of 0.3 with depth, with minimal changes throughout the year. The sediments have low total organic carbon (TOC) content (<0.1%), with the highest values observed at the sediment surface (top 10 cm).
Porewater composition, seepage rate measurements, and associated solute fluxes were investigated during December 2009, April, July, October 2010, and January 2011. Sampling equipment was deployed at the intertidal seepage face during tidal exposure and sampling conducted through the two subsequent tidal cycles, thus leaving the system to re-equilibrate for one tidal cycle after installation. The equipment remained in place for the duration of fieldwork surveys, minimizing disruption to local beach hydraulics (Seeberg-Elverfeldt et al., 2005; Ibánhez et al., 2011). Three sampling stations were established within the beach profile, following identical sampling strategy as in previous studies at the same location (Leote et al., 2008; Rocha et al., 2009; Ibánhez et al., 2011). Two sampling stations (A and B) covered the permanently saturated intertidal seepage face and a third (C) the upper part of the beach profile, situated outside the permanently saturated intertidal zone (Figure 1). Station A was situated at the lowest part of the intertidal beach profile where a permanent, well-developed freshwater discharge tube was observed during 2005–2007 (Figure 1; Rocha et al., 2009), while B was placed at the upper limit of the permanently saturated seepage face.
Seepage Measurements
Five (six during July and October 2010) Lee-type seepage meters were installed at the beach face (Figure 1) to allow direct measurements of seepage rate and solute fluxes across the sediment–water interface (Lee, 1977; Burnett et al., 2006). These were distributed (Figure 1) between the three sampling stations, two at A and B and one at C (with an additional seepage meter added to C in July and October 2010). During the survey performed in January 2011, seepage meters were only deployed at station A. Sampling followed the precautions suggested by Cable et al. (1997). Measurements of seepage rate, associated solute fluxes, salinity, and temperature were performed using the water collected with the bags connected to the seepage meters, with aliquots also taken for laboratory determinations.
Porewater and Surface Water Sampling
Four push–pull piezometers (MHE, United States) were installed at each sampling station within the beach profile at screened depths of 28, 66, 84, and 200 cm relative to the sediment surface. Porewater samples were collected periodically with luer-lock syringes (100 mL) attached to the piezometers through tygon tubing and luer stopcocks. The internal volume of the piezometers was flushed three times prior to the collection of any sample.
Soil moisture samplers (Rhizon SMS-10 cm; Rhizosphere, The Netherlands, 0.1 μm pore size) were used to collect in situ high-resolution vertical porewater profiles close to the sediment–water interface. The samplers were placed into the sediment at fixed depths with the aid of two acrylic profilers (stations A and B; Figure 1) modified from the design of Seeberg-Elverfeldt et al. (2005). Each profiler was buried with 12 Rhizon samplers located horizontally at vertical intervals of 1, 2.5, and 5 cm, covering the first 20 cm depth of the sediment column. Porewater was collected at each depth by connecting Luer-Lock syringes to the Rhizon samplers through the connection tubing protruding from the sediment surface. The first 2 mL of filtered porewater was discarded to avoid contamination due to the dead volume inside the tubing and the samplers and to prevent influence of the NH4+ adsorption properties of the membranes (Ibánhez and Rocha, 2014b).
Surface water samples were also collected next to the sampling site during low tide. These were filtered onsite with Rhizon SMS samplers. The final aliquots collected from the seepage meters, piezometers, the benthic profilers, and the surface seawater were stored at −20°C until analysis. All parameters were analyzed within 1 month of sampling.
Analytical Methods
Porewater, seepage, and surface water samples collected during each field survey were analyzed for NO3–, NO2– and NH4+ content in a Lachat Quickchem 8500 Flow Injection Analysis system following standard colorimetric methods (Grasshoff et al., 1983). Porewater salinity (from both the high-resolution porewater profilers and the piezometers) was measured with an ATAGO hand-held refractometer using single-point calibration with distilled water. Salinity and temperature measurements on the seepage water were performed in situ using a YSI 600 (Yellowspring instruments) multiparameter probe following the recommendations of the manufacturer. Dissolved Organic C (DOC) from the seepage meters was determined in a Vario TOC Cube elemental analyzer, after acidification with a 2 M HCl solution to pH < 2 and purge to ensure removal of dissolved inorganic C.
Excitation-Emission Matrix (EEM) Fluorescence of Dissolved Organic Matter (DOM)
A Cary Varian Eclipse fluorescence spectrophotometer was used to obtain a three-dimensional excitation-emission matrix of FDOM in all water and porewater samples (n = 701). The 5 nm excitation and 10 nm emission bandwidths were used. Emission wavelengths for analysis ranged from 290 to 550 nm with a 2 nm interval, and excitation intensities were recorded at wavelengths ranging from 270 to 440 nm with 5 nm intervals. The samples were first placed in a thermostatic bath at 20oC to avoid changes in the spectral intensities caused by temperature differences. Absorbance of the samples in a 1 cm cuvette at 270 nm (the lowest wavelength used in the fluorescence determinations) was generally well below 0.05. The correction of the fluorescence spectra for inner filter effects was therefore deemed unnecessary (Kothawala et al., 2013). Spectra were collected in signal-to-reference mode with instrument-specific excitation and emission corrections applied during collection. Daily recorded Milli-Q water blanks were subtracted from the sample spectra to eliminate water Raman scatter peaks. Subsequently, EEMs were normalized to the integrated area of Milli-Q water Raman peaks to account for potential instrument-dependent intensity factors (Lawaetz and Stedmon, 2009). Results are expressed in Raman units (R.U.). MATLAB with the DOMFluor Toolbox was used to handle first- and second-order Rayleigh scatter peaks and to perform the PARAlel FACtor analysis (PARAFAC) of our samples (Stedmon and Bro, 2008). PARAFAC modeling of EEM fluorescence has been extensively described elsewhere (Andersen and Bro, 2003; Stedmon and Bro, 2008). It allows decomposition of a three-way array of data (the 3-D excitation-emission matrix) into a set of three linear terms and a residual array. Following PARAFAC decomposition, the complex sample EEM yields the individual fluorescence components (fluorophores) within the sample and their individual abundance. PARAFAC analysis was performed on the entire EEM fluorescence dataset discussed here (701 samples). The adequacy of the selected number of components and the uniqueness of the solution were tested by Split Half Analysis (Stedmon and Bro, 2008).
Results
Water and Solute Seepage at the Sampling Site
Seepage rates measured from December 2009 to January 2011 showed a similar discharge pattern to that previously described at the same site (Leote et al., 2008). Seepage rates peaked during ebb tide and were minimal or absent at flood tide (see Supplementary Material). Linear vertical porewater velocities in excess of 100 cm day–1 were measured at station A in all surveys but April 2010 (Figure 2). The highest discharge rates were always measured at this point, followed by station B except during October 2010 where station C showed higher water discharge rates. Although we recorded the highest discharge rates observed between 2009 and 2011 at station A during October 2010 (153 ± 73 cm day–1), the difference in discharge rates obtained during the five sampling periods covering this point of the profile were non-significant (Kruskal–Wallis test, p > 0.05).
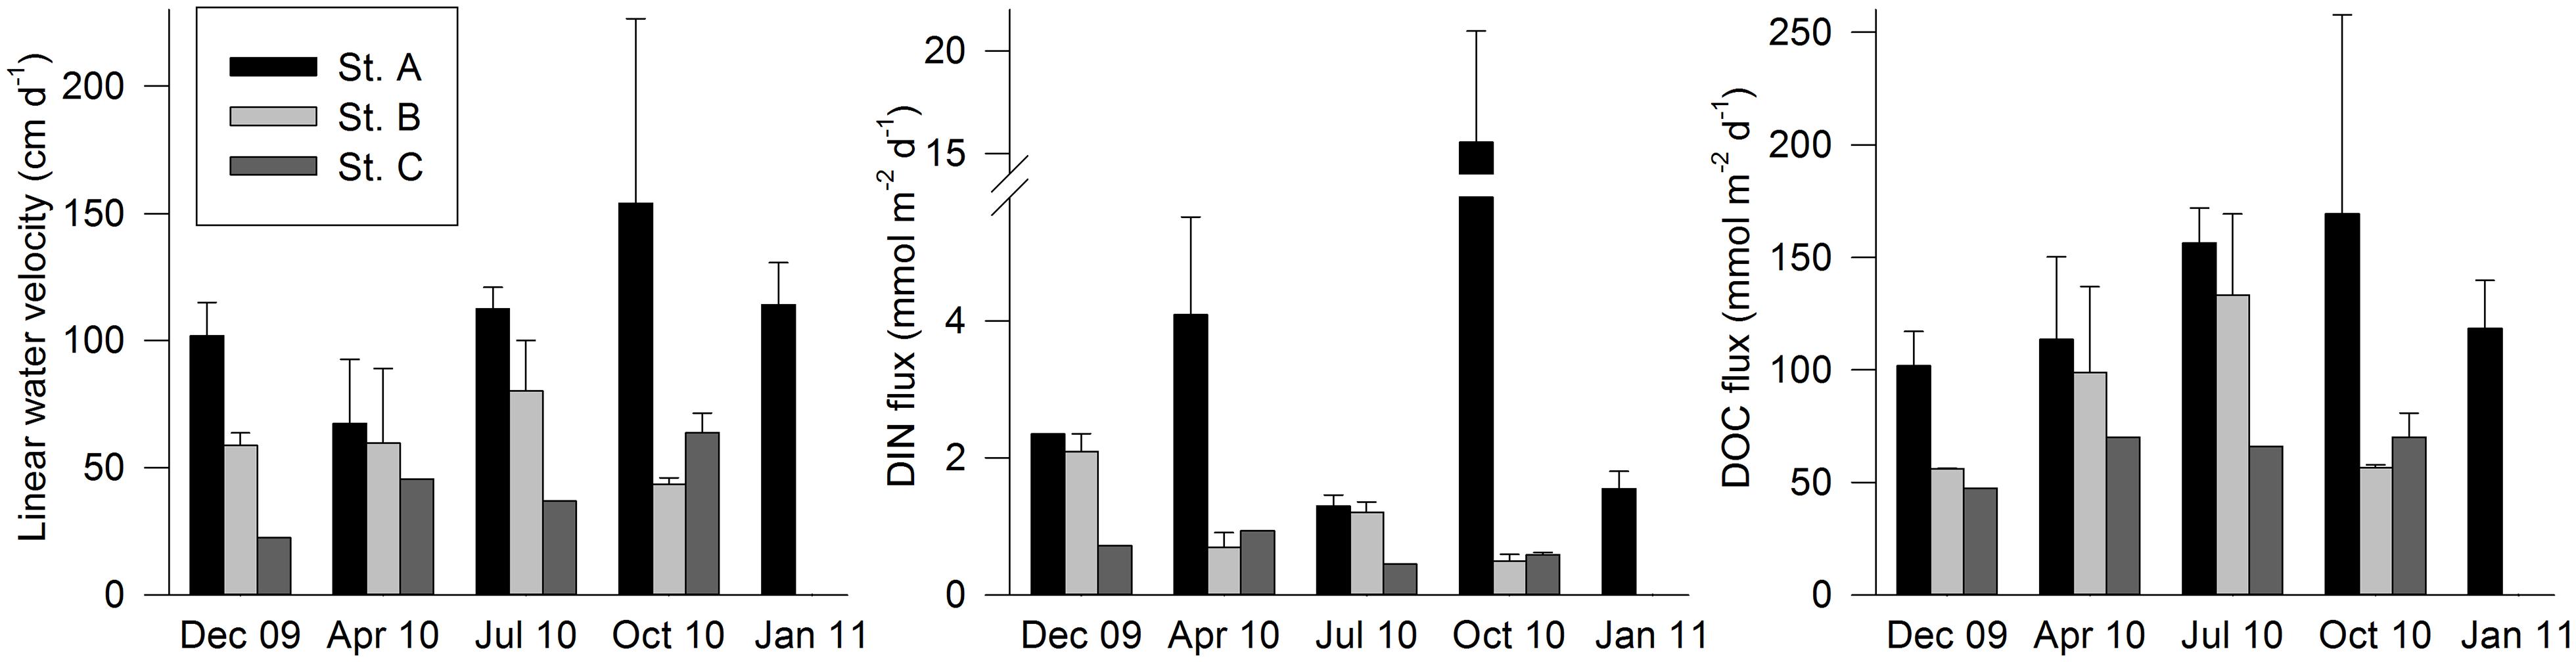
Figure 2. Daily linear porewater velocities, and DIN and DOC fluxes per sampling station calculated over the two consecutive tidal cycles sampled during each survey. Error bars represent the standard error of the estimate.
The salinity of STE outflows only dipped below 35 in April 2010 (Figure 3). This contrasts with the 2005–2007 period, when salinities as low as 16.8 were measured (Leote et al., 2008). Nevertheless, the magnitude of the discharge remained very high and comparable to that measured during 2005–2007 (up to 180 cm day–1; Leote et al., 2008).
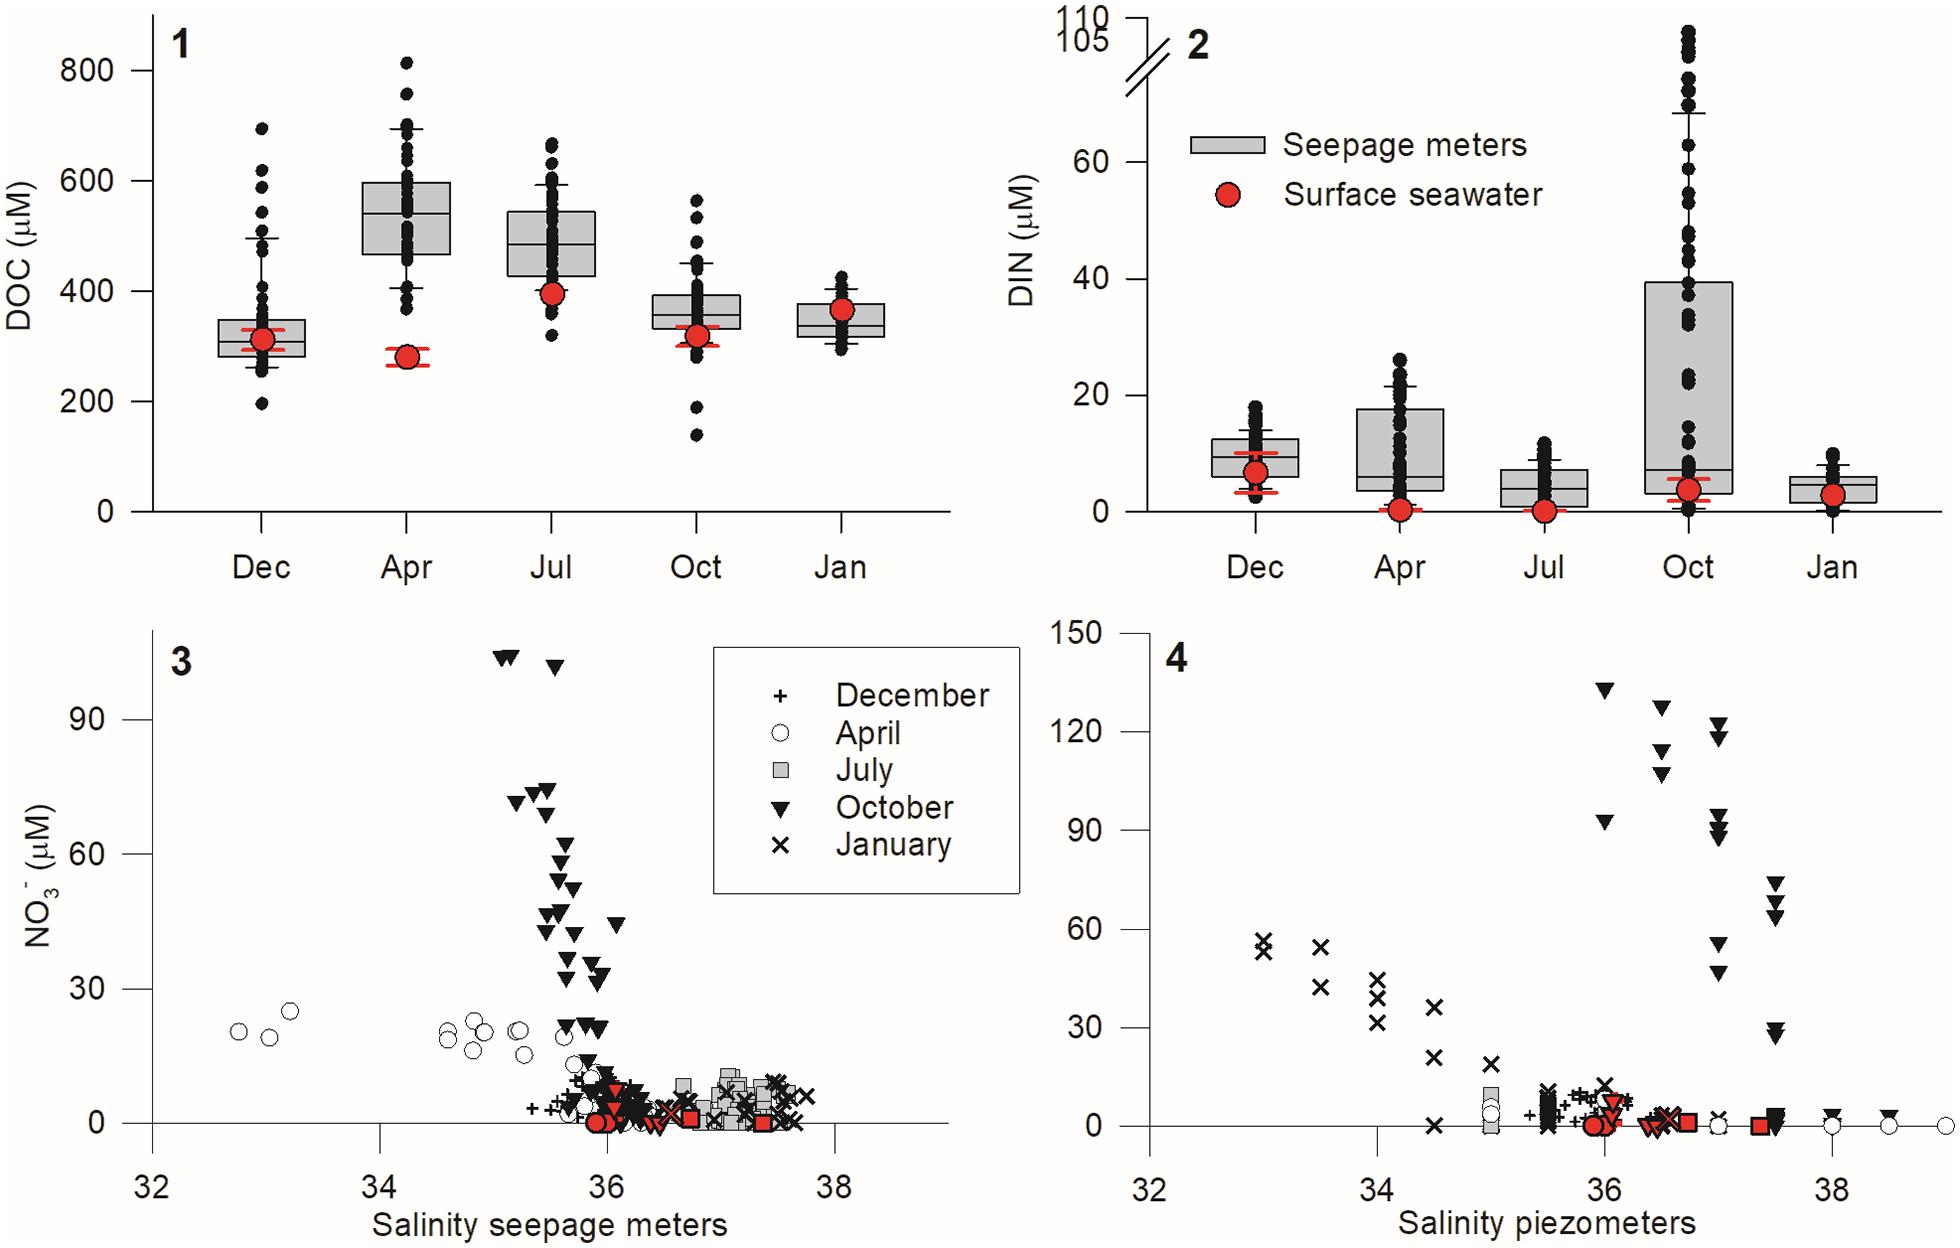
Figure 3. Upper panels: box plot of DOC and DIN concentration range observed in the water samples taken from seepage meters during the five seasonal sampling surveys. Square limits represent the first and the third quartiles, the middle line represents the median, and whiskers are proportional to the interquartile range (IQR) of the data by using 1.58 IQR/(n)1/2. Average DOC and DIN concentrations measured in the surface seawater at low tide are shown in red as reference. Lower panels: Seasonal NO3– concentrations measured in the seeped water (3) and in the porewater samples taken with piezometers (4) as a function of salinity. Symbols denote each survey performed, while red fills are used to include the surface seawater measurements as reference.
NO3– was generally the predominant dissolved inorganic nitrogen form (DIN = NO3– + NO2– + NH4+; Supplementary Table 1) in STE outflow water. The highest DIN concentrations in seepage were recorded during October 2010, even if the lower salinities were measured during April 2010 (Figure 3). For the April and October data, DIN was significantly correlated with salinity (Figure 3), but with very distinct slopes (April: −7.1x + 261.7, R = 0.80, p < 0.0001, n = 46; October: −84.1x + 3041.7, R = 0.86, p < 0.0001, n = 71). DOC concentrations in seepage were highest in April (Figure 3). DOC fluxes from the beach face at station A, where the highest fluxes were measured, remained year round between 100 and 170 mmol m–2 day–1 (Figure 2). DOC did not covary significantly with salinity, and both DOC and DIN concentrations in the seeped water were generally higher than those measured in the surface seawater during low tide (Figure 3).
FDOM Components at the Seepage Face
PARAFAC analysis of our dataset identified five FDOM components (see Supplementary Material). These were compared with the OpenFluor database1 (Murphy et al., 2014). All five components showed high similarity (>0.95 Tucker’s congruence) with components identified in several prior studies (C1 present in nine studies, C2 in 18, C3 in 62, C4 in 61, and C5 in 24). Components 1, 2, and 4 (C1, C2, and C4) have characteristic emission wavelengths of 296, 340, and 336 nm, typical of protein-like fluorophores. They correspond to peaks T (C2 and C4) and B (C1) in Coble’s nomenclature (Coble, 1996) and are associated to labile DOM (Yamashita and Tanoue, 2003; Stubbins et al., 2014). Although they have similar characteristic emission wavelengths, components C2 and C4 differ in their characteristic excitation wavelengths (300 and 280 nm, respectively), suggesting they may correspond to FDOM fractions with different molecular weight (higher in C2; Coble et al., 1998). Components 3 and 5 (C3 and C5) have emission wavelengths of 418 and 466 nm characteristic of humic-like FDOM components (Supplementary Figure 2). Component C3 is similar to Coble’s peak M, previously identified as a humic-like FDOM component freshly produced in the marine environment by microbial activity. Component C5 corresponds to Coble’s peak C and is associated with refractory terrestrial DOM of low bioavailability (Stubbins et al., 2014). These FDOM components are highly similar to those from an independent PARAFAC analysis run with samples from flow-through reactor experiments conducted with water and sediment collected at the same sampling site (Ibánhez and Rocha, 2014a). Three protein-like (C1, C2, and C5, with characteristic emission wavelengths of 358, 320, and 298 nm, respectively) and two humic-like (C3 and C4, with characteristic emission wavelengths of 464 and 422 nm) FDOM components were also identified then.
Protein-like FDOM component C2 and the two humic-like FDOM components were always present in the seeped water. The predominant FDOM components, on the basis of relative peak intensity, were protein-like component C1 (44.4 ± 1.8%) followed by the marine humic-like component C3 (18.1 ± 0.7%). Over the entire dataset (n = 701), these two components as well as the terrestrial humic-like component C5 were significantly correlated with DOC concentration (C1: R = 0.56, p < 0.0001; C3: R = 0.66, p < 0.0001; C5: R = 0.26, p < 0.0001; n = 251). In contrast, no correlations of FDOM components with salinity or DIN were found. This general pattern in the composition of the FDOM held for each sampling event but October, where FDOM was dominated by the marine humic-like component C3 (28.9 ± 0.9%), followed by the protein-like component C4 (26.9 ± 1.2%) and the terrestrial humic-like component C5 (17.2 ± 0.6%). Despite its ubiquitous presence, protein FDOM component C2 was the lowest contributor to the overall FDOM pool by far (median contribution <8%) and therefore was excluded from the subsequent data analysis.
The FDOM composition of seepage differed along the beach profile. The relative abundance of the two humic-like FDOM components (C3 and C5) was strongly correlated within the permanently saturated beach face (stations A and B), but not in station C (Figure 4). Furthermore, this correlation was highly similar across both stations, with very comparable regression slopes (Figure 4). Similarly high correlation between the two humic-like FDOM components was observed in surface seawater samples. In contrast, no significant correlations between the relative abundance of the protein-like FDOM components C1 and C4 were found in seepage.
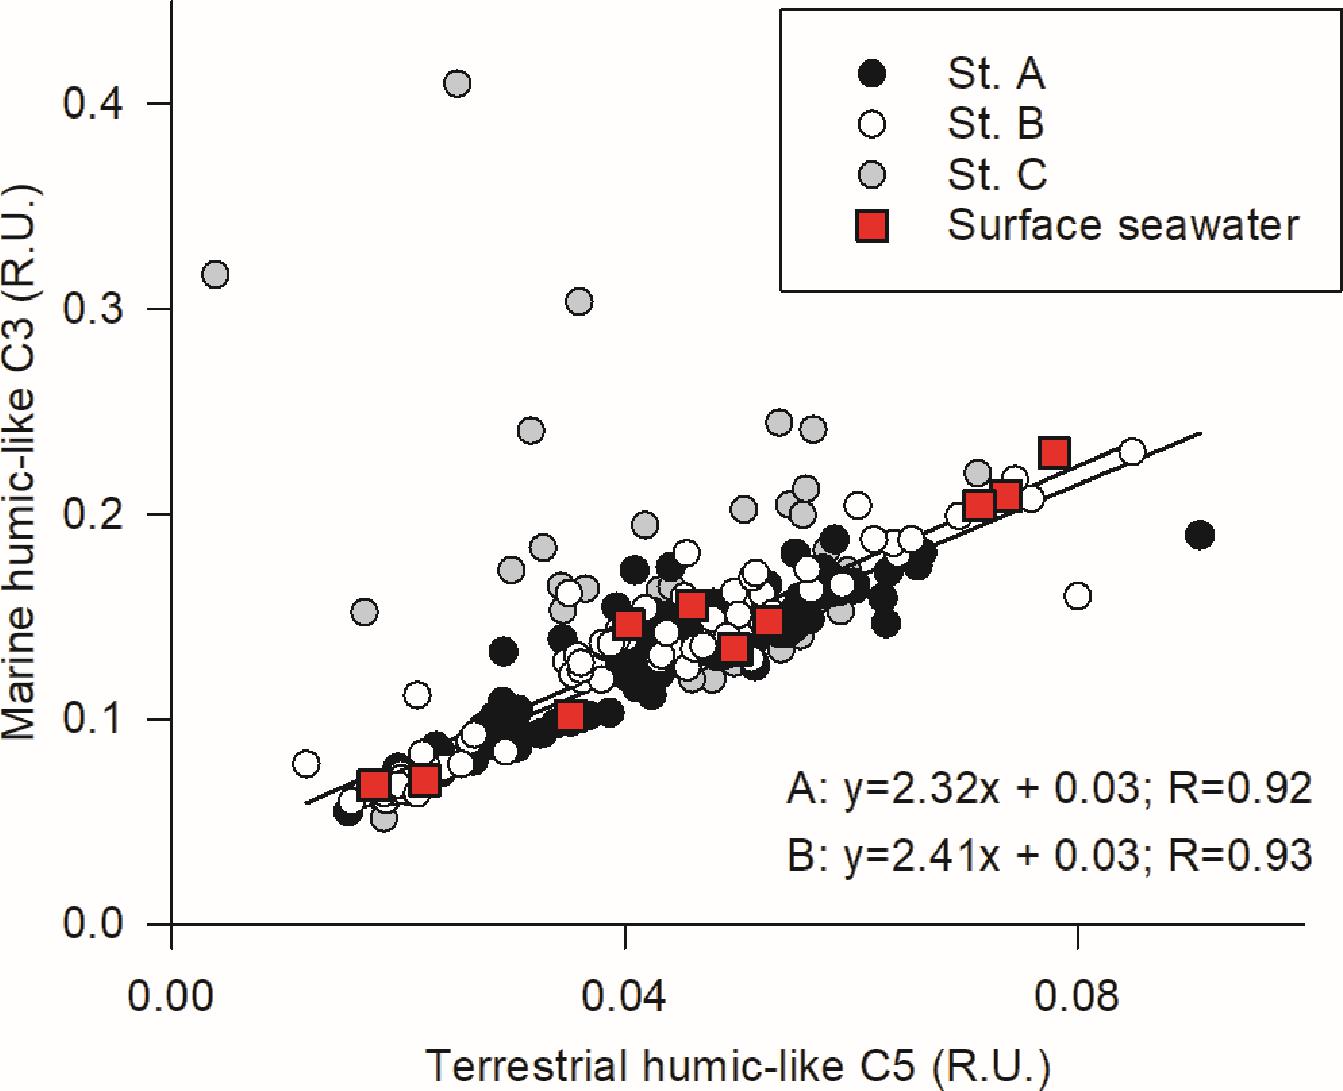
Figure 4. Relationships of the two humic-like FDOM components identified through PARAFAC modeling of our dataset in the samples collected from the seepage meters and those collected from the surface seawater during low tide. Samples from the seepage meters are organized by sampling station.
Porewater Solute Distribution at the Seepage Face
Large spatial solute gradients were found within the beach porewater. Figures 5, 6 show a snapshot of solute distribution within the seepage face at the beginning of active seepage (i.e., at the beginning of sediment exposure). In contrast with seepage meter outflows, porewater salinities lower than 35 were only detected in January 2011 (Figure 3). These lows were restricted to sampling stations C and B where no seepage meters were installed at the time (Figure 5.5). Still, variable vertical salinity gradients are found in almost all the surveys. In stations C and B, the lowest salinity generally corresponds to samples taken from the deepest screened points within the beach aquifer (2 m depth). The exception occurred in January, where the lowest salinities within the beach are found at the shallower screened depths at station B (Figure 5.5). At station A, the lower salinity values in seepage water are found in April (Figure 5.2) and during July in porewater (salinity = 35; Figure 5.3).
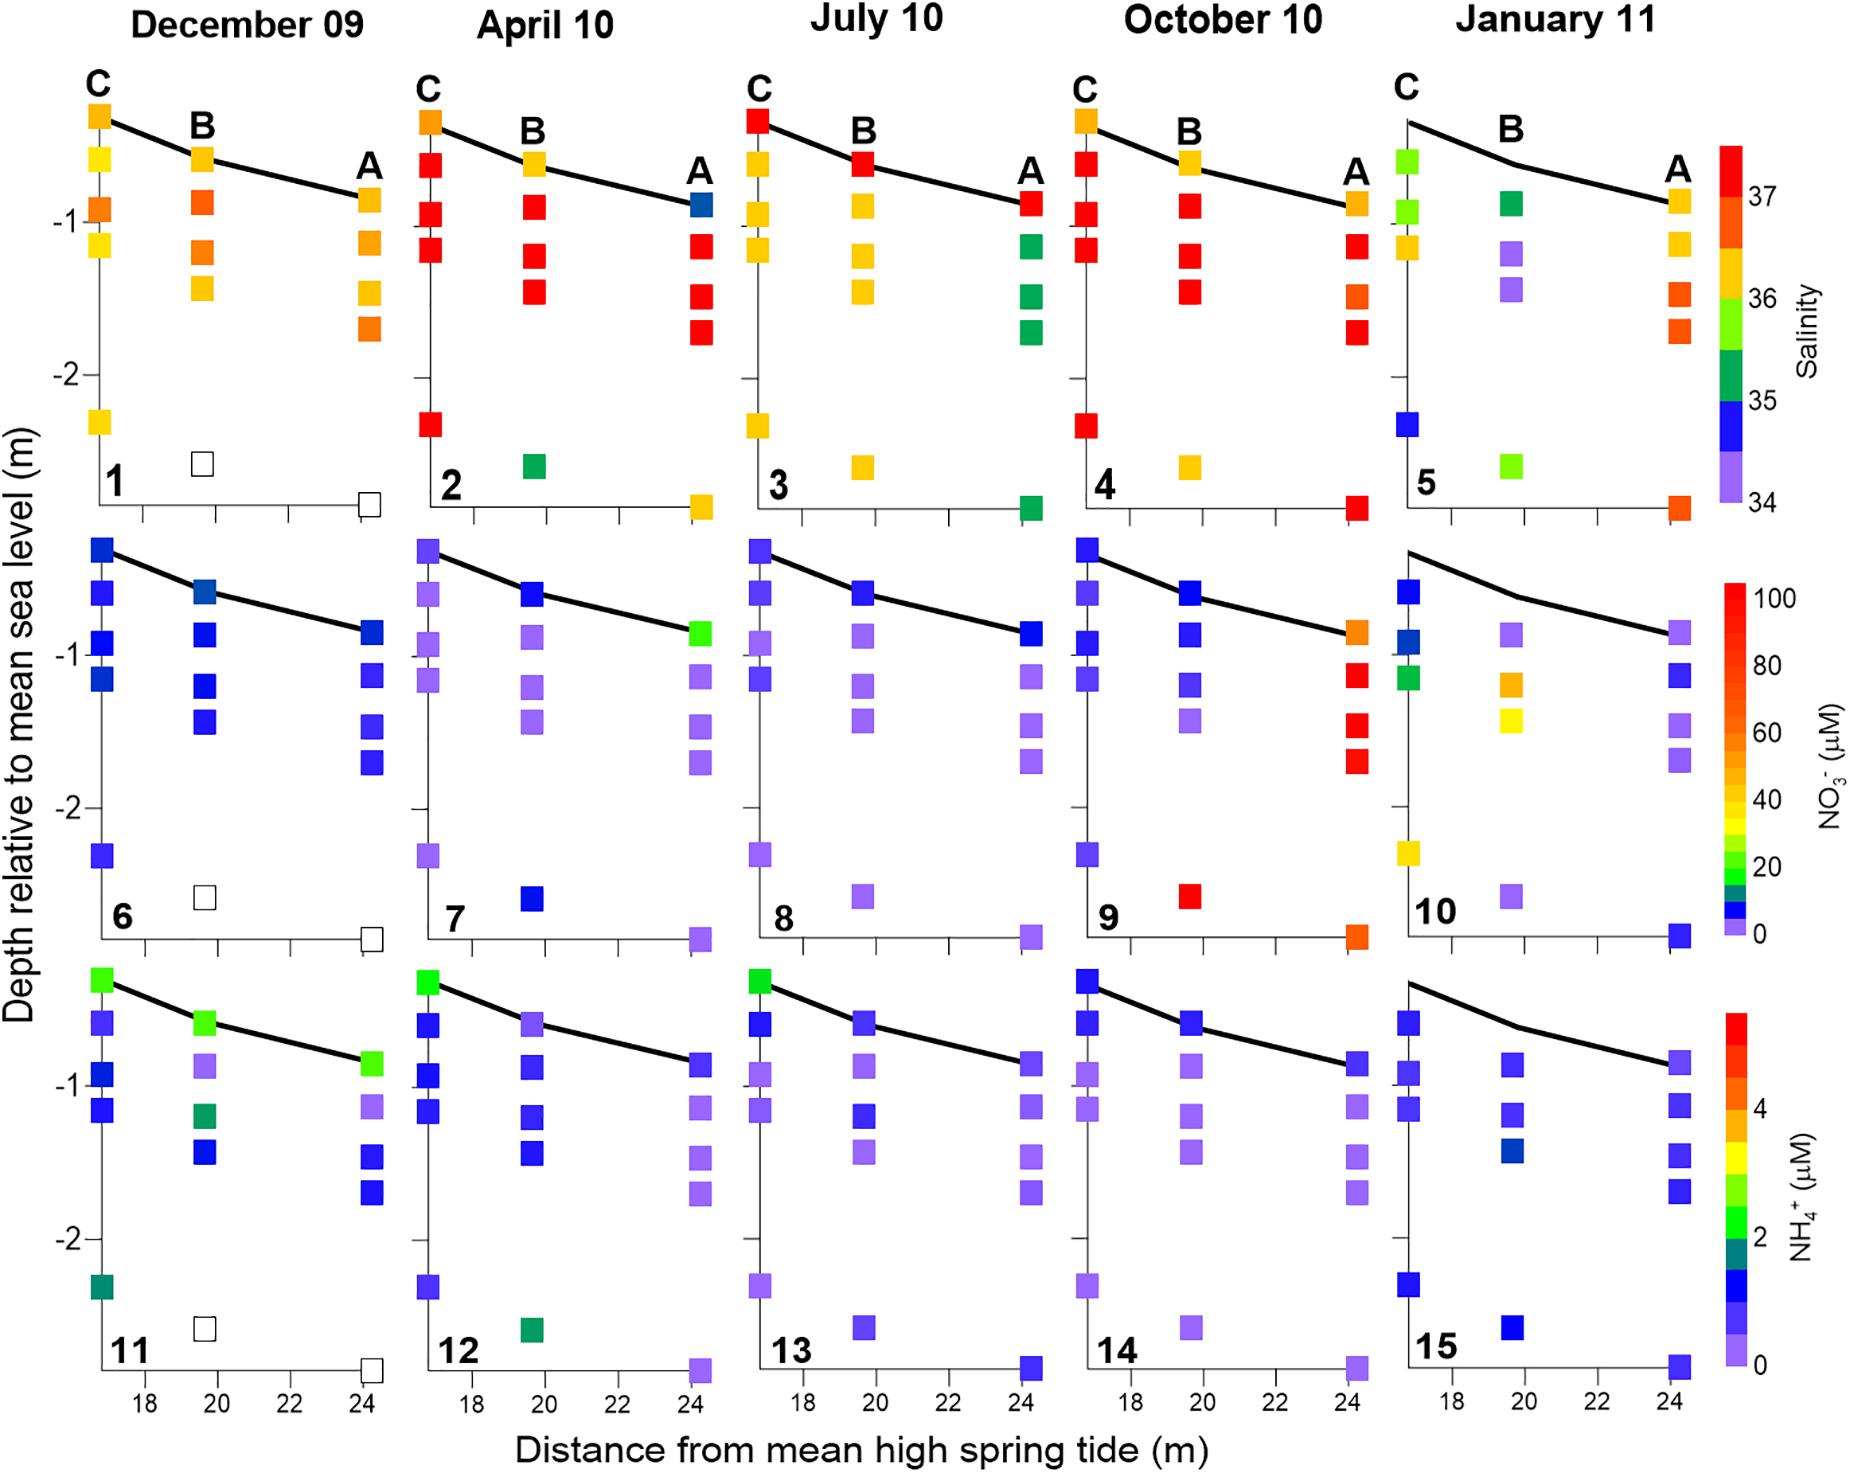
Figure 5. Solute distribution within the seepage face at the beginning of sediment exposure during low tide. Salinity (panels 1–5), NO3– (panels 6–10), and NH4+ (panels 11–15) are shown for the five surveys presented here. Data are represented on the beach profile, where the dark line represents sediment surface. Samples were collected with piezometers buried at different depths and seepage meters. Seepage meter data corresponding to half an hour around the time of piezometer sampling were integrated at each sampling station and presented at the sediment surface. Sampling stations are labeled in the top panels. White squares mean lack of data.
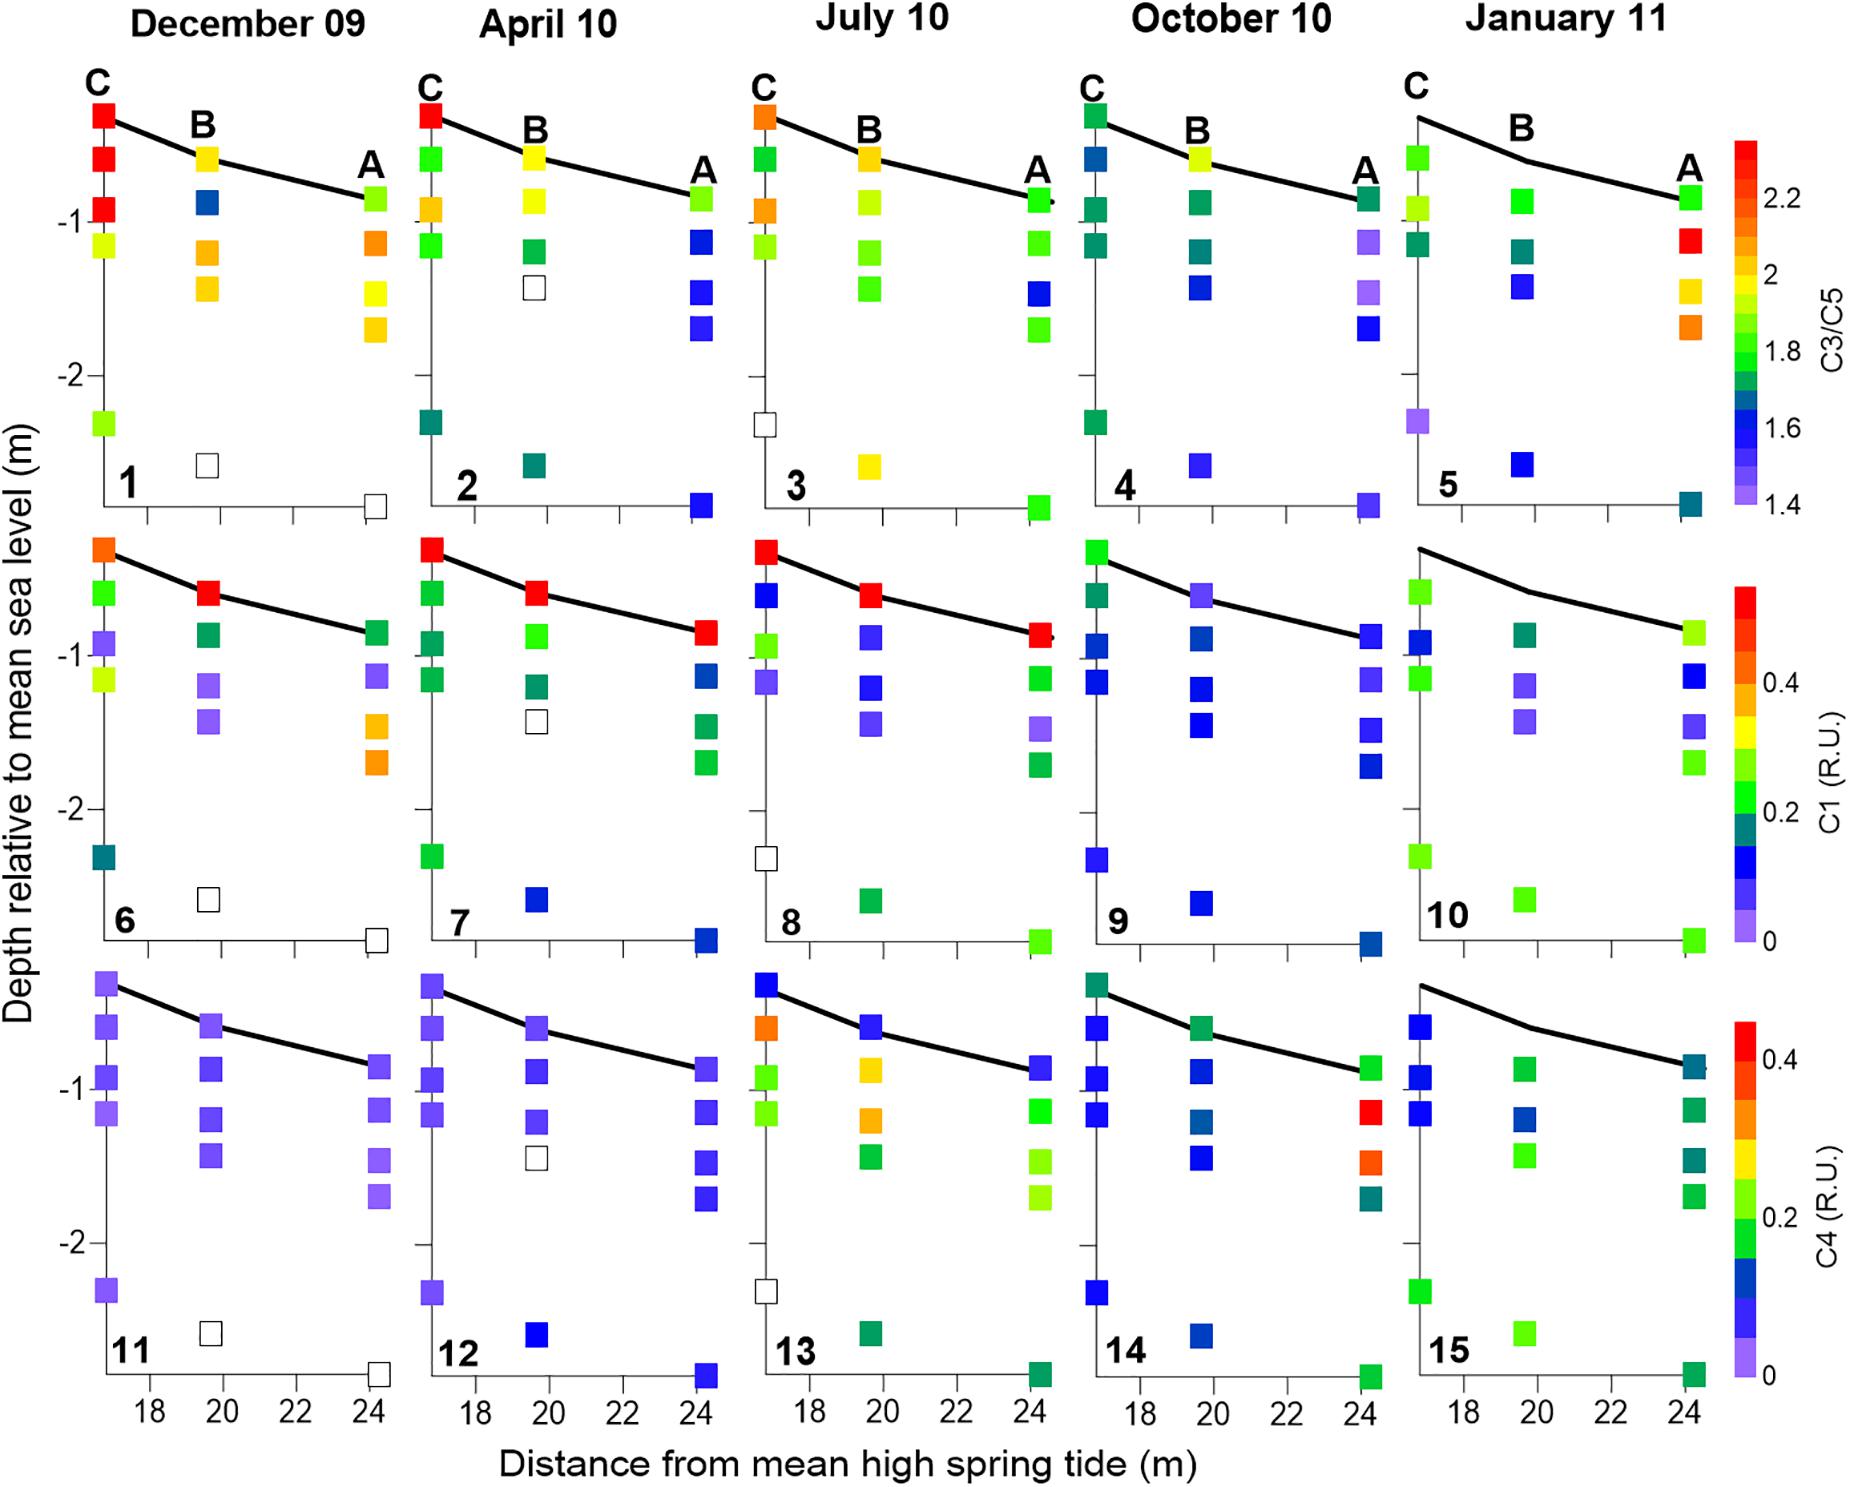
Figure 6. FDOM distribution within the seepage face at the beginning of sediment exposure during low tide. The ratio of FDOM C3/C5 (panels 1–5), C1 (panels 6–10), and C4 (panels 11–15) are shown for the five surveys presented here. Data are represented on the beach profile, where the dark line represents sediment surface. Samples were collected with piezometers buried at different depths and seepage meters. Seepage meter data corresponding to half an hour around the time of piezometer sampling were integrated at each sampling station and presented at the sediment surface. Sampling stations are labeled in the top panels. White squares mean lack of data.
NO3– was the predominant form of porewater DIN throughout the studied period (Figure 5), as expected given the near-saturation of oxygen inside the beach (see Supplementary Figure 3; Ibánhez and Rocha, 2016). Significant reductions in oxygen levels during active seepage are only found in association with particulate organic matter (POM) enrichments near the sediment surface (Ibánhez and Rocha, 2016). NO3– distribution within the seepage face follows two different patterns during the year: from December 2009 to July 2010, NO3– porewater concentrations were lower than 15 μM and generally peaked close to the sediment surface. During October 2010 and January 2011, NO3– concentrations in porewaters exceeded 30 μM (up to 133 μM in October; Figure 3). In these two surveys, a significant linear relationship between salinity and NO3– exists, although with different slopes and intercepts: October: −77.3x + 2923.5, R = 0.81, p < 0.0001, n = 44; January: −14.0x + 504.7, R = 0.83, p < 0.0001, n = 56 (Figure 3). The location of the most NO3– enriched porewater was also different during these two surveys: in October, it was found at depth in station B and distributed with depth in station A (Figure 5.9). In January, it was found at depth in station C and in the shallower screens for station B piezometer nests (Figure 5.10). Ammonium, on the other hand, was permanently low and did not exceed 3 μM with peak concentrations found near the sediment surface (Figures 5.11–15).
With regard to the zonation of FDOM components, the highest values for the ratio between abundances of FDOM components C3 and C5 (C3/C5) within the seepage face were generally found in the beach interior (Figures 6.1–4), except for January where they could be found in the shallower levels of station A (Figure 6.5). On the other hand, the lowest C3/C5 abundance ratios were found during October and January (Figures 6.4–5) and generally matched the location of NO3–-enriched porewaters (Figures 5.9–10). Contrastingly, while FDOM component C1 was more abundant at the sediment surface from December to July (Figures 6.6–8), C4 tended to be more prevalent in depth (Figures 6.11–15). Nevertheless, no statistical evidence of antithetical association between these protein-like FDOM components was found.
The spatial solute distribution within the seepage face was relatively constant throughout the active seepage period (Figures 7, 8). Salinity gradients within the seepage face remained in place throughout the sampled period (Figures 7.2–4), suggesting the active pumping of waters with different origin contributed to support them. Toward the end of sediment exposure, the brackish, NO3–-enriched porewaters observed in station B during January (Figures 7.5, 7.11) were replaced by low NO3–, saline porewaters (Figures 7.5, 7.11). Interestingly, in April, salinity gradients persisted at the deepest beach aquifer zones during tidal exposure (Figures 7.2–3) in association with higher NO3– concentrations than those in surrounding porewaters (Figures 7.8, 7.9). Furthermore, the spatial patterns identified at the beginning of sediment exposure with regard to FDOM components remained almost unchanged throughout the period of active seepage (Figure 8). The lowest C3/C5 ratios were identified in station A during April and stations B and C during January with small changes over time. Labile FDOM component C1 peaked at the sediment–water interface during April and remained so throughout tidal exposure. On the contrary, the highest abundance of the labile FDOM component C4 was found in depth throughout the same period.
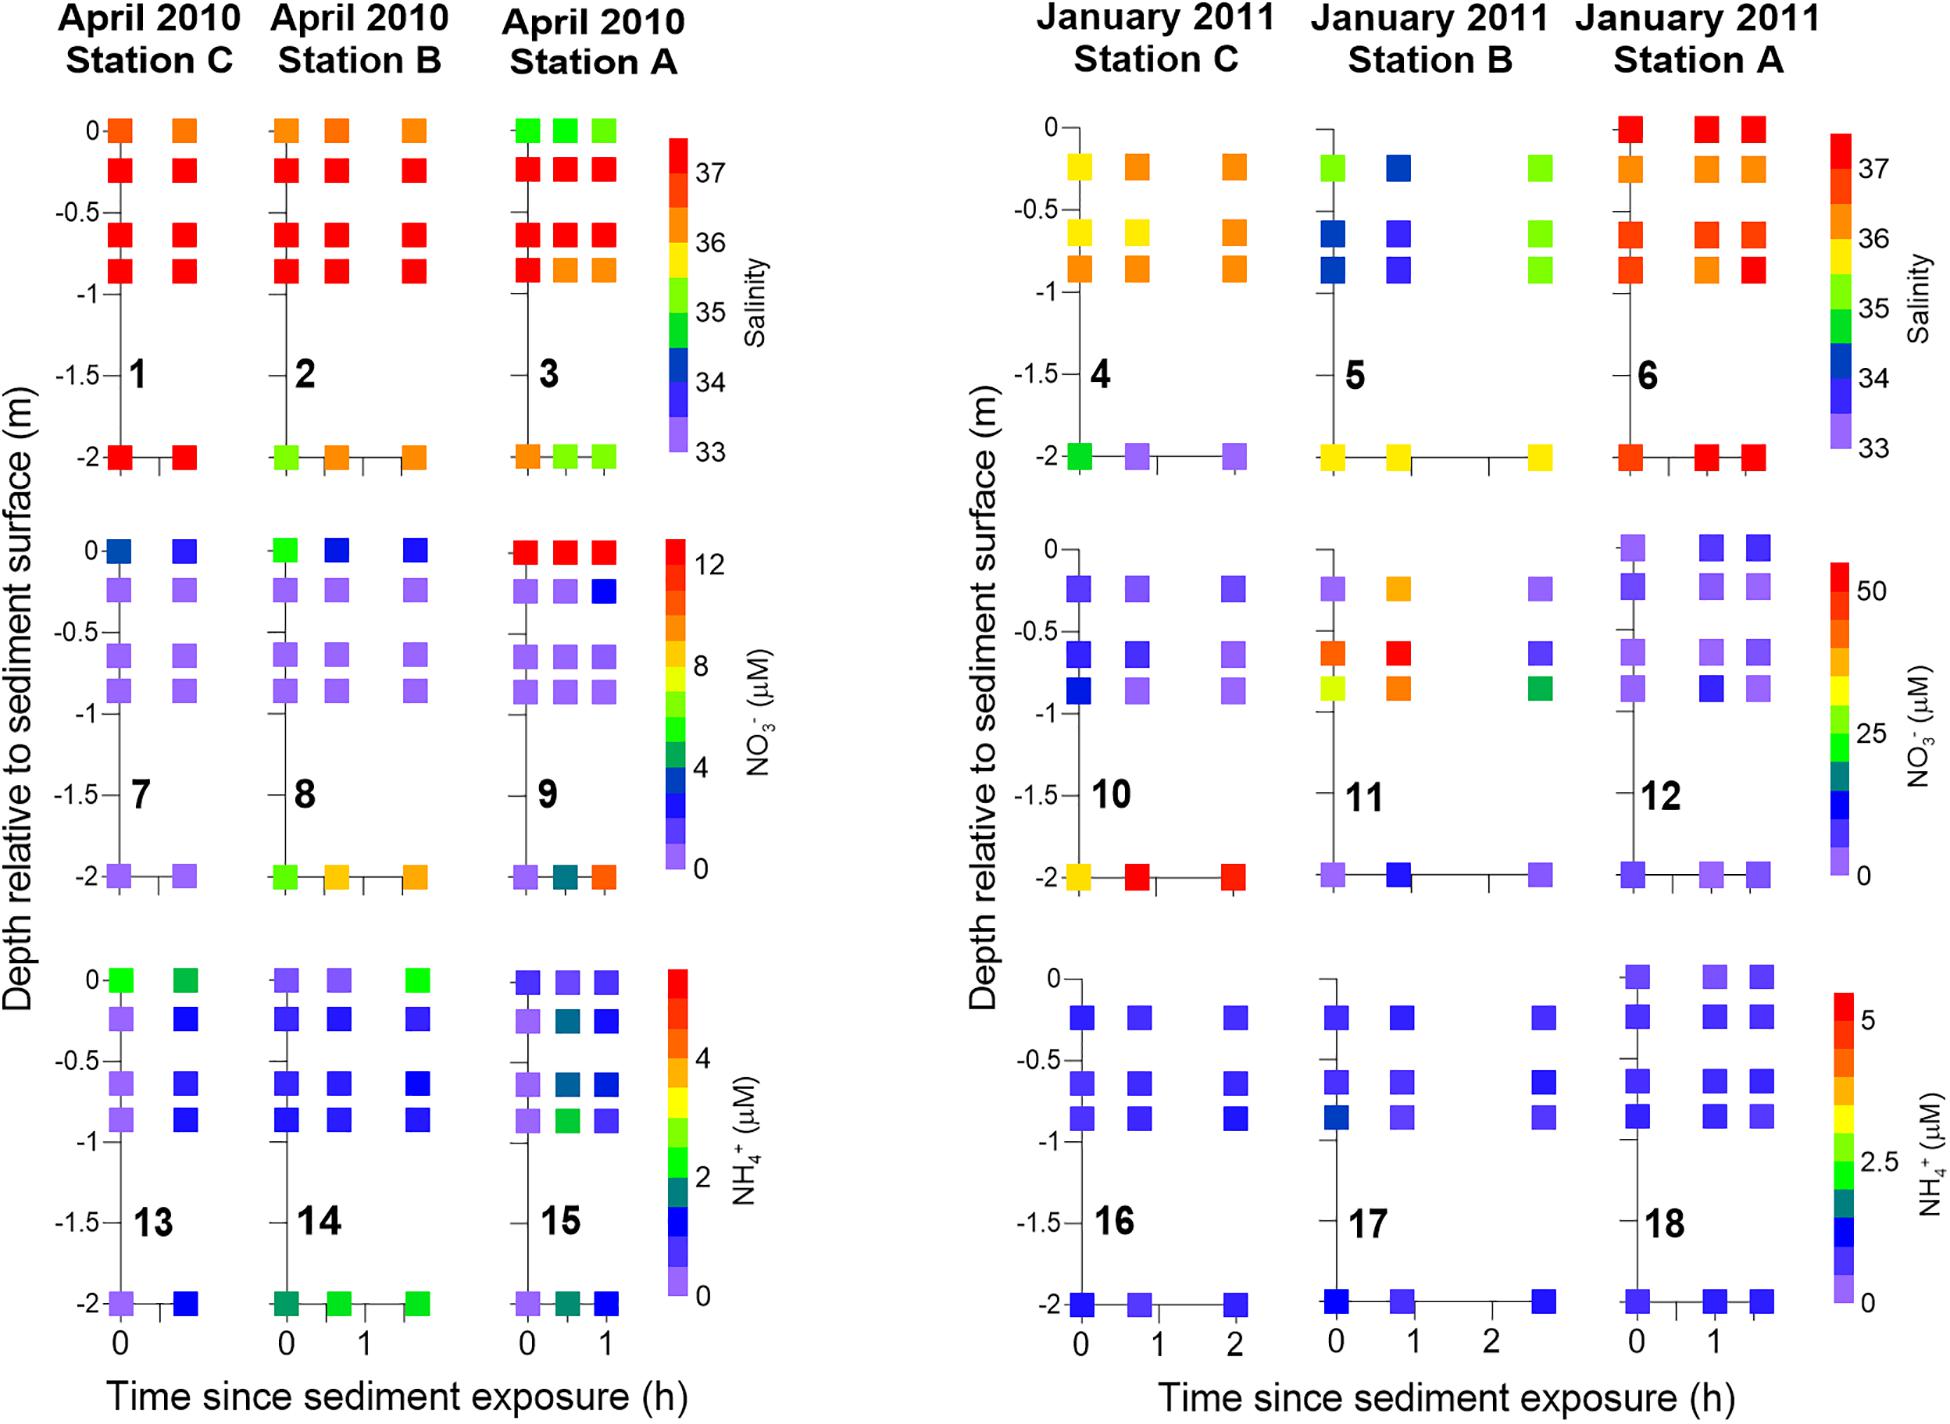
Figure 7. Temporal solute distribution within the seepage face during the period of active seepage, i.e., during sediment exposure, organized by sampling station during April 2010 and January 2011. Porewater salinity (panels 1–6), NO3– (panels 7–12), and NH4+ (panels 13–18) are shown. Samples were collected with piezometers and seepage meters. Seepage meter data corresponding to half an hour around the time of piezometer sampling were integrated at each sampling station and presented at the sediment surface. White squares represent lack of data. Note the different scale in the NO3– concentrations between April and January.
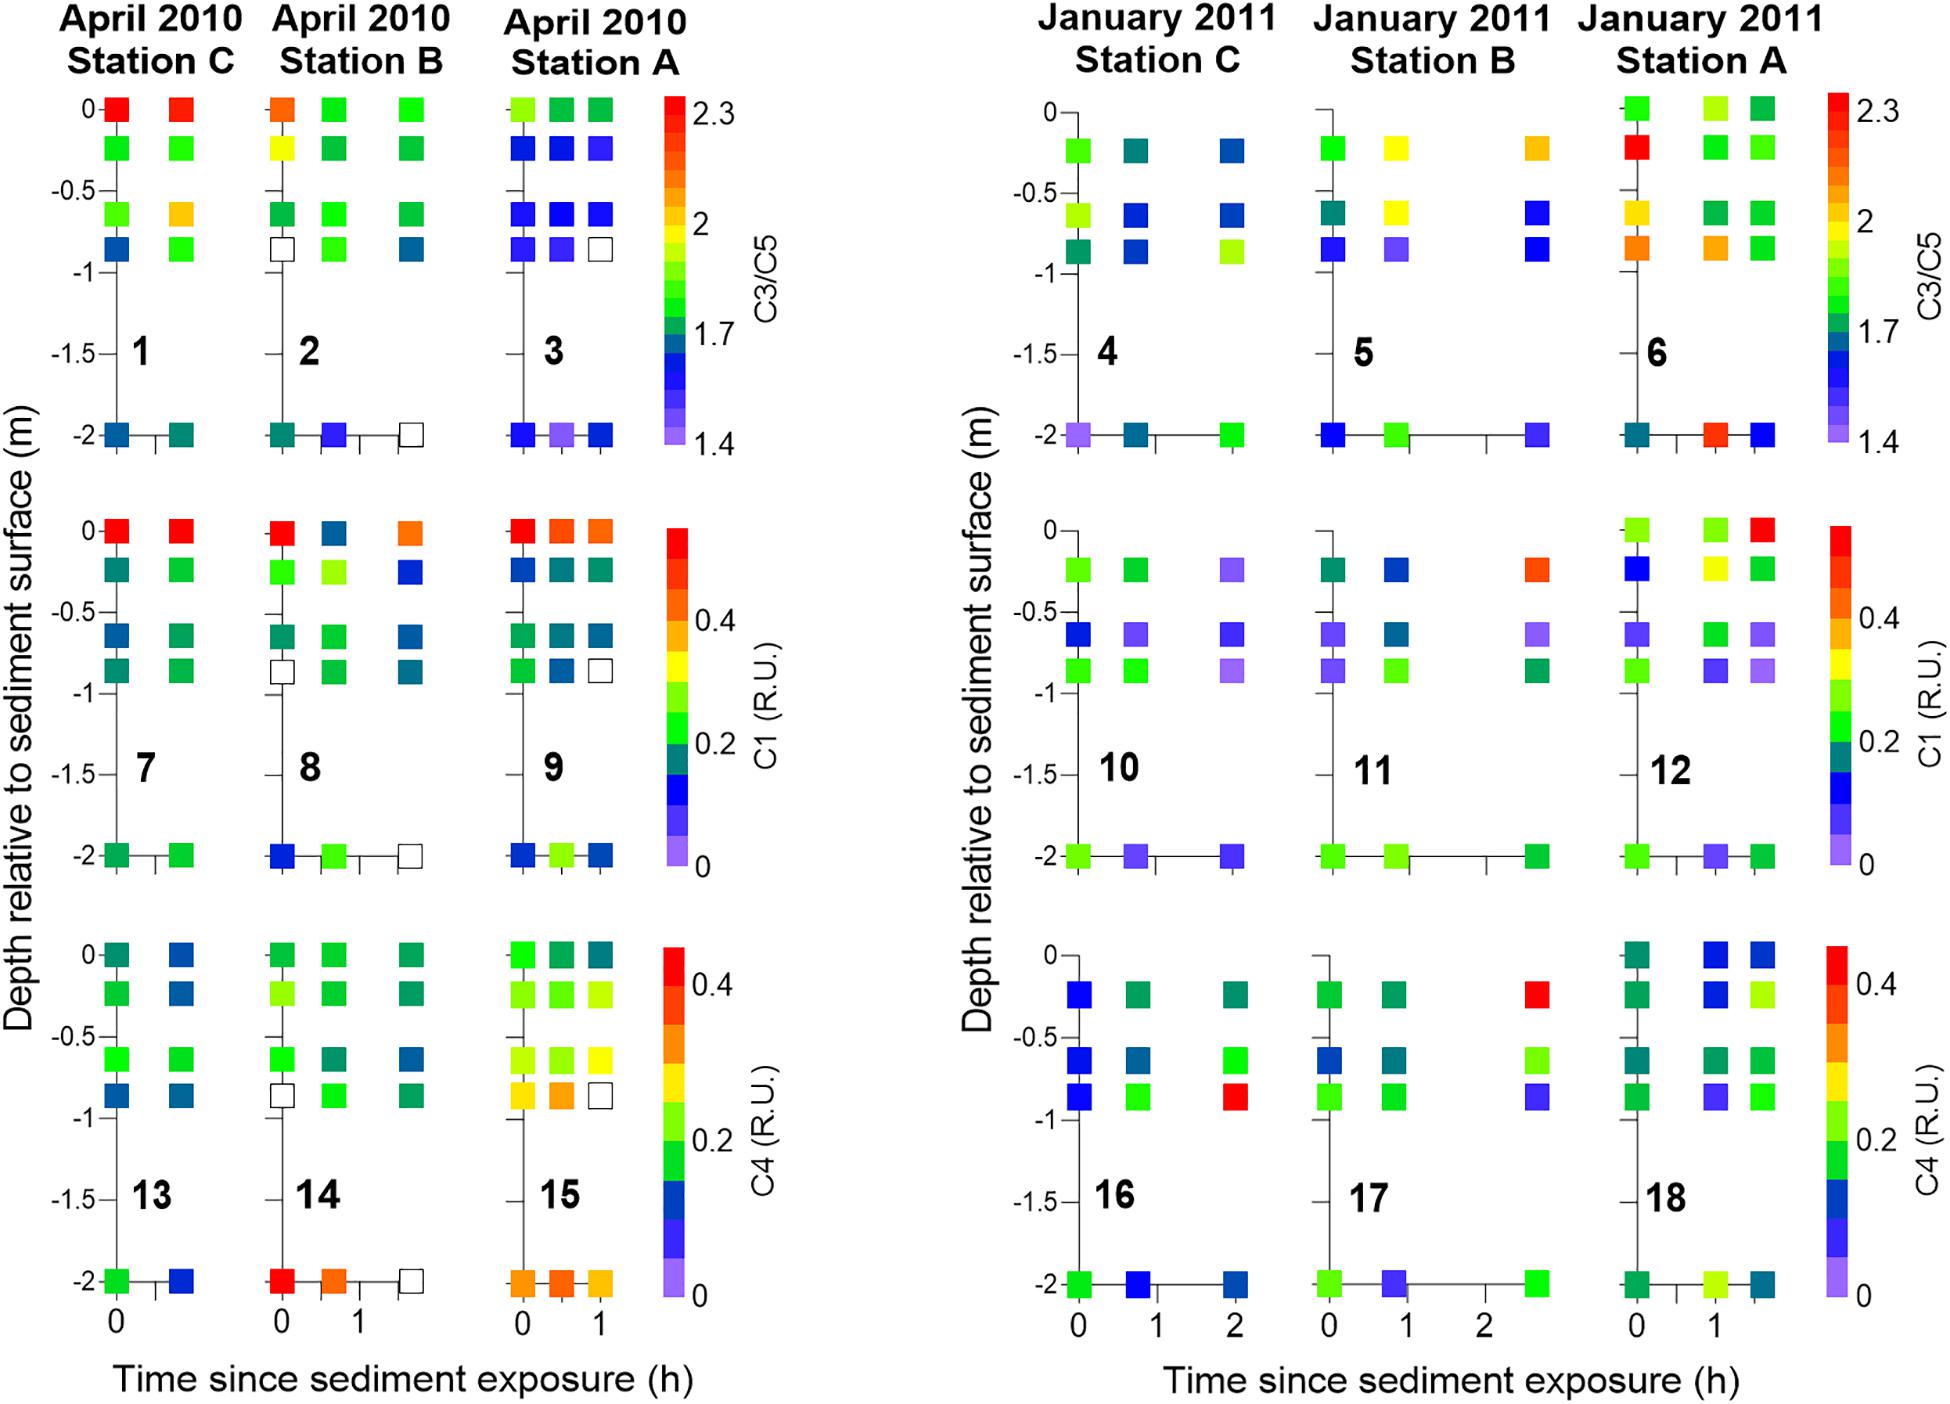
Figure 8. Temporal FDOM distribution within the seepage face during the period of active seepage, i.e., during sediment exposure, organized by sampling station during April 2010 and January 2011. The ratio of FDOM C3/C5 (panels 1–6), C1 (panels 7–12), and C4 (panels 13–18) is shown. Samples were collected with piezometers and seepage meters. Seepage meter data corresponding to half an hour around the time of piezometer sampling were integrated at each sampling station and presented at the sediment surface. White squares represent lack of data.
The persistence of large, stable solute gradients within the beach aquifer during tidal exposure in spite of high seepage rates highlights the extent of reactive modulation of solute concentrations inside the beach prior to discharge. High-resolution vertical porewater profiles show that the largest vertical solute gradients occur near the sediment surface at the peak of the discharge (Figures 9, 10). These are measured within vertically homogeneous salinity distributions (see Supplementary Material), implying that the nitrate gradients are sustained by reaction and not by mixing of different inputs. NO3– peaked within the surface 30–50 cm of sediment in station A from December 2009 to July 2010 (Figure 9) when large porewater flow rates were measured (Figure 2). Considering the predominant vertical direction of flow near the sediment surface at our site (Rocha et al., 2009; Ibánhez and Rocha, 2016), these results imply the active production of NO3– near the sediment surface at that point of the beach profile. The same is clearly observed at station B in July and October (Figure 10). In contrast, NO3– is only available at measurable concentrations at depths exceeding 50 cm during December in station B (>3 μM; Figure 9), during January in station A and the deepest reaches of station B and during October over the entire sediment column below station A, where NO3– concentrations exceeded 100 μM (Figure 10). NH4+, on the other hand, remained low throughout the entire period of study. The abundance of the two humic-like FDOM components, analyzed individually, was virtually constant with depth throughout the period of study, with very low temporal variability (very small error bars; Figure 9). The only notable exceptions to this general pattern were found in January 2011 and quite clearly in October 2010, where the vertical distribution of humic-like FDOM abundance drastically changed over the surface 30 cm of sediment from relative homogeneity with depth (Figure 10). There, active production of both C3 and C5 was observed. Protein-like FDOM components C1 and C4 showed higher spatial and temporal variability, although in general the largest changes also occurred at the surface sediment layers.
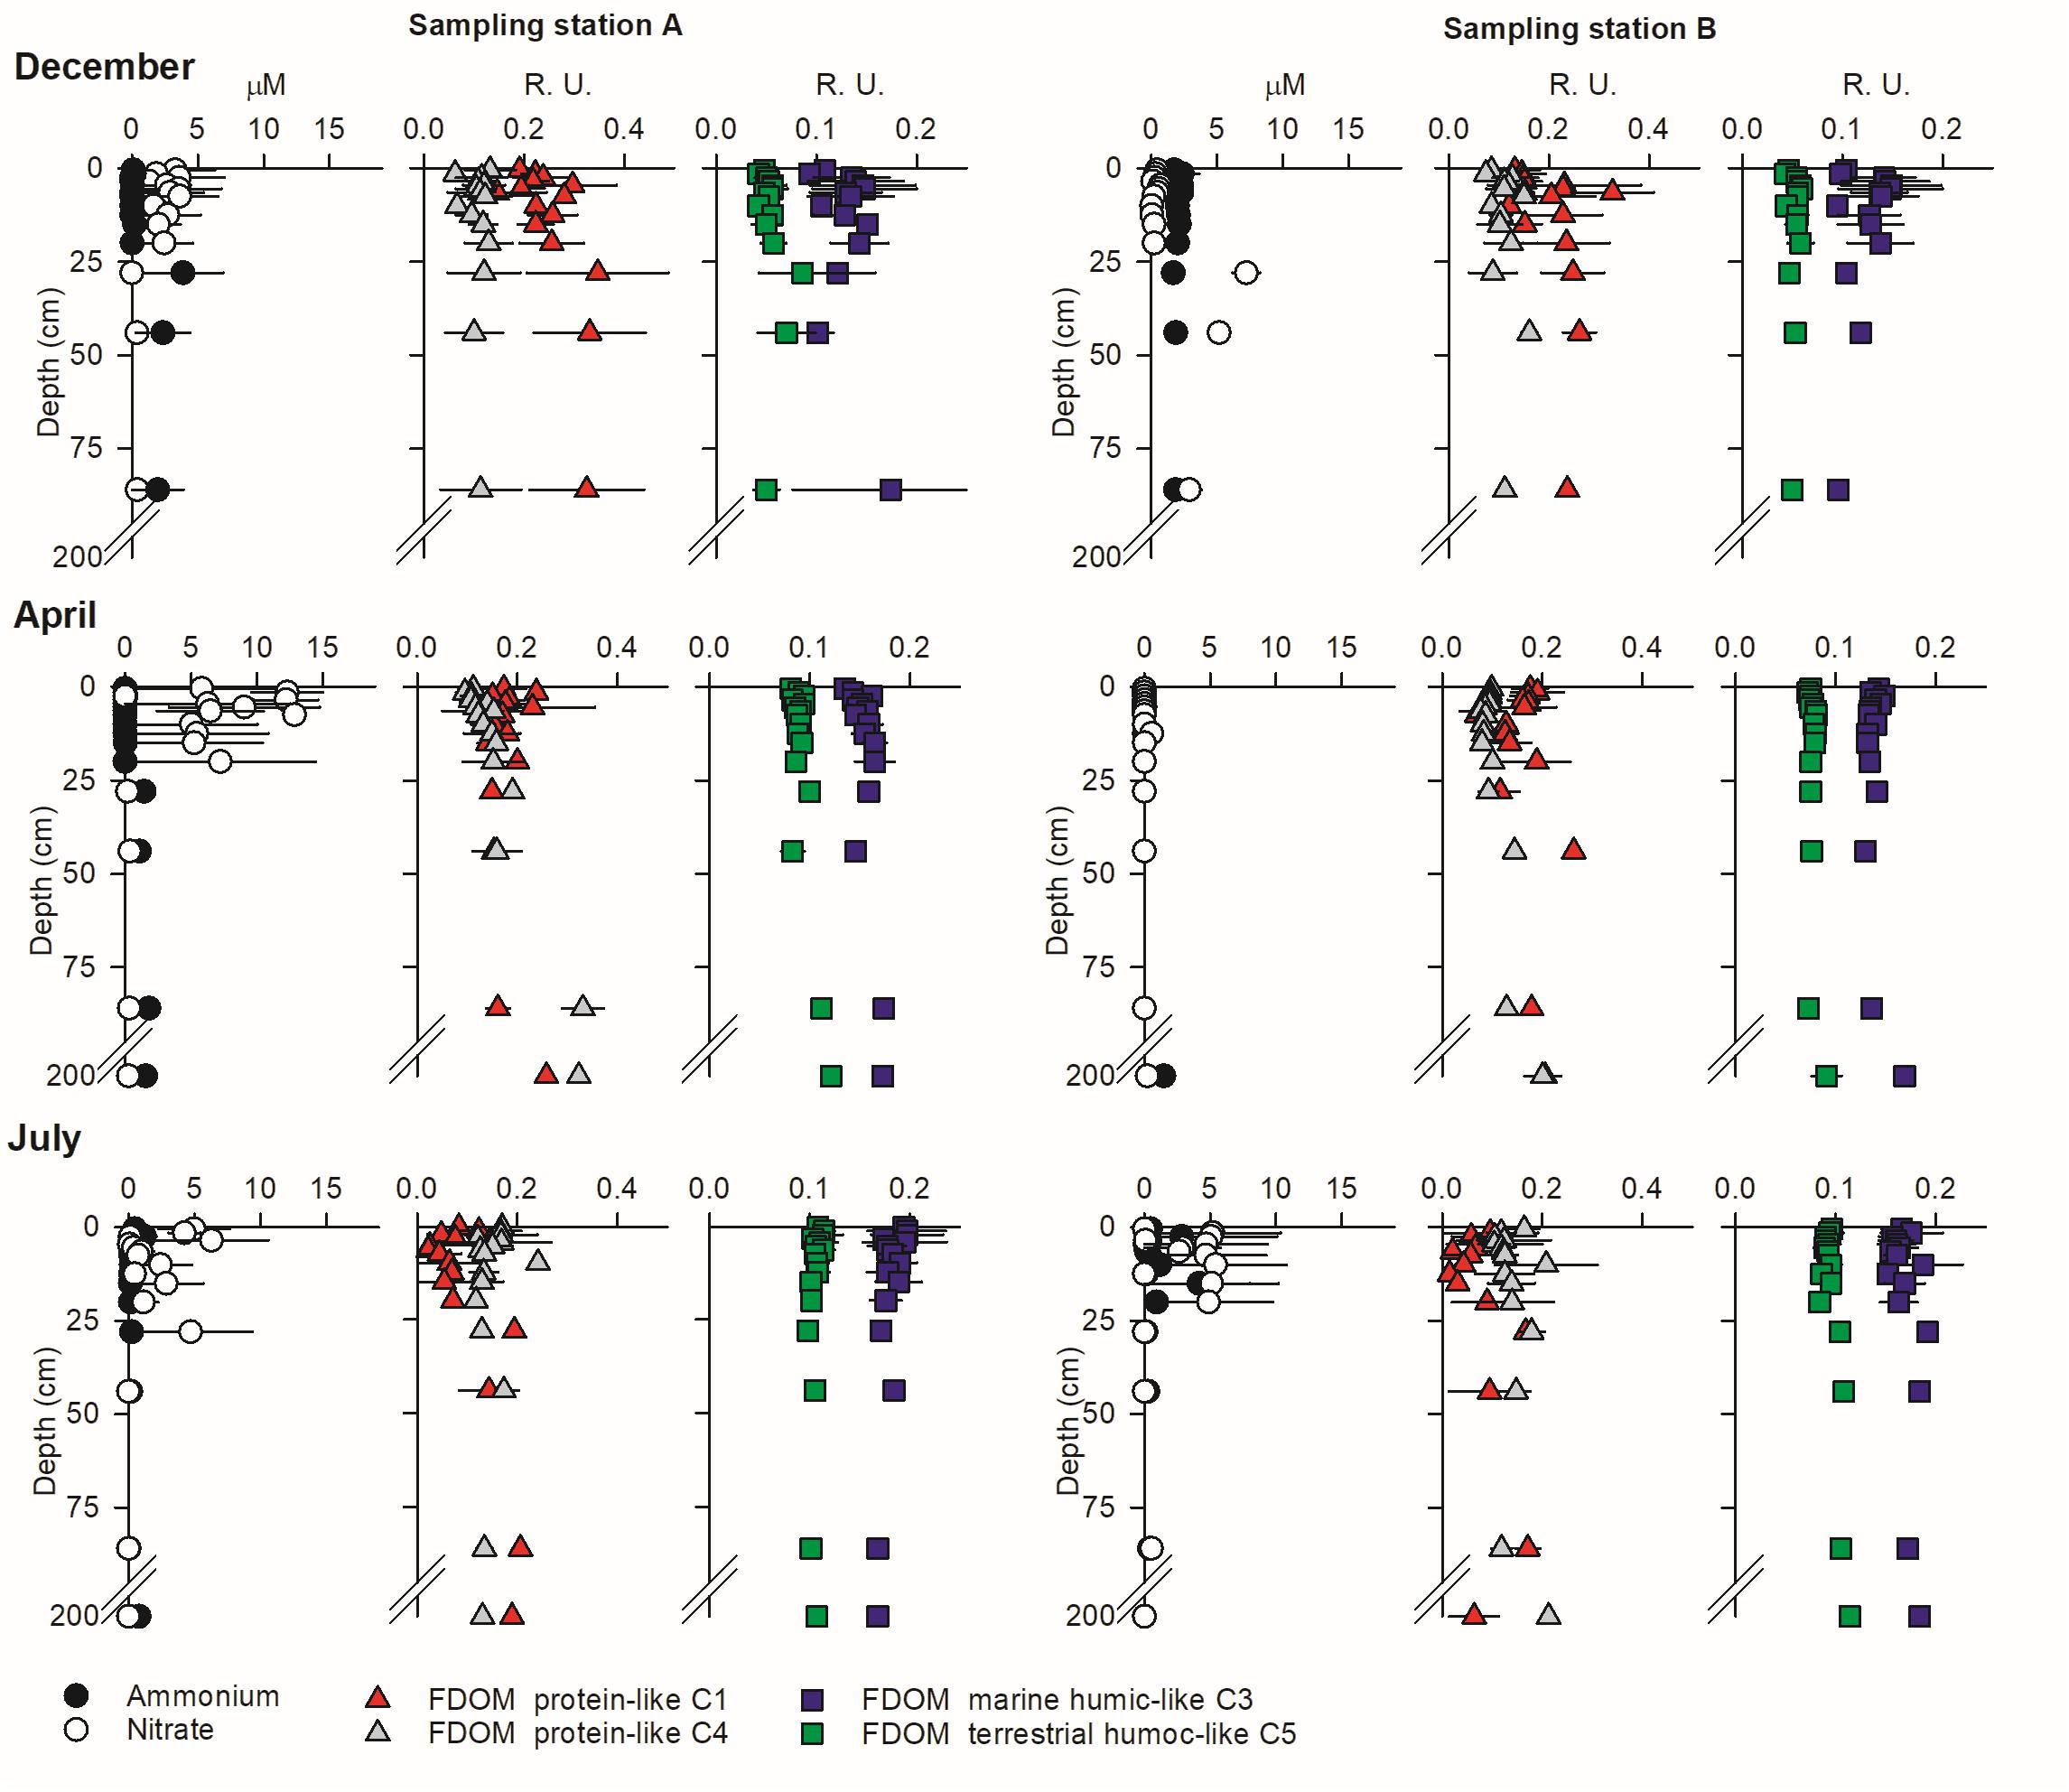
Figure 9. High-resolution vertical porewater profiles of NH4+, NO3–, and FDOM components during the peak of discharge in stations A and B during December 2009 and April and July 2010. Porewater profiles correspond to the average of those obtained during two consecutive tidal cycles with piezometers and porewater profilers.
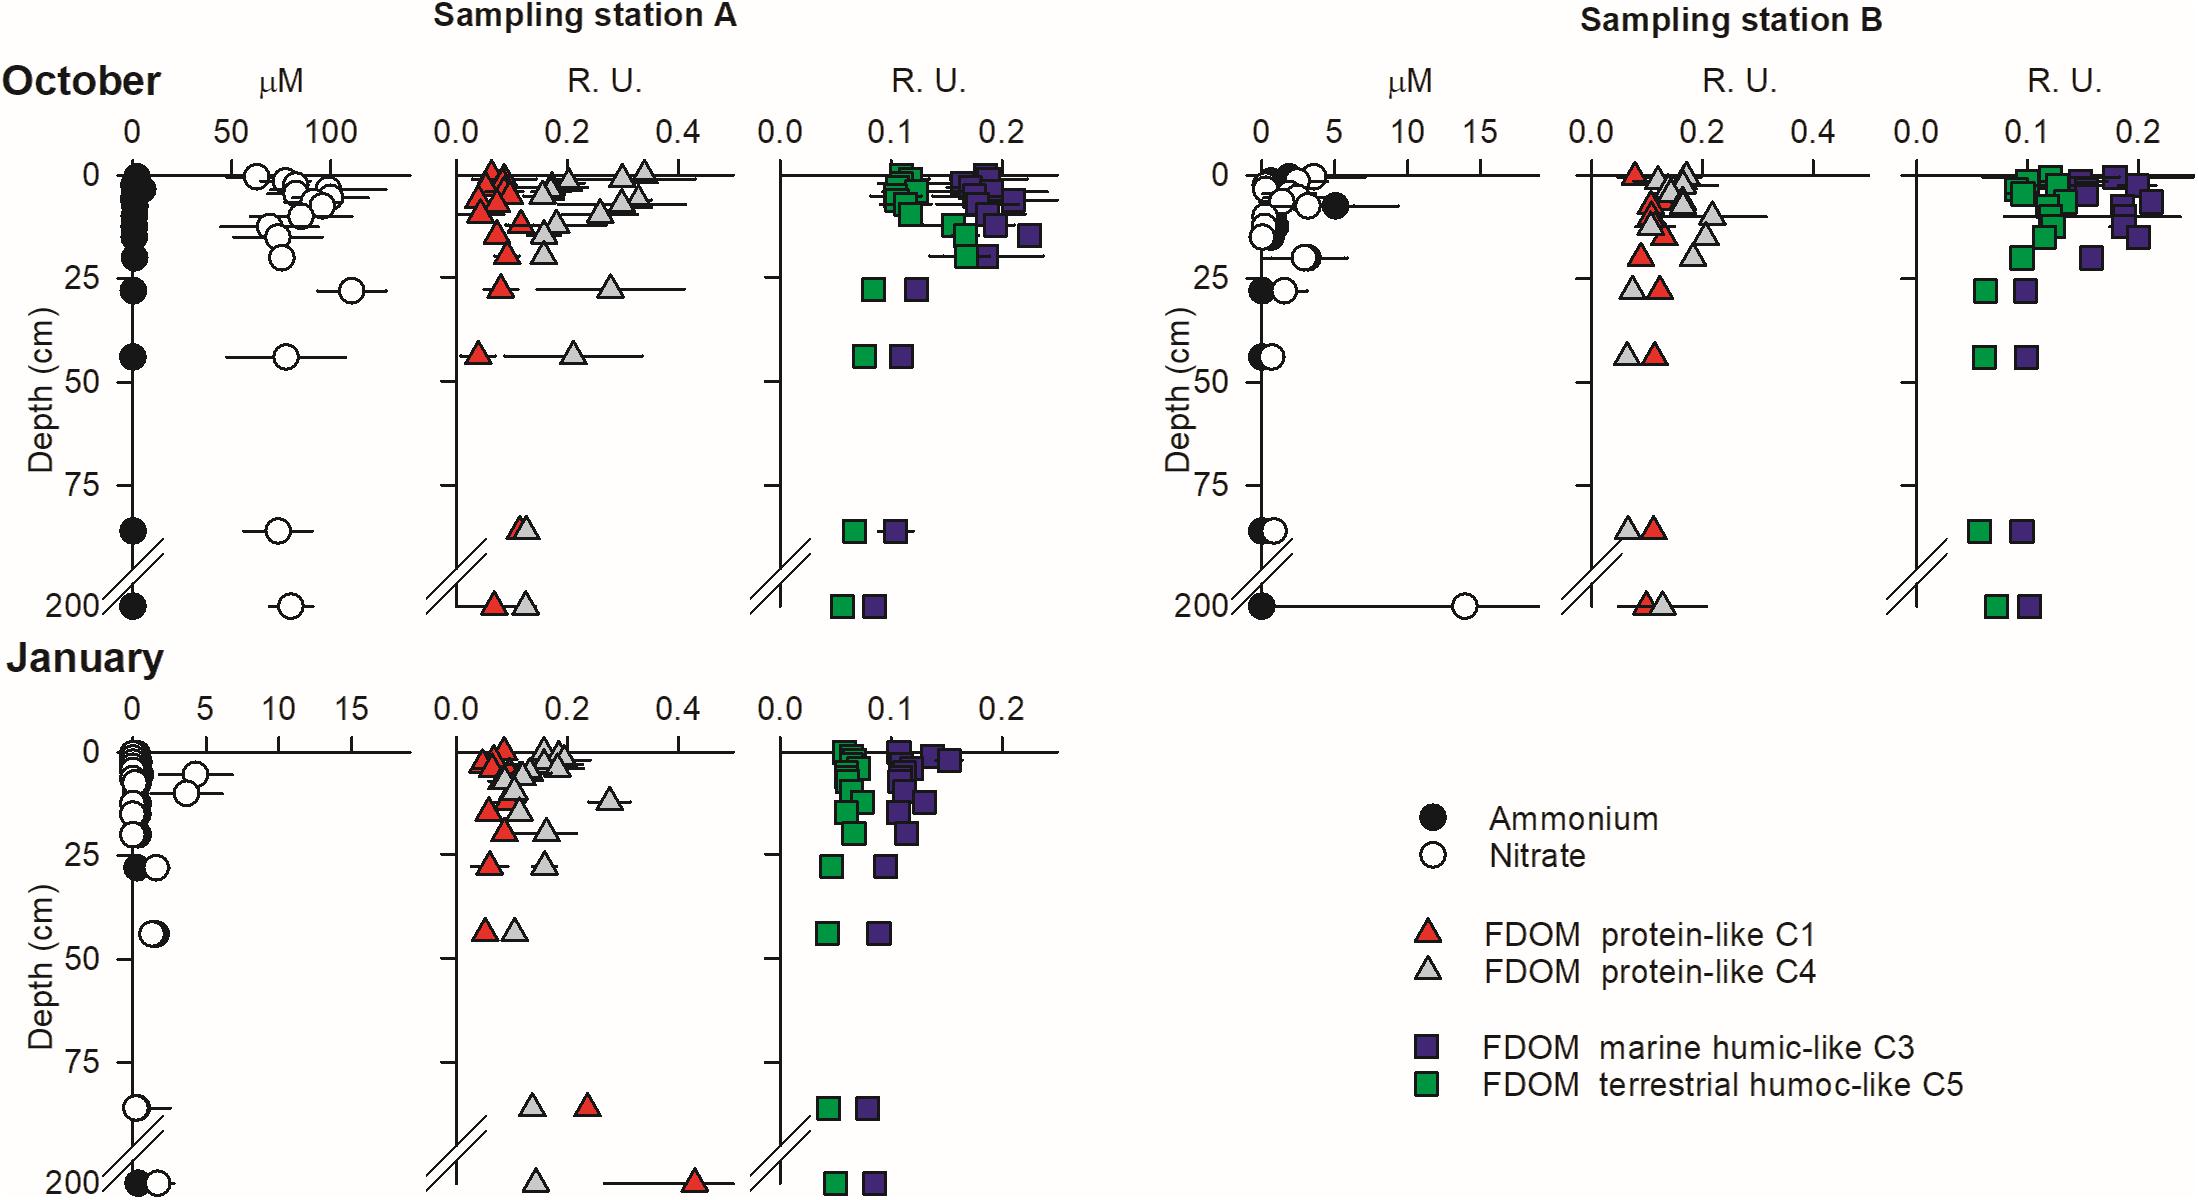
Figure 10. High-resolution vertical porewater profiles of NH4+, NO3–, and FDOM components during the peak of discharge in stations A and B during October 2010 and January 2011 (only station A). Porewater profiles correspond to the average of those obtained during two consecutive tidal cycles with piezometers and porewater profilers. Note the different scale used in the NO3– and NH4+ profiles.
Discussion
Technical Considerations
Lee-type seepage meters are affected by potential artifacts that influence seepage rate measurements (Shaw and Prepas, 1989). These effects are reduced at high seepage rates, as was the case for the study period (Cable et al., 1997; Leote et al., 2008). Nevertheless, seepage rate measurements reported here were validated with pressure measurements carried out in parallel, in two independent ways: using manual measurements of pore pressure employing the shallow screen piezometers installed every survey, and during April 2010, additional backing provided by continuous pressure measurements made with a ceramic 10M CTD Diver (Schlumberger Water Services, United States) buried at the seepage face for the duration of field sampling (Ibánhez and Rocha, 2016). Intercomparison of results confirmed the correct functioning of our Lee-type seepage meters during sediment exposure and the magnitude of the meter-derived seepage rates. During high tide however, the continuous pressure measurements obtained during April 2010 showed that surface water infiltration occurred within the permanently saturated zone (Ibánhez and Rocha, 2016). Infiltration rates cannot be monitored by Lee-type seepage meters due to their design. While this does not affect the credibility of measured seepage (outflow) rates, it raises concerns regarding the drivers of composition of seepage water collected by these instruments. During high tide, both the entrapped water and the volume of sediment enclosed by Lee-type seepage meters may have been subject to relatively limited ventilation. This would of course affect the solute composition of water collected during the first moments of seepage outflow as this water might be considered the efflux of pore and overlying water stagnating within the chamber for a few hours. Yet, under the prevalent seepage rates, the enclosed volume of water, calculated on the basis of the chamber dimensions (0.1 m2, 10 cm depth) and the local porosity (∼0.3), this potentially stagnant porewater would have been flushed out within less than 30 min of active seepage. Even if this effect is limited over the vast majority of data given the large period covered by the measurements during active seepage stages of the tidal cycle, it might explain the large enrichment in FDOM component C1 found in water samples collected at the beginning of these stages, particularly from December to July (Figure 6). The progressive decrease of abundance in FDOM component C1 with time during the active seepage stage shown for April 2010 (Figure 8) and the paucity of this FDOM component in porewater profiles collected with our profilers (Figure 10) support this interpretation. It follows that composition of seepage water collected with these meters at the very beginning of the outflow stage should be taken with caution when interpreting the overall results.
Compositional Change of SGD at the Sampling Site
Salinities lower than 35 were only measured in seepage water during April, in contrast with the monthly surveys performed during 2006–2007 at the same site where measurable fresh groundwater was always present, even if in small quantities during the summer months (Leote et al., 2008; Rocha et al., 2009). Salt budgets (Ibánhez and Rocha, 2016) revealed that fresh groundwater would only account for 2.7 ± 1.8% of the STE outflow at station A during April 2010, while negative salt balances prevailed in the other two stations, due essentially to the accumulation of salt in the unsaturated sediments over low tide (Geng et al., 2016). This drop in salinity during April 2010 is not associated with an influx of NO3– to the seepage face as observed during 2006–2007 at the same site, where nitrates and salinity were negatively correlated, suggesting that it might have originated from local rainfall rather than from the subsurface. Thus, SGD was essentially composed of recirculated seawater for this study period. Regardless, seepage rates were comparatively high in comparison to the 2006–2007 period when significant amounts of fresh groundwater were outflowing from the same site. The high hydraulic conductivity (10–3 cm s–1), beach slope (10%), and tidal amplitude (1.5–3 m) of the location allow the fast recirculation of seawater through the upper parts of the beach, forming the so-called tidal circulation cell (Robinson et al., 2007a, b) which contributes to sustain the high seepage rates in situ.
A sudden, more than threefold increase in SGD-derived NO3– fluxes to the lagoon compared to the other months is observed in October 2010. These large NO3– fluxes were restricted to sampling station A, where continental groundwater discharge was observed during the period 2005–2007 (Leote et al., 2008). Parallel increases in porewater NO3– were not observed in the water collected from the seepage meters installed in January 2011, although the presence of a NO3–-rich, brackish discharge tube is clearly observed in the beach interior. Beach sands can host large nitrification rates supported by the simultaneous supply of oxygen and organic matter into the beach interior (Schutte et al., 2018). Oxygen transport into our site is driven by the fast infiltration of surface seawater at the unsaturated upper intertidal, explaining the large benthic oxygenation (see Supplementary Material; Ibánhez and Rocha, 2016) and therefore could explain the porewater NO3– enrichment found during October and January. The substrate for benthic autotrophic nitrification, NH4+, remained low (generally <3 μM) in porewater (e.g., Figure 5). These sediments also have very low NH4+ adsorption capacity (Ibánhez and Rocha, 2017). Therefore, to support nitrification rates capable of explaining the observed NO3– concentrations, significant benthic organic matter mineralization is required. Two moles of O2 are needed for the production of one mole of NO3– during autotrophic nitrification, and these have to be added to the O2 consumption fueling aerobic organic matter mineralization. Porewater O2 levels measured during January in the three sampling stations and throughout the studied sediment column remained near saturation levels (>200 μM; see Supplementary Material) at all times, giving no indication of significant benthic O2 consumption that would support aerobic mineralization coupled to nitrification over the sampling timeframe. This observation supports our previous findings indicating strong organic matter limitation of aerobic respiration (Ibánhez and Rocha, 2016), and implies that the NO3– enrichment in porewater found during October and January is not driven by nitrification supported by aerobic respiration within the seepage face. It has to originate elsewhere and is transported toward the seepage face by porewater advection.
The first option is that nitrate originates in subsurface fresh groundwater of continental origin, as suggested by the strong linear correlation of porewater NO3– with salinity during both October and January (Figure 3) even if porewater salinity below 35 was only found in January. Furthermore, the NO3–-rich porewater discharge tube observed during these surveys was located in the same area affected by fresh continental groundwater during 2005–2007 (Rocha et al., 2009). These waters originated from the direct mixing of NO3–-polluted Campina de Faro aquifer system groundwaters and coastal seawater (Rocha et al., 2016). In 2005, a drastic drop in the piezometric head was observed in the coastal aquifer system surrounding Ria Formosa (Figure 11). The hydraulic gradient to the sea remained very low until the beginning of 2010, when a fast recovery began. This increase in the piezometric head in land during the study period, which reached values at the higher end of those registered for the period 2002–2011, is not immediately translated into higher continental freshwater influx at the site. This suggests that there is a time lag of months from the recovery (or drop during the 2006–2007 period) in the piezometric head inland and the increase (or decrease) of the contribution of continental groundwater to the overall SGD at the site. Alternatively, the water might be diverted or intercepted in transit, and recirculated via irrigation (Hugman et al., 2017) during the spring to fall period. The inland piezometric head further controls the position of the freshwater–seawater interface within the aquifer matrix (Michael et al., 2005; Robinson et al., 2006). Thus, during the prolonged drop in the piezometric head of the coastal aquifer, the freshwater–seawater is displaced inland and surface seawater intrudes de aquifer. There, seawater intrusion completely changes ionic strength (and hence desorption of solutes such as ammonium from the aquifer matrix), pH, DOM content, or oxygen levels within the aquifer and can significantly increase NO3– levels through processes such as DOM mineralization, nitrification, and matrix weathering (Slomp and Van Cappellen, 2004; Moore and Joye, 2021; Wan et al., 2021). With the recovery of the piezometric head, this salty groundwater will be displaced toward the seepage face. The displacement of the freshwater–seawater interface and the discharge of the intruded seawater can explain the delay observed between piezometric head recovery and the identification of a fresh groundwater signal at the seepage face but also, can add to the NO3– levels observed during October and January. If we take DIN content within the seepage face as a reference however, our data can be separated into two highly distinctive sets: one from December 2009 until July 2010 where porewater in the seepage face is largely dominated by recirculated seawater with low DIN content, and another from October 2010 to January 2011 where the arrival of continental groundwater largely impacted DIN content inside the seepage face.
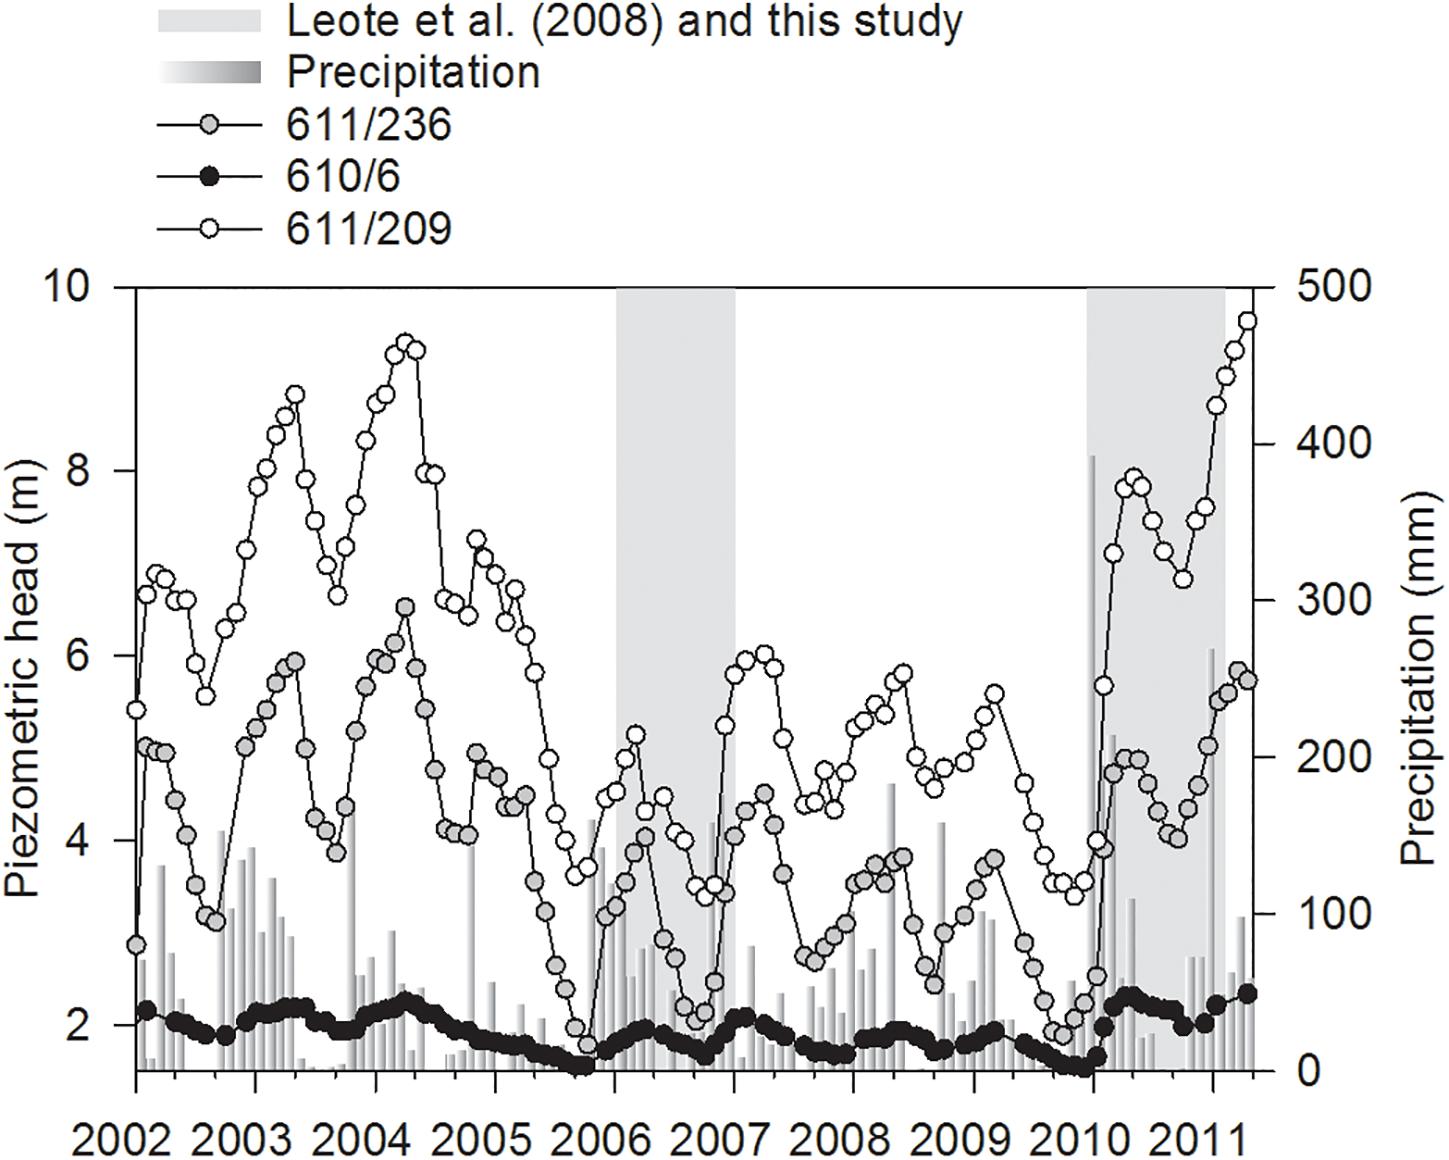
Figure 11. Monthly precipitation as recorded in the meteorological station placed in the airport of Faro (37.02°N, 7.97°W) and piezometric head recorded in the 610/6 (37.02°N, 7.97°W), 611/236 (37.03°N, 7.94°W), and 611/209 (37.05°N, 7.95°W) monitoring wells of the Sistema Nacional de Informação de Recursos Hídricos (SNIRH; Portugal; https://snirh.apambiente.pt) from January 2002 until March 2011. Gray areas denote the temporal coverage of surveys presented in Leote et al. (2008) and in this study.
FDOM as a Proxy of Organic Matter Transport and Reactivity at the Seepage Face
In combination with PARAFAC modeling, FDOM permits to disentangle the cycling of specific fractions of the DOM pool. Compared to the traditional pick-picking technique for identification of FDOM components (e.g., Coble, 1996), PARAFAC allows the fluorescence signals of each fluorophore to be separated, thus avoiding signal overlapping and the ensuing overestimation of fluorophore abundances in concentrated samples (Andersen and Bro, 2003; Stedmon and Bro, 2008). Furthermore, the unique solution produced by PARAFAC modeling of an FDOM dataset allows quantification of the relative abundance of each fluorophore, which is directly proportional to the concentrations of the individual components in the samples (Andersen and Bro, 2003; Murphy et al., 2013).
Previous studies have used FDOM humic-like components identified through PARAFAC analysis to quantify the transport of terrestrial DOM to the coast through SGD (Nelson et al., 2015; Kim and Kim, 2017; Cho et al., 2021). In our site, the relative abundances of FDOM humic-like components C3 and C5 were significantly correlated in water seeping out from stations A and B (Figure 4), suggesting that the relative abundances of C3 and C5 expressed as a ratio (FDOM C3/C5) could be a reliable tracer of SGD in the Ria Formosa lagoon. Nevertheless, inside the seepage face, the FDOM C3/C5 abundance ratio showed high spatial and temporal variability (Figures 6, 8). During December 2009, at the lowest piezometric level observed inland for this study (Figure 11), the FDOM C3/C5 ratio was the highest of the series. A progressive enrichment in FDOM terrestrial humic-like component C5 relative to component C3 is observed afterward, except for July, in coincidence with the seasonal fall of the hydraulic gradient in the coastal aquifer during the summer. During October and January, the lowest C3/C5 ratios (i.e., higher relative contribution of the FDOM terrestrial humic-like component C5) are strongly associated with the NO3–-rich porewater discharge tube identified (Figures 5, 6), further suggesting the inland origin of the observed porewater NO3– enrichment during these last two surveys.
The microbial degradation of both particulate and dissolved organic matter produces humic-like FDOM compounds (Ogawa et al., 2001). Despite the presumable terrestrial origin of FDOM component C5, this humic-like fluorophore was actively produced during October and January near the sediment surface (Figure 10). Suryaputra et al. (2015) observed the production of this FDOM component in a microtidal STE associated to marine organic matter degradation. Furthermore, Romera-Castillo et al. (2010, 2011) suggested that humic-like FDOM component C3 is produced by eukaryotes, whereas C5 is produced by prokaryotes that are also able to use FDOM component C3 to produce C5. The blue shift of C5 compared to C3 suggests comparatively higher aromaticity (Coble et al., 1998; Stubbins et al., 2014). Thus, C5 is assumed to have higher resistance to microbial degradation but also that it is produced from more refractory organic matter compared to C3. Its persistence in the environment allows its use to fingerprint water masses with different origins in complex coastal ecosystems (Ibánhez et al., 2019). Combined, humic-like FDOM components C3 and C5 can be linked to the microbial processing of different organic matter fractions.
Protein-like FDOM components are linked to the amino acid content of aquatic ecosystems (Yamashita and Tanoue, 2003; Stubbins et al., 2014). Peptides and both intra and extracellular proteins contribute to the protein-like FDOM pool (Fox et al., 2017). In this study, samples were filtered with Rhizon SMS with a pore size of 0.1 μm, and thus, protein-like FDOM components C1 and C4 can confidently be attributed to the extracellular amino acid content in water samples. Both FDOM components are therefore labile and can feed heterotrophic microbial processes (Stubbins et al., 2014) but also their active production is a reliable proxy of microbial activity (Fox et al., 2017). This is consistent with the highly variable distribution of FDOM components C1 and C4 within the seepage face and the observation of both apparent production and consumption patterns (Figures 9, 10).
DIN and FDOM Reactivity Within the Seepage Face
Large spatial solute gradients were observed inside the seepage face (Figures 5, 6) that remained stable throughout the period of sediment exposure (Figures 6, 7). Particularly notable are the unstable salinity gradients observed, for instance, in the deepest piezometers of April and in stations C and B in January, that remained in place throughout the period of sediment exposure (Figure 6). Vertical density instabilities promote convective turnover and mixing (Rocha, 2000) and thus are not stable over time. Therefore, these unstable density gradients that persist over time must be continuously feed by the complex 3-D transport pathways present inside the beach. Nevertheless, near the sediment–water interface, the magnitude of the measured seepage rates and their validation with pressure measurements that assume vertical porewater transport (Ibánhez and Rocha, 2016), confirm that there, porewater transport is largely dominated by the vertical component.
Using the measured seepage rates during the peak of the discharge and assuming stationary state and vertical seepage (Rocha et al., 2009; Ibánhez and Rocha, 2016), we calculated solute reaction rates from the averaged, high-resolution porewater profiles from the seepage face. To ensure that vertical seepage dominates the sediment horizon studied, solute mass balances were performed with the data from the top 44 cm of sediment. Homogeneous vertical salinity is verified in the selected sediment column throughout the studied period and thus, solute gradients are confidently assigned to the local reactivity (see Supplementary Material), calculated as follows:
where △C is the change of the target solute verified between 44 cm depth and the sample closest to the sediment surface, q is the Darcy velocity, and d is the length of the studied sediment column (44 cm).
The two different periods identified based on the presence or absence of measurable NO3– at the seepage face presented contrasting reactivity (Table 1). From December to July, NO3– production dominated, while the highest NO3– reduction rates are obtained in station A in October, coinciding with the NO3– enrichment in the sediment column. These nitrification and NO3– reduction rates are at the low end of those determined through diagenetic modeling of in situ porewater profiles (Ibánhez et al., 2013) and with flow-through reactor experiments (Ibánhez and Rocha, 2017) at the same site. FDOM protein-like components C1 and C4 showed variable reactivity, with a tendency toward net consumption during the first period sampled and a net production of both components during the second one. Nevertheless, the reactivity of the humic-like FDOM components showed the clearest seasonal pattern. While during the first three surveys humic-like FDOM components remained almost vertically unchanged denoted by the low reaction rates obtained, these were actively produced at high rates coinciding with the observed porewater NO3– enrichment at the seepage face. Overall, while during the initial period (December 2009 to July 2010) the seepage face generally acted as a sink of FDOM, during October 2010 and January 2011 net production of the four FDOM components was generally obtained.
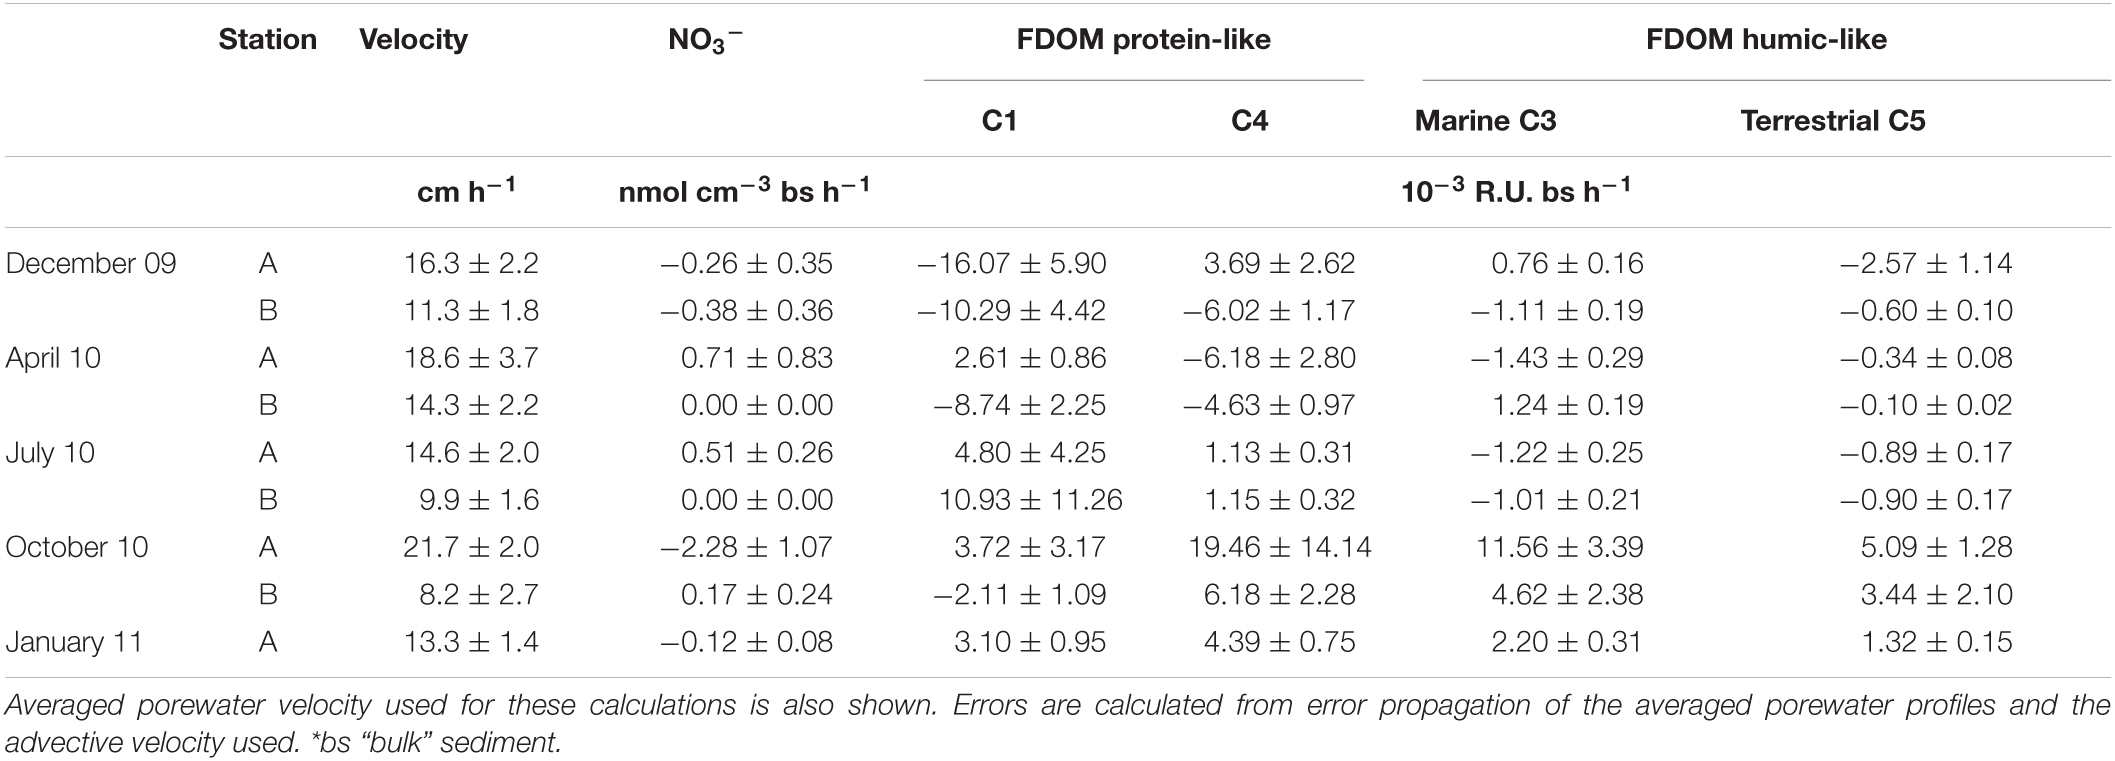
Table 1. NO3– and FDOM reaction rates calculated through mass balances of solute distribution in the top 44 cm of sediment in the seepage face, organized by survey and sampling station.
DIN Impact Over C Storage and Processing Capacity in the STE
In intertidal sands, pelagic POM transported by seawater infiltration during high tide is trapped near the infiltration surface (de Beer et al., 2005; Rocha, 2008; Jiang et al., 2020). Thus, while solutes such as oxygen or DOC can penetrate the beach interior, POM accumulates in the surface sediments. This was clearly observed at our sampling site during the studied period, where POM content peaked at the sediment surface and decayed with depth (Ibánhez and Rocha, 2014a, 2016). Aerobic respiration and NO3– reduction processes at the studied site are limited by organic C availability, showing strong limitation at depths exceeding 30–40 cm (Ibánhez et al., 2013; Ibánhez and Rocha, 2016). Similarly, intense FDOM reactivity seems to be mainly restricted to the top 30–40 cm of sediment, where FDOM components changed abundance by up to 90% (Figure 10).
FDOM component C5 was never actively produced from December 2009 to July 2010 (Table 1). This contrasts with the high rates of production of both humic-like FDOM components during October 2010 and January 2011, suggesting an enhanced C processing within the seepage face during this period, including both fresh and older organic matter. This period also showed the highest protein-like FDOM production rates, except for C1 in station B in October, suggesting an enhancement of microbial activity during October and January. Furthermore, the concomitant production of both protein-like and humic-like FDOM suggests that they are primary originated from POM processing rather than from DOC. This is supported by the location of the FDOM production zone, tightly coupled with the distribution of infiltrated pelagic POM that accumulates in the top sediment column of the studied site (Ibánhez and Rocha, 2016). Similar spatial patterns of FDOM reactivity were identified in an STE from Sanggou Bay (China) that receives significant land-derived NO3– loads (Jiang et al., 2020). There, the concomitant production of protein-like, humic-like FDOM and DOC under chronic porewater NO3– enrichment is observed in the sediment depths where POM is accumulated.
Mechanisms Underlying NO3–-Driven Organic C Processing Enhancement in the STE
Our results are in high agreement with those presented in Ibánhez and Rocha (2014a). There, a series of flow-through reactor experiments were run with intact sediment columns from the top 12 cm and porewater collected at the study site during October 2010 and January 2011. Under a purely advective regime (15.1 ± 0.2 to 18.8 ± 0.1 cm h–1; Ibánhez and Rocha, 2014a), similar to that found in the field (Table 1), the surface sediment metabolism is C-limited and an overall DOC and FDOM sink. Nevertheless, when the circulating porewater is spiked with NO3– (>100 μM final concentration), the sediment became a source of DOC, protein-like FDOM, and both humic-like FDOM components identified here, both under oxic (>220 μM O2) and suboxic conditions (<90 μM O2). The sudden availability of N stimulates microbial metabolism and its ability to process particulate refractory organic matter, thus mobilizing the stored POM pool. In our field surveys, active FDOM production is mainly restricted to the last two surveys where NO3– enrichment is observed within the seepage face. The highest rates of FDOM production are observed in station A during October, directly impacted by this enrichment in NO3–. In station B during October and station A during January, this NO3– enrichment is not observed at the peak of the discharge. Nevertheless, the lateral displacement of the NO3–enriched porewater discharge tube caused by tidal oscillation and mixing during active surface water infiltration during high tide could spread this NO3– enrichment within the seepage face, thus promoting the observed enhanced POM processing.
NO3– is a powerful oxidant that is used as electron acceptor by different microbial organisms (e.g., Kuypers et al., 2018). In the benthic redox cascade, i.e., the sequential use of electron acceptors by the microbial community based on favorable energy yields, NO3– is the most energetically efficient electron acceptor after O2. Under anoxic conditions, the sudden availability of NO3– would feed heterotrophic processes such as heterotrophic denitrification that could promote the observed enhancement of organic C processing at the seepage face. Nevertheless, the sampled beach interior was well oxygenated during the surveyed period and thus, benthic aerobic respiration would not be limited by O2 availability (see Supplementary Material; Ibánhez and Rocha, 2016). NO3– reduction under bulk benthic oxic conditions was observed at our site (Ibánhez and Rocha, 2017), and net NO3– reduction rates were obtained in the mass balances performed here (Table 1). Although aerobic denitrification was reported in permeable marine sediments (Marchant et al., 2017), NO3– reduction rates at our site increase when lowering the amount of O2 in the circulating porewater, suggesting the presence of anoxic microniches within the sediment pore structure that would sustain NO3– reduction rates under bulk aerobic conditions (Ibánhez and Rocha, 2017). In the FTR experiments performed in parallel to the surveys presented here (Ibánhez and Rocha, 2014a), the concomitant benthic production of both humic-like and protein-like FDOM components under NO3– spiked porewater was similar under both oxic and suboxic conditions. There, a significant increase of the benthic production of humic-like and protein-like FDOM was verified after further adding NH4+ to the circulating porewater. These results suggest that, adding to the observed organic C limitation, the local microbial metabolism is also N-limited. With excess electron acceptors in place at the seepage face, porewater N enrichment promotes a priming effect over organic matter mineralization by overcoming stoichiometric constraints of microbial metabolism (Guenet et al., 2010), thus accelerating organic C turnover within the seepage face as observed in other N-deficient systems (e.g., Mack et al., 2004; Bragazza et al., 2006; Chen et al., 2020).
Conclusion
The large heterotrophic capacity of permeable coastal sands prevents the accumulation of labile organic matter in the sediment, driving these environments to C limitation. Together with previous research at the same site, our results also indicate that heterotrophic processes are N-limited at the seepage face. Because the progressive recovery of the inland piezometric head observed during the study period resulted in the gradual increase of NO3– availability at the seepage face, organic C processing there was completely changed. Sudden N transport to the seepage face appeared to catalyse POM processing, thus reducing C storage. The resulting organic metabolites are then rapidly transported to surface waters where they become exposed to photolysis and pelagic mineralization. Overall, additional N supplied by the subterranean estuary appears to accelerate particulate organic C turnover within the system. Despite the low standing stocks of POM of these benthic environments, their large volume suggests that this mechanism may have a significant impact on the reactive resilience of the coastal C pool. Validation of these findings by elucidating the role of N supplementation on local microbial and enzymatic activity and generalization of the observations supporting this priming effect to other STEs is yet to occur.
Data Availability Statement
The raw data supporting the conclusions of this article will be made available by the authors, without undue reservation.
Author Contributions
JI and CR conceived the study. JI participated in the field and laboratory work and data analysis and elaborated the first draft of the manuscript, which was enriched by contributions of XÁ-S and CR. All authors revised and approved the manuscript.
Funding
Data collection and sample analysis were funded by the Portuguese Foundation for Science and Technology (FCT), the EU (FEDER), and the Portuguese Government through grant contract SFRH/BD/39170/2007 and project NITROLINKS [NITROgen loading into the Ria Formosa through Coastal Groundwater Discharge (CGD) – Pathways, turnover, and LINKS between land and sea in the Coastal Zone, PTDC/MAR/70247/2006]. Data analysis and manuscript preparation were funded by project SUBACID [SUBmarine Groundwater Discharge (SGD) impact on coastal ACIDification processes in contrasting European Atlantic Shores: toward securing ecosystem services and food production], funded by the Irish Research Council and the European Union’s Horizon 2020 Research and Innovation Program under the Marie Skłodowska-Curie grant agreement no. 713279 through the CAROLINE program (CLNE/2017/210).
Conflict of Interest
The authors declare that the research was conducted in the absence of any commercial or financial relationships that could be construed as a potential conflict of interest.
Acknowledgments
The authors are thankful to Inês Alves and Liliana Carbalho (University of Algarve, Portugal) for field support during the December 2009 and April, July, and October 2010 fieldwork surveys and to Mark Kavanagh (Trinity College Dublin, Ireland) for laboratory support. The authors also appreciate the comments made by two reviewers that helped to improve an early version of this manuscript.
Supplementary Material
The Supplementary Material for this article can be found online at: https://www.frontiersin.org/articles/10.3389/fmars.2021.661201/full#supplementary-material
Footnotes
- ^ https://openfluor.lablicate.com; last access 22/12/2020.
References
Andersen, C. M., and Bro, R. (2003). Practical aspects of PARAFAC modeling of fluorescence excitation-emission data. J. Chemometr. 17, 200–215. doi: 10.1002/cem.790
Bauer, J. E., Cai, W.-J., Raymond, P. A., Bianchi, T. S., Hopkinson, C. S., and Regnier, P. A. G. (2013). The changing carbon cycle of the coastal ocean. Nature 504, 61–70. doi: 10.1038/nature12857
Boyer, E. W., Howarth, R. W., Galloway, J. N., Dentener, F. J., Green, P. A., and Vörösmarty, C. J. (2006). Riverine nitrogen export from the continents to the coasts. Glob. Biogeochem. Cycles 20:GB1S91. doi: 10.1029/2005GB002537
Bragazza, L., Freeman, C., Jones, T., Rydin, H., Limpens, J., Fenner, N., et al. (2006). Atmospheric nitrogen deposition promotes carbon loss from peat bogs. Proc. Natl. Acad. Sci. U.S.A. 103, 19386–19389. doi: 10.1073/pnas.0606629104
Burnett, W. C., Aggarwal, P. K., Aureli, A., Bokuniewicz, H., Cable, J. E., Charette, M. A., et al. (2006). Quantifying submarine groundwater discharge in the coastal zone via multiple methods. Sci. Total Environ. 367, 498–543. doi: 10.1016/j.scitotenv.2006.05.009
Burnett, W. C., Bokuniewicz, H., Huettel, M., Moore, W. S., and Taniguchi, M. (2003). Groundwater and pore water inputs to the coastal zone. Biogeochemistry 66, 3–33. doi: 10.1023/B:BIOG.0000006066.21240.53
Cable, J. E., Burnett, W. C., and Chanton, J. P. (1997). Magnitude and variations of groundwater seepage along a Florida Marine Shoreline. Biogeochemistry 38, 189–205. doi: 10.2307/1469004
Calvo-Martin, E., Álvarez-Salgado, X. A., Rocha, C., and Ibánhez, J. S. P. (2021). Reactive solute transport through two contrasting subterranean estuary exit sites in the Ría de Vigo (NW Iberian Peninsula). Front. Mar. Sci. 8:626813. doi: 10.3389/fmars.2021.626813
Chen, Q., Yuan, Y., Hu, Y., Wang, J., Si, G., Xu, R., et al. (2020). Excessive nitrogen addition accelerates N assimilation and P utilization by enhancing organic carbon decomposition in a Tibetan alpine steppe. Sci. Total Environ. 764:142848. doi: 10.1016/j.scitotenv.2020.142848
Cho, H.-M., Kim, G., Kwon, E. Y., Moosdorf, N., Garcia-Orellana, J., and Santos, I. R. (2018). Radium tracing nutrient inputs through submarine groundwater discharge in the global ocean. Sci. Rep. 8:2439. doi: 10.1038/s41598-018-20806-2
Cho, H.-M., Kim, T.-H., Moon, J.-H., Song, B.-C., Hwang, D.-W., Kim, T., et al. (2021). Estimating submarine groundwater discharge in Jeju volcanic island (Korea) during a typhoon (Kong-rey) using humic-fluorescent dissolved organic matter-Si mass balance. Sci. Rep. 11:941. doi: 10.1038/s41598-020-79381-0
Coble, P. G. (1996). Characterization of marine and terrestrial DOM in seawater using excitation-emission matrix spectroscopy. Mar. Chem. 51, 325–346. doi: 10.1016/0304-4203(95)00062-3
Coble, P. G., Del Castillo, C. E., and Avril, B. (1998). Distribution and optical properties of CDOM in the Arabian Sea during the 1995 Southwest Monsoon. Deep Sea Res. 2 Top. Stud. Oceanogr. 45, 2195– 2223.
Couturier, M., Tommi-Morin, G., Sirois, M., Rao, A., Nozais, C., and Chaillou, G. (2017). Nitrogen transformations along a shallow subterranean estuary. Biogeosciences 14, 3321–3336. doi: 10.5194/bg-14-3321-2017
de Beer, D., Wenzhöfer, F., Ferdelman, T. G., Boeme, S. E., Huettel, M., Beusekom, J. E. E., et al. (2005). Transport and Mineralization Rates in North Sea Sandy Intertidal Sediments, Sylt-Rømø Basin, Wadden Sea. Available online at: http://hdl.handle.net/10013/epic.21375 (accessed December 25, 2008)
Erisman, J. W., Sutton, M. A., Galloway, J., Klimont, Z., and Winiwarter, W. (2008). How a century of ammonia synthesis changed the world. Nat. Geosci. 1, 636–639. doi: 10.1038/ngeo325
Erler, D. V., Santos, I. R., Zhang, Y., Tait, D. R., Befus, K. M., Hidden, A., et al. (2014). Nitrogen transformations within a tropical subterranean estuary. Mar. Chem. 164, 38–47. doi: 10.1016/j.marchem.2014.05.008
Fox, B. G., Thorn, R. M. S., Anesio, A. M., and Reynolds, D. M. (2017). The in situ bacterial production of fluorescent organic matter; an investigation at a species level. Water Res. 125, 350–359. doi: 10.1016/j.watres.2017.08.040
Galloway, J. N., Townsend, A. R., Erisman, J. W., Bekunda, M., Cai, Z., Freney, J. R., et al. (2008). Transformation of the nitrogen cycle: recent trends, questions, and potential solutions. Science 320, 889–892. doi: 10.1126/science.1136674
Geng, X., Boufadel, M. C., and Jackson, N. L. (2016). Evidence of salt accumulation in beach intertidal zone due to evaporation. Sci. Rep. 6:31486. doi: 10.1038/srep31486
Grasshoff, K., Ehrhardt, M., and Kremling, K. (1983). Methods of Seawater Analysis, 2nd Edn. Weinheim: Verlag Chemie.
Gruber, N., and Galloway, J. N. (2008). An Earth-system perspective of the global nitrogen cycle. Nature 451, 293–296. doi: 10.1038/nature06592
Guenet, B., Danger, M., Abbadie, L., and Lacroix, G. (2010). Priming effect: bridging the gap between terrestrial and aquatic ecology. Ecology 91, 2850–2861. doi: 10.1890/09-1968.1
Hartog, N., van Bergen, P. F., de Leeuw, J. W., and Griffioen, J. (2004). Reactivity of organic matter in aquifer sediments: geological and geochemical controls. Geochim. Cosmochim. Acta 68, 1281–1292. doi: 10.1016/j.gca.2003.09.004
Hugman, R., Stigter, T., Costa, L., and Monteiro, J. P. (2017). Modeling nitrate-contaminated groundwater discharge to the ria formosa coastal lagoon (Algarve, Portugal). Proc. Earth Planet. Sci. 17, 650–653. doi: 10.1016/j.proeps.2016.12.174
Ibánhez, J. S. P., Arévalo, E., Kelly, T., Papaspyrou, S., Rocha, C., and Nicolaidou, A. (2019). Unraveling the dispersion and environmental impact of anthropogenic discharges in transitional water ecosystems. Estuar. Coast. Shelf Sci. 216, 204–217. doi: 10.1016/j.ecss.2017.11.028
Ibánhez, J. S. P., Leote, C., and Rocha, C. (2011). Porewater nitrate profiles in sandy sediments hosting submarine groundwater discharge described by an advection–dispersion-reaction model. Biogeochemistry 103, 159–180. doi: 10.1007/s10533-010-9454-1
Ibánhez, J. S. P., Leote, C., and Rocha, C. (2013). Seasonal enhancement of submarine groundwater discharge (SGD)-derived nitrate loading into the Ria Formosa coastal lagoon assessed by 1-D modeling of benthic NO3- profiles. Estuar. Coast. Shelf Sci. 132, 56–64. doi: 10.1016/j.ecss.2012.04.015
Ibánhez, J. S. P., and Rocha, C. (2014a). Effects of recirculation of seawater enriched in inorganic nitrogen on dissolved organic carbon processing in sandy seepage face sediments. Mar. Chem. 166, 48–58. doi: 10.1016/j.marchem.2014.09.012
Ibánhez, J. S. P., and Rocha, C. (2014b). Porewater sampling for NH 4 + with rhizon soil moisture samplers (SMS): potential artifacts induced by NH 4 + sorption. Freshw. Sci. 33, 1195–1203. doi: 10.1086/678483
Ibánhez, J. S. P., and Rocha, C. (2016). Oxygen transport and reactivity within a sandy seepage face in a mesotidal lagoon (Ria Formosa, Southwestern Iberia). Limnol. Oceanogr. 61, 61–77. doi: 10.1002/lno.10199
Ibánhez, J. S. P., and Rocha, C. (2017). Kinetics of inorganic nitrogen turnover in a sandy seepage face on a subterranean estuary. Appl. Geochem. 87, 108–121. doi: 10.1016/j.apgeochem.2017.10.015
Jiang, S., Zhang, Y., Jin, J., Wu, Y., Wei, Y., Wang, X., et al. (2020). Organic carbon in a seepage face of a subterranean estuary: turnover and microbial interrelations. Sci. Total Environ. 725:138220. doi: 10.1016/j.scitotenv.2020.138220
Johannes, R. E. (1980). The ecological significance of the submarine discharge of groundwater. Mar. Ecol. Prog. Ser. 3, 365–373. doi: 10.3354/meps003365
Kim, J., and Kim, G. (2017). Inputs of humic fluorescent dissolved organic matter via submarine groundwater discharge to coastal waters off a volcanic island (Jeju, Korea). Sci. Rep. 7:7921. doi: 10.1038/s41598-017-08518-5
Kothawala, D. N., Murphy, K. R., Stedmon, C. A., Weyhenmeyer, G. A., and Tranvik, L. J. (2013). Inner filter correction of dissolved organic matter fluorescence. Limnol. Oceanogr. Methods 11, 616–630. doi: 10.4319/lom.2013.11.616
Kroeger, K. D., and Charette, M. A. (2008). Nitrogen biogeochemistry of submarine groundwater discharge. Limnol. Oceanogr. 53, 1025–1039. doi: 10.4319/lo.2008.53.3.1025
Kuypers, M. M. M., Marchant, H. K., and Kartal, B. (2018). The microbial nitrogen-cycling network. Nat. Rev. Microbiol. 16, 263–276. doi: 10.1038/nrmicro.2018.9
Kwon, E. Y., Kim, G., Primeau, F., Moore, W. S., Cho, H.-M., DeVries, T., et al. (2014). Global estimate of submarine groundwater discharge based on an observationally constrained radium isotope model. Geophys. Res. Lett. 41, 8438–8444. doi: 10.1002/2014GL061574
Lawaetz, A. J., and Stedmon, C. A. (2009). Fluorescence intensity calibration using the Raman scatter peak of water. Appl. Spectrosc. 63, 936–940. doi: 10.1366/000370209788964548
Lee, D. R. (1977). A device for measuring seepage flux in lakes and estuaries. Limnol. Oceanogr. 22, 140–147. doi: 10.4319/lo.1977.22.1.0140
Leote, C., Ibánhez, J., and Rocha, C. (2008). Submarine groundwater discharge as a nitrogen source to the Ria Formosa studied with seepage meters. Biogeochemistry 88, 185–194. doi: 10.1007/s10533-008-9204-9
Luijendijk, E., Gleeson, T., and Moosdorf, N. (2020). Fresh groundwater discharge insignificant for the world’s oceans but important for coastal ecosystems. Nat. Commun. 11:1260. doi: 10.1038/s41467-020-15064-8
Mack, M. C., Schuur, E. A. G., Bret-Harte, M. S., Shaver, G. R., and Chapin, F. S. (2004). Ecosystem carbon storage in arctic tundra reduced by long-term nutrient fertilization. Nature 431, 440–443. doi: 10.1038/nature02887
Mackenzie, F. T., Ver, L. M., and Lerman, A. (2002). Century-scale nitrogen and phosphorus controls of the carbon cycle. Chem. Geol. 190, 13–32. doi: 10.1016/S0009-2541(02)00108-0
Marchant, H. K., Ahmerkamp, S., Lavik, G., Tegetmeyer, H. E., Graf, J., Klatt, J. M., et al. (2017). Denitrifying community in coastal sediments performs aerobic and anaerobic respiration simultaneously. ISME J. 11, 1799–1812. doi: 10.1038/ismej.2017.51
Michael, H. A., Mulligan, A. E., and Harvey, C. F. (2005). Seasonal oscillations in water exchange between aquifers and the coastal ocean. Nature 436, 1145–1148. doi: 10.1038/nature03935
Moore, W. S. (1999). The subterranean estuary: a reaction zone of ground water and sea water. Mar. Chem. 65, 111–125. doi: 10.1016/S0304-4203(99)00014-6
Moore, W. S. (2010). The effect of submarine groundwater discharge on the ocean. Annu. Rev. Mar. Sci. 2, 59–88. doi: 10.1146/annurev-marine-120308-081019
Moore, W. S., and Joye, S. B. (2021). Saltwater intrusion and submarine groundwater discharge: acceleration of biogeochemical reactions in changing coastal aquifers. Front. Earth Sci. 9:600710. doi: 10.3389/feart.2021.600710
Murphy, K. R., Stedmon, C. A., Graeber, D., and Bro, R. (2013). Fluorescence spectroscopy and multi-way techniques. PARAFAC. Anal. Methods 5, 6557–6566. doi: 10.1039/C3AY41160E
Murphy, K. R., Stedmon, C. A., Wenig, P., and Bro, R. (2014). OpenFluor– an online spectral library of auto-fluorescence by organic compounds in the environment. Anal. Methods 6, 658–661. doi: 10.1039/C3AY41935E
Nelson, C. E., Donahue, M. J., Dulaiova, H., Goldberg, S. J., La Valle, F. F., Lubarsky, K., et al. (2015). Fluorescent dissolved organic matter as a multivariate biogeochemical tracer of submarine groundwater discharge in coral reef ecosystems. Mar. Chem. 177(Pt 2), 232–243. doi: 10.1016/j.marchem.2015.06.026
Ogawa, H., Amagai, Y., Koike, I., Kaiser, K., and Benner, R. (2001). Production of refractory dissolved organic matter by bacteria. Science 292, 917–920. doi: 10.1126/science.1057627
Pain, A. J., Martin, J. B., Young, C. R., Huang, L., and Valle-Levinson, A. (2019). Organic matter quantity and quality across salinity gradients in conduit- vs. diffuse flow-dominated subterranean estuaries. Limnol. Oceanogr. 64, 1386–1402. doi: 10.1002/lno.11122
Paytan, A., Shellenbarger, G. G., Street, J. H., Gonneea, M. E., Davis, K., Young, M. B., et al. (2006). Submarine groundwater discharge: an important source of new inorganic nitrogen to coral reef ecosystems. Limnol. Oceanogr. 51, 343–348. doi: 10.4319/lo.2006.51.1.0343
Rivett, M. O., Buss, S. R., Morgan, P., Smith, J. W. N., and Bemment, C. D. (2008). Nitrate attenuation in groundwater: a review of biogeochemical controlling processes. Water Res. 42, 4215–4232. doi: 10.1016/j.watres.2008.07.020
Robinson, C., Gibbes, B., Carey, H., and Li, L. (2007a). Salt-freshwater dynamics in a subterranean estuary over a spring-neap tidal cycle. J. Geophys. Res. 112:C09007. doi: 10.1029/2006JC003888
Robinson, C., Gibbes, B., and Li, L. (2006). Driving mechanisms for groundwater flow and salt transport in a subterranean estuary. Geophys. Res. Lett. 33:L03402. doi: 10.1029/2005GL025247
Robinson, C., Li, L., and Barry, D. A. (2007b). Effect of tidal forcing on a subterranean estuary. Adv. Water Resour. 30, 851–865. doi: 10.1016/j.advwatres.2006.07.006
Robinson, C. E., Xin, P., Santos, I. R., Charette, M. A., Li, L., and Barry, D. A. (2018). Groundwater dynamics in subterranean estuaries of coastal unconfined aquifers: controls on submarine groundwater discharge and chemical inputs to the ocean. Adv. Water Resour. 115, 315–331. doi: 10.1016/j.advwatres.2017.10.041
Rocha, C. (2000). Density-driven convection during flooding of warm, permeable intertidal sediments: the ecological importance of the convective turnover pump. J. Sea Res. 43, 1–14. doi: 10.1016/S1385-1101(00)00002-2
Rocha, C. (2008). Sandy sediments as active biogeochemical reactors: compound cycling in the fast lane. Aquat. Microb. Ecol. 53, 119–127. doi: 10.3354/ame01221
Rocha, C., Ibanhez, J., and Leote, C. (2009). Benthic nitrate biogeochemistry affected by tidal modulation of submarine groundwater discharge (SGD) through a sandy beach face, Ria Formosa, Southwestern Iberia. Mar. Chem. 115, 43–58. doi: 10.1016/j.marchem.2009.06.003
Rocha, C., Robinson, C. E., Santos, I. R., Waska, H., Michael, H. A., and Bokuniewicz, H. J. (2021). A place for subterranean estuaries in the coastal zone. Estuar. Coast. Shelf Sci. 250:107167. doi: 10.1016/j.ecss.2021.107167
Rocha, C., Veiga-Pires, C., Scholten, J., Knoeller, K., Gröcke, D. R., Carvalho, L., et al. (2016). Assessing land–ocean connectivity via submarine groundwater discharge (SGD) in the Ria Formosa Lagoon (Portugal): combining radon measurements and stable isotope hydrology. Hydrol. Earth Syst. Sci. 20, 3077–3098. doi: 10.5194/hess-20-3077-2016
Romera-Castillo, C., Nieto-Cid, M., Castro, C. G., Marrasé, C., Largier, J., Barton, E. D., et al. (2011). Fluorescence: absorption coefficient ratio–Tracing photochemical and microbial degradation processes affecting coloured dissolved organic matter in a coastal system. Mar. Chem. 125, 26–38. doi: 10.1016/j.marchem.2011.02.001
Romera-Castillo, C., Sarmento, H., Álvarez-Salgado, X. A., Gasol, J. M., and Marraséa, C. (2010). Production of chromophoric dissolved organic matter by marine phytoplankton. Limnol. Oceanogr. 55, 446–454. doi: 10.4319/lo.2010.55.1.0446
Santos, I. R., Eyre, B. D., and Huettel, M. (2012). The driving forces of porewater and groundwater flow in permeable coastal sediments: a review. Estuar. Coast. Shelf Sci. 98, 1–15. doi: 10.1016/j.ecss.2011.10.024
Schlesinger, W. H. (2009). On the fate of anthropogenic nitrogen. Proc. Natl. Acad. Sci.U.S.A. 106, 203–208. doi: 10.1073/pnas.0810193105
Schutte, C. A., Wilson, A. M., Evans, T., Moore, W. S., and Joye, S. B. (2018). Deep oxygen penetration drives nitrification in intertidal beach sands. Limnol. Oceanogr. 63, S193–S208. doi: 10.1002/lno.10731
Seeberg-Elverfeldt, J., Schluter, M., Feseker, T., and Kolling, M. (2005). Rhizon sampling of porewaters near the sediment-water interface of aquatic systems. Limnol. Oceanogr. Methods 3, 361–371. doi: 10.4319/lom.2005.3.361
Shaw, R. D., and Prepas, E. E. (1989). Anomalous, short-term influx of water into seepage meters. Limnol. Oceanogr. 34, 1343–1351. doi: 10.4319/lo.1989.34.7.1343
Slomp, C. P., and Van Cappellen, P. (2004). Nutrient inputs to the coastal ocean through submarine groundwater discharge: controls and potential impact. J. Hydrol. 295, 64–86. doi: 10.1016/j.jhydrol.2004.02.018
Stedmon, C. A., and Bro, R. (2008). Characterizing dissolved organic matter fluorescence with parallel factor analysis: a tutorial. Limnol. Oceanogr. Methods 6, 572–579. doi: 10.4319/lom.2008.6.572b
Stubbins, A., Lapierre, J.-F., Berggren, M., Prairie, Y., Dittmar, T., and del Giorgio, P. (2014). What’s in an EEM? Molecular signatures associated with dissolved organic fluorescence in boreal Canada. Environ. Sci. Technol. 48, 10598–10606. doi: 10.1021/es502086e
Suryaputra, I. G. N. A., Santos, I. R., Huettel, M., Burnett, W. C., and Dittmar, T. (2015). Non-conservative behavior of fluorescent dissolved organic matter (FDOM) within a subterranean estuary. Cont. Shelf Res. 110, 183–190. doi: 10.1016/j.csr.2015.10.011
Tamborski, J. J., Cochran, J. K., and Bokuniewicz, H. J. (2017). Submarine groundwater discharge driven nitrogen fluxes to Long Island Sound, NY: terrestrial vs. marine sources. Geochim. Cosmochim. Acta 218, 40–57. doi: 10.1016/j.gca.2017.09.003
Vitousek, P. M., Mooney, H. A., Lubchenco, J., and Melillo, J. M. (1997). Human domination of Earth’s ecosystems. Science 277, 494–499. doi: 10.1126/science.277.5325.494
Wan, J., Tokunaga, T. K., Brown, W., Newman, A. W., Dong, W., Bill, M., et al. (2021). Bedrock weathering contributes to subsurface reactive nitrogen and nitrous oxide emissions. Nat. Geosci. 14, 217–224. doi: 10.1038/s41561-021-00717-0
Wong, W. W., Applegate, A., Poh, S. C., and Cook, P. L. M. (2020). Biogeochemical attenuation of nitrate in a sandy subterranean estuary: insights from two stable isotope approaches. Limnol. Oceanogr. 65, 3098–3113. doi: 10.1002/lno.11576
Keywords: submarine groundwater discharge (SGD), fluorescent dissolved organic matter (FDOM), subterranean estuary, Ria Formosa coastal lagoon, priming effect
Citation: Ibánhez JSP, Álvarez-Salgado XA and Rocha C (2021) Does Nitrate Enrichment Accelerate Organic Matter Turnover in Subterranean Estuaries? Front. Mar. Sci. 8:661201. doi: 10.3389/fmars.2021.661201
Received: 30 January 2021; Accepted: 27 April 2021;
Published: 21 May 2021.
Edited by:
Laura Anne Bristow, University of Southern Denmark, DenmarkReviewed by:
Andrea Pain, University of Maryland Center for Environmental Science (UMCES), United StatesHannah Karen Marchant, Max Planck Institute for Marine Microbiology (MPG), Germany
Copyright © 2021 Ibánhez, Álvarez-Salgado and Rocha. This is an open-access article distributed under the terms of the Creative Commons Attribution License (CC BY). The use, distribution or reproduction in other forums is permitted, provided the original author(s) and the copyright owner(s) are credited and that the original publication in this journal is cited, in accordance with accepted academic practice. No use, distribution or reproduction is permitted which does not comply with these terms.
*Correspondence: J. Severino P. Ibánhez, cGlub2liYWpAdGNkLmll