 Phil J. Bouchet
 Catriona M. Harris
 Len Thomas
- 1Centre for Research into Ecological and Environmental Modelling, University of St Andrews, St Andrews, United Kingdom
- 2School of Mathematics and Statistics, University of St Andrews, St Andrews, United Kingdom
Concerns over cetacean mortality events coincident with maritime warfare exercises have motivated efforts to characterize the effects of anthropogenic noise on free-ranging whales and dolphins. By monitoring the movement, diving, and acoustic behaviors of individual whales before, during, and after sound exposure, behavioral response studies (BRSs) have supported significant progress in our understanding of the sensitivity of various cetacean species to high-powered naval sonar signals. However, differences in the designs and sampling capabilities of animal-borne tags typically used in BRS experiments prompt questions about the influence of data resolution in quantitative assessments of noise impacts. We conducted simulations to examine how uncertainty in the acoustic dose either measured on high-resolution multi-sensor biologging tags or modeled from position-transmitting satellite telemetry tags may affect predictions of behavioral responses in Cuvier’s beaked whales (Ziphius cavirostris) exposed to low- and mid-frequency active sonar. We considered an array of scenarios representative of real-world BRSs and used posterior estimates of dose-response functions obtained under an established Bayesian hierarchical modeling framework to explore the consequences of different tag choices for management decision-making. Our results indicate that (1) the zone of impact from a sonar source is under-estimated in most test conditions, (2) substantial reductions in the uncertainty surrounding dose-response relationships are possible at higher sample sizes, and (3) this largely holds true irrespective of tag choice under the scenarios considered, unless positional fixes from satellite tags are consistently poor. Strategic monitoring approaches that combine both archival biologging and satellite biotelemetry are essential for characterizing complex patterns of behavioral change in cetaceans exposed to increasing levels of acoustic disturbance. We suggest ways in which BRS protocols can be optimized to curtail the effects of uncertainty.
Introduction
Sound plays a critical role in the lives of cetaceans, with many species of whales, dolphins, and porpoises shown to be sensitive to the adverse effects of both chronic and acute exposure to anthropogenic underwater noise (Duarte et al., 2021). For instance, elevated noise levels (e.g., in areas of dense vessel traffic) can mask animal communication signals, elicit physiological stress, and/or cause displacements from preferred habitats, ultimately interfering with key life functions such as foraging, mating, nursing, or resting, with knock-on repercussions on individual fitness, energy expenditure, and survival (Erbe et al., 2018). In recognition of acoustic pollution as an emerging threat to wildlife globally, calls have been made to strengthen management and mitigation frameworks for sound-producing activities in the ocean (Chou et al., 2021). In the United States, the Marine Mammal Protection Act of 1972 (MMPA, 16 U.S.C. 1361 et seq.) regulates the take (defined as the “harassment, hunting, capture, or killing”) of marine mammals by U.S.-based organizations worldwide, including areas beyond national jurisdiction (i.e., on the high seas). The U.S. Navy is legally bound to assess the potential impacts of military readiness training activities on cetaceans to meet compliance requirements under the MMPA as well as other U.S. Federal laws pertaining to protected marine taxa (e.g., the Endangered Species Act ESA 16 U.S.C.1531 et seq.) (Zirbel et al., 2011). Of particular concern are activities involving the deployment of explosives and munitions, and the use of tactical, high-powered sonar technology operating in the lower (LFAS, ∼0.1–2 kHz) and mid-frequency bands (MFAS, 3–8 kHz) (Sivle et al., 2012; Goldbogen et al., 2013; Falcone et al., 2017). LFAS and MFAS systems were developed in the 1950s for anti-submarine warfare (D’Amico and Pittenger, 2009; Bernaldo de Quirós et al., 2019), and have been implicated in a number of atypical lethal mass strandings largely involving deep-diving toothed whales from the Ziphiidae family (D’Amico et al., 2009; Filadelfo et al., 2009; Fernández et al., 2012; Parsons, 2017).
These events prompted a series of coordinated, collaborative, behavioral response studies (BRSs) aimed at better understanding the short-term responses of cetaceans to both simulated and real sonar sources (Southall et al., 2012, 2016; Harris et al., 2016). In many cases, BRSs entail rigorously designed Before-After Control-Impact (BACI) experimental field protocols (referred to as controlled exposure experiments, or CEEs), which allow focal animals to be monitored before, during, and after sonar transmissions using animal-mounted tags, visual follows, passive acoustics, or any combinations thereof (Southall et al., 2016; Harris et al., 2018). In some cases, silent controls (i.e., vessel approaches with sonar deployed but turned off) can provide a benchmark of baseline behavioral patterns and a test of responses to ship presence alone, in the absence of sonar activity. Additional exposure treatments are sometimes also used to contextualize the nature and magnitude of detected responses relative to other acoustic stimuli, including conspecific vocalizations, playback recordings of potential predators such as mammal-eating killer whales, or artificial tones (e.g., pseudo-random noise in the same frequency bands) (Tyack et al., 2011; Dunlop et al., 2012). The data from CEEs are complemented by other sources of information from captive settings (e.g., Houser et al., 2013) or observational studies (Falcone et al., 2017; Harris et al., 2019b; Durbach et al., 2021).
The first U.S. Navy-funded CEE was undertaken in 2007–2008 in the vicinity of the Atlantic Undersea Testing and Evaluation Center (AUTEC)’s Bahamas testing and training range (Tyack et al., 2011). Since then, numerous other studies have taken place in the Atlantic, Arctic, and Pacific oceans, as well as in the Mediterranean Sea, with a focus on a range of odontocetes and mysticetes (Supplementary Table 1; Southall et al., 2016). CEEs have allowed a wide spectrum of behavioral metrics to be captured under a variety of protocols and configurations (e.g., dose escalations or “ramp-ups,” single vs. repeated exposures of one or multiple signal types, silent vs. full-power vessel approaches, etc.) (Southall et al., 2016; Wensveen et al., 2017), including data on animal position, body orientation, social dynamics, diving patterns, vocal activity, and swimming speeds (Harris et al., 2016). An important focus of efforts to date has been to translate these metrics into estimates of probabilities of sublethal behavioral responses, which may lead to biologically significant changes in survival or fecundity rates if elicited repeatedly (Harris et al., 2018). Detecting and characterizing such responses is difficult, however, not least because: (i) many reactions are idiosyncratic and context-dependent (DeRuiter et al., 2013; Goldbogen et al., 2013; Friedlaender et al., 2016; Gomez et al., 2016; Southall et al., 2016, 2019), making it challenging to extrapolate patterns of responsiveness across individuals, populations, and/or species (Harris et al., 2019a); (ii) success in identifying response events is a function of the amount and quality of available tag data, the duration and characteristics of the baseline period with which exposures are being compared, as well as the response detection method used; and (iii) the logistical complexities of monitoring cryptic animals that can only be approached within brief surfacing intervals limit the number of replicates available, particularly for elusive species like beaked whales (Harris et al., 2016; Hooker et al., 2019; Curtis et al., 2020).
Success in overcoming these obstacles requires the strategic integration of remote tracking technologies to maximize data collection opportunities over a range of complementary spatio-temporal scales (Tyack et al., 2011). As such, a rising number of CEEs now integrate near real-time telemetry and archival biologging (Tyack et al., 2011) by simultaneously deploying multiple types of tags on different individuals in the vicinity of planned sonar activity (e.g., Wensveen et al., 2019). Most commonly, these include multi-sensor, high-resolution, acoustic and movement tags such as Acousondes, CATS tags, or DTAGs (Johnson and Tyack, 2003) and coarser-resolution, position-transmitting satellite tags (hereafter ‘‘S-TAGs’’) such as those operating over the Argos system1 (Tyack et al., 2011; Schick et al., 2019; Wensveen et al., 2019). The former combine a microprocessor with a suite of depth, temperature, hydrostatic pressure, and triaxial acceleration sensors to record fine-scale motion in three dimensions while synchronously acquiring broadband audio data with one or more built-in hydrophones. DTAGs, in particular, have revolutionized the study of cetacean behavior by offering detailed insights into activity states that could not previously be readily observed (Johnson et al., 2009). However, DTAGs were originally designed for playback experiments of short duration (<24 h), and most models are attached using non-invasive suction cups with a maximum longevity spanning a few hours to at best a couple of days (Andrews et al., 2019). Additional limitations imposed by memory capacity, battery life, and the high sampling rates required to capture sound further constrain deployment times, precluding the use of DTAGs (or other acoustic tags) for assessments of long-term baselines prior to and following noise disturbance (Schick et al., 2019). By contrast, implantable S-TAGs allow animals to be tracked over far wider spatial domains (several hundreds of km; e.g., Schorr et al., 2009) and much longer timeframes (several months; e.g., Falcone et al., 2017), though this often comes at the cost of lower resolution with respect to surface locations and individual behaviors (Nowacek et al., 2016). Importantly, most S-TAGs lack on-board acoustic recorders and sacrifice the ability to take in situ measurements of received sound levels, which must then be inferred indirectly from knowledge of both the acoustic transmission properties of the area of interest and the animals’ position relative to the noise source at the time of exposure (von Benda-Beckmann et al., 2019). Tags transmitting via Service Argos can also suffer from substantial geo-localisation errors, which may range anywhere between 150 m and > 10 km (Nicholls et al., 2007; Irvine et al., 2020) and are likely to compromise estimates of the sound dose experienced by exposed individuals (Schick et al., 2019; von Benda-Beckmann et al., 2019). Such differences in data quality and resolution between monitoring technologies raise important questions regarding the optimisation of their use in BRSs (Harris et al., 2018). Another key challenge lies in reconciling the onerous costs and logistical demands of BRSs with the need to ensure that sonar impacts can be detected reliably (Dunlop et al., 2012), particularly as not all responses are equally identifiable on all tags. For instance, DTAGs are often used to identify cessation of foraging, interrupted dive cycles, and variations in swim kinematics, whereas S-TAGs offer better insights into patterns of horizontal avoidance, or changes in relative source-whale positions and low-resolution travel speeds. Furthermore, the number of tags available tends to be limited, as DTAGs are usually rented (ca. US $3,500 per month per device) (S. Isojunno, personal communication) and can be repeatedly used but necessitate significant labor input for deployment and recovery, whereas S-TAG prices can exceed US$ 5,000 per unit, with extra operational costs for data processing and satellite time (Thomas et al., 2012). Ethical concerns related to tag attachment may also dictate the tagging methodology used, and the ability to re-tag the same individuals or monitor different ones in the future (Hazen et al., 2012). Despite the above caveats, power analyses are seldom considered to determine the minimum sample size needed to yield conclusive results in BRSs (but see Dunlop et al., 2012; Wensveen et al., 2017).
To address this, we explored the effects of sample size and tag choice on our ability to quantify dose-response (“risk”) functions from multi-tag BRS data. In the past, managers have relied on “all-or-none” step functions to estimate the proportion of a population impacted by a sound source, but this approach can grossly underestimate risk, and reduces management criteria to a single threshold that is unlikely to be adequate for meeting different regulatory needs (Tyack and Thomas, 2019). Instead, novel statistical methods have recently emerged to quantify dose-response relationships in the form of flexible probabilistic curves (Miller et al., 2014; Moretti et al., 2014). These allow (i) predictions of responses to be made for an array of doses, including at low levels of exposure, (ii) responsiveness to be contextualized, by testing hypotheses about the factors driving the type and severity of responses (e.g., auditory sensitivity, prey density, behavioral mode), and (iii) resulting insights to be translated into mitigation guidelines for specific policy scenarios, on a case-by-case basis (Moretti et al., 2014). Here, we relied on a previously published Bayesian hierarchical dose-response model (Miller et al., 2014) to simulate cetacean responses to low- and mid-frequency active sonar, and we investigated how uncertainty in our knowledge of the dose experienced by a group of animals (each carrying a DTAG or a S-TAG in different combinations) affected metrics of sonar impact, as used in management decision-making. Simulation exercises are useful tools for guiding effort allocation in tagging studies, particularly when they are designed based on real-world datasets (Sequeira et al., 2019; New et al., 2020). We drew upon existing data from the Atlantic BRS project2 (see Schick et al., 2019) to tailor simulation inputs for scenarios involving Cuvier’s beaked whales (Ziphius cavirostris), a species notoriously vulnerable to sonar (D’Amico et al., 2009; Filadelfo et al., 2009; Bernaldo de Quirós et al., 2019) and reported to be site-faithful, even to sonar-rich areas such as Navy training ranges (Curtis et al., 2020). Our model is not spatially explicit and does not simulate individuals traversing a landscape of disturbance. Rather, it provides a conceptual structure for linking measurements of behavioral change made at the individual level to intrinsic response thresholds for each species (Figure 1). We place no restrictions on the nature or magnitude of responses per se, as the focus of dose-response modeling will vary with research objectives and data availability. The small sample sizes typical of BRSs mean that data are often pooled before analysis (Harris et al., 2015), and numerous BRSs also rely on expert scoring to quantify the severity of behavioral responses. This is usually done based on the severity scale described in Southall et al. (2007) and modified by Miller et al. (2012), which ranges from no effect (0) to effects not likely to influence vital rates (severity of 1–3), effects that could affect vital rates (severity of 4–6), and effects that are thought likely to influence vital rates (severity of 7–9) (Curé et al., 2021). Our only assumption, therefore, is that responses are strong enough to be detected on both tags and broadly comparable, for example by being of the same type (e.g., all avoidance responses) or of similar intensity (e.g., all with a severity score > 4). Importantly, Bayesian analysis offers a natural framework for parameter estimation in complex hierarchical models that is robust to the limitations of small datasets and can provide assessments of uncertainty that are fully interpretable in probabilistic terms (Antunes et al., 2014). In BRSs, this is advantageous for making appropriate predictions of responsiveness that can inform mitigation measures for naval training activities (Parsons, 2017; Harris et al., 2018).
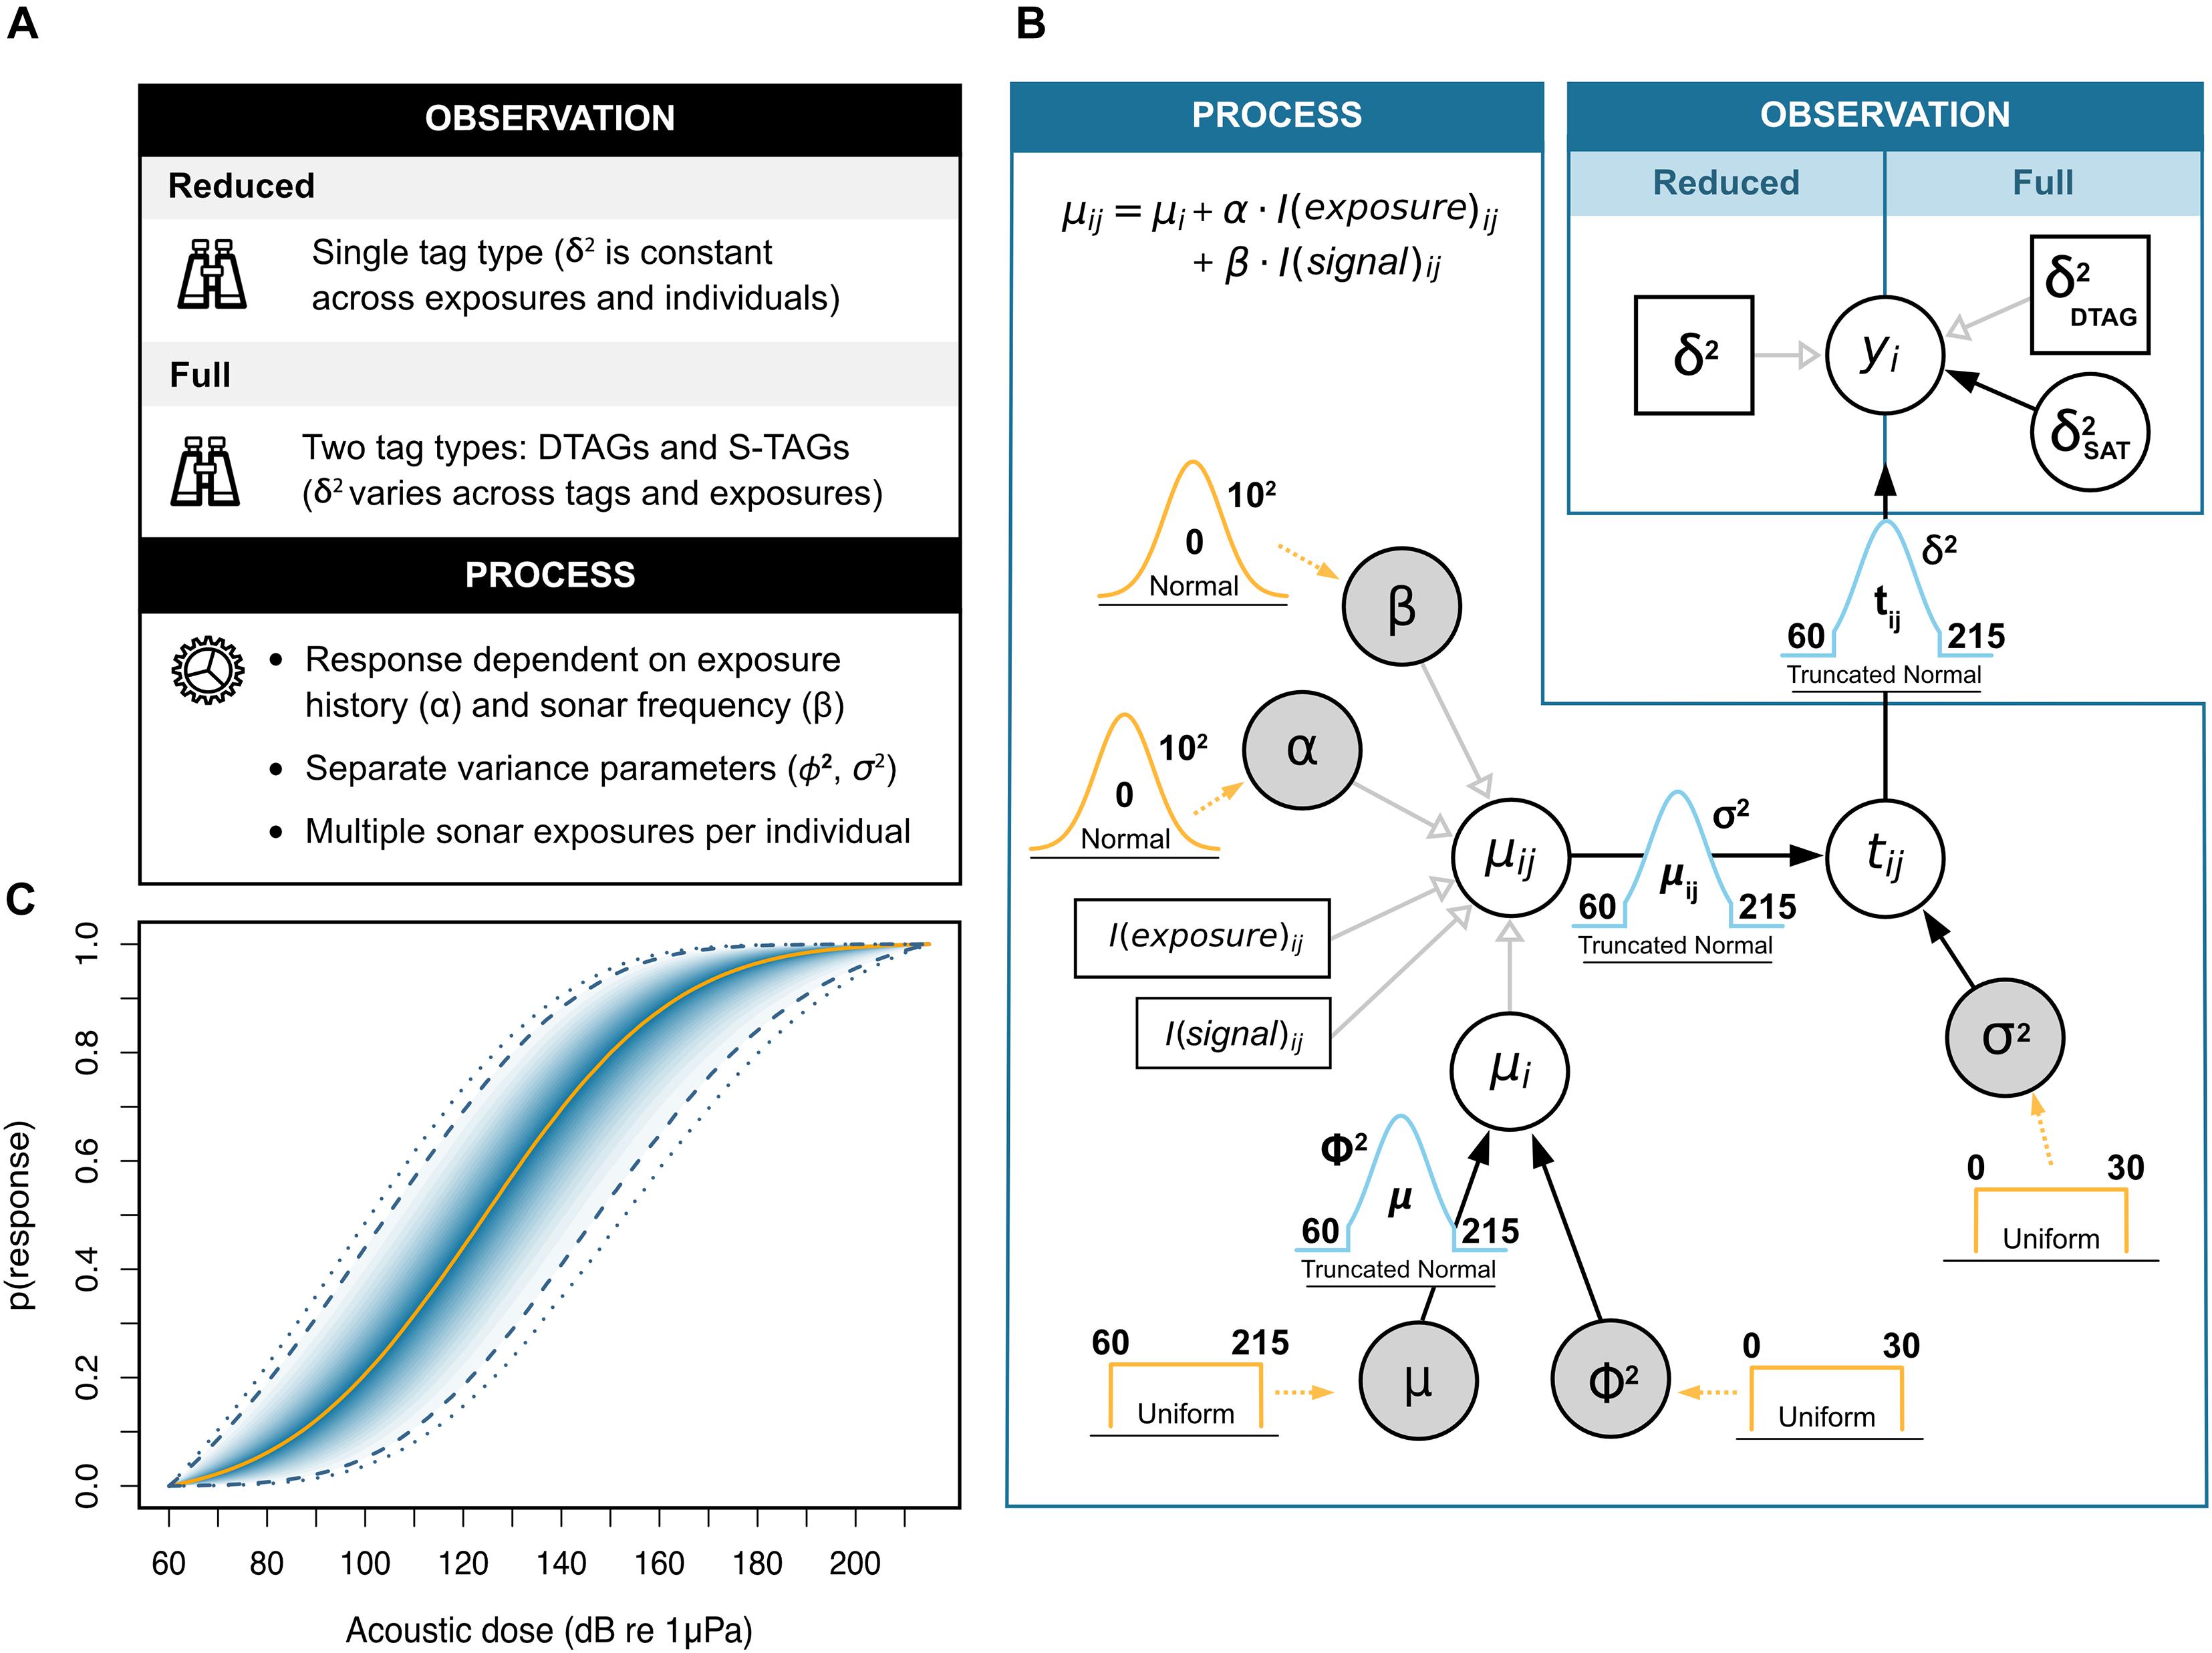
Figure 1. Bayesian hierarchical dose-response model used for simulating Cuvier’s beaked whale (Ziphius cavirostris) responses to naval sonar. (A) Summary of features for the observation and process model components. The treatment of sampling uncertainty (δ2) defines variants of the original framework proposed by Miller et al. (2014). In the reduced model, all animals carry the same type of tag and uncertainty is treated as a constant. In the full model, different tags are fitted on different individuals, and the uncertainty associated with S-TAGs varies stochastically (see main text for details). (B) Directed acyclic graph of the model structure. The expected response threshold μij for the ith whale in the jth exposure session is conditional on the additive effects of two contextual covariates: the animals’ previous history of exposure (“exposure” with coefficient α), and the frequency band of the sonar signal (i.e., low- or mid-frequency; “signal” with coefficient β). Random variables are denoted by circles, and those monitored for posterior inference are additionally shaded in gray. Constants are represented by square boxes. Filled (black) and open (light gray) arrows indicate stochastic and deterministic relationships, respectively. Prior distributions are shown in orange, with their relevant parameters (i.e., bounds and/or mean and standard deviation) appearing in bold font. Dotted arrows indicate the parameters to which priors relate. (C) Example dose-response curve obtained from posterior estimates of model parameters. The curve maps the probability of behavioral response (y-axis) to the received sound level (i.e., acoustic dose, x-axis). The solid orange line denotes the posterior median, followed by the 5, 10, 15 … and 95% credible intervals in darker to lighter shades of blue. Dashed and dotted lines mark the 95 and 99% credible intervals, respectively.
Materials and Methods
Dose-Response Model
Our work builds on the Bayesian hierarchical dose-response model proposed by Miller et al. (2014), which assumes that each individual whale has an inherent sensitivity threshold at which it will respond to an acoustic stimulus. This threshold is a function of: (1) the typical sensitivity of the population/species, and (2) the influence of both internal and external factors (e.g., behavioral mode, sonar frequency, distance from sonar source, etc.). Random effect terms are used to accommodate individual-level differences (i.e., between-whale variance) as well as repeated measurements of the same individuals during consecutive exposure sessions (i.e., within-whale, between-exposure variance). The full model consists of (1) a process component, which describes the underlying mechanisms conditioning the sensitivity of animals during exposure, and (2) an observation component, which links these to the observed values, measured with some degree of error (Miller et al., 2014). The former is interpreted as follows: Let tij be the true (but unknown) threshold of exposure that elicits a behavioral response (from a user-defined category, e.g., avoidance response, or response with severity score > 4) for the ith whale during the jth sonar transmission. We assume that this threshold is given by:
with TN denoting a truncated normal distribution where μ is the location parameter (i.e., the mean of the corresponding untruncated distribution), σ2 the scale (i.e., the variance of the corresponding untruncated distribution), L the lower bound, and U the upper bound. Here, μij relates to the expected response threshold of the ith whale during the jth exposure, and σ2 relates to the within-animal, between-session variability in this threshold. Using truncation is advantageous for constraining variables within biologically sensible bounds, making sure that values align with expectations of what constitutes a plausible range of sensitivity to sound (Miller et al., 2014). We further assume that μij hinges on the expected threshold for that individual, μi, and any changes arising from the animal’s previous history of exposure to sonar and the frequency band of the sonar signal used, such that:
where α is a parameter capturing the change in sensitivity from repeat exposures, and I(exposed)ij is an indicator to which a value of 0 is assigned during the first exposure session, and a value of 1 thereafter. Likewise, β governs the effect of MFAS relative to LFAS, with I(MFAS)ij taking the value 1 if MFAS is used, and 0 otherwise. Lastly, we assume that the expected threshold for each whale, μi, also follows a truncated normal distribution:
where μ indexes the mean threshold for all whales, ϕ2 relates to the between-whale variability, and L and U are as above. The model also includes an observation component to capture sampling variability, which stipulates that dose measurements obtained from tags follow a truncated normal distribution centered on tij, with scale δ2:
Dose-response curves are then computed as the cumulative distribution functions associated with the location and scale parameters of the truncated normal distribution defined in Eq. 3.
Simulation Scenarios
We adapted the above framework to formulate two complementary simulation scenarios (Figure 1). The first was a baseline scenario identical to Miller et al. (2014) whereby all whales carried the same type of tag and δ was treated as a constant (henceforth, “reduced model”). We tested incremental values of δ within 2.5–35 dB to emulate tag data of increasingly coarse resolution (Table 1). The lower bound of this range reflects the typical calibration error of DTAG hydrophones (Antunes et al., 2014), while the upper limit is consistent with maximum uncertainty estimates obtained in recent CEEs in which satellite tags were deployed (Schick et al., 2019; von Benda-Beckmann et al., 2019; Joyce et al., 2020). In a second augmented scenario, we implemented a more complex observation component that allowed for concurrent deployments of both DTAGs and S-TAGs on different individuals (henceforth, “full model”). Tags were assigned randomly to animals according to a pre-determined ratio (PS–TAG), which varied from 0 to 100% (DTAG vs. S-TAG) in 20% increments. δ was kept at 2.5 dB for all DTAGs but varied for S-TAGs in order to mimic the heterogeneous quality which is characteristic of location fixes derived from conventional Argos tracking systems (Irvine et al., 2020) (see section “Accounting for Positional Uncertainty on S-TAGs” for details). We tested an array of realistic sample sizes, from a minimum of N = 5 to a maximum of N = 30 (Supplementary Table 1; Southall et al., 2016). Small sample sizes remain the norm in marine mammal science, as successful data collection across remote ocean habitats must comply with the many constraints imposed by logistics, safety requirements, weather conditions, and expense. Clearly, the ecological insights gleaned from single exposures on multiple tags will differ from those produced by single tags recording a sequence of multiple exposures. The latter are valuable for painting a picture of within-individual heterogeneity in behavior (e.g., Tyack et al., 2011; Sivle et al., 2015), and for learning more broadly about species’ ecological requirements, patterns of habitat use, and spatial movements (Sequeira et al., 2019). However, samples of N = 1 do not convey information about the between-individual variance and were thus not considered here. We focused on Cuvier’s beaked whales given their preponderance in sonar-associated atypical mass strandings (Bernaldo de Quirós et al., 2019), and we relied on existing datasets, published literature, and expert input to inform the selection of relevant parameter values (Table 1). For example, we set the location parameter indexing the mean threshold for all whales to μ = 120 dB re 1μPa, as an average of the received sound levels associated with previously reported avoidance responses for this species (136 dB re 1 μPa, Aguilar Soto et al., 2006; 98 and 127 dB re 1 μPa, DeRuiter et al., 2013). When no information was available, we turned to similar taxa such as beaked whales from the same or closely related families, or other deep-diving odontocetes. This was the case for both ϕ and σ, as we were not aware of any quantitative estimates of these parameters for Z. cavirostris, despite evidence of population- and individual-level differences in patterns of behavior coincident with sonar activity (e.g., Falcone et al., 2017). Here, we set ϕ = 20 dB and σ = 25 dB, respectively, based on a study of long-finned pilot whales (Globicephala melas) (Antunes et al., 2014). We considered that any noise stimulus below L = 60 dB re 1 μ Pa would be barely audible above ambient and therefore would not provoke a response (Schick et al., 2019), and we expected that all animals would react at or above U = 215 dB re 1 μPa. This upper bound aligns with the maximum source levels employed in BRSs to date (211–212 dB re 1 μPa, Tyack et al., 2011; 210 dB re 1μPa, DeRuiter et al., 2013; 199–214 dB re 1 μPa, Antunes et al., 2014; 210 dB re 1 μPa, Stimpert et al., 2014), though it remains markedly lower than most high-powered sonar systems in operation globally (Southall et al., 2016; Falcone et al., 2017). It also mirrors current understanding of the potential for injury at sound levels over 180 dB re 1 μPa, which underpins existing regulations surrounding sonar mitigation in areas of importance to marine mammals (U.S. Navy, 2019).
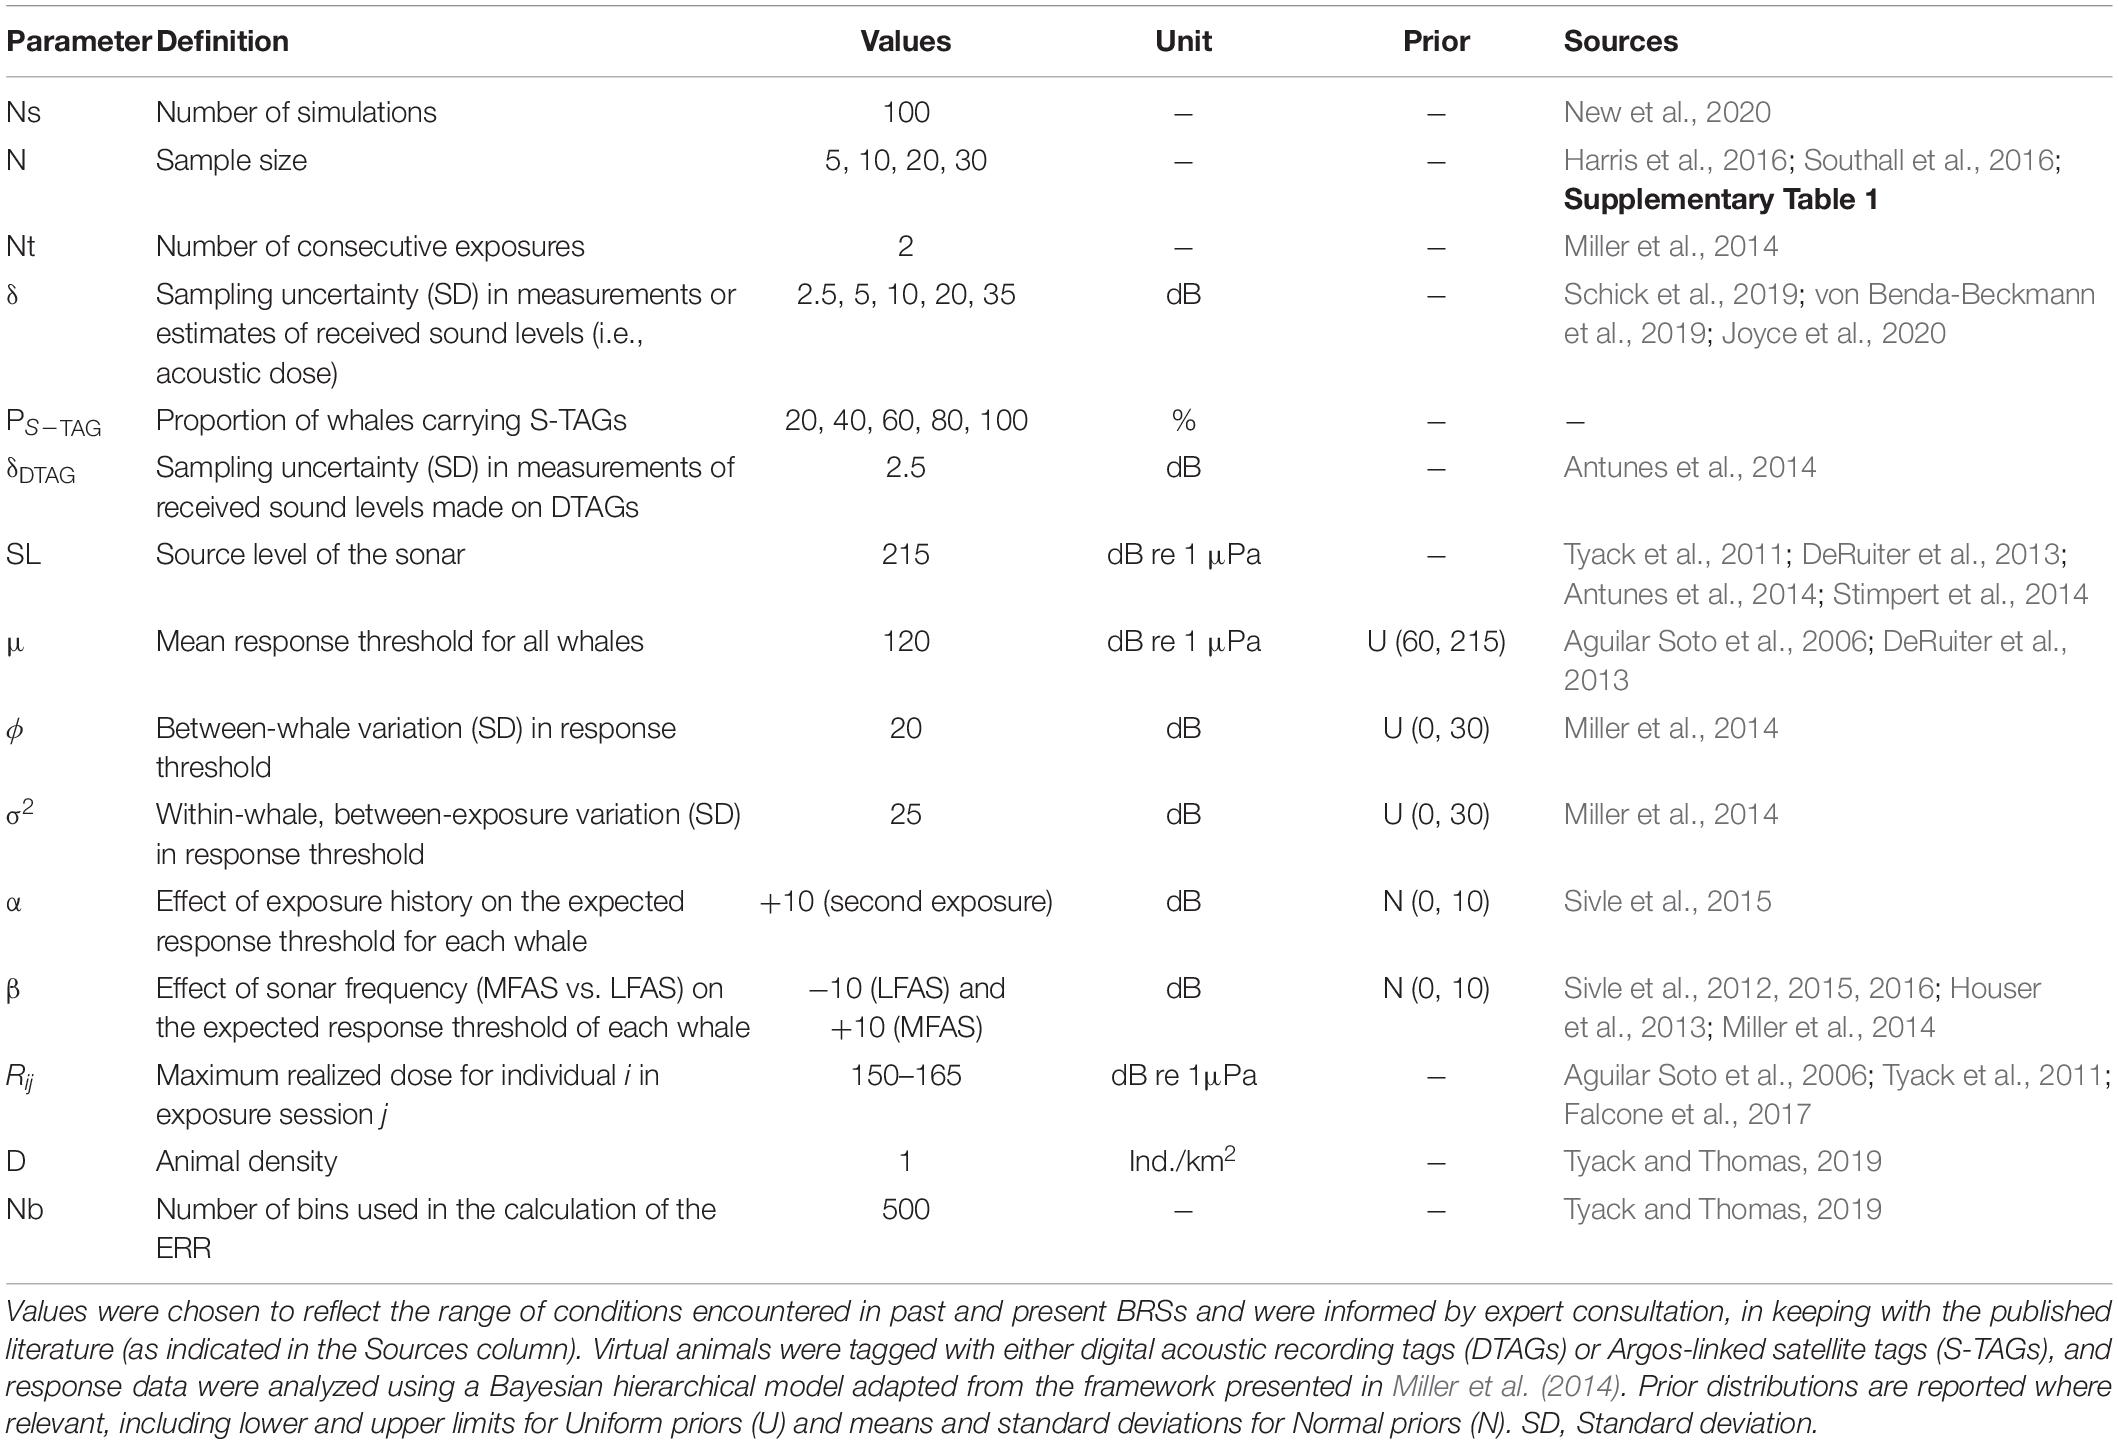
Table 1. Parameters used in simulations of Cuvier’s beaked whale (Ziphius cavirostris) behavioral responses following exposure to mid-frequency and low-frequency active sonar.
Re-sampling the same wild animals multiple times is difficult and poses numerous challenges related to interpreting order effects where sequential noise stimuli are presented over relatively short durations (Southall et al., 2016). To date, CEEs on beaked whales have largely been limited to single exposures, and only a few BRSs overall have attempted to assess the potential for sensitisation or habituation. Despite limited statistical support for an effect of exposure history, available evidence from better-studied cetacean species points to potentially lower probabilities of response subsequent to the initial sonar transmission (Sivle et al., 2012; Houser et al., 2013; Miller et al., 2014; Sivle et al., 2015, 2016). Here, we considered two consecutive exposure sessions (the maximum reported for beaked whales, to our knowledge), and we set α = 10 dB to simulate a higher tolerance to sound on the second exposure. In their systematic review of 370 published papers, Gomez et al. (2016) found that the type of sound source (continuous noise, pulsed sonar, seismic/explosion) was “an important variable for describing the severity of behavioral response of wild cetaceans.” In addition, more recent studies indicate that some species exhibit sonar signal-specific responses (LFAS vs. MFAS) (Isojunno et al., 2018). We therefore also tested the influence of sonar signal frequency in the model. To keep the average expected threshold μij centered with respect to this covariate, we treated it as a relative effect between individuals exposed to LFAS vs. MFAS and encoded the β parameter as an effect size, such that for β = 20 dB the corresponding coefficient values for LFAS and MFAS were set to −10 and +10 dB, respectively. LFAS has been shown to exacerbate sensitivity to sonar in a number of species (Sivle et al., 2012; Isojunno et al., 2016), yet we note that responses to low-frequency signals can be variable across taxa and strongly mediated by behavioral state (Harris et al., 2015). Lastly, BRS data often entail some degree of right-censoring, which arises when a subset of animals display no signs of behavioral disturbance across the array of doses received in any given experiment (Antunes et al., 2014). The resulting data entries are assigned missing values and must be accounted for as they hold critical information about the nature of dose-response relationships (i.e., they indicate that a response may still occur at some unknown point above the maximum realized dose, Rij) (Harris et al., 2015), conditional on the definition of what constitutes a response within the context of each study. For instance, if interest lies in predicting changes in population vital rates, then responses with a severity score < 4 may be considered as “non-responses” and treated as right-censored (Southall et al., 2007; Miller et al., 2012). Similarly, models focused on avoidance responses only would include any exposures resulting in another response type (e.g., social, vocal, respiration) as right-censored data. By including right-censoring in our simulations, we can therefore accommodate for both animals that genuinely do not respond (i.e., because their sensitivity threshold is higher than the maximum dose received), as well as animals that do not respond in a way that aligns with the focus of the dose-response modeling. To obtain right-censored observations, we generated random values of Rij with equal probability within [150–165] dB re 1 μPa for each exposure. This interval is consistent with the range of minimum approach (source-whale) distances logged in previous studies (e.g., 700 m, Aguilar Soto et al., 2006; 1 km, Tyack et al., 2011; 1.9 km, Falcone et al., 2017), assuming simple spherical spreading of the acoustic signals (i.e., uniform propagation away from the source in all directions). Right-censored data points were labeled as NA and imputed using the dinterval distribution in software JAGS (Plummer, 2003), which ensures that the lower bound in Eq. (4) is changed to Rij.
Accounting for Positional Uncertainty on Argos-Linked Satellite Tags
Most of what we know about the population ranges, diving abilities, and habitat use patterns of beaked whales comes from Argos-linked satellite tags (Schorr et al., 2009; Joyce et al., 2017; Hooker et al., 2019). The Argos system relays radio signals emitted by animal-borne transmitters to a network of remote stations on the ground for processing and distribution to users (Irvine et al., 2020). The geo-localisation of tags is achieved by determining the Doppler shift in the frequency of uplinks received by one or more polar-orbiting satellites during the course of an overhead pass, which usually lasts no more than ca. 10 min (McConnell et al., 2010). While set-up latency is negligible, the short time window available for data transfers means that Argos messages are often incomplete, corrupted, and/or subject to errors, the magnitude of which depends on latitude, animal behavior, environmental conditions, time of day, transmitter stability, and the placement of the tag on the animal’s body, among other factors (Quick et al., 2019). These issues are compounded in deep-diving taxa such as Z. cavirostris, which engage in exceptionally long foraging dives and stay at the surface for periods of variable duration (i.e., from 2 min to over 1 h, Shearer et al., 2019; Quick et al., 2020). In practice, Argos data are therefore recorded with varying quality, even when uplinks are successful (Schick et al., 2019). Accounting for this uncertainty is critical to making fair assessments of variance in received sound levels, and thus to quantifying dose-response relationships (Schick et al., 2019). Prior to 2008, Argos position estimates were assigned one of seven location classes (LC: 3, 2, 1, 0, A, B, and Z in descending order of quality), with nominal error radii ranging from < 250 m for LC 3 to < 1,500 m for LC 0, > 10 km for the lettered classes (Nicholls et al., 2007; Irvine et al., 2020). However, these estimates are subject to substantially greater bias in the longitudinal than the latitudinal direction, such that true errors around calculated positions are better represented by 2-dimensional anisotropic ellipses rather than by 1-dimensional circles (McClintock et al., 2015). Service Argos has been supplying these ellipses with each location in recent years. Each ellipse has three components, namely its (1) semi-major axis, M, (2) semi-minor axis m, and (3) orientation, c. Taken together, these define a bivariate normal distribution of geolocation error centered on the animal’s location, with larger ellipses being associated with higher positional uncertainty (McClintock et al., 2015). Published estimates of Argos error ellipses are only currently available for a small number of cetacean species, including blue (Balaenoptera musculus), fin (B. physalus), and sperm whales (Physeter macrocephalus) (Irvine et al., 2020). Empirical data on tagged Cuvier’s beaked whales have also recently been collected as part of the Atlantic BRS (Schick et al., 2019), and we used this latter dataset as a basis for simulating appropriate levels of sampling uncertainty in S-TAGs. Specifically, we jittered the (x, y) coordinates of each simulated animal within plausible error ellipses selected at random from the BRS dataset in every exposure (Figure 2). This was achieved in seven steps, as follows.
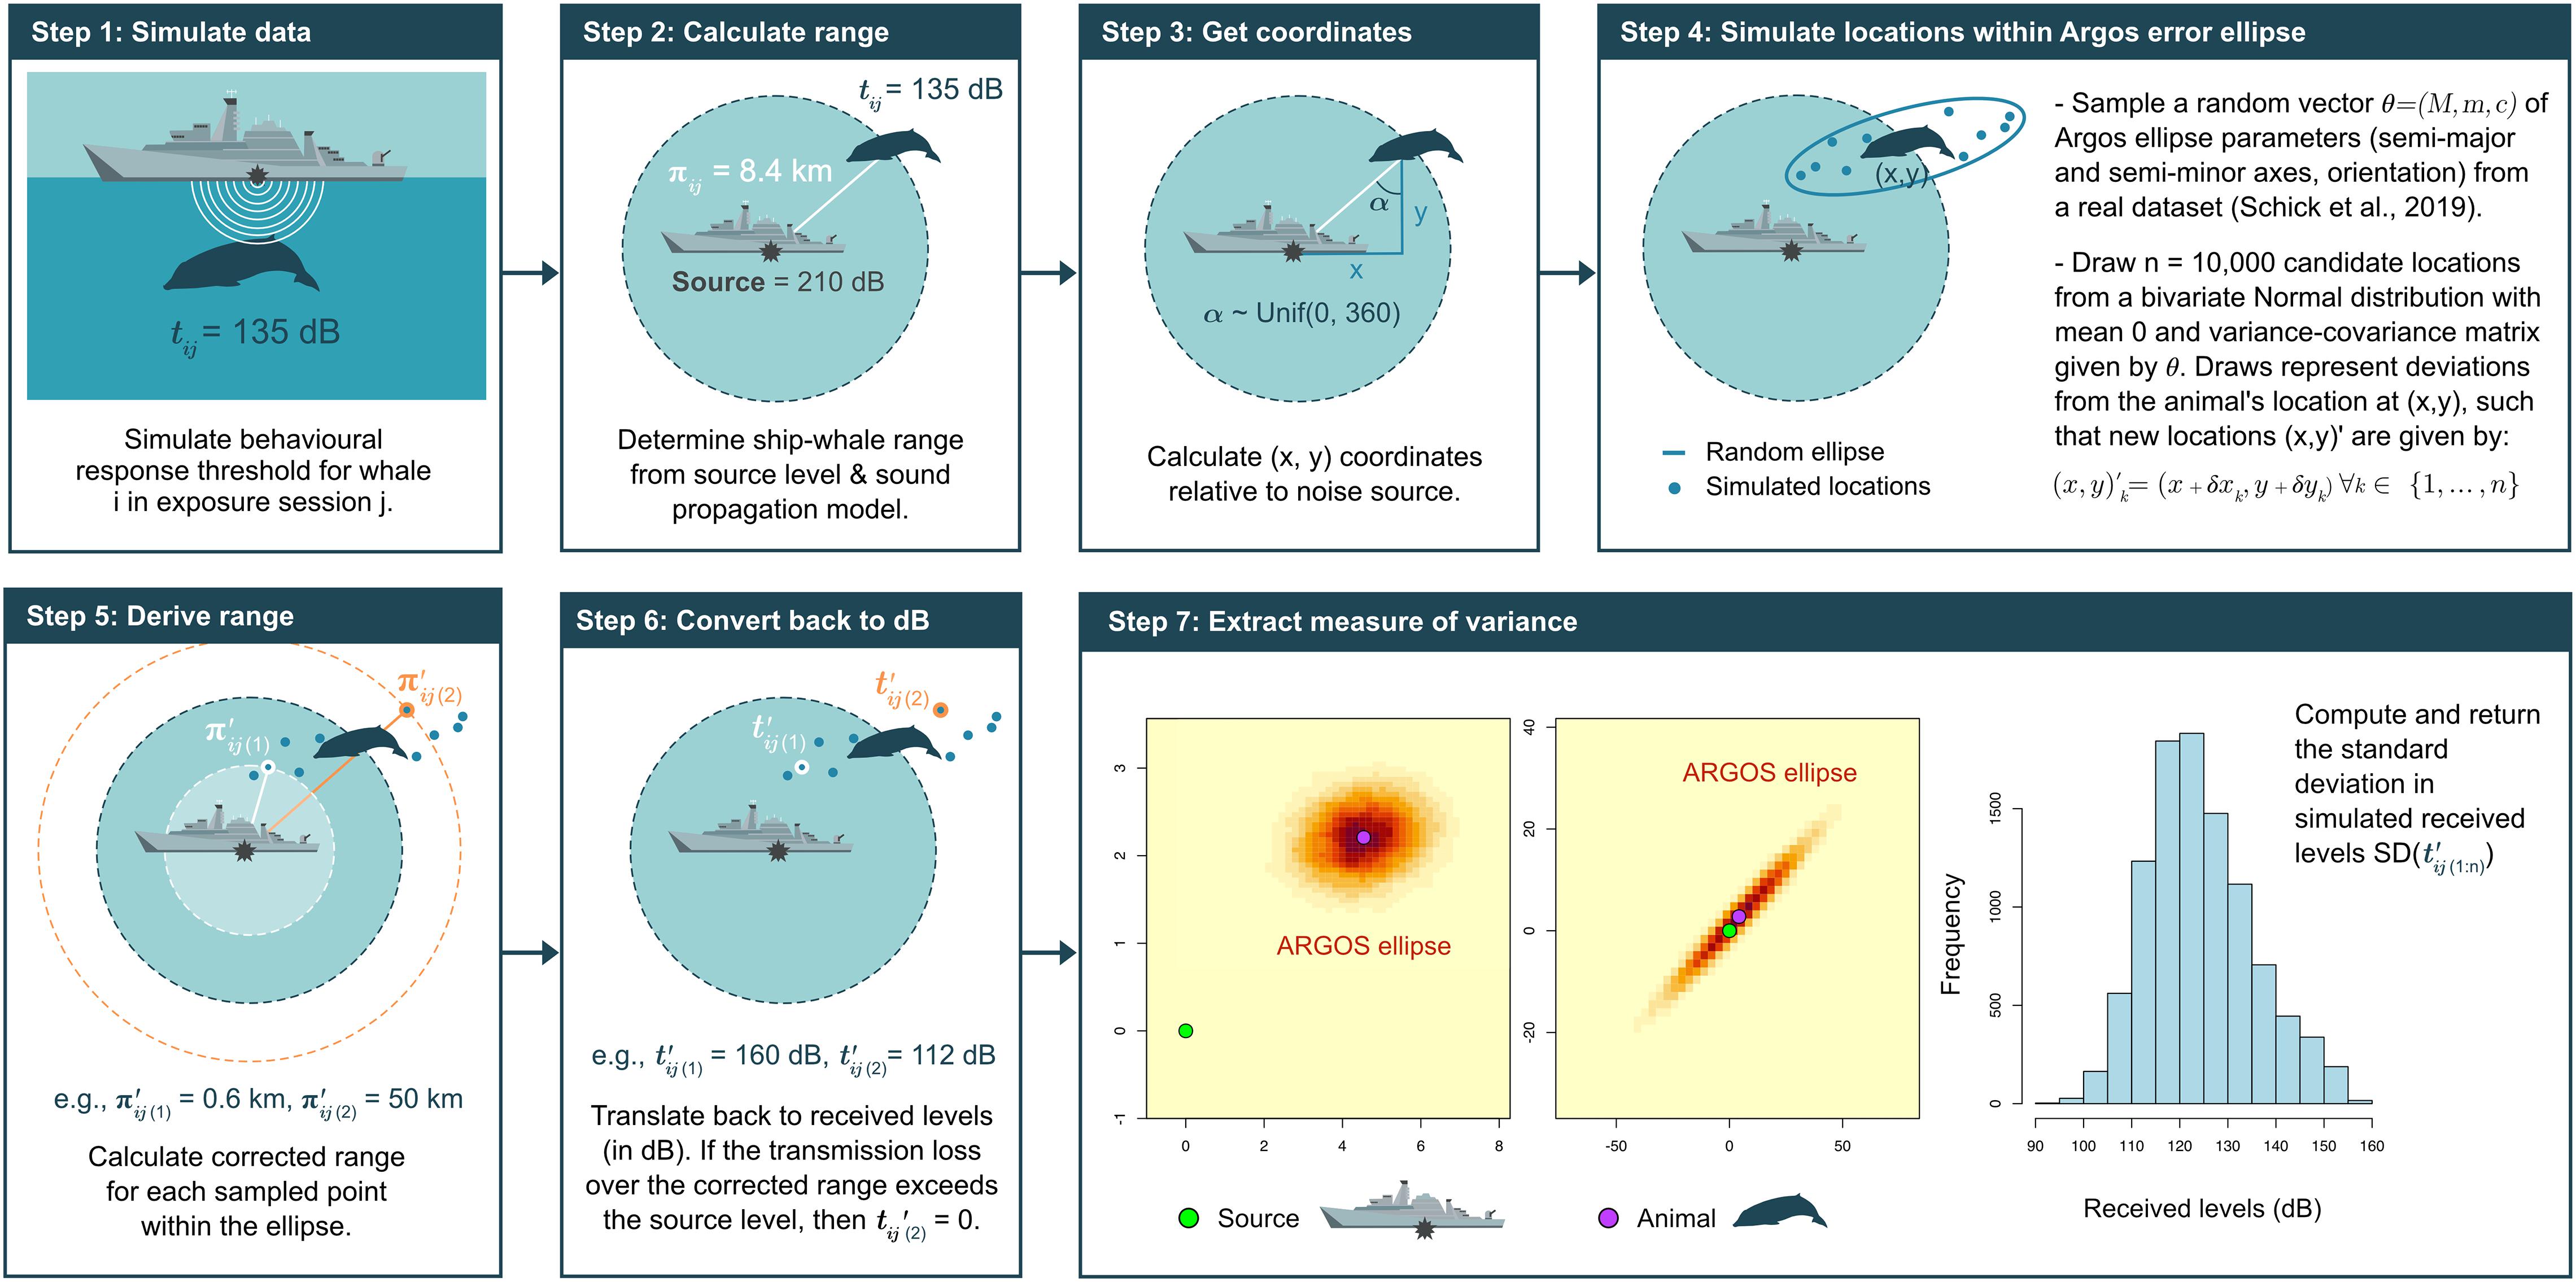
Figure 2. Schematic of the approach taken to estimate sampling uncertainty on Argos-linked satellite tags (S-TAGs). Step 4 is informed by a real-world dataset on Cuvier’s beaked whales (Ziphius cavirostris) tagged as part of the Atlantic BRS project (https://sea-inc.net/science/atlantic-brs/) (Schick et al., 2019).
• Step 1: Simulate response thresholds, tij, for each animal i in exposure session j.
• Step 2: Determine the corresponding range between whale and sonar source, under the assumption that sound spreads equally in all directions (i.e., inverse-square spherical spreading) (Tyack and Thomas, 2019). For these calculations, the absorption coefficient was set to 0.185 dB re 1μPa per km, which corresponds to the rate of absorption of an acoustic signal emitted at a nominal frequency of 3 kHz under normal sea conditions (Miller et al., 2014).
• Step 3: Position an animal at this range, and calculate its coordinates on the (x, y) plane relative to the source using simple trigonometry. Whale-source angles are drawn from a Uniform distribution U∼(0, 360).
• Step 4: Create an Argos error ellipse by randomly sampling a vector of ellipse parameters θij = (Mij,mij,cij) from the Atlantic BRS dataset (Schick et al., 2019), and generate n = 10,000 candidate locations within this ellipse by sampling from the bivariate Normal distribution centered on the animal and with variance–covariance matrix defined by the values in θij.
• Step 5: Compute the source-whale range for all candidate locations.
• Step 6: Estimate received sound levels at candidate locations using the same spherical spreading loss model as above.
• Step 7: Extract the standard deviation of received levels as an estimate of the sampling uncertainty associated with each S-TAG.
Model Fitting and Posterior Inference
Model fitting was performed using Markov Chain Monte Carlo (MCMC) in JAGS, interfaced via the rjags library in R v4.0.3 (R Core Team, 2020). Model parameters were estimated based on 10,000 posterior samples from each of three MCMC chains, taken after variable burn-in periods (Supplementary Table 2). Chains were assessed for convergence both visually (i.e., inspection of trace plots) and numerically (Brooks–Gelman–Rubin statistic, < 1.1) using functions from the coda and bayesplot packages. Each parameter was initialized using arbitrary starting values. Prior distributions were required on all top-level random variables in the hierarchical model (shown as gray circles in Figure 1), and we largely followed Miller et al. (2014) in choosing diffuse uniform priors for these. The only exceptions were the two parameters governing the respective effects of exposure history (α) and sonar frequency (β), for which normal distributions centered on zero were assumed (Figure 1 and Table 1). These decisions were subjective, and it could be argued that the use of more informative priors (e.g., a low a priori response threshold with small variance) may have been more beneficial in the analysis of a sonar-sensitive species like Z. cavirostris. That said, misspecified priors have the potential to undermine inference and mislead model interpretation (McCarthy and Masters, 2005). Given the strong within- and between-individual heterogeneity in responsiveness described in previous BRSs (Harris et al., 2018), uniform priors were deemed an adequate and more precautionary alternative, and were specified so as to constrain model parameters within biologically plausible bounds (McCarthy and Masters, 2005; Table 1). Within each scenario, we fitted models to 100 simulated datasets for each combination of N and δ/PS–TAG, running the code in parallel on multiple cores to increase execution speed. In contrast to Miller et al. (2014), we did not implement Gibbs Variable Selection (GVS), but instead assessed the ability of the models to discriminate covariate effects by examining the posterior distributions of the relevant coefficients, α and β. If the corresponding 95% credible intervals included zero, we deemed the model unable to detect an effect.
Regulatory agencies in many jurisdictions now require noise impact assessments to authorize at-sea activities involving loud sound sources which may adversely affect marine mammals (Farcas et al., 2016). The assessment process often entails the estimation of “potential zones of effect” (or alternatively, the number of animals predicted to be affected) using noise exposure criteria which define thresholds of sound at which individual- or population-level impacts can be expected (e.g., mortality, temporary or permanent hearing impairment, habitat exclusion, behavioral change) (Faulkner et al., 2018). Historically, these estimates have often been obtained from simple step functions which consider that individuals are impacted only if/when exposed above a discrete level of sound (i.e., the risk of impact increases instantaneously from 0 to 100% once that level is attained—typically, 160 dB re 1 μPa). However, this approach ignores the fact that responses do not necessarily scale with dose (Gomez et al., 2016), and overlooks the complexities of wildlife responsiveness to sound, including the large suite of contextual factors that drive the onset and intensity of behavioral responses observed to date both within and across taxonomic groups (Ellison et al., 2012). Tyack and Thomas (2019) recently proposed the effective response radius (or effective response range, ERR) as an alternative and unbiased diagnostic of impact for management applications. The ERR is derived from probabilistic dose-response curves and can be combined with information on animal density to determine the number of individuals expected to respond under given exposure conditions, making it a key metric in environmental impact assessments. Specifically, the ERR represents an “effect zone” (sensu Faulkner et al., 2018) which quantifies the distance beyond which as many animals respond as do not respond within it; it follows that the total number of animals (both those that respond and those that do not) within this range is identical to the overall number of animals responding at all distances, assuming that individuals are distributed evenly throughout the region of interest (although other spatial distributions can be readily incorporated; see Tyack and Thomas, 2019 for details). Using acoustic propagation models, the ERR can additionally be translated into an effective received level (ERL), which yields an identical estimate of impact when used as a threshold in a step function as would be obtained from a full dose-response function (Tyack and Thomas, 2019). To explore the consequences of sampling uncertainty on decision-making, we used posterior estimates of model parameters to compute the ERR in each simulation, assuming spherical spreading loss of the acoustic signals.
To evaluate model performance, we compared the posterior distributions of parameters and derived quantity (i.e., ERR) with their “true” values, concentrating on three key diagnostics: (1) precision, expressed as the average width of posterior credible intervals; (2) accuracy, measured as the average absolute percent relative bias, defined as and (3) identifiability, defined as the average prior posterior overlap (PPO). The latter is useful for identifying parameter-redundant models, i.e., in which priors simply dictate posteriors and the data have little bearing on the results, if any. A guideline of 35% or greater overlap has been suggested as an indicator of weak identifiability (Gimenez et al., 2009). Lastly, we computed dose-response curves from each model in the same way as Miller et al. (2014), and created plots of the associated posterior median and credible interval lines for a range of chosen quantiles. The code used to run the analyses is publicly available at https://github.com/pjbouchet/brs_uncertainty and fully described in Bouchet et al. (2020).
Results
Reduced Model
An interaction between sample size (N) and sampling error (δ) was apparent in the reduced model, with the variance surrounding dose-response curves increasing as both N declined and δ increased (Figure 3A and Supplementary Figure 1). Posterior estimates of the location parameter for the response threshold (μ) were closely aligned with their true original value under most test conditions but were subject to strong positive bias (average ± SD: 15.7 ± 1.0 dB) at the largest level of sampling error (δ = 35 dB), irrespective of sample size (Supplementary Figure 2). Furthermore, degrading data quality from consistently good (high N, low δ) to consistently poor (low N, high δ) incurred a ca. threefold loss in precision (average ± SD: 2.99 ± 0.46 dB) around μ. Together, these trends translated into highly uncertain assessments of responsiveness and underestimates of impact when sampling errors were magnified (Figure 3B). Similar patterns were observed for the scale parameter related to the within-exposure variance (σ), indicating that even as few as two repeated exposures can be useful for quantifying intra-individual variability. By contrast, the scale parameter related to between-whale variance (ϕ) was consistently more difficult to estimate, with wide credible intervals and a high prior posterior overlap under all sampling regimes (Figure 3C and Supplementary Figure 2). The model was rarely able to detect an effect of exposure history (α) (overall average ± SD: 5.7 ± 7.9% of simulation runs) but was more successful at disentangling the effect of sonar frequency (β), with credible intervals excluding zero in up to 66% of simulations runs at N = 30 and δ = 2.5 dB (overall average ± SD: 27.9 ± 20.0%). Of all model parameters, only μ was fully identifiable (PPO < 35%) in all simulations, highlighting the relevance of the information contained in simulated behavioral data for predicting the population-level thresholds of response (Figure 3C).
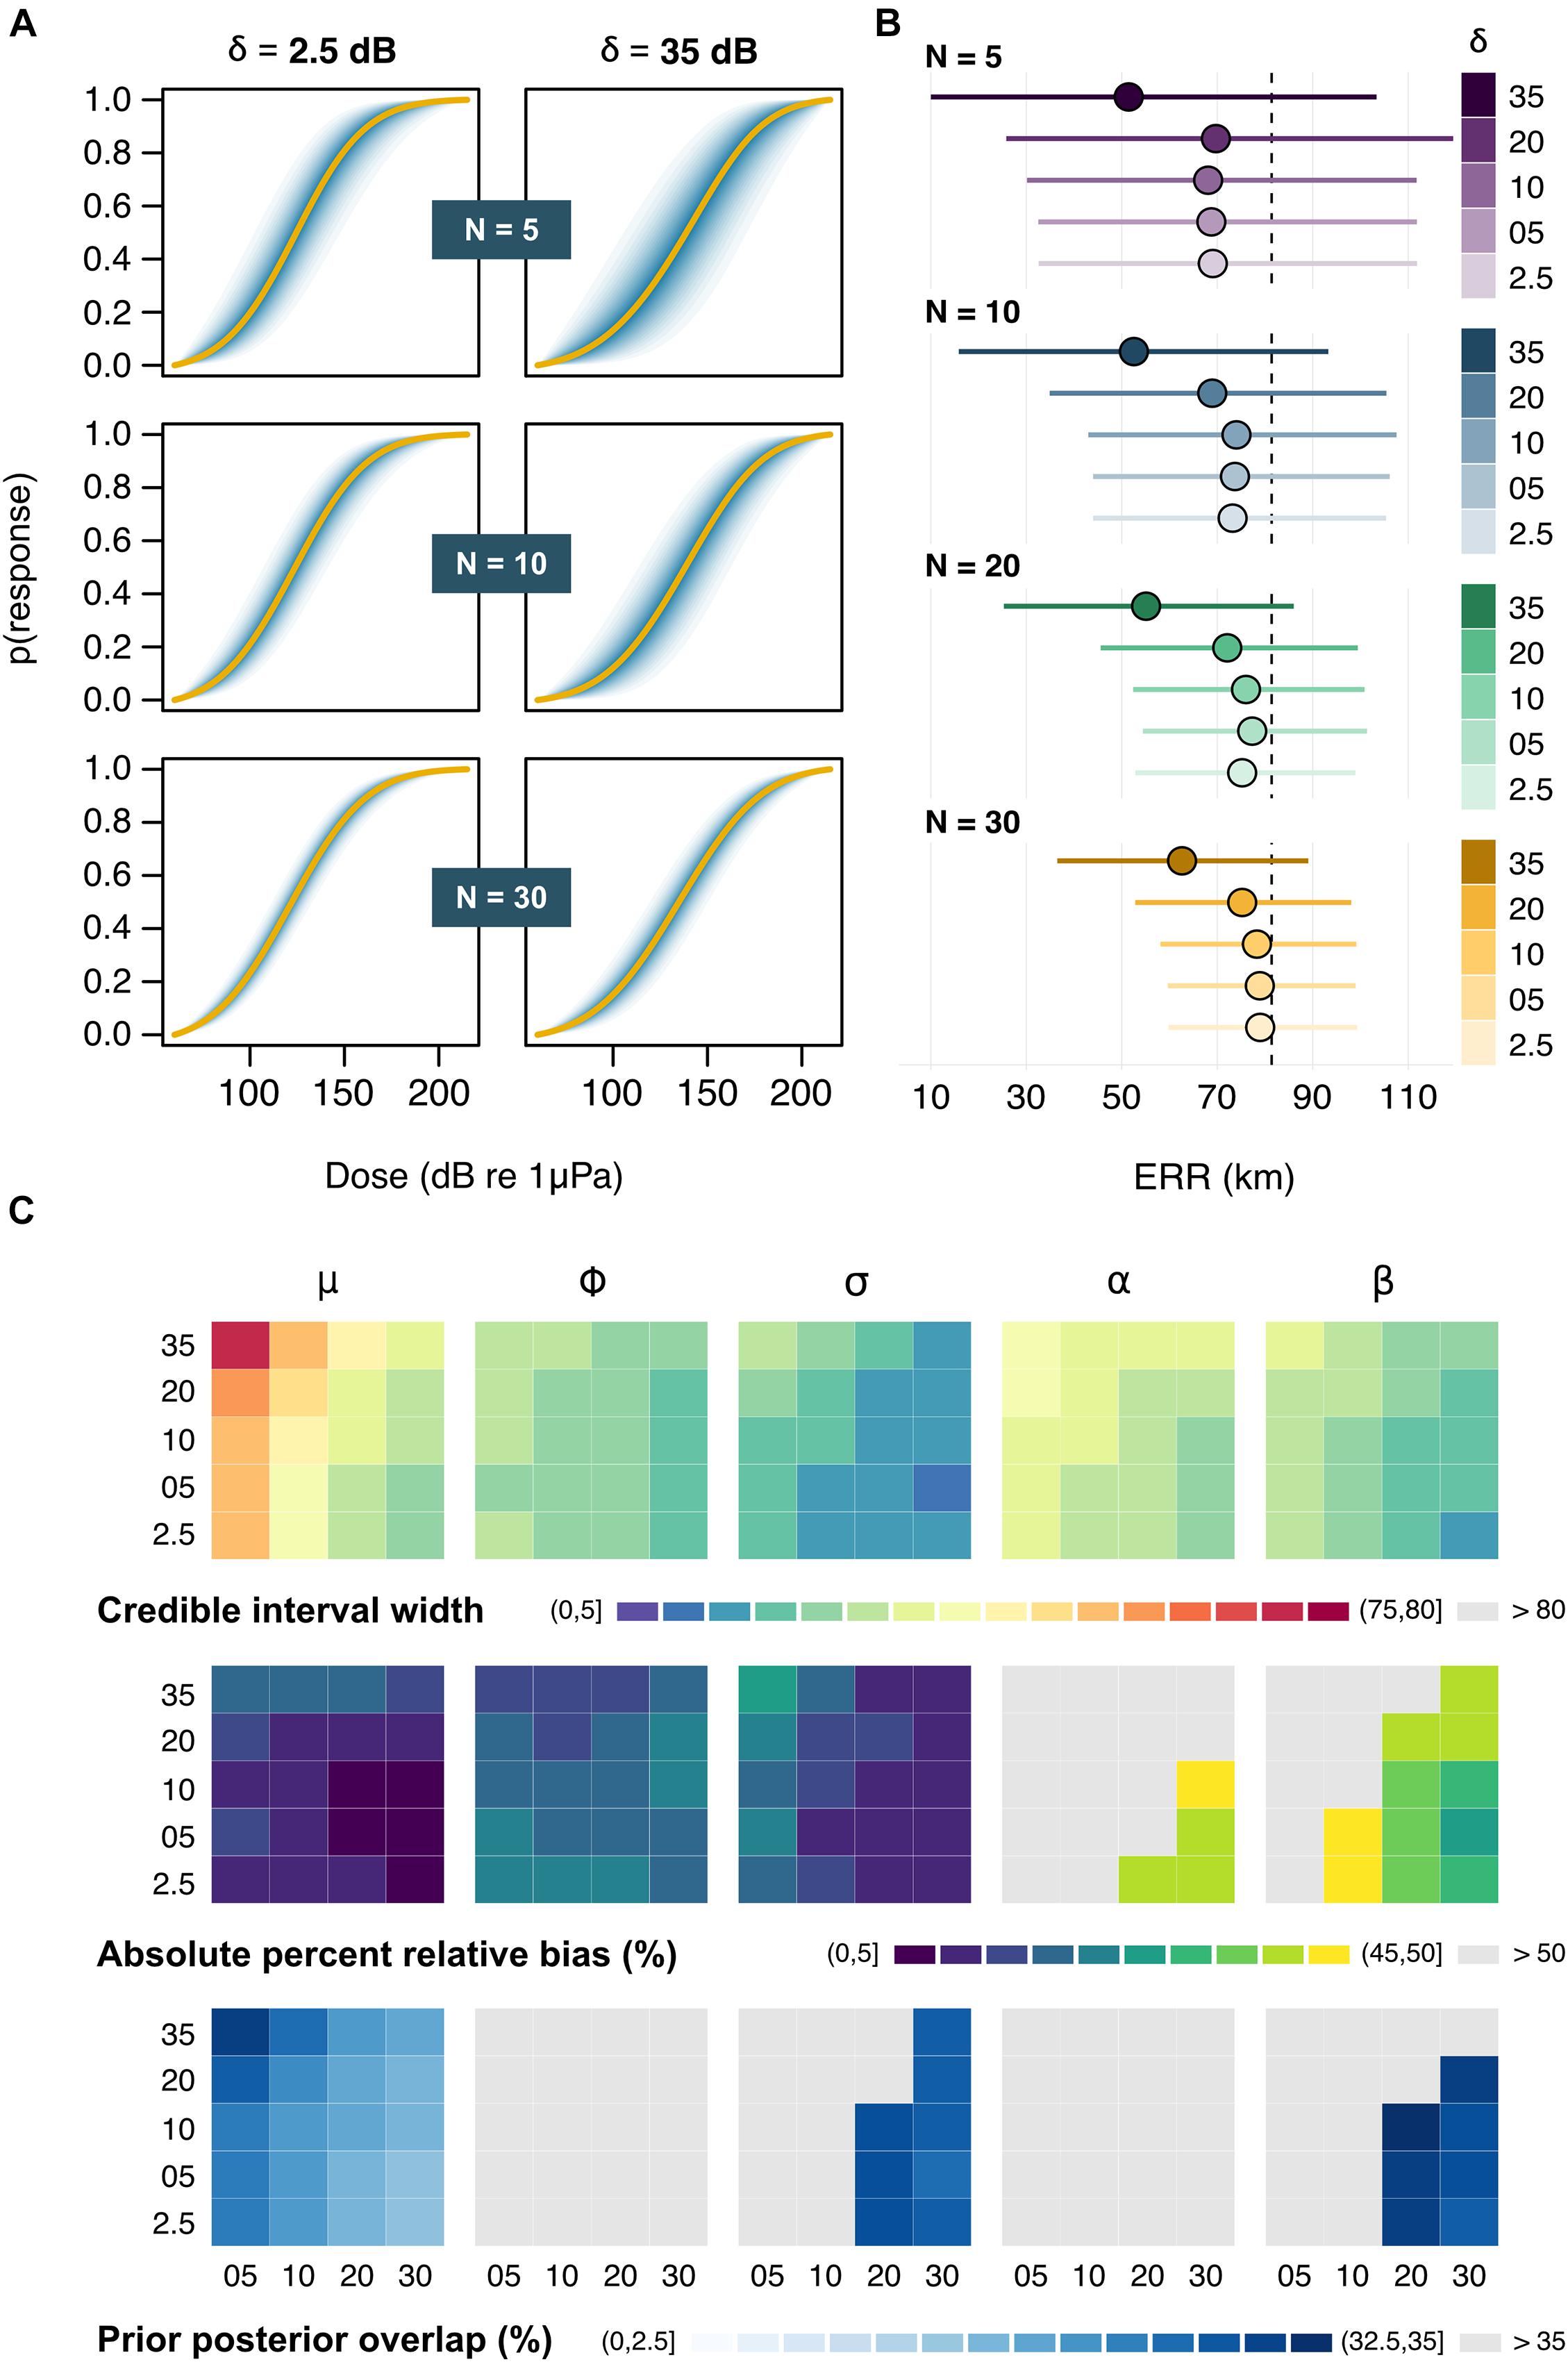
Figure 3. Outputs from the reduced model. (A) Example dose-response curves for a subset of sample sizes (N) and sampling errors (δ). Solid lines represent the average posterior medians across Ns = 100 simulations, followed by the average 5, 10, 15 … and 95% credible intervals in darker to lighter shades of blue. (B) Posterior estimates of the effective response range (ERR). Circles and bars respectively denote the average posterior median and credible intervals for each N × δ combination. The dashed line marks the true underlying value. (C) Summary of patterns in the precision, accuracy, and identifiability of posterior estimates across N (across) × δ (down) combinations. Results are shown (from left to right) for the location parameter relating to the mean response threshold for all whales (μ), the scale parameters relating to the between-whale variation (phi) and the within-whale between-exposure variation (σ), and the two contextual covariates (α and β). Rows indicate the average posterior credible interval width (in dB) [top], absolute percent relative bias (in %) [middle], and prior posterior overlap (PPO, in %) [bottom]. PPO values above 35% indicate that parameters may be non-identifiable (2011).
Full Model
The dose-response curves obtained from the full model were sensitive to variation in N but not PS–TAG, such that sample size became the dominant driver of posterior inference when multiple tag types were used (Figure 4A and Supplementary Figure 3). Bias in estimates of μ remained low in all scenarios, even when every simulated individual carried a S-TAG (PS–TAG = 100%; average ± SD: 3.67 ± 0.84 dB) (Supplementary Figure 4). Likewise, tag choice had a negligible influence on the precision of μ for a given sample size. By contrast, posterior credible intervals were halved when sampling effort increased from N = 5 to N = 30 whales (average ratio ± SD: 0.44 ± 0.075 dB), as was the range of plausible predictions of the ERR, which decreased from 32–114 km to 58–99 km, respectively (Figure 4B). On average, the model only detected an effect of exposure history in 5.5 ± 5.3% of simulations. At N = 30, the effect of sonar frequency (beta) was correctly detected in more than 50% of runs (overall average ± SD: 29.6 ± 20.0%). Patterns in parameter identifiability largely mirrored those observed in the reduced model (Figure 4C).
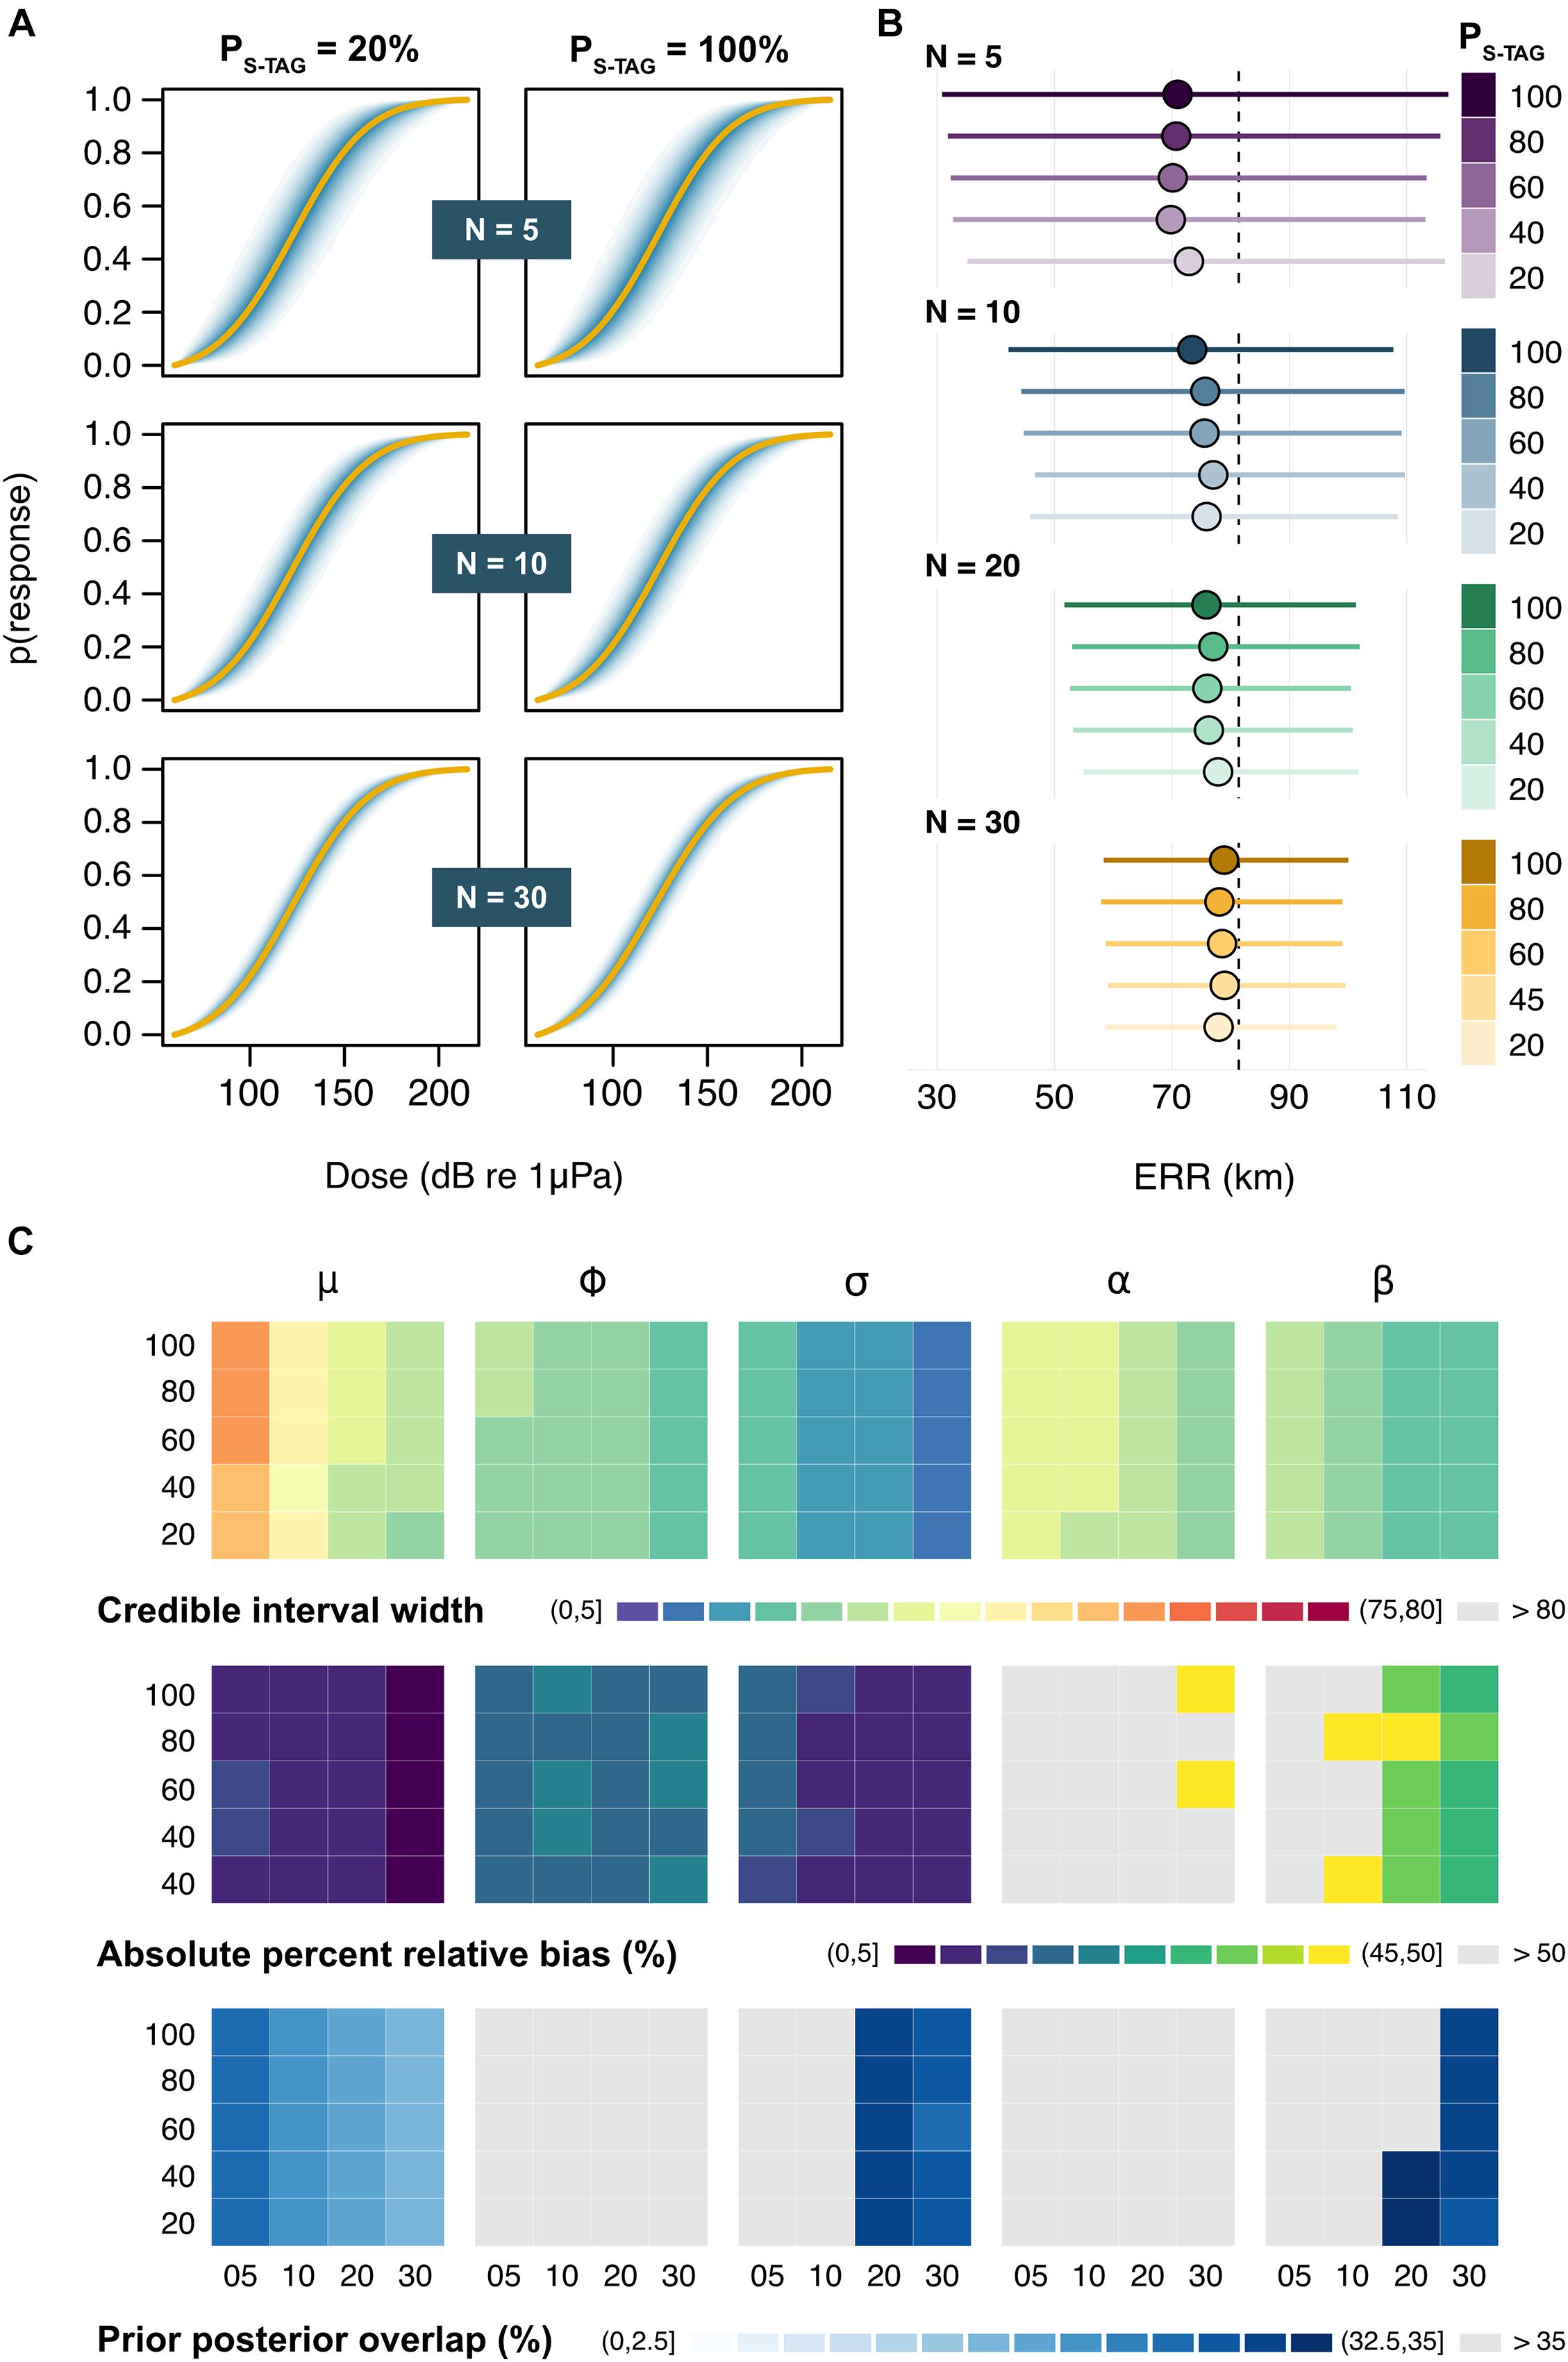
Figure 4. Outputs from the full model. (A) Example dose-response curves for a subset of sample sizes (N) and ratios of satellite tags (PS–TAG). Solid lines represent the average posterior medians across Ns = 100 simulations, followed by the average 5, 10, 15 … and 95% credible intervals in darker to lighter shades of blue. (B) Posterior estimates of the effective response range (ERR). Circles and bars respectively denote the average posterior median and credible intervals for each N × PS–TAG combination. The dashed line marks the true underlying value. (C) Summary of patterns in the precision, accuracy, and identifiability of posterior estimates across N (across) × PS–TAG (down) combinations. Results are shown (from left to right) for the location parameter relating to mean response threshold for all whales (μ), the scale parameters relating to the between-whale variation (ϕ) and the within-whale between-exposure variation (σ), and the two contextual covariates (α and β). Rows indicate the average posterior credible interval width (in dB) [top], absolute percent relative bias (in %) [middle], and prior posterior overlap (PPO, in %) [bottom]. PPO values above 35% indicate that parameters may be non-identifiable (Gimenez et al., 2009).
Discussion
Over two decades of BRSs on the effects of military sonar have now been funded by the world’s navies, allowing major strides in our understanding of the impacts of man-made noise on free-ranging cetaceans (Harris et al., 2016, 2018; Southall et al., 2016). While the pathways leading to physical injury and mortality are not yet fully resolved (Hooker et al., 2019), individual behavioral change has been highlighted as a pivotal symptom of sonar-related disturbance (DeRuiter et al., 2013; Southall et al., 2019). In the last 75 years, engineers and marine mammal scientists have come up with creative technological solutions to assess the behavior (e.g., spatial movements, call rates, diving patterns, group dynamics) of whales and dolphins before, during, and after sound exposure (Nowacek et al., 2016). Static passive acoustic platforms, for instance, have played a prominent role in BACI studies of shallow nearshore and shelf ecosystems, where numerous cetacean populations co-occur with human activities (e.g., Risch et al., 2012; Sarnocińska et al., 2020). Many BRSs also focus on deep-diving oceanic species in offshore habitats, where the onerous costs of running dedicated CEEs (i.e., often in excess of several US$ 100,000 for a single season) (Harris et al., 2016) provide a strong impetus for integrating multiple sampling approaches, including visual focal follows and combinations of archival biologging and near real-time biotelemetry (Berga et al., 2019; von Benda-Beckmann et al., 2019). However, commonly used animal-borne tags like DTAGs and S-TAGs capture ecological processes on fundamentally different spatio-temporal scales (Hazen et al., 2012), and generate data burdened with varying levels of uncertainty. For example, estimates of received sound levels from DTAGs are typically obtained with higher precision than on S-TAGs, especially when the latter operate through the Argos system (Costa et al., 2010; Irvine et al., 2020). At present, it is unclear how sampling uncertainty from the use of different instruments propagates into metrics of risk as used in decision-making. Here, we took advantage of an existing Bayesian hierarchical model to address this question and investigate the implications of tag choice for estimating probabilistic dose-response functions (Miller et al., 2014; Tyack and Thomas, 2019).
Our results highlight the importance of considering sample size in studies of sonar impacts on free-ranging cetaceans, and illustrate how larger datasets can deliver consistent improvements in accuracy and precision irrespective of tag choice. Obtaining reliable estimates of the location and scale parameters that relate to the mean threshold of response (μ) and its associated variance components (σ and ϕ) is essential, as it is these that define the position and steepness of the cumulative distribution function on which dose-response curves are based. As such, any biases in model parameters may undermine assessments of risk and lead to errors that can misguide decision-making. For instance, the limited information available when N is low means that posterior estimates for μ will be pulled away from the true threshold of response (here, μ = 120 dB re 1 μPa) toward the prior mean (here, μ = 135 dB re 1μPa). If the latter exceeds the former, then impact zones from sonar transmissions will be consistently underestimated (Figures 3, 4). Conversely, impact will be overestimated if the prior mean is lower than the true response threshold. When paired with adequate controls and baselines, larger datasets may also help differentiate among-individual from within-individual heterogeneity, and facilitate their separation from the proximate drivers that control reactions to sound (Cleasby et al., 2015; Dunlop et al., 2018). There is compelling evidence that many factors (other than received sound levels) affect the onset and severity of behavioral responses (Ellison et al., 2012; Gomez et al., 2016; Harris et al., 2018; Southall et al., 2019). These include (1) intrinsic traits, such as hearing sensitivity, noise tolerance, activity and motivational states at the time of exposure, age, sex, or the presence of dependent offspring, as well as (2) extrinsic elements, such as the nature of the sound (e.g., frequency band) (Isojunno et al., 2018), or the spatial relationship between emitter and receiver (e.g., motion, depth, and proximity of the sound source). Some of the most dramatic responses to underwater noise reported to date appear to have been from naïve, free-ranging individuals at very low received levels (90–120 dB re 1 Pa rms) (Finley et al., 1990), suggesting that acoustic novelty and previous history of exposure may also play a decisive role. However, efforts to appropriately assess the potential for sensitisation and habituation are complicated by the variety of timescales over which exposures may occur—from a few hours in the context of CEEs to upwards of several days or weeks during real military operations—and the lack of a standardized metric of individual experience or familiarity with sonar sounds over a range of relevant time periods (Gomez et al., 2016). Our model was rarely successful at recovering the influence of exposure history (α) in the simulations, likely because of the small effect size for this covariate relative to the overall level of variability present in the data. In the absence of appropriate empirical measurements, our choice of parameterisation for α was ultimately arbitrary, yet it points to the need to further consider statistical power in analyses of sonar effects. Modest changes in response thresholds and the behavior of individual whales associated with disturbance can have population-level consequences (e.g., through reduced energy intake, Benoit-Bird et al., 2020), but these may go undetected without adequate sample sizes.
It is important to note that the ability to tease apart the effects of contextual factors from tags that cannot directly measure sound is predicated on the assumptions made regarding acoustic transmission loss. Simple transmission loss models may not accurately predict received levels from a sonar source to a free-diving animal (Wensveen, 2012), leading to substantial uncertainties and biases in the impact assessment process (Farcas et al., 2016). This is particularly the case in oceanographically dynamic habitats and over convoluted seabed terrain, where depth-mediated changes in sound profiles can manifest throughout the water column (Siderius and Porter, 2006; Schick et al., 2019; von Benda-Beckmann et al., 2019). Accounting for fine-scale variations in sound profiles is a complicated problem to tackle which requires the development of sophisticated sound propagation models, not all of which perform well in areas different to the ones in which they were built (Siderius and Porter, 2006). Using a propagation model was outside the scope of the present study and would have undermined the applicability of our results, constraining inference to a narrow range of environmental conditions (e.g., bathymetry, ocean currents) with limited value for management. For simplicity and generality, we thus assumed that sonar pings propagated away from the source uniformly in all directions along the horizontal plane (i.e., spherical spreading). While this is clearly a simplification of the sound field, evidence suggests that it may provide a reasonable approximation of noise propagation in at least some homogeneous deep-water environments (Wensveen, 2012). Our estimates of variance in received levels at incremental distances from the source (Supplementary Figure 5) also align with the range of values reported in the literature, including in studies of beaked whales that did rely on sound propagation models within topographically complex shelf break habitats (Schick et al., 2019). This lends confidence that our simulation successfully captured realistic scenarios of sound exposure.
From the early days of the first DTAG deployments on single individuals, BRSs (and CEEs) have rapidly evolved into what are now fully multidisciplinary, multi-platform, operational field programs that capitalize on an array of remote sensing technologies to monitor animal behavior in complementary ways. By simulating specific sampling regimes involving several tag types, we were able to start evaluating how methodological decisions regarding tag selection may influence predictions of risk. We found that despite the occasionally high positional errors reported in previous satellite tracking studies (Tyack et al., 2011; Falcone et al., 2017; von Benda-Beckmann et al., 2019; Wensveen et al., 2019; Joyce et al., 2020), the average variability in the modeled acoustic dose experienced by whales carrying S-TAGs was sufficiently low to support the estimation of dose-response relationships (Supplementary Figure 5). This aligns with an expanding body of literature documenting the utility of satellite-transmitting tags for evaluating the impacts of anthropogenic sound on marine mammals (Tyack et al., 2011; Falcone et al., 2017; von Benda-Beckmann et al., 2019; Wensveen et al., 2019; Joyce et al., 2020), in complement to other tools. In our example, similar estimates of the ERR were obtained on average from a sample of N = 20 whales with DTAGs (assuming a fixed measurement error of δ = 2.5 dB) as from a sample of N = 30 whales all carrying S-TAGs (unless uplinks were consistently poor) (Figures 3, 4). This type of comparative assessment is not only useful for planning future survey effort but also for framing expectations about the realm of inference that is attainable given existing datasets. A key assumption, however, is that responses are comparable and detection rates equal between tag types. This is an important caveat, as the energetic costs associated with sonar disturbance vary with the nature and strength of behavioral responses, and are a function of species’ life histories and physiologies (Czapanskiy et al., 2021). For example, the relative energy expenditure of a blue whale exhibiting a “mild” foraging response has been shown to exceed that of an “extreme” flight response in Cuvier’s beaked whales (Czapanskiy et al., 2021). Failure to detect weak responses, or responses of a particular type, on instruments that deliver coarser-resolution data like S-TAGs would lead to bias in estimates of the dose-response functions and thus assessments of biological impacts. An additional issue is that the accuracy of Argos locations has been shown to be site- and species-specific, and mediated by both diving patterns and the positioning of the tag on the animal’s body (Mul et al., 2019). For instance, Costa et al. (2010) and Irvine et al. (2020) provided evidence that drifts in the frequency of tag transmissions at cold temperatures may be responsible for higher levels of errors in animals undergoing deep, long-duration dives like sperm whales or northern elephant seals (Mirounga angustirostris)—and thus presumably beaked whales. Given the above, our estimates likely remain conservative and are strictly only relevant within the bounds of error recorded on tags deployed on Z. cavirostris (as part of the Atlantic BRS study), particularly as further work is required to validate our results with other species in different environments. That said, we anticipate that any disparities in performance between taxa or between instruments will quickly narrow in the near future given the enormous advances in telemetry systems that have been accomplished in recent years (e.g., higher numbers of polar-orbiting satellites, better sensitivity of satellite sensors, longer transmitter battery life, more streamlined tag shapes). Already, the accuracy of tags enabled with Fastloc-GPS surpasses conventional Argos tracking systems by several orders of magnitude (Dujon et al., 2014), leading to an exponentially rising volume of telemetry data of constantly improving quality. Similarly, much research is being directed at improving current methods for the characterisation of behavioral change,3 and engineering efforts to enhance tag adhesion and augment the array of onboard electronics available are expected to facilitate a new generation of longer-lasting, data-rich DTAG and S-TAG attachments that can yield novel insights into not only the levels of noise required to elicit behavioral responses, but also the physiological mechanisms through which these responses may cause harm (Nowacek et al., 2013; Hooker et al., 2019). Further improvements to our modeling framework are also possible and may entail: (i) the inclusion of a formal detection process, which acknowledges that behavioral responses are harder to detect from coarser-resolution data and lead to a larger proportion of censored observations on S-TAGs relative to DTAGs, (ii) the use of dedicated sound propagation models to better represent the range of received levels which whales are likely to experience, (iii) the addition of a depth component to map received levels in three dimensions, (iv) correlated patterns of satellite uplink quality for animals fitted with S-TAGs, (iv) different model parameterisations (e.g., prior choice). We have made our code freely available to support these efforts.
Conclusion
Determining how cetaceans react to manmade underwater noise is vital for making informed decisions about what may constitute acceptable levels of risk to species from sound-producing activities. A significant challenge in studies of cetacean exposure to military sonar lies in teasing out pattern from noise within complex datasets gathered using instruments that are subject to varying degrees of measurement error. Very few BRSs consider how sample size and tag choice may affect statistical power (Dunlop et al., 2012; Cato et al., 2016), yet understanding how these two elements interact to shape ecological inference is essential in delivering robust estimates of uncertainty that can help managers adhere to precautionary principles in the face of many unknowns. We demonstrated that clear improvements in the accuracy and precision of parameter estimates from a Bayesian hierarchical dose-response model are possible with increased sample sizes, largely independently of tag choice (DTAG vs. S-TAG). Thus, substantial advances in our capacity to predict sonar impacts on cetaceans are likely to be made in the future as collaborative efforts to conduct multi-platform BRSs continue to persist in earnest.
Data Availability Statement
The R code used in the analyses is fully described and available on GitHub (https://github.com/pjbouchet/brs_uncertainty). The Argos data are confidential and cannot presently be made available.
Author Contributions
LT designed the underlying hierarchical model. CH and LT conceived the simulation study and provided expert advice to guide parameter choice, with input from PB. PB performed the analyses, wrote the R code, and led the writing of the manuscript, with contributions from the other authors. All authors contributed to the article and approved the submitted version.
Funding
This work was financially supported by the US Navy Living Marine Resources Program (LMR) Contract No. N3943018C2080. Support for the Atlantic BRS project was provided by the Naval Facilities Engineering Command Atlantic under Contract No. N62470-15-D-8006, Task Order 18F4036, Issued to HDR, Inc.
Conflict of Interest
The authors declare that the research was conducted in the absence of any commercial or financial relationships that could be construed as a potential conflict of interest.
Publisher’s Note
All claims expressed in this article are solely those of the authors and do not necessarily represent those of their affiliated organizations, or those of the publisher, the editors and the reviewers. Any product that may be evaluated in this article, or claim that may be made by its manufacturer, is not guaranteed or endorsed by the publisher.
Acknowledgments
We are grateful to Rob Schick and the Atlantic BRS project for providing the Argos ellipse data. We thank two reviewers for their thoughtful comments on an earlier draft of the manuscript.
Supplementary Material
The Supplementary Material for this article can be found online at: https://www.frontiersin.org/articles/10.3389/fmars.2021.674554/full#supplementary-material
Footnotes
- ^ https://www.argos-system.org/
- ^ https://sea-inc.net/science/atlantic-brs/
- ^ See https://github.com/r-glennie/CTMCdive for an example.
References
Aguilar Soto, N., Johnson, M., Madsen, P. T., Tyack, P. L., Bocconcelli, A., and Fabrizio Borsani, J. (2006). Does intense ship noise disrupt foraging in deep-diving Cuvier’s beaked whales (Ziphius cavirostris)? Mar. Mamm. Sci. 22, 690–699. doi: 10.1111/j.1748-7692.2006.00044.x
Andrews, R. D., Baird, R. W., Calambokidis, J., Goertz, C. E. C., Gulland, F., Heide-Jørgensen, M. P., et al. (2019). Best practice guidelines for cetacean tagging. J. Cetacean Res 20, 27–66.
Antunes, R., Kvadsheim, P. H., Lam, F. P. A., Tyack, P. L., Thomas, L., Wensveen, P. J., et al. (2014). High thresholds for avoidance of sonar by free-ranging long-finned pilot whales (Globicephala melas). Mar. Pollut. Bull. 83, 165–180. doi: 10.1016/j.marpolbul.2014.03.056
Benoit-Bird, K. J., Southall, B. L., Moline, M. A., Claridge, D. E., Dunn, C. A., Dolan, K. A., et al. (2020). Critical threshold identified in the functional relationship between beaked whales and their prey. Mar. Ecol. Prog. Ser. 654, 1–16. doi: 10.3354/meps13521
Berga, A. S., Trickey, J. S., Rice, A., Široviæ, A., Roch, M. A., Paxton, C. G., et al. (2019). Potential impact of mid-frequency active sonar on whales from passive acoustic monitoring data. J. Acoust. Soc. Am. 146, 2939–2939. doi: 10.1121/1.5137205
Bernaldo de Quirós, Y., Fernandez, A., Baird, R. W., Brownell, R. L. Jr., Aguilar de Soto, N., Allen, D., et al. (2019). Advances in research on the impacts of anti-submarine sonar on beaked whales. Proc. Biol. Sci. 286:20182533. doi: 10.1098/rspb.2018.2533
Bouchet, P. J., Harris, C. M., and Thomas, L. (2020). Simulating Cetacean Responses to Sonar Exposure within a Bayesian Hierarchical Modelling Framework — R code Description. St Andrews: University of St Andrews.
Cato, D. H., Dunlop, R. A., Noad, M. J., McCauley, R. D., Kniest, E., Paton, D., et al. (2016). Addressing challenges in studies of behavioral responses of whales to noise. Adv. Exp. Med. Biol. 875, 145–152. doi: 10.1007/978-1-4939-2981-8_17
Chou, E., Southall, B. L., Robards, M., and Rosenbaum, H. C. (2021). International policy, recommendations, actions and mitigation efforts of anthropogenic underwater noise. Ocean Coast. Manag. 202:105427. doi: 10.1016/j.ocecoaman.2020.105427
Cleasby, I. R., Nakagawa, S., and Schielzeth, H. (2015). Quantifying the predictability of behaviour: statistical approaches for the study of between-individual variation in the within-individual variance. Methods Ecol. Evol. 6, 27–37. doi: 10.1111/2041-210x.12281
Costa, D. P., Robinson, P. W., Arnould, J. P. Y., Harrison, A.-L., Simmons, S. E., Hassrick, J. L., et al. (2010). Accuracy of ARGOS locations of pinnipeds at-sea estimated using Fastloc GPS. PLoS One 5:e8677. doi: 10.1371/journal.pone.0008677
Curé, C., Isojunno, S., Siemensma, M. L., Wensveen, P. J., Buisson, C., Sivle, L. D., et al. (2021). Severity scoring of behavioral responses of sperm whales (Physeter macrocephalus) to novel continuous versus conventional pulsed active sonar. J. Mar. Sci. Eng. 9:444. doi: 10.3390/jmse9040444
Curtis, K. A., Falcone, E. A., Schorr, G. S., Moore, J. E., Moretti, D. J., Barlow, J., et al. (2020). Abundance, survival, and annual rate of change of Cuvier’s beaked whales (Ziphius cavirostris) on a Navy sonar range. Mar. Mamm. Sci. 37, 399–419. doi: 10.1111/mms.12747
Czapanskiy, M. F., Savoca, M. S., Gough, W. T., Segre, P. S., Wisniewska, D. M., Cade, D. E., et al. (2021). Modelling short-term energetic costs of sonar disturbance to cetaceans using high-resolution foraging data. J. Appl. Ecol. 58, 1643–1657. doi: 10.1111/1365-2664.13903
D’Amico, A., Gisiner, R. C., Ketten, D. R., Hammock, J. A., Johnson, C., Tyack, P. L., et al. (2009). Beaked whale strandings and naval exercises. Aquat. Mamm. 35, 452–472. doi: 10.1578/AM.35.4.2009.452
D’Amico, A., and Pittenger, R. (2009). A brief history of active sonar. Aquat. Mamm. 35, 426–434. doi: 10.1578/AM.35.4.2009.426
DeRuiter, S. L., Southall, B. L., Calambokidis, J., Zimmer, W. M. X., Sadykova, D., Falcone, E. A., et al. (2013). First direct measurements of behavioural responses by Cuvier’s beaked whales to mid-frequency active sonar. Biol. Lett. 9:20130223. doi: 10.1098/rsbl.2013.0223
Duarte, C. M., Chapuis, L., Collin, S. P., Costa, D. P., Devassy, R. P., Eguiluz, V. M., et al. (2021). The soundscape of the Anthropocene ocean. Science 371:eaba4658. doi: 10.1126/science.aba4658
Dujon, A. M., Lindstrom, R. T., and Hays, G. C. (2014). The accuracy of Fastloc-GPS locations and implications for animal tracking. Methods Ecol. Evol. 5, 1162–1169. doi: 10.1111/2041-210x.12286
Dunlop, R. A., Noad, M. J., and Cato, D. H. (2012). Behavioral-response studies: problems with statistical power. Adv. Exp. Med. Biol. 730, 293–297. doi: 10.1007/978-1-4419-7311-5_65
Dunlop, R. A., Noad, M. J., McCauley, R. D., Kniest, E., Slade, R., Paton, D., et al. (2018). A behavioural dose-response model for migrating humpback whales and seismic air gun noise. Mar. Pollut. Bull. 133, 506–516. doi: 10.1016/j.marpolbul.2018.06.009
Durbach, I., Harris, C., Martin, C., Helble, T. A., Henderson, E. E., Ierley, G., et al. (2021). Changes in the movement and calling behavior of minke whales (Balaenoptera acutorostrata) in response to navy training. Front. Mar. Sci. 8:660122. doi: 10.3389/fmars.2021.660122
Ellison, W. T., Southall, B. L., Clark, C. W., and Frankel, A. S. (2012). A new context-based approach to assess marine mammal behavioral responses to anthropogenic sounds. Conserv. Biol. 26, 21–28. doi: 10.1111/j.1523-1739.2011.01803.x
Erbe, C., Dunlop, R., and Dolman, S. (2018). “Effects of noise on marine mammals,” in Effects of Anthropogenic Noise on Animals, eds H. Slabbekoorn, R. J. Dooling, A. N. Popper, and R. R. Fay (New York, NY: Springer), 277–309. doi: 10.1007/978-1-4939-8574-6_10
Falcone, E. A., Schorr, G. S., Watwood, S. L., DeRuiter, S. L., Zerbini, A. N., Andrews, R. D., et al. (2017). Diving behaviour of Cuvier’s beaked whales exposed to two types of military sonar. R. Soc. Open Sci. 4:170629. doi: 10.1098/rsos.170629
Farcas, A., Thompson, P. M., and Merchant, N. D. (2016). Underwater noise modelling for environmental impact assessment. Environ. Impact Assess. Rev. 57, 114–122. doi: 10.1016/j.eiar.2015.11.012
Faulkner, R. C., Farcas, A., and Merchant, N. D. (2018). Guiding principles for assessing the impact of underwater noise. J. Appl. Ecol. 55, 2531–2536. doi: 10.1111/1365-2664.13161
Fernández, A., Sierra, E., Martín, V., Méndez, M., Sacchinni, S., de Quirós, Y. B., et al. (2012). Last “atypical” beaked whales mass stranding in the Canary Islands (July, 2004). J. Mar. Sci. Res. Dev. 2, 1–3. doi: 10.4172/2155-9910.1000107
Filadelfo, R., Mintz, J., Michlovich, E., D’Amico, A., Tyack, P. L., and Ketten, D. R. (2009). Correlating military sonar use with beaked whale mass strandings: what do the historical data show? Aquat. Mamm. 35, 435–444. doi: 10.1578/AM.35.4.2009.435
Finley, K. J., Miller, G. W., Davis, R. A., and Greene, C. R. (1990). Reactions of belugas, Delphinapterus leucas, and narwhals, Monodon monoceros, to ice-breaking ships in the Canadian high arctic. Can. Bull. Fish. Aquat. Sci./Bull. Can. Sci. Halieut. Aquat. 224, 97–117.
Friedlaender, A. S., Hazen, E. L., Goldbogen, J. A., Stimpert, A. K., Calambokidis, J., and Southall, B. L. (2016). Prey-mediated behavioral responses of feeding blue whales in controlled sound exposure experiments. Ecol. Appl. 26, 1075–1085. doi: 10.1002/15-0783
Gimenez, O., Morgan, B. J. T., and Brooks, S. P. (2009). “Weak identifiability in models for mark-recapture-recovery data,” in Modeling Demographic Processes in Marked Populations, eds D. L. Thomson, E. G. Cooch, and M. J. Conroy (Boston, MA: Springer US), 1055–1067. doi: 10.1007/978-0-387-78151-8_48
Goldbogen, J. A., Southall, B. L., DeRuiter, S. L., Calambokidis, J., Friedlaender, A. S., Hazen, E. L., et al. (2013). Blue whales respond to simulated mid-frequency military sonar. Proc. R. Soc. Lond. B Biol. Sci. 280:20130657. doi: 10.1098/rspb.2013.0657
Gomez, C., Lawson, J. W., Wright, A. J., Buren, A. D., Tollit, D., and Lesage, V. (2016). A systematic review on the behavioural responses of wild marine mammals to noise: the disparity between science and policy. Can. J. Zool. 94, 801–819. doi: 10.1139/cjz-2016-0098
Harris, C. M., Martin, S. W., Martin, C., Helble, T. A., Henderson, E. E., Paxton, C. G. M., et al. (2019b). Changes in the spatial distribution of acoustically derived minke whale (Balaenoptera acutorostrata) tracks in response to Navy training. Aquat. Mamm. 45, 661–674.
Harris, C. M., Burt, M. L., Allen, A. N., Wensveen, P. J., Miller, P. J. O., and Sivle, L. D. (2019a). Foraging behavior and disruption in blue, fin, and humpback whales in relation to sonar exposure: the challenges of generalizing responsiveness in species with high individual variability. Aquat. Mamm. 45, 646–660. doi: 10.1578/AM.45.6.2019.646
Harris, C. M., Sadykova, D., DeRuiter, S. L., Tyack, P. L., Miller, P. J. O., Kvadsheim, P. H., et al. (2015). Dose response severity functions for acoustic disturbance in cetaceans using recurrent event survival analysis. Ecosphere 6:art236. doi: 10.1890/ES15-00242.1
Harris, C. M., Thomas, L., and Falcone, E. A. (2018). Marine mammals and sonar: dose-response studies, the risk-disturbance hypothesis and the role of exposure context. J Appl. Ecol. 55, 396–404. doi: 10.1111/1365-2664.12955
Harris, C. M., Thomas, L., Sadykova, D., DeRuiter, S. L., Tyack, P. L., Southall, B. L., et al. (2016). The challenges of analyzing behavioral response study data: an overview of the MOCHA (Multi-study OCean Acoustics Human Effects Analysis) project. Adv. Exp. Med. Biol. 875, 399–407. doi: 10.1007/978-1-4939-2981-8_47
Hazen, E. L., Maxwell, S. M., Bailey, H., Bograd, S. J., Hamann, M., Gaspar, P., et al. (2012). Ontogeny in marine tagging and tracking science: technologies and data gaps. Mar. Ecol. Prog. Ser. 457, 221–240. doi: 10.3354/meps09857
Hooker, S. K., De Soto, N. A., Baird, R. W., Carroll, E. L., Claridge, D., Feyrer, L., et al. (2019). Future directions in research on beaked whales. Front. Mar. Sci. 5:514. doi: 10.3389/fmars.2018.00514
Houser, D. S., Martin, S. W., and Finneran, J. J. (2013). Exposure amplitude and repetition affect bottlenose dolphin behavioral responses to simulated mid-frequency sonar signals. J. Exp. Mar. Bio. Ecol. 443, 123–133. doi: 10.1016/j.jembe.2013.02.043
Irvine, L. M., Winsor, M. H., Follett, T. M., Mate, B. R., and Palacios, D. M. (2020). An at-sea assessment of Argos location accuracy for three species of large whales, and the effect of deep-diving behavior on location error. Anim. Biotelem. 8:20. doi: 10.1186/s40317-020-00207-x
Isojunno, S., Aoki, K., Curé, C., Kvadsheim, P. H., and Miller, P. J. O. (2018). Breathing patterns indicate cost of exercise during diving and response to experimental sound exposures in long-finned pilot whales. Front. Physiol. 9:1462. doi: 10.3389/fphys.2018.01462
Isojunno, S., Cure, C., Kvadsheim, P. H., Lam, F.-P. A., Tyack, P. L., Wensveen, P. J., et al. (2016). Sperm whales reduce foraging effort during exposure to 1-2 kHz sonar and killer whale sounds. Ecol. Appl. 26, 77–93. doi: 10.1890/15-0040
Johnson, M., Aguilar de Soto, N., and Madsen, P. T. (2009). Studying the behaviour and sensory ecology of marine mammals using acoustic recording tags: a review. Mar. Ecol. Prog. Ser. 395, 55–73. doi: 10.3354/meps08255
Johnson, M. P., and Tyack, P. L. (2003). A digital acoustic recording tag for measuring the response of wild marine mammals to sound. IEEE J. Ocean. Eng. 28, 3–12. doi: 10.1109/JOE.2002.808212
Joyce, T. W., Durban, J. W., Claridge, D. E., Dunn, C. A., Fearnbach, H., Parsons, K. M., et al. (2017). Physiological, morphological, and ecological tradeoffs influence vertical habitat use of deep-diving toothed-whales in the Bahamas. PLoS One 12:e0185113. doi: 10.1371/journal.pone.0185113
Joyce, T. W., Durban, J. W., Claridge, D. E., Dunn, C. A., Hickmott, L. S., Fearnbach, H., et al. (2020). Behavioral responses of satellite tracked Blainville’s beaked whales (Mesoplodon densirostris) to mid-frequency active sonar. Mar. Mamm. Sci. 36, 29–46. doi: 10.1111/mms.12624
McCarthy, M. A., and Masters, P. (2005). Profiting from prior information in Bayesian analyses of ecological data. J. Appl. Ecol. 42, 1012–1019. doi: 10.1111/j.1365-2664.2005.01101.x
McClintock, B. T., London, J. M., Cameron, M. F., and Boveng, P. L. (2015). Modelling animal movement using the Argos satellite telemetry location error ellipse. Methods Ecol. Evol. 6, 266–277. doi: 10.1111/2041-210X.12311
McConnell, B., Fedak, M., Hooker, S., and Patterson, T. (2010). “Telemetry,” in Marine Mammal Ecology and Conservation: A Handbook of Techniques, eds I. L. Boyd, W. D. Bowen, and S. J. Iverson (Oxford: Oxford University Press), 222–242.
Miller, P. J. O., Antunes, R. N., Wensveen, P. J., Samarra, F. I. P., Alves, A. C., Tyack, P. L., et al. (2014). Dose-response relationships for the onset of avoidance of sonar by free-ranging killer whales. J. Acoust. Soc. Am. 135, 975–993. doi: 10.1121/1.4861346
Miller, P. J. O., Kvadsheim, P. H., Lam, F.-P. A., Wensveen, P. J., Antunes, R., Alves, A. C., et al. (2012). The severity of behavioral changes observed during experimental exposures of killer (Orcinus orca), long-finned pilot (Globicephala melas), and sperm (Physeter macrocephalus) whales to naval sonar. Aquat. Mamm. 38, 362–401.
Moretti, D., Thomas, L., Marques, T., Harwood, J., Dilley, A., Neales, B., et al. (2014). A risk function for behavioral disruption of Blainville’s beaked whales (Mesoplodon densirostris) from mid-frequency active sonar. PLoS One 9:e85064. doi: 10.1371/journal.pone.0085064
Mul, E., Blanchet, M.-A., Biuw, M., and Rikardsen, A. (2019). Implications of tag positioning and performance on the analysis of cetacean movement. Anim. Biotelem. 7:11. doi: 10.1186/s40317-019-0173-7
New, L., Lusseau, D., and Harcourt, R. (2020). Dolphins and boats: when is a disturbance, disturbing? Front. Mar. Sci. 7:353. doi: 10.3389/fmars.2020.00353
Nicholls, D. G., Robertson, C. J. R., and Murray, M. D. (2007). Measuring accuracy and precision for CLS: argos satellite telemetry locations. Notornis 54, 137–157.
Nowacek, D., Bowers, M., Cannon, A., Hindell, M., Howle, L. E., Murray, M. M., et al. (2013). The next generation of multi-sensor acoustic tags: sensors, applications, and attachments. J. Acoust. Soc. Am. 134, 4043–4043. doi: 10.1121/1.4830757
Nowacek, D. P., Christiansen, F., Bejder, L., Goldbogen, J. A., and Friedlaender, A. S. (2016). Studying cetacean behaviour: new technological approaches and conservation applications. Anim. Behav. 120, 235–244. doi: 10.1016/j.anbehav.2016.07.019
Parsons, E. C. M. (2017). Impacts of Navy sonar on whales and dolphins: now beyond a smoking gun? Front. Mar. Sci. 4:295. doi: 10.3389/fmars.2017.00295
Plummer, M. (2003). JAGS: A Program for Analysis of Bayesian Graphical Models Using Gibbs Sampling. Available online at: http://citeseerx.ist.psu.edu/viewdoc/summary?doi=10.1.1.13.3406 (accessed January 4, 2021)
Quick, N. J., Cioffi, W. R., Shearer, J., and Read, A. J. (2019). Mind the gap—optimizing satellite tag settings for time series analysis of foraging dives in Cuvier’s beaked whales (Ziphius cavirostris). Anim. Biotelem. 7:5. doi: 10.1186/s40317-019-0167-5
Quick, N. J., Cioffi, W. R., Shearer, J. M., Fahlman, A., and Read, A. J. (2020). Extreme diving in mammals: first estimates of behavioural aerobic dive limits in Cuvier’s beaked whales. J. Exp. Biol. 223:jeb222109. doi: 10.1242/jeb.222109
R Core Team (2020). R: A Language and Environment for Statistical Computing. Vienna: R Foundation for Statistical Computing.
Risch, D., Corkeron, P. J., Ellison, W. T., and Van Parijs, S. M. (2012). Changes in humpback whale song occurrence in response to an acoustic source 200 km away. PLoS One 7:e29741. doi: 10.1371/journal.pone.0029741
Sarnocińska, J., Teilmann, J., Balle, J. D., van Beest, F. M., Delefosse, M., and Tougaard, J. (2020). Harbor porpoise (Phocoena phocoena) reaction to a 3D seismic airgun survey in the North Sea. Front. Mar. Sci. 6:824. doi: 10.3389/fmars.2019.00824
Schick, R. S., Bowers, M., DeRuiter, S., Friedlaender, A., Joseph, J., Margolina, T., et al. (2019). Accounting for positional uncertainty when modeling received levels for tagged cetaceans exposed to sonar. Aquat. Mamm. 45, 675–690. doi: 10.1578/AM.45.6.2019
Schorr, G. S., Baird, R. W., Hanson, M. B., Webster, D. L., McSweeney, D. J., and Andrews, R. D. (2009). Movements of satellite-tagged Blainville’s beaked whales off the island of Hawai‘i. Endanger. Species Res. 10, 203–213. doi: 10.3354/esr00229
Sequeira, A. M. M., Heupel, M. R., Lea, M.-A., Eguíluz, V. M., Duarte, C. M., Meekan, M. G., et al. (2019). The importance of sample size in marine megafauna tagging studies. Ecol. Appl. 29, e01947. doi: 10.1002/eap.1947
Shearer, J. M., Quick, N. J., Cioffi, W. R., Baird, R. W., Webster, D. L., Foley, H. J., et al. (2019). Diving behaviour of Cuvier’s beaked whales (Ziphius cavirostris) off Cape Hatteras, North Carolina. R. Soc. Open Sci. 6:181728. doi: 10.1098/rsos.181728
Siderius, M., and Porter, M. B. (2006). Modeling techniques for marine-mammal risk assessment. IEEE J. Ocean. Eng. 31, 49–60. doi: 10.1109/JOE.2006.872211
Sivle, L. D., Kvadsheim, P. H., Curé, C., Isojunno, S., Wensveen, P. J., Lam, F.-P. A., et al. (2015). Severity of expert-identified behavioural responses of humpback whale, minke whale, and northern bottlenose whale to naval sonar. Aquat. Mamm. 41, 469–502. doi: 10.1578/AM.41.4.2015.469
Sivle, L. D., Kvadsheim, P. H., Fahlman, A., Lam, F. P. A., Tyack, P. L., and Miller, P. J. O. (2012). Changes in dive behavior during naval sonar exposure in killer whales, long-finned pilot whales, and sperm whales. Front. Physiol. 3:400. doi: 10.3389/fphys.2012.00400
Sivle, L. D., Wensveen, P. J., Kvadsheim, P. H., Lam, F.-P. A., Visser, F., Curé, C., et al. (2016). Naval sonar disrupts foraging in humpback whales. Mar. Ecol. 562, 211–220. doi: 10.3354/meps11969
Southall, B. L., Bowles, A. E., Ellison, W. T., Finneran, J. J., Gentry, R. L., Greene, C. R., et al. (2007). Marine mammal noise-exposure criteria: initial scientific recommendations. Bioacoustics 17, 273–275. doi: 10.1080/09524622.2008.9753846
Southall, B. L., DeRuiter, S. L., Friedlaender, A., Stimpert, A. K., Goldbogen, J. A., Hazen, E., et al. (2019). Behavioral responses of individual blue whales (Balaenoptera musculus) to mid-frequency military sonar. J. Exp. Biol. 222:jeb190637. doi: 10.1242/jeb.190637
Southall, B. L., Moretti, D., Abraham, B., Calambokidis, J., DeRuiter, S. L., and Tyack, P. L. (2012). Marine mammal behavioral response studies in southern California: advances in technology and experimental methods. Mar. Technol. Soc. J. 46, 48–59. doi: 10.4031/mtsj.46.4.1
Southall, B. L., Nowacek, D. P., Miller, P. J. O., and Tyack, P. L. (2016). Experimental field studies to measure behavioral responses of cetaceans to sonar. Endanger. Species Res. 31, 293–315. doi: 10.3354/esr00764
Stimpert, A. K., DeRuiter, S. L., Southall, B. L., Moretti, D. J., Falcone, E. A., Goldbogen, J. A., et al. (2014). Acoustic and foraging behavior of a Baird’s beaked whale, Berardius bairdii, exposed to simulated sonar. Sci. Rep. 4:7031. doi: 10.1038/srep07031
Thomas, B., Holland, J. D., and Minot, E. O. (2012). Wildlife tracking technology options and cost considerations. Wildl. Res. 38, 653–663. doi: 10.1071/WR10211
Tyack, P. L., and Thomas, L. (2019). Using dose–response functions to improve calculations of the impact of anthropogenic noise. Aquat. Conserv. 29, 242–253. doi: 10.1002/aqc.3149
Tyack, P. L., Zimmer, W. M. X., Moretti, D., Southall, B. L., Claridge, D. E., Durban, J. W., et al. (2011). Beaked whales respond to simulated and actual navy sonar. PLoS One 6:e17009. doi: 10.1371/journal.pone.0017009
U.S. Navy (2019). Final Supplemental Environmental Impact Statement for Surveillance towed Array Sensor System Low Using Frequency Active Sonar. Philadelphia, PA: U.S. Navy.
von Benda-Beckmann, A. M., Wensveen, P. J., Prior, M., Ainslie, M. A., Hansen, R. R., Isojunno, S., et al. (2019). Predicting acoustic dose associated with marine mammal behavioural responses to sound as detected with fixed acoustic recorders and satellite tags. J. Acoust. Soc. Am. 145, 1401–1416. doi: 10.1121/1.5093543
Wensveen, P. (2012). The Effects of Sound Propagation and Avoidance Behaviour on Naval Sonar Levels Received by Cetaceans. Ph.D. thesis. St Andrews: University of St Andrews.
Wensveen, P., Isojunno, S., Hansen, R. R., von Benda-Beckmann, A. M., Kleivane, L., van IJsselmuide, S., et al. (2019). Northern bottlenose whales in a pristine environment respond strongly to close and distant navy sonar signals. Proc. R. Soc. Lond. B Biol. Sci. 286, 20182592. doi: 10.1098/rspb.2018.2592
Wensveen, P. J., Kvadsheim, P. H., Lam, F.-P. A., von Benda-Beckmann, A. M., Sivle, L. D., Visser, F., et al. (2017). Lack of behavioural responses of humpback whales (Megaptera novaeangliae) indicate limited effectiveness of sonar mitigation. J. Exp. Biol. 220, 4150–4161. doi: 10.1242/jeb.161232
Keywords: acoustics, dose-response, underwater noise, military sonar, beaked whales, Bayesian modelling and inference, sampling uncertainty
Citation: Bouchet PJ, Harris CM and Thomas L (2021) Assessing the Role of Sampling Uncertainty When Predicting Behavioral Responses of Tagged Cetaceans Exposed to Naval Sonar. Front. Mar. Sci. 8:674554. doi: 10.3389/fmars.2021.674554
Received: 01 March 2021; Accepted: 09 September 2021;
Published: 04 October 2021.
Edited by:
Edward Urban, Scientific Committee on Oceanic Research, United StatesReviewed by:
Stacy DeRuiter, Calvin University, United StatesJ. Lawson, Department of Fisheries and Oceans, Canada
Copyright © 2021 Bouchet, Harris and Thomas. This is an open-access article distributed under the terms of the Creative Commons Attribution License (CC BY). The use, distribution or reproduction in other forums is permitted, provided the original author(s) and the copyright owner(s) are credited and that the original publication in this journal is cited, in accordance with accepted academic practice. No use, distribution or reproduction is permitted which does not comply with these terms.
*Correspondence: Phil J. Bouchet, cGIyODJAc3QtYW5kcmV3cy5hYy51aw==