 Neda Gilannejad
 Francisco J. Moyano
 Gonzalo Martínez-Rodríguez
 Manuel Yúfera
- 1Departamento de Biología Marina y Acuicultura, Instituto de Ciencias Marinas de Andalucía, Consejo Superior de Investigaciones Científicas (ICMAN-CSIC), Cádiz, Spain
- 2Departamento de Biología y Geología, Facultad de Ciencias, Campus de Excelencia Internacional del Mar (CEI-MAR), Universidad de Almería, Almería, Spain
Understanding the daily digestive function could lead to more efficient feeding practices in the farmed fish species. In this work, the effect of several daily feeding protocols was assessed on the daily expression of the genes related to the circadian system (arntl1, clock, per1, and cry1), appetite (cck), nutrients hydrolysis (try1, ctrb1, pga, atp4a, cel, and amy2a), peptides transport (slc15a1), pH, and activity of key digestive (trypsin, chymotrypsin, amylase, 4C- and 7C-like lipases) and absorptive (alkaline phosphatase) enzymes in the gastrointestinal tract (GIT) of Senegalese sole (Solea senegalensis) juveniles. Some of the tested feeding protocols demonstrated a significant influence on the entrainment of the peripheral oscillator. The synchrony of slc15a1 and some digestive proenzymes with per1 in some of the experimental treatments could underline the role of clock genes in the regulation of these biological functions. Unlike gene expression of the digestive proenzymes wherein feeding protocol occasionally affected the temporal organization, the influence of this factor was determinant on the daily average production and/or circadian pattern of their activities. Daily pH was maintained at approximately neutral levels in all the GIT segments, and no pepsin activity was detected. Fish fed a single diurnal meal showed the lowest activity for all the studied enzymes, except for amylase, suggesting an insufficient utilization of the ingested nutrients. Higher amylase activity in this group, on the other hand, implies the possible activation of alternative compensatory metabolic pathways. Overall, our results pointed to the suitability of higher feeding frequencies, especially during dark hours, for the aquaculture production of this species.
Introduction
Sustainability and competitiveness of the aquaculture industry highly depend on efficiency of the feeding practice, which is responsible for most of the production cost (Boujard and Leatherland, 1992). In this sense, not only nutritional quality of the feeds, but also a deep knowledge of the target fish physiology is needed to uncover the age-dependent digestive requirements and capacities.
As many other physiological processes, the digestive function is driven by biological clocks (Sánchez-Vázquez and López-Olmeda, 2018). In vertebrates, circadian systems are formed by interlocked autoregulatory feedback loops, with positive (BMAL1/CLOCK) and negative (PER and CRY) elements, in an ~24-h period. Positive elements transactivate the genes from PER and CRY families, which their gradual accumulation represses the BMAL1/CLOCK transcription, closing the negative feedback loop (Muñoz and Baler, 2003; Ye et al., 2014). While light/dark cycle is the most powerful synchronizer of the central clock, feeding/fasting cycles strongly affect the peripheral oscillators, especially the liver (Damiola et al., 2000; Stokkan et al., 2001). Food anticipatory activity (FAA), which is controlled by food-trainable oscillators, optimizes the nutrient utilization, fitness, and growth, by modifications in behavior as well as in physiological and metabolic processes (Stephan, 2002; Strubbe and Van Dijk, 2002). Therefore, the study of daily rhythms of factors related to the digestive function and the circadian machinery may provide useful information to design daily feeding protocols that may be better synchronized with the fish potentials.
Digestion involves a series of spatial and temporal organization of food cues, physiological responses, and chemical modulators that are coordinated by complex neuronal, endocrine, and local mechanisms (Rønnestad et al., 2013). This process starts with food ingestion, hydrolysis by mechanical forces, and sequential secretion of enzymes and fluids, absorption, and motility. All these processes are interdependent and regulated by external factors (such as food availability, light/dark cycle, and temperature) and internal factors (such as hormones, metabolites, and other sensor molecules, signals) (Rønnestad et al., 2013; Isorna et al., 2017). Activity of the main digestive enzymes may be one of the most important parameters that determines the food utilization and adequacy to a given diet (Debnath et al., 2007; Mohanta et al., 2008). Only in few fish species, daily patterns of digestive enzymes and/or other factors determining the digestive functionality have been examined (Yúfera et al., 2012; Mata-Sotres et al., 2015, 2016; Zeytin et al., 2016). Nevertheless, even fewer studies have addressed the influence of different daily feeding regimes on these parameters (Vera et al., 2007; Yúfera et al., 2014; Gilannejad et al., 2021a,b).
High commercial value and market demand have made the Senegalese sole (Solea senegalensis) an important species for aquaculture industry in Southern Europe (Imsland et al., 2003; Morais et al., 2016). One of the important characteristics of this species is the sporadic feeding behavior and an atypically small stomach, with negligible acidification and a dubitable involvement in digestion process (Yúfera and Darias, 2007; Dias et al., 2010). Additionally, this species is particularly interesting for chronobiology studies because during the metamorphosis, the larvae undergo a light-dependent switch in their locomotor activity and feeding behavior, changing from diurnal preference in larval stage to nocturnal habits in juvenile and adult stages (Bayarri et al., 2004; Cañavate et al., 2006; Navarro et al., 2009; Blanco-Vives, 2012). Daily profiles of food intake and digestive enzyme production have been studied in the Senegalese sole larvae and post-larvae (Navarro-Guillén et al., 2015, 2017), although the underlying molecular pathways have not yet been explored. Therefore, adapting an integrative approach in addressing the digestive functionality may give an insight into the controlling mechanisms and help to design more suitable feeding protocols.
In a previous work, we reported the effects of different feeding regimes, in terms of timing and frequency, on daily patterns of gut content, gastrointestinal tract (GIT) transit time, and the within-1-day changes of food digestibility in the Senegalese sole juveniles (Gilannejad et al., 2019). The aim of the present work was to estimate how different parameters determining the efficiency of digestive process are influenced by these feeding protocols in the same juveniles. For this purpose, daily oscillations in the expression of genes related to circadian system (aryl hydrocarbon receptor nuclear translocator-like protein 1, arntl1-previously named as bmal1; circadian locomotor output cycles protein kaput, clock; period circadian protein homolog 1, per1; cryptochrome 1, cry1), appetite regulation (cholecystokinin, cck), peptide transport (solute carrier family 15 member 1, slc15a1), together with the genes involved in the digestion of proteins (trypsinogen 1, try1; chymotrypsinogen b1, ctrb1; pepsinogen a, pga; potassium-transporting ATPase alpha chain 1, atp4a), lipids (carboxyl ester lipase, cel), and carbohydrates (pancreatic alpha amylase, amy2a) were assessed. Moreover, after measuring the pH in different GIT segments, daily activity pattern of enzymes involved in digestion (pepsin, trypsin, chymotrypsin, amylase, 4C-like lipase, and 7C-like lipase) and intestinal transport (alkaline phosphatase) of nutrients was determined.
Materials and Methods
Experimental Design
Senegalese sole juveniles were purchased from a local hatchery and were maintained at the ICMAN experimental facilities (REGA ES110280000311). Animals were randomly distributed into four groups, with three replicates for each (N = 120 in each group, with an initial body mass of 8.91 ± 0.3 g). During the experimental period, fish were maintained in quadrangular flat-bottom 250-L tanks with flow-through water system, at 19.5 ± 1.0°C, and a photoperiod of 11L/13D [with the light period from 08:00 to 19:00 h (local time)]. Using automatic feeders, the four groups were fed the same experimental diet and daily ration, close to the satiation level (2% of their fresh body mass), but different daily feeding protocols (P): (P1) one meal at 8:30 h (local time); (P2) six meals during the light period, at 08:30, 10:00, 12:00, 14:00, 16:00, and 18:00 h; (P3) six meals during the dark period, at 20:00, 22:00, 24:00, 02:00, 04:00, and 06:00 h; and (P4) 12 meals for 24 h, at times mentioned for P2 and P3 (Figure 1). The composition of the experimental diet (SPAROS Lda., Olhão, Portugal) is shown in Table 1. Juveniles were maintained under the different feeding protocols for 2 weeks before sampling.
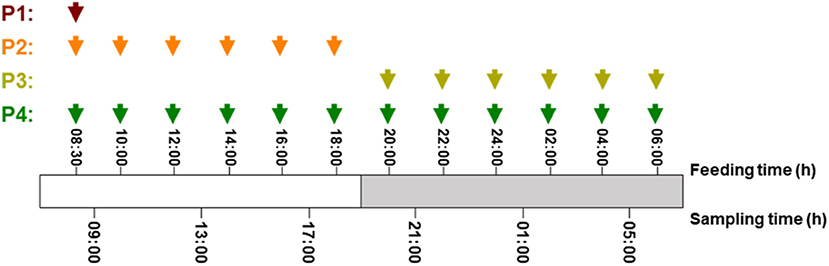
Figure 1. Detailed schema for feeding and sampling schedule in S. senegalensis fed different daily protocols. Red, orange, yellow, and green arrows indicate feeding hours in protocols 1, 2, 3, and 4, respectively.
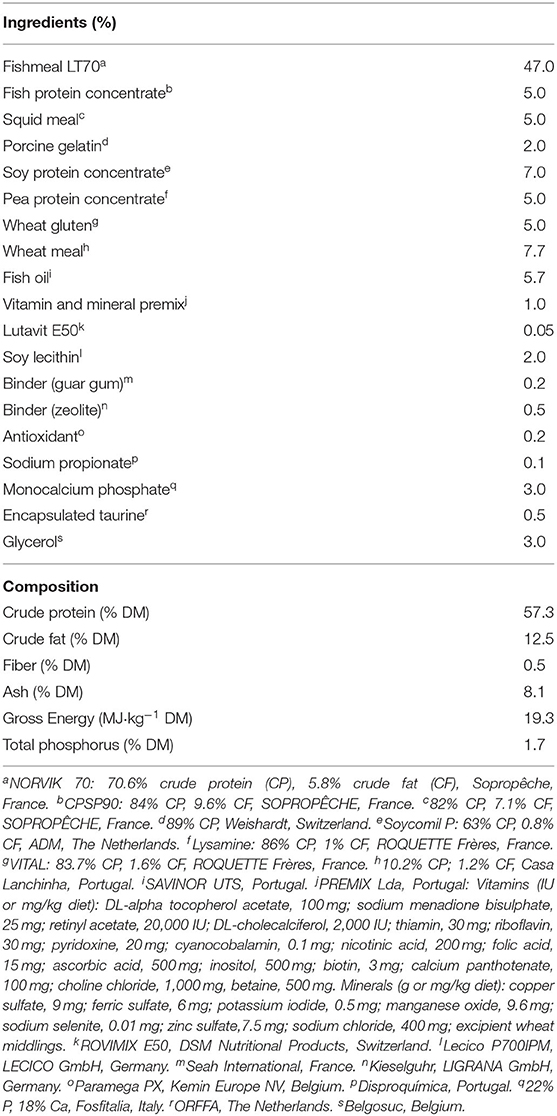
Table 1. Formulation and proximate composition of experimental diets.
Sampling Procedure
All the experimental and sampling procedures were carried out in compliance with the European Union Council Guidelines (2010/63/EU) and the Spanish legislation for the use of laboratory animals, with approval of Bioethics Committee of the Spanish National Research Council for Project EFISHDIGEST (AGL2014-52888-R).
Experimental design with feeding and sampling times for the different protocols is illustrated in Figure 1. For each group, fish were sampled every 4 h, at 09:00, 13:00, 17:00, 21:00, 01:00, and 05:00 h. For each one of the gene expression and enzyme activity analyses, six individuals per feeding protocol (two per tank) and sampling time were anesthetized (250 ppm) and then killed with a 2-phenoxyethanol overdose (600 ppm), and the whole GIT was carefully dissected. For gene expression analysis, GIT + liver tissues were preserved in an appropriate volume (1/10 w/v) of RNAlater® (Invitrogen Life Technologies). Samples were kept at 4°C for 24 h and then stored at−20°C, until the total RNA isolation. For enzyme activity analysis, GIT samples were kept at−20°C until being processed.
Gene Expression Analyses
This manuscript follows the ZFIN Zebrafish Nomenclature Guidelines for gene and protein names and symbols (available at https://zfin.atlassian.net/wiki/spaces/general/pages/1818394635/ZFIN+Zebrafish+Nomenclature+Conventions).
Sequences and Primers
All the primers for quantitative real-time PCR (qPCR) were designed with the help of Primer3 software v.0.4.0 (available at http://bioinfo.ut.ee/primer3-0.4.0/) and were synthetized by IDT® (Belgium). Sequences and the Accession Number (acc. No.) of their sources are shown in Supplementary Table 1.
For actin beta (actb; GeneBank Accession No. DQ485686), ubiquitin (ubq; GeneBank acc. No. AB291588), per1 (SoleaDB acc. No. solea_v4.1_unigene3039), and try1 (consensus sequence from try1a, try1b, and try1c, with GenBank acc. nos. AB359189, AB359190, and AB359191), primers were modified from Martins et al. (2013), Infante et al. (2008), Manchado et al. (2008), and Martín-Robles et al. (2012), respectively.
For each one of pga and atp4a, qPCR primers were designed in a final sequence after merging two partial sequences (GenBank acc. nos. FF289598 and FF286387 for pga; FF285012 and FF286513 for atp4a) retrieved from expressed sequence tags (EST).
For arntl1 (solea_v4.1_unigene53204), clock (solea_v4.1_unigene7837), cry1 (solea_v4.1_unigene37401), cck (solea_v4.1_unigene78330), slc15a1 (solea_v4.1_unigene96321), ctrb1 (solea_v4.1_unigene29140), cel (solea_v4.1_unigene36939), and amy2a (solea_v4.1_unigene50654), qPCR primers were designed in sequences obtained from SoleaDB transcriptome database (available at https://www.scbi.uma.es/soleadb).
qPCR
Total RNA extraction was carried out from the GIT + liver sample of each individual, which was homogenized by Ultra-Turrax® T25 with an S25N-8G dispersion tool (IKA®-Werke), using NucleoSpin® RNA kit (Macherey-Nagel). RNA quality was checked in a Bioanalyzer 2100 with RNA 6000 Nano kit (Agilent Technologies, LifeSciences). RNA quantity was measured in a Qubit® 2.0 Fluorometer with Qubit® RNA BR Assay Kit (Invitrogen, Life technologies). Using qScript™ cDNA synthesis kit (Quanta BioSciences), 1 μg of each total RNA sample was reverse-transcribed in a total reaction volume of 40 μL. Only samples with a RNA integrity number (RIN) higher than 8.0 were used for expression analyses.
Quantifications of gene expression were carried out using a CFX Connect™ Real-Time PCR Detection System, CFX Manager™ Software, and Hard-Shell® Low-Profile Thin-Wall 96-Well Skirted PCR plates, covered with Microseal® B Adhesive Seals (Bio-Rad). qPCR were performed using 10 ng of cDNA (assumed from RNA input), forward and reverse primers (400 nM for cck and 200 nM for the rest of the genes), and IQ™ SYBR® Green Supermix (Bio-Rad), in a final volume of 10 μL, and a cycling protocol of 95°C, 10 min; [95°C, 15 s; 60°C, 30 s] × 40 cycles; melting curve 60–95°C, 0.5°C /5 s. Relative gene quantification was calculated by the ΔΔCT method (Livak and Schmittgen, 2001) corrected for efficiencies (Pfaffl, 2001). To normalize the results, actb and ubq were chosen as internal reference genes, and a pool of all cDNA samples was used as a calibrator to correct for interassay variations on every qPCR plate. Before proceeding to quantifications, the calibrator sample was used to optimize the qPCR conditions for each gene, by constructing calibration curves with several pairs of primers, template concentrations (1:10 serial dilution from 10 ng to 100 fg of input RNA), and primer concentrations (200 and 400 nM). To ensure the absence of primer dimers and genomic DNA contamination, control reactions with RNase-free water (NTC) and RNA (NRT) were included in the calibration curves. Finally, PCR products were visualized in agarose gels, cloned, and sequenced, to confirm the exclusive amplification of the genes of interest. In brief, PCR products were purified using the NucleoSpin® Gel and PCR Clean-up Kit (Macherey–Nagel) and cloned using the CloneJET PCR Cloning Kit (LifeSciences, ThermoFisher), and sequenced by STAB VIDA (Caparica, Portugal). Amplicon size, amplification range, efficiency (E), and coefficient of determination (R2) of the calibration curves are shown in Supplementary Table 1.
GIT pH and Enzyme Activity Analyses
Immediately after defrosting the GIT samples and before continuing to the enzyme activity analysis, luminal pH of the stomach and of the anterior, medium, and posterior intestine segments was measured using a micro pH electrode (Thermo Scientific™ Orion™ Star A111), following the procedure described in the study by Yúfera et al. (2012, 2019).
In order to prepare the enzyme extracts, stomach and intestine were separately dissected from each one of the GIT samples, homogenized in distilled water (1:3 w/v), and then centrifuged for 10 min at 4°C at 13,000 rpm. The supernatants were aliquoted and kept at−20°C until being used for activity measurements. For pepsin activity, only the stomach and for the rest of enzymes, only the intestine homogenates were used. All enzyme activity analyses were carried out at room temperature (20°C).
Pepsin activity was measured using EnzChek® Protease Assay Kit (Molecular Probes™, E33651). Fluorescent-labeled casein, as substrate, was dissolved in phosphate-buffered saline (pH 7.2) and then diluted in 200 mM glycine + HCl buffer (pH 3.4) to a final concentration of 10 μg/mL. For each sample, fluorescence was measured at 485/530 nm (excitation/emission) for 100 μL of the substrate in buffer and 15 μL of enzyme extract per reaction.
Boc-Gln-Ala-Arg-7-methylcoumarin hydrochloride (Sigma-Aldrich®, B4153) and Ala-Ala-Phe-7-amido-4-methylcoumarin (Sigma-Aldrich, A3401) were separately diluted in dimethyl sulfoxide (DMSO) to a final concentration of 20 μM and were used as fluorogenic substrate for trypsin and chymotrypsin activity analyses, respectively. For each sample, fluorescence was measured at 355/460 nm for 5 μL of the substrate, 190 μL of 50 mM Tris and 10 mM CaCl2 buffer (pH 8.5), and 15 μL of the enzyme extract per reaction (Rotllant et al., 2008).
For 4C-like and 7C-like lipase activity analyses, 4-methylumbelliferyl butyrate (Sigma-Aldrich®, 19362) and 4-methylumbelliferyl heptanoate (Sigma-Aldrich®, M2514) were used as fluorogenic substrates, respectively. These reagents were separately dissolved in 200 mM phosphate buffer (pH 7.0) to a final concentration of 0.4 mM. For each sample, fluorescence was measured at 355/460 nm for 250 μL of the substrate with buffer and 15 μL of the enzyme extract per reaction (modified from Rotllant et al., 2008).
EnzChek® Ultra Amylase Assay Kit (Molecular Probes™, E33651) was used for the amylase activity measurement. This kit contains a starch derivate labeled with a fluorescent dye as substrate, which was dissolved in 50 mM sodium acetate buffer (pH 4.0) and then diluted in 50 mM MOPS (pH 6.9) to a final concentration of 200 μg/mL. For each sample, fluorescence was measured at 485/538 nm for 50 μL of the substrate in buffer and 15 μL of the enzyme extract per reaction.
For alkaline phosphatase activity analysis, 4-methylumbelliferyl phosphate disodium salt (Sigma-Aldrich®, M8168) was used as fluorogenic substrate. This reagent was dissolved in 200 mM borate buffer (pH 8.5) to a final concentration of 1 mM. For each sample, fluorescence was measured at 360/440 nm for 100 μL of the substrate and buffer and 15 μL of the enzyme extract per reaction (Bessey et al., 1946).
For each enzyme, all samples were assayed in microplate wells in duplicate, and activities were expressed as RFU (relative fluorescence units) per gram of fish fresh body mass.
Statistics
Statistical analyses were performed using GraphPad Prism v. 6.01. Data were analyzed for possible outliers using the Grubbs' test (ESD method). After checking for normality of distribution and homogeneity of variance, values obtained for gene expressions and enzymatic activities were subjected to two-way ANOVA, with feeding protocol and sampling time as the independent factors. Within each feeding protocol, differences among sampling times were assessed by one-way ANOVA followed by post-hoc Tukey test, considered statistically significant when p < 0.05. Data were visualized as mean ± standard error of the mean (SEM), using SigmaPlot v.13. Existence of daily rhythms was tested by cosinor analysis, using the chronobiology software EL TEMPS® v.292 (from Prof. A. Díez Noguera, University of Barcelona, Spain). Following this method, we evaluated whether fluctuations of a data set, gene expression, or enzyme activity, over time were fitted into a cosine curve, applying the following equation. Y = Mesor + Amplitude cos [2π (t − Acrophase)/Period], where, Mesor (MES) is the mean of the rhythm, Amplitude (AMP) is the maximum variation, t is the phase of the rhythm, Acrophase (ACR) is the time of the peak value, and Period is the duration of one cycle (24 h). In this analysis, sampling points were considered as Zeitgeber time (ZT). The ZT 0 was defined as the time of the light on (08:00 h local time), and light was switched off at ZT 11 (19:00 h local time). Rhythms were assumed to be significant when amplitude differs from zero (p < 0.05).
Results
After the experimental period, body mass (10.4 ± 0.3, 11.3 ± 0.4, 11.9 ± 0.4, and 11.5 ± 0.4 g from P1–P4, respectively) was significantly lower in fish from P1 compared to P3, and no significant differences were detected among the other feeding protocols (p < 0.05).
Gene Expression
Daily expression patterns of the studied genes in response to different feeding protocols are illustrated in Figures 2–4, as well as in Supplementary Table 2. For a better description, they have been grouped in different categories.
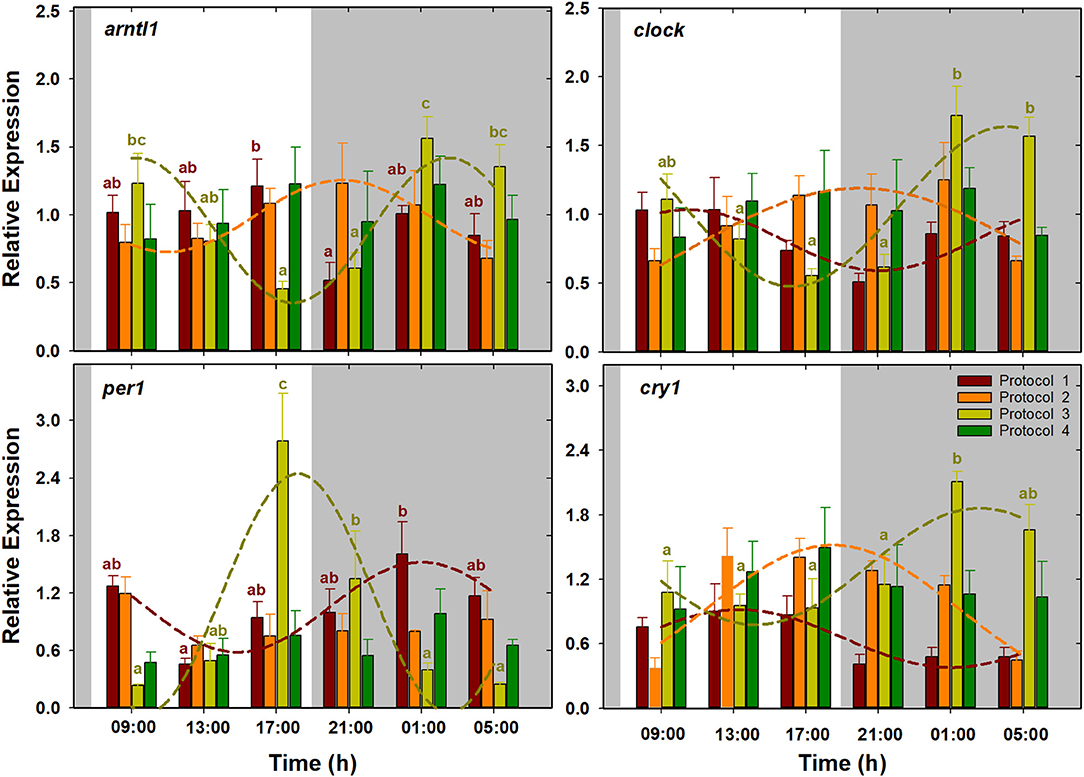
Figure 2. Daily patterns of arntl1, clock, per1, and cry1 expression in S. senegalensis with different feeding protocols. Within each protocol, different letters denote significant differences among sampling times (one-way ANOVA, Tukey's test). Short-dashed lines exhibit expression patterns with significant circadian rhythm (cosinor analysis). For each feeding protocol, N = 6 individuals per sampling point (p < 0.05). Gray areas indicate the dark period.
Genes Related to the Circadian System
Their expression did not show significant oscillations in all the feeding protocols (Figure 2). In fish with a single diurnal meal (P1), arntl1 expression showed the maximum and minimum levels at the last sampling of the light period (17:00 h) and the first sampling of the dark (21:00 h) period, respectively. In this feeding protocol, per1 expression decreased during daytime, to minimum level at 13:00 h, and increased afterward, reaching to maximum level at 01:00 h. In fish with exclusively nocturnal meals (P3), per1 expression was characterized by a pronounced peak at transition from the light to dark period (17:00 h). Expression of arntl1 and clock, on the other hand, decreased during the daytime to lowest levels at the end of the light period, and increased afterward to highest levels at late dark period. In this protocol (P3), cry1 expression was low during the whole light and the beginning of the dark period and increased significantly at the two last nocturnal sampling times. According to the cosinor analysis in P1, per1 expression with ACR during the dark period, at 02:25 h (ZT 18:25), was approximately in antiphase with clock and cry1 with ACR during the light period, around 09:30 and 13:00 h (ZT 01:21 and 05:00), respectively. In fish with several diurnal meals (P2), the positive elements of the circadian machinery arntl1 and clock, with ACR around 20:20 h (ZT 12:20), showed a 2-h phase shift with respect to the negative element cry1, with ACR at 18:18 h (ZT 10:18). Fish with exclusively nocturnal feeding (P3) were the only group in which the expression of the four clock genes was fitted into cosine curves. In this protocol, per1 expression with ACR at the end of the light period (ZT 18:01 h; 10:01) was approximately in antiphase with arntl1, clock, and cry1 with ACR at the end of the dark period, at 04:44, 03:41, and 02:20 h (ZT 20:44, 19:41, and 18:20), respectively. On the other hand, P4 was the only protocol in which none of the clock genes showed a significant circadian rhythm (Table 2, Figure 2).
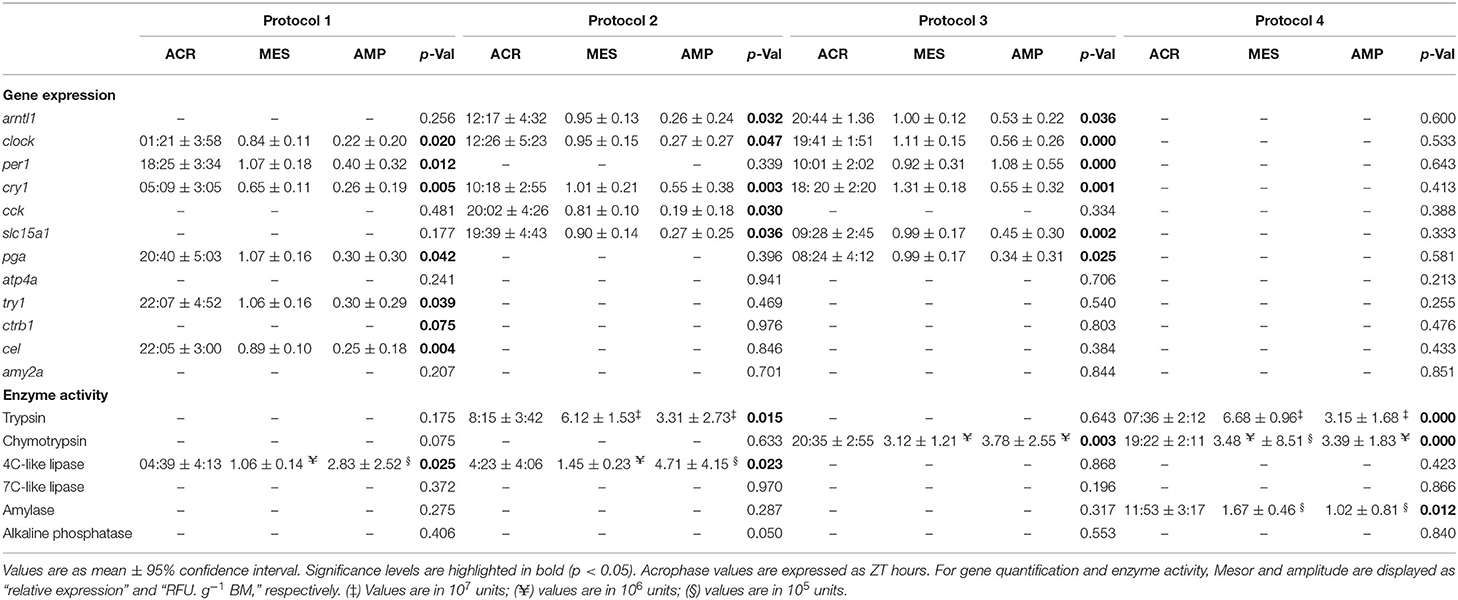
Table 2. ACR, MES, and AMP for gene expression and enzyme activity in Senegalese sole juvenile fed different daily experimental protocols, based on cosinor analysis.
Genes Involved in Appetite Control and Nutrient Transport
Results presented in Figure 3 show that cck expression in P1 was characterized by a significant upregulation at 13:00 h and low levels during the rest of the times, whereas no significant changes were detected in the rest of the protocols. For slc15a1, highest expression levels in P3 were found at the end of the light period (17:00 h), while the lowest levels were observed during the late dark period. The expression pattern of this gene was almost opposite in P4, where the lowest and highest levels were observed at the end of the light and dark period, respectively. P1 and P2 did not show significant daily changes for this gene. According to the cosinor analysis, cck expression had significant daily rhythms in P2, with ACR at 04:02 h (ZT 20:02). Besides, daily expression of slc15a1 was fitted into cosine curves both in P2 and in P3, with ACR at 03:39 and 17:28 h (ZT 19:39 and 09:28), respectively. No significant rhythms were found in the rest of the protocols (Table 2, Figure 3).
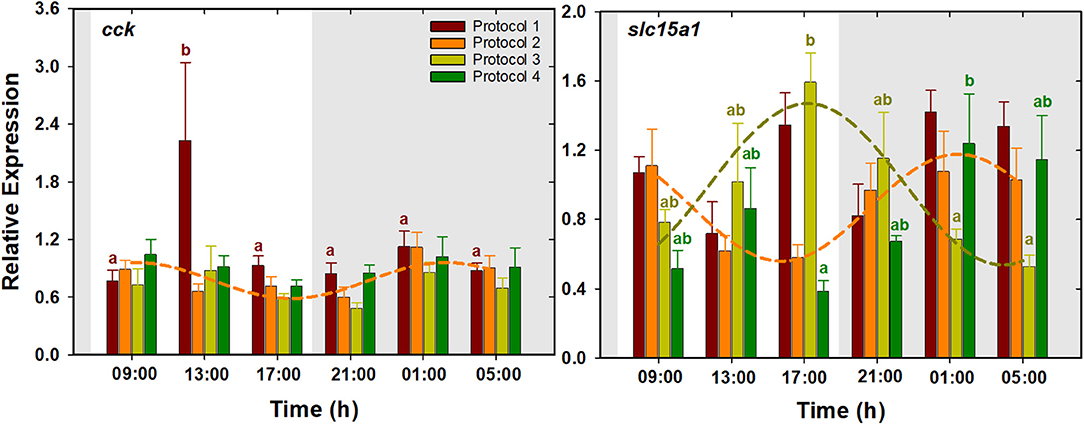
Figure 3. Daily patterns of cck and slc15a1 expression in S. senegalensis with different feeding protocols. The rest of legend as in Figure 2.
Genes Codifying the Digestive Enzymes and Gastric Proton Pump
No significant changes were observed in the expression of these genes (Figure 4). However, cosinor analysis revealed significant circadian rhythms for the expression of pga, for which P1 and P3 showed antiphase daily rhythms with ACR at 04:40 and 16:24 h (ZT 20:40 and 08:24), respectively. Besides, P1 also showed significant rhythms for try1 and cel with ACR around 06:00 h (ZT 22:00). No significant circadian rhythms were found in the rest of the protocols (Table 2, Figure 4).
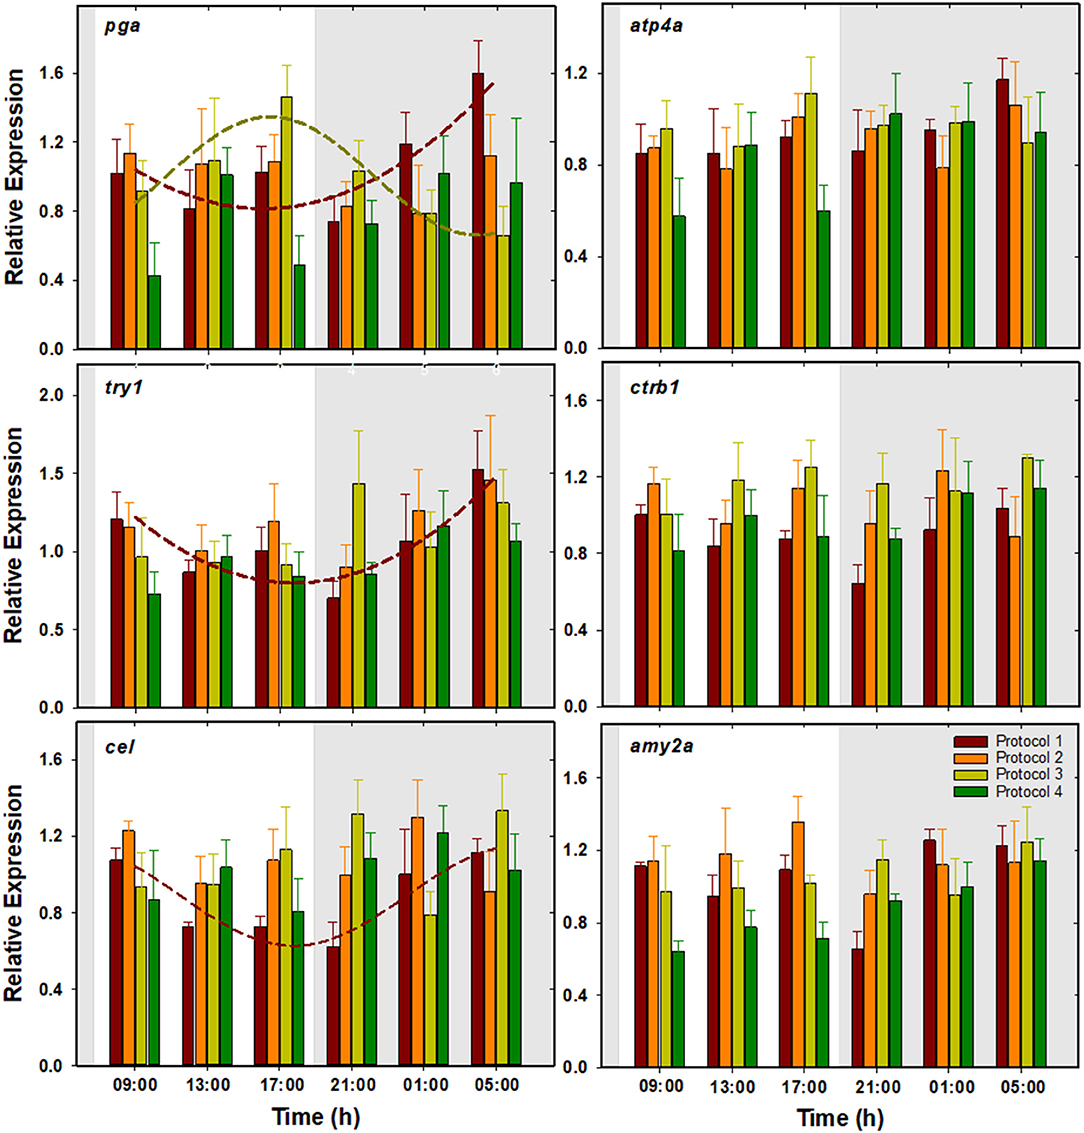
Figure 4. Daily patterns of pga, atp4a, try1, ctrb1, cel, and amy2a expression in S. senegalensis with different feeding protocols. The rest of legend as in Figure 2.
Besides daily variations in the expression of genes, in order to obtain a comparative estimation of the whole-day mRNA production, average values of each gene for all the sampling points measured in the different feeding protocols are shown in Table 3. Two-way ANOVA revealed a significant effect of both factors, feeding protocol and sampling time, and their interaction on per1 and cck. On the other hand, cry1, slc15a1, ctrb1, and amy2a were only influenced by the feeding protocol, although the interaction of the factors also affected the two former genes. Expression of artl1 and clock was significantly affected by sampling time and its interaction with the feeding protocol. Nevertheless, the rest of the studied genes were not influenced by either of the factors or their interaction. According to one-way ANOVA, P1 showed the highest expression level for cck, slc15a1, and per1; while P4 had the minimum levels for the two latter genes, P2 and P3 showed the lowest values for cck. For cry1 and ctrb1, on the other hand, P3 showed the highest and P1 showed the lowest expression levels. For amy2a, the minimum expression level was observed in P4, which was significantly different from P2 (Table 3).
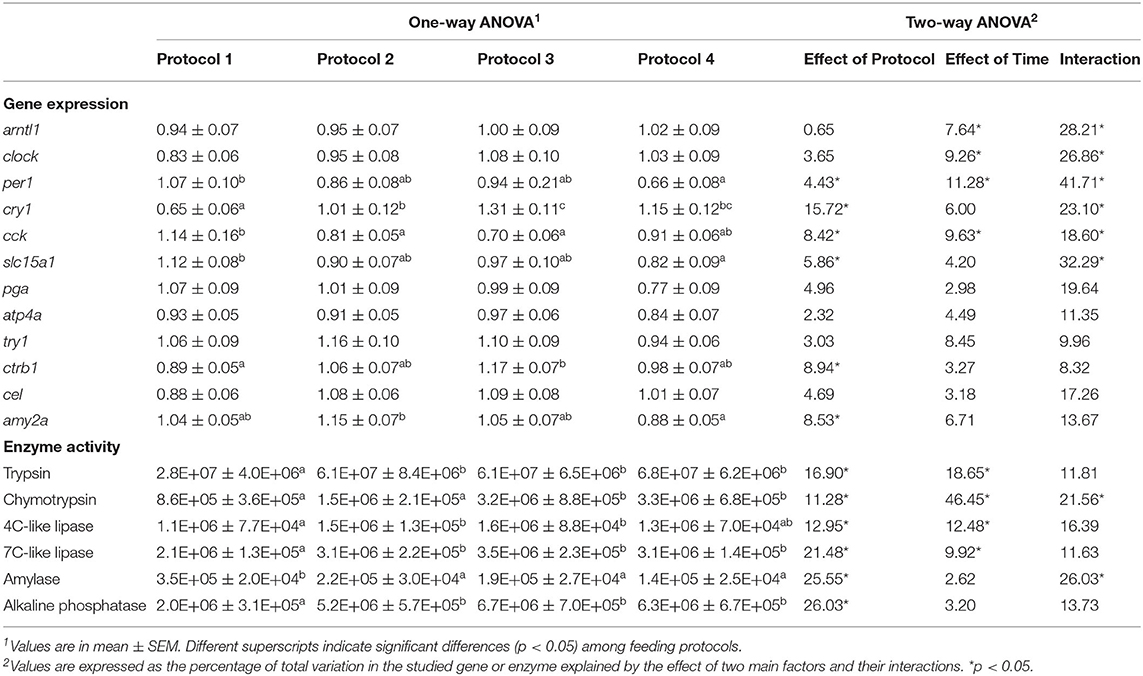
Table 3. Daily average values for gene expression and enzyme activity in Senegalese sole juveniles fed different daily experimental protocols.
GIT pH
Luminal pH in experimental protocols was 6.69 ± 0.02 (mean ± SEM) in the stomach, and 7.10 ± 0.02, 7.29 ± 0.03, and 7.39 ± 0.02, in the anterior, medium, and posterior intestine, respectively.
Enzyme Activity
Pepsin activity was not detected in any of the tested experimental protocols. Daily fluctuations in the activity of other studied enzymes in response to different feeding protocols are illustrated in Figure 5 and Supplementary Table 2. Trypsin activity did not show significant daily changes in P1 and P3. In fish fed exclusively during the day (P2) and during 24 h (P4) however, the activity pattern of this enzyme was quite similar, showing a peak at 13:00 h and a progressive decrease afterward, reaching minimum levels at the end of the dark period. All the feeding protocols showed significant daily changes for chymotrypsin, for which extremely low levels were observed during most of the day with a significant increase at 05:00 h. These peaks of expression were more marked in groups fed during the night (P3 and P4). In fish with exclusively diurnal feeding (P2), 4C-like lipase activity was high during the light period and dropped during the dark hours. In fish fed exclusively during the night (P3), on the other hand, 7C-like lipase activity showed a significant peak at 01:00 h. While in P1 amylase activity was high and stable over time, P2, P3, and P4 showed the maximum levels at 05:00, 09:00, and 17:00 h, respectively. For alkaline phosphatase, none of the feeding protocols showed significant daily changes. According to the cosinor analysis, a significant circadian rhythmicity for trypsin activity was found in P2 and P4 with ACR at 16:15 and 15:36 h (ZT 8:15 and 07:36), respectively. For chymotrypsin, on the other hand, only P3 and P4 showed significant daily rhythms with ACR at 04:35 and 03:22 h (ZT 20:35 and 19:22), respectively. While for 4C-like lipase activity, cosinor analysis revealed significant daily rhythms in P1 and P2 with ACR around 12:30 h (ZT 4:30), none of the feeding protocols showed rhythmic daily patterns for 7C-like lipase. According to the cosinor analysis, amylase daily activity pattern was significantly rhythmic only in P4 with ACR at 19:53 h (ZT 11:53) (Table 2, Figure 5).
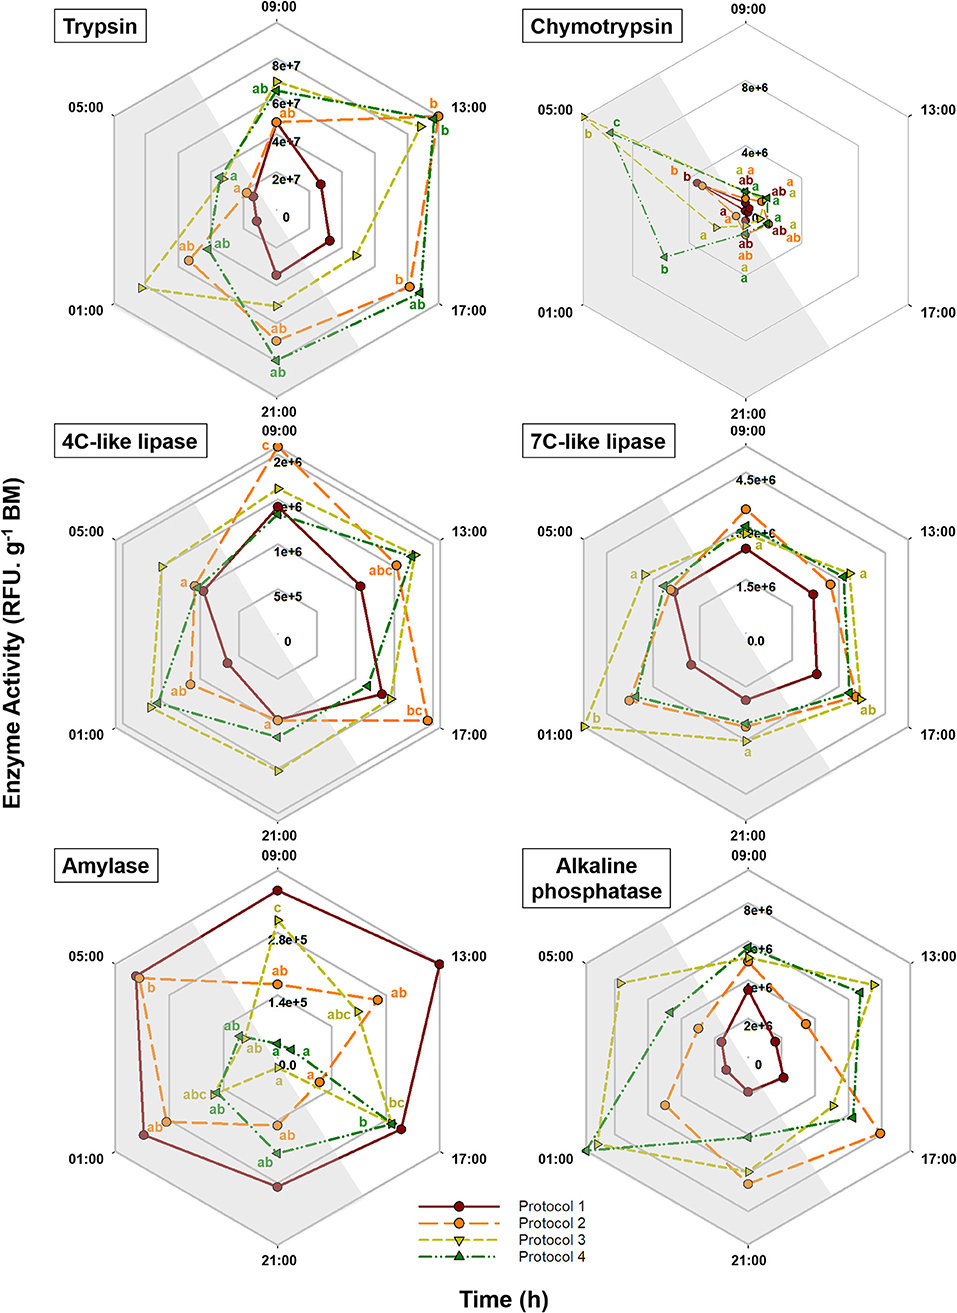
Figure 5. Daily patterns of trypsin, chymotrypsin, amylase, 4C-like lipase, 7C-like lipase, and alkaline phosphatase activity in S. senegalensis with different feeding protocols. Within each protocol, different letters denote significant differences among sampling times (one-way ANOVA, Tukey's test, p < 0.05). For each feeding protocol, N = 6 individuals per sampling point. Gray areas indicate the dark period.
Daily average activity of all the sampling points in different experimental protocols is detailed in Table 3. According to two-way ANOVA, feeding protocol had a significant influence on the activity of all the studied enzymes. Besides, the sampling time affected the activity of trypsin, chymotrypsin, and 4C-like and 7C-like lipases. Nevertheless, the interaction influence of these factors was only observed on chymotrypsin and amylase activities. According to one-way ANOVA, in all the studied enzymes, the lowest activity values were registered in fish with a single diurnal meal (P1), except for amylase for which this group had the highest values compared to the rest of the experimental groups (Table 3).
Discussion
In this work, we have assessed the influence of different feeding schedules on daily pattern of several parameters potentially affecting the feeding efficiency in Senegalese sole juveniles. Although the aim of the present work was not to conduct a growth trial and the experimental duration was not long enough to draw firm conclusions, the group with a single diurnal feeding (P1) showed lower weight gain than the group with exclusively nocturnal feeding (P3). Nevertheless, these differences were not important enough to cause bias in our findings by the size factor.
One of our interesting findings was that different feeding protocols led to important changes in daily expression pattern of the genes related to the circadian system; a time lapse of 8 to 18 h was found between the acrophase of clock genes at the different feeding protocols. Entrainment of the molecular clock in peripheral oscillators by feeding cues has been previously evidenced in fish (López-Olmeda et al., 2010; Cavallari et al., 2011; Feliciano et al., 2011; Vera et al., 2013). In this study, unlike the positive elements of the molecular clock (arntl1/clock) that showed a negligible phase shift (5 min−1 h) within each feeding protocol, the negative elements (per1/cry1) had a major time lapse (8–13 h). Consequently, arntl1/clock expressions were in antiphase with per1 in each feeding protocol, consistent with their putative roles as positive and negative limbs of the circadian regulatory loop (Pando and Sassone-Corsi, 2002), as described in Senegalese sole (Martín-Robles et al., 2012) and other fish species (Feliciano et al., 2011; Vatine et al., 2011; Mata-sotres et al., 2015). However, these positive elements showed a negligible phase shift (1–4 h) with cry1, suggesting a more relevant role of per1 in adjusting the molecular clock in response to feeding.
In a previous study on Senegalese sole, clock genes showed a tissue-specific expression pattern, which was more robust in the retina and liver (Martín-Robles et al., 2012). In the present work, the whole digestive system, i.e., the liver and GIT, was indistinctly used for the gene expression analysis. Hence, the obtained patterns cannot be attributed to any specific tissue or organ, although the liver is known to be the most sensitive organ to the food-related cues (Feliciano et al., 2011; Nisembaum et al., 2012). Moreover, in the few studies in which both the liver and the gut have been addressed (in goldfish Carassius auratus), clock genes expressions were in phase in these organs, which was both food-entrainable oscillators (Velarde et al., 2009; Sánchez-Bretaño et al., 2015a). Future studies are necessary to shed light on the effect of different daily feeding protocols on the tissue-specific expression pattern of these genes. Nocturnal feeding (P3) was the only protocol in which all the clock genes showed significant circadian rhythms, suggesting the influence of this feeding protocol on synchronizing the peripheral clock in this species. In goldfish (Carassius auratus), when only one environmental signal (light/dark or feeding/fasting cycle) was present, the amplitude of per1a rhythm in the liver was lower than when both singles were available, indicating that both environmental cues collaborate to maintain the hepatic molecular clockwork (Nisembaum et al., 2012, Sánchez-Bretaño et al., 2015b). Accordingly, the general trend in obtaining higher amplitude of the clock genes in P3 compared to the other protocols in our study may indicate a higher synchronization of different peripheral tissues (liver and intestine) with the signals received from the central nervous system, which is in agreement with the nocturnal feeding preference in the juvenile stage of this species. Contrarily, continuous feeding (P4) did not entrain any of the clock genes in this work, which is one possible explanation for such asynchrony the masking influence of opposite or inverted trends in the two addressed tissues resulting in neutral overall patterns. From all the clock genes addressed in this study, per1 was the only one whose daily average expression was significantly influenced by both feeding protocol and sampling time. Interestingly, family of period genes are the most sensitive targets for the signaling molecules that are induced by the feeding clues, through which they mainly exert their influence on the hepatic oscillator (Nisembaum et al., 2012, 2014a,b; Sánchez-Bretaño et al., 2015b).
Cholecystokinin (CCK), a peptide hormone mainly secreted by the proximal intestine, plays an important role in the digestion process and is mainly known as a short-term satiety signal (Liddle, 1997; Rønnestad et al., 2017). Higher cck transcription levels in fish fed one daily meal (P1), which is mainly due to the high up-regulation of this gene at 13:00 h, may indicate a strong anorexigenic influence of the large meal size, imposed by the low feeding frequency. Interestingly, in this protocol, the cck expression peak coincided to a great extent with the maximum gut content (Gilannejad et al., 2019). On the contrary, in a study carried out on Senegalese sole larvae, lower CCK protein was detected with higher gut contents, although this trend was less prominent in late post-larval stages (Navarro-Guillén et al., 2017). This inconsistency may indicate the difference between developmental stages addressed in these studies, suggesting a lack of a matured anorexigenic function of this hormone during early life stages (Bonacic et al., 2016). Alternatively, the delay between maximum levels of gut CCK hormone (at the beginning of the light period) in larger Senegalese sole juveniles (~67 g) under a single diurnal meal (P1) (Gilannejad et al., 2021b), and the cck expression peak (at 13:00 h) in our study, could imply the involvement of post-transcriptional and/or translational mechanisms. Besides gut content, a regulatory loop between CCK and trypsin has also been reported in Senegalese sole larvae and post-larvae (Navarro-Guillén et al., 2017) and larger juveniles (Gilannejad et al., 2021b). The existence of such regulation mechanism could not be confirmed in this study. Although the general diel profile (opposite tendencies between cck expression and trypsin activity in P2, with respective acrophases at 04:02 and 16:15 h) and their absolute daily average values (minimum daily average cck expression while maximum trypsin activity in P1) pointed to the viability of this hypothesis.
Peptide transporter 1 (PepT1), located at the brush border of the intestine epithelium, plays a key role in H+ gradient uptake of di- and tripeptides (Adibi, 2003; Yuen et al., 2007) and is considered as a useful marker to estimate the protein absorption function (Rønnestad et al., 2010). According to our previous study, single daily meal (P1) led to the minimum daily average protein digestibility compared to the other feeding schedules in Senegalese sole juveniles (Gilannejad et al., 2019). Hence, the highest expression of slc15a1 in P1 might reflect a compensatory mechanism that enables the uptake of maximum amount of peptides resulted from the insufficient protein digestion in this protocol, or may indicate that the mRNAs were not translated to PepT1 protein due to lower digestion efficiency. Furthermore, the expression rhythm of slc15a1 in P3 was highly comparable to the expression of per1 in this protocol, pointing to the possible involvement of clock genes in the regulation of the “molecular transport,” as previously reported in gilthead seabream (Sparus aurata) larvae (Yúfera et al., 2017) and juveniles (Gilannejad et al., 2021a).
With few exceptions (ctrb1 and amy2a), the effect of feeding protocol was not significant on daily average expression of the genes related to digestion of nutrients. These genes did not show significant changes along the daily cycle either, although they were occasionally fitted into significant circadian rhythms in P1 and/or P3. Fish with one daily meal (P1) showed a higher prevalence of rhythmic patterns in comparison with the other experimental groups. One daily meal is expected to be the simplest scenario wherein postprandial digestive process can be fitted into a daily cycle, without the overlapping influence of multiple feeding events (Yúfera et al., 2014). While the expression of pancreatic proenzymes try1 and cel was almost completely synchronized (acrophase around 06:00 h, ZT 22:00), pga highest expression was detected 2 h earlier (acrophase at 04:40 h, ZT 20:40), implying the anticipatory response to the food passage time through the stomach and the intestine. Additionally, expression rhythms of the digestive enzyme precursors were highly comparable to per1 in the corresponding protocol. Similar results were obtained in gilthead seabream larvae, where this resemblance was attributed to the role of the negative elements of the molecular clock in preparation of the enzymatic machinery for the upcoming feeding cycle (Mata-Sotres et al., 2016).
In agreement with the previous reports on this species (Yúfera and Darias, 2007; Gilannejad et al., 2017), pH of all GIT segments was close to neutral levels during the whole daily cycle and no stomach acidification was detected in our study. Therefore, under such pH conditions in our experiment, pga transcripts would not be able to be translated to protein. In fact, our attempts to measure the gastric pepsin activity, even by using extremely sensitive fluorometric substrates at the optimum pH 2.0, failed. Absence of pepsin activity in spite of detectable levels of pga transcripts has been previously reported in the omnivorous fish larvae Chelon labrosus and could suggest the involvement of posttranscriptional/translational pathways (Gilannejad et al., 2020).
Unlike gene expression, feeding protocol had a significant influence on daily average activity of all the studied enzymes, with minimum levels in P1 except for amylase for which this protocol showed the maximum level. The generally low levels of digestive enzyme activity in P1 have been reflected in the poor daily average digestive efficiency in this protocol (Gilannejad et al., 2019). Similarly, increasing the feeding frequency in Carassius auratus gibelio led to a higher proteolytic enzyme activity (Zhao et al., 2016). In fact, multiple daily meals are recommended specially in species with very small stomach with continuous foraging behavior (NRC, 2011). This disagreement between gene expression and enzyme has been previously reported in other species (Wang et al., 2006; Yúfera et al., 2012, 2014; Mata-Sotres et al., 2016) and could be explained by different mechanisms regulating the molecular expression and biochemical activity. Besides, while qPCR analyses are able to detect the codifying genes even at specific isoform level, biochemical methods might measure the activity of a group of enzymes or even isoforms (Yúfera et al., 2018).
Trypsin activity rhythm in P2 and P4, with respective acrophases at 16:15 and 15:36 h (ZT 08:15 and 07:36), was in agreement with the feed transit pattern in these protocols, showing an increasing trend during the light hours and reaching to maximum levels during the light to dark transition (Gilannejad et al., 2019). In P4, although the food was available for 24 h, neither food ingestion nor the enzymatic activities were continuous. This may indicate that even under constant food availability, fish requires resting periods to restore the metabolic and enzymatic resources (Yúfera et al., 2018), and as a consequence, feeding regimes that exceed the digestive capacity may not be economically viable (Ueberschär et al., 2018).
On the other hand, the daily pattern of chymotrypsin activity seemed to be regardless of the feeding protocol, as it showed high levels during the dark period in all the groups, suggesting that it is mainly controlled by the light/dark cycle rather than feeding signals. Interestingly, moment of the lowest trypsin activity value coincided with maximum chymotrypsin levels in all the feeding protocols; this contrast is more clear in P4, with trypsin and chymotrypsin acrophases at 15:36 and 03:22 h (ZT 07:36 and 19:22), respectively. Activation of these pancreatic proteolytic enzymes at different moments of the day have been previously evidenced in other species such as Trachinotus falcatus (Lazado et al., 2017) and gilthead seabream (Blanco-Rivas, 2020). Such inverted daily patterns may be explained considering that chymotrypsin requires activation by trypsin, also that these enzymes possess different active sites along the peptide chain, thus supporting the complementary role of these alkaline proteases leading to optimization of the protein digestion.
While trends of higher 4C-like lipase activity in P1 and P2 (acrophase around 12:30 h, ZT 04:30) and 7C-like lipase activity in P3 (peak at 01:00 h) were detected during the feeding phase, a general discordance was obtained in rest of the cases. This independence between the presence of gut contents and lipase activity was previously reported in Senegalese sole and gilthead seabream larvae (Navarro-Guillén et al., 2015; Mata-Sotres et al., 2016). It is suggested that such absence of temporal correlation may be due to the much longer hydrolysis time required for lipid digestion compared to that of protein or carbohydrates (Yúfera et al., 2018). In addition, similar to larval stages, 4C-like lipase tended to show high activity levels during the light hours, whereas the highest 7C-like lipase activities were detected during the dark period. This may suggest a sequential involvement of different types of lipolytic enzymes during different postprandial times (Navarro-Guillén et al., 2015).
One of our most striking results was that, in contrast to other digestive enzymes, the average activity of amylase in fish fed once a day (P1) was considerably higher to that measured in the rest of the experimental groups. This may indicate the activation of alternative metabolic pathways aimed to enhance the use of carbohydrates as the main energy source, probably due to the limited availability of the other macronutrients (i.e., proteins and lipids). Accordingly, oral glucose tolerance test, which is commonly used as a good indicator of carbohydrate utilization capacity, showed a high plasma clearance rate and therefore a high capacity of this species, compared to other carnivorous fish (Stone, 2003; Conde-Sieira et al., 2015). In addition, a preferential utilization of carbohydrates at insufficient dietary protein levels has been reported in this species a by Borges et al. (2013). Indeed, the digestive features of this species, such as limited stomach digestion and long intestine, are more closely related to those generally found in fish with omnivorous feeding habits (Yúfera and Darias, 2007).
Alkaline phosphatase is involved in the absorption of nutrients and has been described as a good marker of active functionality of the brush border membrane. This enzyme is present at the same location as the digestive enzymes, permitting a sufficient absorption of the hydrolysis products as soon as they are produced (Tengjaroenkul et al., 2000). Determination of intestinal alkaline phosphatase activity in gut samples was performed in simple homogenates, not in purified brush border membrane as recommended by some authors to obtain a higher accuracy (Gisbert et al., 2018). Therefore, our determinations of its activity could be subestimated due to the possible inclusion of other cell types in the homogenates, but still, we think the present results are representative enough of the responses produced by the changes in feeding regimes. Significantly lower activity of alkaline phosphatase together with the digestive enzymes addressed in this work indicates that Senegalese sole fed once a day (P1) may have an insufficient digestion and absorption capacity and consequently may exhibit a poor nutrient utilization in comparison with the other experimental groups. This hypothesis could be supported by the lowest digestibility of the dry matter, protein, and energy obtained in this group compared with the other experimental protocols (Gilannejad et al., 2019).
Conclusions
In summary, the markedly different rhythms of clock genes in response to feeding protocol suggest the influence of feeding cues on entrainment of the molecular clock of the peripheral oscillators. Besides, rhythmicity of all these genes and their higher amplitude in the group fed exclusively during the dark period (P3) underline the synchrony of this protocol with the fish internal clock, which is in agreement with the nocturnal feeding preference in this species. The synchrony of the expression rhythms of the genes related to the transport (slc15a1) and hydrolysis of nutrients (pga, try1, and cel) with per1 could indicate the interaction or involvement of clock genes in regulation of the digestive process. Unlike gene expression of the digestive proenzymes that seemed to be mainly regulated by internal clocks, the influence of feeding protocol was determinant on the total production and/or daily pattern of the enzyme activity, suggesting the involvement of posttranscriptional/translational mechanisms. Overall, fish with one diurnal meal had the lowest activity level for the digestive and absorptive enzymes, reflecting a poor digestive capacity and an insufficient nutrient utilization. Therefore, higher feeding frequencies, especially during dark hours, could be advisable for aquaculture production of this species.
Data Availability Statement
Publicly available datasets were analyzed in this study. The names of the repository/repositories and accession number(s) can be found in the article/Supplementary Material.
Ethics Statement
All the experimental and sampling procedures were carried out in compliance with the European Union Council Guidelines (2010/63/EU) and the Spanish legislation for the use of laboratory animals, with approval of Bioethics Committee of the Spanish National Research Council for project EFISHDIGEST (AGL2014-52888-R).
Author Contributions
The experiment was conceived and designed by MY, GM-R, and FM. In vivo experiment measurement was the responsibility of NG and GM-R. Gene expression analyses were performed by NG and GM-R. Enzyme activity measurements were performed by NG and FM. Luminal pH was measured by MY and NG. Results analysis, writing, statistical treatment, and interpretation of the data were the responsibility of NG with the active collaboration of all co-authors. All authors have approved the final article and contributed for its revision.
Funding
This research was funded by the Spanish Ministry of Economic Affairs and Competitiveness (MINECO) by projects EFISHDIGEST (AGL2014-52888-R) with FEDER/ERDF contribution granted to MY and WISEFEED funded by the European Union's H2020 Program (Marie Skłodowska-Curie Grant No. 691150). NG was supported by a doctoral fellowship (BES-2015-071662) from MINECO (Spain).
Conflict of Interest
The authors declare that the research was conducted in the absence of any commercial or financial relationships that could be construed as a potential conflict of interest.
Publisher's Note
All claims expressed in this article are solely those of the authors and do not necessarily represent those of their affiliated organizations, or those of the publisher, the editors and the reviewers. Any product that may be evaluated in this article, or claim that may be made by its manufacturer, is not guaranteed or endorsed by the publisher.
Acknowledgments
We acknowledge support of the publication fee by the CSIC Open Access Publication Support Initiative through its Unit of Information Resources for Research (URICI).
Supplementary Material
The Supplementary Material for this article can be found online at: https://www.frontiersin.org/articles/10.3389/fmars.2021.698403/full#supplementary-material
Abbreviations
actb, actin beta; amy2a, pancreatic alpha amylase; arntl1, aryl hydrocarbon receptor nuclear translocator-like protein 1 (previously known as brain and muscle ARNT-like protein 1 (bmal1)); atp4a, potassium-transporting ATPase alpha chain 1 (proton pump or gastric H+/K+- ATPase precursor); cck, cholecystokinin; cel, carboxyl ester lipase precursor (bile-salt activated lipase); clock, circadian locomotor output cycles protein kaput; cry1, cryptochrome 1; ctrb1, chymotrypsinogen b1 (chymotrypsin b1 precursor); per1, period circadian protein homolog 1; pga, pepsinogen a (pepsin a precursor); slc15a1, solute carrier family 15 member 1 (peptide transporter 1 precursor); try1, trypsinogen 1 (trypsin 1 precursor); ubq, ubiquitin., ; Other abbreviations: ACR, Acrophase; AMP, Amplitude; FAA, food-anticipatory activity; GIT, Gastrointestinal tract; MES, Mesor; P, Protocol; PepT1, Peptide transporter 1; qPCR, quantitative real-time PCR; ZT, Zeitgeber time.
References
Adibi, S. A. (2003). Regulation of expression of the intestinal oligopeptide transporter (Pept-1) in health and disease. Am. J. Physiol.-Gastr. L. 285, G779–G788. doi: 10.1152/ajpgi.00056.2003
Bayarri, M. J., Muñoz-Cueto, J.A., López-Olmeda, J. F., Vera, L. M., Rol de Lama, M. A., Madrid, J. A., et al. (2004). Daily locomotor activity and melatonin rhythms in Senegal sole (Solea senegalensis). Physiol. Behav. 81, 577–583. doi: 10.1016/j.physbeh.2004.02.001
Bessey, O. A., Lowry, O. H., and Brock, M. J. (1946). A method for the rapid determination of alkaline phosphatase with five cubic millimeters of serum. J. Biol. Chem. 164, 321–329. doi: 10.1016/S0021-9258(18)43072-4
Blanco-Rivas, G. (2020). Influence of different feeding regimes on growth and daily patterns of metabolism and digestive process in gilthead seabream (Sparus aurata) (Master Thesis). University of Cádiz, Cadiz, Spain.
Blanco-Vives, B., Aliaga-Guerrero, A., Cañavate, J.P., García-Mateos, G., Martín-Robles, A.G., Herrera-Pérez, P., et al. (2012). Metamorphosis induces a light-dependent switch in Senegalese sole (Solea senegalensis) from diurnal to nocturnal behavior. J. Biol. Rhythms. 27, 135–144. doi: 10.1177/0748730411435303
Bonacic, K., Campoverde, C., Gómez-Arbonés, J., Gisbert, E., Estévez, A., and Morais, S. (2016). Dietary fatty acid composition affects food intake and gut-brain satiety signaling in Senegalese sole (Solea senegalensis, Kaup 1858) larvae and post-larvae. Gen. Comp. . 228, 79–94. doi: 10.1016/j.ygcen.2016.02.002
Borges, P., Médale, F., Veron, V., Pires, M. d. A., Dias, J., Valente, L. M., et al. (2013). Lipid digestion, absorption and uptake in Solea senegalensis. Comp. Biochem. Physiol. A 166, 26–35. doi: 10.1016/j.cbpa.2013.05.007
Boujard, T., and Leatherland, J. (1992). Circadian rhythms and feeding time in fishes. Environ. Biol. Fish 35, 109–131. doi: 10.1007/BF00002186
Cañavate, J. P., Zerolo, R., and Fernández-Díaz, C. (2006). Feeding and development of Senegal sole (Solea senegalensis) larvae reared in different photoperiods. Aquaculture 258, 368–377. doi: 10.1016/j.aquaculture.2006.04.009
Cavallari, N., Frigato, E., Vallone, D., Fröhlich, N., López-Olmeda, J. F., Foà, A., et al. (2011). A blind circadian clock in cavefish reveals that opsins mediate peripheral clock photoreception. PLoS Biol. 9:e1001142. doi: 10.1371/journal.pbio.1001142
Conde-Sieira, M., Soengas, J. L., and Valente, L. M. P. (2015). Potential capacity of Senegalese sole (Solea senegalensis) to use carbohydrates: metabolic responses to hypo- and hyper-glycaemia. Aquaculture 438, 59–67. doi: 10.1016/j.aquaculture.2014.12.042
Damiola, F., Le Minh, N., Preitner, N., Kornmann, B., Fleury-Olela, F., and Schibler, U. (2000). Restricted feeding uncouples circadian oscillators in peripheral tissues from the central pacemaker in the suprachiasmatic nucleus. Genes Dev. 14, 2950–2961. doi: 10.1101/gad.183500
Debnath, D., Pal, A. K., Sahu, N. P., Yengkokpam, S., Baruah, K., Choudhury, D., et al. (2007). Digestive enzymes and metabolic profile of Labeo rohita fingerlings fed diets with different crude protein levels. Comp. Biochem. Physiol. B 146, 107–114. doi: 10.1016/j.cbpb.2006.09.008
Dias, J., Yúfera, M., Valente, L. M. P., and Rema, P. (2010). Feed transit and apparent protein, phosphorus and energy digestibility of practical feed ingredients by Senegalese sole (Solea senegalensis). Aquaculture 302, 94–99. doi: 10.1016/j.aquaculture.2010.02.013
Feliciano, A., Vivas, Y., de Pedro, N., Delgado, M. J., Velarde, E., and Isorna, E. (2011). Feeding time synchronizes clock gene rhythmic expression in brain and liver of goldfish (Carassius auratus). J. Biol. Rhythms 26, 24–33. doi: 10.1177/0748730410388600
Gilannejad, de las Heras, V., Martos-Sitcha, J. A., Moyano, F. J., Yúfera, M., and Martínez-Rodríguez, G. (2020). Ontogeny of expression and activity of digestive enzymes and establishment of gh/igf1 axis in the omnivorous fish Chelon labrosus. Animals 10:874. doi: 10.3390/ani10050874
Gilannejad, N., Martínez-Rodríguez, G., Yúfera, M., and Moyano, F. J. (2017). Estimating the effect of different factors on the digestive bioaccessibility of protein by the Senegalese sole (Solea senegalensis); combination of response surface methodology and in vitro assays. Aquaculture 477, 28–34. doi: 10.1016/j.aquaculture.2017.04.037
Gilannejad, N., Moyano, F. J., Martínez-Rodríguez, G., and Yúfera, M. (2021a). The digestive function of gilthead seabream juveniles in relation to feeding frequency. Aquaculture 531:735867. doi: 10.1016/j.aquaculture.2020.735867
Gilannejad, N., Rønnestad, I., Lai, F., Jordal, A.-E. O., Gottlieb-Almeida, A. P., Martínez-Rodríguez, G., et al. (2021b). Daily rhythms of intestinal cholecystokinin and pancreatic proteases activity in Senegalese sole juveniles with diurnal and nocturnal feeding. Comp. Biochem. Physiol. A 253:110868. doi: 10.1016/j.cbpa.2020.110868
Gilannejad, N., Silva, T., Martínez-Rodríguez, G., and Yúfera, M. (2019). Effect of feeding time and frequency on gut transit and feed digestibility in two fish species with different feeding behaviours, gilthead seabream and Senegalese sole. Aquaculture 513:734438. doi: 10.1016/j.aquaculture.2019.734438
Gisbert, E., Nolasco, H., and Solovyev, M. (2018). Towards the standardization of brush border purification and intestinal alkaline phosphatase quantification in fish with notes on other digestive enzymes. Aquaculture 487, 102–108. doi: 10.1016/j.aquaculture.2018.01.004
Imsland, A. K., Foss, A., Conceição, L. E. C., Dinis, M. T., Delbare, D., Schram, E., et al. (2003). A review of the culture potential of Solea solea and S. senegalensis. Rev. Fish Biol. Fisher. 13, 379–408. doi: 10.1007/s11160-004-1632-6
Infante, C., Matsuoka, M. P., Asensio, E., Cañavate, J. P., Reith, M., and Manchado, M. (2008). Selection of housekeeping genes for gene expression studies in larvae from flatfish using real-time PCR. BMC Mol. Biol. 9:28. doi: 10.1186/1471-2199-9-28
Isorna, E., de Pedro, N., Valenciano, A. I., Alonso-Gómez, Á. L., and Delgado, M. J. (2017). Interplay between the endocrine and circadian systems in fishes. J. Endocrinol. 232, R141–R159. doi: 10.1530/JOE-16-0330
Lazado, C. C., Pedersen, P. B, Nguyen, H. Q., and Lund, I. (2017). Rhythmicity and plasticity of digestive physiology in a euryhaline teleost fish, permit (Trachinotus falcatus). Comp. Biochem. Physiol. A. 212, 107–116. doi: 10.1016/j.cbpa.2017.07.016
Liddle, R. A. (1997). Cholecystokinin cells. Annu. Rev. Physiol. 59, 221–242. doi: 10.1146/annurev.physiol.59.1.221
Livak, K. J., and Schmittgen, T. D. (2001). Analysis of relative gene expression data using real-time quantitative PCR and the 2−ΔΔCT methods. Methods 25, 402–408. doi: 10.1006/meth.2001.1262
López-Olmeda, J. F., Tartaglione, E. V., de la Iglesia, H. O., and Sánchez-Vázquez, F. J. (2010). Feeding entrainment of food-anticipatory activity and per1 expression in the brain and liver of zebrafish under different lighting and feeding conditions. Chronobiol. Int. 27, 1380–1400. doi: 10.3109/07420528.2010.501926
Manchado, M., Infante, C., Asensio, E., Crespo, A., Zuasti, E., and Cañavate, J. P. (2008). Molecular characterization and gene expression of six trypsinogens in the flatfish Senegalese sole (Solea senegalensis Kaup) during larval development and in tissues. Comp. Biochem. Physiol. B 149, 334–344. doi: 10.1016/j.cbpb.2007.10.005
Martín-Robles, A. J., Whitmore, D., Sánchez-Vázquez, F. J., Pendón, C., and Muñoz-Cueto, J. A. (2012). Cloning, tissue expression pattern and daily rhythms of Period1, Period2 and Clock transcripts in the flat fish Senegalese sole, Solea senegalensis. J. Comp. Physiol. B 182, 673–685. doi: 10.1007/s00360-012-0653-z
Martins, D. A., Rocha, F., Castanheira, F., Mendes, A., Pousão-Ferreira, P., Bandarra, N., et al. (2013). Effects of dietary arachidonic acid on cortisol production and gene expression in stress response in Senegalese sole (Solea senegalensis) post-larvae. Fish Physiol. Biochem. 39, 1223–1238. doi: 10.1007/s10695-013-9778-6
Mata-Sotres, J. A., Martínez-Rodríguez, G., Pérez-Sánchez, J., Sánchez-Vázquez, F. J., and Yúfera, M. (2015). Daily rhythms of clock gene expression and feeding behavior during the larval development in gilthead seabream, Sparus aurata. Chronobiol. Int. 32, 1061–1074. doi: 10.3109/07420528.2015.1058271
Mata-Sotres, J. A., Moyano, F. J., Martínez-Rodríguez, G., and Yúfera, M. (2016). Daily rhythms of digestive enzyme activity and gene expression in gilthead seabream (Sparus aurata) during ontogeny. J. Comp. Physiol. B 197, 43–51. doi: 10.1016/j.cbpa.2016.03.010
Mohanta, K. N., Mohanty, S. N., Jena, J. K., and Sahu, N. P. (2008). Optimal dietary lipid level of silver barb, Puntius gonionotus fingerlings in relation to growth, nutrient retention and digestibility, muscle nucleic acid content and digestive enzyme activity. Aquacult. Nutr. 14, 350–359. doi: 10.1111/j.1365-2095.2007.00542.x
Morais, S., Aragão, C., Cabrita, E., Conceição, L. E. C., Constenla, M., Costas, B., et al. (2016). New developments and biological insights into the farming of Solea senegalensis reinforcing its aquaculture potential. Rev. Aquacult. 8, 227–263. doi: 10.1111/raq.12091
Muñoz, E., and Baler, R. (2003). The circadian E-box: when perfect is not good enough. Chronobiol. Int. 20, 371–388. doi: 10.1081/CBI-120022525
Navarro, D. B., Rubio, V. C., Luz, R. K., Madrid, J. A., and Sánchez-Vázquez, F. J. (2009). Daily feeding rhythms of Senegalese sole under laboratory and farming conditions using self-feeding systems. Aquaculture 291, 130–135. doi: 10.1016/j.aquaculture.2009.02.039
Navarro-Guillén, C., Moyano, F. J., and Yúfera, M. (2015). Diel food intake and digestive enzyme production patterns in Solea senegalensis larvae. Aquaculture 435, 33–42. doi: 10.1016/j.aquaculture.2014.09.017
Navarro-Guillén, C., Rønnestad, I., Jordal, A. O., Moyano, F. J., and Yúfera, M. (2017). Involvement of cholecystokinin (CCK) in the daily pattern of gastrointestinal regulation of Senegalese sole (Solea senegalensis) larvae reared under different feeding regimes. Comp. Biochem. Physiol. A 203, 126–132. doi: 10.1016/j.cbpa.2016.09.003
Nisembaum, L. G., de Pedro, N., Delgado, M. J., and Isorna, E. (2014b). Crosstalking between the “gut-brain” hormone ghrelin and the circadian system in the goldfish. Effects on clock gene expression and food anticipatory activity. Gen. Comp. Endocrinol. 205, 287–295. doi: 10.1016/j.ygcen.2014.03.016
Nisembaum, L. G., De Pedro, N., Delgado, M. J., Sánchez-Bretaño, A., and Isorna, E. (2014a). Orexin as an input of circadian system in goldfish: effects on clock gene expression and locomotor activity rhythms. Peptides 52, 29–37. doi: 10.1016/j.peptides.2013.11.014
Nisembaum, L. G., Velarde, E., Tinoco, A. B., Azpeleta, C., de Pedro, N., Alonso-Gómez, A. L., et al. (2012). Light-dark cycle and feeding time differentially entrains the gut molecular clock of the goldfish (Carassius auratus). Chronobiol. Int. 29, 665–673. doi: 10.3109/07420528.2012.686947
NRC (2011). Nutrient requirements of fish and shrimp. In: Animal Nutrition. Washington: The National Academy Press.
Pando, M. P., and Sassone-Corsi, P. (2002). Unraveling the mechanisms of the vertebrate circadian clock zebrafish may light the way. Bioessays 24, 419–426. doi: 10.1002/bies.10091
Pfaffl, M. W. (2001). A new mathematical model for relative quantification in real-time RT-PCR. Nucleic Acids Res. 29:e45. doi: 10.1093/nar/29.9.e45
Rønnestad, I., Gomes, A. S., Murashita, K., Angotzi, R., Jönsson, E., and Volkoff, H. (2017). Appetite-controlling endocrine systems in teleosts. Front. Endocrinol. 8, 1–24. doi: 10.3389/fendo.2017.00073
Rønnestad, I., Murashita, K., Kottra, G., Jordal, A.-E. E., Narawane, S., Jolly, C., et al. (2010). Molecular Cloning and Functional Expression of Atlantic salmon peptide transporter 1 in Xenopus oocytes reveals efficient intestinal uptake of lysine-containing and other bioactive di- and tripeptides in teleost fish. J. Nutr. 140, 893–900. doi: 10.3945/jn.109.118240
Rønnestad, I., Yúfera, M., Ueberschär, B., Ribeiro, L., Sæle, Ø., and Boglione, C. (2013). Feeding behaviour and digestion physiology in larval fish - current knowledge, and gaps and bottlenecks in research. Rev. Aquacult. 5, S59–S98. doi: 10.1111/raq.12010
Rotllant, G., Moyano, F. J., Andrés, M., Díaz, M., Estévez, A., and Gisbert, E. (2008). Evaluation of fluorogenic substrates in the assessment of digestive enzymes in a decapod crustacean Maja brachydactyla larvae. Aquaculture 282, 90–96. doi: 10.1016/j.aquaculture.2008.06.004
Sánchez-Bretaño, A., Alonso-Gómez, Á. L., Delgado, M. J., and Isorna, E. (2015b). The liver of goldfish as a component of the circadian system: integrating a network of signals. Gen. Comp. Endocrinol. 221, 213–216. doi: 10.1016/j.ygcen.2015.05.001
Sánchez-Bretaño, A., Gueguen, M. M., Cano-Nicolau, J., Kah, O., Alonso-Gómez, A. L., Delgado, M. J., et al. (2015a). Anatomical distribution and daily profile of gper1b gene expression in brain and peripheral structures of goldfish (Carassius auratus). Chronobiol. Int. 32, 889–902. doi: 10.3109/07420528.2015.1049615
Sánchez-Vázquez, F. J., and López-Olmeda, J. F. (2018). “Environmental cycles and biological rhythms during early development,” in Emerging Issues in Fish Larvae Research, ed M. Yúfera (Cham: Springer International Publishing), 37–50.
Stephan, F. K. (2002). The ‘other' circadian system: food as a Zeitgeber. J. Biol. Rhythms 17, 284–292. doi: 10.1177/074873002129002591
Stokkan, K.-A., Yamazaki, S., Tei, H., Sakaki, Y., and Menaker, M. (2001). Entrainment of the circadian clock in the liver by feeding. Science 291, 490–493. doi: 10.1126/science.291.5503.490
Stone, D. A. J. (2003). Dietary carbohydrate utilization by fish. Rev. Fish Sci. 11, 337–369. doi: 10.1080/10641260390260884
Strubbe, J. H., and Van Dijk, G. (2002). The temporal organization of ingestive behaviour and its interactions with regulation of energy balance. Neurosci. Biobehav. Rev. 26, 485–498. doi: 10.1016/S0149-7634(02)00016-7
Tengjaroenkul, B., Smith, B. J., Caceci, T., and Smith, S. A. (2000). Distribution of intestinal enzyme activities along the intestinal tract of cultured Nile tilapia, Oreochromis niloticus L. Aquaculture 182, 317–327. doi: 10.1016/S0044-8486(99)00270-7
Ueberschär, B., Navarro-Guillén, C., Gomes, A., Rønnestad, I., Rojas-Garcia, C., Hanke, I., et al. (2018). “Variability in digestive enzyme capacity in early stages of marine fish larvae: ontogenetic variations, biorhythms, hormonal control and nutrient sensing mechanisms,” in Emerging Issues in Fish Larvae Research, ed M. Yúfera (Cham: Springer International Publishing), 87–129.
Vatine, G., Vallone, D., Gothilf, Y., and Foulkes, N. S. (2011). It's time to swim! Zebrafish and the circadian clock. FEBS Lett. 585, 1485–1494. doi: 10.1016/j.febslet.2011.04.007
Velarde, E., Haque, R., Iuvone, P. M., Azpeleta, C., Alonso-Gómez, A. L., and Delgado, M. J. (2009). Circadian clock genes of goldfish, carassius auratus: cDNA cloning and rhythmic expression of period and cryptochrome transcripts in retina, liver, and gut. J. Biol. Rhythm. 24, 104–113. doi: 10.1177/0748730408329901
Vera, L. M., De Pedro, N., Gómez-Milán, E., Delgado, M. J., Sánchez-Muros, M. J., Madrid, J. A., et al. (2007). Feeding entrainment of locomotor activity rhythms, digestive enzymes and neuroendocrine factors in goldfish. Physiol. Behav. 90, 518–524. doi: 10.1016/j.physbeh.2006.10.017
Vera, L. M., Negrini, P., Zagatti, C., Frigato, E., Sánchez-Vázquez, F. J., and Bertolucci, C. (2013). Light and feeding entrainment of the molecular circadian clock in a marine teleost (Sparus aurata). Chronobiol. Int. 30, 649–661. doi: 10.3109/07420528.2013.775143
Wang, C., Xie, S., Zhu, X., Lei, W., Yang, Y., and Liu, J. (2006). Effects of age and dietary protein level on digestive enzyme activity and gene expression of Pelteobagrus fulvidraco larvae. Aquaculture 254, 554–562. doi: 10.1016/j.aquaculture.2005.11.036
Ye, R., Selbt, C. P., Chiou, Y.-Y., Ozkan-Dagliyan, I., Gaddameedhi, S., and Sancar, A. (2014). Dual modes of CLOCK:BMAL1 inhibition mediated by cryptochrome and period proteins in the mammalian circadian clock. Genes Dev. 28, 1989–1998. doi: 10.1101/gad.249417.114
Yuen, B. B. H., Wong, C. K. C., Woo, N. Y. S., and Au, D. W. T. (2007). Induction and recovery of morphofunctional changes in the intestine of juvenile carnivorous fish (Epinephelus coioides) upon exposure to foodborne benzo[a]pyrene. Aquat. Toxicol. 82, 181–194. doi: 10.1016/j.aquatox.2007.02.010
Yúfera, M., and Darias, M. J. (2007). Changes in the gastrointestinal pH from larvae to adult in Senegal sole (Solea senegalensis). Aquaculture 267, 94–99. doi: 10.1016/j.aquaculture.2007.02.009
Yúfera, M., Moyano, F. J., Astola, A., Pousão-Ferreira, P., and Martínez-Rodríguez, G. (2012). Acidic digestion in a teleost: postprandial and circadian pattern of gastric pH, pepsin activity, and pepsinogen and proton pump mRNAs expression. PLoS ONE 7:e33687. doi: 10.1371/journal.pone.0033687
Yúfera, M., Moyano, F. J., and Martínez-Rodríguez, G. (2018). “The digestive function in developing fish larvae and fry. from molecular gene expression to enzymatic activity,” in Emerging Issues in Fish Larvae Research, ed M. Yúfera (Cham: Springer International Publishing), 51–86 doi: 10.1007/978-3-319-73244-2_3
Yúfera, M., Nguyen, M. V., Navarro-Guillén, C., Moyano, F. J., Jordal, A.-E. O., Espe, M., et al. (2019). Effect of increased rearing temperature on digestive function in cobia early juvenile. Comp. Biochem. Physiol. 230A, 71–80. doi: 10.1016/j.cbpa.2019.01.007
Yúfera, M., Perera, E., Mata-Sotres, J. A., Calduch-Giner, J., Martínez-Rodríguez, G., and Pérez-Sánchez, J. (2017). The circadian transcriptome of marine fish (Sparus aurata) larvae reveals highly synchronized biological processes at the whole organism level. Sci. Rep. 7:12943. doi: 10.1038/s41598-017-13514-w
Yúfera, M., Romero, M. J., Pujante, I. M., Astola, A., Mancera, J. M., Sánchez-Vázquez, F. J., et al. (2014). Effect of feeding frequency on the daily rhythms of acidic digestion in a teleost fish (gilthead seabream). Chronobiol. Int. 31, 1024–1033. doi: 10.3109/07420528.2014.944265
Zeytin, S., Schulz, C., and Ueberschär, B. (2016). Diurnal patterns of tryptic enzyme activity under different feeding regimes in gilthead sea bream (Sparus aurata) larvae. Aquaculture 457, 85–90. doi: 10.1016/j.aquaculture.2016.02.017
Zhao, S., Han, D., Zhu, X., Jin, J., Yang, Y., and Xie, S. (2016). Effects of feeding frequency and dietary protein levels on juvenile allogynogenetic gibel carp (Carassius auratus gibelio) var. CAS III: growth, feed utilization and serum free essential amino acids dynamics. Aquacult. Res. 47, 290–303. doi: 10.1111/are.12491
Keywords: circadian system, digestive efficiency, feeding protocol, gastrointestinal tract, Solea senegalensis
Citation: Gilannejad N, Moyano FJ, Martínez-Rodríguez G and Yúfera M (2021) Feeding Protocol Modulates the Digestive Process in Senegalese Sole (Solea senegalensis) Juveniles. Front. Mar. Sci. 8:698403. doi: 10.3389/fmars.2021.698403
Received: 21 April 2021; Accepted: 03 June 2021;
Published: 23 July 2021.
Edited by:
Enric Gisbert, Institute of Agrifood Research and Technology (IRTA), SpainReviewed by:
José Miguel Cerda-Reverter, Consejo Superior de Investigaciones Científicas (CSIC), SpainMaria J. Darias, Institut de Recherche Pour le Développement (IRD), France
Copyright © 2021 Gilannejad, Moyano, Martínez-Rodríguez and Yúfera. This is an open-access article distributed under the terms of the Creative Commons Attribution License (CC BY). The use, distribution or reproduction in other forums is permitted, provided the original author(s) and the copyright owner(s) are credited and that the original publication in this journal is cited, in accordance with accepted academic practice. No use, distribution or reproduction is permitted which does not comply with these terms.
*Correspondence: Neda Gilannejad, bmVnaUBub3JjZXJlc2VhcmNoLm5v
†Present address: Neda Gilannejad, NORCE Norwegian Research Centre AS, Uni Research Environment, Bergen, Norway