 Qiang Wang
 Sergey Danilov
 Dmitry Sidorenko
 Xuezhu Wang
- 1Alfred Wegener Institute Helmholtz Centre for Polar and Marine Research, Bremerhaven, Germany
- 2Laboratory for Regional Oceanography and Numerical Modeling, Pilot National Laboratory for Marine Science and Technology, Qingdao, China
- 3Department of Mathematics and Logistics, Jacobs University, Bremen, Germany
- 4A. M. Obukhov Institute of Atmospheric Physics, Russian Academy of Science, Moscow, Russia
- 5College of Oceanography, Hohai University, Nanjing, China
River runoff supplies the Arctic Ocean with a large amount of freshwater and land-derived material, so it is important for both the physical and biogeochemical marine environment. In this study, we used wind perturbation simulations to elucidate the response of the circulation pathways and exports of Arctic river runoff to different atmospheric circulation regimes. Specifically, wind perturbations representing the negative and positive phases of the Arctic Oscillation and Beaufort High modes were imposed over the Arctic Ocean separately in different sensitivity experiments. In addition, some combinations of the two modes were also considered in sensitivity experiments. By comparing these experiments with a control simulation, we revealed the impact of different wind perturbations. The atmospheric circulation regimes influence the Arctic surface geostrophic currents through changing the halosteric height, which is associated with the changes in spatial distribution of surface freshwater. The circulation pathways of river runoff, and Pacific and Atlantic derived surface waters are mainly determined by the surface geostrophic currents. The positive (negative) Arctic Oscillation reduces (increases) freshwater storage and sea surface height in the Makarov and Eurasian basins, thus strengthening (weakening) the cyclonic circulation and weakening (strengthening) the anticyclonic circulation; Accordingly, the Eurasian runoff leaves the Siberian shelf at more eastern (western) locations, and has an enhanced export through the Fram Strait (Canadian Arctic Archipelago). The positive (negative) Beaufort High increases (reduces) freshwater storage and sea surface height in the Amerasian Basin, thus strengthening (weakening) the anticyclonic circulation; Accordingly, the Eurasian runoff export through the Fram Strait and the Mackenzie River runoff export through the Canadian Arctic Archipelago are reduced (increased). The positive Arctic Oscillation increases freshwater available to the Beaufort Gyre, which can be efficiently accumulated there in the presence of a positive Beaufort High forcing. The impact of the Beaufort High mode on the location of the Transpolar Drift Stream and runoff circulation pathways is stronger with a positive Arctic Oscillation than with a neutral Arctic Oscillation state. Our results also showed that Eurasian runoff can only have a relatively small contribution to freshwater accumulation in the Beaufort Gyre region.
1. Introduction
The Arctic Ocean can influence the large-scale ocean circulation and climate through the accumulation and release of freshwater. It receives a large amount of river runoff, net precipitation and low-salinity Pacific Water, thus having a strong halocline and being a large reservoir of low-salinity water (Rudels et al., 1996; Serreze et al., 2006; Carmack et al., 2016). The excess low-salinity water in the Arctic upper ocean is released to the subpolar North Atlantic, where it can increase the stratification of the upper ocean and impact deep water formation and thus large-scale circulation. To emphasize the contrast with the much more saline Atlantic Water from midlatitude that also feeds the subpolar North Atlantic and the Arctic Ocean, the upper ocean low-salinity water in the Arctic Ocean has been traditionally termed “Arctic freshwater,” a terminology that will also be used in this study.
Atmospheric circulation drives the accumulation and release of Arctic freshwater (e.g., Proshutinsky and Johnson, 1997; Zhang et al., 2003; Condron et al., 2009). An anticyclonic wind regime over the Arctic Ocean tends to accumulate more freshwater in the Arctic through enhancing surface Ekman convergence, while a cyclonic wind regime tends to release freshwater through producing Ekman divergence anomalies. The Arctic freshwater content (FWC) varied on a quasi-decadal time scale before the 1990s and remained in an increasing state afterwards for about two decades (Proshutinsky et al., 2015). The latter was associated with the prevailing anticyclonic winds over that period (McPhee et al., 2009; Giles et al., 2012; Polyakov et al., 2013; Rabe et al., 2014). Since the mid 1990s, the Arctic FWC has increased for more than 10, 000km3 (Rabe et al., 2014; Wang et al., 2019b). Amplified by the effect of sea ice decline, the accumulation of freshwater was mainly in the Amerasian Basin (Wang et al., 2019b). The Beaufort Gyre region had a FWC increase of about 6, 400km3 in the period of 2003 – 2018 (Proshutinsky et al., 2019).
The upper ocean circulation in the Arctic Ocean is mainly characterized by the anticyclonic Beaufort Gyre circulation and the Transpolar Drift Stream which is the front separating the Pacific and Atlantic derived waters (Figure 1). The leading mode of the Arctic atmospheric circulation, the Arctic Oscillation (Thompson and Wallace, 1998), was in a strongly positive phase from the end 1980s to the mid 1990s (Figure 2). The associated cyclonic winds in this period caused the Transpolar Drift Stream to shift from its climatological location roughly at the Lomonosov Ridge to the Alpha-Mendeleev Ridge, thus leading to a retreat of Pacific-derived water and an expansion of Atlantic-derived water (e.g., Carmack et al., 1995; Morison et al., 1998; Steele and Boyd, 1998). After the Arctic Oscillation returned to a negative to neutral state, the location of Transpolar Drift Stream and the spatial distribution of different water masses relaxed to their climatological condition at the beginning of the 2000s (e.g., Steele and Ermold, 2004; Morison et al., 2006; Alkire et al., 2007). The stronger Beaufort High in the late 2000s, as indicated by the strongly negative wind curl (Figure 2), along with a concurrent increase in freshwater availability, caused a rapid increase in the FWC in the Beaufort Gyre region (Zhang et al., 2016; Wang et al., 2018a; Proshutinsky et al., 2019). This increase in the FWC was manifested by an increase in sea surface height and the speedup of the anticyclonic Beaufort Gyre circulation (McPhee, 2013; Armitage et al., 2017). Both the strength and spatial extent of the Beaufort Gyre circulation and the strength and location of the Transpolar Drift Stream vary with the change in sea surface height, which is mainly determined by the change in halosteric height in response to wind variability (Wang, 2021).
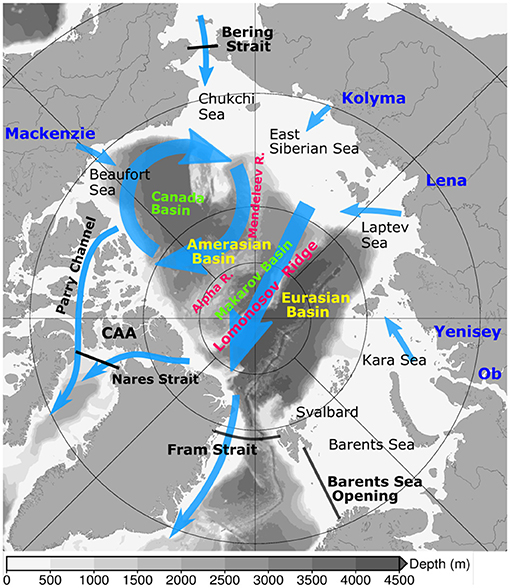
Figure 1. Schematic of Arctic upper ocean circulation (blue arrows). The background gray color shows bottom bathymetry. The Arctic gateways are indicated with black lines. CAA stands for Canadian Arctic Archipelago.
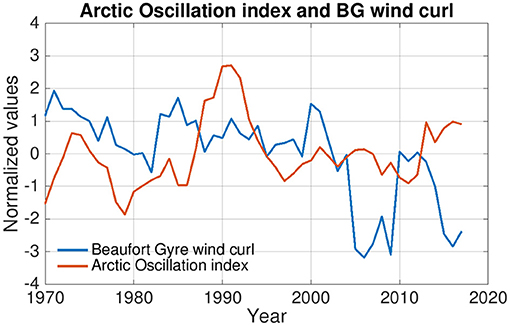
Figure 2. Annual mean Arctic Oscillation index (red) and wind curl over the Beaufort Gyre region (blue). Five years running means are shown. A positive (negative) Arctic Oscillation index is associated with a negative (positive) sea level pressure anomaly over the Arctic Ocean. See also Figure 3 for the spatial pattern of the sea level pressure anomaly.
River runoff accounts for about 40% of the Arctic total freshwater input (Serreze et al., 2006; Haine et al., 2015). It also supplies the Arctic Ocean with a large amount of land derived material that can affect the biogeochemistry and ecosystem in the Arctic Ocean (Charette et al., 2020). Similar to the position of the Transpolar Drift Stream and the spatial distribution of Pacific and Atlantic derived waters, the pathway of river runoff in the Arctic Ocean can be also significantly influenced by the phases of the Arctic Oscillation (Ekwurzel et al., 2001; Anderson et al., 2004; Timmermans et al., 2011). It was argued that the increase of FWC in the Beaufort Gyre region in the 2000s was mainly due to the cyclonic shift of the Eurasian runoff pathway driven by positive Arctic Oscillation (Morison et al., 2012). On the contrary, some other studies suggested that Pacific Water, Mackenzie River runoff and sea ice meltwater are the main contributors of freshwater accumulated in the Beaufort Gyre region over the recent decades (Kelly et al., 2019; Proshutinsky et al., 2019). Changes in the phase of the Arctic Oscillation may also modify the export gateways of different Arctic water masses (e.g., Steele and Ermold, 2004; Jahn et al., 2010; Lique et al., 2010; Dodd et al., 2012; Rabe et al., 2013; Aksenov et al., 2016). However, it is unclear how the variability of the Beaufort High, which is a joint active center of different atmospheric modes (Serreze and Barry, 2011) and has no strong correlation with the Arctic Oscillation (Figure 2), can influence the circulation pathways and exports of river runoff of different origins. Furthermore, the joint impact of the Arctic Oscillation and Beaufort High on Arctic Ocean circulation is also not well-understood yet.
In this paper, we will use numerical simulations to understand how different atmospheric circulation regimes change the Arctic upper ocean circulation and influence the pathways and exports of Eurasian and north American river runoff. For this purpose, we will use wind perturbation experiments considering different phases of the Arctic Oscillation and Beaufort High and some of their combinations as well. In addition, we will explore the possibility for Eurasian runoff to contribute to the FWC in the Beaufort Gyre region.
The outline of this paper is as follows. We describe the model and method in section 2, present the results in section 3, discuss implications in section 4 and summarize the study in section 5.
2. Method and Model Setups
In this study we used the Finite Element Sea-ice Ocean Model (FESOM1.4, Wang et al., 2014). It is based on unstructured-mesh numerical methods and allows for multi-resolution global simulations (Danilov et al., 2004, 2015; Wang et al., 2008, 2014). The model configuration used here is similar to those previously employed for studying the Arctic Ocean (Wang et al., 2019b, 2020b; Wang, 2021) and is briefly described below before the description of the methodology specific for the current study.
The model grid has a horizontal resolution of nominal 1o in most areas of the global ocean. North of 45oN the resolution is set to 24 km and in the Arctic Ocean the grid is refined to 4.5 km. This high resolution improves the representation of the narrow straits in the Canadian Arctic Archipelago (CAA) (Wekerle et al., 2013; Wang et al., 2018b), although it is only marginally eddy-permitting in the Arctic basin (Wang et al., 2020a). The vertical resolution is 10 m in the upper 100 m and gradually coarsened downward. The model bottom topography is derived from a blend of two bathymetry datasets. The 2-km resolution version of the International Bathymetric Chart of the Arctic Oceans (IBCAO; Jakobsson et al., 2008) is used in the Arctic region and the 1-min resolution version of the General Bathymetric Chart of the Oceans (GEBCO) is used in other parts of the global ocean.
For tracer advection, a second-order flux-corrected-transport (FCT) scheme is used, which eliminates tracer overshoots (Löhner et al., 1987). Vertical mixing is parameterized with the K-profile parameterization (KPP) scheme (Large et al., 1994). The Smagorinsky viscosity (Smagorinsky, 1963) in a biharmonic form is used for horizontal viscosity. Eddies are parameterized with Redi diffusion (Redi, 1982) and the Gent and McWilliams (1990) parameterization, and eddy diffusivity varies with horizontal resolution and vertical stratification as described in Wang et al. (2014). In the sea ice module, the elastic-viscous-plastic (EVP, Hunke and Dukowicz, 1997) rheology and the Parkinson and Washington (1979) sea ice thermodynamics are used.
We conducted a control simulation for 30 model years. The wind forcing used to drive the model is the 6-hourly normal year (1-year repeating) forcing of the Coordinated Ocean-ice Reference Experiments Phase II (CORE2) atmospheric forcing datasets (Large and Yeager, 2009). Other forcing fields, including downward shortwave and longwave radiation (daily), near-surface air temperature and humidity (6 hourly) and precipitation (monthly), are obtained by averaging the CORE2 interannually varying forcing over the 2000s. Therefore, they are 1-year forcing fields with the same frequency as the original CORE2 forcing. As sea ice states can significantly influence the quantitative response of the Arctic Ocean to winds through modifying momentum transfer (Wang, 2021), using the atmospheric thermal forcing representing the 2000s instead of the CORE2 normal year thermal forcing (i.e., the climatological forcing) allows us to quantify the impact of winds on river runoff pathways in the present climate conditions. The monthly climatological river runoff is taken from Dai et al. (2009). The simulation is initialized from the PHC3 winter climatology provided by Steele et al. (2001).
A set of wind perturbation experiments were carried out starting from the 20th year results of the control simulation. They are the same as the control run except that wind perturbations were added to the winds when calculating wind stress. In the first group of perturbed simulations, wind perturbations representing the negative and positive phases of the Arctic Oscillation and Beaufort High were applied separately in four different simulations (AOn, AOp, BHp, and BHn, see Table 1). The second group has two simulations with perturbations of both the Arctic Oscillation and Beaufort High. They were forced by the same positive Arctic Oscillation forcing, but also by different phases of the Beaufort High forcing: one with positive Beaufort High forcing and the other with negative one (AOp+BHp and AOp+BHn). These simulations were motivated by two facts: First, we found that Eurasian runoff can get very close to the Beaufort Gyre region (see the section 3), which may facilitate the Beaufort High forcing to influence the circulation pathway of the Eurasian runoff; Second, the Beaufort High can be in different phases when the Arctic Oscillation is in a positive phase (for example, at the beginning of the 1990s and in the mid 2010s, Figure 2). In the last group of wind perturbation simulations, we repeated three of the wind perturbation experiments mentioned above, but with the Bering Strait closed in these new runs (AOp_closed, AOp+BHp_closed and AOp+BHn_closed). With these simulations we want to explore the impact of Bering Strait inflow on the pathways of river runoff.
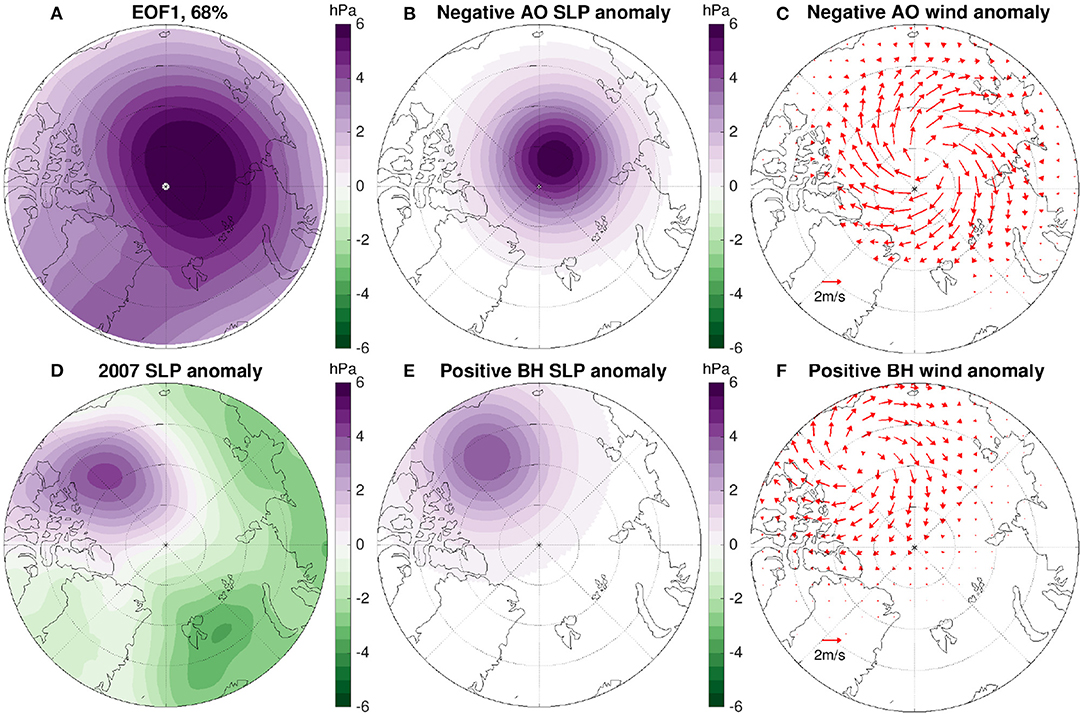
Figure 3. (A) The first empirical orthogonal function (EOF) of sea level pressure (SLP, north of 70oN) for the period 1980–2019. It resembles the pattern of the negative, anticyclonic Arctic Oscillation (AO) phase. (B) Idealized SLP anomaly representing negative AO and (C) the associated wind anomaly. (D) 2007 SLP anomaly relative to the mean over 1980–2019. It shows a strong positive Beaufort High (BH) SLP anomaly. (E) Idealized SLP anomaly representing positive BH anomaly and (F) the associated wind anomaly.
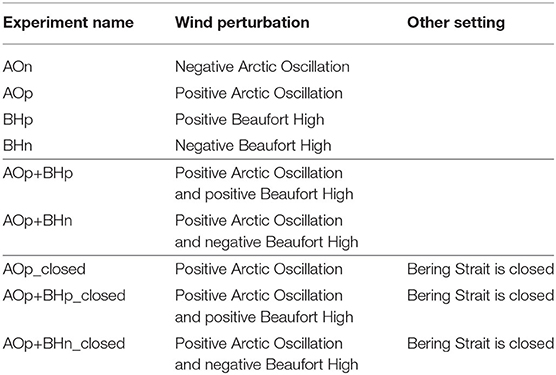
Table 1. List of wind perturbation simulations used in this study.
We used idealized wind perturbations representing different phases of the Arctic Oscillation and Beaufort High. Figure 3A shows the first empirical orthogonal function (EOF1, explaining 68%) of deseasonalized monthly sea level pressure north of 70oN calculated over the period of 1980–2019 using the JRA55-do reanalysis dataset (Tsujino et al., 2018). It resembles the negative phase of the Arctic Oscillation. Figure 3D depicts the sea level pressure anomaly in 2007 relative to the 1980–2019 mean. It shows a strong positive Beaufort High that contributed to the rapid increase in the liquid FWC in the Beaufort Gyre region in the 2000s (Proshutinsky et al., 2019). The idealized sea level pressure and wind anomalies representing the negative Arctic Oscillation and positive Beaufort High are shown in Figures 3B,C,E,F, respectively. The Beaufort High perturbations are the same as those used in the project of Climate Response Functions for the Arctic Ocean (e.g., Marshall et al., 2017; Wang et al., 2019a).
Four passive tracers were introduced. They experienced the same advection and diffusion processes as salinity and temperature. Their initial values were set to zero. Two of the passive tracers represented the Eurasian and north American runoff, respectively. They received their respective runoff fluxes (with a unit m/s) at the surface. For the Eurasian runoff tracer, the river discharge in the Kara, Laptev, and East Siberian Seas were included. There are four large rivers in these regions, including Ob, Yenisey, Lena, and Kolyma (Figure 1). For the north American runoff tracer, the Beaufort Sea region was considered. Mackenzie River supplies most of the runoff in this region. Runoff from the CAA and Bering Sea is not included in this passive tracer.
The other two passive tracers are dye tracers representing the Atlantic Water entering the Arctic Ocean through the Barents Sea Opening and the Pacific Water through the Bering Strait, respectively. During the simulations their values were restored to one inside the corresponding inflow gateways. The circulations and exports of Atlantic and Pacific waters are not the focus of this study, but we will use these dye tracers to better understand the changes in upper ocean circulations.
We will calculate the liquid freshwater inventory
where S is ocean salinity, Sref = 34.8psu is the reference salinity and D is the isohaline depth of S = Sref. FWI is measured in meters and represents the amount of freshwater contained in the ocean column. It is equivalent to the amount of pure (zero-salinity) water required to be taken out from an ocean column so that the mean salinity in the ocean column is changed to the reference salinity. Integrating FWI laterally in a region we can get the volumetric FWC (with a unit km3). Integrating the runoff passive tracers vertically and in 3D space we can get the runoff inventory (in meter) and volume (in km3), respectively.
In this study the Arctic Ocean domain is defined with the four Arctic gateways shown by the black lines in Figure 1 (the Bering Strait, the southern boundary of the CAA, the Fram Strait and Barents Sea Opening). The Arctic deep basin (bottom bathymetry deeper than 500 m) is composed of the Eurasian and Amerasian basins which are separated by the Lomonosov Ridge. The Beaufort Gyre region is defined with the longitude range of 170oW−130oW, latitude range of 70oN−81oN, and bottom bathymetry deeper than 500 m.
The model configuration used in this study is able to well simulate Arctic sea ice and FWC variability in historical simulations as shown in previous studies (Wang et al., 2018a, 2019b, 2021b; Wang, 2021), so model evaluations are not repeated here. In the following we will show the results from the sensitivity experiments directly.
3. Results
3.1. Freshwater Storage and Ocean Circulation
3.1.1. Cases With One Mode of Wind Perturbations
With the negative Arctic Oscillation perturbation, the surface Ekman transport anomaly is directed toward the central Arctic (Figure 4A), which leads to an increase in liquid FWI in both the Eurasian Basin and northwestern Amerasian (mainly Makarov) Basin (Figure 4B). Contemporarily, the FWI in the marginal seas is slightly reduced (Figure 4B). The FWC in both the Arctic deep basins increases monotonically with time (Figures 5C,D), and the Arctic total FWC increases by about 13, 000km3 at the end of the simulation (Figure 5A). The FWC in the Beaufort Gyre region is very slightly reduced with the negative Arctic Oscillation forcing (Figure 5B). As found by Wang (2021), the strength of the FWC response to wind perturbations depends on the sea ice state, and the persistent Arctic sea ice decline in the past decades has significantly enhanced the response. The quantitative results of our simulations are therefore more representative of the situation in the 2000s (the period that the atmospheric thermal forcing is based on), rather than the climatological condition in the 20th century.
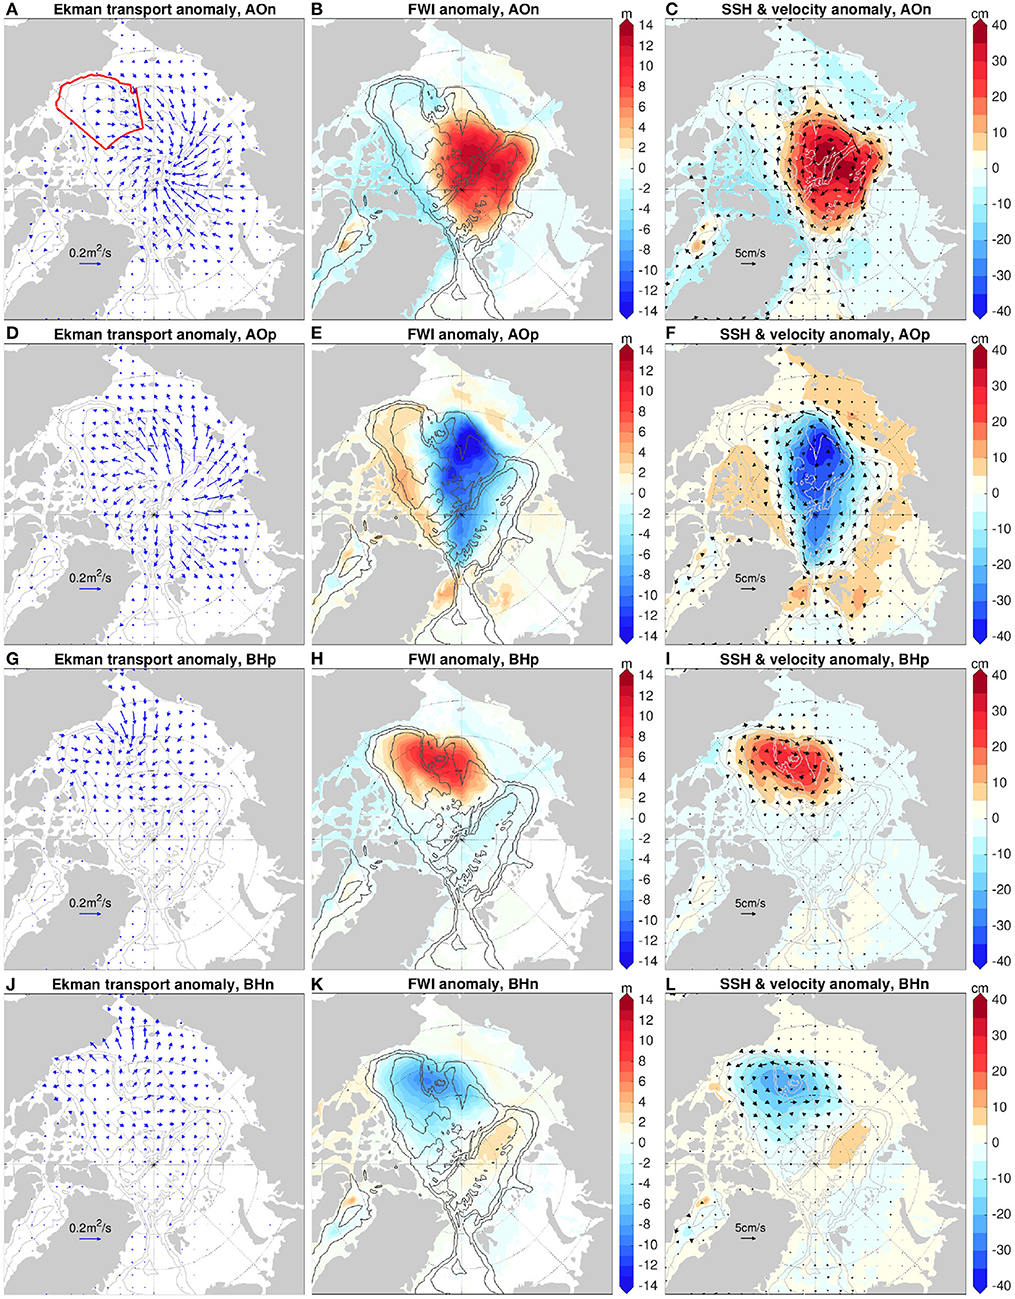
Figure 4. (A) Anomaly of surface Ekman transport with negative Arctic Oscillation (AO) forcing relative to the control run averaged over the 10 model years. (B) Anomaly of freshwater inventory (FWI, in m) with negative AO forcing relative to the control run averaged over the last model year. (C) Anomalies of sea surface height (SSH) and upper 150 m mean velocity with negative AO forcing relative to the control run averaged over the last model year. (D–F) The same as (A–C), but for the case with positive AO forcing. (G–I) The same as (A–C), but for the case with positive Beaufort High (BH) forcing. (J–L) The same as (A–C), but for the case with negative BH forcing. The 500, 2,000, and 3,500 m isobaths are shown with gray contour lines.
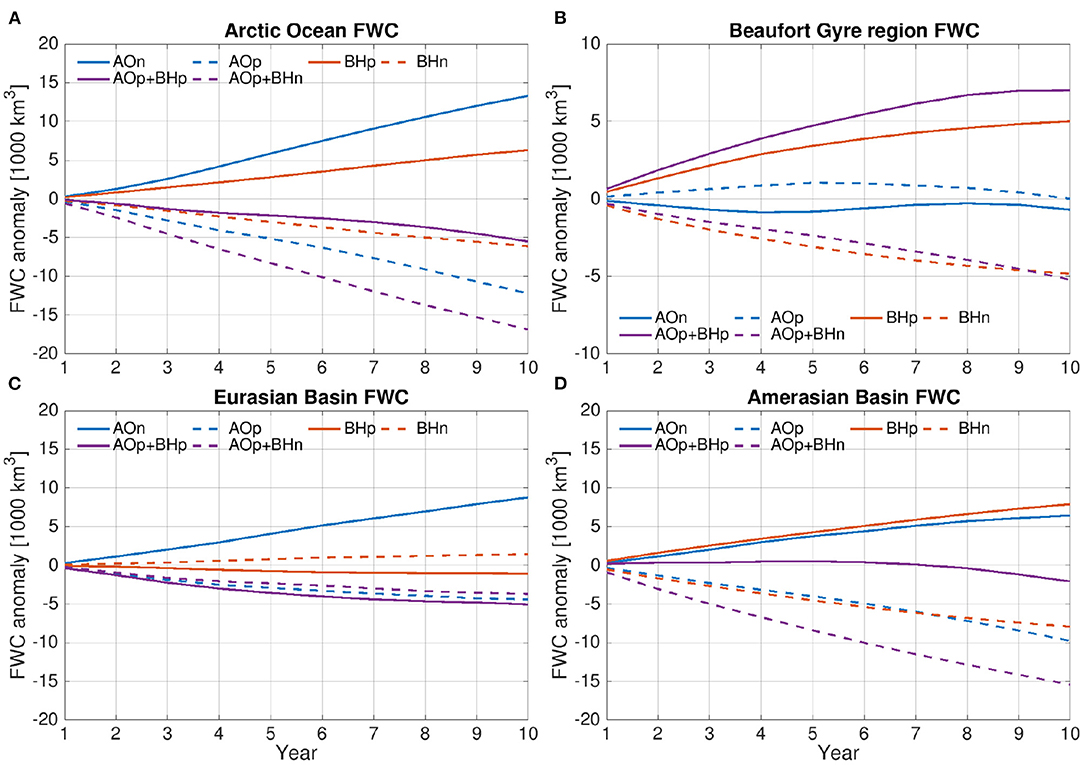
Figure 5. (A) Time series of the Arctic Ocean freshwater content (FWC) anomaly relative to the control run. (B–D) The same as (A), but for FWC anomaly in the Beaufort Gyre region, Eurasian Basin, and Amerasian Basin, respectively.
The changes in sea surface height under the negative Arctic Oscillation forcing have a spatial pattern resembling that of FWI (Figure 4C), reflecting the fact that the Arctic sea surface height variability is mainly determined by the halosteric effect. Accordingly, the upper ocean circulation has an anticyclonic anomaly (Figure 4C).
With the positive Arctic Oscillation perturbation, the Ekman transport anomaly is directed from the central Arctic to the periphery (Figure 4D), and the changes in FWI, FWC, sea surface height and upper ocean circulation are opposite to those induced by the negative perturbation (Figures 4E,F, 5). The magnitudes of the FWI anomalies are not exactly the same between the cases with negative and positive Arctic Oscillation perturbations (cf. Figures 4B,E). Factors such as the details of the original freshwater spatial pattern and changes in pathways of different water masses may influence the details of the FWI anomalies.
The positive Beaufort High perturbation causes a convergence anomaly in the Ekman transport in the Amerasian Basin (Figure 4G). Accordingly, the FWI has a positive anomaly in the Amerasian Basin (Figure 4H). The magnitude of the Ekman transport anomaly is smaller on the northeastern side of the Amerasian Basin, where thicker and more compact sea ice reduces the momentum transfer. As a result, the increase in FWI is smaller in this region. In both the Eurasian Basin and the marginal seas adjacent to the Amerasian Basin, there are small negative FWI anomalies. The FWC integrated in different regions consistently reveals that the accumulation of freshwater occurs mainly in the Beaufort Gyre region and the FWC slightly decreases in the Eurasian Basin (Figure 5). The increased FWI in the Amerasian Basin causes a sea surface height doming and a spin-up of the anticyclonic circulation (Figure 4I).
The Ekman transport has a divergent anomaly with the negative Beaufort High perturbation (Figure 4J). As expected, the resulting changes in FWI, FWC, sea surface height and upper ocean circulation are opposite to those induced by the positive perturbation (Figures 4K,L, 5).
The changes in ocean circulation induced by the wind perturbations are manifested by the changes in the pathways and spatial distribution of Atlantic and Pacific derived waters. The negative Arctic Oscillation perturbation causes the anticyclonic circulation to expand into the Eurasian Basin (Figure 6A). Consequently, the Atlantic Water from the Barents Sea in the upper ocean circulates anticyclonically along the southern boundary of the Eurasian Basin and has a larger proportion transported into the Amerasian Basin along the continental shelf north of the Greenland in comparison to the control run (Figure 6B). Following this pathway, more Atlantic Water enters the Nares Strait and the central CAA. Some Atlantic Water can reach the Parry Channel and leave the Arctic Ocean from there. A small portion of the Atlantic Water continues with the anticyclonic pathway along the southern boundary of the Canada Basin. The Pacific Water circulation pathway is also significantly influenced by the negative Arctic Oscillation forcing (Figure 6C). The Pacific Water is advected by the anticyclonic circulation through the entire Eurasian Basin and back to the Amerasian Basin. It is largely located on the inner side of the Atlantic Water and has a lower concentration in the Fram Strait and CAA compared to the control run.
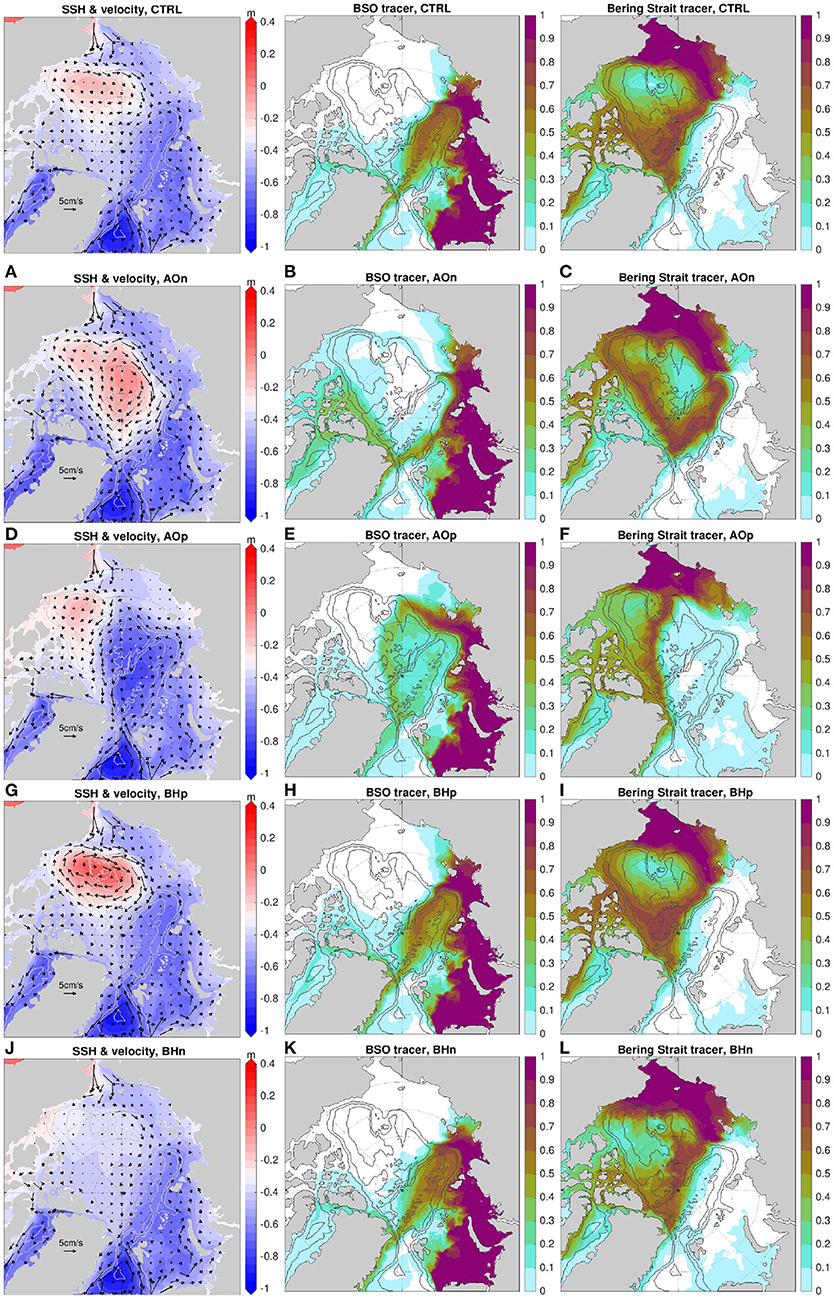
Figure 6. Left: Sea surface height (SSH) and upper 150 m mean velocity in the last model year. Middle column: The upper 150 m mean value of Barents Sea Opening (BSO) passive tracer concentration in the last model year. Right: The upper 150 m mean value of Bering Strait passive tracer concentration in the last model year. (A–C): the case with negative Arctic Oscillation (AO) forcing. (D–F): the case with positive AO forcing. (G–I): the case with positive Beaufort High (BH) forcing. (J–L): the case with negative BH forcing. The control run results are shown in the top row of the figure for reference. The 500, 2,000, and 3,500 m isobaths are shown with gray contour lines.
The persistent positive Arctic Oscillation strengthens the cyclonic circulation and pushes the Transpolar Drift Stream beyond the Mendeleev Ridge (Figure 6D). Accordingly the anticyclonic circulation shrinks to the central Canada Basin. In this situation, the Atlantic Water leaves the continental shelf at the Mendeleev Ridge and circulates cyclonically through the Amerasian Basin (Figure 6E). The Atlantic Water has an enlarged spatial occupation, while the area with high Pacific Water concentration becomes smaller (Figure 6F). The cyclonic circulation carries a small portion of the Pacific and Atlantic waters back to the Eurasian Basin, and the Barents Sea inflow also contains a low concentration of Pacific Water that has returned from the subpolar North Atlantic. The passive tracer concentration also indicates that the modified ocean circulation causes more Pacific Water to enter the Fram Strait and Nares Strait and reduces the amount of Pacific Water entering the Parry Channel (Figure 6F).
The changes in ocean circulation induced by the Beaufort High perturbations are mainly confined to the Amerasian Basin (Figures 6G,J). These changes have some impacts on the details of the water mass circulation pathways, but the impacts are weaker than in the cases with Arctic Oscillation perturbations (Figures 6H,I,K,L). The latter is because the location of the Transpolar Drift Stream is not significantly altered by the Beaufort High perturbations, even though the strength of the anticyclonic circulation in the Amerasian Basin is changed significantly.
3.1.2. Cases With Two Modes of Wind Perturbations
In the last section, we showed that the location of the Transpolar Drift Stream plays a leading role in determining the circulation pathways and spatial distribution of Atlantic and Pacific derived waters. We also found that it corresponds to the front separating different water masses and is mainly determined by the Arctic Oscillation in the experiments analyzed so far. When the Arctic Oscillation is in a positive phase, the Transpolar Drift Stream shifts to the Amerasian Basin and becomes closer to the Beaufort Gyre region. In this case, can the Beaufort High perturbations play a more important role than when the Transpolar Drift Stream is located near the Lomonosov Ridge? In the following we will analyze the second group of wind perturbation experiments (Table 1) to understand the joint effect of the Beaufort High perturbations and the positive Arctic Oscillation perturbation.
When the Transpolar Drift Stream shifts to the Amerasian Basin due to the presence of positive Arctic Oscillation perturbation, the Beaufort High perturbations are found to be much more efficient in influencing the location of the Transpolar Drift Stream and the spatial extent of the anticyclonic and cyclonic circulations (Figures 7A,D). Compared to the case only with the positive Arctic Oscillation perturbation (Figure 6D), adding the positive Beaufort High perturbation strengthens the anticyclonic circulation and limits the expansion of the cyclonic circulation (Figure 7A). On the contrary, adding the negative Beaufort High perturbation further increases the area of the cyclonic circulation and nearly eliminates the anticyclonic circulation (Figure 7D).
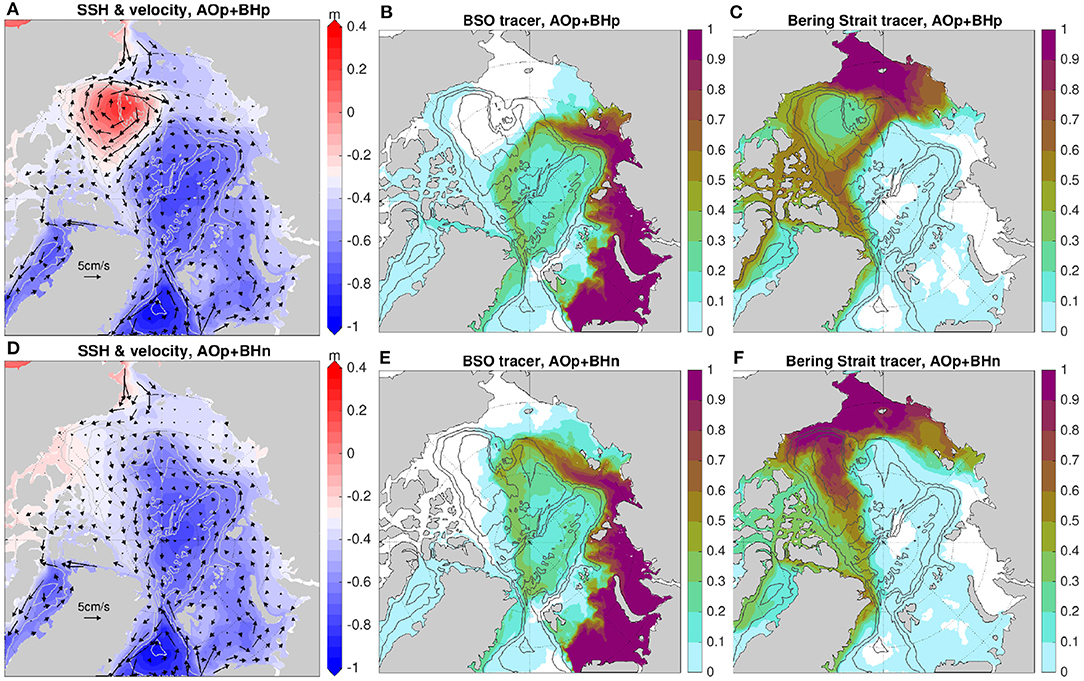
Figure 7. Left: Sea surface height (SSH) and upper 150 m mean velocity in the last model year. Middle column: The upper 150 m mean value of Barents Sea Opening (BSO) passive tracer concentration in the last model year. Right: The upper 150 m mean value of Bering Strait passive tracer concentration in the last model year. (A–C): the case with positive Arctic Oscillation (AO) forcing and positive Beaufort High (BH) forcing. (D–F): the case with positive AO forcing and negative BH forcing. The 500, 2,000, and 3,500 m isobaths are shown with gray contour lines.
The Atlantic Water and Pacific Water passive tracers consistently indicate the changes in the upper ocean circulation associated with the joint effect of Beaufort High and Arctic Oscillation perturbations. Adding the positive Beaufort High perturbation reduces the spatial occupation of the Atlantic Water and increases the area of the Pacific Water (cf. Figures 6E,F, 7B,C). The relatively strong anticyclonic Beaufort Gyre circulation with the positive Beaufort High carries some Atlantic Water to the southern Canada Basin (Figure 7B). Adding the negative Beaufort High perturbation, on the contrary, allows more Atlantic Water to enter the Canada Basin from the northwest and causes the Pacific Water circulation pathway to be closer to the CAA (cf. Figures 6E,F, 7E,F). In this case, despite the nearly eliminated Beaufort Gyre circulation, Pacific Water is still mainly transported along the shifted Transpolar Drift Stream rather than in the cyclonic transport along the Alaskan coast (Figure 7F).
In terms of the total FWC in the Arctic Ocean and in different Arctic basins, the responses to the contemporary perturbations of Arctic Oscillation and Beaufort High modes are roughly the sum of the responses to each individual perturbation (Figure 5).
3.2. Impact on Runoff Circulation Pathways
Figure 8 depicts the sea surface height and upper ocean velocity, the inventory of Eurasian runoff and the inventory of Mackenzie River runoff in the left, middle and right columns, respectively. Comparing Figure 8 with Figure 6 indicates that the impact of atmospheric circulation regimes on the circulation pathway of Eurasian runoff is qualitatively similar to that on the Barents Sea branch Atlantic Water, and the impact on the circulation pathway of Mackenzie River runoff is qualitatively similar to that on the Pacific Water.
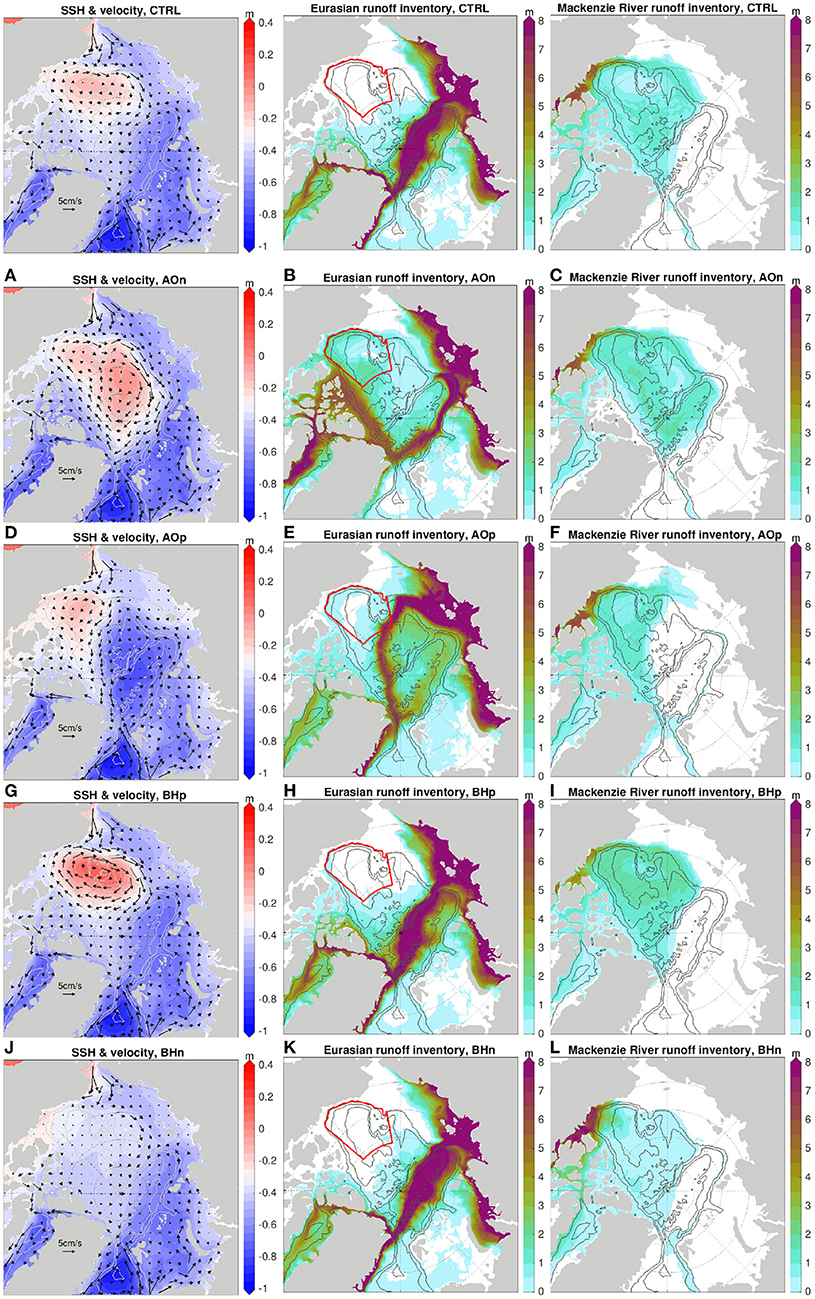
Figure 8. Left: Sea surface height (SSH) and upper 150 m mean velocity in the last model year. Middle column: The inventory of Eurasian runoff (in m) in the last model year. Right: The inventory of Mackenzie River runoff in the last model year. (A–C): the case with negative Arctic Oscillation (AO) forcing. (D–F): the case with positive AO forcing. (G–I): the case with positive Beaufort High (BH) forcing. (J–L): the case with negative BH forcing. The control run results are shown in the top row of the figure for reference. The red boxes in the middle column indicate the Beaufort Gyre region. The 500, 2,000, and 3,500 m isobaths are shown with gray contour lines.
In the control simulation, the Eurasian runoff leaves the continental shelf mainly at the Lomonosov Ridge and is advected toward the Fram Strait and north of the Greenland mainly on the Eurasian Basin side of the Lomonosov Ridge, while the Mackenzie River runoff covers the Amerasian Basin through the anticyclonic circulation (upper row of Figure 8). With the negative Arctic Oscillation perturbation, the anticyclonic circulation expands to the whole Arctic deep basin (Figure 8A), which causes the Eurasian runoff to circulate anticyclonically from the Eurasian Basin to the Amerasian Basin (Figure 8B). In this case, the inventory of the Eurasian runoff in the Beaufort Gyre region is larger than in other cases shown in Figure 8. The strengthened anticyclonic circulation expand the Mackenzie River runoff to cover most of the Eurasian Basin (Figure 8C). The positive Arctic Oscillation forcing, on the contrary, expands the cyclonic circulation and shrinks the anticyclonic circulation (Figure 8D), which causes the Eurasian runoff to leave the continental shelf at the Mendeleev Ridge and occupy a larger Arctic area (Figure 8E), and causes the Mackenzie River runoff to retreat to the Canada Basin (Figure 8F).
The impact of the Beaufort High mode on the circulation pathways of the runoff is visible, but relatively weak compared with the impact of the Arctic Oscillation. The main pathway of the Eurasian runoff remains on the Eurasian Basin side of the Lomonosov Ridge, but more (less) Eurasian runoff penetrates to the Amerasian Basin, especially north of the Greenland, with the positive (negative) perturbation (Figures 8H,K) in comparison to the control run. The Mackenzie River runoff is present in the whole Amerasian Basin after 10 years of either positive or negative Beaufort High perturbation (Figures 8I,L), covering an area similar to that in the control simulation. However, the stronger anticyclonic circulation under the positive perturbation carries more Mackenzie River runoff, while under the negative perturbation the inventory of the Mackenzie River runoff drops because more runoff enters the Parry Channel through the cyclonic route along the Alaskan coast.
Compared with the simulation only with the positive Arctic Oscillation perturbation (Figure 8E), adding the positive Beaufort High forcing weakens the intrusion of Eurasian runoff into the Beaufort Gyre region at its northwest corner, but strengthens the spreading of Eurasian runoff in the anticyclonic gyre circulation (Figures 9A,B). Contemporarily, the area of the Mackenzie River runoff coverage is enlarged in the northwest Canada Basin, and its inventory in the gyre also becomes higher (cf. Figures 8F, 9C).
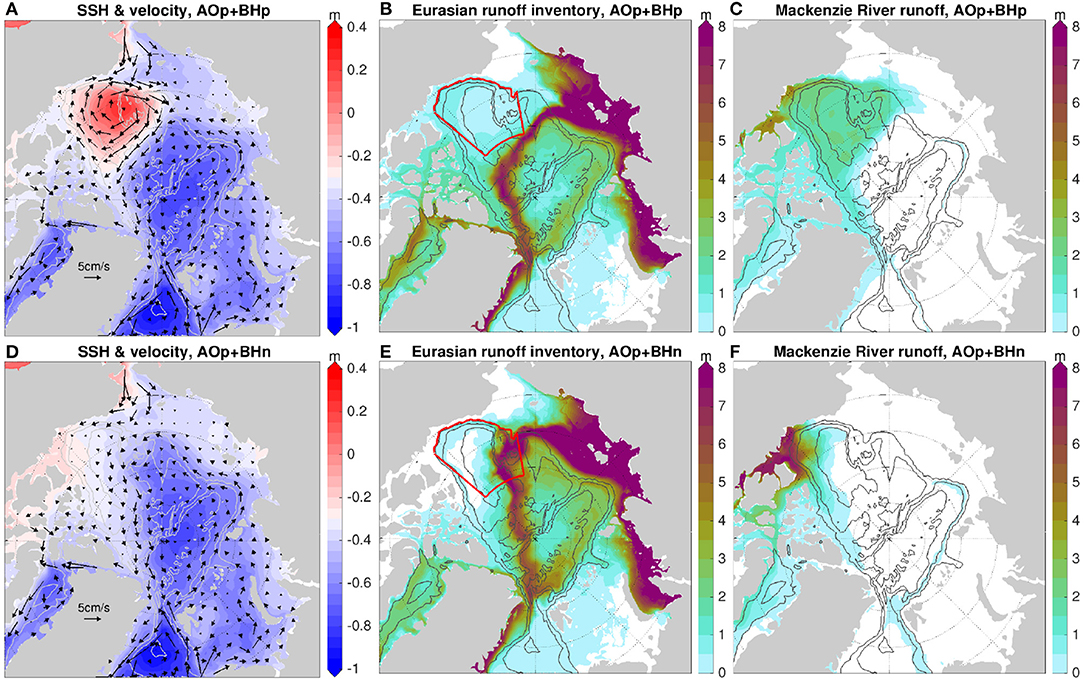
Figure 9. Left: Sea surface height (SSH) and upper 150 m mean velocity in the last model year. Middle column: The inventory of Eurasian runoff (in m) in the last model year. Right: The inventory of Mackenzie River runoff in the last model year. (A–C): the case with positive Arctic Oscillation (AO) forcing and positive Beaufort High (BH) forcing. (D–F): the case with positive AO forcing and negative BH forcing. The red boxes in the middle column indicate the Beaufort Gyre region. The 500, 2,000, and 3,500 m isobaths are shown with gray contour lines.
The anticyclonic Beaufort Gyre circulation nearly vanishes with the negative Beaufort High perturbation added to the positive Arctic Oscillation forcing, which allows the cyclonic circulation to extensively penetrate into the Beaufort Gyre region (Figure 9D). As a consequence, the Eurasian runoff has a very high inventory in the northwest part of the climatological Beaufort Gyre region (Figure 9E). The combination of negative Beaufort High and positive Arctic Oscillation expels Mackenzie River runoff to the southeastern boundary of the Canada Basin and forces it to export mainly through the western channels of the CAA (cf. Figures 8F, 9F).
3.3. Impact on Runoff Storage
The impact of the atmospheric circulation modes is also clearly seen in the storage of runoff in the Arctic Ocean (Figure 10). The negative Arctic Oscillation forcing causes the total Eurasian runoff volume in the Arctic Ocean to increase first and then decrease slightly (solid blue line in Figure 10A). The induced changes are even larger in the individual basins (Figures 10C,E). The expansion of the anticyclonic circulation from the Amerasian Basin into the Eurasian Basin (Figure 8A) tends to increase Eurasian runoff in the Eurasian Basin in the first few years and then decrease it afterwards (Figure 10C). The transport of Eurasian runoff from the Eurasian Basin to the Amerasian Basin north of the Greenland causes an increase in the amount of Eurasian runoff present in the Amerasian Basin (Figure 10E). The amount of Eurasian runoff in the Amerasian Basin stabilizes in the last few years, because excess runoff is exported into the CAA. At the end of the simulation, the sum of the changes in both basins is negative (a reduction of about 1, 000km3), opposite to the change integrated over the whole Arctic Ocean (an increase of about 1, 500km3), which can be explained by the significantly increased Eurasian runoff inventory in the CAA region (Figure 8B).
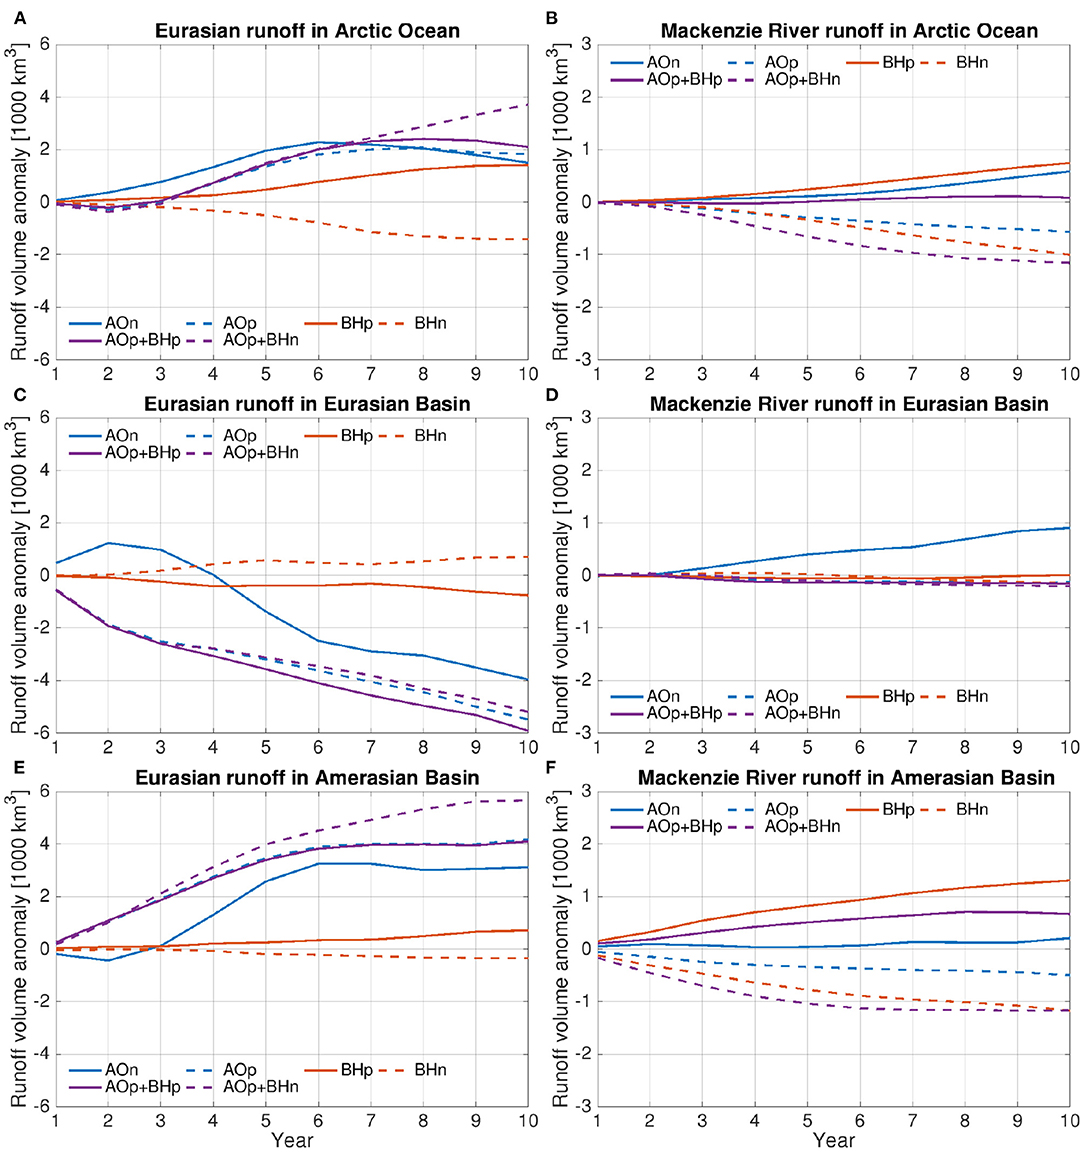
Figure 10. Time series of the volume of the (A) Eurasian runoff and (B) Mackenzie River runoff in the Arctic Ocean. The anomalies relative to the control run are shown. (C,D) The same as (A,B), but for the anomalies in the Eurasian Basin. (E,F) The same as (A,B), but for the anomalies in the Amerasian Basin. Note that different y-axis scales are used in the left and right columns.
When the positive Arctic Oscillation perturbation is applied, the total Eurasian runoff in the Arctic Ocean has negligible change in the first 3 years, but the change increases to about 2, 000km3 afterwards (dashed blue line in Figure 10A). As expected from the shift of the Eurasian runoff circulation pathway toward the Mendeleev Ridge (Figure 8E), the amount of Eurasian runoff decreases in the Eurasian Basin and increases in the Amerasian Basin (Figures 10C,E). At the end of the simulation, the amount of Eurasian runoff in the Eurasian Basin is lower by about 5, 500km3 than the control simulation (Figure 10C), and in the Amerasian Basin higher by about 4, 000km3 (Figure 10E). So the amount of Eurasian runoff in the Arctic deep basin is reduced, contrary to the overall increase of 2, 000km3 in the whole Arctic Ocean (Figure 10A). This can be explained by the strong increase in the Eurasian runoff inventory over the outer shelf of the East Siberian Sea (Figure 8E).
The Beaufort High perturbations lead to relatively small changes in the amount of Eurasian runoff in the two basins (solid and dashed red lines in Figures 10C,E), as the impact on the main circulation pathway is small (Figures 8H,K). The positive Beaufort High forcing slightly reduces (increases) the amount of Eurasian runoff in the Eurasian (Amerasian) Basin and the negative forcing has an opposite effect (Figures 10C,E). The changes in the two basins partially compensate and the total change in the Arctic deep basin is very small. However, the changes in the amount of Eurasian runoff in the whole Arctic Ocean (about ±1, 500km3 at the end of the simulations, Figure 10A) are larger than in each basin. This can be attributed to the changes over the continental shelf (mainly in the East Siberian Sea and the CAA region, Figures 8H,K).
When the positive Arctic Oscillation perturbation is present, imposing the negative Beaufort High perturbation further increases the amount of Eurasian runoff in the Arctic Ocean (comparing the dashed violet line with the dashed blue line in Figure 10A), which is mainly due to the increase in the Amerasian Basin (Figure 10E), and more precisely in the northwest Canada Basin (Figure 9E). Imposing the positive Beaufort High perturbation changes the spatial distribution of Eurasian runoff in the Amerasian Basin, with reduced penetration into the northwest Canada Basin and increased penetration into the eastern Canada Basin (cf. Figures 8E, 9B). Due to these opposite changes, the amount of Eurasian runoff in the Amerasian Basin and in the whole Arctic Ocean does not change much (comparing the solid violet line with the dashed blue line in Figures 10A,E).
The changes in the amount of Mackenzie River runoff in the Arctic Ocean and different basins induced by different wind perturbations are shown in Figures 10B,D,F. Only the negative Arctic Oscillation perturbation can significantly influence the amount of Mackenzie River runoff in the Eurasian Basin (with an increase of about 1, 000km3 at the end of the simulation, Figure 10D), and in other cases the changes in Mackenzie River runoff volume in the Arctic Ocean can be mainly attributed to the changes in the Amerasian Basin (Figures 10B,D,F). With the positive Arctic Oscillation perturbation, the Mackenzie River runoff retreats to the Canada Basin (Figure 8F), associated with a reduction in the runoff volume of about 500km3 at the end of the simulation (dashed blue line in Figure 10F). With the positive (negative) Beaufort High perturbation, the amount of Mackenzie River runoff increases (decreases) with time and has a change of more than 1, 000km3 at the end of the simulation (solid and dashed red lines in Figure 10F).
Relative to the case only with positive Arctic Oscillation perturbation, additionally imposing positive Beaufort High perturbation causes a change in the amount of Mackenzie River runoff (solid violet line vs. dashed blue line in Figure 10F) similar to that induced by only imposing positive Beaufort High perturbation (solid red lines in Figure 10F). At the end of the simulations, the induced reduction is similar between the case only with the negative Beaufort High forcing and the case additionally with the positive Arctic Oscillation forcing (dashed red line and dashed violet line in Figure 10F). However, the latter case has a much confined spatial distribution (cf. Figures 8L, 9F) due to the expansion of the cyclonic circulation into the Canada Basin (cf. Figures 8J, 9D).
3.4. Impact on Runoff Exports Through Gateways
The impact of the atmospheric circulation modes on runoff volume exports through the Fram Strait and the CAA is depicted in Figure 11. The negative Arctic Oscillation perturbation has the largest impact on the Eurasian runoff exports, which have opposite changes for the two gateways (solid blue line in Figures 11A,B). The reduction in the Fram Strait export is associated with the westward geostrophic current anomaly which enhances the transport of Eurasian runoff toward the Amerasian Basin (Figure 8A). More Eurasian runoff is then exported through the CAA. The runoff inventory further shows that the Parry Channel and central straits are the main CAA straits for the increased Eurasian runoff export (Figure 8B). The anomalies of the exports through the two gateways relative to the control simulation preserve their signs in the simulation, but their magnitudes drop slightly after reaching the maxima (Figures 11A,B). The Eurasian runoff is carried westward by a broad and accelerating geostrophic current north of the Fram Strait during the first half of the simulations (see Supplementary Figure 2B), which reduces the export through the Fram Strait; with a further expansion of the positive sea surface height anomaly in the Arctic Ocean, the geostrophic current is narrowed down and pushed closer to the Fram Strait (Figure 8B), which weakens the reduction in the Fram Strait export. The positive anomaly of the export through the CAA is larger than the negative anomaly of the export at the Fram Strait in the last few years, consistent with the reduction in the total Eurasian runoff storage in the Arctic Ocean in this period (solid blue line in Figure 10A).
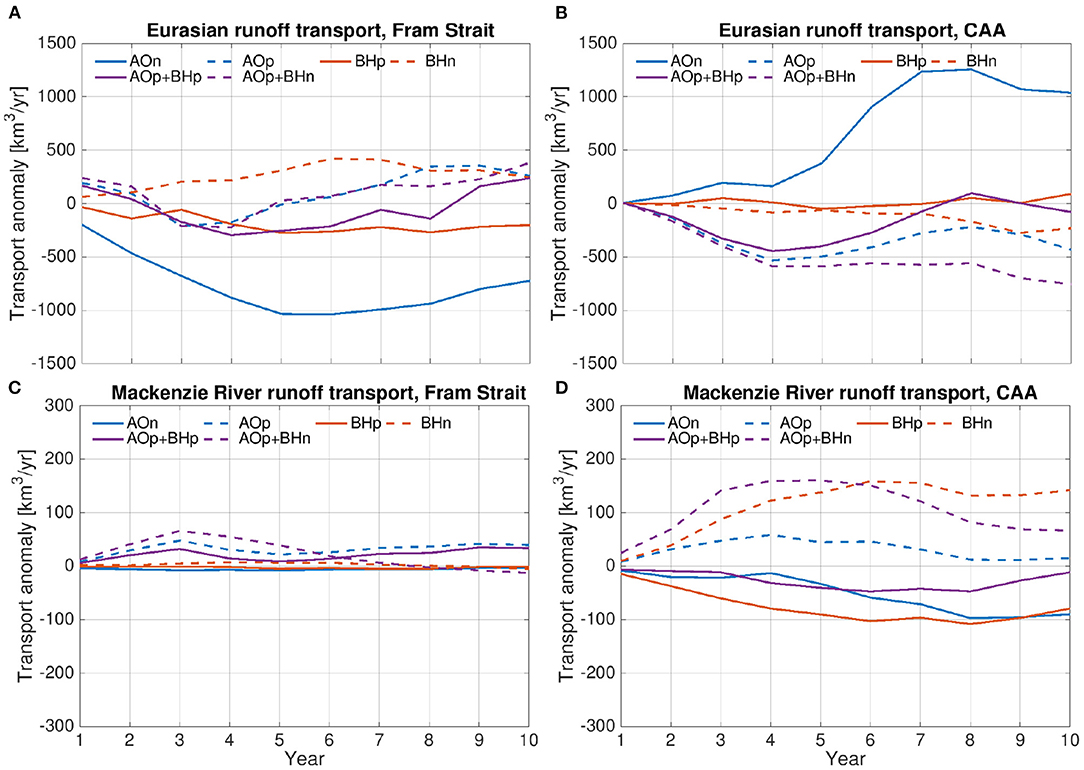
Figure 11. Eurasian runoff volume export anomaly through (A) Fram Strait and (B) Canadian Arctic Archipelago (CAA). (C,D) The same as (A,B), but for Mackenzie River runoff. The anomalies are relative to the control run. Positive values indicate larger export. Note that different y-axis scales are used in the upper and bottom rows.
To better understand the causes of the change in the runoff export, the export is decomposed as the following:
where u = ū+u′ is the velocity normal to the gateway transect and is the river runoff concentration at the gateway, and the integral is over the gateway transect area A. The component with overbar is the annual mean value before the perturbation simulations (averaged over 2009 in the control simulation), and the component with the prime is the anomaly relative to this mean value. After computing the export transport components, their anomalies relative to the corresponding components in the control simulation are then computed (shown in Figure 12).
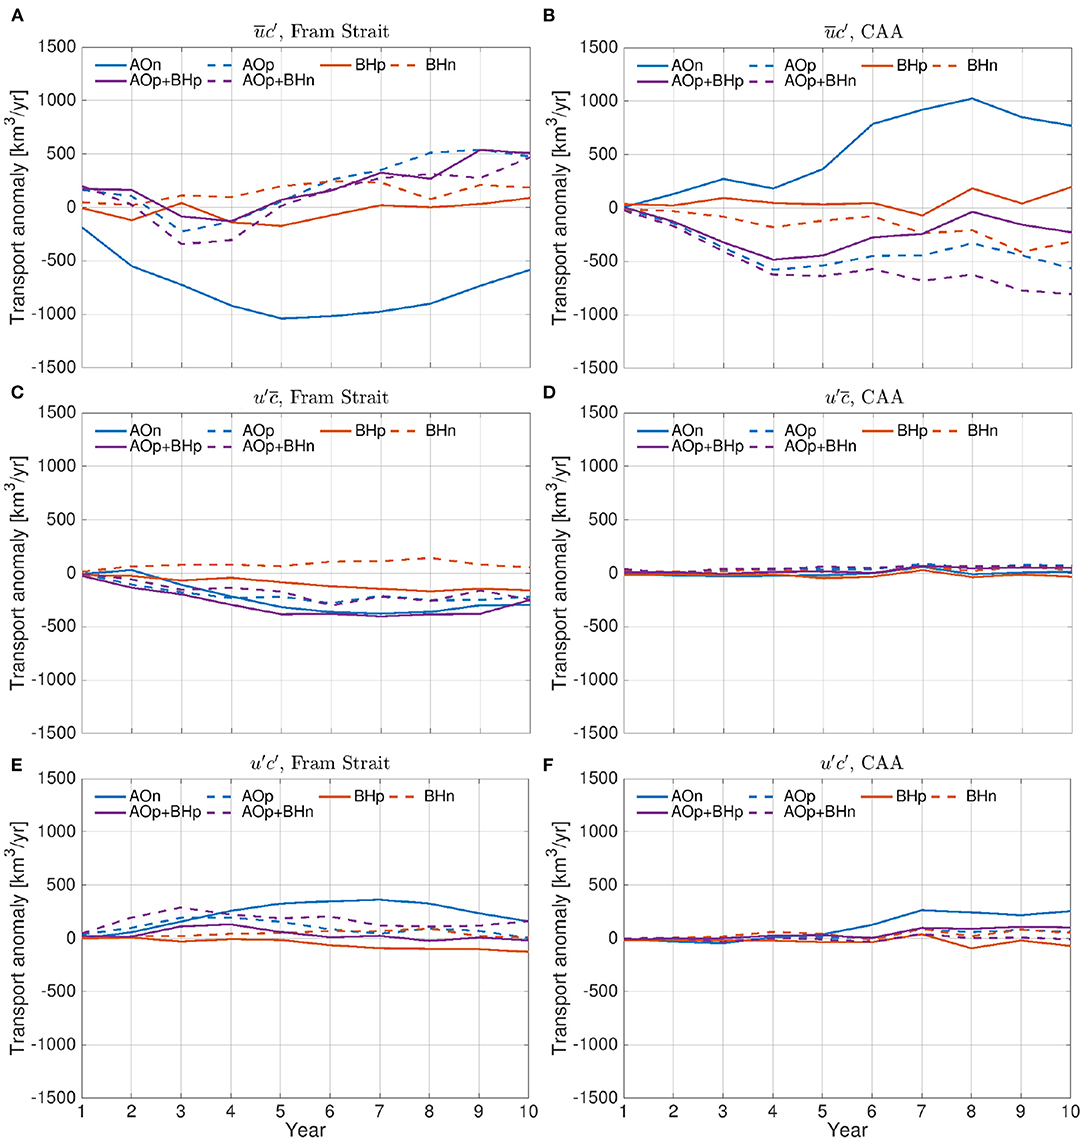
Figure 12. Components of Eurasian runoff volume export anomaly through Fram Strait: (A) due to runoff concentration change, (C) due to ocean velocity change, and (E) due to their concurrent changes. (B,D,F) The same as (A,C,E) but for export through the Canadian Arctic Archipelago (CAA). The anomalies are relative to the control run. Positive values indicate larger export.
With the negative Arctic Oscillation perturbation, the Eurasian runoff export anomalies relative to the control simulation at both gateways are mainly due to changes in the runoff concentration (solid blue line in Figures 12A,B). The change in the ocean velocity at the Fram Strait induces a small negative change in the runoff export (Figure 12C), but it is compensated by the effect of the concurrent changes of the runoff concentration and ocean velocity (Figure 12E).
With the positive Arctic Oscillation perturbation, the anomaly of the Eurasian runoff export at Fram Strait varies in its sign during the first few simulation years (dashed blue line in Figure 11A), which could be associated with the adjustment of the runoff circulation pathways to geostrophic current changes over the large Arctic area. On the one hand, more Eurasian runoff penetrates to and fills the Amerasian Basin; on the other hand, the strengthened cyclonic circulation tends to advect Eurasian runoff toward the Fram Strait (Figure 8E). The change in the Fram Strait export is the result of the two competing factors, while both the factors tend to reduce the CAA export (Figures 11A,B). The exports through the two gateways largely compensate each other over the last few years, which is consistent with the quasi-stationarity of the total Eurasian runoff storage in the Arctic Ocean in that period (dashed blue line in Figure 10A). At the Fram Strait, the changes in the export are mainly due to the changes in the Eurasian runoff concentration in the export water (dashed blue line in Figure 12A), while the reduction in velocity has a small negative contribution (Figure 12C). The changes in the CAA export are predominantly caused by the reduction in the runoff concentration (Figure 12B).
The Beaufort High perturbations induce changes in the Eurasian runoff export mainly through the Fram Strait (solid and dashed red lines in Figures 11A,B). The changes are attributed to all components with varying significance during the simulations (Figures 12A,C,E). The changes in ocean velocity at the Fram Strait have more persistent contributions in time: positive (negative) Beaufort High perturbation reduces (increases) ocean volume export and thus Eurasian runoff export at the Fram Strait. With the negative Beaufort High perturbation, the Eurasian runoff export through the CAA decreases slightly in the last few years (Figure 11B), mainly due to the reduction in the runoff concentration in the export water (Figure 12B).
The impact of the Beaufort High perturbations on Eurasian runoff exports depends on whether the positive Arctic Oscillation perturbation is present or not (Figures 11A,B). In comparison with the case only with the positive Arctic Oscillation perturbation, adding the negative Beaufort High perturbation does not significantly change the export at the Fram Strait (the dashed violet line vs. the dashed blue line in Figure 11A), but reduces the export through the CAA (Figure 11B), which explains the larger Eurasian runoff storage in the Arctic Ocean (Figure 10A). However, adding the positive Beaufort High perturbation reduces the export at the Fram Strait and increases it through the CAA (the solid violet line vs. the dashed blue line in Figures 11A,B), so the runoff storage in the Arctic Ocean does not change much (Figure 10A).
The Mackenzie River runoff is mainly exported through the CAA (right column in Figure 8), so the changes in its exports are larger for the CAA branch (Figures 11C,D). Both the negative (positive) Arctic Oscillation perturbation and the positive (negative) Beaufort High perturbation increase (decrease) the storage of Mackenzie River runoff in the Arctic Ocean (Figure 10B), and accordingly the export through the CAA is reduced (increased). When both the positive Arctic Oscillation perturbation and Beaufort High perturbations are applied, the response of the CAA exports has the imprint of both perturbations, but it is not simply the sum of the responses to each individual perturbation. The changes in the Mackenzie River runoff export through the CAA are mainly due to the changes in the runoff concentration in the export water (not shown), similar to the Eurasian runoff export through the CAA. We note that the magnitudes of the changes in the export in most forcing cases are smaller for the Mackenzie River runoff than for the Eurasian runoff because the source flux of the latter is much larger.
3.5. Runoff in the Beaufort Gyre Region
Geographically, the Beaufort Gyre region is near to the Mackenzie River mouth and farther from the Eurasian rivers. There have been debates on whether the Eurasian runoff could be the major contributor to the FWC increase in the Beaufort Gyre region (Morison et al., 2012; Kelly et al., 2019; Proshutinsky et al., 2019). In this section, we will quantify the response of the amount of river runoff in the Beaufort Gyre region to different wind forcing.
Except for the cases only with Beaufort High perturbations, the wind perturbations can increase the amount of Eurasian runoff in the Beaufort Gyre region (Figure 13A). Relative to the control simulation, the amount of Eurasian runoff increases by about 600 and 1, 100km3 at the end of the simulations with the positive and negative Arctic Oscillation perturbations, respectively. When both the positive Arctic Oscillation and negative Beaufort High perturbations are applied, the amount of Eurasian runoff in the Beaufort Gyre region has the largest increase, by more than 2, 000km3 at the end of the simulation (Figure 13A), due to the penetration of the main circulation pathway into the northwest Beaufort Gyre region (Figure 9E). However, in these three simulations (positive Arctic Oscillation, negative Arctic Oscillation, and positive Arctic Oscillation together with negative Beaufort High), the FWC in the Beaufort Gyre region either does not change much or even decreases significantly (Figure 5B). Only in the simulation with both the positive Arctic Oscillation and positive Beaufort High perturbations, both the FWC and the amount of Eurasian runoff increase in the Beaufort Gyre region (solid violet line in Figures 5B, 13A). The increase in Eurasian runoff accounts for about 7% of the increase in the FWC at the end of the simulation (500km3 over 7, 000km3). In this case, however, the amount of Mackenzie River runoff is more than twice the amount of the Eurasian runoff (Figure 13B). In summary, Eurasian runoff is scarcely the major contributor to the FWC increase in the Beaufort Gyre region.
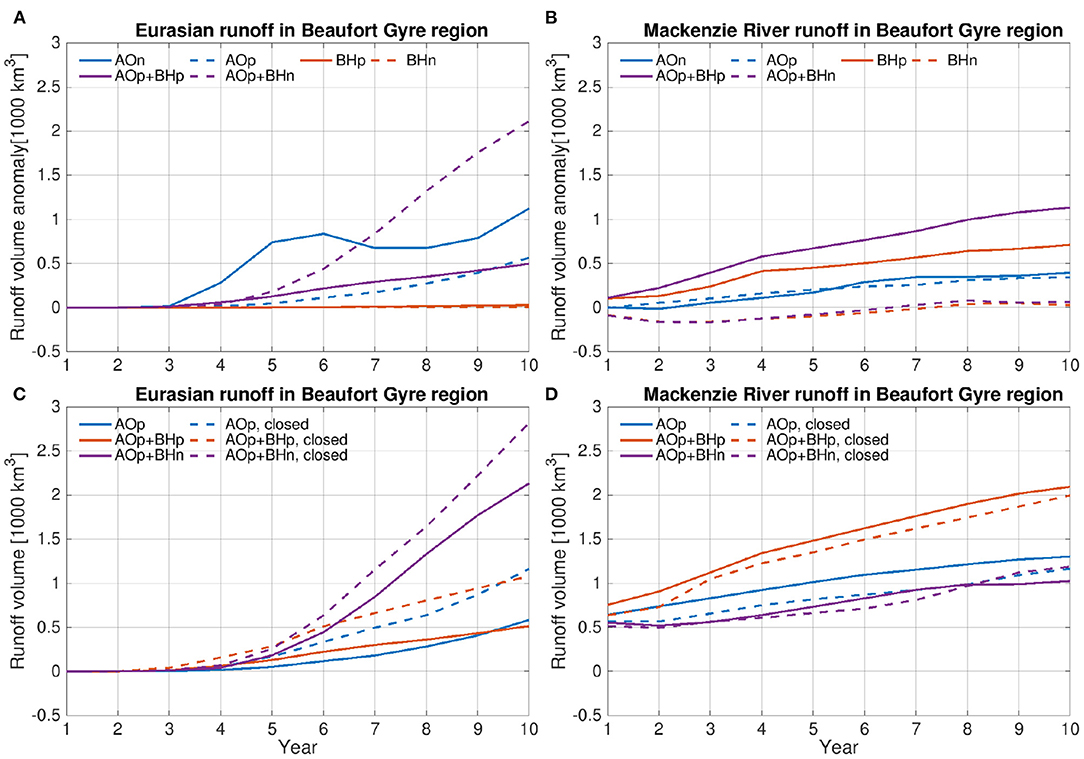
Figure 13. Time series of the volume of (A) Eurasian runoff and (B) Mackenzie River runoff in the Beaufort Gyre region. The anomalies relative to the control run are shown. (C,D) River runoff volume in simulations with Bering Strait closed compared with those with Bering Strait open: Time series of the volume of (C) Eurasian runoff and (D) Mackenzie River runoff in the Beaufort Gyre region.
Pacific Water from the Bering Strait not only provides freshwater, but also influences the sea surface height gradient at export gateways (Spall, 2020). We carried out a few experiments with the Bering Strait closed (Table 1) to investigate whether the Pacific Water inflow can influence the accumulation of runoff water in the Beaufort Gyre region. As revealed by the difference in the sea surface height between the simulations with and without Bering Strait inflow, the Bering Strait inflow increases the sea surface height along the Alaskan coast, in the CAA and around the north Greenland, and lowers the sea surface height in the northern Chukchi Sea and eastern East Siberian Sea (Figures 14A–C). On the one hand, the associated changes in the upper ocean circulation cause an increase in the residence of the Eurasian runoff in the East Siberian Sea in the cases with the Bering Strait open (cf. Figures 14D–F and Figures 14G–I). On the other hand, the weakening of the anticyclonic circulation reduces the amount of Eurasian runoff that could be transported clockwise into the southern Canada Basin. Effectively, the Bering Strait inflow reduces the Eurasian runoff inventory in the Beaufort Gyre region (Figures 14G–I). In all the considered forcing cases, the Bering Strait inflow reduces the amount of Eurasian runoff in the Beaufort Gyre region by about 500km3 at the end of the simulation (Figure 13C), while the amount of Mackenzie River runoff has smaller changes (Figure 13D). The main finding from these sensitivity simulations is the following: closing Bering Strait could increase the penetration of Eurasian runoff into the Beaufort Gyre region by up to 100%, but this does not change the fact that Eurasian runoff can only contribute to a small proportion of the FWC increase in the Beaufort Gyre region. Then the natural variability of the Bering Strait throughflow has an even smaller impact on the amount of Eurasian runoff in this region.
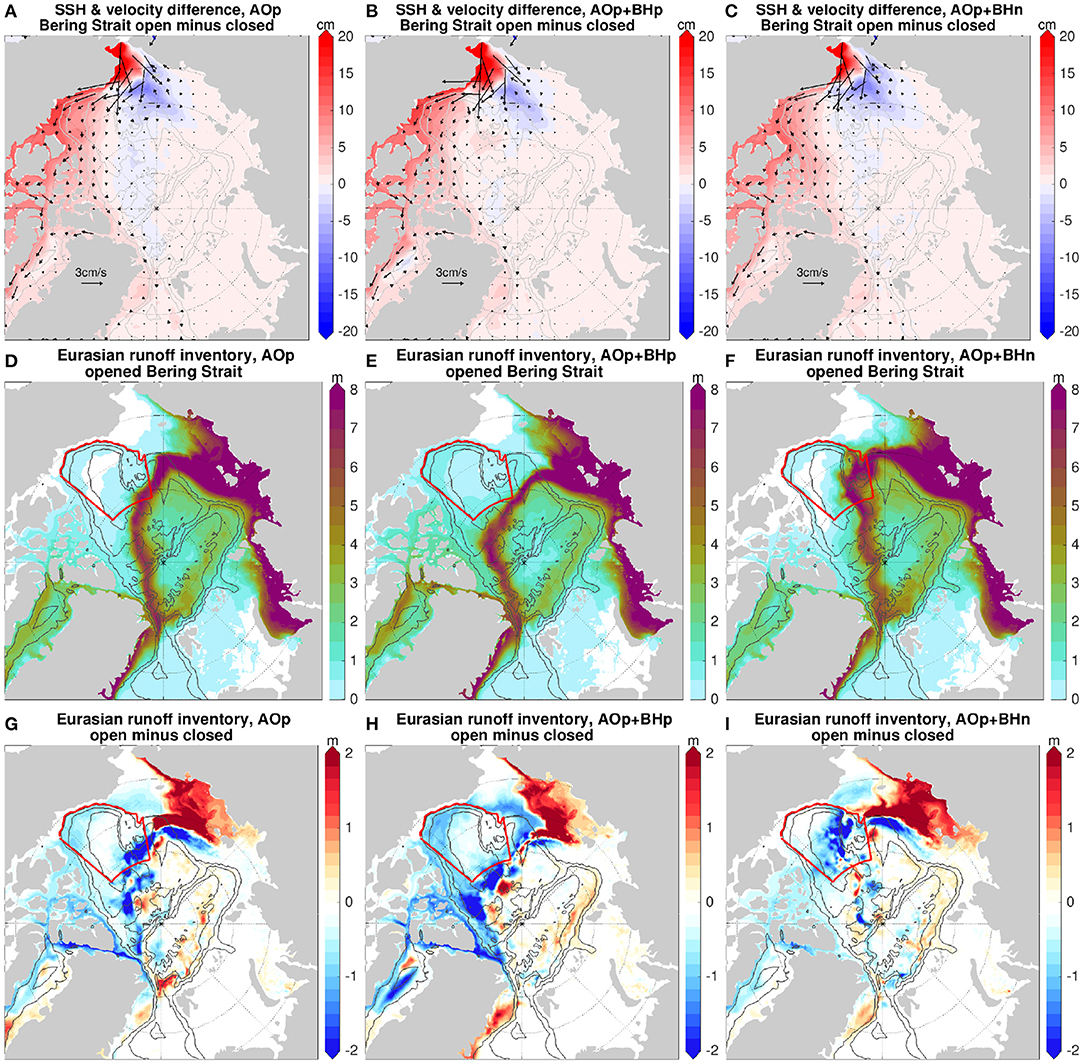
Figure 14. (A–C) Difference of sea surface height (SSH) and upper 150 m mean velocity between the simulation with open Bering Strait and the one with closed Bering Strait averaged over the 10 model years: the case with (A) positive Arctic Oscillation (AO), (B) both positive AO forcing and positive Beaufort High (BH) forcing, and (C) both positive AO forcing and negative BH forcing. (D–F) The inventory of Eurasian runoff (in m) in the last model year in simulations with the Bering Strait open: (D) with positive AO, (E) with both positive AO forcing and positive BH forcing, and (F) with both positive AO forcing and negative BH forcing. (G–I) The same as (D–F), but for the difference between the cases with Bering Strait open and the cases with the Bering Strait closed (former minus latter). The 500, 2,000, and 3,500 m isobaths are shown with gray contour lines.
4. Discussion
4.1. Implications and Linkage to Observed Arctic Ocean Variability
Between the late 1980s and mid 1990s the Arctic Oscillation was in a strongly positive phase and the Beaufort High mode was slightly negative (Figure 2). The result of our simulation with the positive Arctic Oscillation perturbation is consistent with the observed changes in ocean circulation and water mass spatial distribution in the first half of the 1990s: shifting of the Transpolar Drift Stream from its climatological location roughly at the Lomonosov Ridge to the Alpha-Mendeleev Ridge, retreat of the Pacific-derived water, expansion of the Atlantic-derived water, and shifting of the location where Eurasian runoff left the shelf toward the Mendeleev Ridge (Carmack et al., 1995; Morison et al., 1998; Steele and Boyd, 1998; Ekwurzel et al., 2001; Karcher et al., 2012). It was observed that the ocean conditions relaxed to pre-1990s climatology at the beginning of the 2000s after the Arctic Oscillation weakened starting from the mid 1990s (Steele and Ermold, 2004; Morison et al., 2006; Alkire et al., 2007). The relaxation of the ocean circulation and water mass distribution lagged the Arctic Oscillation variability (Anderson et al., 2004; Morison et al., 2006). This can be explained by the fact that the upper ocean circulation follows the change in halosteric sea surface height, that is, the freshwater inventory, which does not change sharply but rather has a long memory of the prior wind forcing (Johnson et al., 2018; Wang et al., 2021a).
In the second half of the 2000s, the Beaufort High was in a strongly positive phase (strongly negative wind curl, Figure 2). This caused an unprecedented freshwater accumulation in the Beaufort Gyre region, although sea ice decline and increased availability of freshwater to the Beaufort Gyre enhanced the accumulation as well (Wang et al., 2018a; Proshutinsky et al., 2019). In that period, the Arctic Oscillation on average was close to neutral. Because even a persistent and strongly positive Arctic Oscillation forcing needs a few years to push the Transpolar Drift Stream to the Mendeleev Ridge as revealed by our simulations and the observations in the 1990s, the Eurasian runoff had little chance to penetrate extensively into the central Canada Basin to contribute to the freshwater accumulation in the Beaufort Gyre in the second half of the 2000s. Different model simulations in previous studies also suggested the same (Proshutinsky et al., 2019). Our simulations further showed that with a persistent and strongly positive Arctic Oscillation, Eurasian runoff can penetrate into the Beaufort Gyre region, but the associated contribution to the FWC increase in the Beaufort Gyre region remains small even on a forcing time scale of 10 years. This is consistent with the previous finding that Eurasian runoff had a small contribution to the Beaufort Gyre region in the past decades (Kelly et al., 2019).
In the mid to late 2010s, the wind curl over the Beaufort Gyre region was strongly negative, while the Arctic Oscillation was in a medium-strength positive phase (Figure 2). It is interesting to note that the Beaufort High sea level pressure was only slightly higher than the climatological mean, and the sea level pressure drop in the Arctic area outside the western Canada Basin also contributed to the wind anticyclonicity over the Beaufort Gyre region in the mid to late 2010s (see Figure 5 in Wang, 2021). The anticyclonicity over the Beaufort Gyre region and the positive Arctic Oscillation together resulted in an increase in the liquid FWC in the eastern Canada Basin, an eastward movement of the Beaufort Gyre center, and a FWC reduction in the Eurasian and Makarov basins (Figure 5 in Wang, 2021). These changes imply a shift of the location of the Transpolar Drift Stream and water mass distribution in the direction from the Eurasian Basin toward the Amerasian Basin, but they also indicate that the extent of the shift was smaller than what happened in the 1990s because the Arctic Oscillation in the 2010s was medium-strength positive.
Our study suggests that both the Arctic Oscillation and Beaufort High modes should be considered together to adequately explain and predict ocean changes. For example, in comparison to the case only with the positive Beaufort High perturbation, applying both the positive Arctic Oscillation and positive Beaufort High perturbations increases the FWC in the Beaufort Gyre region by about 40%. The positive Arctic Oscillation forcing increases the availability of freshwater, which can be accumulated in the Beaufort Gyre under the positive Beaufort High forcing. As another example from our simulations, a positive Arctic Oscillation alone reduces FWC in both the Eurasian and Amerasian basins, while applying both the positive Beaufort High and positive Arctic Oscillation perturbations does not change the Amerasian Basin FWC much, because the accumulation of freshwater in the Beaufort Gyre region roughly counterbalances the release of freshwater in other parts of the Amerasian Basin. Furthermore, the location of the Transpolar Drift Stream, the spatial extent of the cyclonic and anticyclonic circulation and the spatial distribution of different water masses are also very sensitive to whether both or only one of the atmospheric circulation modes are enforced.
Although river runoff is an important Arctic freshwater source, the residence of newly discharged river runoff in the Arctic Ocean could change oppositely to the Arctic FWC. In particular, the positive Arctic Oscillation forcing, together with either neutral, negative or positive Beaufort High, reduces the Arctic total FWC. However, the amount of river runoff (both the Eurasian runoff and the total runoff from all Arctic rivers) tends to increase in the Arctic Ocean in all these forcing cases. The reduction of the Arctic FWC in these cases could be attributed to the release of freshwater of different origins that has been present in the Arctic Ocean before. The impact of winds on freshwater components other than river runoff was not studied here. Nevertheless, our results indicate that the response of the residence of river runoff in the Arctic Ocean to wind forcing is more complicated than the response of the Arctic total FWC. When it comes to attribute FWC changes in an individual basin, the situation will be even more complicated. One needs to investigate the detailed changes in the circulation pathways of river runoff and other water masses.
4.2. Limitations and Outlook
The wind perturbation simulations used in this study are shown to be very helpful in improving our understanding of the impact of different atmospheric circulation modes and their combination on Arctic upper ocean circulation and runoff circulation pathways and exports. However, the model setup is only marginally eddy-permitting. As eddies could influence the lateral transport of water masses (Hu et al., 2019; Spall, 2020), using eddy-resolving model setups might improve the quantitative results presented here. With increasing available computing resources in the future, one might be able to carry out long and multiple eddy-resolving 1 km scale Arctic simulations, as prototyped in Wang et al. (2020a), to better quantify the effect of eddies and the ocean response to wind variability.
We note that the strength of the changes in the ocean circulation and river runoff pathways depends on the duration of the wind perturbations. For example, the negative Arctic Oscillation perturbation can lead to anticyclonic circulation of river runoff from the Eurasian Basin to the Amerasian Basin, but this happens after the wind perturbation has been applied persistently for 2 years. We provided both the results after ten model years and the time series of the changes above. One can thus get information on possible impacts of the winds on different time scales (1–10 years).
In this paper we focused on the impact of wind perturbations on annual to decadal time scales. In reality there is synoptic atmospheric variability and the relationship of the sea level pressure anomalies between the central Arctic and the Beaufort Gyre region on synoptic scales could be different from that on an interannual scale shown in Figure 2. As the river runoff pathways depend on the surface geostrophic current, which follows the build-up of the sea surface height anomaly associated with the changes in FWC, the relevant time scale is that of the changes in FWC. If the accumulative effect of synoptic-scale winds in a certain period can change the FWC similarly to what certain lasting wind perturbations do, the response of the river runoff pathways is also expected to be similar to such perturbation scenarios. How various synoptic-scale winds can influence the Arctic FWC is beyond the scope of this study.
The Arctic river runoff is expect to increase in the future (Carmack et al., 2016; Shu et al., 2018), which could influence the Arctic Ocean hydrography, freshwater storage, stratification and circulation (Nummelin et al., 2016; Pemberton and Nilsson, 2016; Wang et al., 2021c). Both the Arctic Oscillation and the Beaufort High also might change in a warming climate (Shindell et al., 1999; Moore et al., 2018). There is a need for improved understanding and predictivity of ocean changes in response to possible contemporary changes in both the major atmospheric modes and the Earth's water cycle.
5. Summary
In this study we carried out wind perturbation simulations to investigate the impact of different atmospheric modes on Arctic liquid freshwater content (FWC), upper ocean circulation and the circulation pathways and exports of Arctic river runoff. We considered not only the individual Arctic Oscillation and Beaufort High modes, but also their joint effect. The main results are summarized below.
1. Arctic freshwater content. Both the Arctic Oscillation and Beaufort High modes can strongly influence the amount of freshwater in the Arctic Ocean: An anticyclonic wind regime (negative Arctic Oscillation or positive Beaufort High forcing) leads to accumulation of freshwater in the Arctic Ocean, and a cyclonic regime has an opposite effect. However, the induced changes in the spatial pattern of the Arctic freshwater distribution are different due to the difference in the locations of the modes' active centers. For example, the negative Arctic Oscillation increases FWC in both the Amerasian and Eurasian basins, while the positive Beaufort High forcing increases FWC in the Amerasian Basin but very slightly reduces the FWC in the Eurasian Basin. Our simulations further showed that the impact of the Arctic Oscillation on the Amerasian Basin FWC occurs mainly outside the climatological Beaufort Gyre region. The Makarov Basin is sensitive to both the atmospheric modes.
2. Arctic upper ocean circulation. The impact of the atmospheric modes is manifested in the change of the Arctic sea surface height and surface geostrophic currents, because the halosteric height change dominates the sea surface height change. With the negative Arctic Oscillation wind perturbation, the anticyclonic ocean circulation expands into the Eurasian Basin, which causes Pacific derived water to fill the Eurasian Basin and confines the Atlantic derived water close to the Eurasian continental shelf break. Both water masses circulate clockwise from the Eurasian Basin to the Amerasian Basin north of the Greenland. With the positive Arctic Oscillation perturbation, the cyclonic circulation expands from the Eurasian Basin into the Amerasian Basin. Accordingly, the Transpolar Drift Stream shifts from the Lomonosov Ridge toward the Mendeleev Ridge, which is associated with an areal expansion of the Atlantic derived water and a retreat of the Pacific derived water. Contrary to the impact of the Arctic Oscillation, the Beaufort High perturbations do not significantly change the location of the Transpolar Drift Stream, although they can significantly change the strength of the anticyclonic gyre circulation in the Amerasian Basin. The reason is that the spatial extent of the anticyclonic circulation occupies most of the Amerasian Basin in the control simulation (forced by the applied CORE-II normal year winds), and the applied Beaufort High wind perturbations have a similar spatial scale. We found that the Beaufort High forcing can have a strong impact on the location of the Transpolar Drift Stream when the Transpolar Drift Stream shifts into the Amerasian Basin under the positive Arctic Oscillation forcing.
3. River runoff circulation pathways. Our simulations indicate that the pathway of river runoff is mainly determined by surface geostrophic currents that are associated with the spatial pattern of liquid FWC. The expanded anticyclonic circulation induced by the negative Arctic Oscillation can shift the main pathway of the Eurasian Runoff from the vicinity of the Lomonosov Ridge to the close vicinity of the Eurasian continental shelf break and extend the Mackenzie River runoff into the Eurasian Basin. On the contrary, the expanded cyclonic circulation induced by the positive Arctic Oscillation can cause the Eurasian runoff to leave the Eurasian continental shelf at the Mendeleev Ridge and then cross the central Amerasian Basin; Contemporarily, the spatial coverage of the Mackenzie River runoff is reduced as a result of the shrinking anticyclonic circulation.
4. The Beaufort High perturbations can influence the partition of Mackenzie River runoff between entering the anticyclonic gyre circulation and cyclonically exporting to the Canadian Arctic Archipelago (CAA), but it alone does not significantly change the runoff spatial coverage. The main circulation pathway of the Eurasian runoff in the Arctic Ocean is not significantly changed by the Beaufort High perturbations. However, the impact of the Beaufort High perturbations on runoff circulation pathways becomes more pronounced when the positive Arctic Oscillation forcing is also present, which shifts the Transpolar Drift Stream toward the central Amerasian Basin. In this case, the positive Beaufort High forcing causes Eurasian runoff to enter the Amerasian Basin at relatively more western locations and allows more Eurasian runoff to enter the Beaufort Gyre circulation in comparison with the case when only the positive Arctic Oscillation perturbation is applied. On the contrary, the negative Beaufort High forcing allows Eurasian runoff to penetrate into the Canada Basin more extensively from the northwest and can cause most of the Mackenzie River runoff to enter the CAA cyclonically.
5. River runoff storage. The amount of runoff present in the Arctic Ocean changes in response to the change in runoff circulation pathways. The Beaufort High perturbations do not significantly change the amount of Eurasian runoff in both Arctic deep basins, while the Arctic Oscillation perturbations lead to relatively large opposite changes in the two basins. The change in the total amount of Eurasian runoff in the whole Arctic Ocean cannot be just explained by the change in the Arctic deep basins (Amerasian plus Eurasian basins) in all the considered simulations. We found that the changed residence of the Eurasian runoff over Arctic continental shelves and in the CAA straits is important in explaining the total change of Eurasian runoff in the Arctic Ocean. The Mackenzie River runoff remains in the Amerasian Basin except for the negative Arctic Oscillation case. Its amount in the Amerasian Basin depends on the wind anticyclonicity or cyclonicity over the basin.
6. River runoff exports. Changes in runoff circulation pathways also lead to changes in its export through the Fram Strait and CAA. Both the total runoff export and the partition of the export through different gateways can be influenced, especially for the Eurasian runoff. We found that changes in the concentration of runoff in the export water determine the changes in the CAA export of river runoff of both origins, while changes in ocean export velocity (volume transport) are also important for the changes in the Fram Strait export of Eurasian runoff. The negative Arctic Oscillation perturbation strengthens the westward geostrophic currents north of the Fram Strait and facilitates Eurasian runoff to enter the Amerasian Basin north of the Greenland. Consequently, more Eurasian runoff is exported through the CAA and less is exported through the Fram Strait. The responses of the Eurasian runoff export to the positive Arctic Oscillation, averaged in time, are also opposite between the gateways: an increase through the Fram Strait and a decrease through the CAA. This is associated with the strengthening of the cyclonic circulation, which carries more Eurasian runoff toward the Fram Strait. The positive (negative) Beaufort High perturbation reduces (increases) the Eurasian runoff export at the Fram Strait, which can be attributed to the changes in both ocean export velocity and runoff concentration at Fram Strait. The Mackenzie River runoff is exported mainly through the CAA, and the changes in its export correspond to the anticyclonicity or cyclonicity of the wind perturbation: both the positive Arctic Oscillation and negative Beaufort High can increase the export.
7. It is important to note that the changes in the runoff export are typically non-monotonic in most considered cases, and they could even change signs with time in some cases. Such complexity in the response of the runoff export through individual gateways to Arctic wind perturbations can be attributed to the changes in the details of the Arctic upper ocean circulation. For example, the shift of the Eurasian runoff pathway toward the Mendeleev Ridge under the positive Arctic Oscillation forcing increases the residence of the runoff in the Arctic Ocean and thus reduces its overall export, but the strengthened cyclonic circulation tends to facilitate Eurasian runoff to reach the Fram Strait instead of Nares Strait. Due to the existence of opposite effects, the resulting Fram Strait export anomaly relative to the control simulation can change its sign with time.
8. River runoff in the Beaufort Gyre region. Our results further showed that Eurasian runoff potentially can only have a small contribution to the FWC accumulation in the Beaufort Gyre region. A strong FWC increase in the Beaufort Gyre region requires a positive Beaufort High perturbation, and the positive Arctic Oscillation perturbation can just facilitate the positive Beaufort High perturbation to produce an even stronger FWC increase in the Beaufort Gyre region. Without the positive Arctic Oscillation perturbation, the positive Beaufort High perturbation alone does not make it possible for Eurasian runoff to reach the Beaufort Gyre region. With the positive Arctic Oscillation perturbation, Eurasian runoff can enter the Beaufort Gyre region and contribute to the FWC increase. However, it only contributes to a very small proportion of the FWC increase.
9. By carrying out additional simulations with the Bering Strait closed, we found that the Pacific Water inflow can increase the residence of Eurasian runoff over Eurasian continental shelf and reduce the amount of Eurasian runoff that can enter the Beaufort Gyre region. However, even fully eliminating the Pacific Water inflow could not change the fact that Eurasian runoff has a relatively small contribution to freshwater accumulation in the Beaufort Gyre region.
Data Availability Statement
The raw data supporting the conclusions of this article will be made available by the authors, without undue reservation.
Author Contributions
QW conceived the study, performed the simulations, and wrote the first draft of the paper. SD, DS, and XW contributed to the interpretation of model results, discussion of the paper content, and improving the manuscript. All authors contributed to the article and approved the submitted version.
Funding
This work was supported by the Helmholtz Climate Initiative REKLIM (Regional Climate Change) and the EPICA project in the research theme MARE:N - Polarforschung/MOSAiC funded by the German Federal Ministry for Education and Research with funding number 03F0889A.
Conflict of Interest
The authors declare that the research was conducted in the absence of any commercial or financial relationships that could be construed as a potential conflict of interest.
Publisher's Note
All claims expressed in this article are solely those of the authors and do not necessarily represent those of their affiliated organizations, or those of the publisher, the editors and the reviewers. Any product that may be evaluated in this article, or claim that may be made by its manufacturer, is not guaranteed or endorsed by the publisher.
Supplementary Material
The Supplementary Material for this article can be found online at: https://www.frontiersin.org/articles/10.3389/fmars.2021.707593/full#supplementary-material
References
Aksenov, Y., Karcher, M., Proshutinsky, A., Gerdes, R., de Cuevas, B., Golubeva, E., et al. (2016). Arctic pathways of Pacific Water: Arctic Ocean model intercomparison experiments. J. Geophys. Res. Oceans 121, 27–59. doi: 10.1002/2015JC011299
Alkire, M. B., Falkner, K., Rigor, I., Steele, M., and Morison, J. (2007). The return of Pacific waters to the upper layers of the central Arctic Ocean. Deep Sea Res. I 54, 1509–1529. doi: 10.1016/j.dsr.2007.06.004
Anderson, L., Jutterström, S., Kaltin, S., Jones, E., and Björk, G. (2004). Variability in river runoff distribution in the Eurasian Basin of the Arctic Ocean. J. Geophys. Res. Oceans 109:C01016. doi: 10.1029/2003JC001773
Armitage, T., Bacon, S., Ridout, A., Petty, A., Wolbach, S., and Tsamados, M. (2017). Arctic Ocean surface geostrophic circulation 2003–2014. Cryosphere 11, 1767–1780. doi: 10.5194/tc-11-1767-2017
Carmack, E., Yamamoto-Kawai, M., Haine, T., Bacon, S., Bluhm, B. A., Lique, C., et al. (2016). Freshwater and its role in the Arctic Marine System: sources, disposition, storage, export, and physical and biogeochemical consequences in the Arctic and global oceans. J. Geophys. Res. Biogeosci. 121, 675–717. doi: 10.1002/2015JG003140
Carmack, E. C., Macdonald, R., Perkin, R. G., McLaughlin, F. A., and Pearson, R. J. (1995). Evidence for warming of Atlantic water in the Southern Canadian Basin of the Arctic Ocean: results from the Larsen-93 Expedition. Geophys. Res. Lett. 22, 1061–1064. doi: 10.1029/95GL00808
Charette, M. A., Kipp, L. E., Jensen, L. T., Dabrowski, J. S., Whitmore, L. M., Fitzsimmons, J. N., et al. (2020). The Transpolar Drift as a source of riverine and shelf-derived trace elements to the central Arctic Ocean. J. Geophys. Res. Oceans 125:e2019JC015920. doi: 10.1029/2019JC015920
Condron, A., Winsor, P., Hill, C., and Menemenlis, D. (2009). Simulated response of the Arctic freshwater budget to extreme NAO wind forcing. J. Clim. 22, 2422–2437. doi: 10.1175/2008JCLI2626.1
Dai, A., Qian, T., Trenberth, K. E., and Milliman, J. D. (2009). Changes in continental freshwater discharge from 1948 to 2004. J. Clim. 22, 2773–2792. doi: 10.1175/2008JCLI2592.1
Danilov, S., Kivman, G., and Schröter, J. (2004). A finite-element ocean model: principles and evaluation. Ocean Modell. 6, 125–150. doi: 10.1016/S1463-5003(02)00063-X
Danilov, S., Wang, Q., Timmermann, R., Iakovlev, N., Sidorenko, D., Kimmritz, M., et al. (2015). Finite-Element Sea Ice Model (FESIM), version 2. Geosci. Model Dev. 8, 1747–1761. doi: 10.5194/gmd-8-1747-2015
Dodd, P. A., Rabe, B., Hansen, E., Falck, E., Mackensen, A., Rohling, E., et al. (2012). The freshwater composition of the Fram Strait outflow derived from a decade of tracer measurements. J. Geophys. Res. Oceans 117:C11005. doi: 10.1029/2012JC008011
Ekwurzel, B., Schlosser, P., Mortlock, R. A., Fairbanks, R. G., and Swift, J. H. (2001). River runoff, sea ice meltwater, and Pacific water distribution and mean residence times in the Arctic Ocean. J. Geophys. Res. Oceans 106, 9075–9092. doi: 10.1029/1999JC000024
Gent, P. R., and McWilliams, J. C. (1990). Isopycnal mixing in ocean circulation models. J. Phys. Oceanogr. 20, 150–155. doi: 10.1175/1520-0485(1990)020<0150:IMIOCM>2.0.CO;2
Giles, K. A., Laxon, S. W., Ridout, A. L., Wingham, D. J., and Bacon, S. (2012). Western Arctic Ocean freshwater storage increased by wind-driven spin-up of the Beaufort Gyre. Nat. Geosci. 5, 194–197. doi: 10.1038/ngeo1379
Haine, T., Curry, B., Gerdes, R., Hansen, E., Karcher, M., Lee, C., et al. (2015). Arctic freshwater export: status, mechanisms, and prospects. Global Planet. Change 125, 13–35. doi: 10.1016/j.gloplacha.2014.11.013
Hu, X., Myers, P. G., and Lu, Y. (2019). Pacific Water pathway in the Arctic Ocean and Beaufort Gyre in two simulations with different horizontal resolutions. J. Geophys. Res. Oceans 124, 6414–6432. doi: 10.1029/2019JC015111
Hunke, E., and Dukowicz, J. (1997). An elastic-viscous-plastic model for sea ice dynamics. J. Phys. Oceanogr. 27, 1849–1867. doi: 10.1175/1520-0485(1997)027<1849:AEVPMF>2.0.CO;2
Jahn, A., Tremblay, B., Mysak, L. A., and Newton, R. (2010). Effect of the large-scale atmospheric circulation on the variability of the Arctic Ocean freshwater export. Clim. Dyn. 34, 201–222. doi: 10.1007/s00382-009-0558-z
Jakobsson, M., Macnab, R., Mayer, L., Anderson, R., Edwards, M., Hatzky, J., et al. (2008). An improved bathymetric portrayal of the Arctic Ocean: Implications for ocean modeling and geological, geophysical and oceanographic analyses. Geophys. Res. Lett. 35:L07602. doi: 10.1029/2008GL033520
Johnson, H. L., Cornish, S. B., Kostov, Y., Beer, E., and Lique, C. (2018). Arctic Ocean freshwater content and its decadal memory of sea–level pressure. Geophys. Res. Lett. 45, 4991–5001. doi: 10.1029/2017GL076870
Karcher, M., Smith, J., Kauker, F., Gerdes, R., and Smethie, W. (2012). Recent changes in Arctic Ocean circulation revealed by iodine-129 observations and modeling. J. Geophys. Res. Oceans 117:C08007. doi: 10.1029/2011JC007513
Kelly, S. J., Proshutinsky, A., Popova, E. K., Aksenov, Y. K., and Yool, A. (2019). On the origin of water masses in the Beaufort Gyre. J. Geophys. Res. Oceans 124, 4696–4709. doi: 10.1029/2019JC015022
Large, W. G., Mcwilliams, J. C., and Doney, S. C. (1994). Oceanic vertical mixing - a review and a model with a nonlocal boundary-layer parameterization. Rev. Geophys. 32, 363–403. doi: 10.1029/94RG01872
Large, W. G., and Yeager, S. G. (2009). The global climatology of an interannually varying air-sea flux data set. Clim. Dyn. 33, 341–364. doi: 10.1007/s00382-008-0441-3
Lique, C., Treguier, A. M., Blanke, B., and Grima, N. (2010). On the origins of water masses exported along both sides of Greenland: a lagrangian model analysis. J. Geophys. Res. Oceans 115:C05019. doi: 10.1029/2009JC005316
Löhner, R., Morgan, K., Peraire, J., and Vahdati, M. (1987). Finite-element flux-corrected transport (FEM-FCT) for the Euler and Navier-Stokes equations. Int. J. Numer. Methods Fluids 7, 1093–1109. doi: 10.1002/fld.1650071007
Marshall, J., Scott, J., and Proshutinsky, A. (2017). “Climate response functions” for the Arctic Ocean: a proposed coordinated modelling experiment. Geosci. Model Dev. 10, 2833–2848. doi: 10.5194/gmd-10-2833-2017
McPhee, M. G. (2013). Intensification of geostrophic currents in the Canada Basin, Arctic Ocean. J. Clim 26, 3130–3138. doi: 10.1175/JCLI-D-12-00289.1
McPhee, M. G., Proshutinsky, A., Morison, J. H., Steele, M., and Alkire, M. B. (2009). Rapid change in freshwater content of the Arctic Ocean. Geophys. Res. Lett. 36:L10602. doi: 10.1029/2009GL037525
Moore, G. W. K., Schweiger, A., Zhang, J., and Steele, M. (2018). Collapse of the 2017 winter Beaufort High: a response to thinning sea ice? Geophys. Res. Lett. 45, 2860–2869. doi: 10.1002/2017GL076446
Morison, J., Kwok, R., Peralta-Ferriz, C., Alkire, M., Rigor, I., Andersen, R., et al. (2012). Changing Arctic Ocean freshwater pathways. Nature 481, 66–70. doi: 10.1038/nature10705
Morison, J., Steele, M., and Andersen, R. (1998). Hydrography of the upper Arctic Ocean measured from the nuclear submarine U.S.S. Pargo. Deep Sea Res. I 45, 15–38. doi: 10.1016/S0967-0637(97)00025-3
Morison, J., Steele, M., Kikuchi, T., Falkner, K., and Smethie, W. (2006). The relaxation of central Arctic Ocean hydrography to pre-1990s climatology. Geophys. Res. Lett. 33:L17604. doi: 10.1029/2006GL026826
Nummelin, A., Ilicak, M., Li, C., and Smedsrud, L. H. (2016). Consequences of future increased Arctic runoff on Arctic Ocean stratification, circulation, and sea ice cover. J. Geophys. Res. Oceans 121, 617–637. doi: 10.1002/2015JC011156
Parkinson, C. L., and Washington, W. M. (1979). A large-scale numerical model of sea ice. J. Geophys. Res. Oceans 84, 311–337. doi: 10.1029/JC084iC01p00311
Pemberton, P., and Nilsson, J. (2016). The response of the central Arctic Ocean stratification to freshwater perturbations. J. Geophys. Res. Oceans 121, 792–817. doi: 10.1002/2015JC011003
Polyakov, I., Bhatt, U., Walsh, J., Abrahamsen, E. P., Pnyushkov, A., and Wassmann, P. (2013). Recent oceanic changes in the Arctic in the context of long-term observations. Ecol. Appl. 23, 1745–1764. doi: 10.1890/11-0902.1
Proshutinsky, A., Dukhovskoy, D., Timmermans, M., Krishfield, R., and Bamber, J. (2015). Arctic circulation regimes. Philos. Trans. R. Soc. A 373:20140160. doi: 10.1098/rsta.2014.0160
Proshutinsky, A., and Johnson, M. (1997). Two circulation regimes of the wind-driven Arctic Ocean. J. Geophys. Res. Oceans 102, 12493–12514. doi: 10.1029/97JC00738
Proshutinsky, A., Krishfield, R., Toole, J. M., Timmermans, M. L., Williams, W., Zimmermann, S., et al. (2019). Analysis of the Beaufort Gyre freshwater content in 2003-2018. J. Geophys. Res. Oceans 124, 9658–9689. doi: 10.1029/2019JC015281
Rabe, B., Dodd, P., Hansen, E., Falck, E., Schauer, U., Mackensen, A., et al. (2013). Export of Arctic freshwater components through the Fram Strait 1998-2011. Ocean Sci. 9, 91–109. doi: 10.5194/os-9-91-2013
Rabe, B., Karcher, M., Kauker, F., Schauer, U., Toole, J. M., Krishfield, R. A., et al. (2014). Arctic ocean basin liquid freshwater storage trend 1992-2012. Geophys. Res. Lett. 41, 961–968. doi: 10.1002/2013GL058121
Redi, M. H. (1982). Oceanic isopycnal mixing by coordinate rotation. J. Phys. Oceanogr. 12, 1154–1158. doi: 10.1175/1520-0485(1982)012<1154:OIMBCR>2.0.CO;2
Rudels, B., Anderson, L. G., and Jones, E. P. (1996). Formation and evolution of the surface mixed layer and halocline of the Arctic Ocean. J. Geophys. Res. Oceans 101, 8807–8821. doi: 10.1029/96JC00143
Serreze, M. C., Barrett, A. P., Slater, A. G., Woodgate, R. A., Aagaard, K., Lammers, R. B., et al. (2006). The large-scale freshwater cycle of the Arctic. J. Geophys. Res. Oceans 111:C11010. doi: 10.1029/2005JC003424
Serreze, M. C., and Barry, R. G. (2011). Processes and impacts of Arctic amplification: a research synthesis. Glob. Planet. Change 77, 85–96. doi: 10.1016/j.gloplacha.2011.03.004
Shindell, D. T., Miller, R. L., Schmidt, G. A., and Pandolfo, L. (1999). Simulation of recent northern winter climate trends by greenhouse-gas forcing. Nature 399, 452–455. doi: 10.1038/20905
Shu, Q., Qiao, F., Song, Z., Zhao, J., and Li, X. (2018). Projected freshening of the Arctic Ocean in the 21st century. J. Geophys. Res. Oceans 123, 9232–9244. doi: 10.1029/2018JC014036
Smagorinsky, J. (1963). General circulation experiments with the primitive equations: I. the basic experiment. Monthly Weather Rev. 91, 99–164. doi: 10.1175/1520-0493(1963)091<0099:GCEWTP>2.3.CO;2
Spall, M. (2020). Potential vorticity dynamics of the Arctic halocline. J. Phys. Oceanogr. 50, 2491–2506. doi: 10.1175/JPO-D-20-0056.1
Steele, M., and Boyd, T. (1998). Retreat of the cold halocline layer in the Arctic Ocean. J. Geophys. Res. Oceans 103, 10419–10435. doi: 10.1029/98JC00580
Steele, M., and Ermold, W. (2004). Salinity trends on the Siberian shelves. Geophys. Res. Lett. 31:L24308. doi: 10.1029/2004GL021302
Steele, M., Morley, R., and Ermold, W. (2001). Phc: A global ocean hydrography with a high quality Arctic Ocean. J. Clim. 14, 2079–2087. doi: 10.1175/1520-0442(2001)014<2079:PAGOHW>2.0.CO;2
Thompson, D. W. J., and Wallace, J. M. (1998). The Arctic Oscillation signature in the wintertime geopotential height and temperature fields. Geophys. Res. Lett. 25, 1297–1300. doi: 10.1029/98GL00950
Timmermans, M. L., Proshutinsky, A., Krishfield, R. A., Perovich, D. K., Richter-Menge, J. A., Stanton, T. P., et al. (2011). Surface freshening in the Arctic Ocean's Eurasian Basin: an apparent consequence of recent change in the wind-driven circulation. J. Geophys. Res. Oceans 116:C00D03. doi: 10.1029/2011JC006975
Tsujino, H., Urakawa, S., Nakano, H., Small, R. J., Kim, W. M., Yeager, S. G., et al. (2018). JRA-55 based surface dataset for driving ocean–sea-ice models (JRA55-do). Ocean Modell. 130, 79–139. doi: 10.1016/j.ocemod.2018.07.002
Wang, Q. (2021). Stronger variability in the Arctic Ocean induced by sea ice decline in a warming climate: freshwater storage, dynamic sea level and surface circulation. J. Geophys. Res. Oceans 126:e2020JC016886. doi: 10.1029/2020JC016886
Wang, Q., Danilov, S., Mu, L., Sidorenko, D., and Wekerle, C. (2021a). Lasting impact of winds on Arctic sea ice through the ocean's memory. Cryosphere Discuss. doi: 10.5194/tc-2021-50. [Epub ahead of print].
Wang, Q., Danilov, S., and Schröter, J. (2008). Finite element ocean circulation model based on triangular prismatic elements, with application in studying the effect of vertical discretization. J. Geophys. Res. Oceans 113:C05015. doi: 10.1029/2007JC004482
Wang, Q., Danilov, S., Sidorenko, D., Timmermann, R., Wekerle, C., Wang, X., et al. (2014). The Finite Element Sea Ice-Ocean Model (FESOM) v.1.4: formulation of an ocean general circulation model. Geosci. Model Dev. 7, 663–693. doi: 10.5194/gmd-7-663-2014
Wang, Q., Koldunov, N. V., Danilov, S., Sidorenko, D., Wekerle, C., Scholz, P., et al. (2020a). Eddy kinetic energy in the Arctic Ocean from a global simulation with a 1-km Arctic. Geophys. Res. Lett. 47:e2020GL088550. doi: 10.1029/2020GL088550
Wang, Q., Marshall, J., Scott, J., Meneghello, G., Danilov, S., and Jung, T. (2019a). On the feedback of ice - ocean stress coupling from geostrophic currents in an anticyclonic wind regime over the Beaufort Gyre. J. Phys. Oceanogr. 49, 369–383. doi: 10.1175/JPO-D-18-0185.1
Wang, Q., Ricker, R., and Mu, L. (2021b). Arctic sea ice decline preconditions events of anomalously low sea ice volume export through Fram Strait in the early 21st century. J. Geophys. Res. Oceans 126:e2020JC016607. doi: 10.1029/2020JC016607
Wang, Q., Wekerle, C., Danilov, S., Koldunov, N., Sidorenko, D., Sein, D., et al. (2018a). Arctic sea ice decline significantly contributed to the unprecedented liquid freshwater accumulation in the Beaufort Gyre of the Arctic Ocean. Geophys. Res. Lett. 45, 4956–4964. doi: 10.1029/2018GL077901
Wang, Q., Wekerle, C., Danilov, S., Sidorenko, D., Koldunov, N., Sein, D., et al. (2019b). Recent sea ice decline did not significantly increase the total liquid freshwater content of the Arctic Ocean. J. Clim. 32, 15–32. doi: 10.1175/JCLI-D-18-0237.1
Wang, Q., Wekerle, C., Danilov, S., Wang, X., and Jung, T. (2018b). A 4.5 km resolution Arctic Ocean simulation with the global multi-resolution model FESOM 1.4. Geosci. Model Dev. 11, 1229–1255. doi: 10.5194/gmd-11-1229-2018
Wang, Q., Wekerle, C., Wang, X., Danilov, S., Koldunov, N., Sein, D., et al. (2020b). Intensification of the Atlantic Water supply to the Arctic Ocean through Fram Strait induced by Arctic sea ice decline. Geophys. Res. Lett. 47:e2019GL086682. doi: 10.1029/2019GL086682
Wang, S., Wang, Q., Shu, Q., Song, Z., Lohmann, G., Danilov, S., et al. (2021c). Nonmonotonic change of the Arctic Ocean freshwater storage capability in a warming climate. Geophys. Res. Lett. 48:e2020GL090951. doi: 10.1029/2020GL090951
Wekerle, C., Wang, Q., Danilov, S., Jung, T., and Schröter, J. (2013). The Canadian Arctic archipelago throughflow in a multiresolution global model: Model assessment and the driving mechanism of interannual variability. J. Geophys. Res. Oceans 118, 4525–4541. doi: 10.1002/jgrc.20330
Zhang, J., Steele, M., Runciman, K., Dewey, S., Morison, J., Lee, C., et al. (2016). The Beaufort Gyre intensification and stabilization: a model-observation synthesis. J. Geophys. Res. Oceans 121, 7933–7952. doi: 10.1002/2016JC012196
Keywords: Arctic Ocean circulation, Arctic Oscillation, Beaufort High, Arctic freshwater, river runoff, geostrophic current
Citation: Wang Q, Danilov S, Sidorenko D and Wang X (2021) Circulation Pathways and Exports of Arctic River Runoff Influenced by Atmospheric Circulation Regimes. Front. Mar. Sci. 8:707593. doi: 10.3389/fmars.2021.707593
Received: 10 May 2021; Accepted: 27 July 2021;
Published: 23 August 2021.
Edited by:
Katrin Schroeder, Institute of Marine Science, National Research Council (CNR), ItalyReviewed by:
Manuel Bensi, Istituto Nazionale di Oceanografia e di Geofisica Sperimentale, ItalyZhenxia Long, Bedford Institute of Oceanography (BIO), Canada
Copyright © 2021 Wang, Danilov, Sidorenko and Wang. This is an open-access article distributed under the terms of the Creative Commons Attribution License (CC BY). The use, distribution or reproduction in other forums is permitted, provided the original author(s) and the copyright owner(s) are credited and that the original publication in this journal is cited, in accordance with accepted academic practice. No use, distribution or reproduction is permitted which does not comply with these terms.
*Correspondence: Qiang Wang, UWlhbmcuV2FuZ0Bhd2kuZGU=