 Jessica Lunt*†
 Christopher J. Freeman†
 Dean S. Janiak
 Katrina Bayliss†Michelle Stephens
 Eve Galimany†
 Valerie J. Paul
- Smithsonian Marine Station, Fort Pierce, FL, United States
Understanding the structure and function of infaunal communities is useful in determining the biodiversity and ecosystem function of shallow estuaries. We conducted a survey of infaunal communities within three separate water basins [Mosquito Lagoon (ML), Indian River (IR), and Banana River (BR)] in the larger Northern Indian River Lagoon, FL, United States to establish a database of infaunal community structure and function. Twenty-seven sites were sampled quarterly from 2014 to 2016. Analysis of all samples determined that basin, season, and sediment composition were the primary drivers of macrobenthic community composition. Diversity was highest in the ML, and lower in spring compared to other seasons. The occurrence of a brown tide (Aureoumbra lagunensis) in 2016 allowed a comparison of winter and spring communities before (2015) and during (2016) a bloom event. Community composition and diversity at the BR sites were the most affected by the bloom event with the lowest diversity and abundances during the bloom. Diversity in the IR was also lower during the bloom, while the ML was unaffected by the bloom. Species of all feeding groups were affected by the bloom, with lower abundances found in all groups. In addition, to determine the overall trophic diversity of infaunal communities, we collected infaunal organisms from two of the quarterly sampled sites for isotope analyses. Values of δ13C and δ15N from infaunal tissue were compared to those of potential food sources at each site. Substantial interspecific variation in isotope values of infaunal organisms within a site suggests the presence of diverse nutritional modes that include suspension and deposit feeding and predation. Together, these data suggest that infaunal communities contribute to benthic pelagic coupling and nutrient cycling within the estuarine communities, but the overall function of these communities may be tightly linked to their species composition.
Introduction
Biodiversity is an important component of resilient ecosystems at all levels. From genetic to landscape, diverse communities promote healthy functioning and contribute to resiliency and survival in times of disturbance (Chapin et al., 2000). Diversity is also linked to the provision and sustainability of ecosystem processes (Hooper et al., 2005) as individual species or groups have important and specific functions like nutrient cycling, decomposition, and the production and removal of organic matter. In estuaries, suspension feeders such as bivalves are often targeted for their effects on water clarity and potential for bioremediation (Triest et al., 2016; Galimany et al., 2017b). However, other diverse communities of organisms including polychaetes and crustaceans also carry out critical ecosystem services including carbon cycling, filtration, secondary production, and sediment stability (Snelgrove, 1999).
Soft sediment communities comprise a large portion of sea floor (Snelgrove, 1997, 1999; Ieno et al., 2006) and are composed of diverse taxonomic and functional groups with a wide array of feeding modes (Fauchald and Jumars, 1979; Snelgrove, 1999; Abreu et al., 2006; Galván et al., 2008). In addition to their critical role in nutrient and organic matter cycling, infauna are bioturbators that increase oxygenation of the sediments and affect sediment biogeochemistry through their movements (Snelgrove, 1999; Devereux et al., 2019). Suspension feeders also facilitate biodeposition and accelerate carbon removal relative to deposit feeders (Riisgard, 1991). Infaunal communities are useful indicators of ecosystem health (Dauvin, 2007), as they are constant features of the bottom sediments and vary predictably with the physical habitat and in response to natural and man-made stressors (Labrune et al., 2008). Faunistic studies are essential to assess diversity patterns within ecosystems and to detect the effects of environmental changes and disturbances in marine soft-bottom macrobenthos (Currie and Small, 2005; Labrune et al., 2008). For example, diversity in benthic samples in an Australian subtropical estuary was reduced by half during the 1997–1998 El Niño event (Currie and Small, 2005). Thus, they are extremely good indicators of induced environmental changes.
Estuaries around the world have experienced declining water quality and eutrophication for the last few decades (Pinckney et al., 2001; Bricker et al., 2008). In the Indian River Lagoon (IRL) of Florida (United States), human activities, such as freshwater diversion for agriculture and eutrophication from coastal development (Dybas, 2002; Lapointe et al., 2020) have led to increased prevalence of algal blooms. In the spring of 2011, a “superbloom” spread throughout the northern IRL and lasted for 7 months (SJRWMD, 2012; Kamerosky et al., 2015; Phlips et al., 2015). The 2011 bloom, dominated by several microalgae, was followed in 2012 by a brown tide of Aureoumbra lagunensis (DeYoe et al., 1997). The brown tide event had negative and lasting effects on many groups (Gobler et al., 2013). For example, behavioral changes were also seen in bivalve suspension feeders, which reduced their clearance rates in the presence of the bloom (Gobler et al., 2013; Galimany et al., 2017a, 2020). Changes in faunal abundance and behavior were accompanied by a loss of 60% of IRL seagrass coverage which led to further degradations of water quality and nutrient cycling capabilities (Lapointe et al., 2015, 2020). These widespread impacts on both flora and fauna, led to concerns about the damaged state of the lagoon (Gobler et al., 2013; Kamerosky et al., 2015).
While macrobenthic community composition has been examined in the IRL, these studies targeted seagrass-associated species (Young and Young, 1975; Virnstein et al., 1984) or a single group of organisms (decapods: Gore et al., 1981; amphipods: Nelson, 1995; bivalves: Mikkelsen et al., 1995; polychaetes: Cox et al., 2018). Therefore, the spatial and temporal trends of soft sediment communities are lacking in current IRL research and are needed to further assess patterns of change in a rapidly changing ecosystem. The initial goal of this study was to establish a database of infaunal community structure and function within the northern IRL using a combined approach of biological surveys and targeted sampling of δ15N and δ13C values of infaunal organism tissue to assess the diversity of feeding modes of infauna. During sampling, an A. lagunensis bloom occurred, which provided an opportunity to examine the effects of the brown tide on soft-sediment communities.
Materials and Methods
Infauna Survey
Environmental Data
Environmental conditions were recorded at each site during each sampling event. A YSI recorded bottom water temperature, dissolved oxygen, salinity, and pH (YSI 556 and YSI Professional Plus instruments). Turbidity was measured using a Secchi disk. Time of day and weather conditions (cloud cover, wind direction and speed, and air temperature) as well as presence of H2S based on smell were noted. Sites ranged in depth from 0.5 to 3.5 m, depth was not corrected for tidal stage as the northern IRL is microtidal with primarily wind driven differences (Smith, 1993; Schaefer et al., 2019).
Sediment samples were taken in January and April 2016 for a snapshot of the sediment types at each of the 27 sites. These samples were averaged for inclusion in data analyses. At the same time, three bottom substrate samples were collected using an Ogeechee corer, two for organic content analysis and one for grain size analysis. The sediment from these cores was divided into sub-samples from two substrate depths (0–2 and 2–5 cm). These samples were stored in airtight containers in a cooler in the field and frozen upon return to the laboratory. For analysis, sediment samples were thawed and immediately placed in pre-weighed aluminum dishes. Samples were weighed to the nearest 0.01 g and placed in an 80°C drying oven for a week to reach a constant weight. Samples were cooled in a desiccator, weighed, and transferred to a 500°C furnace for 5 h. Samples were again cooled in a desiccator, weighed, and discarded. Water content, calculated as the difference in weight from thawed to dried divided by wet weight and multiplied by 100, and loss on ignition (LOI, organic content), calculated as the difference in weight from dried to muffled divided by dry weight and multiplied by 100, were determined from these measurements.
For grain size analysis a single 5 cm core was collected as described above. For analysis, samples were thawed, transferred to a pre-weighed aluminum weigh boat, weighed, and dried at 100°C for 24 h. Samples were cooled in a desiccator and weighed, then mixed in a solution of hexametaphosphate and tap water. The volume of hexametaphosphate used was calculated by dividing the dry weight of the sample by 2.5. The volume of tap water was calculated by multiplying the dry weight of the sample by 10. The sample in solution was then mixed for 10 min and left in solution over night at room temperature. After soaking, samples were rinsed in a 63 μm sieve, dried for 24 h at 100°C, cooled, and weighed. Grain size was determined by placing samples in a geological sieve stack (63 μm, 125 μm, 250 μm, 500 μm, 2 mm, and 4 mm). The sample was shaken for 10 min, and the amount of sample remaining on each sieve was weighed and discarded. Percent of each grain size was calculated as the dry weight of each grain size divided by the total dry weight retained in all sieves multiplied by 100.
27 Site Survey
Quantitative benthic infaunal sampling was performed throughout the Northern Indian River Lagoon (NIRL), FL, United States. Sites were in the three primary basins of the IRL, Mosquito Lagoon (ML), Banana River (BR), and Indian River (IR), though each basin had differing numbers of sites. The basins of the IRL are ecologically distinct, differing hydrodynamically, chemically, and biologically (Kleppel, 1996). In 2014 (March–June), sampling initially occurred at 90 sites (Supplementary Figure 1). These 90 sites were chosen haphazardly to provide a “snapshot” on infaunal diversity within the IRL and help inform site selection for the quarterly sampling effort. This sampling effort was repeated in April–July of 2016, again by multiple teams. We include the species list generated by this effort, but no further analysis was performed (Supplementary Table 1). After the preliminary sampling at 90 sites in 2014, a subset of 27 sites (Supplementary Figure 2) was chosen for continued sampling. Not all 27 sites were represented in the initial sampling, though 10 were included. Sites were sampled quarterly (January, April, July, and October) to capture seasonal variation from July 2014 to April 2016. Three replicate samples, to account for patchy distributions of macrofauna (Elliott, 1977), were collected at each sampling site utilizing a 0.02 m2 Petite Ponar grab. In the field, samples were washed through a 0.5 mm mesh sieve, preserved in a solution of 4–7% buffered formalin (including Rose Bengal), and transported to the laboratory. After 2 weeks, samples were rinsed with freshwater and transferred to 70% ethanol. Animals were picked from samples with stereo microscopes (×6 magnification). Everything within the sample was counted with no discrimination based on size class (macro- vs. meiofauna) or life history (epi- vs. infauna). Organisms picked from the samples were later enumerated. Specifically, only animals with heads were included in counts to avoid double counting, and all shells were crushed to verify there was an animal within. These specimens were identified to the lowest possible taxon.
Analysis
Environmental parameters (temperature, salinity, dissolved oxygen, and temperature) were compared using a two-way ANOVA with basin and season as factors. Sediment grain size proportion was logit transformed, and proportion of the grain size categories (63 μm, 125 μm, 250 μm, 500 μm, 2 mm, and 4 mm) were compared among basins using ANOVA. Tukey’s HSD post hoc test was used to determine differences among levels within factors. Significance was determined by comparison to an alpha value of 0.05 for all analyses.
Data from the 27 quarterly samples were visualized using PRIMER and pretreated using a fourth-root overall transformation to reduce skew in data analysis from very abundant or very rare species. Congeners were combined prior to analysis to account for ambiguity in identification of some species, as not all were identified to species level. Species richness and diversity were calculated in PRIMER (Clarke and Warwick, 2014; Clarke and Gorley, 2015) based on the averages of the three replicates taken at each site on each sampling date. Replicate samples were averaged to account for high variability among replicates at each sampling. For all statistical tests, we used an alpha level of 0.05. Community composition was compared between seasons and basins using a permutational analysis of variance (PERMANOVA). The contribution of individual species to the similarity/dissimilarity between sites was calculated using the SIMPER procedure. Relationships between the abiotic parameters and the biological samples were assessed using the RELATE and distance based linear modeling (DistLM) procedures. All parameters (depth, temperature, salinity, dissolved oxygen, pH, Secchi depth, % 4mm grain, % 2mm, %500μm, %250μm, %125μm, %63μm, % < 63μm, and % LOI) were checked for collinearity using draftsman plots and associated Pearson’s correlation coefficients in PRIMER. Any parameters with a r value > ±0.7 were considered collinear. No parameters were removed from the analysis. All environmental data was normalized prior to comparisons. Normalization is a procedure in PRIMER that creates a standard scale for parameters taken in different units, allowing for direct comparison. Relationships among the biological and environmental data were established using a forward stepwise procedure and the best model (DistLM) chosen based on Aikaike information criterion. Average diversity (Shannon–Wiener Index) was calculated in PRIMER for each site and compared using three-way ANOVA with year, season, and basin as factors using SPSS. For diversity and abundance an interaction with year was significant, and to investigate differences within this interaction data was analyzed within year. For species richness, the basin × season interaction was significant, therefore, we analyzed within basin to examine differences among seasons and years. Tukey’s HSD post hoc test was used to determine differences among treatment levels. Data was log transformed to meet assumptions.
Brown Tide
A brown tide was reported throughout the northern IRL in early 2016 (Schaefer et al., 2019). Using data from St. Johns River Water Management District’s water quality monitoring program, chlorophyll a data for the three basins was compared with survey site locations. Infaunal communities were compared before and during the 2016 brown tide using PERMANOVA with bloom, season, and basin as factors. Species responsible for the patterns were explored using the SIMPER program in PRIMER. Abundance patterns of these species were explored using a three-way ANOVA with bloom condition, season, and basin as factors. To examine interactions, species were separated by basins and analyzed using a two-way ANOVA with bloom condition and season as factors. Additionally, Shannon–Wiener diversity was compared between pre-bloom and bloom years using a three-way ANOVA with bloom, season, and basin as fixed factors. The feeding types (e.g., deposit, suspension, etc.) of the identified taxa was determined through a review of the literature. Within the community samples we identified deposit feeders, suspension feeders, detritivores, herbivores, predators, and scavengers. Scavengers were not identified among the species collected for isotope analysis. Abundances were pooled within feeding types and the response of these feeding types to the bloom were examined using a three-way ANOVA with bloom condition, season, and basin as factors. When a significant interaction was found, feeding response was examined separately by basin. To account for fewer samples taken during the bloom, only the corresponding pre-bloom samples in winter (January) and spring (April) of 2015 were used for comparison. Significant basin × season interactions within the three-way ANOVA were investigated using a two-way ANOVA within basin with bloom condition (pre- and bloom) and season (winter and spring) as factors. Data was log transformed to meet assumptions.
Isotopes
To investigate interspecific differences in δ15N and δ13C values within sites as a proxy for functional (trophic) differences across infaunal organisms, we sampled macrobenthic communities at two locations in the NIRL that were near the quarterly monitoring sites NIRL 11 and NIRL12 (see Supplementary Figure 2). These sites (herein termed I11 and I12 for NIRL 11 and NIRL12, respectively) were chosen because preliminary work at nearby locations showed that they differed in their benthic cover, with sparse coverage of the seagrass Halodule wrightii and high levels of benthic detritus at I11 and bare sediment and low levels of detritus at I12. In addition, although the locations were within approximately 4 km of each other, I12 was closer to chronic human impact and potential nutrient inputs from development around the city of Titusville, FL (Freeman et al., 2018); I11, in contrast, was on the east side of the lagoon adjacent to restricted, conservation land that is part of the Kennedy Space Center. We thus predicted that the composition of food sources [e.g., particulate organic matter (POM) suspended in the water column and deposited on the surface of the sediment] would differ at these two sites and that their varying proximity to human development would influence the baseline isotopic signal of the site (in particular for δ15N; Freeman et al., 2018). Infaunal organisms were collected by multiple (at least 4) Petite Ponar (0.02 m2) grabs at each of the sites. After each collection, sediment was sieved through 1 mm mesh, and retained organisms from each site were pooled into plastic buckets with fresh seawater for transport back to the laboratory. At each site, we also collected replicate samples of surface sediment (top 1 cm) in 50 mL tubes and water in 20 L plastic buckets to sample potential sources of organic matter for deposit- and suspension-feeding infaunal organisms.
After identification (Supplementary Table 2), each individual organism was placed into a 7 mL scintillation vial or, to obtain enough biomass for isotope analysis, several individuals were pooled into one vial (Galván et al., 2008; Supplementary Table 2). Individual water samples (8–12 L per sample) from each site were filtered through Millipore quartz fiber filter (2 μm porosity) to retain POM (Freeman et al., 2018). Samples of infaunal organisms, sediment, and filters were dried at 60°C. Infaunal tissue and sediment were then homogenized to a fine powder using a mortar and pestle. Homogenized infaunal tissue for each sample was then split evenly between two vials and tissue in one vial of each pair was acidified to remove carbonate that can lead to enriched (higher) δ13C values by dripping 1N HCl onto infaunal tissue until bubbling stopped. All sediment samples were also processed this way, but dried filters were acidified by exposure to 12N HCl fumes in a sealed desiccator for 12 h and then returned to a 60°C oven for 12 h to remove residual acid. After bubbling stopped, infaunal tissue and sediment samples were dried at 60°C. Acidified and unacidified samples of infaunal tissue, sediment, and organic matter retained by filters were weighed into tared tin capsules to the nearest 0.001 mg. Isotope analysis was carried out at the Stable Isotope Facility at UC Davis using a PDZ Europa ANCA-GSL (for infaunal tissue samples) or Micro Cube [for POM and sediment (herein referred to as SOM for sediment organic matter) samples]] elemental analyzer interfaced to a PDZ Europa 20–20 isotope ratio mass spectrometer (Sercon Ltd., Cheshire, United Kingdom). The long-term standard deviation is 0.2‰ for 13C and 0.3‰ for 15N. Delta values are expressed relative to international standards Vienna Pee Dee Belemnite (VPDB) and Air for carbon and nitrogen, respectively. Isotope values are reported in δ notation (δ15N and δ13C) in units per mill (‰). Both acidified and unacidified samples were analyzed to determine whether acidification also impacted δ15N values.
Results
Infauna Surveys
Species Lists
The sampling efforts before and after the quarterly sampling from the 90 sites captured 235 taxa, including 44 not found in the quarterly sampling. The initial survey captured 213 taxa and the second survey captured 143 taxa including 22 not captured in the initial sampling. These data are provided as a species list (Supplementary Table 1). Quarterly sampling captured 314 taxa, including 71 not found in the 90 site surveys (Supplementary Table 3). Surveys capturing additional species are attributed to increased spatial sampling as species accumulation curves indicate the areas were well sampled.
Community Analysis
Diversity was similar across basins (Supplementary Table 4), though varied considerably among stations. Shannon–Wiener diversity did not differ consistently among basins and seasons across years (year × basin: F = 3.275, p = 0.011). This interaction was explored by analyzing within years. ML diversity was highest (Figure 1A). In 2014, diversity was lower in the IR and BR than the ML and did not differ between summer and fall samples (Table 1 and Figure 1A). Diversity was lower in the BR and was lowest in fall and highest in winter 2015. In 2016, diversity was higher in the ML and was not different between winter and spring samples.
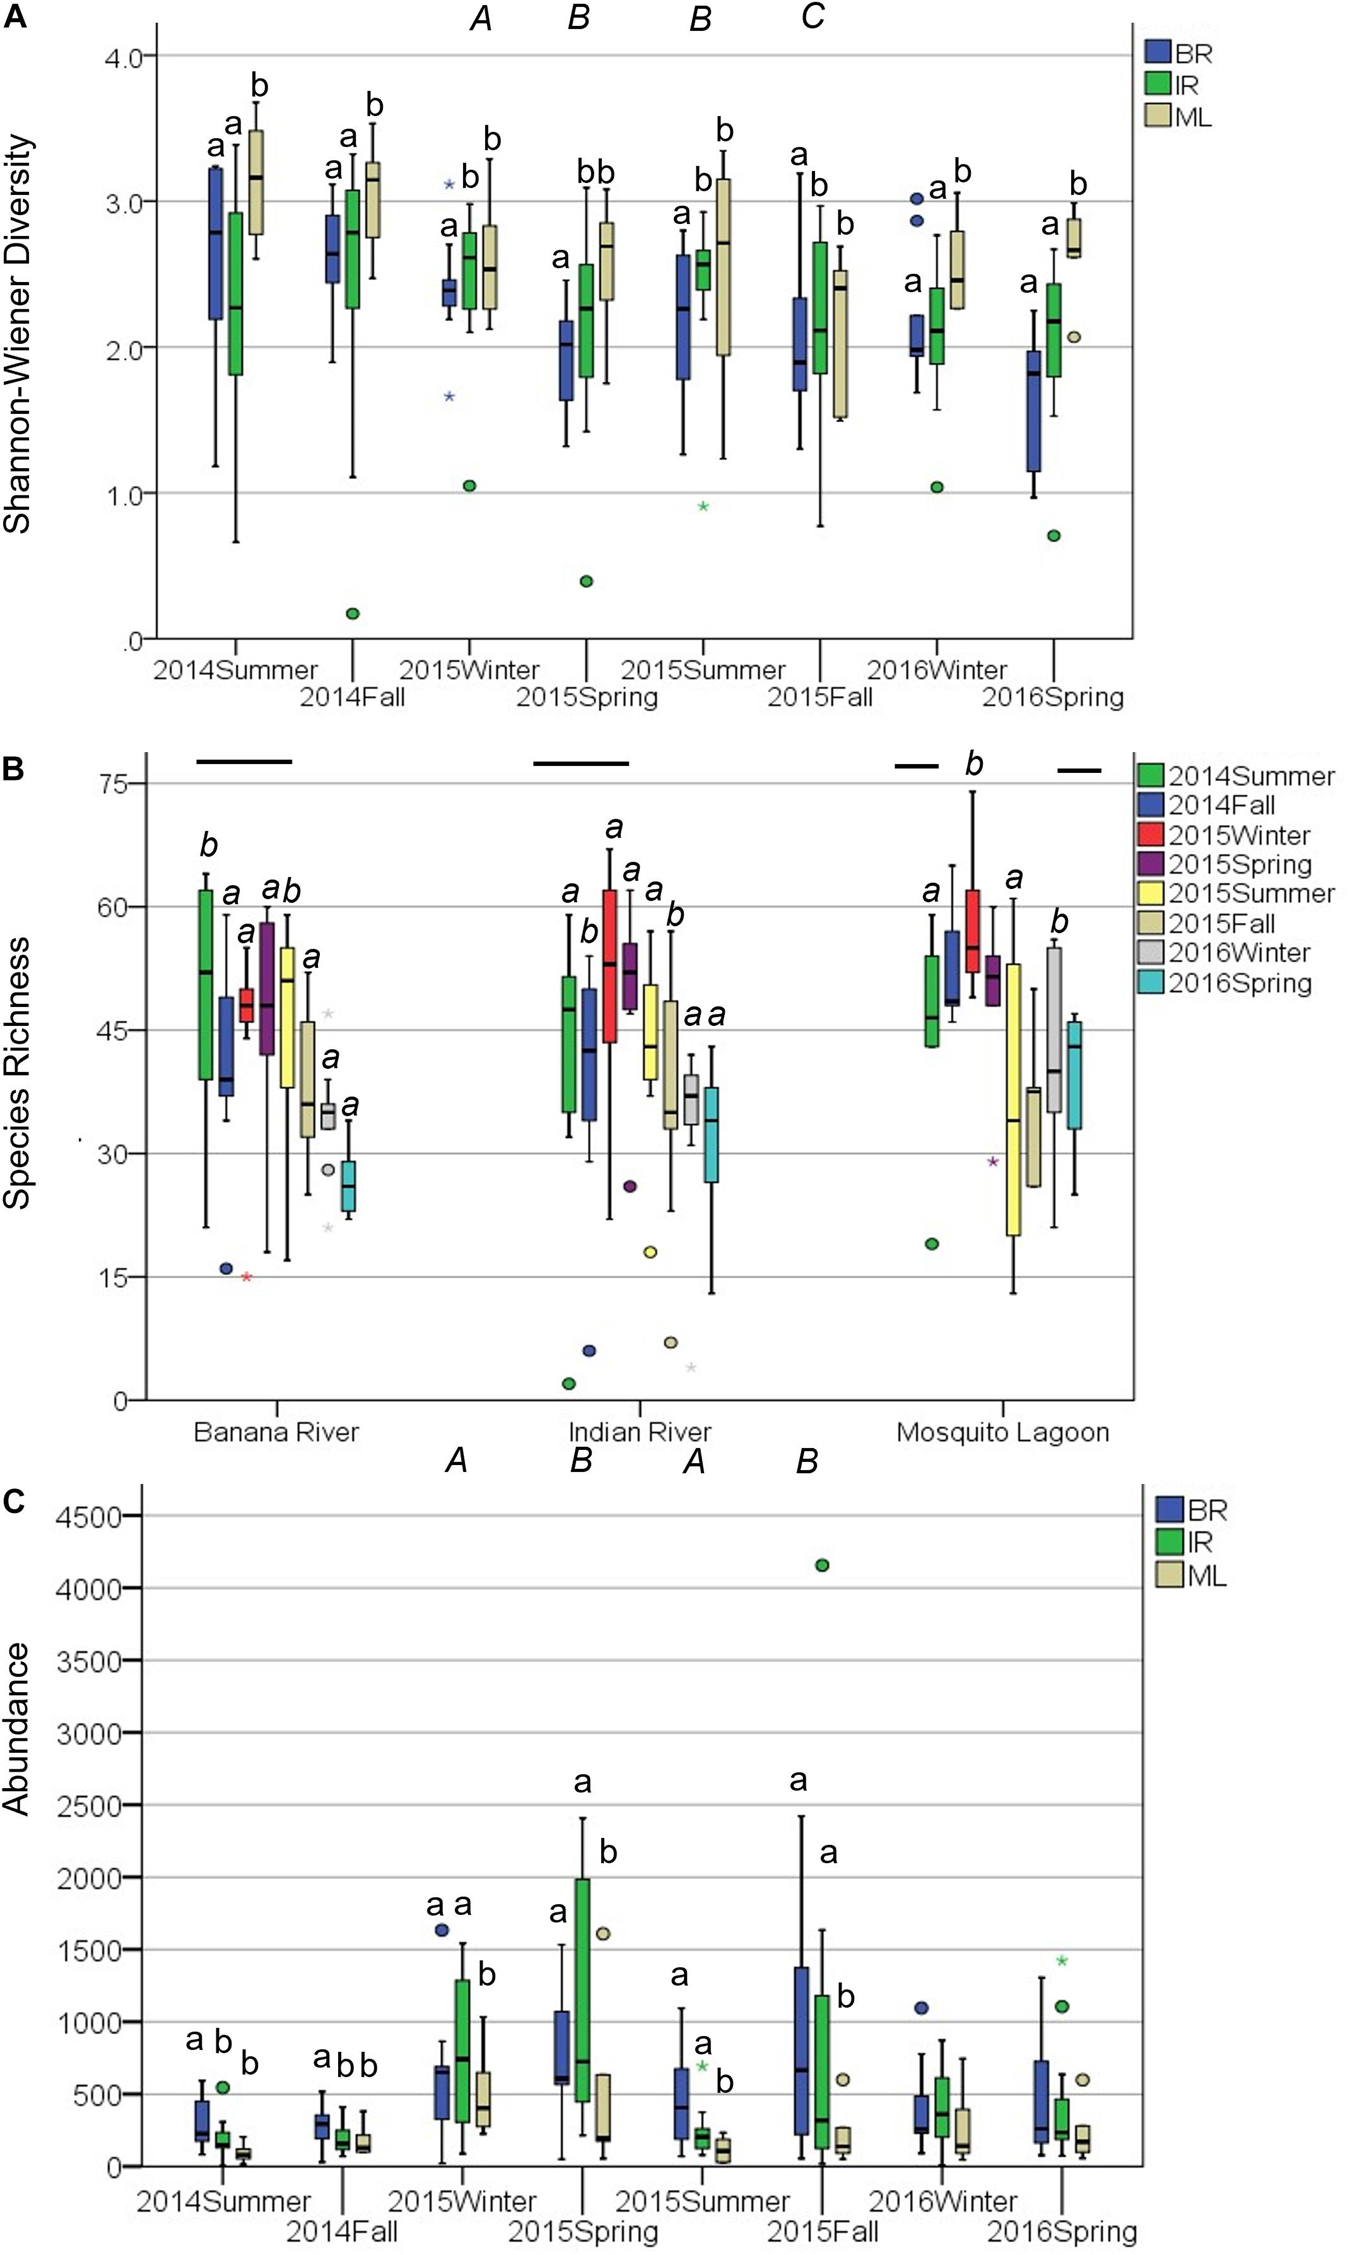
Figure 1. Community metrics for the 27 quarterly sampled sites. Boxplots represent minimum, first quartile, median, third quartile, and maximum, with circles denoting outliers. (A) Shannon–Wiener diversity was analyzed within years because of a significant interaction between year and basin. Lower case letters (a) denote differences among basins, upper case italics (A) denote differences among seasons within 2015. (B) Species Richness was analyzed within basins because of a significant interaction between season and basin. Lowercase italics (a) denote differences among seasons. For the Mosquito Lagoon fall and spring samples were intermediate to summer and winter samples, but the (ab) designation has been left out for readability. Bars denote differences among years. (C) Abundance was analyzed within years because of a significant interaction between year and basin. Lower case letters (a) denote differences among basins, upper case italics (A) denote differences among seasons within 2015.
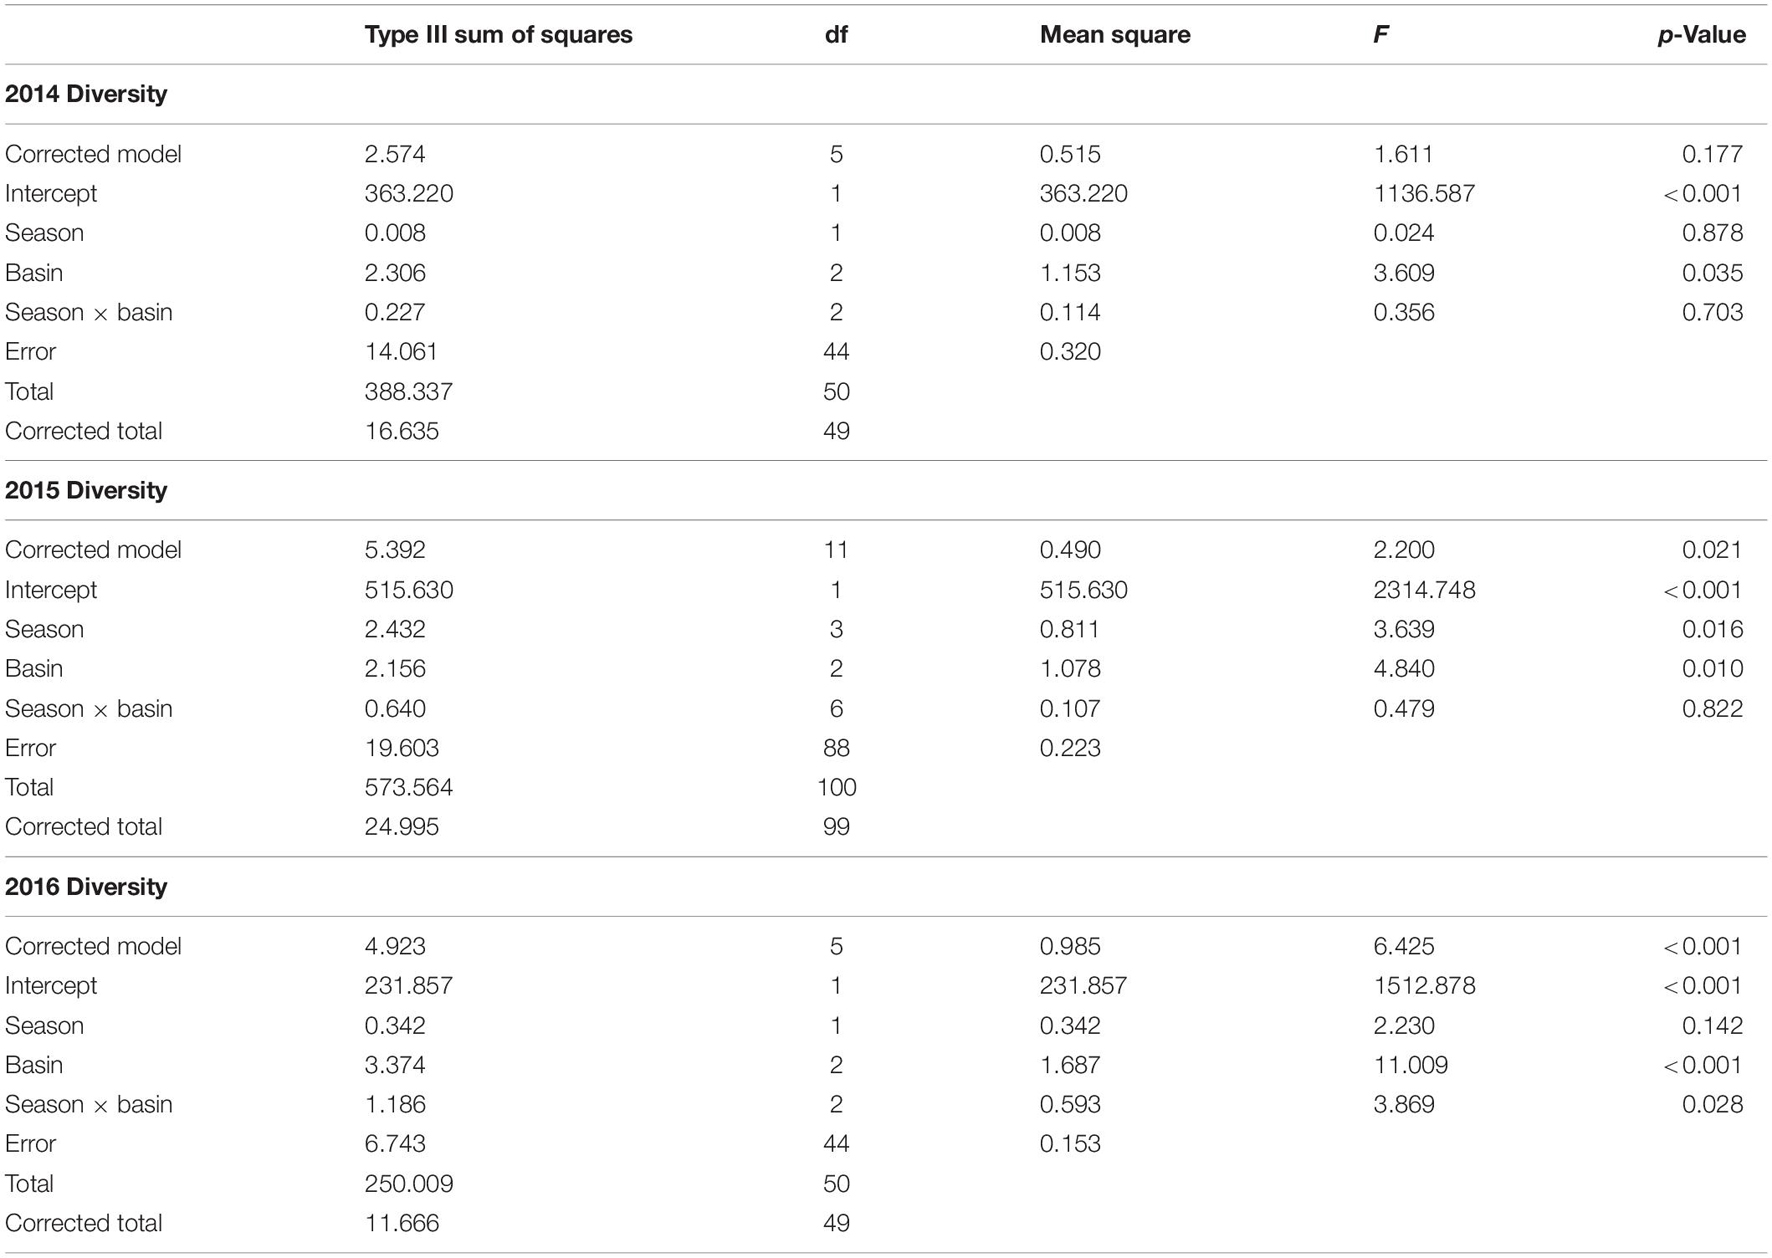
Table 1. ANOVA results for two-way ANOVA of Shannon–Wiener diversity within year, with season and basin as factors.
Species richness differed between seasons, but these differences were not consistent across basins (season × basin interaction: F5,590 = 3.34, p = 0.006). This interaction was explored by analyzing within basins. Species richness decreased in the summer of 2015, most prominently in the ML (Figure 1B). Species richness in the BR was lower in 2016 and was higher in the summer than in the other seasons, which did not differ (Table 2). Species richness in the IR was lower in 2016 and was lower in the fall than in the other seasons, which did not differ. Species richness in the ML was lowest in 2016 and highest in 2014 and was lowest in summer and highest in winter.
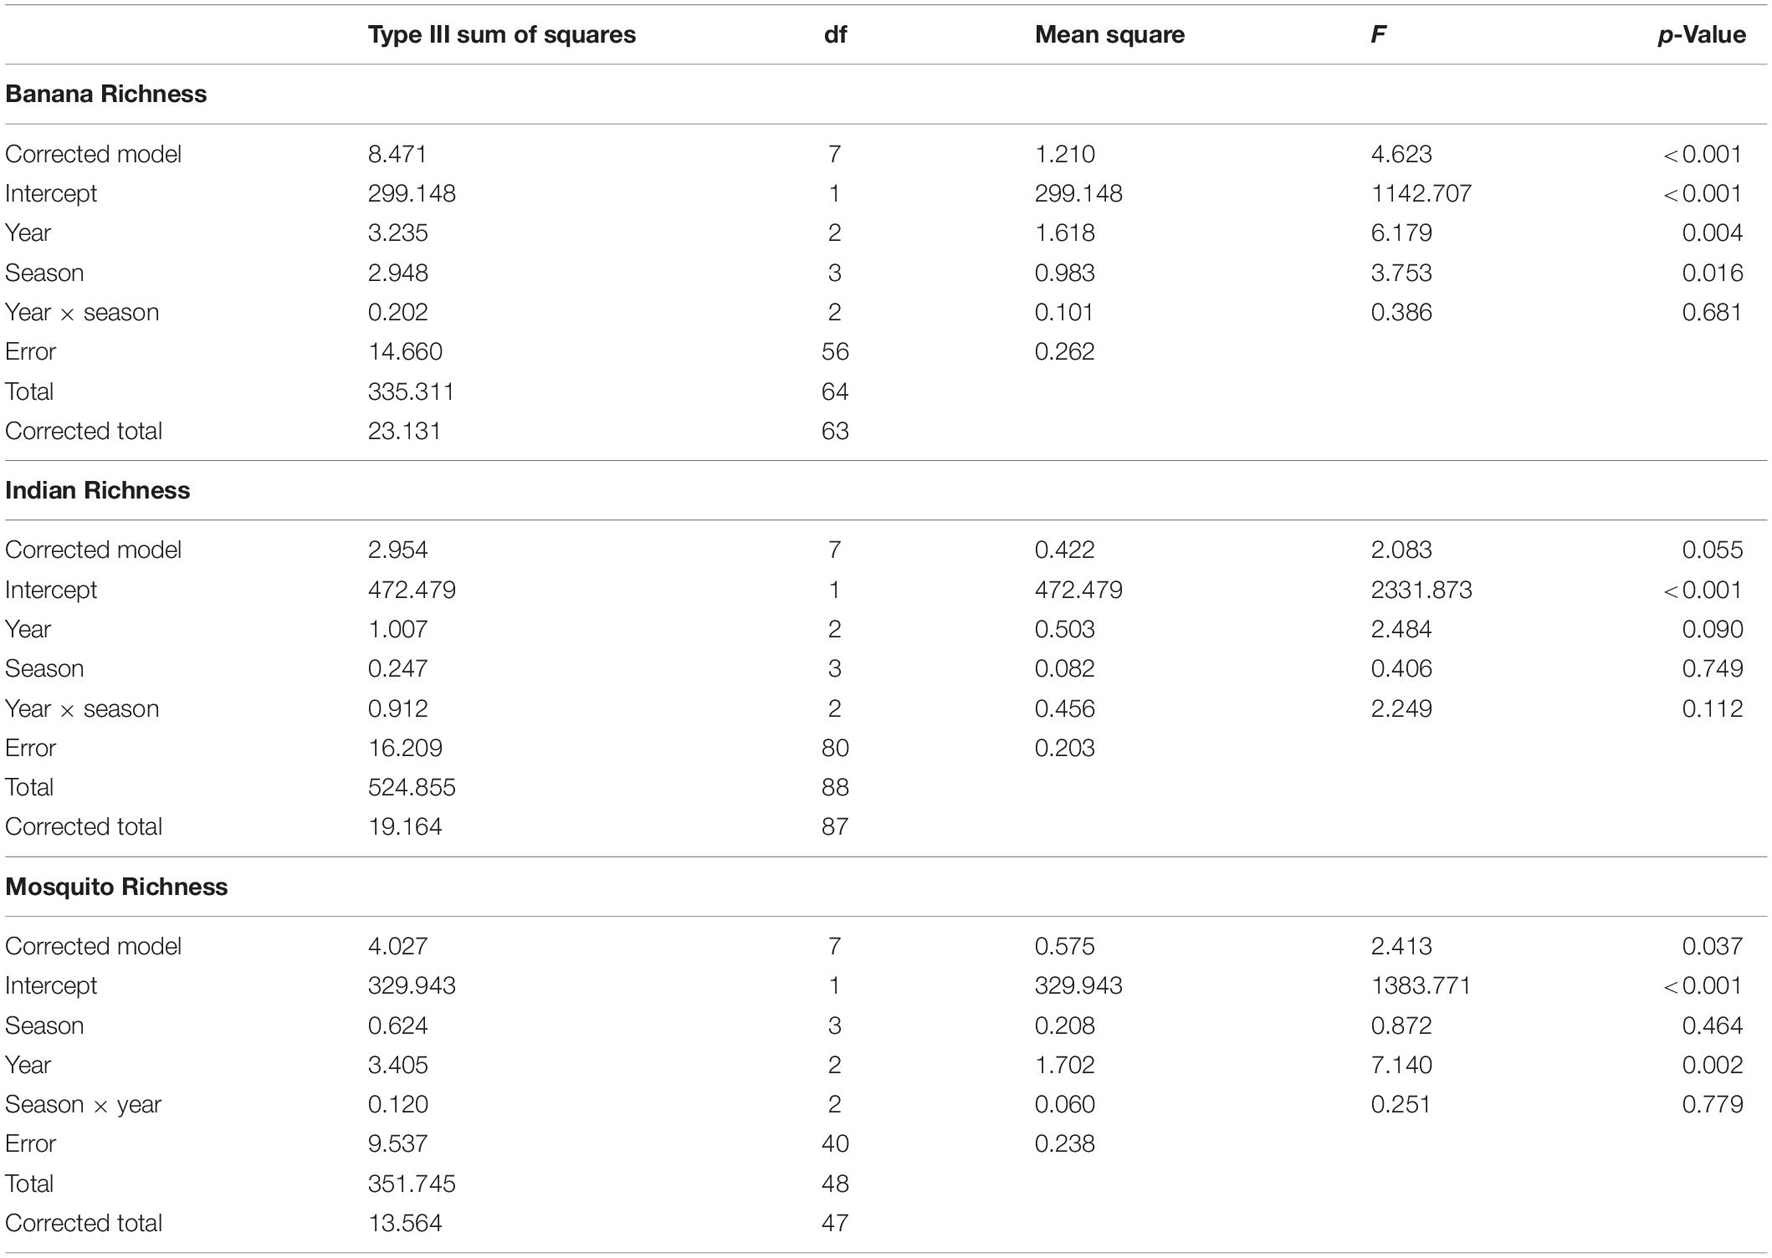
Table 2. ANOVA results for two-way ANOVA of species richness within basin, with year and season as factors.
Abundance differed among basins but not consistently among years or seasons (season × year interaction: F2,590 = 9.04, p = 0.001). This interaction was explored by analyzing within years. Abundance was lower in ML than in the IR and BR (Figure 1C). In 2014, abundance was lower in the IR and ML than the BR and did not differ between summer and fall samples (Table 3 and Figure 1C). In the ML, abundance was lower than in the IR and BR and lower in summer and winter than in fall and spring of 2015. In 2016, abundance did not differ among basins or between seasons.
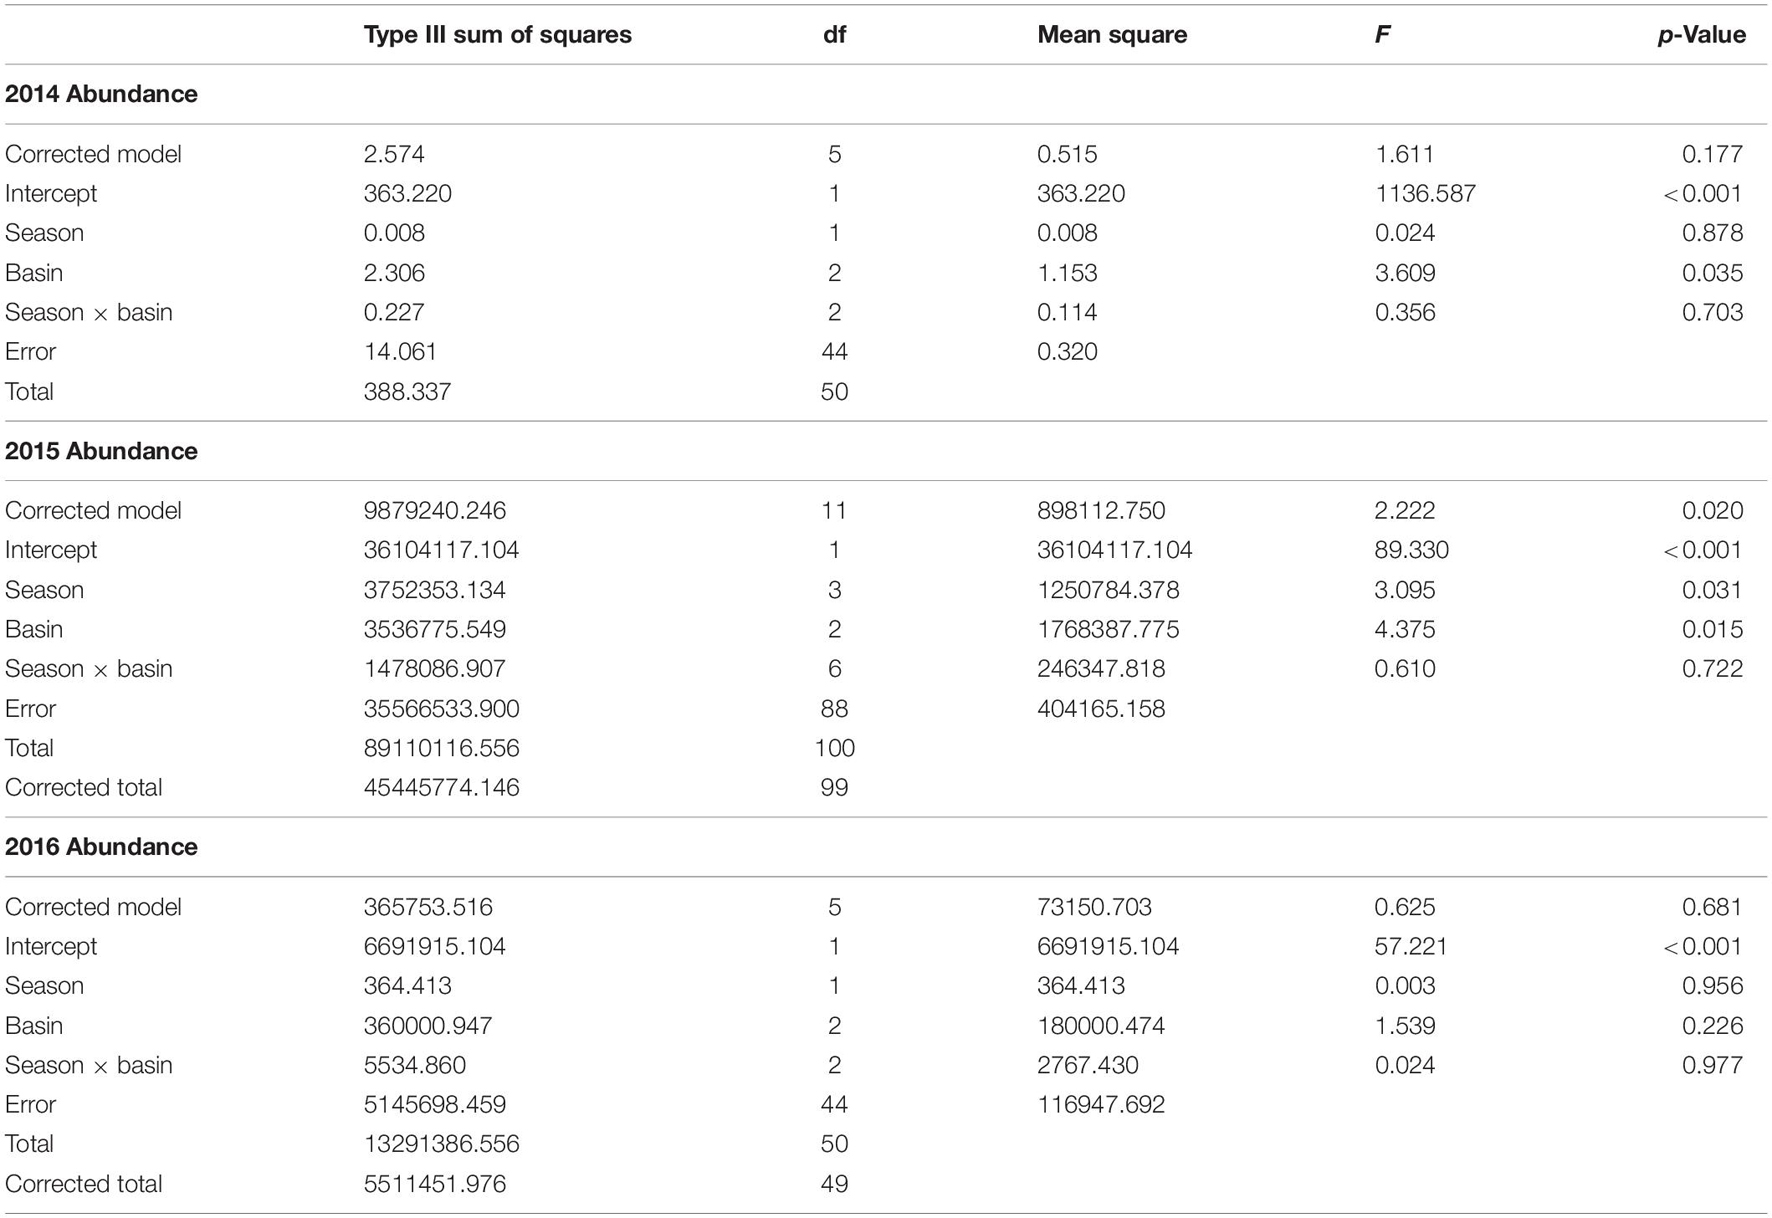
Table 3. ANOVA results for two-way ANOVA of abundance within year, with season and basin as factors.
Environmental conditions were consistent across our sites, though average salinity was slightly higher in the ML (31 ppt) than in the IR (27 ppt) and BR (28 ppt). Temperature and dissolved oxygen were different by seasons, while other measured parameters were not different. These parameters were inversely correlated, with the lowest temperatures and highest dissolved oxygen levels in the winter. There were some differences in grain size distribution among basins. There were overall higher proportions of 500 μm sediments in ML samples, 125 μm sediments in IR, and 63 μm sediments in BR.
Relationships among community assemblages were highly skewed by the inclusion of sites 16 and 27 (Supplementary Figure 3A), and therefore sites 16 and 27 were removed from further analysis (Supplementary Figure 3B). Sites 16 and 27 had the lowest species richness, with 68 and 45 species, respectively, compared to a species richness of 90 or higher at all other sites. The communities at site 16 were dominated by 8 taxa: Tharyx sp., Polydora sp., Aricidea sp., Mediomastus californiensis, Streblospio sp., Cirratulidae, Psuedopolydora sp., and Oligochaeta. Communities at site 27 were dominated by 4 taxa: Streblospio sp., Spiochaetopterus oculatus, Mulinia lateralis, and Paraprionospio pinnata. Both sites had greater than 20% of their sediments made up of particles ≤63 μm, more than any other site.
Infaunal communities were influenced by basin and season (Table 4 and Figure 2) with no significant interaction. Pairwise differences existed among all seasonal pairs (p = 0.001), with abundance highest in spring (average 613 individuals) and lowest in summer (average 244 individuals). The taxa dominating the basins by season and year are listed in Supplementary Table 5. Six taxa contributed to dissimilarity in all basins. Ostracods of the group Cylindroleberididae and the tanaid Hargeria rapax were the top drivers of dissimilarity among all three basins (Dissim. > 7%, Table 5). Polychaetes Streblospio sp. and Kinbergonuphis sp., bivalve Parastarte triquetra, and amphipod Ampelisca sp. varied in their contributions (2–7%, Table 5).
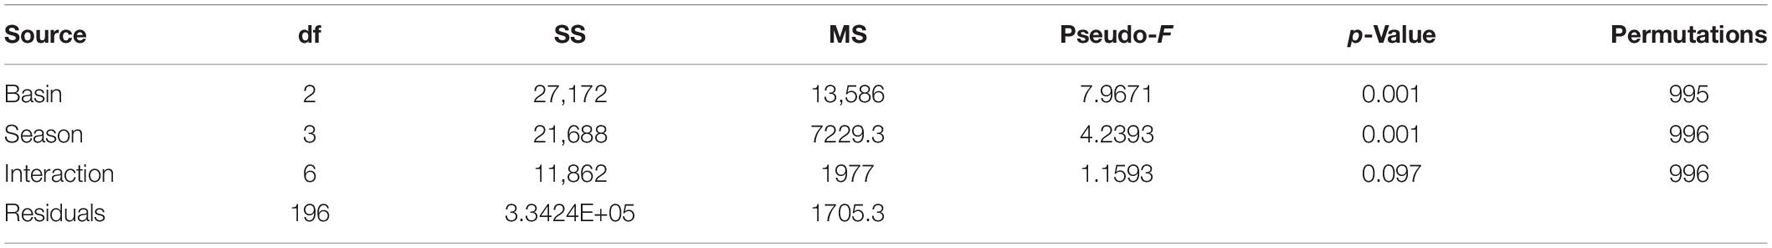
Table 4. Permutational analysis of variance table for analysis of 27 quarterly samples by basin and season.
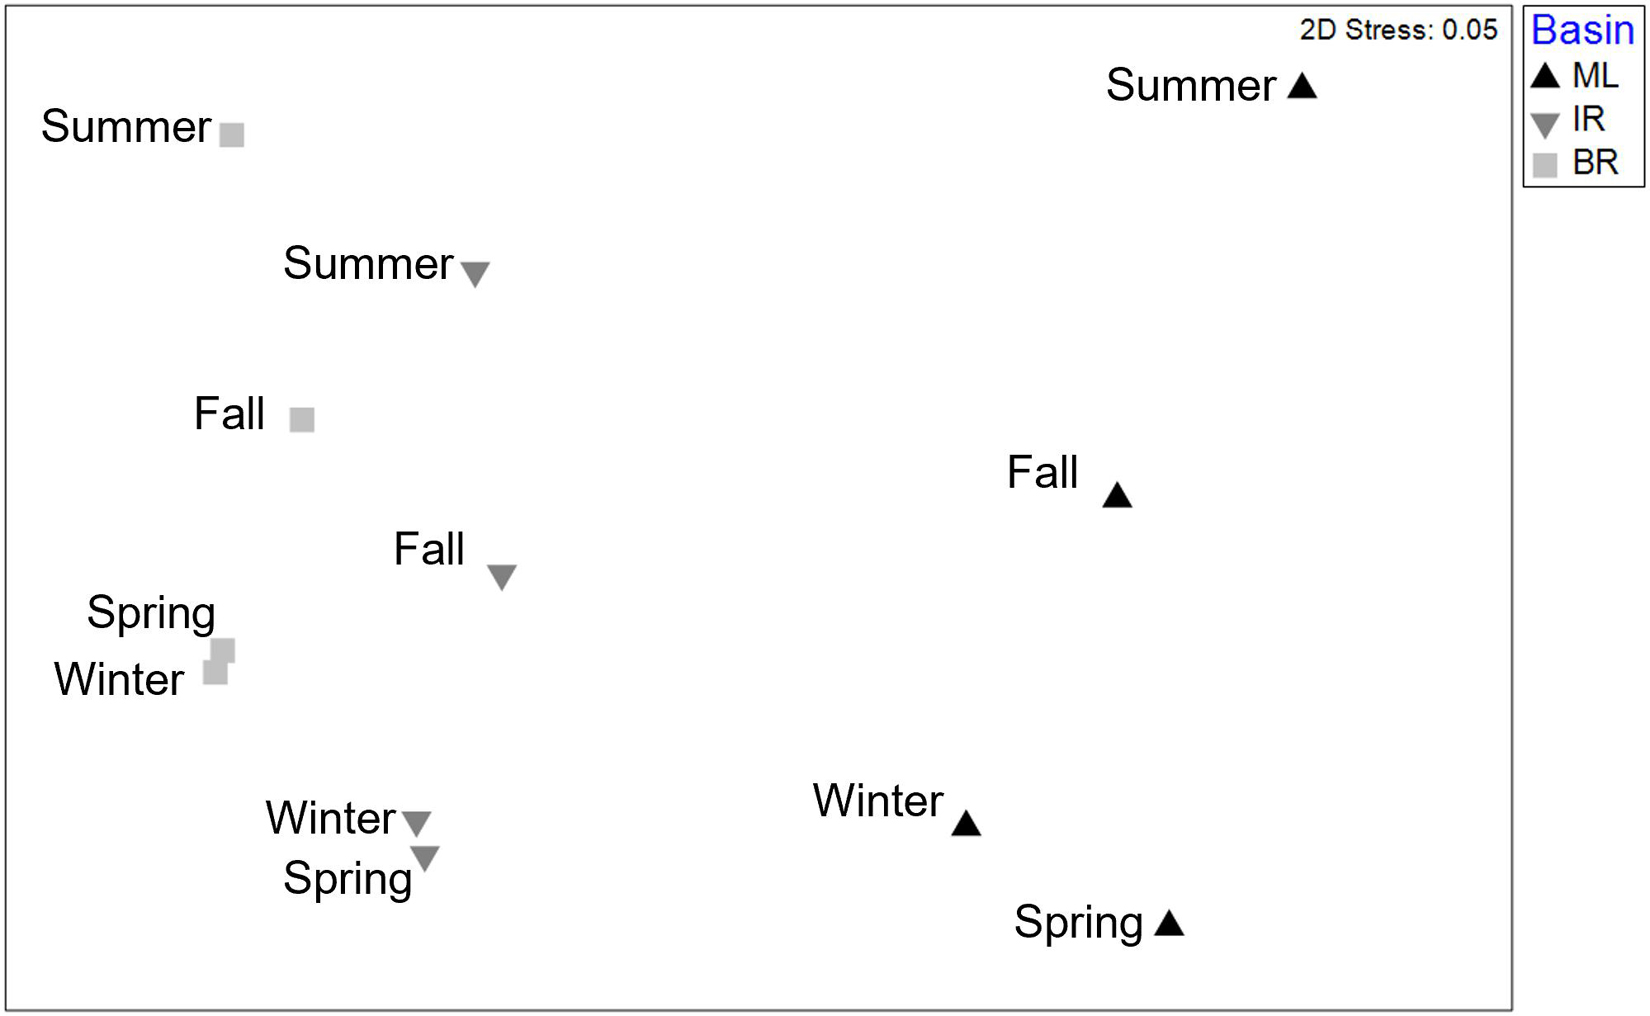
Figure 2. 2D nMDS ordination based upon Bray–Curtis similarities of fourth root transformed abundance averaged by basin and season. Demonstrates differences found among both factors by PERMANOVA.

Table 5. Summary of SIMPER analyses on basin assemblages.
Relationships between the biological data and environmental parameters measured were determined to exist (RELATE: ρ = 0.225, p = 0.001). DistLM indicated 11 variables explained significant variations in the macrobenthic assemblages (Supplementary Table 6) and explained 22.56% of the variation (R2 = 0.2256). The variables in this model were depth, bottom temperature, % 500μm, % < 63μm, %125μm, % 63μm, Secchi depth, pH, % 2mm, % 250μm, and % LOI, added to the model in that order. The low R2 value of the DistLM combined with significant RELATE indicates these parameters are shaping the communities but there are other factors at play that were not measured.
Brown Tide
Chlorophyll a varied significantly among basins but peaked December 2015 through May 2016 for all basins. Mean chlorophyll a level in the IRL ranges from 6.2 to 16.4 μg L–1 based on measurements taken monthly from 2006 to 2009 (Phlips et al., 2011). However, during this time chlorophyll a was recorded by St Johns River Water Management District sensors at 20–65 μg L–1 in the ML and IR and 30–160 μg L–1 in the BR.
There was a significant interaction between bloom condition and basin (Table 6). The interaction is not unexpected, as bloom conditions were more intense in the BR. To account for this interaction, community samples were analyzed within the bloom condition factor. Differences were found among seasons and basins within pre-bloom 2015 samples, while only basins were different within bloom (2016) samples (Figure 3). Bloom condition was a bigger influence on communities than season for ML and IR (Figure 3). However, there is a larger separation in the BR communities between winter and spring samples during the bloom. This difference from the other basins may be attributable to the intensity of bloom conditions, as chlorophyll a levels were 2.5 times greater in the BR.
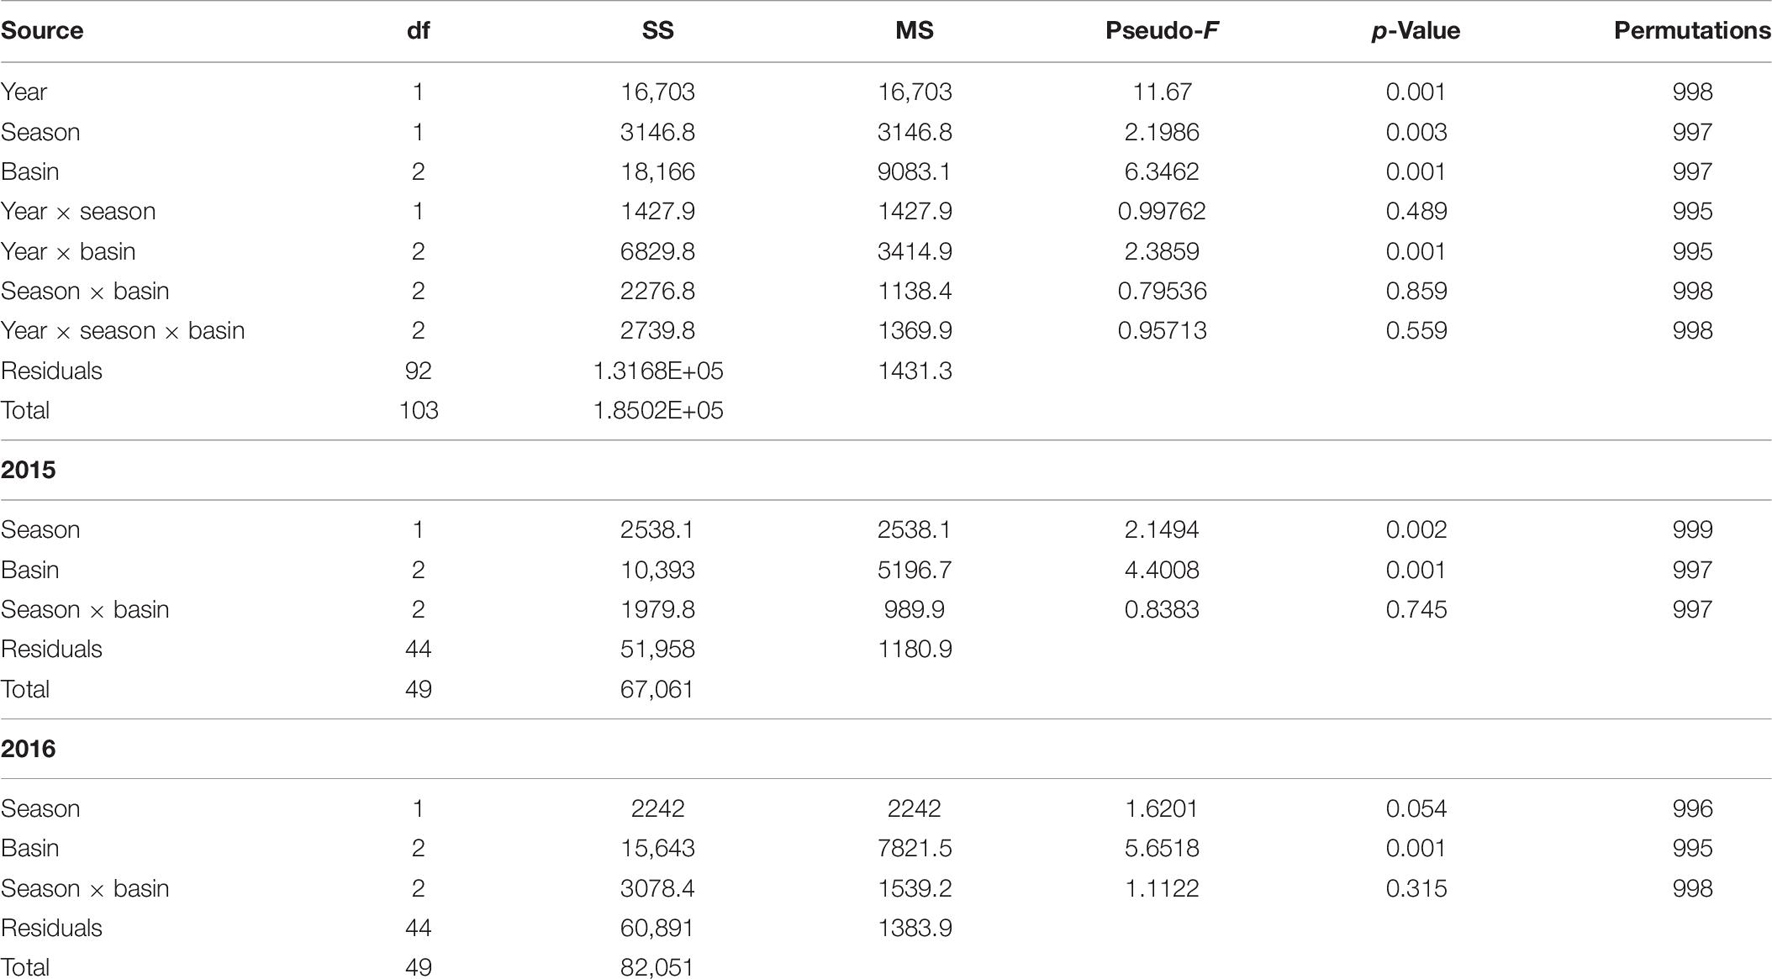
Table 6. Permutational analysis of variance results for analysis of community assemblages in pre-bloom (2015) and bloom (2016) winter and spring samples.
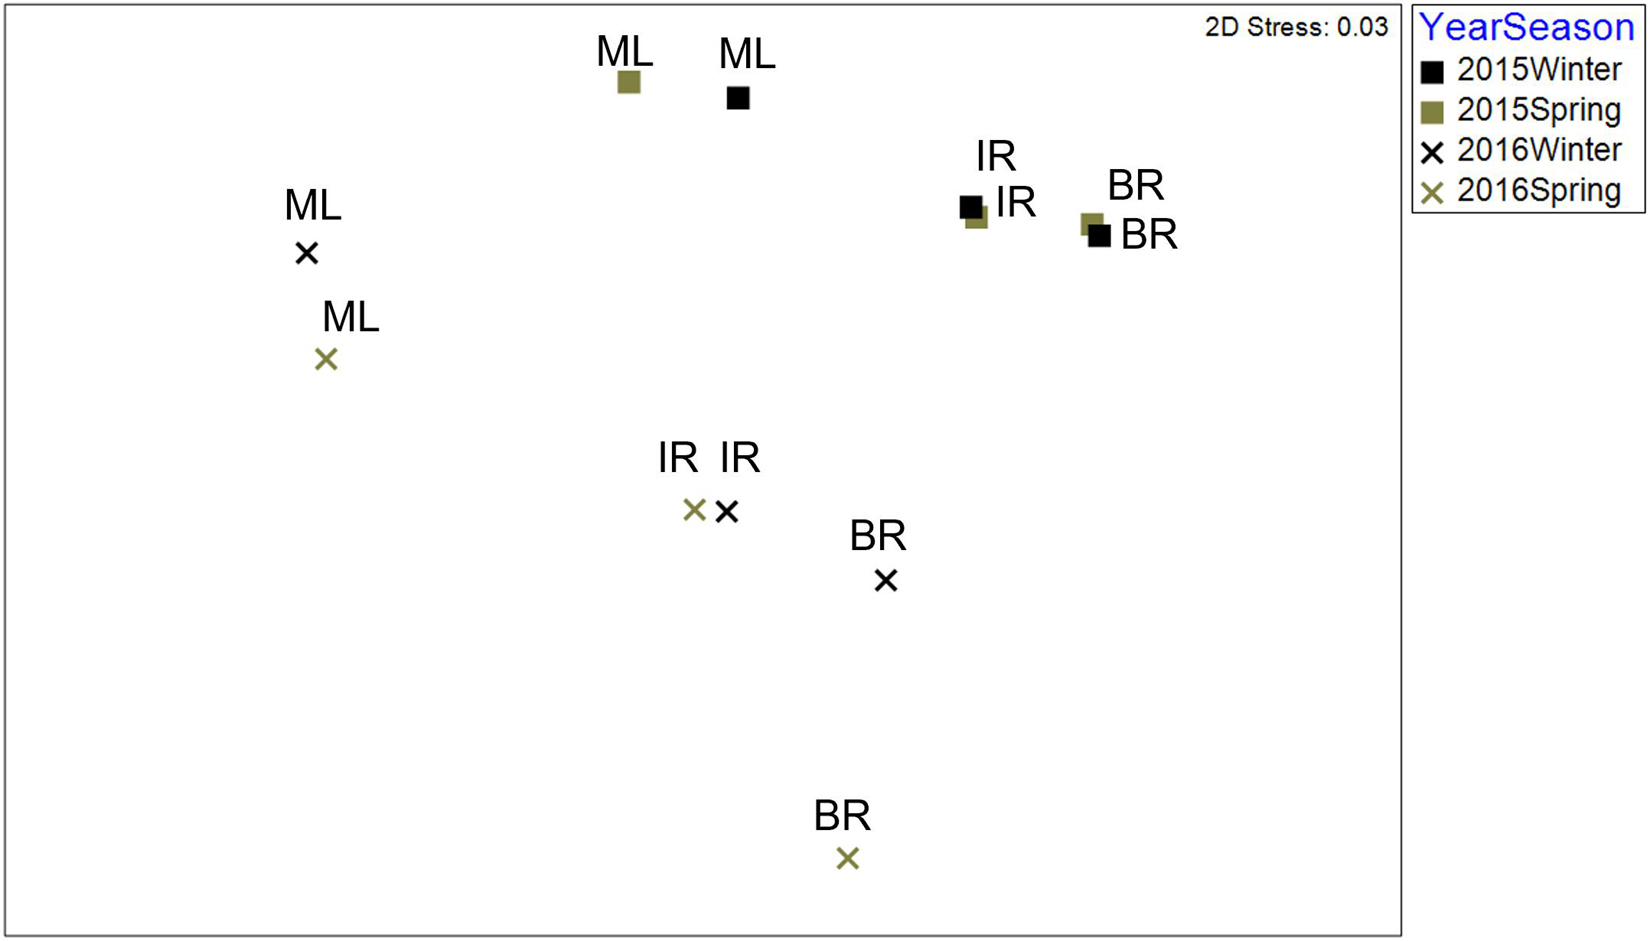
Figure 3. 2D nMDS ordination based upon Bray–Curtis similarities of fourth root transformed abundance averaged for communities by basin in pre-bloom (2015) and bloom (2016) winter and spring samples.
All taxa were pooled by feeding type based on a review of the literature (Supplementary Table 3). Deposit feeder and suspension feeder average abundance was lower in bloom conditions than pre-bloom (Supplementary Table 7 and Figure 4), but not by basin, season, or year. Suspension feeder abundance was also affected by basin, with lower abundance in ML than in the BR and IR. Carnivore abundance was lower in bloom conditions, and during the spring. Detritivore abundance was lower in bloom conditions, spring samples, and the ML. Herbivore abundance did not change in a consistent manner among basins, seasons, and years (Supplementary Table 8). Herbivores in the ML were not affected by the bloom, but their abundance was lower in the spring than in the winter. In the IR, herbivore abundance was lower during the bloom. In the BR, there was an interaction between year and season, as the abundance increased from winter to spring in 2015 but decreased in 2016. Scavenger abundance did not change consistently among basins from pre-bloom to bloom conditions (Supplementary Table 9). Scavenger abundance was lower in bloom samples for the ML and Banana but not the IR.
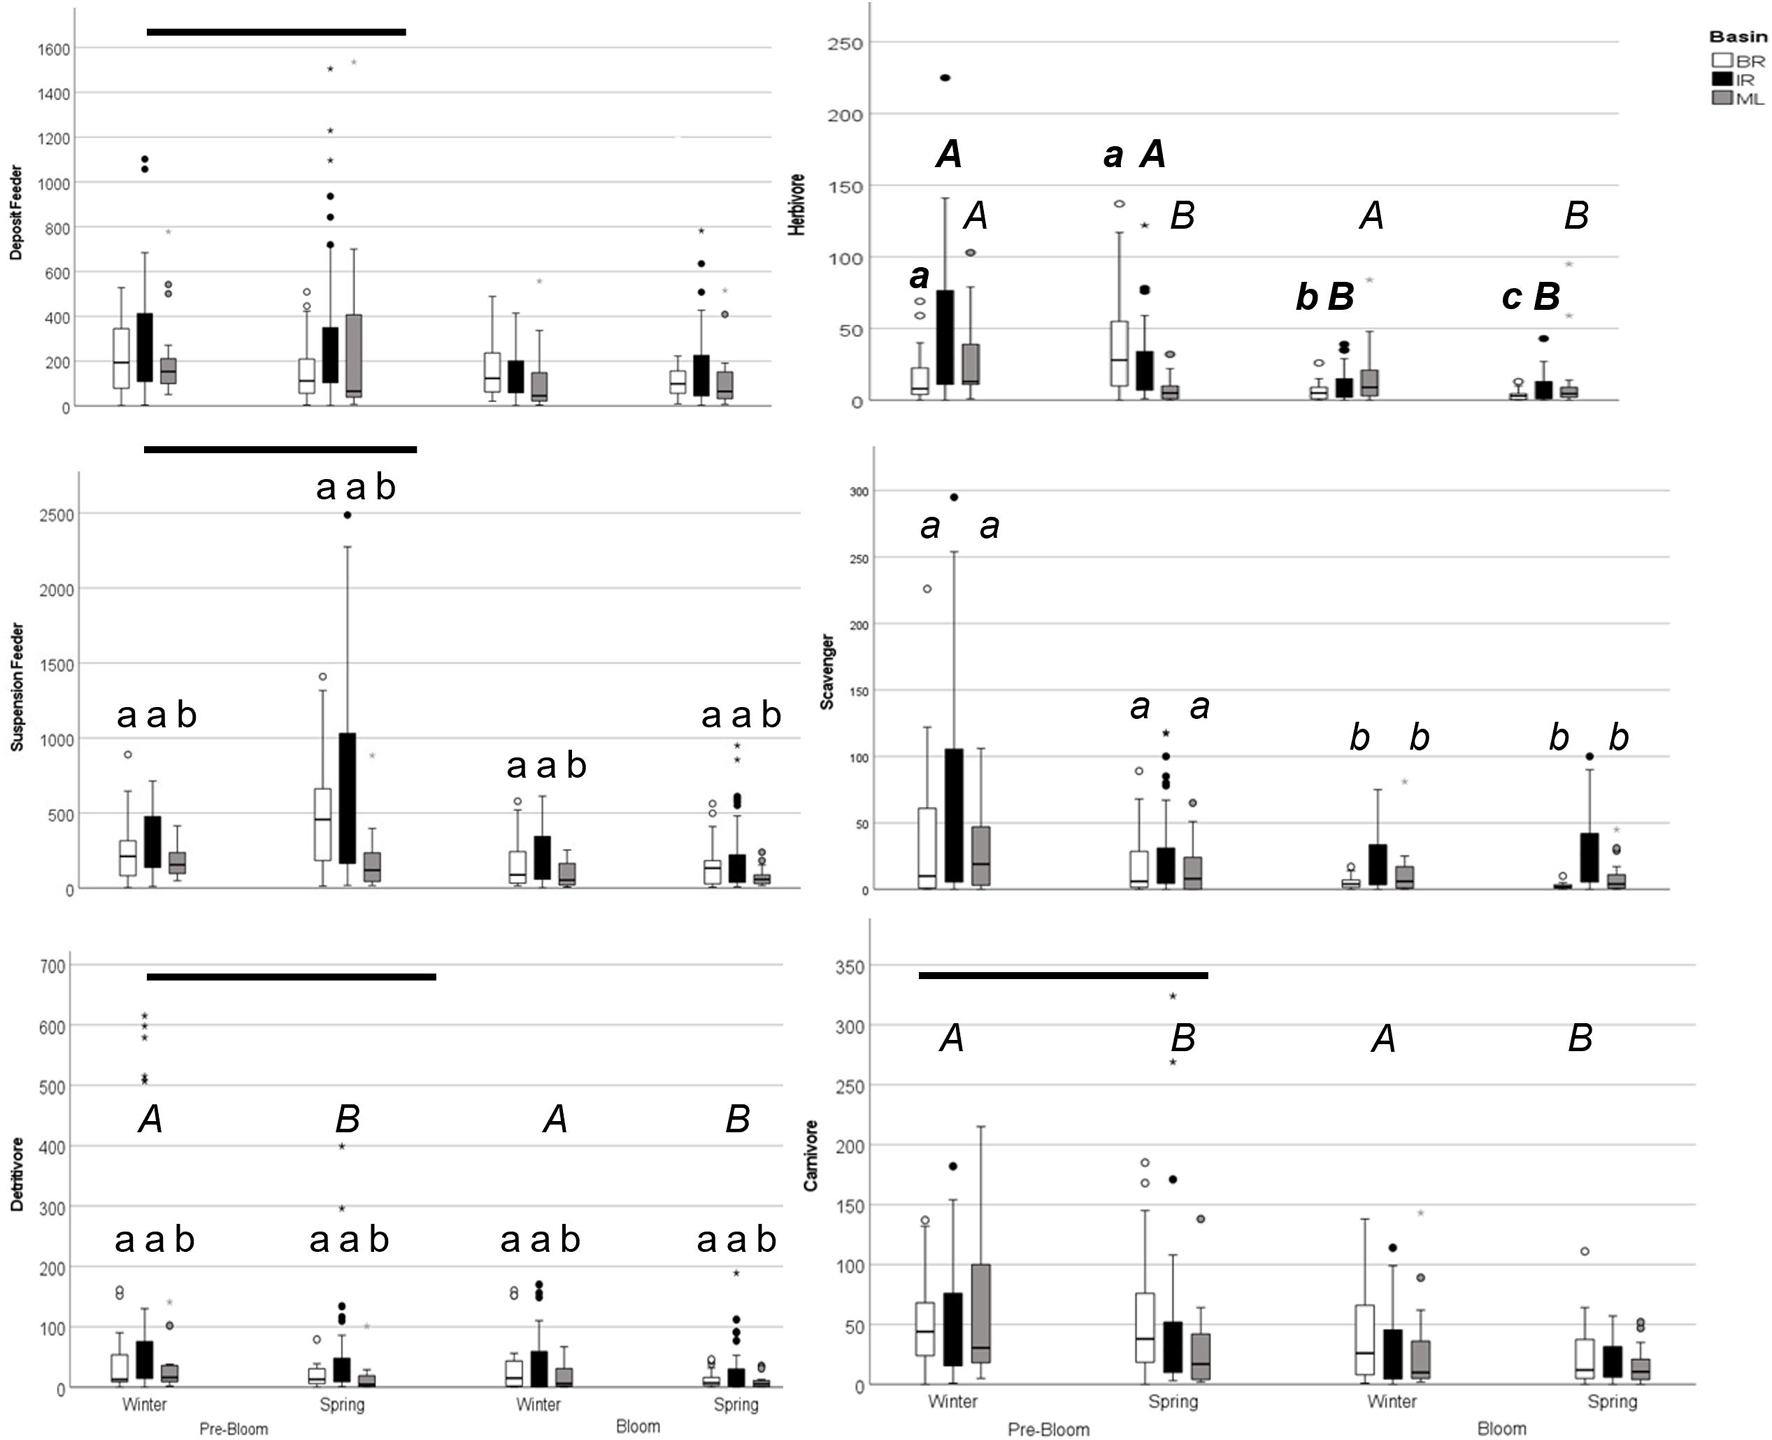
Figure 4. Graph of feeding group abundance in pre-bloom and bloom winter and spring seasons. Boxplots represent minimum, first quartile, median, third quartile, and maximum, with circles indicating outliers. Bars denote differences between years, italic capitals (A) denote differences between seasons, lowercase letters (a) denote differences among basins for three-way ANOVA results. For herbivores, data was analyzed within basin and lowercase bold italics (a) denote differences among year-seasons for Banana River samples; bold italic capitals (A) denote differences between years for Indian River Samples, and italic capitals (A) denote differences between seasons for Mosquito Lagoon samples. For Scavengers, data was analyzed within basins and lowercase italics (a) denotes differences among year-basins.
SIMPER analysis of the winter and spring samples before and during the bloom indicate 18 species driving differences in these samples. Taxa did not respond to the bloom in a consistent manner, with many of these select species altering their seasonal patterns. Feeding type was also not a consistent predictor of response to the bloom, though these species of note were predominantly suspension and deposit feeders (Supplementary Table 10). Generally, taxa abundance was lower during the bloom than pre-bloom (Supplementary Tables 11–13 and Figure 5). However, several taxa had increases in abundance during the bloom. Polychaetes (Cirratulidae) increased in abundance during the bloom for both the ML and the BR, though their pattern of abundance reversed in the ML for the seasons affected. The abundances of the amphipod Ampelisca sp. and polychaete Streblospio sp. were also higher during the bloom in the IR, though lower in the ML. The tanaidacean H. rapax was affected by bloom conditions only in the BR, where it increased in abundance. Abundances of ostracods (Cylindroleberididae) and the cumacean Oxyurostylis smithi were lower during the bloom in all three basins. The change in abundance was not consistent across seasons in the ML for either taxon, and in the IR and BR for ostracods (Cylindroleberididae). The amphipod Monocorophium sp., the bivalve M. lateralis, and the polychaetes Clymenella mucosa and Kinbergonuphis sp., all had lower abundance during the blooms for two of three basins. Abundances of Grandidierella bonneriodes and Photis sp. were not affected by bloom conditions, though they did differ among basins and between seasons.
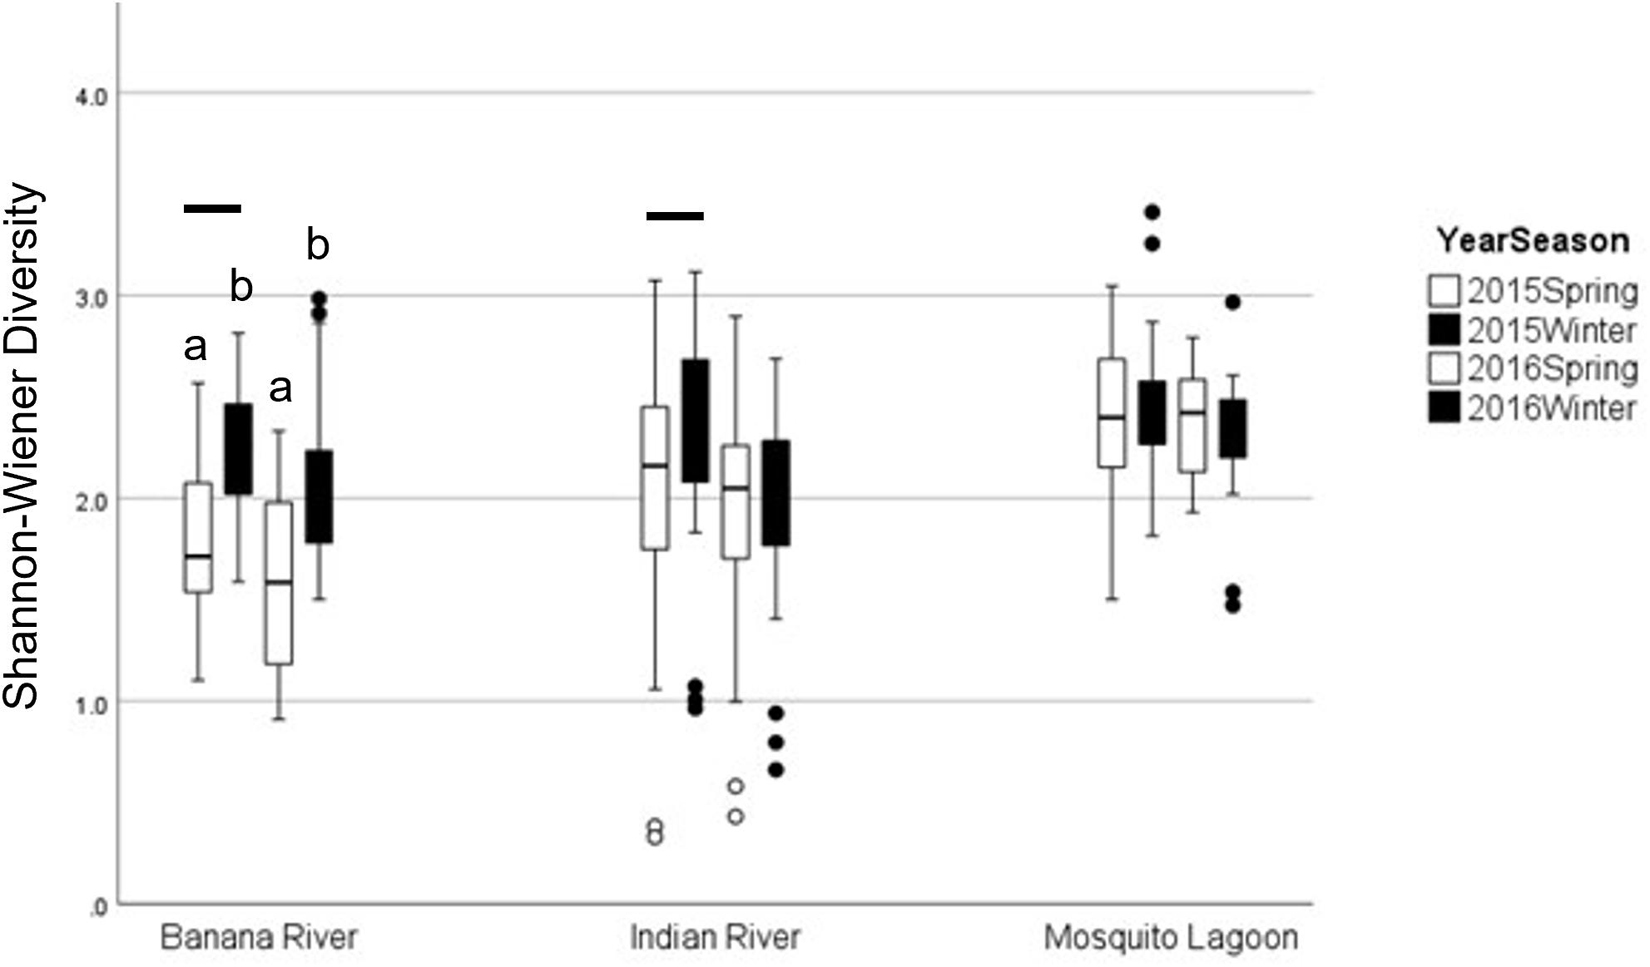
Figure 5. Graph of average diversity by basin in pre-bloom (2015) and bloom (2016) winter and spring samples. Boxplots represent minimum, first quartile, median, third quartile, and maximum, with circles denoting outliers. Lowercase letters denote significance between seasons, and bars denote significance between years. Error bars represent standard error.
Diversity pre-bloom and during the bloom did not change consistently among basins (ANOVA: season × basin Interaction: F = 5.90, p = 0.003). Diversity in the BR and IR was lower during the bloom than in pre-bloom samples (Table 7 and Figure 6). Diversity in the ML was not different from pre-bloom samples during the bloom in either season. Diversity was lower in spring samples in the BR than in winter samples, but season did not affect diversity in the other basins.
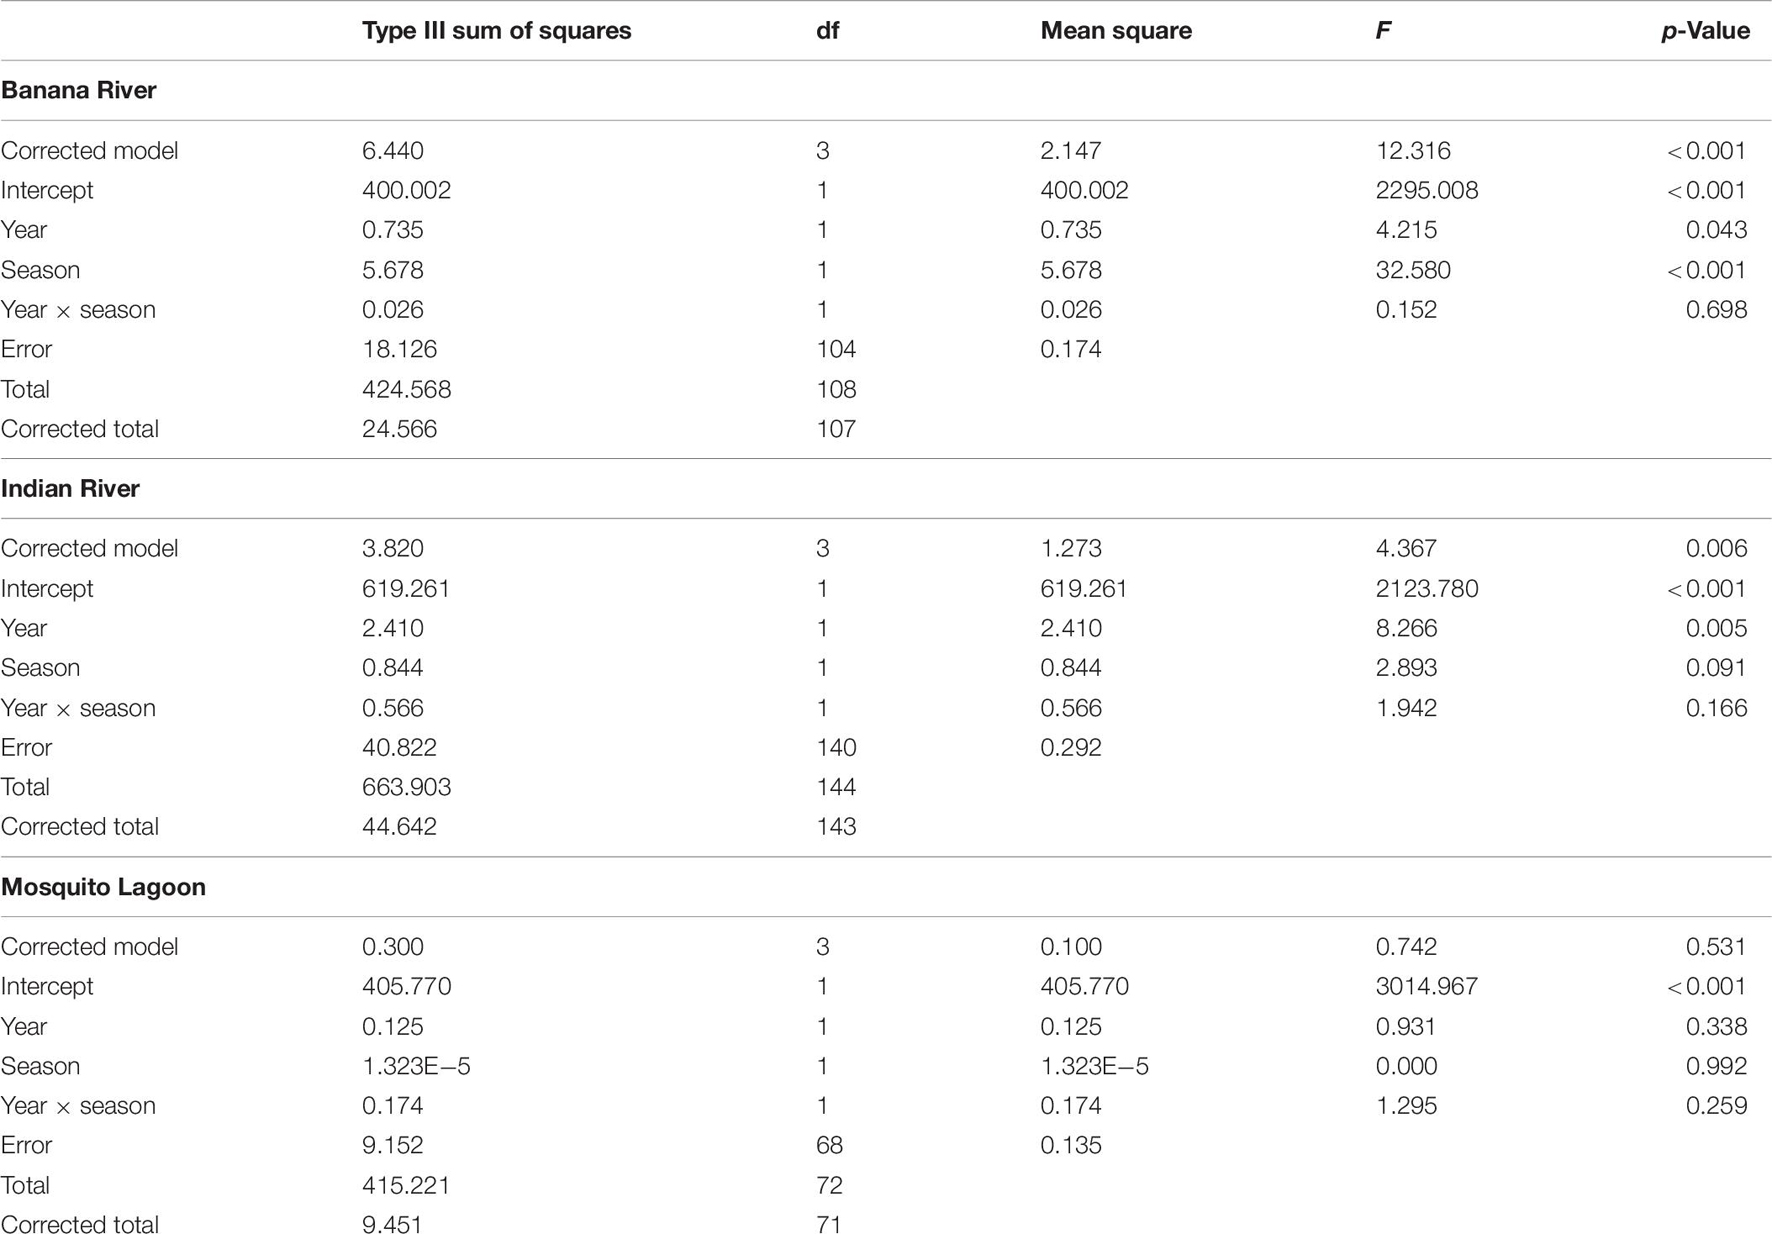
Table 7. ANOVA results table of Shannon–Wiener Diversity in pre-bloom and bloom winter and spring samples.
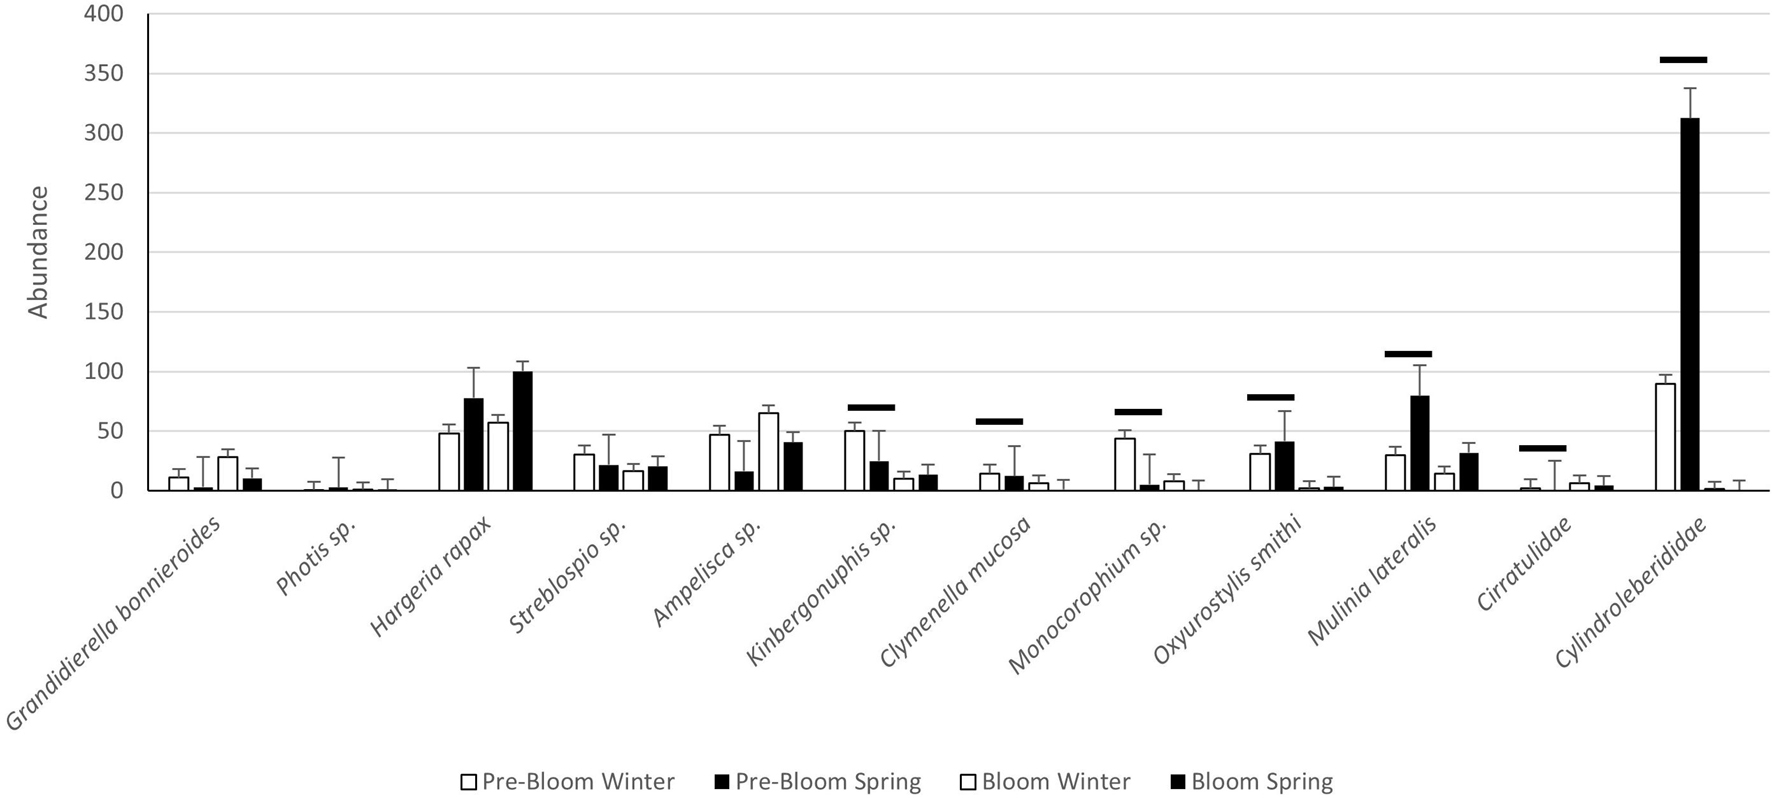
Figure 6. Graph of the mean abundance of select species in pre-bloom and bloom samples. Error bars represent standard error. Bars denote significance between pre-bloom and bloom years.
Isotopes
Sources of organic matter varied across the two sites, with mean (±SE) δ15N and δ13C values of 3.10 (±0.04) and −17.13 (±0.07) for SOM and 4.89 (±0.03) and −22.92 (±0.14) for POM at I11 and 4.05 (±0.71) and −20.06 (±0.06) for SOM and 6.39 (±0.01) and −22.93 (±0.05) for POM at I12 (Figures 7, 8).
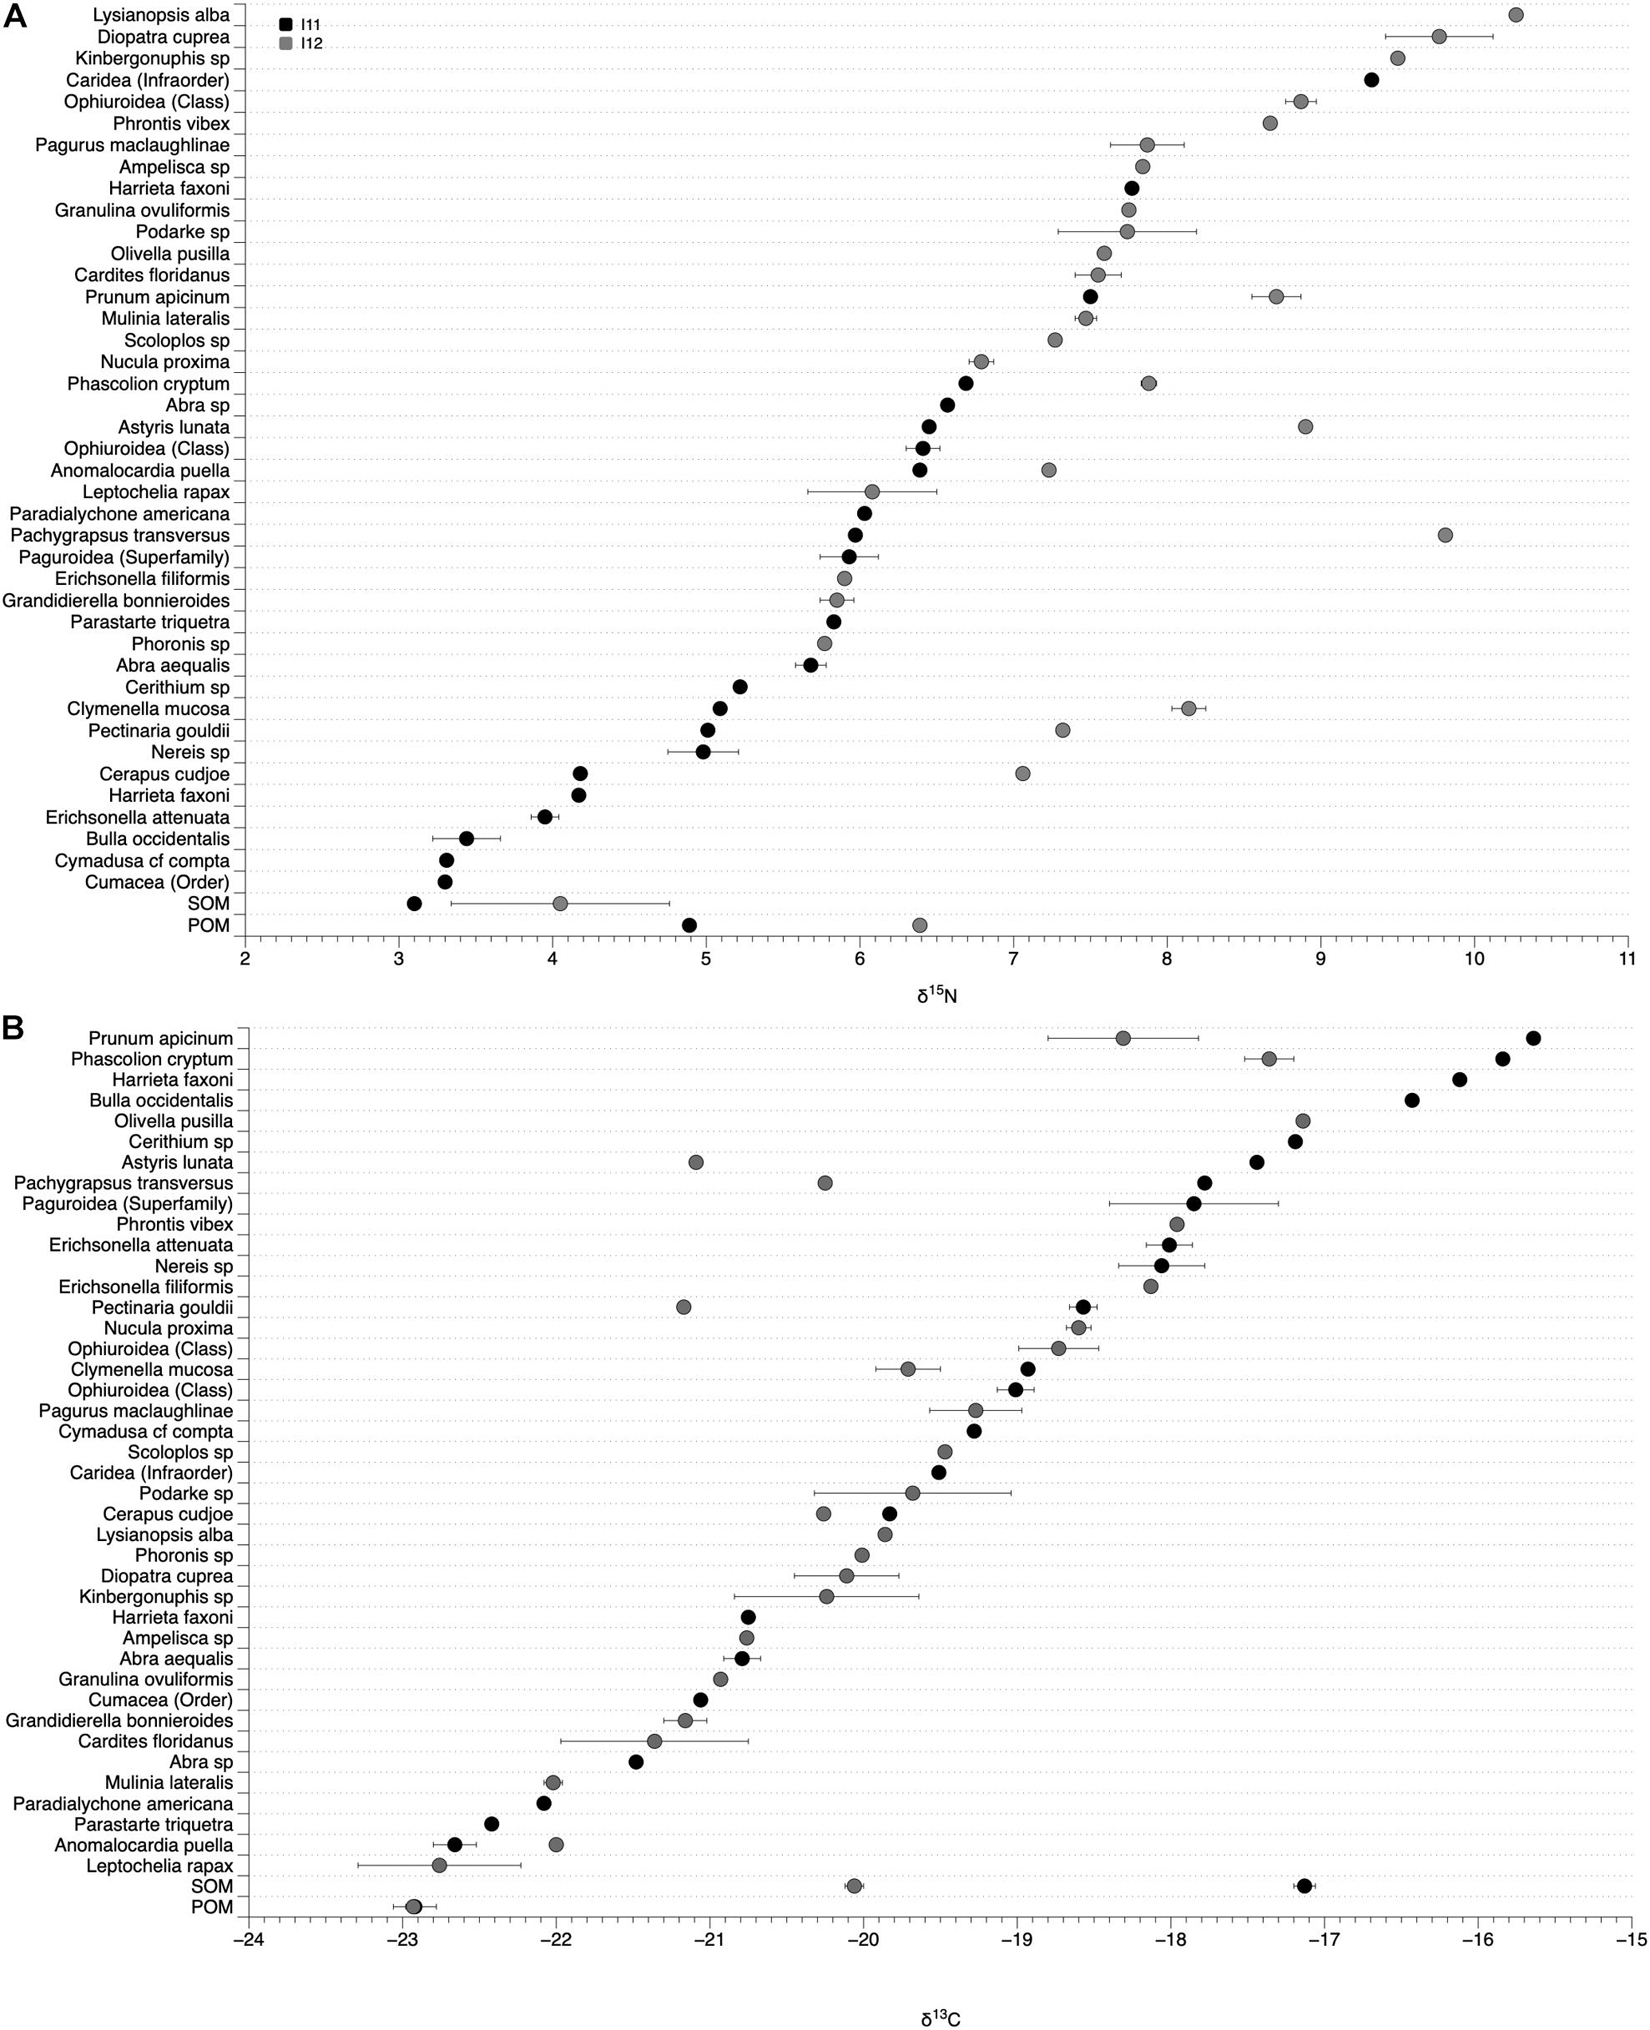
Figure 7. δ15N (A) and δ13C (B) values of sediment and particulate organic matter (SOM and POM) and infaunal tissue at site I11 (black circles) and I12 (gray circles). Organisms collected from both sites have two values in one column.
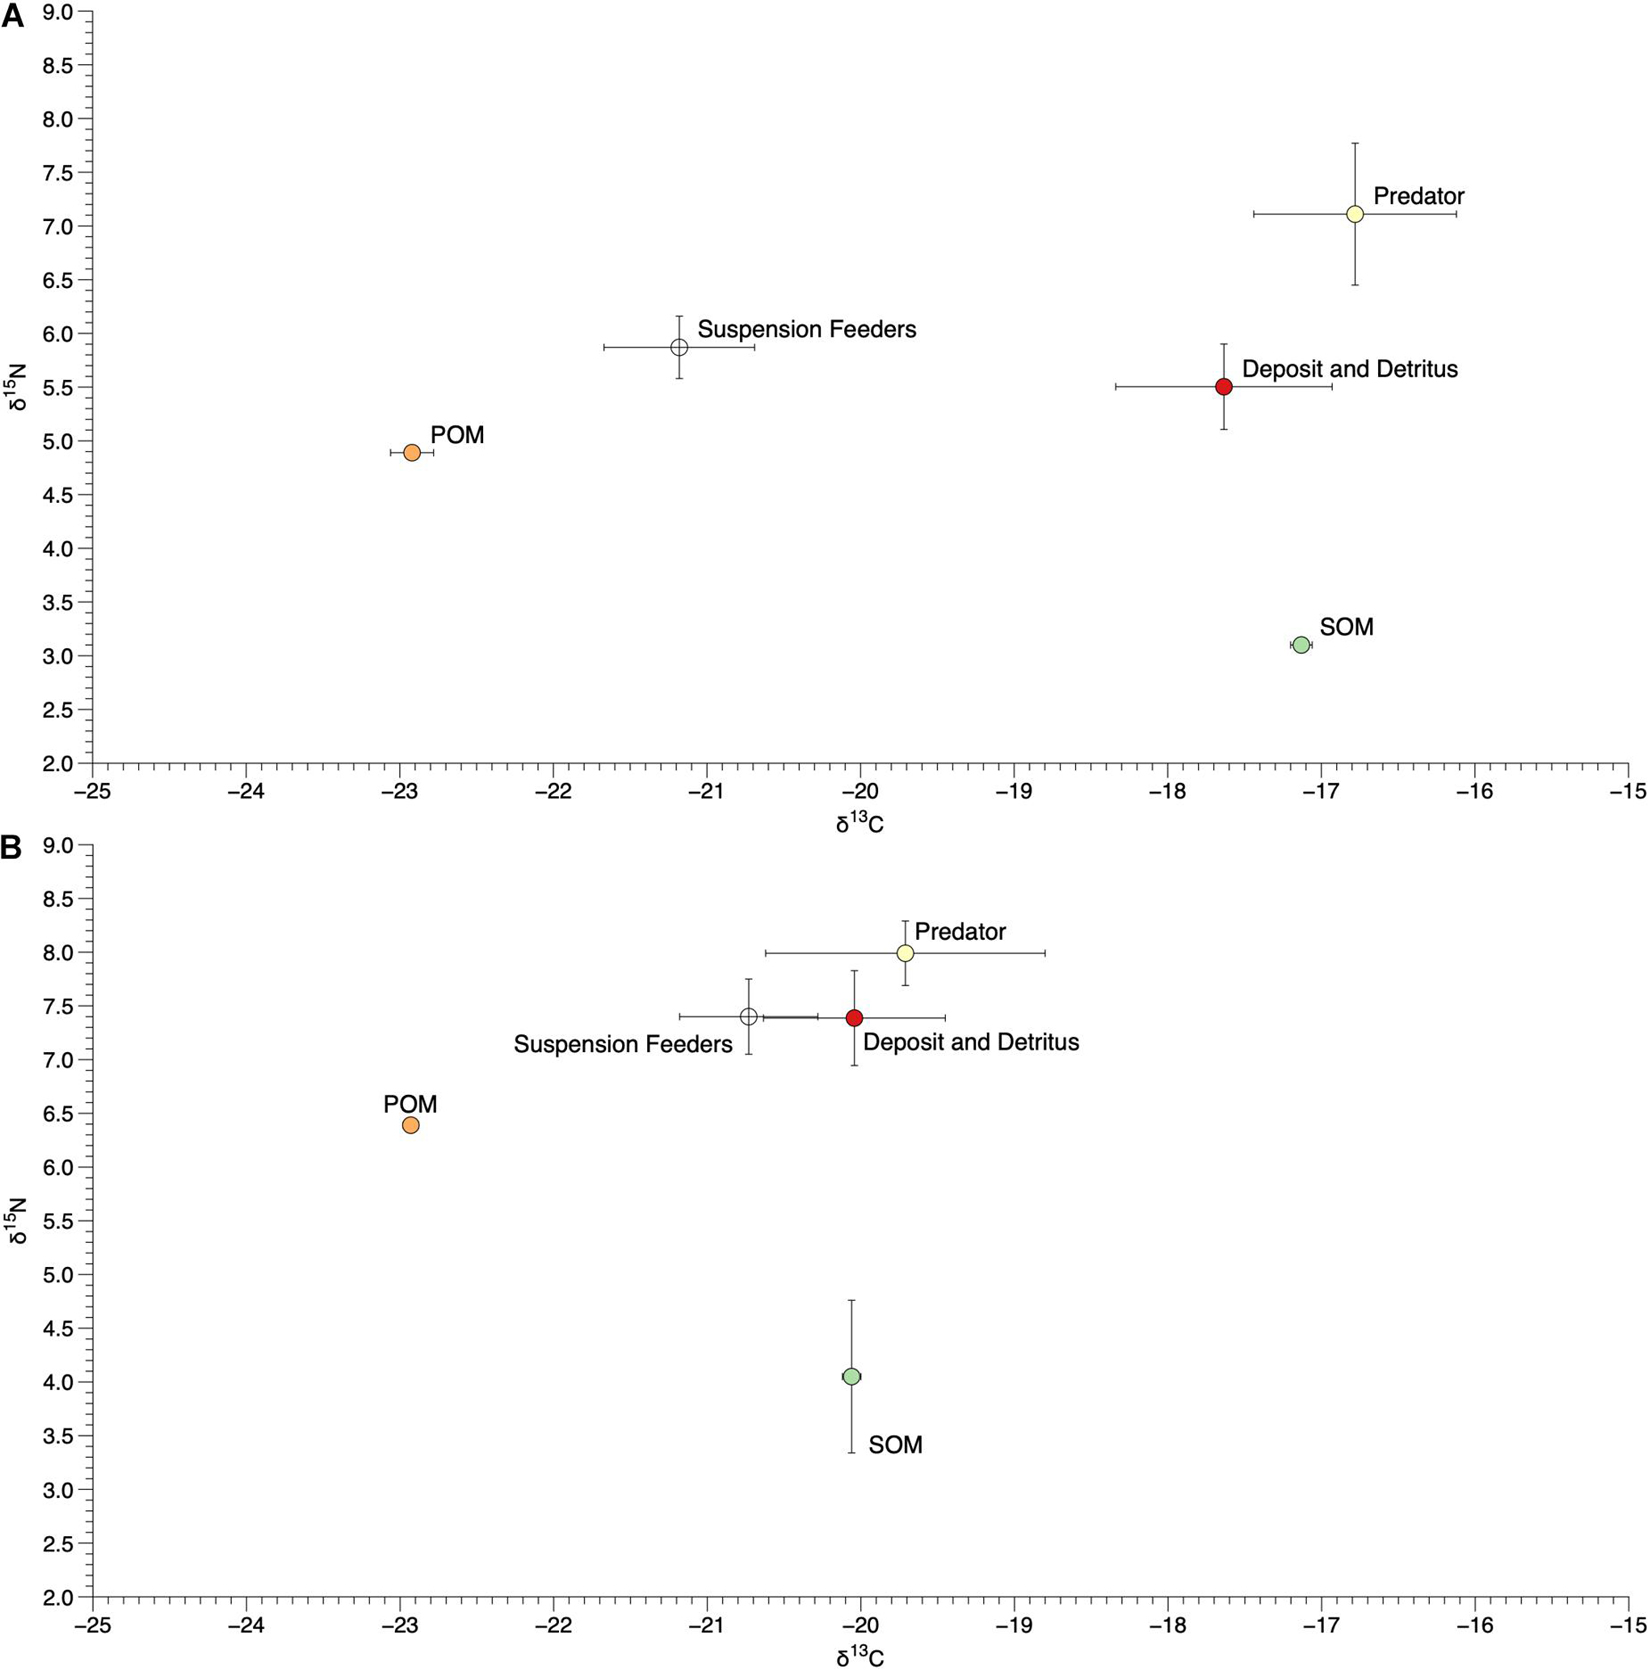
Figure 8. Mean (±SE) δ15N and δ13C values of sediment and particulate organic matter (SOM and POM) and tissue of organisms within different functional groups at site I11 (A) and I12 (B).
We collected and measured the δ15N and δ13C values of 39 infaunal species spanning diverse taxonomic (Bivalvia, Gastropoda, Amphipoda, Isopoda, Polychaeta, Tanaidacea, Phoronida, Decapoda, Sipunculida, and Echinodermata) and functional (suspension and deposit feeders, herbivores, detritivores, and predators; scavengers were not found among the species sampled for this effort, Supplementary Table 2) groups. There was a wide range of δ15N and δ13C values of infaunal organisms within each site, with δ15N values from 9.3 to 3.3‰ at I11 and 10.3 to 5.8‰ at I12 and δ13C values from −15.7 to −22.9‰ at I11 and −17.1 to −22.8‰ at I12 (Figure 7). Organisms within different functional groups (based on published data) varied in their δ15N and δ13C values, with predators on average having the highest δ15N values at both sites (7.1 and 8.0‰; Figure 8). Suspension feeders and deposit/detritus feeders were at a similar trophic level in each site based on their δ15N values (5.9 and 5.5‰ for suspension and deposit/detritus feeders at site I11 and 7.4‰ for both these groups at I12) and had δ15N values that were enriched compared to both POM and SOM (Figure 8). δ13C values of suspension feeders (−21.2 and −20.73‰ at I11 and I12, respectively) and deposit/detritus feeders (−17.6 and −20.0‰ at I11 and I12, respectively) were between the δ13C values of nutrient sources (POM and SOM) at both sites, but suspension feeder δ13C values were generally closer to POM (especially at I11) and deposit/detritus feeders closer to SOM (Figure 8). Predator δ13C values were most similar to those of SOM and deposit/detritus feeders.
Enrichment in the δ15N values of POM and SOM at site I12, the site with chronic anthropogenic inputs, were also observed in the tissues of organisms from that site. This was most evident when comparing the δ15N values of the species found at both sites. For instance, the δ15N values of the polychaete Clymenella mucosa, the amphipod Cerapus cudjoe, and the gastropod Astyris lunata at sites I11 and I12 (I11/I12) were 5.09/8.14, 4.18/7.06, and 6.45/8.90‰, respectively, and an average enrichment of 2.21‰ at I12 for the 8 species that were found at both sites (Figure 7).
Acidification of tissue samples prior to isotope analysis reduced δ13C of infaunal tissue by an average of 1.96‰ (±0.33 SE) but had minimal impact on δ15N values with a mean (±SE) reduction of 0.08 (0.03).
Discussion
Disturbance plays a key role in community structure and function (Levin and Paine, 1974; Connell, 1978; Menge and Sutherland, 1987), with anthropogenic effects as a primary driver of disturbance in coastal systems (Hillebrand and Kunze, 2020). A previous study on disturbance, which mimicked the effects of harmful algal blooms on macrobenthic communities, estimated that the assemblage would recover within 2 years, though abundance recovered much quicker, within 10 months (Kröger et al., 2006). This indicates that infaunal communities within the northern IRL could have returned to approximately a pre-bloom assemblage from the 2011 and 2012 blooms by the beginning of our surveys in spring 2014. However, species composition could have still been affected by these blooms, and therefore our survey would not account for species lost to this previous disturbance.
Within our survey data, the primary drivers of infaunal community composition were season, basin, and sediment composition. Seasonal patterns in abundance and diversity within our survey are the same as found in previous studies on infaunal communities in coastal systems in both Florida and Texas. Species abundance was lower in our summer and fall samples (June and October) and higher in our winter and spring samples (January and April) (Nelson et al., 1982; Whaley and Minello, 2002). Though diversity was lowest overall in spring. This seasonal pattern is thought to coincide with fish predator abundance patterns as infauna provide a substantial food source for many fish species, especially juveniles which often spawn in the summer (Whaley and Minello, 2002). Basin differences may be geographical differences in species assemblages because of limited connections among the basins of the lagoon. The ML and IR are connected via the Haulover Canal and there are no connections between the ML and the BR. The IR and the BR are better connected, as the BR flows into the IR at its southern end, and the Canaveral barge canal approximately mid-way. Sediment characteristics were also important drivers of community composition in the IRL. This is unsurprising as sediment grain size can determine the type of infauna present (McNulty et al., 1962; Van Hoey et al., 2004). Further, grain size is linked to the functional group that species belong to Snelgrove (1999), as sediment type will be determined in part by flow conditions (Snelgrove and Butman, 1994). Areas with low flow will have a higher proportion of fine sediments and more likely support detritivores while areas with higher flow will have coarser sediments but also more abundant food for suspension feeders. Within our data set, a larger proportion of sediments less than 63 μm in size was inversely related to species richness and abundance. This is especially apparent in sites 16 and 27, which had the largest proportion of this size sediment and the lowest abundances and species richness. Throughout the IRL, “muck,” a sediment composed of high organic content and fine sediment grains is widespread and characterized by a lack of biota (Fox and Trefry, 2018).
A recurrence of brown tide in the spring of 2016 (Phlips et al., 2019; Schaefer et al., 2019) allowed us to investigate the effects of an ongoing bloom event. While most intense in the BR (Lapointe et al., 2017; Barile, 2018), all basins of the northern IRL were affected by the 2016 bloom (Schaefer et al., 2019). The responses of the communities to the bloom were complex, and significant variability among seasons and years that occurs regularly within these communities likely contributed to the differences detected in pre-bloom and bloom samples. The greatest difference in communities before and during the bloom was the spring 2016 BR community (Figure 6). The BR experienced the most intense bloom conditions, concentrations of A. lagunensis were higher (Schaefer et al., 2019; Phlips et al., 2020), and the spring samples were taken after months of bloom conditions (Figure 5). Similar results were found by analyzing diversity before and during the bloom, though this test highlighted an inconsistency in the pattern between season and basin, and the difference between pre-bloom and bloom samples was less pronounced (Figure 7). In fact, there were no differences found among samples in the ML and IR. This pattern is likely because of lower intensity of the 2016 bloom in the ML and IR (Schaefer et al., 2019). The differences found via multivariate analysis but not in diversity highlights the usefulness of multivariate statistics in monitoring communities post disturbance as they often continue to show differences that more traditional metrics (diversity) miss (Hillebrand and Kunze, 2020).
Extended or prolonged harmful algal blooms can affect seasonal recruitment or even recolonization (Ward et al., 2000; Bricelj and Macquarrie, 2007) through the mortality of recent recruits and the adult invertebrate populations but also sub-lethally on larvae (Summerson and Peterson, 1990; Ward et al., 2000). Overall, abundance was lower during the bloom across feeding types. While basin and season remained important factors in determining abundance, this is likely attributable to normal temporal variation, and differences in assemblages among basins. While we anticipated that suspension feeders would be most affected that did not seem to be the case. Several suspension feeding taxa increased in abundance during the bloom, including Streblospio sp., Ampelisca sp., and cirratulids. Harmful algal blooms may repress feeding, though because of increased particle density this may not result in a reduction of food intake (Galimany et al., 2017a). However, it is difficult to tease apart typical temporal and spatial variation from changes attributable to the bloom because of the short nature of our survey program.
The δ15N and δ13C values of POM and SOM provide a coarse assessment of the isotope values of two broad resource pools available to infaunal organisms at these sites. Although these two pools can be further resolved (i.e., different classes of phytoplankton and bacteria for POM and detritus, filamentous algae, epiphytes, and diatoms for SOM; Badylak and Phlips, 2004; Galván et al., 2008), their differences in this study certainly suggest that they are comprised of distinct resources for infauna (Deegan and Garritt, 1997; Michener and Kaufman, 2007; Campbell and Fourqurean, 2009).
The observed variation in isotope values of infaunal organisms within each site indicates high trophic diversity, with feeding across approximately two trophic levels based on trophic enrichment values of δ15N between 3.0 and 2.6‰; (Dubois et al., 2007) and a substantial range of δ13C values. This was also apparent after grouping species into functional categories. Predators had δ15N values that were most enriched and suggestive of being at the top of this infaunal food web, while suspension and deposit/detritus feeders fed at similar trophic levels (both enriched compared to SOM and to a lesser extent POM) but, as expected, varied their δ13C values (Figure 8). This implies that some organisms within these communities are consuming suspended organic matter, while others are feeding on detritus or organic matter that has settled on the benthos, or even on other infaunal organisms. These infaunal communities therefore represent complex food webs with different allochthonous and autochthonous sources of nutrients being assimilated and ultimately passed on to other infaunal or pelagic predators (Abreu et al., 2006; Galván et al., 2008). In addition, elevated δ15N values of POM, SOM, individual species, and functional groups at site I12 suggest the presence of anthropogenic nutrient inputs from nearby human development and highlight the potential use of infaunal organisms (in addition to epifauna) as sentinel species for nutrient pollution in the IRL (Freeman et al., 2018).
The IRL is considered an imperiled waterway as increased human population has amplified nutrient inputs that have led to an increased frequency of harmful algal blooms (Lapointe et al., 2018; Schaefer et al., 2019; Phlips et al., 2020). These blooms result in large loss of species, including macrobenthic species. This defaunation is not confined to a specific group of species but can be species specific. While our results indicated some species increased in abundance during a bloom, most decreased, with the largest losses in the location with the most intense bloom. As the diversity and composition of infaunal communities are increasingly impacted by both acute and chronic disturbances, we may see a shift in the ecosystem services that these communities provide, but more work is needed to make these links between structure and function, especially for the species presented here. The life history of many of these species is understudied and understanding the effects of these disturbances is difficult without knowledge of their feeding habits, motility, or reproduction. However, high diversity, as we see in our surveys, may also support ecosystem stability by providing functional redundancy (Pennekamp et al., 2018; Hillebrand and Kunze, 2020).
Data Availability Statement
The original contributions presented in the study are included in the article/Supplementary Material, further inquiries can be directed to the corresponding author. Data is available through Figshare at https://doi.org/10.25573/data.16847746.
Author Contributions
JL took the lead in writing the manuscript. JL, KB, EG, and MS collected and processed infaunal samples, and contributed to analyses and presentation of infaunal data. MS and KB identified infauna taxa. CF and DJ collected and processed isotope samples, analyzed, and presented isotope data. DJ identified isotope infauna and epifauna. VP planned the study, provided project oversight, and participated in data interpretation. All authors contributed to the final manuscript.
Funding
Funding for this work was provided through the St. Johns River Water Management District Algal Blooms Investigation project to the Smithsonian Marine Station (Contract No. 27799) and the Florida Fish and Wildlife Conservation Commission (FWC Agreement No. 13051). The funding for the publication of this manuscript was provided through an EPA Region 4 supplemental funding grant to the IRLNEP. This was Smithsonian Marine Station contribution #1166.
Conflict of Interest
The authors declare that the research was conducted in the absence of any commercial or financial relationships that could be construed as a potential conflict of interest.
Publisher’s Note
All claims expressed in this article are solely those of the authors and do not necessarily represent those of their affiliated organizations, or those of the publisher, the editors and the reviewers. Any product that may be evaluated in this article, or claim that may be made by its manufacturer, is not guaranteed or endorsed by the publisher.
Acknowledgments
We thank SMS staff, especially Sherry Reed and William Lee, Griffin Bell and Richard Paperno, numerous volunteers, and interns for their invaluable help in logistical support, sample collection, and processing. We acknowledge and thank the IRL Council, host of the Indian River Lagoon National Estuary Program (IRLNEP), and the United States EPA for providing encouragement and funding to support publication of this manuscript.
Supplementary Material
The Supplementary Material for this article can be found online at: https://www.frontiersin.org/articles/10.3389/fmars.2021.719049/full#supplementary-material
References
Abreu, P. C., Costa, C. S. B., Bemvenuti, C., Odebrecht, C., Graneli, W., and Anesio, A. M. (2006). Eutrophication processes and trophic interactions in a shallow estuary: preliminary results based on stable isotope analysis (δ13C and δ15N). Estuaries Coasts 29, 277–285. doi: 10.1007/BF02781996
Badylak, S., and Phlips, E. J. (2004). Spatial and temporal patterns of phytoplankton composition in subtropical coastal lagoon, the Indian River Lagoon, Florida, USA. J. Plankton Res. 26, 1229–1247. doi: 10.1093/plankt/fbh114
Barile, P. J. (2018). Widespread sewage pollution of the Indian River Lagoon system, Florida (USA) resolved by spatial analyses of macroalgal biogeochemistry. Mar. Pollut. Bull. 128, 557–574. doi: 10.1016/j.marpolbul.2018.01.046
Bricelj, V. M., and Macquarrie, S. P. (2007). Effects of brown tide (Aureococcus anophagefferens) on hard clam Mercenaria mercenaria larvae and implications for benthic recruitment. Mar. Ecol. Prog. Ser. 331, 147–159. doi: 10.3354/meps331147
Bricker, S. B., Longstaff, B., Dennison, W., Jones, A., Boicourt, K., Wicks, C., et al. (2008). Effects of nutrient enrichment in the nation’s estuaries: a decade of change. Harmful Algae 8, 21–32. doi: 10.1016/j.hal.2008.08.028
Campbell, J. E., and Fourqurean, J. W. (2009). Interspecific variation in the elemental and stable isotope content of seagrasses in South Florida. Mar. Ecol. Prog. Ser. 387, 109–123. doi: 10.3354/meps08093
Chapin, F. S., Zavaleta, E. S., Eviner, V. T., Naylor, R. L., Vitousek, P. M., Reynolds, H. L., et al. (2000). Consequences of changing biodiversity. Nature 405, 234–242. doi: 10.1038/35012241
Clarke, K. R., and Gorley, R. N. (2015). PRIMER v7: User Manual/Tutorial. Plymouth: PRIMER-E Ltd, 296.
Clarke, K. R., and Warwick, R. M. (2014). Change in Marine Communities: An Approach to Statistical Analysis and Interpretation, 3rd Edn. Plymouth: Primer-E Ltd, 256.
Connell, J. H. (1978). Diversity in tropical rain forests and coral reefs. Science 199, 1302–1310. doi: 10.1086/284967
Cox, A., Hope, D., Zamora-Duran, M. A., and Johnson, K. B. (2018). Environmental factors influencing benthic polychaete distributions in a subtropical lagoon. Mar. Technol. Soc. J. 52, 58–74. doi: 10.4031/MTSJ.52.4.1
Currie, D. R., and Small, K. J. (2005). Macrobenthic community responses to long-term environmental change in an east Australian sub-tropical estuary. Estuar. Coast. Shelf Sci. 63, 315–331. doi: 10.1016/j.ecss.2004.11.023
Dauvin, J. C. (2007). Paradox of estuarine quality: benthic indicators and indices, consensus or debate for the future. Mar. Pollut. Bull. 55, 271–281. doi: 10.1016/j.marpolbul.2006.08.017
Deegan, L. A., and Garritt, R. H. (1997). Evidence for spatial variability in estuarine food webs. Mar. Ecol. Prog. Ser. 147, 31–47. doi: 10.3354/meps147031
Devereux, R., Lehrter, J. C., Cicchetti, G., Beddick, D. L. Jr., Yates, D. F., Jarvis, B. M., et al. (2019). Spatially variable bioturbation and physical mixing drive the sedimentary biogeochemical seascape in the Louisiana continental shelf hypoxic zone. Biogeochemistry 143, 151–169. doi: 10.1007/s10533-019-00539-8
DeYoe, H. R., Stockwell, D. A., Bidigare, R. R., Latasa, M., Johnson, P. W., Hargraves, P. E., et al. (1997). Description and characterization of the algal species Aureoumbra lagunensis gen. et sp. nov. and referral of Aureoumbra and Aureococcus to the Pelagophyceae. J. Phycol. 33, 1042–1048. doi: 10.1111/j.0022-3646.1997.01042.x
Dubois, S., Jean-Louis, B., Bertrand, B., and Lefebvre, S. (2007). Isotope trophic-step fractionation of suspension-feeding species: implications for food partitioning in coastal ecosystems. J. Exp. Mar. Biol. Ecol. 351, 121–128. doi: 10.1016/j.jembe.2007.06.020
Dybas, C. L. (2002). Florida’s Indian River Lagoon: an estuary in transition. BioScience 52, 554–559. doi: 10.1641/0006-3568(2002)052[0555:FSIRLA]2.0.CO;2
Elliott, J. M. (1977). Some methods for the statistical analysis of samples of benthic invertebrates. Sci. Publ. Freshw. Biol. Assoc. 25:159.
Fauchald, K., and Jumars, P. A. (1979). The diet of worms: a study of polychaete feeding guilds. Oceanogr. Mar. Biol. Ann. Rev. 17, 193–284.
Fox, A. L., and Trefry, J. H. (2018). Environmental dredging to remove fine-grained, organic-rich sediments and reduce inputs of nitrogen and phosphorus to a subtropical estuary. Mar. Technol. Soc. J. 52, 42–57. doi: 10.4031/MTSJ.52.4.3
Freeman, C. J., Janiak, D. S., Mossop, M., Osman, R., and Paul, V. J. (2018). Spatial and temporal shifts in the diet of the barnacle Amphibalanus eburneus within a subtropical estuary. PeerJ 6:e5485. doi: 10.7717/peerj.5485
Galimany, E., Lunt, J., Freeman, C. J., Houk, J., Sauvage, T., Santos, L., et al. (2020). Bivalve feeding responses to microalgal bloom species in the Indian River Lagoon: the potential for top-down control. Estuaries Coast 43, 1519–1532. doi: 10.1007/s12237-020-00746-9
Galimany, E., Lunt, J., Freeman, C. J., Reed, S., Segura-Garcia, I., and Paul, V. J. (2017a). Feeding behavior of eastern oysters Crassostrea virginica and hard clams Mercenaria mercenaria in shallow estuaries. Mar. Ecol. Prog. Ser. 567, 125–137. doi: 10.3354/meps12050
Galimany, E., Wikfors, G. H., Dixon, M. H., Newell, C. R., Meseck, S. L., Henning, D., et al. (2017b). Cultivation of the ribbed mussel (Geukensia demissa) for nutrient bioextraction in an urban estuary. Environ. Sci. Technol. 51, 13311–13318. doi: 10.1021/acs.est.7b02838
Galván, K., Fleeger, J. W., and Fry, B. (2008). Stable isotope addition reveals dietary importance of phytoplankton and microphytobenthos to saltmarsh infauna. Mar. Ecol. Prog. Ser. 359, 37–49. doi: 10.3354/meps07321
Gobler, C. J., Koch, F., Kang, Y., Berry, D. L., Tang, Y. Z., Lasi, M., et al. (2013). Expansion of harmful brown tides caused by the pelagophyte, Aureoumbra lagunensis DeYoe et Stockwell, to the U.S. east coast. Harmful Algae 27, 29–41. doi: 10.1016/j.hal.2013.04.004
Gore, R. H., Gallaher, E. E., Scotto, L. E., and Wilson, K. A. (1981). Studies on decapod Crustacea from the Indian River region of Florida. XI. Community composition, structure, biomass and species areal relationships of seagrass and drift algae-associated macrocrustaceans. Estuar. Coast. Shelf Sci. 12, 485–508. doi: 10.1016/S0302-3524(81)80007-2
Hillebrand, H., and Kunze, C. (2020). Meta-analysis on pulse disturbances reveals differences in functional and compositional recovery across ecosystems. Ecol. Lett. 23, 575–585. doi: 10.1111/ele.13457
Hooper, D. U., Chapin, F. S., Ewel, J. J., Hector, A., Inchausti, P., Lavorel, S., et al. (2005). Effects of biodiversity on ecosystem functioning: a consensus of current knowledge. Ecol. Monogr. 75, 3–35. doi: 10.1890/04-0922
Ieno, E. N., Solan, M., Batty, P., and Pierce, G. J. (2006). How biodiversity affects ecosystem functioning: roles of infaunal species richness, identity and density in the marine benthos. Mar. Ecol. Prog. Ser. 311, 263–271. doi: 10.3354/meps311263
Kamerosky, A., Cho, H. J., and Morris, L. (2015). Monitoring of the 2011 super algal bloom in Indian River Lagoon, FL, USA, using MERIS. Remote Sens. 7, 1441–1460. doi: 10.3390/rs70201441
Kleppel, G. S. (1996). The state of Florida’s estuaries and future needs in estuarine research in Paper Presented at The Florida State SeaGrant College Program, Technical Paper 85, (Gainesville, FL: University of Florida), 43–51.
Kröger, K., Gardner, J. P. A., Rowden, A. A., and Wear, R. G. (2006). Recovery of a subtidal soft-sediment macroinvertebrate assemblage following experimentally induced effects of a harmful algae bloom. Mar. Ecol. Prog. Ser. 326, 85–98. doi: 10.3354/meps326085
Labrune, C., Grémare, A., Amouroux, J. M., Sardá, R., Gil, J., and Taboada, S. (2008). Structure and diversity of shallow soft−bottom benthic macrofauna in the Gulf of Lions (NW Mediterranean). Helgol. Mar. Res. 62, 201–214. doi: 10.1007/s10152-008-0108-9
Lapointe, B. E., Burkholder, J. M., and Van Alstyne, K. L. (2018). “Harmful macroalgal blooms in a changing world: causes, impacts, and management,” in Harmful Algal Blooms: A Compendium Desk Reference, eds S. E. Shumway, J. M. Burkholder, and S. L. Morton (New York, NY: Wiley), 515–560. doi: 10.1002/9781118994672.ch15
Lapointe, B. E., Herren, L. W., Brewton, R. A., and Alderman, P. K. (2020). Nutrient over-enrichment and light limitation of seagrass communities in the Indian River Lagoon, an urbanized subtropical estuary. Sci. Total Environ. 699:134068. doi: 10.1016/j.scitotenv.2019.134068
Lapointe, B. E., Herren, L. W., Debortoli, D. D., and Vogel, M. A. (2015). Evidence of sewage-driven eutrophication and harmful algal blooms in Florida’s Indian River Lagoon. Harmful Algae 43, 82–102. doi: 10.1016/j.hal.2015.01.004
Lapointe, B. E., Herren, L. W., and Paule, A. L. (2017). Septic systems contribute to nutrient pollution and harmful algal blooms in the St. Lucie Estuary, Southeast Florida, U.S.A. Harmful Algae 70, 1–22. doi: 10.1016/j.hal.2017.09.005
Levin, S. A., and Paine, R. T. (1974). Disturbance, patch formation, and community structure. Proc. Natl. Acad. Sci. U.S.A. 71, 2744–2747. doi: 10.1073/pnas.71.7.2744
McNulty, J. K., Work, R. C., and Moore, H. B. (1962). Some relationships between the infauna of the level bottom and the sediment in south Florida. Bull. Mar. Sci. 12, 322–332.
Menge, B. A., and Sutherland, J. P. (1987). Community regulation: variation in disturbance, competition, and predation in relation to environmental stress and recruitment. Am. Nat. 130, 730–757. doi: 10.1086/284741
Michener, R. H., and Kaufman, L. (2007). “Stable isotope ratios as tracers in marine aquatic food webs: an update,” in Stable Isotopes in Ecology and Environmental Science, 2nd Edn, eds R. Michener and K. Lajtha (Oxford: Blackwell), 238–282. doi: 10.1002/9780470691854.ch9
Mikkelsen, P. M., Mikkelsen, P. S., and Karlen, D. J. (1995). Molluscan biodiversity in the Indian River Lagoon, Florida. Bull. Mar. Sci. 57, 94–127.
Nelson, W. G. (1995). Amphipod crustaceans of the Indian River Lagoon: current status and threats to biodiversity. Bull. Mar. Sci. 57, 143–152.
Nelson, W. G., Cairns, K. D., and Virnstein, R. W. (1982). Seasonality and spatial patterns of the seagrass-associated amphipods of the Indian River Lagoon, Florida. Bull. Mar. Sci. 32, 121–129.
Pennekamp, F., Pontarp, M., Tabi, A., Altermatt, F., Alther, R., Choffat, Y., et al. (2018). Biodiversity increases and decreases ecosystem stability. Nature 563, 109–112. doi: 10.1038/s41586-018-0627-8
Phlips, E. J., Badylak, S., Christman, M., Wolny, J., Brame, J., Garland, J., et al. (2011). Scales of temporal and spatial variability in the distribution of harmful algae species in the Indian River Lagoon, Florida, U.S.A. Harmful Algae 10, 277–290. doi: 10.1016/j.hal.2010.11.001
Phlips, E. J., Badylak, S., Lasi, M. A., Chamberlain, R., Green, W. C., Hall, L. M., et al. (2015). From red tides to green and brown tides: bloom dynamics in a restricted subtropical lagoon under shifting climatic conditions. Estuaries Coasts 38, 886–904. doi: 10.1007/s12237-014-9874-6
Phlips, E. J., Badylak, S., and Nelson, N. (2019). Harmful algal blooms in the Indian River Lagoon, north. Annual report to the Indian River Lagoon National Estuarine Program, contract 2018-03. Sebastian, FL: Indian River Lagoon National Estuarine Program.
Phlips, E. J., Badylak, S., Nelson, N. G., and Havens, K. E. (2020). Hurricanes, El Niño and harmful algal blooms in two sub-tropical Florida estuaries: direct and indirect impacts. Sci. Rep. 10:1910.
Pinckney, J. L., Paerl, H. W., Tester, P., and Richardson, T. L. (2001). The role of nutrient loading and eutrophication in estuarine ecology. Environ. Health Perspect. 109, 699–706. doi: 10.1289/ehp.01109s5699
Riisgard, H. U. (1991). Suspension feeding in the polychaete Nereis diversicolor. Mar. Ecol. Prog. Ser. 70, 29–37. doi: 10.3354/meps070029
Schaefer, A. M., Hanisak, M. D., McFarland, M., and Sullivan, J. M. (2019). Integrated observing systems: an approach to studying harmful algal blooms in south Florida. J. Oper. Oceanogr. 12, 187–198. doi: 10.1080/1755876X.2019.1606879
Smith, N. P. (1993). Tidal and nontidal flushing of Florida’s Indian River Lagoon. Estuaries 16, 739–746. doi: 10.2307/1352432
Snelgrove, P. V. R. (1997). The importance of marine sediment biodiversity in ecosystem processes. Ambio 26, 578–583.
Snelgrove, P. V. R. (1999). Getting to the bottom of marine biodiversity: sedimentary habitats. BioScience 49, 129–138. doi: 10.2307/1313538
Snelgrove, P. V. R., and Butman, C. A. (1994). Animal-sediment relationships revisited: cause versus effect. Oceanogr. Mar. Biol. Ann. Rev. 32, 111–177.
Summerson, H. C., and Peterson, C. H. (1990). Recruitment failure of the bay scallop, Argopecten irradians concentricus, during the first Red Tide, Ptychodiscus brevis, outbreak recorded in North Carolina. Estuaries 13, 322–331. doi: 10.2307/1351923
Triest, L., Stiers, I., and Van Onsem, S. (2016). Biomanipulation as a nature-based solution to reduce cyanobacterial blooms. Aquat. Ecol. 50, 461–483. doi: 10.1007/s10452-015-9548-x
Van Hoey, G., Degraer, S., and Vincx, M. (2004). Macrobenthic community structure of soft-bottom sediments at the Belgian continental shelf. Estuar. Coast. Shelf Sci. 59, 599–613. doi: 10.1016/j.ecss.2003.11.005
Virnstein, R. W., Nelson, W. G., Lewis, F. G. III, and Howard, R. K. (1984). Latitudinal patterns in seagrass epifauna: do patterns exist, and can they be explained? Estuaries 7, 310–330. doi: 10.2307/1351616
Ward, L. A., Montagna, P. A., Kalke, R. D., and Buskey, E. J. (2000). Sublethal effects of Texas brown tide on Streblospio benedicti (Polychaeta) larvae. J. Exp. Mar. Biol. Ecol. 248, 121–129. doi: 10.1016/S0022-0981(00)00157-X
Whaley, S. D., and Minello, T. J. (2002). The distribution of benthic infauna of a Texas salt marsh in relation to the marsh edge. Wetlands 22, 753–766. doi: 10.1672/0277-5212(2002)022[0753:TDOBIO]2.0.CO;2
Keywords: macrobenthos, isotopes, community structure, brown tide, diversity
Citation: Lunt J, Freeman CJ, Janiak DS, Bayliss K, Stephens M, Galimany E and Paul VJ (2021) Soft-Sediment Communities of the Northern Indian River Lagoon, FL, United States. Front. Mar. Sci. 8:719049. doi: 10.3389/fmars.2021.719049
Received: 01 June 2021; Accepted: 13 October 2021;
Published: 04 November 2021.
Edited by:
Bernardo Antonio Perez Da Gama, Fluminense Federal University, BrazilReviewed by:
Ilana Rosental Zalmon, State University of the North Fluminense Darcy Ribeiro, BrazilDavid James Gillett, Southern California Coastal Water Research Project, United States
Copyright © 2021 Lunt, Freeman, Janiak, Bayliss, Stephens, Galimany and Paul. This is an open-access article distributed under the terms of the Creative Commons Attribution License (CC BY). The use, distribution or reproduction in other forums is permitted, provided the original author(s) and the copyright owner(s) are credited and that the original publication in this journal is cited, in accordance with accepted academic practice. No use, distribution or reproduction is permitted which does not comply with these terms.
*Correspondence: Jessica Lunt, amx1bnRAZGlzbC5vcmc=
†Present address: Jessica Lunt, Dauphin Island Sea Lab, Dauphin Island, AL, United States; Christopher J. Freeman, Department of Biology, College of Charleston, Charleston, SC, United States; Katrina Bayliss, Florida Department of Agriculture and Consumer Services, Division of Aquaculture, Tallahassee, FL, United States; Eve Galimany, Institute of Marine Sciences ICM-CSIC, Barcelona, Spain