 Jigui Yuan1,2†
 Hungdu Lin
 Xuan Zhuang
 Shaoxiong Ding
- 1State Key Laboratory of Marine Environmental Science, College of Ocean and Earth Sciences, Xiamen University, Xiamen, China
- 2Function Laboratory for Marine Fisheries Science and Food Production Processes, Qingdao National Laboratory for Marine Science and Technology, Qingdao, China
- 3The Affiliated School of National Tainan First Senior High School, Tainan, Taiwan
- 4Department of Biological Sciences, University of Arkansas, Fayetteville, AR, United States
- 5Fisheries College, Ocean University of China, Qingdao, China
The large yellow croaker, Larimichthys crocea, was once the most abundant and economically important marine fish in China. Thus far, it has also been the most successful mariculture fish species in China. However, its wild stock severely declined in the 1970s because of overexploitation, and therefore hatchery release has been carried out for stock enhancement since 2000. As a migratory fish, large yellow croaker was divided into three geographical stocks according to ambiguous morphological and biological characteristics in early documents. To investigate the identity of wild large yellow croaker populations and assess the influence of hatchery supplementation on wild populations, a total of 2,785 cultured individuals and 591 wild individuals were collected from 91 hatcheries and six wild populations along the coast of mainland China and analyzed using two mitochondrial genes [cytochrome oxidase I (COI) and cytochrome b (Cyt b)] and one nuclear gene (RyR3). The higher haplotype diversity and moderate nucleotide diversity of wild large yellow croaker indicated that overexploitation, which caused a sharp decrease in biomass, did not lead to a loss of genetic diversity. According to phylogenetic construction and network analysis, the absence of a significant population structure pattern revealed a single panmictic population of wild large yellow croaker with exception of a population collected from the Sansha Bay, which showed high genetic relatedness to the cultured population, suggesting significant genetic effects resulting from stock enhancement. Overall, our study suggests no genetic differentiation in the entire wild population of large yellow croaker, which means that we have great flexibility in mixing and matching farmed and wild populations. However, since the result showed that domestication, the relaxation of purifying selection, increased genetic loads, and maladapted farmed fish will be at a selective disadvantage when cultured juveniles are released in the wild, the effectiveness of stock enhancement and the negative impact of hatchery-wild fish hybridization on the wild population must be carefully evaluated in future.
Introduction
China has a very long history of fishing, and marine catches have been the main source of protein for coastal residents for a long while, maintaining their livelihoods. With economic development, fish have been more favored as an excellent protein source, and fishery catches have steadily increased. As one of the most important traditional fisheries species in East China Sea. Large yellow croaker (Larimichthys crocea), which has bright golden coloration and a delicious taste, is known as the “national fish” of China. To meet people’s consumption demands for large yellow croaker, in addition to the fishing method invented 400 years ago in which fish are caught after being stunned by percussion that causes the otoliths of croakers to resonate, fishermen intercept fish on the way to spawning or overwintering clusters to further improve fishing efficiency (Liu and Mitcheson, 2008). In 1974, 2,000 pairs of fishing boats fished the central fishing ground of large yellow croaker in Zhejiang Province, and the output reached a record of 168,100 tons (Chinese Fishery Statistical Yearbook, 1956–2019). Overfishing directly prevented the recovery of large yellow croaker populations (Supplementary Figure 1; Chinese Fishery Statistical Yearbook, 1956–2019). Large yellow croaker is currently listed as Critically Endangered (CR) by the IUCN (IUCN 2016 ver. 3.1) (Liu M. et al., 2020). Large yellow croaker feeds on small fish and crustaceans and is fed upon by large fish (Liu, 2013). As an important part of the food chain, changes in its resources will directly affect the structure of fish communities. To reduce the fishing pressure on large yellow croaker, its artificial propagation was first successfully conducted in 1987 and was then rapidly industrialized (Liu and Mitcheson, 2008; Liu, 2013). Currently, large yellow croaker is one of the most productive marine aquaculture species in China (Liu, 2013), with an annual yield of approximately 200,000 tons (Chinese Fishery Statistical Yearbook, 1956–2019). Although large yellow croaker is the most successful mariculture fish species, its cultured population originates from only two populations from different sources. One of these populations consists of offspring of individuals captured from the 1987 broodstock that migrated to Sansha Bay (in northern Fujian Province) for breeding (Liu and Mitcheson, 2008; Liu, 2013); the annual output of this population has now reached 3 billion fry (Chinese Fishery Statistical Yearbook, 1956–2019) (most hatcheries of this population are located in northern Fujian Province, especially in Ningde City, and it is referred to as the Fujian cultured population, FJC, in this study) (Supplementary Figure 2). The other population originated from a spawning ground near Zhoushan Island in Zhejiang Province in 2000 (Liu and Mitcheson, 2008; Liu, 2013) and shows annual production of 50 million fry (Chinese Fishery Statistical Yearbook, 1956–2019) (referred to as the Zhejiang cultured population, ZJC, in this study) (Supplementary Figure 2).
As a migratory fish, large yellow croaker is mainly distributed in coastal waters from the Qiongzhou Strait to the South Yellow Sea and southwestern South Korea (Liu and Mitcheson, 2008). Since population identification is of great significance for the conservation of large yellow croaker as for every endangered species, large yellow croaker was divided into three geographical stocks by Tian et al. (1962) and Xu et al. (1962) in the 1960s according to morphological (e.g., body depth-to-length ratio and the numbers of vertebrae and gill rakers) and biological characteristics (e.g., spawning season, age of sexual maturity, and average age). These stocks include the Daiquyang stock (from the South Yellow Sea to the East China Sea), the Min-Yuedong stock (from the Taiwan Strait to the Pearl River Estuary), and the Naozhou stock (from the Pearl River Estuary to the Qiongzhou Strait) (Tian et al., 1962; Xu et al., 1962). As geographical stock delimitation based on morphology is often inconsistent with analysis results based on molecular data, determining the accurate genetic structure is of particular concern. A series of studies based on molecular markers have been conducted since the last decade in wild and cultured populations of large yellow croaker, but these studies were limited in terms of their success in determining population structure and phylogeography due, for instance, to sampling only part of the distribution area (Wang et al., 2012, 2014; Kon et al., 2021), small sample size in one group (Wang et al., 2013; Han et al., 2015); or collecting cultured populations from only a few farms (Huang et al., 2012; Wang et al., 2012; Kon et al., 2021).
To recover the wild resources of large yellow croaker, large amounts of hatchery-reared juveniles have been released into the coastal waters of Fujian, Zhejiang, and Jiangsu provinces each year since 2000 (Liu, 2013). A series of previous studies have shown that stock enhancement usually has negative ecological and genetic impacts on wild populations (Grant et al., 2017; Hagen et al., 2020), such as genetic homogenization (Marie et al., 2010) and decreased genetic diversity (Shan et al., 2020). Moreover, hatchery-reared individuals may replace rather than increase the abundance of wild populations or may be harmful to other species through ecological interactions (Grant et al., 2017). Since it is difficult to sustainably obtain wild broodstocks of large yellow croaker for hatcheries because of the scarce resources and overly sensitive stress response of this species, the cultured stock of large yellow croaker has been reported to show lower genetic diversity and a significantly different population structure compared with the wild population (Wu et al., 2011; Wang et al., 2012); however, the genetic effects and potential risk to the wild population are still unknown. Moreover, data show that relatively limited large yellow croaker catches have consistently been recorded since 2000 in the East China Sea, which is the main fishing area of large yellow croaker (Chinese Fishery Statistical Yearbook, 1956–2019). It is unknown whether the caught individuals come mainly from hatchery-released or wild populations, which leads to an important question of how much the hatchery release in these years has affected the resource recovery of large yellow croaker in the East China Sea.
Here, we employed intensive sampling coverage of wild and cultured populations. We also collected ancient samples (29) from museums on mainland China and Taiwan; unfortunately, all of these specimens were preserved in formalin, and their DNA could not be amplified and sequenced. Thus, in order to better represent the gene pool of the cultured population, we collected a total of 2,785 cultured individuals from 91 hatcheries (approximately 82.7% of the total hatcheries in China) in primary breeding areas and 29 supermarkets in different cities across the country. We also collected 591 wild individuals belonging to six different populations across the species distribution areas from the Qiongzhou Strait to the South Yellow Sea, including a population from the Sansha Bay (SSB), which was once the largest spawning and nursery area for migrated clusters of large yellow croaker in history. A combination of mitochondrial and nuclear gene fragments is commonly used in animal population genetics studies due to their different inheritance patterns (Durand et al., 2005; Qiu et al., 2016). In this study, we used ryanodine receptor 3 (RyR3) (a single-copy nuclear gene fragment functional in phylogeography (Qiu et al., 2016; Ding et al., 2018) and two common mitochondrial gene fragments, cytochrome oxidase I (COI) and cytochrome b (Cyt b), to evaluate the resource status of large yellow croaker based on the 3,376 samples indicated above. The goals of this study are (1) to investigate the population classification of wild large yellow croaker, (2) to determine the role of the long-term stock enhancement of large yellow croaker, (3) to quantify the level of genetic effects associated with restocking intensity in wild populations, and (4) to provide useful information on fisheries management to improve the effectiveness of stock enhancement.
Materials and Methods
Sample Collection
A total of 591 samples from wild populations were combined into six pooled samples based on geographic location along the coast of mainland China during fisheries survey from 2018 to 2019. A total of 2,414 and 371 individuals were sampled from the FJC and ZJC populations, respectively, during 2018∼2019. The FJC population was collected from most of the hatcheries that produce FJC fry (78 of 97 hatcheries) and 29 supermarkets (74 individuals) from different cities in China. The ZJC population was collected from all hatcheries that produce ZJC fry (13 hatcheries) (Figure 1). All animal experiments were carried out in accordance with the guidelines and approval of the Animal Research and Ethics Committee of the College of Ocean and Earth Sciences, Xiamen University. Tissue samples were collected from the muscle below the dorsal fin and preserved in 95% alcohol for DNA extraction.
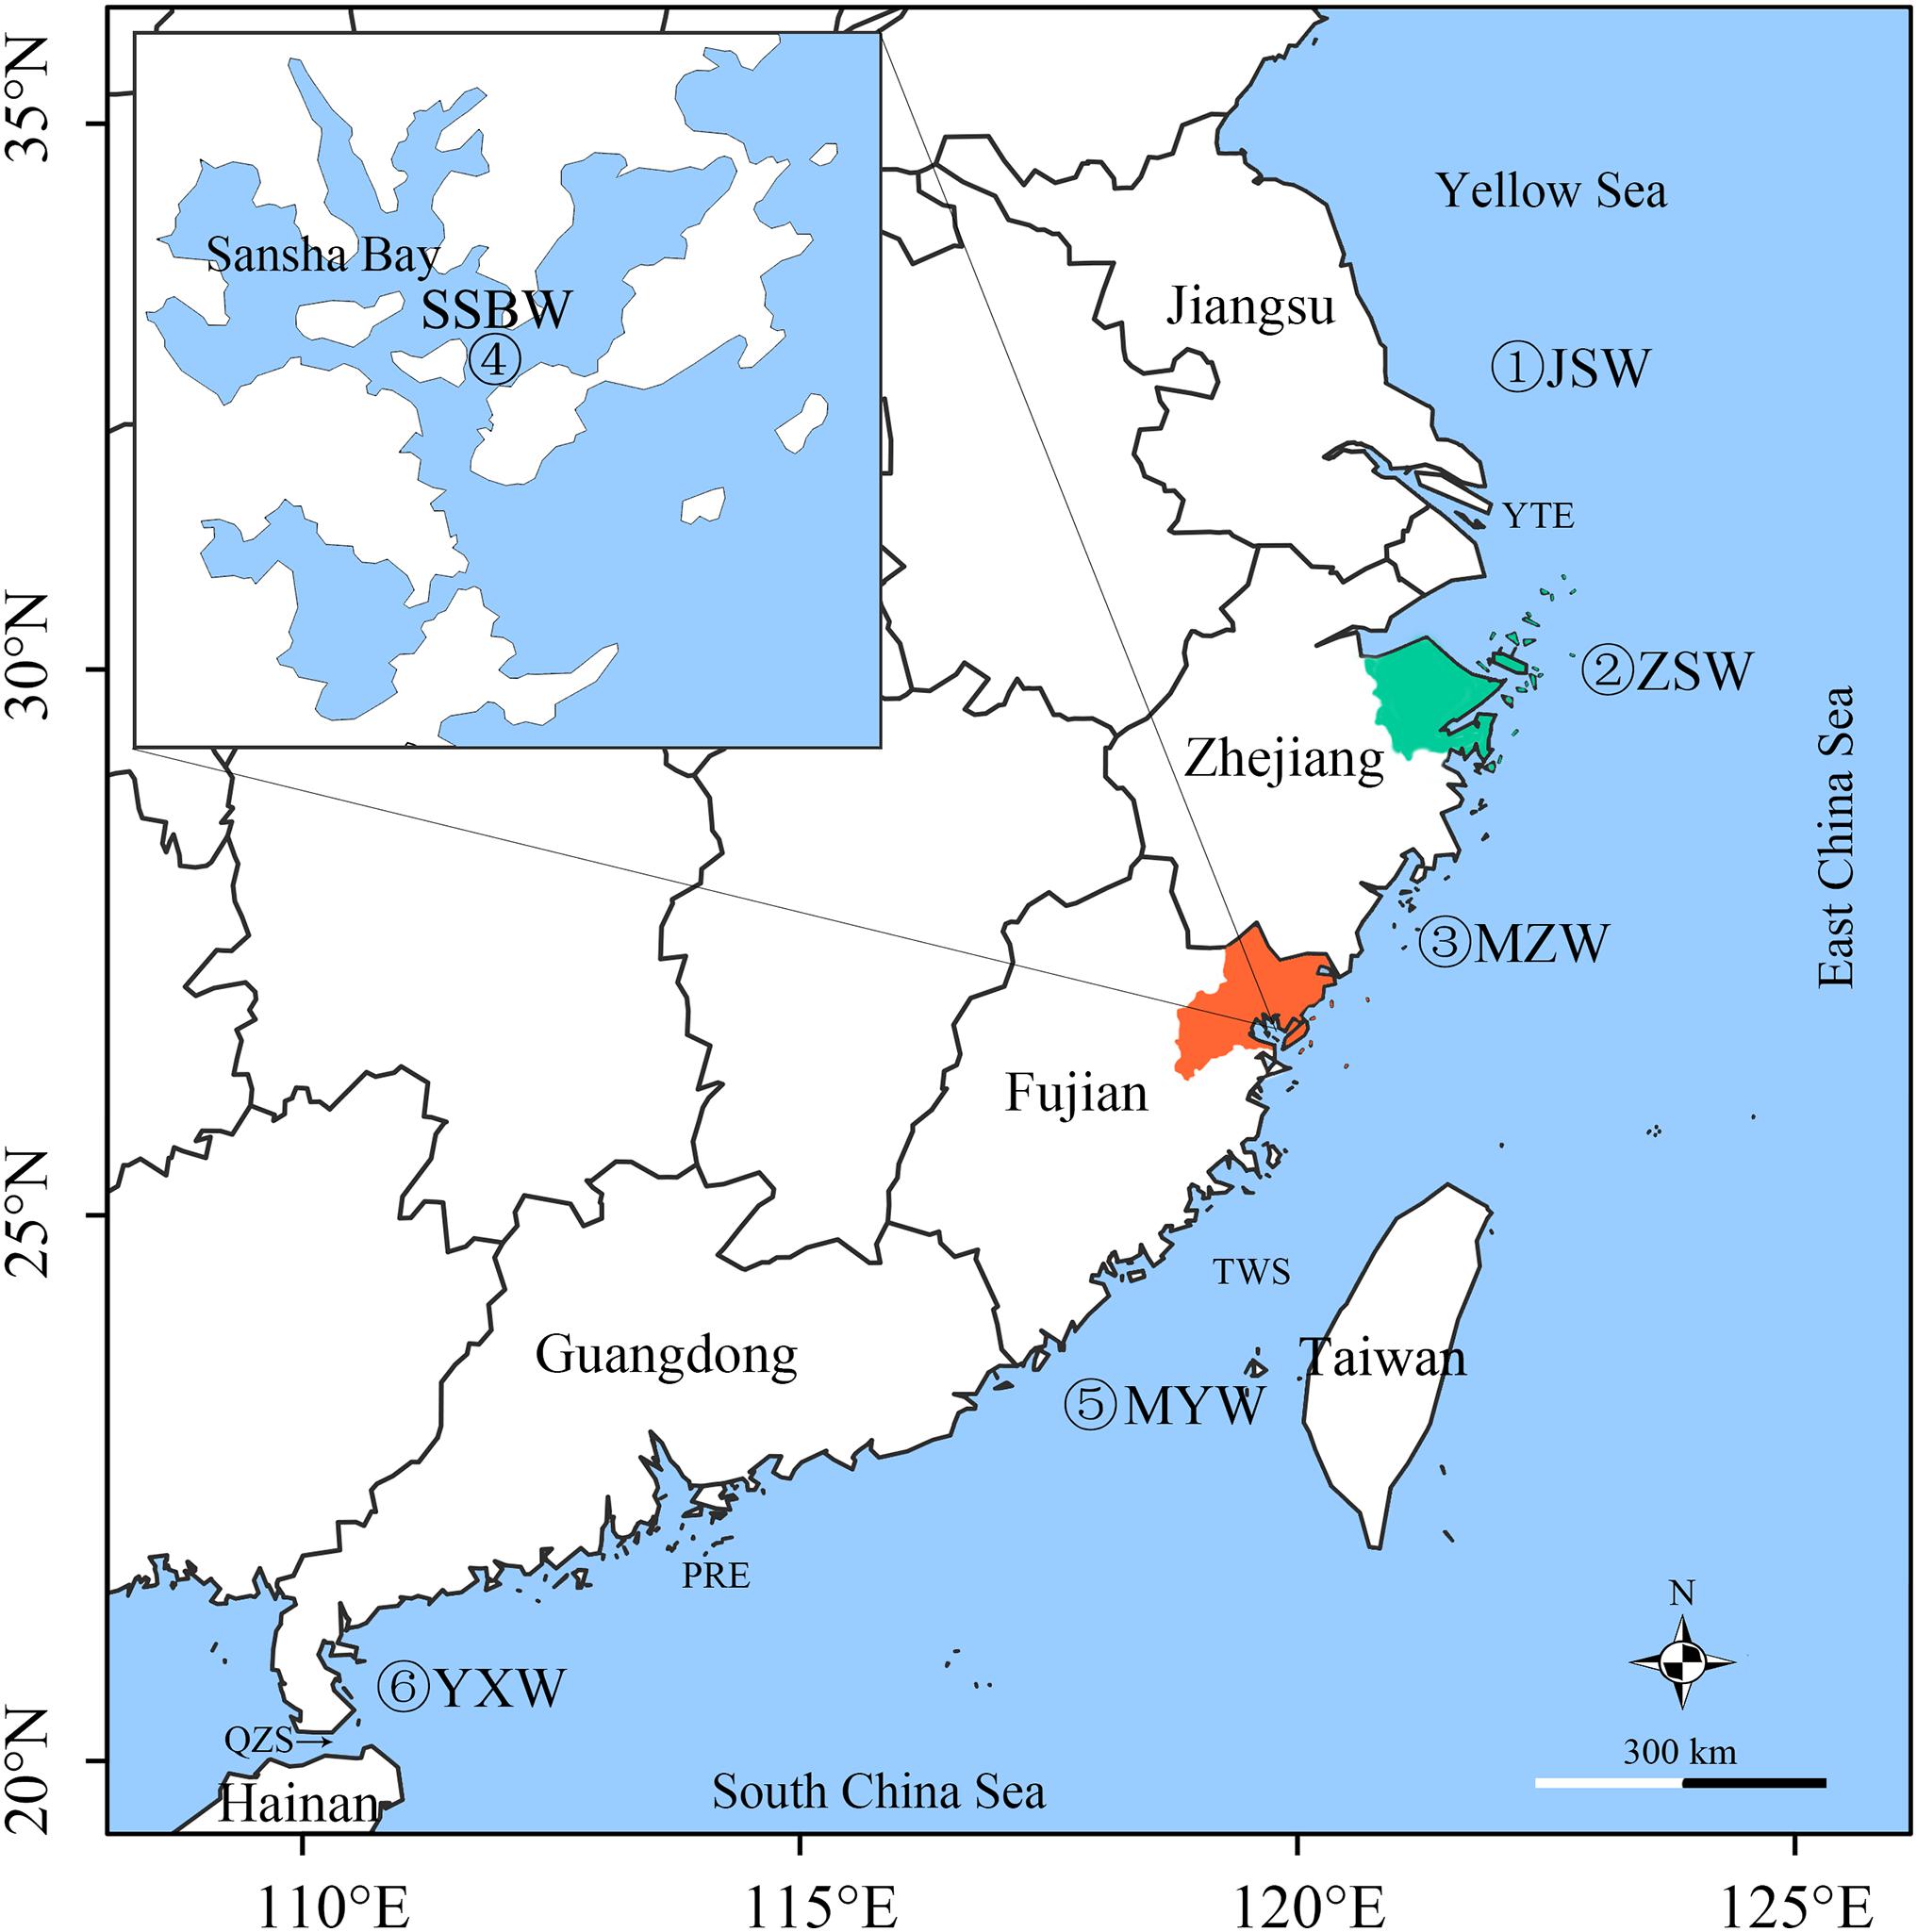
Figure 1. Sampling locations of large yellow croaker populations. JSW, Jiangsu population; ZSW, Zhoushan population; MZW, Minzhe population; SSBW, Sansha Bay population; MYW, Minyue population; and YXW, Yuexi population are wild populations caught in the corresponding seas. The orange area is Ningde City, where most of the FJC fry were produced, and the green areas are Ningbo City and Zhoushan Island, where most of the ZJC fry were produced. The inset map shows Sansha Bay, which is historically the largest spawning and nursery area of large yellow croaker and has been one of the major hatchery release grounds since 2000. TWS, Taiwan Strait; PRE, Pearl River Estuary; QZS, Qiongzhou Strait; YTE, Yangtze River.
Total DNA Genome Extraction and Fragment Amplification
Total genomic DNA was extracted using the guanidine isothiocyanate method (Baldomero et al., 2016). The mitochondrial DNA fragments of COI and Cyt b and the nuclear DNA fragment of RyR3 were amplified by polymerase chain reaction (PCR) using the following primers: forward primer, COIF: 5′-CGCCTAAATCTCAGCCATCT-3′, and reverse primer, COIR: 5′-GAGAAACCATGCCGAATCC-3′; forward primer, CytbF: 5′-AGGCGAAGGGTTTGAAGC-3′, and reverse primer, CytbR: 5′-TGGGAGTTAGTGGTGGGAGT-3′; and forward primer, RyR3F: 5′-CAAACTGAAGGACCTGACGACC-3′, and reverse primer, RyR3R: 5′-GTGGAAGAACCCGAATATAAGT-3′. The PCR mixture (25 μL) contained 12.5 μL of 2 × Accurate Taq Master Mix [Accurate Biotechnology (Hunan)], 10.5 μL of ultrapure water, 0.5 μL of each primer (5 μmol/L) and 25 ng of DNA template. The PCR protocol for both COI and RyR3 sequences was as follows: a denaturation step at 94°C for 3 min, followed by 35 cycles of 94°C for 30 s, 52.5°C for 30 s, and 72°C for 1 min, and then 72°C for 10 min. The PCR protocol for Cyt b sequences included an initial step of 3 min at 94°C, 35 cycles of 94°C for 30 s, 52.5°C for 30 s, and 72°C for 2 min, and a final extension at 72°C for 10 min. The PCR products were purified and processed with the BigDye Terminator Kit and run on an ABI 3730XL DNA Analyzer (Applied Biosystems, Foster City, CA, United States).
Data Processing and Analysis
After sequencing, all polymorphic sites of the fragments were confirmed by manual inspection and corrected according to the corresponding chromatograms in Sequencher version 4.9 (Gene Codes Corporation, Ann Arbor, MI, United States). In this study, the mitochondrial COI and Cyt b fragments from the same sample were assembled into a concatenate fragment (COI + Cytb, mtDNA) for analysis since mtDNA does not recombine. To take advantage of the parental genetic information provided by the nuclear fragment (nuDNA), we used degenerate bases to represent the heterozygous positions of RyR3 fragments in Sequencher version 4.9 (Gene Codes Corporation, Ann Arbor, MI, United States, 2009). Then, we perform haplotype phasing for all of the RyR3 fragments using the PHASE function of DnaSP v6.0 (Julio et al., 2017), and ultimately obtained the haplotype pairs (two fragments from each parent) of each individual. The haplotype pairs of each sample were used for all subsequent analyses.
Molecular diversity parameters such as the number of haplotypes (H), haplotype diversity (Hd), the average number of nucleotide differences (k), nucleotide diversity (π), and historical diversity estimates (θω) were calculated using DnaSP v6.0 software (Julio et al., 2017). Haplotype networks were constructed using the median-joining algorithm and maximum parsimony option in Network 10.1 (Bandelt et al., 1999; Polzin and Daneschmand, 2003). MrBayes v3.2.6 (Ronquist et al., 2012) was used to reconstruct the phylogenetic tree. The sequences of two mtDNA genes were concatenated and then aligned using MUSCLE (Edgar, 2004). The sequences of nuDNA and mtDNA were analyzed separately. The best-fit nucleotide substitution models were estimated using the Bayesian information criterion (BIC) in ModelTest-NG (Diego et al., 2020), which identified TrN + I + G4 model for mtDNA and TIM1ef + I + G4 model for nuDNA. These substitution models were replaced by the GTR + I + G model in MrBayes (Ronquist et al., 2012). The Markov chain Monte Carlo simulation was run for 150 million generations with four chains and sampled every 1000 generations. MCMC convergence was assessed using standard deviation of clade frequencies and potential scale reduction factor (Ronquist et al., 2012), and the first 25% of sampled trees were discarded as burn-in. Clade support was evaluated using posterior probabilities for nodes retained in the 50% majority rule consensus tree.
To identify the genetic relatedness between the cultured (including all cultured samples) and wild populations, we calculated the proportion of shared haplotypes (PSH) between the cultured and wild populations and the proportion of individuals with these shared haplotypes (PIH) in the corresponding populations. Here, we use PSHc and PIHc to represent the proportions in the cultured population, and the proportions in wild populations are denoted by PSHw and PIHw. Furthermore, the hierarchical structure of the eight populations was visualized with the ggplot2 package (Wickham, 2016) (using Bray-Curtis dissimilarity and the average linkage method for hierarchical cluster analysis) based on the haplotype composition and frequency.
The levels of genetic differentiation between the populations (pairwise FST values) and the analysis of molecular variance (AMOVA) were performed using Arlequin 3.5 (Excoffier and Lischer, 2010), followed by the analysis of statistical significance with 100,000 permutation steps for each comparison. For AMOVA, the populations were grouped based on three scenarios according to the wild and cultured populations, restocking intensity, and geographical distance: (1) Scenario I: two independent groups corresponding to the cultured and wild populations; (2) Scenario II: two independent groups (FJC, ZJC, and SSBW; JSW, ZSW, MZW, MYW, and YXW) divided according to the similarity of the haplotype composition and frequency; (3) Scenario III: three groups corresponding to the Daiquyang stock (JSW, ZSW, and MZW), Min-Yuedong stock (MYW), and Naozhou stock (YXW), which were the primary divisions of Tian et al. (1962) and Xu et al. (1962). We used SAMOVA software (Dupanloup et al., 2010) to define the groups of populations that were maximally differentiated from each other. In turn, isolation-by-distance (IBD) was tested to examine whether genetic differentiation increased with geographic distance using the Mantel test in Arlequin 3.5 (Excoffier and Lischer, 2010). We used coordinate information from Google Earth to measure the geographic distance between sampling sites.
Results
Genetic Diversity of Large Yellow Croaker Populations
We defined a total of 199 mtDNA haplotypes (602 bp of COI and 1,055 bp of Cyt b) from 571 individuals and 196 nuDNA haplotypes (704 bp) from 529 individuals in the wild populations, whereas we identified 30 mtDNA haplotypes from 2,739 individuals and 44 nuDNA haplotypes from 2,637 individuals in the cultured populations. In the wild populations, the average haplotype diversity was high (0.983) among the mtDNA fragments, ranging from 0.917 (SSBW) to 0.986 (MZW and YXW), and the average nucleotide diversity was (θπ) 0.0042, ranging from 0.0031 (SSBW) to 0.0046 (YXW), or (θω) 0.0177, ranging from 0.0057 (SSBW) to 0.0137 (MYW). The average haplotype diversity was also high (0.980) among the nuDNA fragments, ranging from 0.864 (SSBW) to 0.990 (MYW), and the average nucleotide diversity was (θπ) 0.0074, ranging from 0.0065 (SSBW) to 0.0078 (MZW), or (θω) 0.0156, ranging from 0.0091 (SSBW) to 0.0141 (JSW). The genetic diversity (Hd, π, and θω) of all the wild populations was significantly higher than that of the two cultured populations based on both the mtDNA and nuDNA sequences (p < 0.05), except π on nuDNA sequences (p = 0.209). It is worth noting that the SSBW population showed the lowest level of genetic diversity (HdCOI+Cytb = 0.917/HdRyR3 = 0.864 and πCOI+Cytb = 0.0031/πRyR3 = 0.0065) among the wild populations, and the MZW, YXW, JSW, MYW, and ZSW populations exhibited relatively similar levels of diversity. The ZJC population (HdCOI+Cytb = 0.444/HdRyR3 = 0.754 and πCOI+Cytb = 0.0010/πRyR3 = 0.0076) showed a lower level of genetic diversity than the FJC population (HdCOI+Cytb = 0.732/HdRyR3 = 0.857 and πCOI+Cytb = 0.0026/πRyR3 = 0.0064) (Table 1).
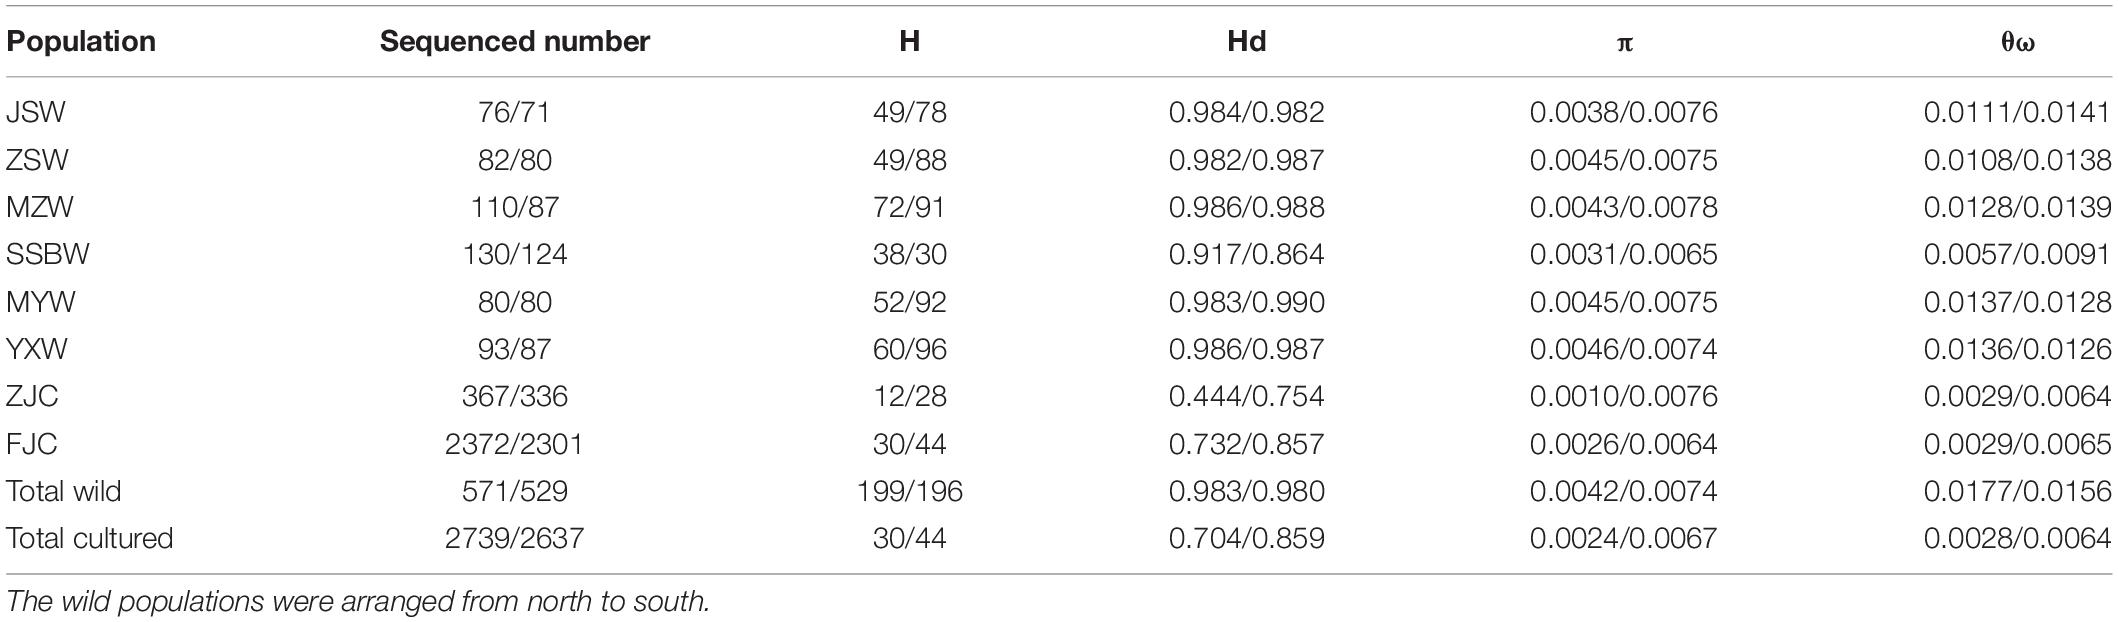
Table 1. The genetic diversity parameters based on mtDNA (former) and nuDNA (latter) fragments.
Phylogenetic Relationships Between Cultured and Wild Populations
All of the haplotype networks and phylogenetic trees based on the mtDNA and nuDNA fragments showed no evidence of significant geographical structure corresponding to the sampling locations (Figure 2 and Supplementary Figures 3, 4), which further indicated that geographical distance did not obviously contribute to the genetic divergence among the wild populations. According to the distribution pattern of haplotypes from different wild populations, the topological relationships observed in the phylogenetic analysis (BI tree) supported the formation of one major lineage (Supplementary Figure 4).
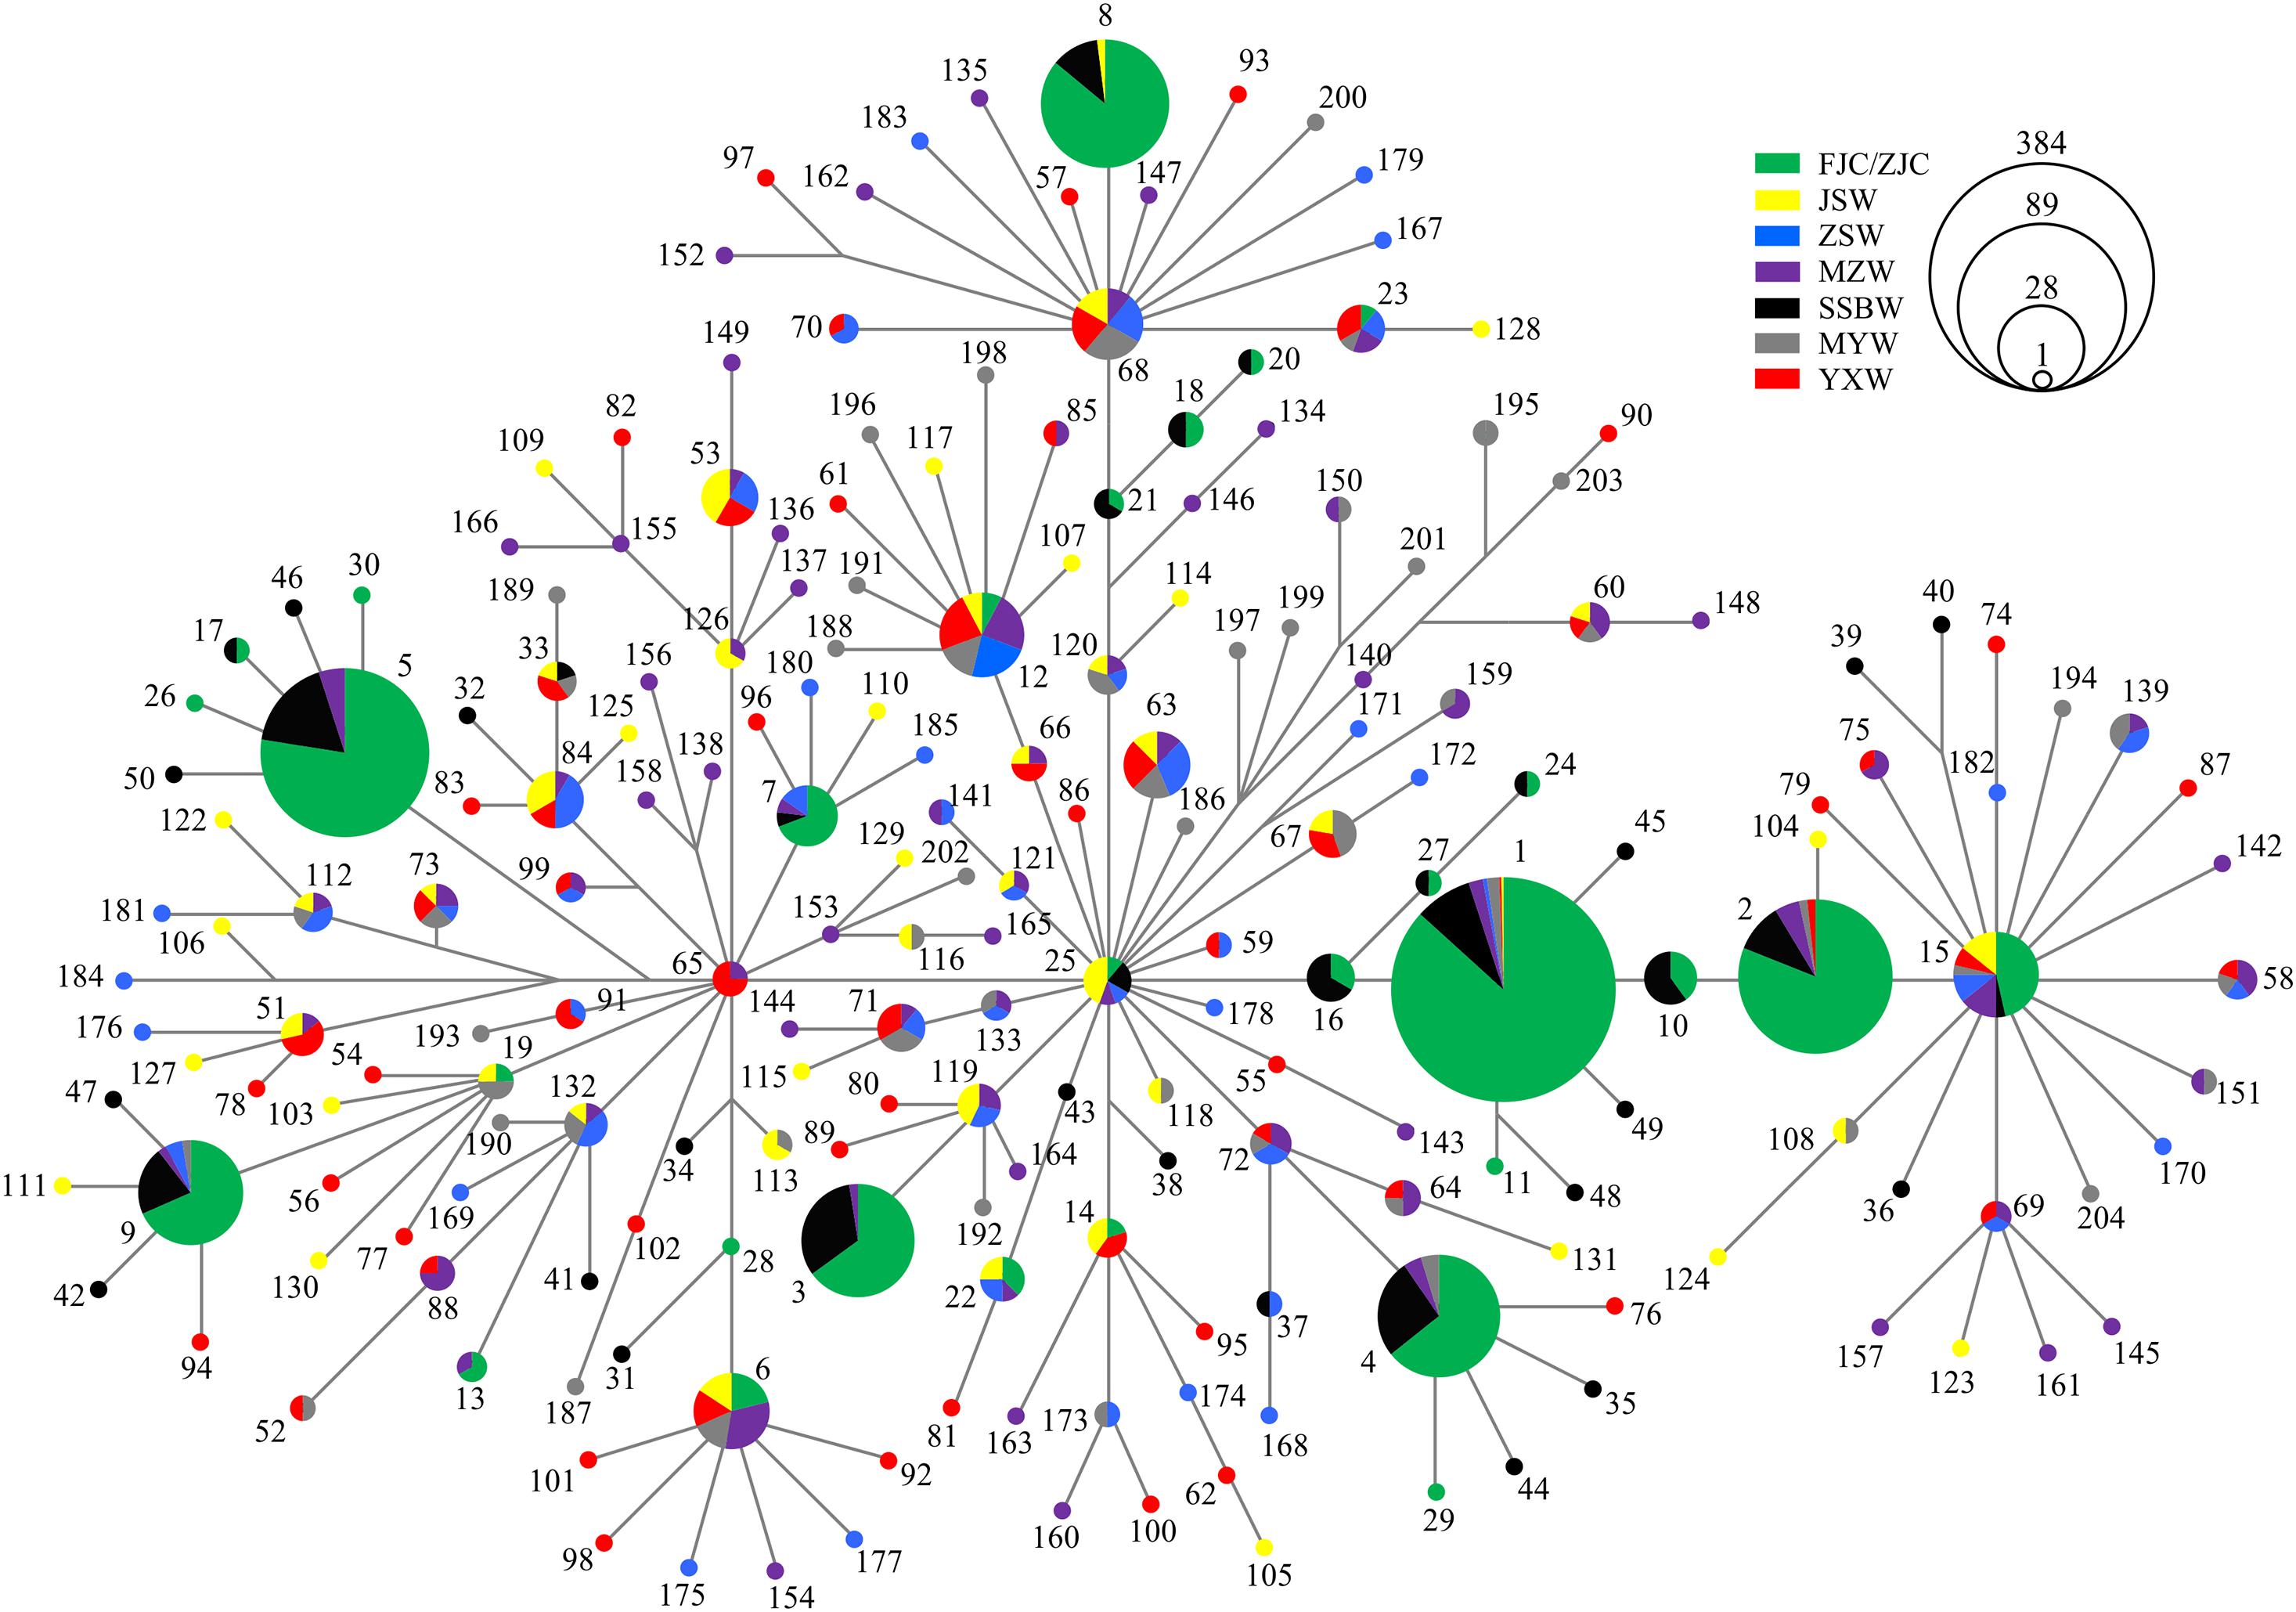
Figure 2. The haplotype network based on mtDNA fragments.
We used the PSH and PIH indexes to assess the genetic relatedness between the cultured and wild populations. Analysis based on mtDNA fragments showed that among the six wild populations, the SSBW population had the highest proportion of haplotypes shared with the cultured population (PSHw = 47%), and the same was true for the proportion of individuals with these shared haplotypes (PIHw = 85%). The PSHc and PIHc of the cultured population also indicated that the cultured population showed the highest proportions of both shared haplotypes and individuals carrying these haplotypes when related to SSBW, rather than the other wild populations. These results indicated that the SSBW population had a close relationship with the cultured population. The PIH values were higher than the PSH values in both the cultured and wild populations (especially in the SSBW population), suggesting that these shared haplotypes were always dominated by the main haplotypes. The PSHc and PIHc of the total cultured population (PSHc = 83.3%, PIHc = 99.6%) were both significantly (p < 0.001) higher than those of the total wild population (PSHw = 12.6%, PIHw = 40.2%), indicating significant divergence between the cultured and wild populations in terms of genetic structure. In addition, the results based on nuDNA fragment analysis were similar to those based on the mitochondrial fragments (Figure 3).
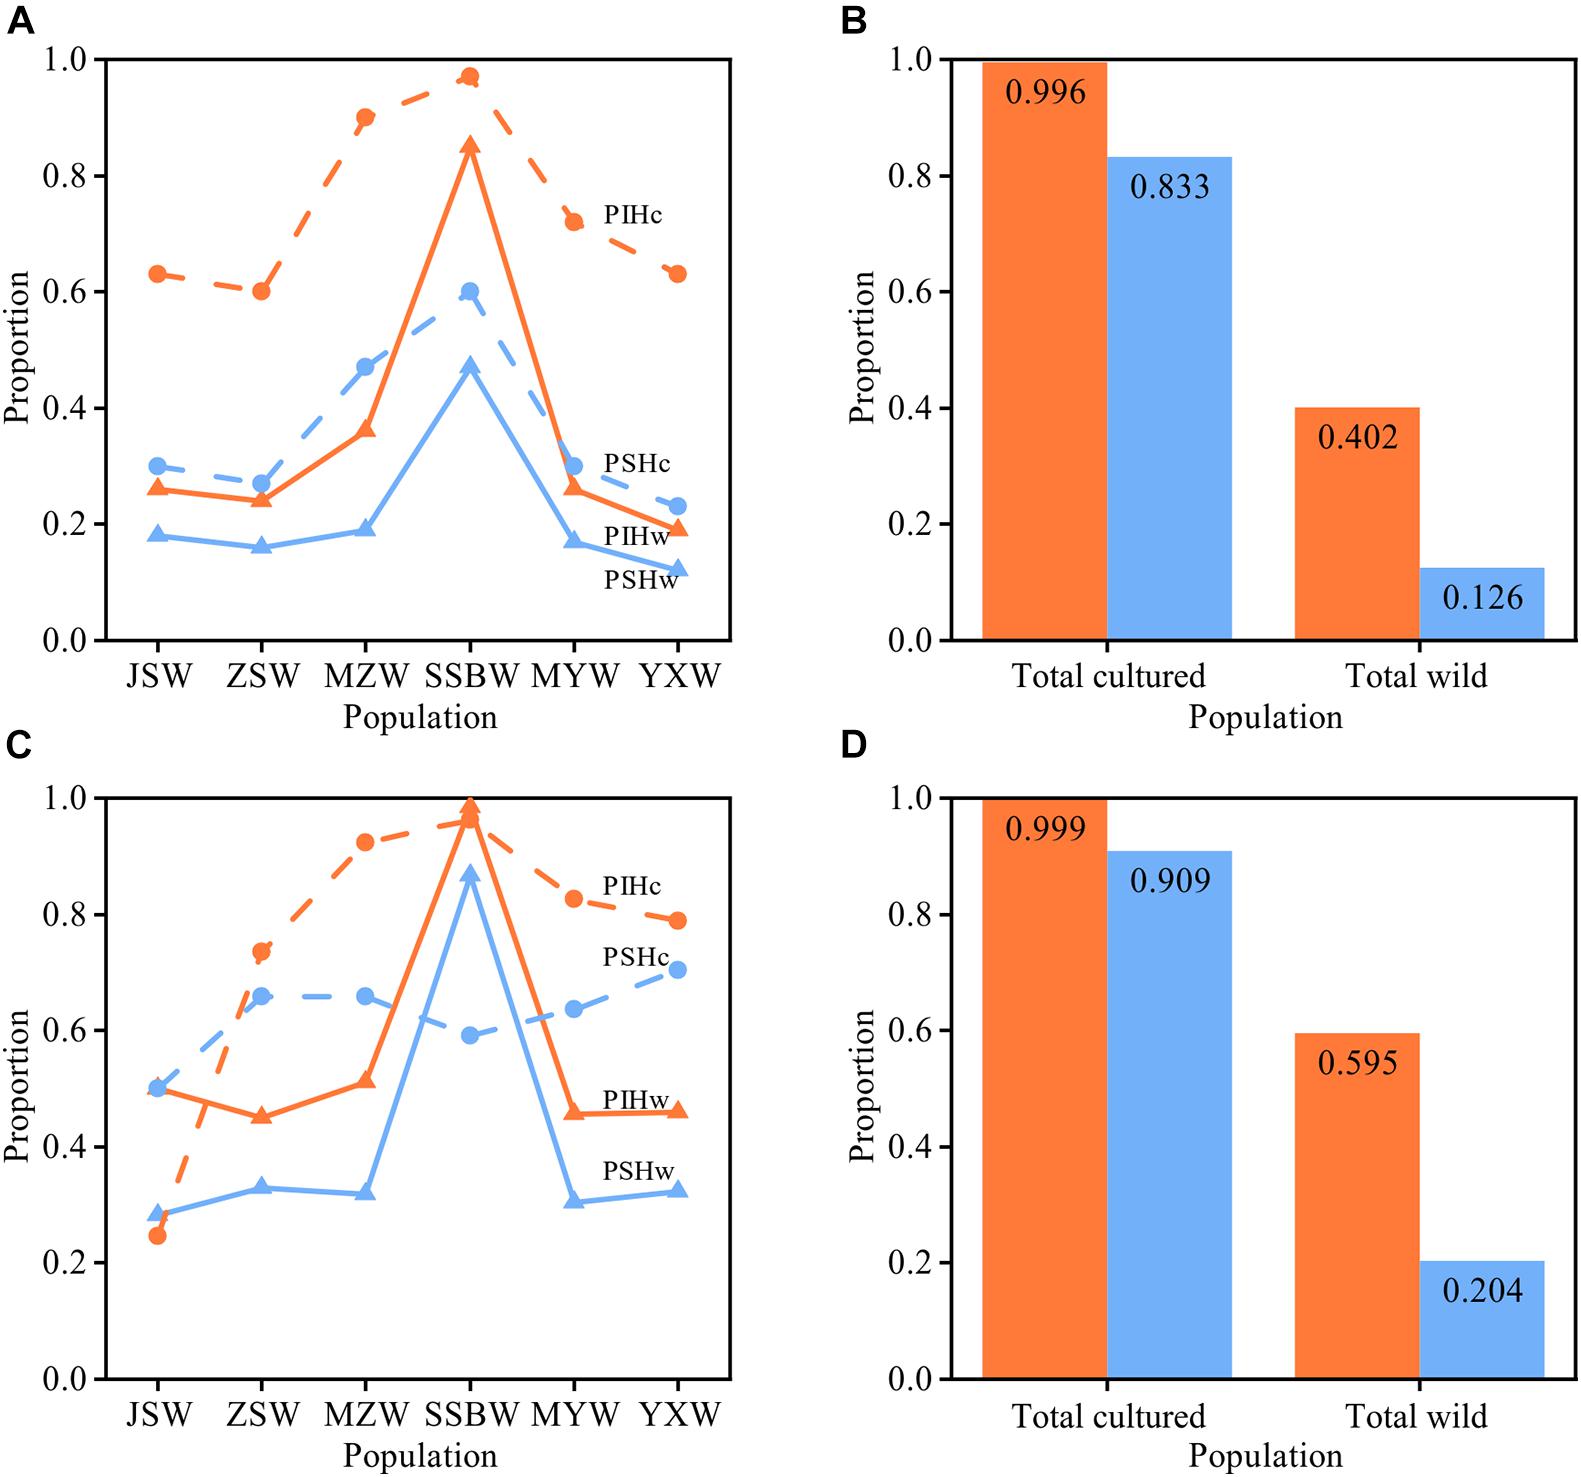
Figure 3. Analysis of shared haplotypes between cultured and wild populations. (A,B) Show the results based on mtDNA, and (C,D) show the results based on the nuDNA. (B,D) Show the PIH and PSH of the total cultured and total wild populations. The proportion of individuals with shared haplotypes (PIH) is shown in orange, and the proportion of shared haplotypes (PSH) is shown in blue. The wild populations are ordered from north to south along the x-axis.
Among the 204 mtDNA haplotypes, only 25 haplotypes were shared between the wild and cultured populations. The most widespread haplotype was Hap1, which was widely distributed in all wild and culture populations. Beyond the haplotypes shared with the cultured populations, there were no haplotypes shared by the six wild populations, but four shared haplotypes were found among 5 of the wild populations, except for SSBW. All private haplotypes in the wild populations were distributed throughout almost the entire range of large yellow croaker. We defined five main haplotypes from the mtDNA fragments shared between the wild and cultured populations that contained the most individuals. In these populations, the cultured individuals with these main haplotypes accounted for 76% of the total individuals in the cultured population, while the corresponding proportion was only 18.2% in the wild population, and this value dropped to 6.8% after excluding the SSBW population. In the analysis of the five main haplotypes of nuDNA fragments shared between the wild populations and cultured populations, SSBW also had a higher proportion of main haplotype-carrying individuals than the other wild populations (Table 2).
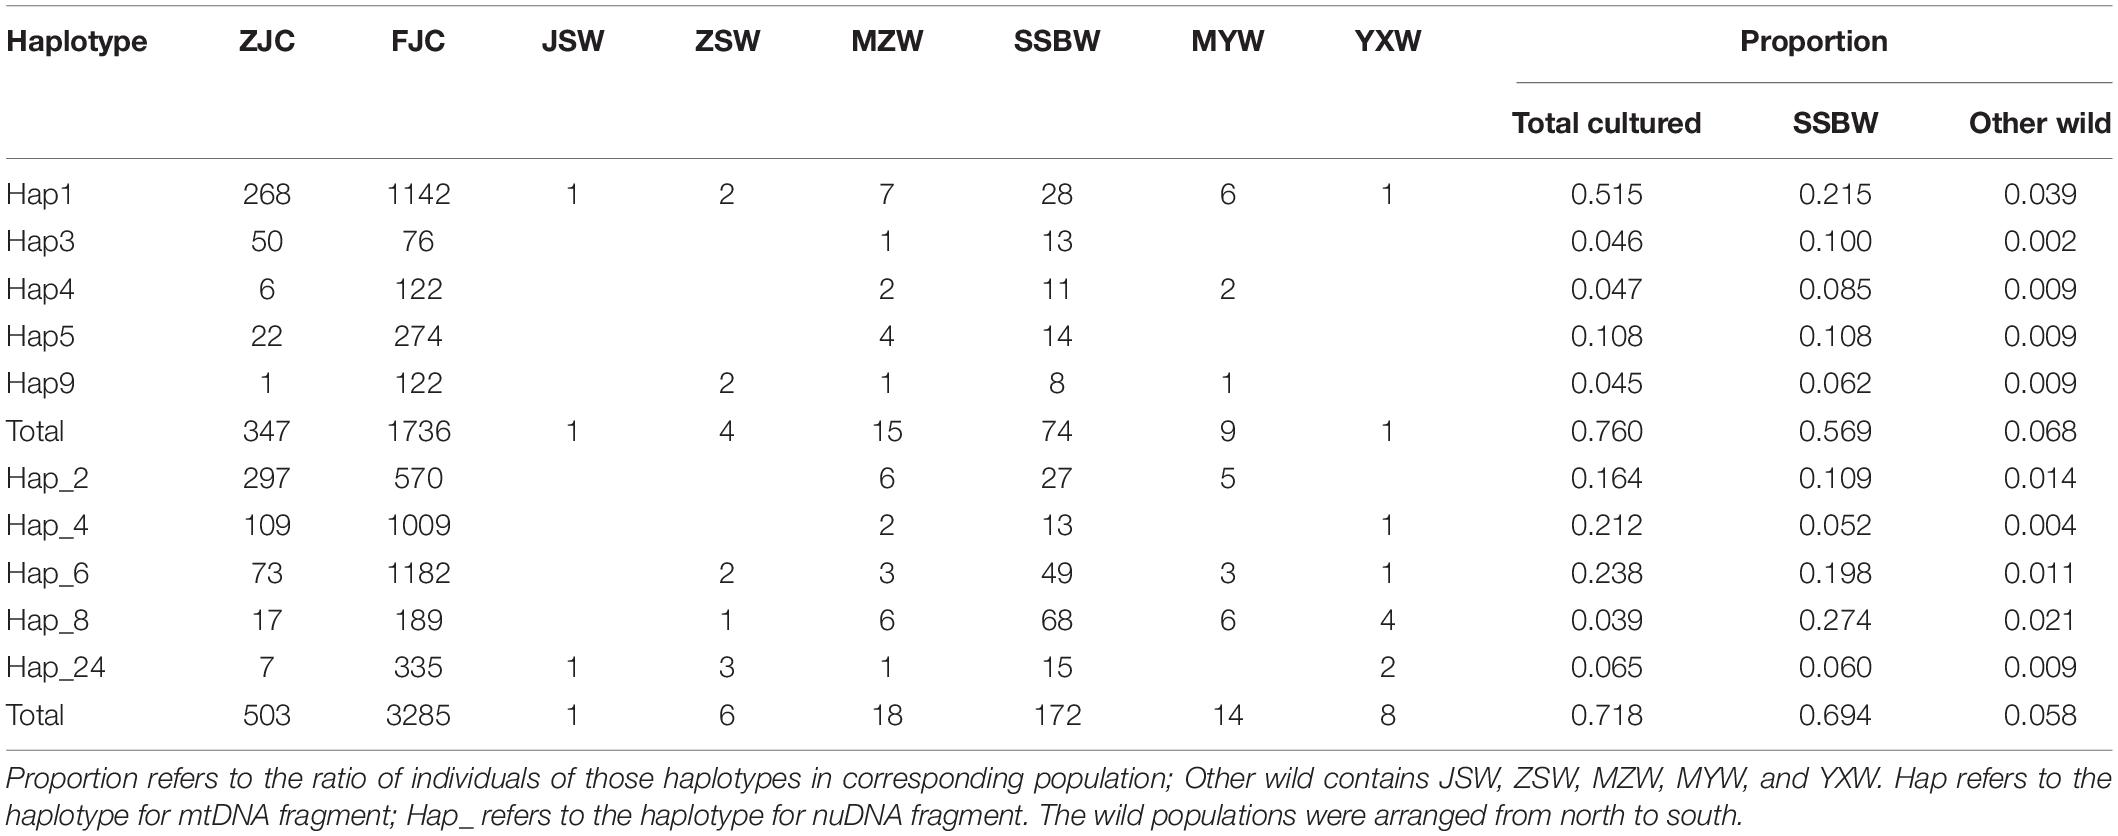
Table 2. The main haplotypes shared between cultured and wild populations.
Genetic Differentiation and Genetic Structure
In the analysis of pairwise FST based on mtDNA fragments, the pairwise FST values ranged from −0.005 (between YXW and ZSW) to 0.064 (between SSBW and JSW) in the wild populations, with a mean value of 0.0177. Moreover, the ZJC population showed a small level of differentiation from the FJC population (FST = 0.065), a moderate level of differentiation from the SSBW population (FST = 0.165), and a high level of differentiation from the other wild populations (0.291 ≤ FST ≤ 0.383). The FJC population showed a small level of differentiation from the others (0.097 ≤ FST ≤ 0.136) and no differentiation from the SSBW population (FST = 0.014). In the wild populations, there was a small level of differentiation (0.060 ≤ FST ≤ 0.064) between the SSBW population and three populations distant from Sansha Bay (ZSW, JSW, and YXW). Moreover, neither the MZW nor MYW population, which were geographically adjacent to Sansha Bay, was differentiated (0.036 ≤ FST ≤ 0.045) from the SSBW population. Besides, we detected very low or non-significant genetic differentiation (FST < 0.05, p > 0.05) for each pair of wild populations except in the comparisons involving the SSBW population. Furthermore, taking into account that the genetic relationship between wild populations may be affected by the shared haplotypes from cultured individuals, we further excluded these shared haplotypes and re-analyzed the genetic relationship between wild populations. The results showed that there is no differentiation between all pairs of wild populations. Lastly, although the pairwise FST values based on the nuDNA fragment were smaller as a result of conservation, they supported the differentiation pattern based on mtDNA fragment analysis.
The AMOVA results indicated that most of the genetic variation occurred among individuals within populations (i.e., two groups (Scenario I, 88.09%/93.04%), two groups (Scenario II, 85.6%/91.66%) or three groups (Scenario III, 100.09%/100.05%). When the populations were divided into two groups (Scenario I), two groups (Scenario II) or three groups (Scenario III), only 7.41%/0.21%, 11.12%/3.06%, and −0.23%/0.06% of the total variation, respectively, occurred among the groups. Notably, the genetic variation among groups under Scenario II was significantly higher than that under the other scenarios (Table 3). The results of SAMOVA further indicated that the SSBW population was less divergent from the cultured population and that the other wild populations were not significantly divergent from each other.
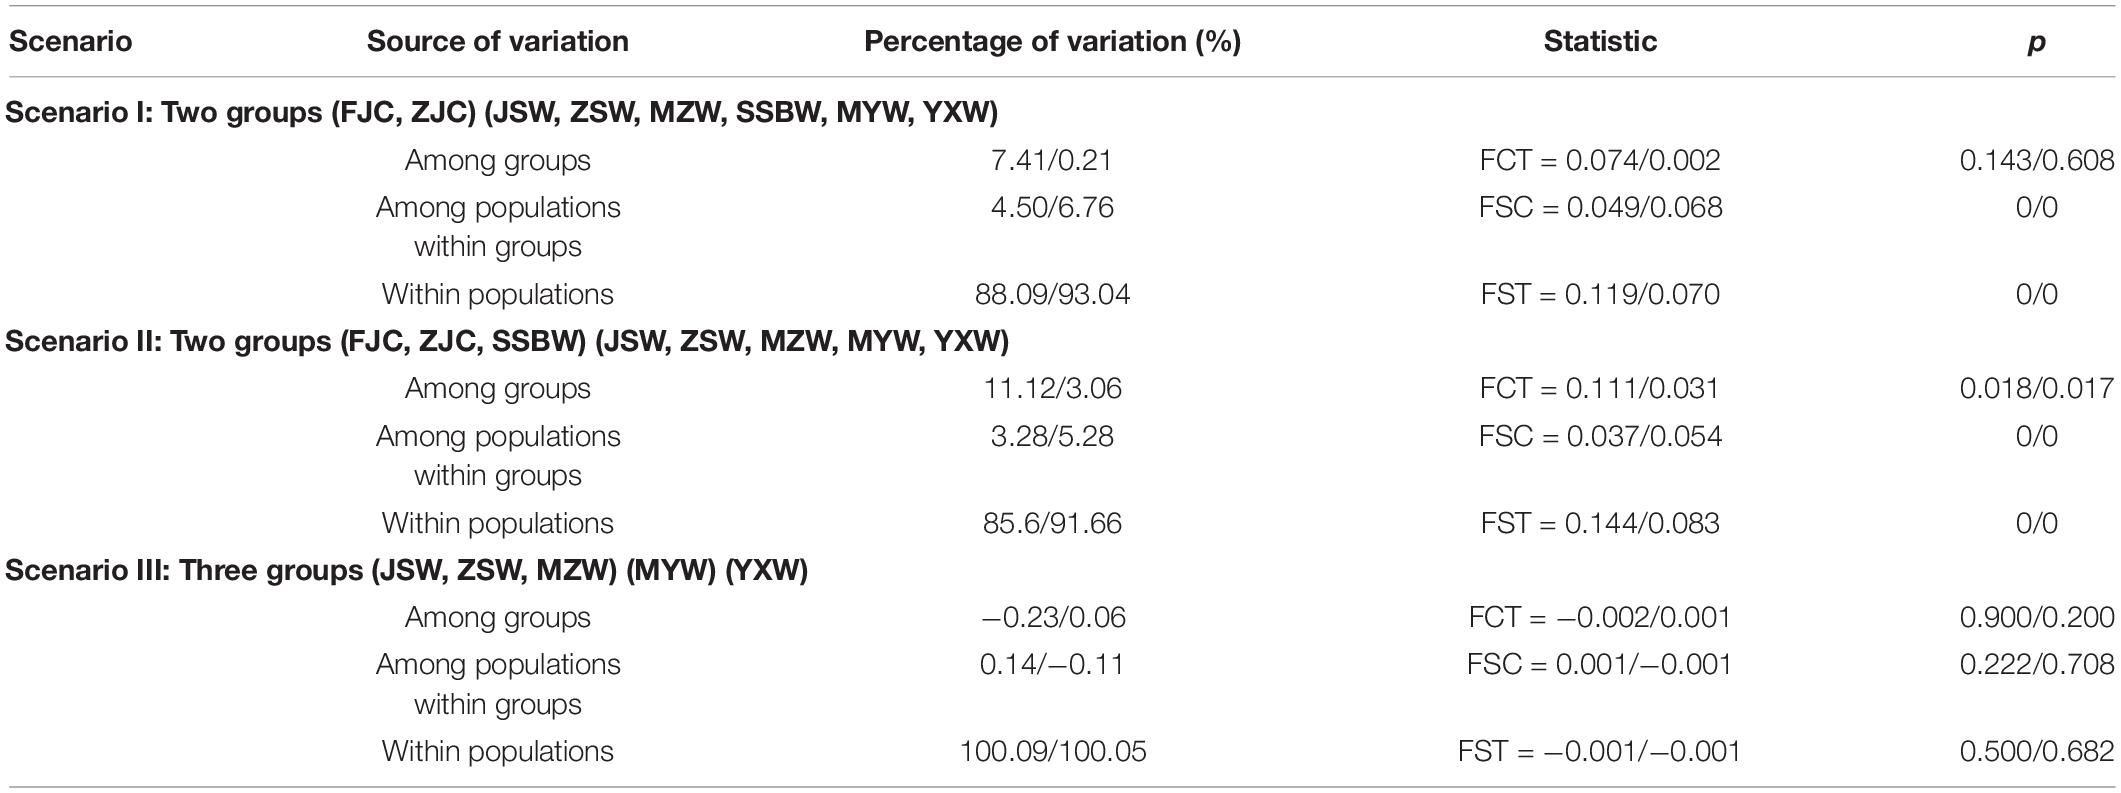
Table 3. AMOVA analysis based on mtDNA (former) and nuDNA (latter) fragments.
The hierarchical structure analysis based on the mtDNA and nuDNA fragments produced a similar clustering structure, which further supported the pairwise FST results, providing more insight into the population genetic structure. As shown in Supplementary Figure 5, the hierarchical structures were separated into two main clades. The ZJC, FJC, and SSBW populations clustered into one clade, in which the ZJC population showed an exceptionally high degree of divergence from the others in terms of haplotype composition and frequency. In addition, the SSBW population showed a more similar population structure to the cultured populations but a divergent structure relative to the other wild populations. The wild populations other than SSBW were clustered into one clade with no obvious geographic structure, even though their sampling locations were far apart. The IBD analysis (RCOI+Cytb = −0.28313, p = 0.757 and RRyR3 = −0.32006, p = 0.832) also showed that the divergent pattern among the wild populations was independent of geographical distance. Therefore, our results did not support the division of the large yellow croaker into three geographical stocks.
Discussion
Large Yellow Croaker in the China Sea, a Single or Mixed Population?
The temporo-spatial genetic architecture of marine fish is typically characterized by genetic homogeneity due to their high dispersal potential and an absence of obvious physical barriers to gene flow among separate ocean basins (Ding et al., 2018; Gu et al., 2021). Such a scenario may have been discovered in many marine fish along the coast of mainland China [e.g., L. polyactis (Kim et al., 2010; Li et al., 2013) and Nibea albiflora (Xu et al., 2012)]. On the other hand, geological structure (e.g., the Taiwan Strait) and/or hydrological characteristics (e.g., Influxes of the large river) can act as barriers to the movement of marine organisms along the coast of mainland China, which results in differentiation among populations, as observed in Chelon haematocheilus (Liu et al., 2007), Terapon jarbua (Liu et al., 2015), and Bostrychus sinensis (Qiu et al., 2016). For large yellow croaker, the hypothesis of three geographical stocks has been widely accepted and has guided decisions related to natural resource protection and breeding (Tian et al., 1962), while some previous studies have revealed a pattern of no significant population structure or little genetic differentiation based on different molecular data (Wang et al., 2012; Han et al., 2015; Liu Q. H. et al., 2020). In this study, sufficient numbers of samples and populations from all the regions were examined, and phylogenetic and network analyses showed that one major lineage was shallow and no distinct genealogical branch corresponding to each sampling locality. Our results demonstrated that the vicariant effect caused by decreasing sea level of the Taiwan Strait and the influx of the Yangtze River/Pearl River might not promote the divergence of large yellow croaker. All the obtained molecular evidence clearly revealed frequent gene flow between populations and the existence of a single panmictic population of large yellow croaker.
Additionally, we suggest that the definition of three geographic stocks in previous studies was unreasonable, which based mainly on non-significant morphological characteristics, and estimates of average age and the spawning season (Tian et al., 1962; Xu et al., 1962). Multiple lines of evidence confirm that the large yellow croaker population consists of a single population. For instance, Liu (2013) reported that the spawning season of large yellow croaker could change with the environment. Furthermore, Xu and Chen (2011) showed that seawater temperature and nourishment were the major factors affecting the latitudinal migration of large yellow croaker. However, the average temperature difference between the South China Sea and the South Yellow Sea (Bao and Ren, 2014) does not exceed the adaptive capacity of this croaker (Chen et al., 2005). Therefore, there are no obvious geographic and hydrologic barriers to the long-term migration of this croaker within its distribution range in the China Seas. As the East China Sea was once the largest production area of wild large yellow croaker, the greatest fishing pressure on this species has been maintained in this area. Based on the above analysis of the population genetic relationships and the stable low-catch data over the past 10 years (Chinese Fishery Statistical Yearbook, 1956–2019), we speculate that the wild stock in the East China Sea might be primarily supplied by immigration from the South China Sea or the southwestern South Korean sea region, where this resource has been relatively well maintained.
How Have Human Activities Affected the Genetic Diversity of the Wild and Cultured Populations of Large Yellow Croaker?
Overfishing and habitat loss can lead to reduced spatial occupancy (Helen et al., 2021) and genetic diversity in marine fish (Miguel et al., 2020). In the present study, the analyses of mtDNA fragments of large yellow croaker populations revealed high haplotype diversity (HdCOI+Cytb = 0.983) and moderate nucleotide diversity (πCOI+Cytb = 0.0042) in wild populations, which was consistent with a previous study in L. crocea (HdCOI+Cytb = 0.990, πCOI+Cytb = 0.005) and findings in a variety of other marine species along the coast of mainland China, such as L. polyactis (HdCOI = 0.936, πCOI = 0.0043) (Zhang et al., 2017), Lepturacanthus savala (HdCOI = 0.977, πCOI = 0.0037) (Gu et al., 2021) and N. albiflora (HdCOI = 0.697, πCOI = 0.002) (Xu et al., 2012). However, our study reveals that large yellow croaker has always maintained relatively high genetic diversity relative to other marine fish in this region. We suggest that genetic diversity losses have not accompanied the dramatic reduction of large yellow croaker biomass, possibly because the population of L. crocea was very large and widely distributed before the depletion of its resources in the 1980s. The spawning habit of large-scale group gatherings and the non-specificity of spawning grounds of large yellow croaker might also be conducive to maintaining the level of group diversity (Xu and Chen, 2011).
The reduction in the genetic diversity of the cultured population may be due to a founder effect caused by the small number of broodstocks, as previously been reported for in cultured marine fish such as Trachinotus ovatus (Guo et al., 2018) and Acanthopagrus schlegelii (Shan et al., 2020) in mainland China. Among most local fish farmers, the breeding offspring is usually performed from a small number of broodstocks developed from their own farms, and broodstock exchange and replenishment are infrequent. Since there are many breeding farms, it was not possible to obtain samples of all of the breeding stocks to produce an overall picture of the entire cultured population. However, we sampled most of the breeding farms in mainland China and revealed a low level of genetic diversity (πCOI+Cytb = 0.0010∼0.0026), which was significantly (p < 0.01) lower than that of the wild population (Table 1). This was consistent with previous research showing that the genetic diversity of the cultured population of large yellow croaker is evidently lower than that of the wild population using microsatellite markers (Wang et al., 2012). The lower genetic diversity of the cultured populations was also evident based on the fewer private haplotypes found only in cultured populations. As a result of mtDNA analysis, only thirty haplotypes were detected in the cultured population, and only five haplotypes were private (accounting for 0.47% of all individuals). There were five main haplotypes (Hap1, 2, 4, 5, and 8) that accounted for 83% of all individuals, suggesting that the cultured populations experienced a founder effect during the domestication process. Similarly, forty-four haplotypes of nuDNA were detected in the cultured population, with five main haplotypes accounting for 74% of all individuals, while only four haplotypes were private (0.08% of all individuals). The reduction of genetic variability in large yellow croaker caused by founder effect is well documented (Wang et al., 2012), but the effect of the hatchery propagation scale on the genetic variability of the stock is still unknown. In this study, lower levels of genetic diversity in the ZJC population were indicated by lower haplotype numbers relative to the FJC population. Furthermore, four private haplotypes were identified only in the FJC population, and none were identified in the ZJC population. The breeding scale of the FJC population (approximately 97 hatcheries with an annual production of 3 billion fry) is much larger than that of the ZJC population (approximately 13 hatcheries whose annual production is less than 50 million fry), suggesting that numerous independent hatcheries of the FJC population might reduce genetic drift and inbreeding effects in the population and thereby minimize the loss of genetic diversity under artificial breeding.
Although no divergence was found among wild populations, the results of the pairwise FST analysis revealed significant genetic differences between the wild and cultured populations. As in previous studies based on microsatellite (Wang et al., 2012), the genetic diversity of the cultured populations of large yellow croaker evaluated in this study showed an evidently decline compared to those of their wild counterparts. However, the results of SAMOVA and hierarchical structure analysis intriguingly showed that the SSBW population was less divergent from both the FJC and ZJC populations, which means that the SSBW population may be influenced more seriously by hatchery-origin individuals than other wild populations.
Is the Phylogeographical Pattern of the Wild Large Yellow Croaker Population Influenced by Release Activities?
In the past few decades, stock enhancement has been one of the popular approaches for biodiversity conservation and fisheries management, particularly for species showing sharp declines in biomass. However, previous studies have shown that the ecological and genetic effects of hatchery releases are also of real concern because of potential negative impacts on wild populations as well as their adaptivity to varying degrees (Grant et al., 2017) [e.g., Atlantic salmon (Hagen et al., 2020), Salvelinus fontinalis (Marie et al., 2010), A. schlegelii (Shan et al., 2020)]. Although large yellow croaker has become one of the marine fish species cultured at the largest scale for hatchery release in mainland China, our results revealed no significant divergence or population structure among the JSW, ZSW, MZW, MYW, and YXW populations, while the SSBW population showed high genetic relatedness to the cultured population in terms of genetic structure and genetic diversity (Table 1, Figure 3, and Supplementary Figure 5). According to the haplotype composition analysis, the SSBW population showed the highest proportion of shared haplotypes and individuals carrying these haplotypes in comparison with the cultured population, suggesting that the individuals with these shared haplotypes in the SSBW population were more likely to have originated from the cultured population. This implies a significant genetic effect of stock enhancement on the SSBW population but only a slight effect on the other wild populations. Although official statistical data showed that more fry of large yellow croaker were released in the sea near Zhoushan Island than in other areas, including Sansha Bay, our results revealed that Sansha Bay, which is the largest spawning and nursery ground for large yellow croaker with migratory habits, could offer a relatively mild environment for hatchery-reared juveniles to adapt, leading to a higher survival rate. In other words, decades of restocking programs have not achieved unequivocal success in dealing with the intense exploitation of large yellow croaker resources, especially in the sea around Zhoushan Island (or the East China Sea). Hatchery-reared juveniles might not adapt to harsh environments due to the possibility of behavioral deficits caused by domestication and genetic changes during artificial selection, which means domestication, relaxed purifying selection, increased genetic loads and the production of maladapted farmed fish will lead to a selective disadvantage when culture juveniles released in the wild. Interestingly, the SSBW population and the geographically distant populations (JSW, ZSW, and YXW) showed evident differences from each other (Fst > 0.05) but fewer differences from the neighboring MZW and MYW populations (Fst < 0.05), which also implies that hatchery-released individuals might spread to neighboring areas through migration after adapting to a relatively mild environment.
How Can a Trade-Off Allowing the Sustainable Fishery of Large Yellow Croaker Be Achieved?
Stock enhancement should be considered as the last countermeasure in biodiversity conservation and fisheries management due to its potential ecological risk and genetic effects on wild resources (Grant et al., 2017). In view of this study, fishing restrictions and habitat restoration are highly recommended as the best ways to increase the abundance of large yellow croaker without any negative influence, though harvest management is difficult to implement in China. And, if stock enhancement is essential, the size, release time and release location of juveniles raised in the hatchery should match the migrations of wild populations (e.g., feralized juveniles release in the traditional nursery area of large yellow croaker and precise time that matches their breeding season), and the release of hatchery-reared juveniles in a relatively mild environment (e.g., Sansha Bay or other similar environments suitable for released juveniles) that can provide protection and abundant food is important to ensure the effectiveness of stock enhancement. Moreover, it is essential to improve the potential adaptability of hatchery-reared juveniles via broodstock management measures, such as using a large number of broodstocks and replenishing broodstocks with wild individuals while limiting domestication. Because there is no differentiation among wild populations, there is much flexibility in the mixing and matching of cultured and wild populations, but considering the significant loss of genetic diversity and genetic drift observed in the cultured population, the smallest number of generations and offspring with high genetic diversity from wild broodstocks should be preferentially used for supplementation. Last, the effectiveness of stock enhancement and the negative impact of hatchery-wild hybridization on the wild population must be carefully evaluated.
Data Availability Statement
The sequences for this study can be found in the NCBI GenBank (https://www.ncbi.nlm.nih.gov/) with access numbers MZ563589∼MZ564196.
Ethics Statement
The animal study was reviewed and approved by the Animal Research and Ethics Committee of the College of Ocean and Earth Sciences.
Author Contributions
SD designed the research. JY and JM performed the research. JY, HL, XZ, LW, and SD analyzed the data. JY, SD, HL, XZ, and BK wrote the manuscript. All authors revised and approved the final manuscript.
Funding
This work was supported by the National Key Research and Development Program of China (Grant No. 2018YFC1406301) and China Agriculture Research System (CARS-47).
Conflict of Interest
The authors declare that the research was conducted in the absence of any commercial or financial relationships that could be construed as a potential conflict of interest.
Publisher’s Note
All claims expressed in this article are solely those of the authors and do not necessarily represent those of their affiliated organizations, or those of the publisher, the editors and the reviewers. Any product that may be evaluated in this article, or claim that may be made by its manufacturer, is not guaranteed or endorsed by the publisher.
Acknowledgments
We thank Michael M. Miyamoto, Jiafu Liu, and Yongquan Su for their helpful comments about this research. We also thank Liang Miao, Zhaokun Liu, Sunzhong Ye, Yong Liu, XiongFei Wu, Renxie Wu, Xiaoyan Wang, Lihua Jiang, Xiang Zhang, Shifeng Wang, Longshan Lin, and Jia Chen for their assistance with sample collection.
Supplementary Material
The Supplementary Material for this article can be found online at: https://www.frontiersin.org/articles/10.3389/fmars.2021.743836/full#supplementary-material
References
Baldomero, A. Z., José, L. Z. B., Agustín, R. F., Luis, J. G. M., and Itzel, V. V. (2016). Modification of a guanidinium thiocyanate to extract dna from semen for genomic analysis in mammals. Rev. Mex. Cienc. Pecu. 7, 405–413. doi: 10.22319/rmcp.v7i4.4273
Bandelt, H. J., Forster, P., and Röhl, A. (1999). Median-joining networks for inferring intraspecific phylogenies. Mol. Biol. Evol. 16, 37–48. doi: 10.1093/oxfordjournals.molbev.a026036
Bao, B., and Ren, G. (2014). Climatological characteristics and long-term change of SST over the marginal seas of China. Cont. Shelf Res. 77, 96–106. doi: 10.1016/j.csr.2014.01.013
Chen, Q. Z., Zeng, J. N., Liao, Y. B., Gao, A. G., and Yang, H. F. (2005). Temperature tolerance of large yellow croaker, Pseudosciaena crocea (Richardson) associated with summer season. Mar. Sci. Bull. 7, 54–62.
Chinese Fishery Statistical Yearbook (1956–2019). Bureau of Fisheries, Ministry of Agriculture. Beijing: China Agriculture Press.
Diego, D., David, P., Alexey, M. K., Alexandros, S., Benoit, M., and Tomas, F. (2020). ModelTest-NG: a New and Scalable Tool for the Selection of DNA and Protein Evolutionary Models. Mol. Biol. Evol. 37, 291–294. doi: 10.1093/molbev/msz189
Ding, S. X., Mishra, M., Wu, H. H., Liang, S., and Miyamoto, M. M. (2018). Characterization of hybridization within a secondary contact region of the inshore fish, Bostrychus sinensis, in the East China Sea. Heredity 120, 51–62. doi: 10.1038/s41437-017-0011-8
Dupanloup, I., Schneider, S., and Excoffier, L. (2010). A simulated annealing approach to define the genetic structure of populations. Mol. Ecol. 11, 2571–2581. doi: 10.1046/j.1365-294X.2002.01650.x
Durand, J. D., Collet, A., Chow, S., Guinand, B., and Borsa, P. (2005). Nuclear and mitochondrial DNA markers indicate unidirectional gene flow of Indo-Pacific to Atlantic bigeye tuna (Thunnus obesus) populations, and their admixture off southern Africa. Mar. Biol. 147, 313–322. doi: 10.1007/s00227-005-1564-2
Edgar, R. C. (2004). MUSCLE: a multiple sequence alignment method with reduced time and space complexity. BMC Bioinform. 5, 1–19. doi: 10.1186/1471-2105-5-113
Excoffier, L., and Lischer, H. (2010). Arlequin suite ver 3.5: a new series of programs to perform population genetics analyses under linux and windows. Mol. Ecol. Resour. 10, 564–567. doi: 10.1111/j.1755-0998.2010.02847.x
Grant, W. S., Jasper, J., Bekkevold, D., and Adkison, M. (2017). Responsible genetic approach to stock restoration, sea ranching and stock enhancement of marine fishes and invertebrates. Rev. Fish. Biol. Fish. 27, 615–649. doi: 10.1007/s11160-017-9489-7
Gu, S., Yi, M. R., He, X. B., Lin, P. S., Yan, Y. R., Liu, W. H., et al. (2021). Genetic diversity and population structure of cutlassfish (Lepturacanthus savala) along the coast of mainland china, as inferred by mitochondrial and microsatellite DNA markers. Reg. Stud. Mar. Sci. 43:101702. doi: 10.1016/j.rsma.2021.101702
Guo, L., Zhang, N., Yang, J. W., Guo, H. Y., Zhu, K. C., Liu, B. S., et al. (2018). Comprehensive assessment of the genetic diversity and population structure of cultured populations of golden pompano, Trachinotus ovatus (Linnaeus, 1758), by microsatellites. Aquac. Int. 26, 1445–1457. doi: 10.1007/s10499-018-0289-4
Hagen, I. J., Ugedal, O., Jensen, A. J., Lo, H., Holthe, E., Bjøru, B., et al. (2020). Evaluation of genetic effects on wild salmon populations from stock enhancement. ICES J. Mar. Sci. 78, 900–909. doi: 10.1093/icesjms/fsaa235
Han, Z. Q., Xu, H. X., Shui, B. N., Zhou, Y. D., and Gao, T. X. (2015). Lack of genetic structure in endangered large yellow croaker Larimichthys crocea from China inferred from mitochondrial control region sequence data. Biochem. Syst. Ecol. 61, 1–7. doi: 10.1016/j.bse.2015.04.025
Helen, F. Y., Peter, M. K., Rima, W. J., Ruth, H. L., Lindsay, N. K. D., and Danielle, H. D. (2021). Overfishing and habitat loss drive range contraction of iconic marine fishes to near extinction. Sci. Adv. 7:eabb6026. doi: 10.1126/sciadv.abb6026
Huang, Z. Y., Wu, C. W., Su, Y. Q., and Zhang, J. S. (2012). Assessment of genetic differentiation in the large yellow croaker, Pseudosciaena crocea Richardson, and its first hybrid filial generations with AFLP markers. Gene 510, 189–192. doi: 10.1016/j.gene.2012.07.055
Julio, R., Albert, F. M., Carlos, S. D. J., Sara, G. R., Pablo, L., Ramos-Onsins, S. E., et al. (2017). Dnasp 6: dna sequence polymorphism analysis of large data sets. Mol. Biol. Evol. 34, 3299–3302. doi: 10.1093/molbev/msx248
Kim, J. K., Kim, Y. H., Kim, M. J., and Park, J. Y. (2010). Genetic diversity, relationships and demographic history of the small yellow croaker, Larimichthys polyactis (Pisces: Sciaenidae) from Korea and China inferred from mitochondrial control region sequence data. Anim. Cells Syst. 14, 45–51. doi: 10.1080/19768351003764973
Kon, T., Pei, L. Y., Ryota, I., Chen, C. Y., Wang, P., Ikuyo, T., et al. (2021). Whole-genome resequencing of large yellow croaker (Larimichthys crocea) reveals the population structure and signatures of environmental adaptation. Sci. Rep. 11, 1–11. doi: 10.1038/s41598-021-90645-1
Li, Y., Han, Z., Song, N., and Gao, T. X. (2013). New evidence to genetic analysis of small yellow croaker (Larimichthys polyactis) with continuous distribution in China. Biochem. Syst. Ecol. 50, 331–338. doi: 10.1016/j.bse.2013.05.003
Liu, J. X., Gao, T. X., Wu, S. F., and Zhang, Y. P. (2007). Pleistocene isolation in the Northwestern Pacific marginal seas and limited dispersal in a marine fish, Chelon haematocheilus (Temminck & Schlegel, 1845). Mol. Ecol. 16, 275–288. doi: 10.1111/j.1365-294X.2006.03140.x
Liu, M., Cheng, J. H., Nguyen Van, Q., Sasaki, K., Hoshino, K., Sakai, T., et al. (2020). Larimichthys Crocea. The IUCN Red List of Threatened Species 2020. Switzerland: international Union for Conservation of Nature. doi: 10.2305/IUCN.UK.2020-1.RLTS.T49182559A49239394.en
Liu, M., and Mitcheson, Y. (2008). Profile of a fishery collapse: why mariculture failed to save the large yellow croaker. Fish. Fish. 9, 219–242. doi: 10.1111/j.1467-2979.2008.00278.x
Liu, Q. H., Lin, H. D., Chen, J., Ma, J. K., Liu, R. Q., and Ding, S. X. (2020). Genetic variation and population genetic structure of the large yellow croaker (Larimichthys crocea) based on genome-wide single nucleotide polymorphisms in farmed and wild populations. Fish. Res. 232:105718. doi: 10.1016/j.fishres.2020.105718
Liu, S. Y. V., Huang, I. H., Liu, M. Y., Lin, H. D., Wang, F. Y., and Liao, T. Y. (2015). Genetic stock structure of Terapon jarbua in taiwanese waters. Mar. Coast. Fish. 7, 464–473. doi: 10.1080/19425120.2015.1074966
Marie, A. D., Bernatchez, L., and Garant, D. (2010). Loss of genetic integrity correlates with stocking intensity in brook charr (Salvelinus fontinalis). Mol. Ecol. 19, 2025–2037. doi: 10.1111/j.1365-294X.2010.04628.x
Miguel, G., Jorge, A., Ramos, M. M., and David, A. (2020). Reduced global genetic differentiation of exploited marine fish species. Mol. Biol. Evol. 202038, 1–11. doi: 10.1093/molbev/msaa299
Polzin, T., and Daneschmand, S. V. (2003). On Steiner trees and minimum spanning trees in hypergraphs. Oper Res Lett. 31, 12–20. doi: 10.1016/S0167-6377(02)00185-2
Qiu, F., Li, H., Lin, H. D., Ding, S. X., and Miyamoto, M. M. (2016). Phylogeography of the inshore fish, Bostrychus sinensis, along the Pacific coastline of China. Mol. Phylogenet. Evol. 96, 112–117. doi: 10.1016/j.ympev.2015.11.020
Ronquist, F., Teslenko, M., Van der Mark, P., Ayres, D. L., Darling, A., Hohna, S., et al. (2012). MrBayes 3.2: efficient bayesian phylogenetic inference and model choice across a large model space. Syst Biol. 61, 539–542. doi: 10.1093/sysbio/sys029
Shan, B. B., Liu, Y., Song, N., Ji, D. P., Yang, C. P., Zhao, Y., et al. (2020). Genetic diversity and population structure of black sea bream (Acanthopagrus schlegelii) based on mitochondrial control region sequences: the genetic effect of stock enhancement. Reg. Stud. Mar. Sci. 35:101188. doi: 10.1016/j.rsma.2020.101188
Tian, M. C., Xu, G. Z., and Yu, R. X. (1962). The geographical variation of morphological characters and the problem of geographical populations in the large yellow croaker, Pseudosciaena crocea (Richardson). Stud. Mar. Sin. 2, 79–97.
Wang, L., Shi, X. F., Su, Y. Q., Meng, Z. N., and Lin, H. R. (2012). Loss of genetic diversity in the cultured stocks of the large yellow croaker, Larimichthys crocea, revealed by microsatellites. Int. J. Mol. Sci. 13, 5584–5597. doi: 10.3390/ijms13055584
Wang, L., Shi, X. F., Su, Y. Q., Meng, Z. N., and Lin, H. R. (2013). Genetic divergence and historical demography in the endangered large yellow croaker revealed by mtDNA. Biochem. Syst. Ecol. 46, 137–144. doi: 10.1016/j.bse.2012.09.021
Wang, Z. D., Chen, C., Guo, Y. S., and Liu, C. W. (2014). High sequence variation and low population differentiation of mitochondrial control regions of wild Large yellow croaker in South China Sea. Biochem. Syst. Ecol. 56, 151–157. doi: 10.1016/j.bse.2014.05.019
Wu, X. W., Liu, X. D., Cai, Y. M., Ye, X. J., and Wang, Z. Y. (2011). Genetic analysis of farmed and wild stocks of large yellow croaker Larimichthys crocea by using microsatellite markers. African J. Biotechnol. 10, 5773–5784. doi: 10.5897/AJB10.2475
Xu, D. D., Liu, B., Shi, H. H., Geng, Z., Li, S. L., and Zhang, Y. R. (2012). Genetic diversity and population structure of Nibea albiflora in the china sea revealed by mitochondrial COI sequences. Biochem. Syst. Ecol. 45, 158–165. doi: 10.1016/j.bse.2012.07.028
Xu, G. Z., Luo, B. Z., and Wang, K. L. (1962). The geographical variation of the population structure in the large yellow croaker, Pseudosciaena crocea (Richardson). Stud. Mar. Sin. 2, 98–109.
Xu, Z. L., and Chen, J. J. (2011). Analysis of migratory route of Larimichthys crocea in the East China Sea and yellow sea. J. Fish. China. 35, 429–437. doi: 10.3724/SP.J.1011.2011.00415
Keywords: Larimichthys crocea, mitochondrial DNA, nuclear DNA, stock enhancement, genetic effect, population structure
Citation: Yuan J, Lin H, Wu L, Zhuang X, Ma J, Kang B and Ding S (2021) Resource Status and Effect of Long-Term Stock Enhancement of Large Yellow Croaker in China. Front. Mar. Sci. 8:743836. doi: 10.3389/fmars.2021.743836
Received: 19 July 2021; Accepted: 09 August 2021;
Published: 07 September 2021.
Edited by:
Hui Zhang, Institute of Oceanology, Chinese Academy of Sciences (CAS), ChinaReviewed by:
Yahui Zhao, Institute of Zoology, Chinese Academy of Sciences (CAS), ChinaYuan Li, Third Institute of Oceanography, State Oceanic Administration, China
Copyright © 2021 Yuan, Lin, Wu, Zhuang, Ma, Kang and Ding. This is an open-access article distributed under the terms of the Creative Commons Attribution License (CC BY). The use, distribution or reproduction in other forums is permitted, provided the original author(s) and the copyright owner(s) are credited and that the original publication in this journal is cited, in accordance with accepted academic practice. No use, distribution or reproduction is permitted which does not comply with these terms.
*Correspondence: Shaoxiong Ding, c3hkaW5nQHhtdS5lZHUuY24=
†These authors have contributed equally to this work