 Dong-Xiu Xue
 Hai-Yan Wang3,4
 Tao Zhang
- 1CAS Key Laboratory of Marine Ecology and Environmental Sciences, Institute of Oceanology, Chinese Academy of Sciences, Qingdao, China
- 2Laboratory for Marine Ecology and Environmental Science, Qingdao National Laboratory for Marine Science and Technology, Qingdao, China
- 3Center for Ocean Mega-Science, Chinese Academy of Sciences, Qingdao, China
- 4Laboratory of Marine Organism Taxonomy and Phylogeny, Institute of Oceanology, Chinese Academy of Sciences, Qingdao, China
Phylogeographic studies contribute to addressing questions regarding the geographic patterns and evolutionary scenarios within and among species and also shed light on the taxonomic status of widely distributed species complexes. The pen shell Atrina pectinata species complex is a widely distributed and economically important bivalve in the northwestern Pacific. Previous phylogeographic studies have identified four genetically distinct cryptic species within the A. pectinata species complex along the coast of China, of which three cryptic species were distributed in the South China Sea. However, less attention has been given to their identification and delimitation. Herein, we report the phylogeography and taxonomic revision of the A. pectinata species complex in the South China Sea using DNA sequence data from mitochondrial cytochrome oxidase I (COI) and 16S ribosomal RNA (16S rRNA), and nuclear 28S ribosomal RNA (28S rRNA) gene markers. Using a combination of phylogenetic and DNA-based species delimitation analysis methods, we found strong support for four genetically valid species in the A. pectinata species complex and defined them as A. japonica, A. lischkeana, Atrina sp., and A. pectinata based on our results as well as on previous morphological and genetic studies. A demographic historical analysis showed that all three species in the South China Sea had populations that were relatively stable over time and then subjected to sudden expansion during the late Pleistocene (60,000–90,000 years ago). These results provide new insights into the systematics and evolution of the A. pectinata species complex and have important conservation and management implications.
Introduction
Species identification and delimitation are fundamentally important within the fields of biology, biogeography, ecology, and conservation, as species are the fundamental units for biodiversity quantification and management (Agapow et al., 2004; Bickford et al., 2007; Liu et al., 2020). Historically, species identification and delimitation have been performed by taxonomists using morphological characteristics; these processes require a high level of expertise and are time consuming. However, many diverse groups are morphologically cryptic and contain many undescribed taxa, and the existing taxonomic literature is conflicting (Bickford et al., 2007). Molecular analytical approaches (e.g., DNA barcoding) have been developed to identify and delimit species and are now used to resolve many taxonomic problems associated with different animals and plant species (Wiens and Servedio, 2000; Goldstein and DeSalle, 2011; Previšić et al., 2016; Sun et al., 2016; Liu et al., 2020). Several methods have been provisionally designed to assess species status based on DNA sequences, including automatic barcode gap discovery (ABGD) (Puillandre et al., 2012), the generalized mixed Yule coalescent model (GMYC) (Fujisawa and Barraclough, 2013), Bayesian Poisson tree processes (bPTP) (Zhang et al., 2013), and Bayesian phylogenetics and phylogeography (BPP) (Yang and Rannala, 2010; Yang, 2015).
The family Pinnidae Leach, 1819, includes approximately 50 species of commercially important subtidal and coastal species that inhabit tropical and temperate coastal oceanic waters worldwide (Huber, 2010; Lemer et al., 2014). The taxonomy of the family has been subjected to a number of revisions since the early 20th century, and the overall number of valid species ranges from 21 to 175 in various reports (Lemer et al., 2014). Atrina pectinata Linnaeus, 1767, one of the most diverse Pinnidae species, is a large wedge-shaped marine bivalve distributed along the coasts of Indo-Pacific countries. The taxonomy of A. pectinata in East Asia has been complicated because of its shell morphology and lack of unified morphological characteristics (Hashimoto et al., 2018). Since the first description of this species in 1767, the nomenclature of A. pectinata has been confusing: Rosewater (1961) assigned 12 distinct Indo-Pacific Atrina species to a single A. pectinata species, Wang (1997) assigned 11 synonymous names to A. pectinata, and Huber (2010) assigned only three synonymous names to A. pectinata.
In China, five morphologic A. pectinata forms exist within the current concept of A. pectinata (hereafter the “A. pectinata species complex”) (Wang, 1997; Yu et al., 2000; Liu et al., 2011). However, debate as to whether the present species should be divided to two or more species or subspecies have lasted for years (Yu et al., 2004; Huber, 2010; Liu et al., 2011; Lemer et al., 2014). Liu et al. (2011) identified five genetically distinct cryptic species (lineage 1-lineage 5) within the A. pectinata species complex along the coast of China. Lineage 1 (nonscaly form) is mainly distributed along the coasts of North China, South Korea and Japan and has been identified as A. japonica (Huber, 2010) and A. pectinata japonica (Kim et al., 2017). Lineage 2-lineage 5 are often sympatric in southern Chinese coastal areas and correspond to four morphological types (thorny, green, yellow, and scabrous pen shells) (Yu et al., 2000). Analyses of their morphological characteristics, isoenzymes, random amplified polymorphic DNA (RAPD) and mitochondrial COI sequences have provided evidence of obvious differences among these forms in the South China Sea (Wang et al., 2000; Yu et al., 2000, 2004, 2019; Liu et al., 2011). This evidence strongly implied that extensive morphological work and molecular work are necessary to clarify the taxonomic status of the A. pectinata species complex and suggest that there is less phenotypic plasticity in A. pectinata than previously thought. However, less attention has been given to their identification and delimitation. Lineage 2 (the thorny form) has been called Ken-type in Japan and is thought to be A. lischkeana (Huber, 2010) or A. pectinata lischkeana (Kim et al., 2017; Hashimoto et al., 2018). The morphological and genetic characteristics of lineage 4 (the yellow form) match those of A. pectinata Linnaeus, which is restricted to Indonesia in the Indian Ocean (Huber, 2010; Lemer et al., 2016). Lineage 5 (the scabrous form) has been identified as A. chinensis through the investigation of morphological and genetic data (Xue et al., 2012). However, lineage 3 (the green form) was only reported as one morphological type of A. pectinata distributed in South China Sea (Yu et al., 2000, 2004). As one of the most ecologically and economically valuable marine bivalves, unstable nomenclature could cause management aberrations, so there is an urgent need for species identification and delimitation to support the protection and management of this important bivalve species.
In the present study, we collected 211 individuals of the A. pectinata species complex from the South China Sea and used phylogenetic analyses based on mitochondrial cytochrome oxidase I (mtCOI) and 16S ribosomal RNA (mt16S rRNA), and nuclear 28S ribosomal RNA (nr28S rRNA) gene markers from these samples to answer three major questions: (1) Should these four cryptic species (lineage 1 – lineage 4) within the A. pectinata species complex be recognized as distinct taxonomic entities? (2) What are the evolutionary relationships among these three cryptic species (lineage 2 – lineage 4) in the South China Sea? (3) Do the three sympatric cryptic species in the South China Sea (lineage 2 – lineage 4) have similar phylogeographic patterns and demographic histories? Their resolution would provide useful information for definite identification and delimitation of the A. pectinata species complex, and developing appropriate conservation and management strategies for the A. pectinata species complex in China, and help reveal the biogeographic history of the studied region.
Materials and Methods
Sample Collection and Sequencing
A total of 211 individuals of the A. pectinata species complex were collected from 15 sites in southern China from 2010 to 2019 (Figure 1 and Table 1). Hereafter, we defined lineage 1–lineage 4 described in Liu et al. (2011) as four putative species: A. japonica, A. lischkeana, Atrina sp., and A. pectinata, respectively (Figure 2). Adductor muscle samples were taken from each individual and preserved in absolute ethyl alcohol. Genomic DNA was isolated from the ethanol-fixed adductor muscle tissue using the TIANamp Marine Animals DNA Kit (Tiangen; Beijing, China). PCR amplification of three target gene fragments (nr28S rRNA, mtCOI, and 16S rRNA) was performed using the universal nr28S primers D1F and D6R (Park and Foighil, 2000), mtCOI primers LCO1490 and HCO2198 (Folmer et al., 1994), and mt16S primers 16Sar and 16Sbr (Kessing et al., 1989). The mtCOI gene was amplified in 211 individuals, while the nr28S rRNA segment and mt16S rRNA segment were amplified in a subset of individuals (nr28S rRNA: n = 44, mt16S rRNA: n = 52). Reactions were performed in 50 μl with final concentrations of 2.0 mM MgCl2, 150 μM of each dNTP, 0.2 μM of each primer, 20 ng template DNA, 2.5 U Taq polymerase (TaKaRa; Dalian, China), and 5 μl 10 × buffer. The fragments were amplified under the following conditions: initial denaturing at 95°C for 5 min; 30 cycles of 95°C for 1 min, 58°C (nr28S rRNA), 50°C (mtCOI), 48°C (mt16S rRNA) for 1 min, and 72°C for 1 min; and a final extension at 72°C for 5 min. A negative control (no template) was included during each PCR run. The PCR products were purified using the TIANgel Midi Purification Kit (Tiangen; Beijing, China). All amplified DNA fragments were sequenced in both directions using the same PCR primers on an ABI3730 XL DNA Sequencer. Additionally, mtCOI sequences of 117 individuals collected from 6 locations along the coast of the South China Sea (Liu et al., 2011) were retrieved from GenBank (Table 1 and Figure 1), and three gene fragments for A. chinensis, A. japonica, A. exusta, A. inflata, A. rigida, and A. vexillum, and Pinna bicolor were retrieved from GenBank.
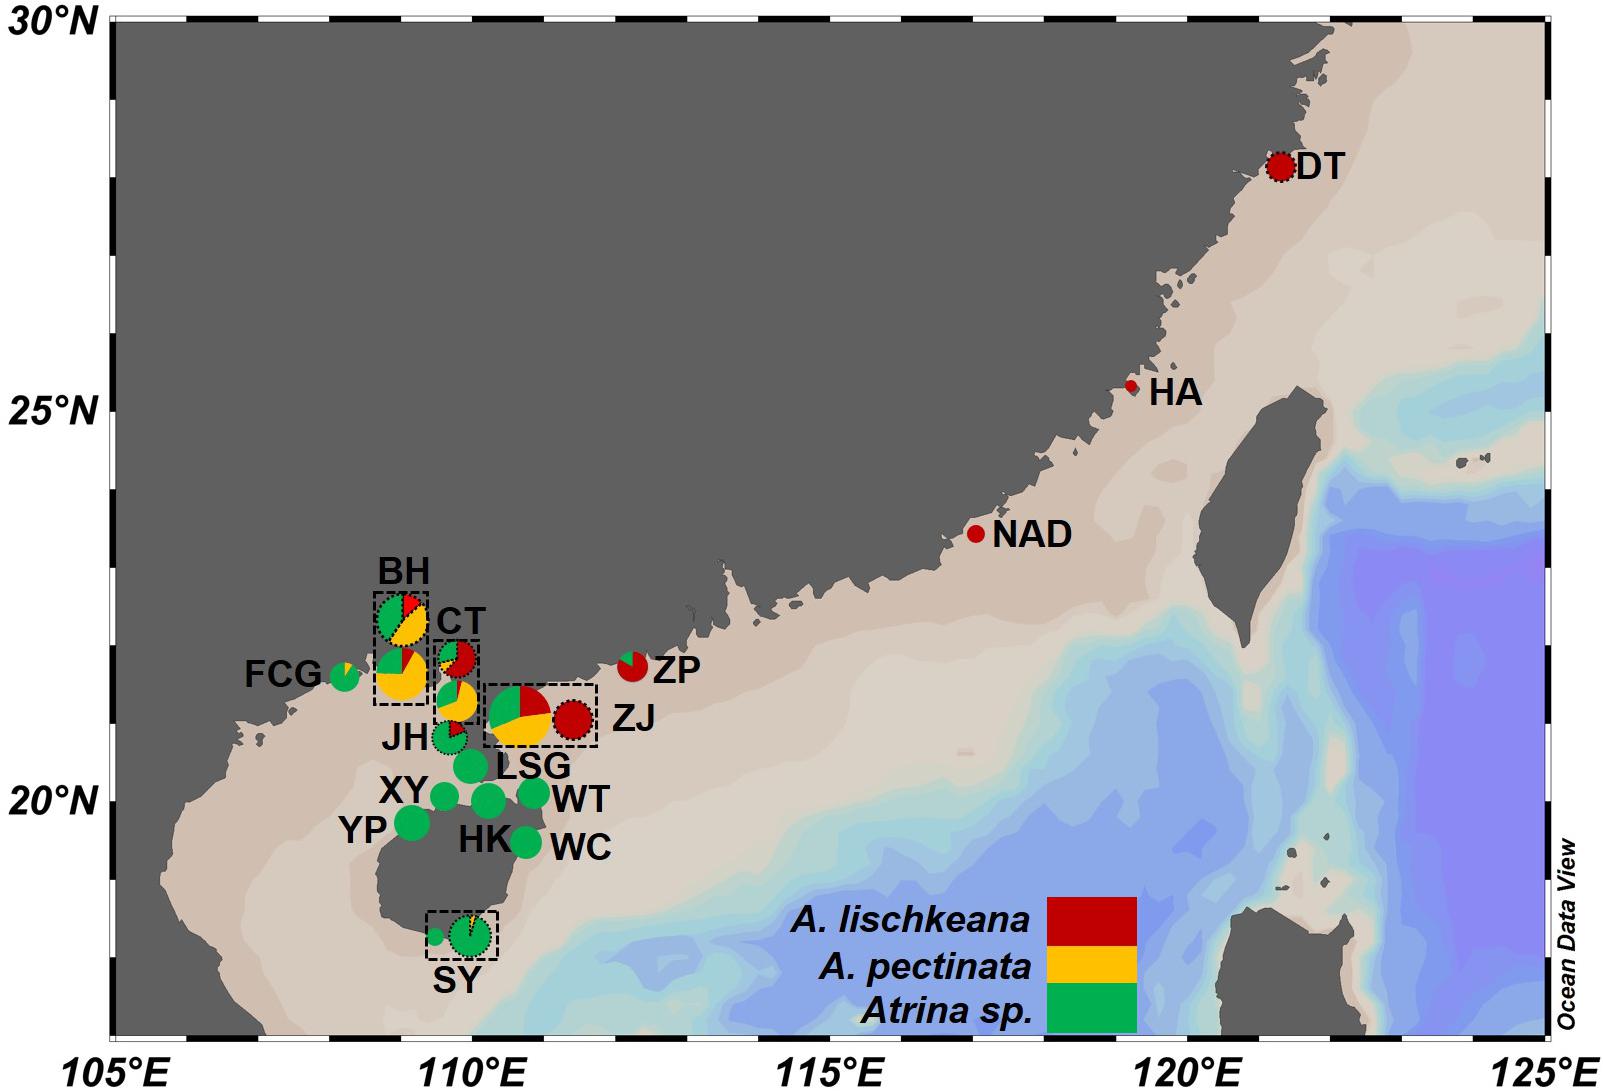
Figure 1. Map of the sampling localities and distribution of the three putative species in the A. pectinata species complex along the coasts of southern China. Sampling sites are labeled with abbreviations in Table 1. The accompanying pie charts with different colors indicate their topological placement among the three putative species for each locality. Dotted circles of sampling localities showed that the sequences of these populations were retrieved from GenBank.
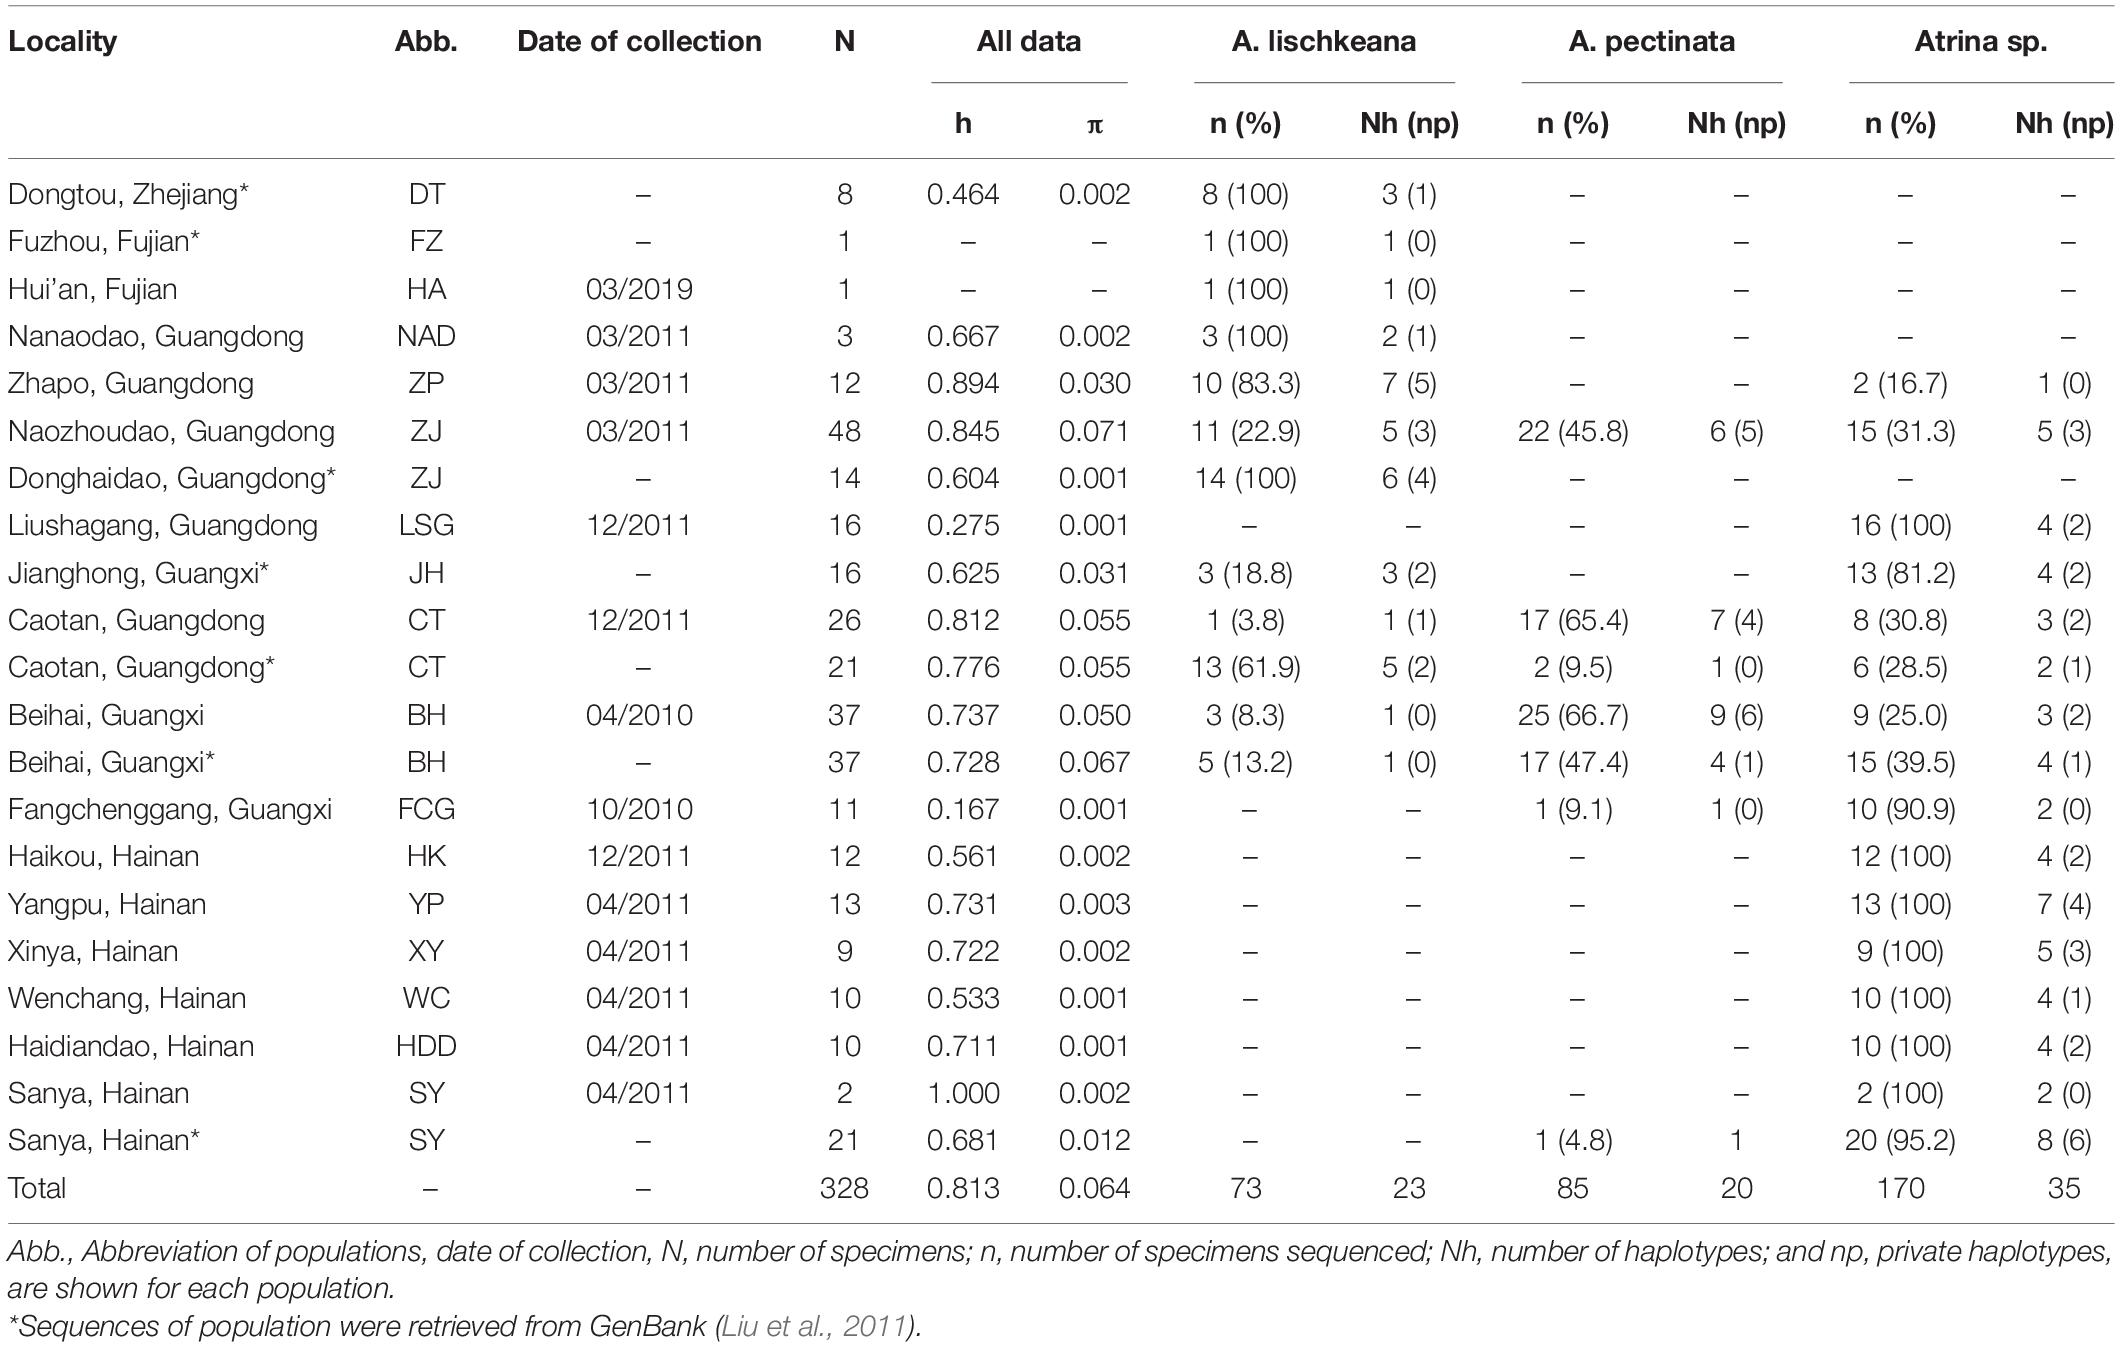
Table 1. Sampling information and molecular diversity indices for mtCOI sequences.
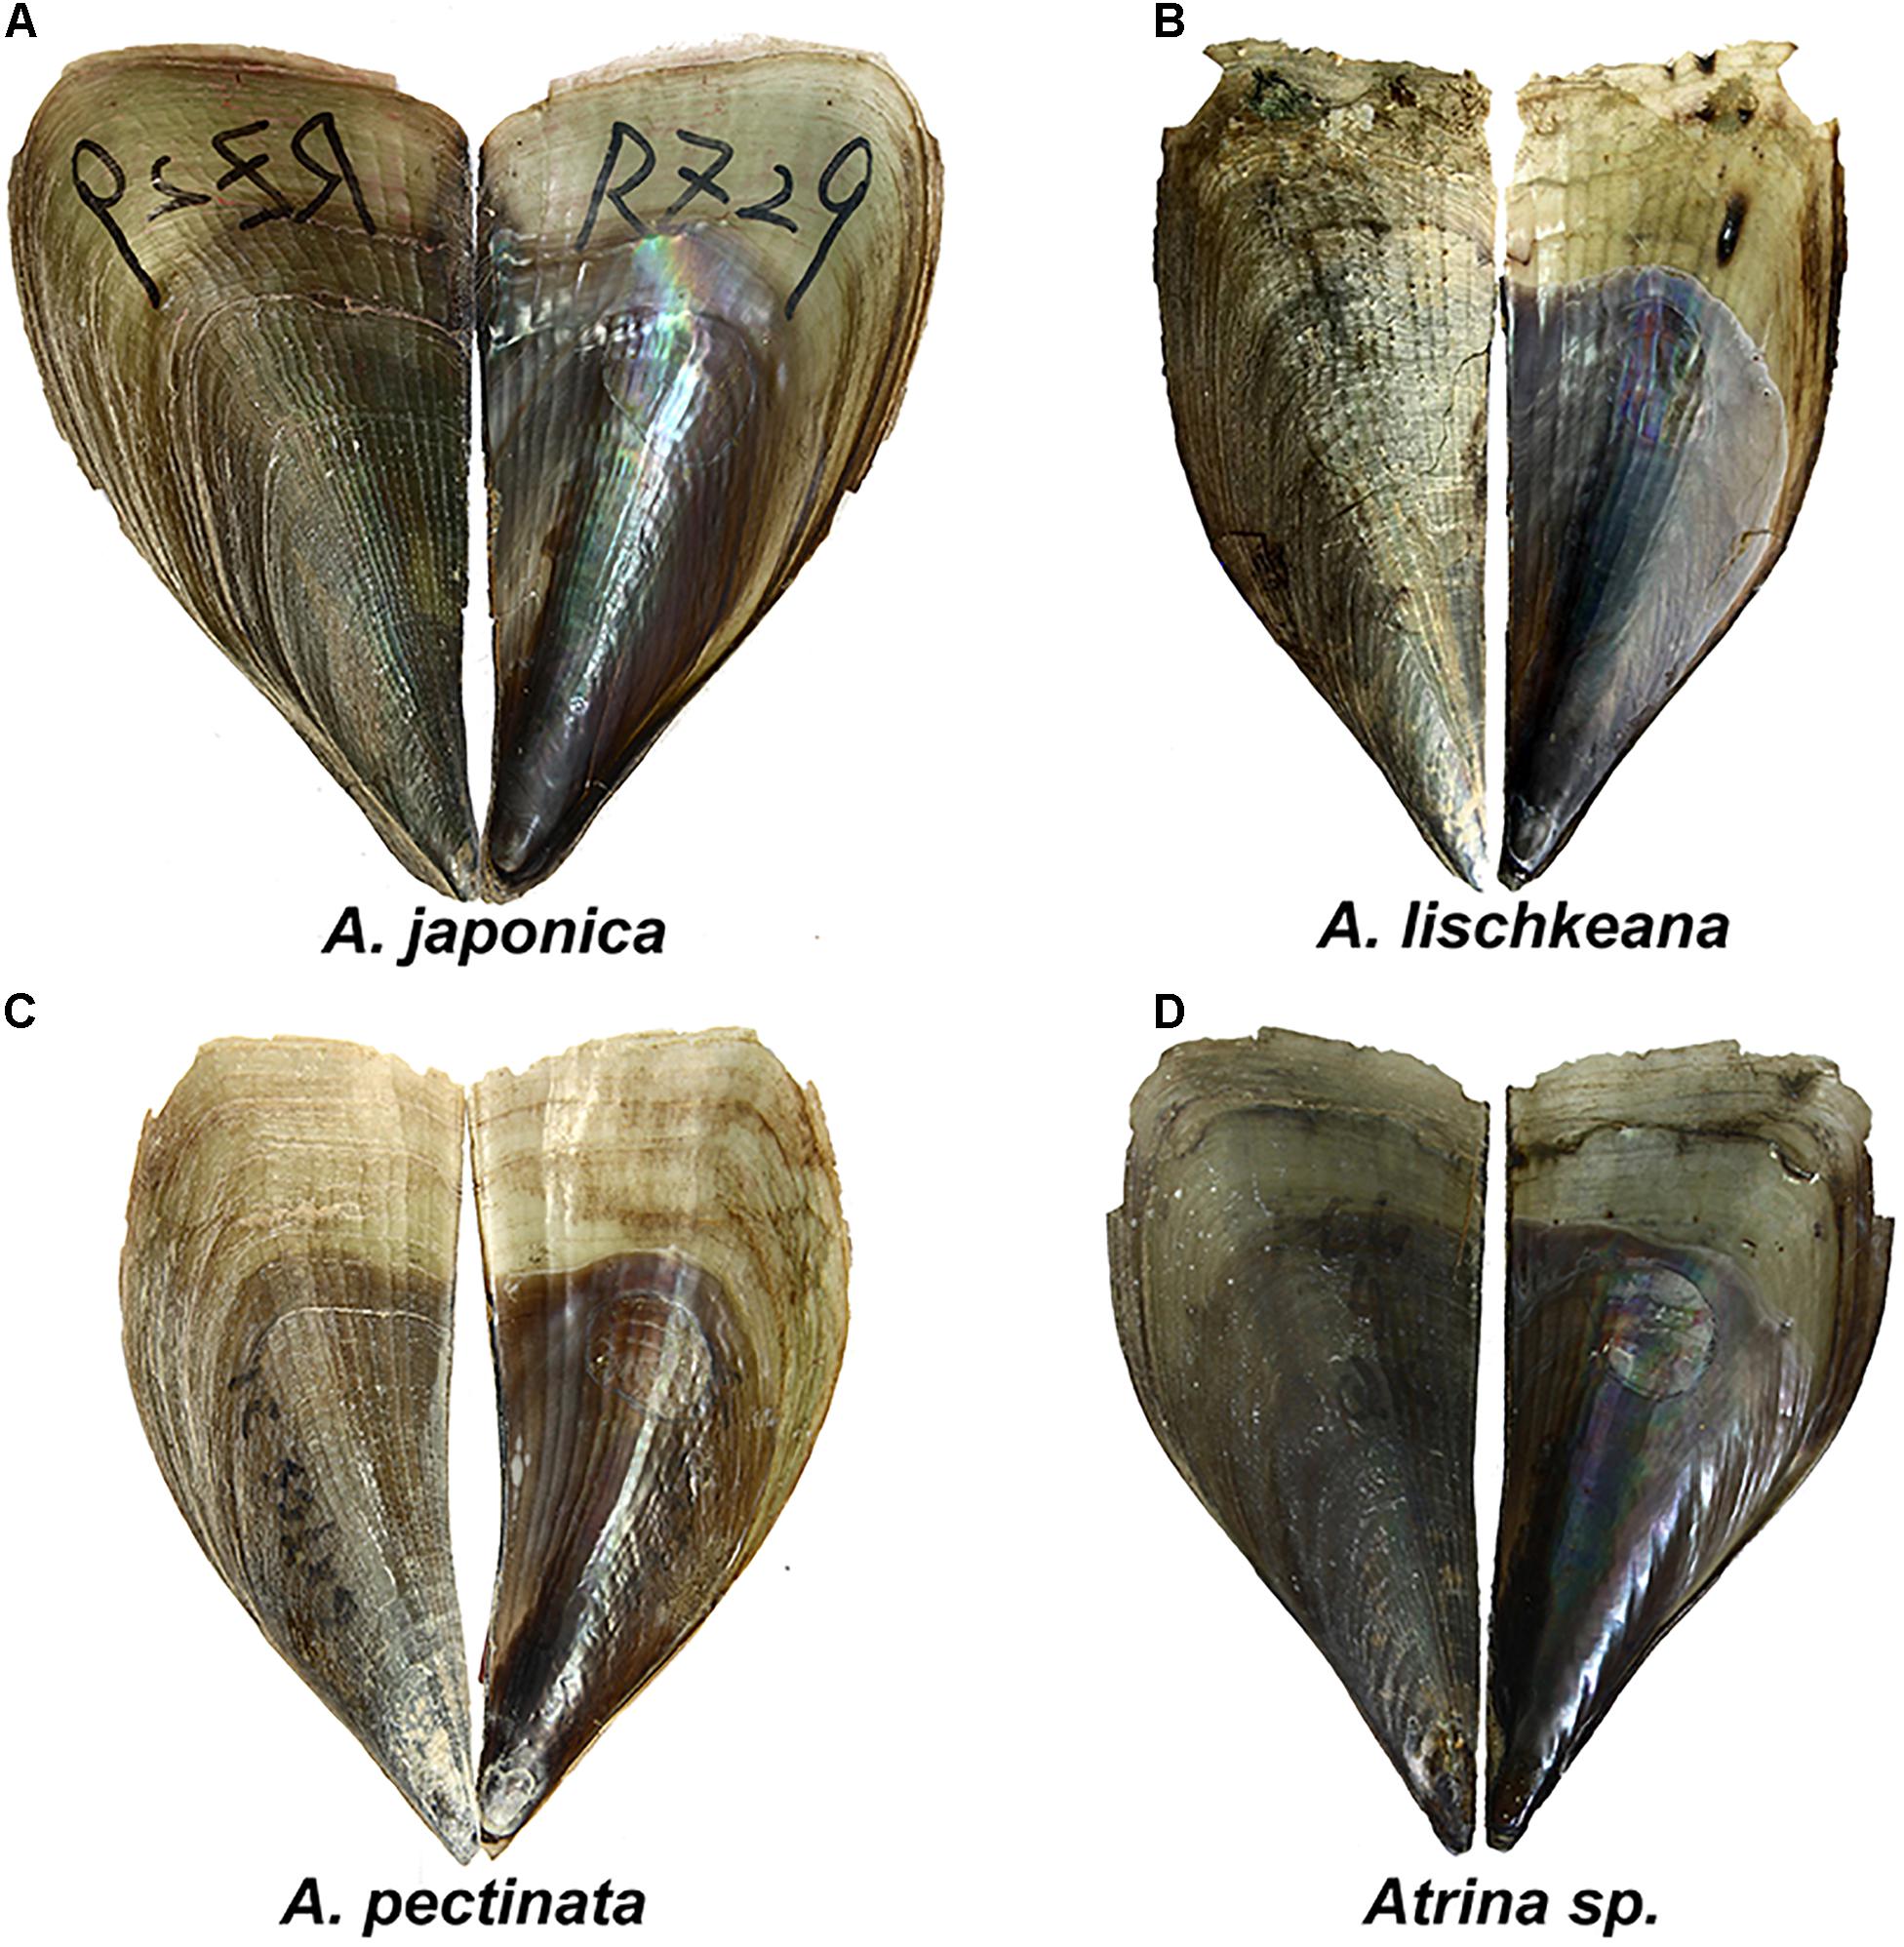
Figure 2. Shell morphology of (A) A. japonica, (B) A. lischkeana, (C) A. pectinata, and (D) Atrina sp. Scale bar = 20 mm.
Sequence Analyses
Initial alignments were performed using CLUSTAL X2 (Larkin et al., 2007). The sequences were trimmed to the same length with other published sequences after alignment. Molecular diversity indices such as the haplotype diversity (h) and nucleotide diversity (π) of the nr28S rRNA, mtCOI, and mt16S rRNA sequences were calculated in DnaSP 6.12 (Rozas et al., 2017).
Species Delimitation
We applied the ABGD, bPTP, and GMYC methods to test species delimitations using the mtCOI haplotype dataset of A. pectinata species complex. The ABGD method clusters sequences into hypothetical species based on differences between intra- and interspecific distance variations (Puillandre et al., 2012). The ABGD analysis was conducted using the online ABGD server1 under the default parameters. The input tree required for bPTP analyses was generated using MrBayes 3.2 (Ronquist et al., 2012). The bPTP analysis is implemented in an online web server2 using default model. For the GMYC model (Bouckaert et al., 2019), the ultrametric tree was constructed in BEAST v2.6.3 (Bouckaert et al., 2019) using a Yule pure birth model tree prior. An uncorrelated relaxed lognormal clock model was used with lognormal relaxed distribution. The MCMC length was 100,000,000 generations with log parameters every 10000 generations. The evaluation of ESS values (>200) and trace files of runs were performed in Tracer v1.6. A maximum clade credibility consensus tree was performed obtained in TreeAnnotator v2.6.3. Single-threshold GMYC analyses were carried out in R studio using the splits packages (Ezard et al., 2009). We used the Bayesian Phylogenetics and Phylogeography (BP&P v3.4) program (Yang, 2015) with the three DNA sequence datasets to validate the number of putative species based on the ABGD, bPTP, and GMYC results. The A10 analysis (species delimitation using a guide tree) was repeated twice, with 1,000,000 rjMCMC generations, a burn-in of 8,000, and sampling intervals of 2. The guide tree used for species delimitation was obtained from phylogenetic analyses (of NJ, ML, and BI gene trees) (Yang, 2015). The species validation was based on the posterior probability value of the species assignment, which indicated the statistical validity of the species.
Phylogenetic Analyses
The nucleotide sequences obtained in this study and those of other pen shell species used for phylogenetic analyses are available from GenBank, and their accession numbers are shown in Supplementary Table 1. P. bicolor (Pinnidae) was used as the outgroup. The best substitution models for the three gene datasets to be used in the phylogenetic analyses were selected based on the Akaike Information Criterion (AIC) with the program Modeltest 3.7 (Posada and Crandall, 1998). Bayesian inference (BI) trees were estimated using MrBayes 3.2 (Ronquist et al., 2012) for 10,000,000 generations with a sample frequency of 1000 generations and an initial burn-in of 100,000. Maximum likelihood (ML) analysis was performed using the PhyML 3.0 program (Guindon et al., 2010). Neighbor-joining (NJ) analyses were conducted using PAUP 4.0b1.0 (Swofford, 2002). The reliability of the internal branches of the NJ and ML trees was estimated with bootstrap values of 1,000 replicates. In addition, the genetic relationships among the haplotypes of the mtCOI genes were further assessed using a minimum spanning tree (Bandelt et al., 1999) constructed by PopART-1.73. The pairwise sequence divergences and the net average genetic distances among species were calculated with MEGA 6.06 (Tamura et al., 2013) using Kimura’s two-parameter model (K2P) (Kimura, 1980). In the absence of a clear fossil or geological record, we used mtCOI divergence rates estimated for molluscan species from 0.7% to 2.4% per million years (Myr) (Liu et al., 2011) to assess conservatively a range of dates for key nodes in the mtCOI phylogenetic tree COI.
Population Genetic Structure
To investigate genetic differentiation among populations within the three putative species in South China Sea, analysis of molecular variance (AMOVA) was performed for the mtCOI data using Arlequin3.5 (Excoffier and Lischer, 2010) with 10,000 permutations. AMOVA analyses were conducted with three groups for Atrina sp., the Guangdong group, Hainan group, and Beibu Gulf group, and with two groups for A. lischkeana and A. pectinata, the Guangdong group and Beibu Gulf group. The pairwise genetic divergence values between populations of the three putative species in South China Sea were estimated using FST values for mtCOI sequences with Arlequin3.5 (Excoffier and Lischer, 2010), and the significance was adjusted using sequential Bonferroni corrections (Narum, 2006).
Demographic History
Inferences on the historical demographic history of the three putative species in South China Sea were obtained using neutrality tests, mismatch distributions, and Bayesian skyline plots based on the mtCOI sequences. For the neutrality test, Tajima’s D test (Tajima, 1989) and Fu’s Fs test (Fu, 1997) were calculated using Arlequin3.5 (Excoffier and Lischer, 2010) with 10,000 permutations. A mismatch distribution was constructed for each geographic population to test the exponential population growth model (Rogers and Harpending, 1992). A goodness of fit test was performed to test the validity of the sudden expansion model using a parametric bootstrap approach based on the sum of square deviations (SSD) between the observed and expected mismatch distributions. The raggedness index (RI), which measures the smoothness of the mismatch distribution, was calculated for each distribution. The demographic expansion parameter (τ) was calculated with Arlequin3.5 (Excoffier and Lischer, 2010). The changes in the effective population size of the three lineages with time were also inferred using the Bayesian Skyline method (Ho and Shapiro, 2011) implemented in the BEAST1.7.5 program (Drummond et al., 2012) with 20 groups. Chains were run for 100 million steps to yield effective sample sizes (ESSs) of at least 200, and the first 10% were discarded as “burn-in” under the HKY substitution model (A. lischkeana and A. pectinata) or the GTR substitution model (Atrina sp.) from Modeltest 3.7 (Posada and Crandall, 1998), a strict molecular clock and a stepwise skyline model. All operators were automatically optimized. The results of the analyses were visualized using Tracer 1.5 (Rambaut and Drummond, 2007).
Results
Species Delimitation
The ABGD method clustered the sequences into four groups that were congruent with the four clades inferred in the phylogenetic analyses, representing four putative species: A. japonica, A. lischkeana, Atrina sp., and A. pectinata. These four groups were inferred for a prior maximal distance P ≥ 0.0599 independent of the relative width of the barcoding gap (X-value) or prior specified P range (Supplementary Figure 1). The bPTP model suggested that the estimated number of species is four (Supplementary Figure 2). Using the GMYC approach, the null model of a single species was rejected for mtCOI genes (likelihood ratios for single threshold model: 63.09 (P = 1.99 × 10⁻¹⁴), and indicated four clusters (Supplementary Figure 3). The results of the Bayesian species delimitation based on the three DNA sequence datasets strongly supported that the four major clades defined by the phylogenetic analyses represented four different species, which was congruent with the ABGD, bPTP, and GMYC analyses. Similar results were obtained using different prior distribution sets for θ and τ0. In summary, the results of ABGD, bPTP, GMYC, and BPP analyses supported the validity of A. japonica, A. lischkeana, Atrina sp., and A. pectinata as their own taxonomic units instead of as synonyms of A. pectinata.
Sequence Variations
Three haplotypes defined by six polymorphic sites were detected among the 44 nr28S rRNA sequences. Each of A. lischkeana, Atrina sp., and A. pectinata samples had only one 1060-bp-long haplotype (Table 2). The nr28S rRNA sequences of A. lischkeana were exactly the same as those of A. japonica. However, four variable sites were detected between A. lischkeana and Atrina sp., three variable sites were detected between A. lischkeana and A. pectinata, and six variable sites were detected between Atrina sp. and A. pectinata. The overall haplotype diversity (h) and nucleotide diversity (π) values of the 44 sequences were 0.729 and 0.0036, respectively.
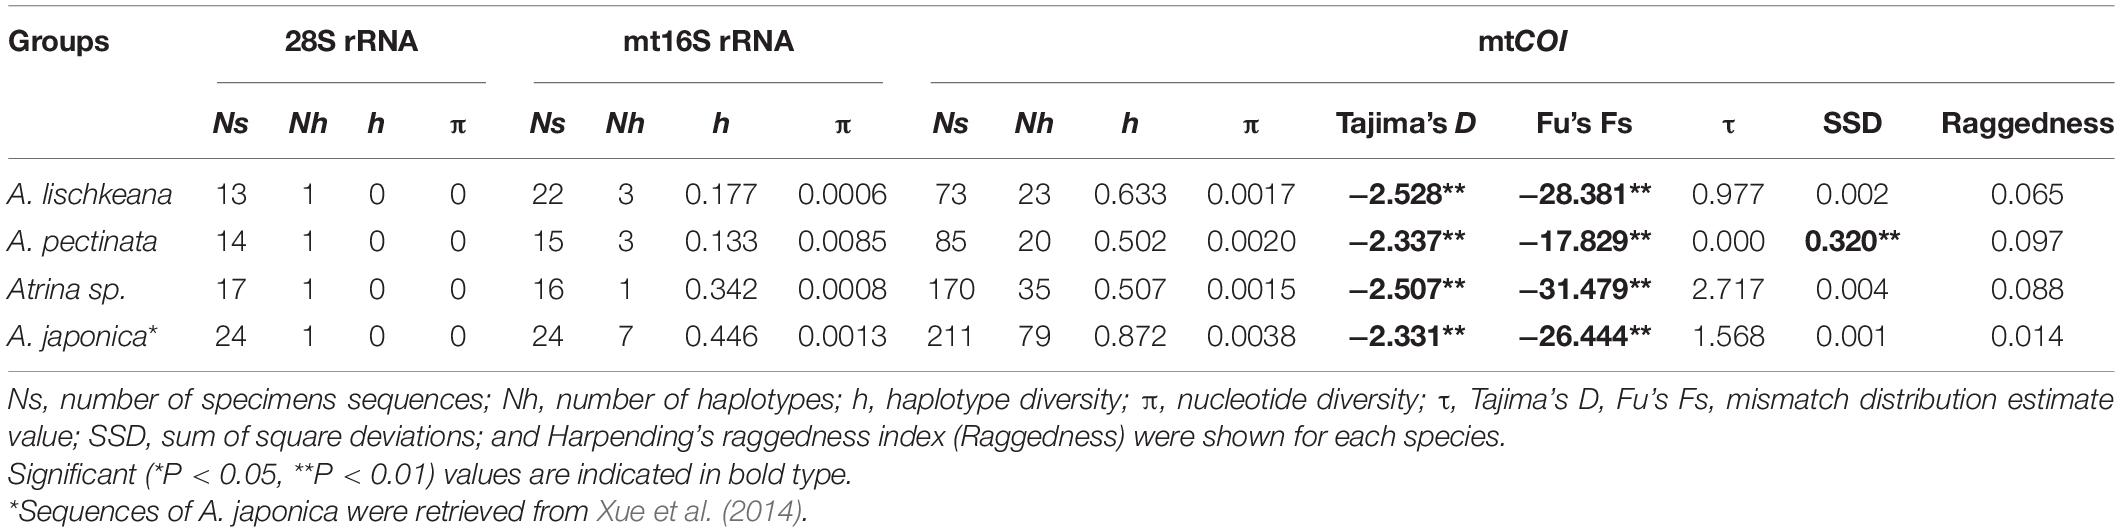
Table 2. Summary of molecular diversity of 28S rRNA, mt16S rRNA, and mtCOI and results of population expansion tests based on mtCOI for various species of A. pectinata species complex.
A 625-bp fragment of the mtCOI gene sequenced for the 211 pen shells along with 117 sequences obtained from GenBank generated 77 haplotypes (Table 2). Twenty-three haplotypes were observed for 73 individuals of A. lischkeana, 20 haplotypes were observed for 85 individuals of A. pectinata, and 35 haplotypes were observed for 170 individuals of Atrina sp. Nucleotide variations were found in 131 base loci, of which 107 were parsimony informative in the mtCOI dataset. Totals of 56, 36, and 39 variable sites were detected between the mtCOI sequences of A. lischkeana and those of A. pectinata, Atrina sp. and A. japonica, respectively. Forty-six, 51, and 53 variable sites were detected between Atrina sp. and A. pectinata, between Atrina sp. and A. japonica and between A. pectinata and A. japonica, respectively. The overall h and π values were 0.813 and 0.064, respectively.
The sequences of the mt16S rRNA region amplicons from the 52 pen shell individuals were 458 bp in length. Of the seven haplotypes obtained, A. lischkeana had 3 haplotypes, A. pectinata had 3 haplotypes, and Atrina sp. had 1 haplotype (Table 2). In the mt16S rRNA dataset, 38 sites were variable, of which 37 sites were parsimony informative. Totals of 24, 19, and 10 variable sites were detected between the mt16S rRNA sequences of A. lischkeana and those of A. pectinata, Atrina sp. and A. japonica, respectively. Twenty-seven, 18, and 24 variable sites were detected between Atrina sp. and A. pectinata, between Atrina sp. and A. japonica and between A. pectinata and A. japonica, respectively. The overall h and π values were 0.729 and 0.036, respectively.
Phylogenetic Analysis
The program Modeltest3.7 selected TRN + I (0.4076), HKY + I (0.5503) +G (0.4487), GTR + I (0.5370) +G as the best models based on the AIC for the nr28S rRNA, mtCOI and 16S rRNA datasets, respectively. Phylogenetic analyses of the three DNA markers conducted using the BI, NJ, and ML procedures produced almost identical results (Figures 3–5). A. lischkeana and A. japonica formed one robust subclade and then formed a robust clade with A. pectinata and Atrina sp., which is a sister clade to other Atrina species.
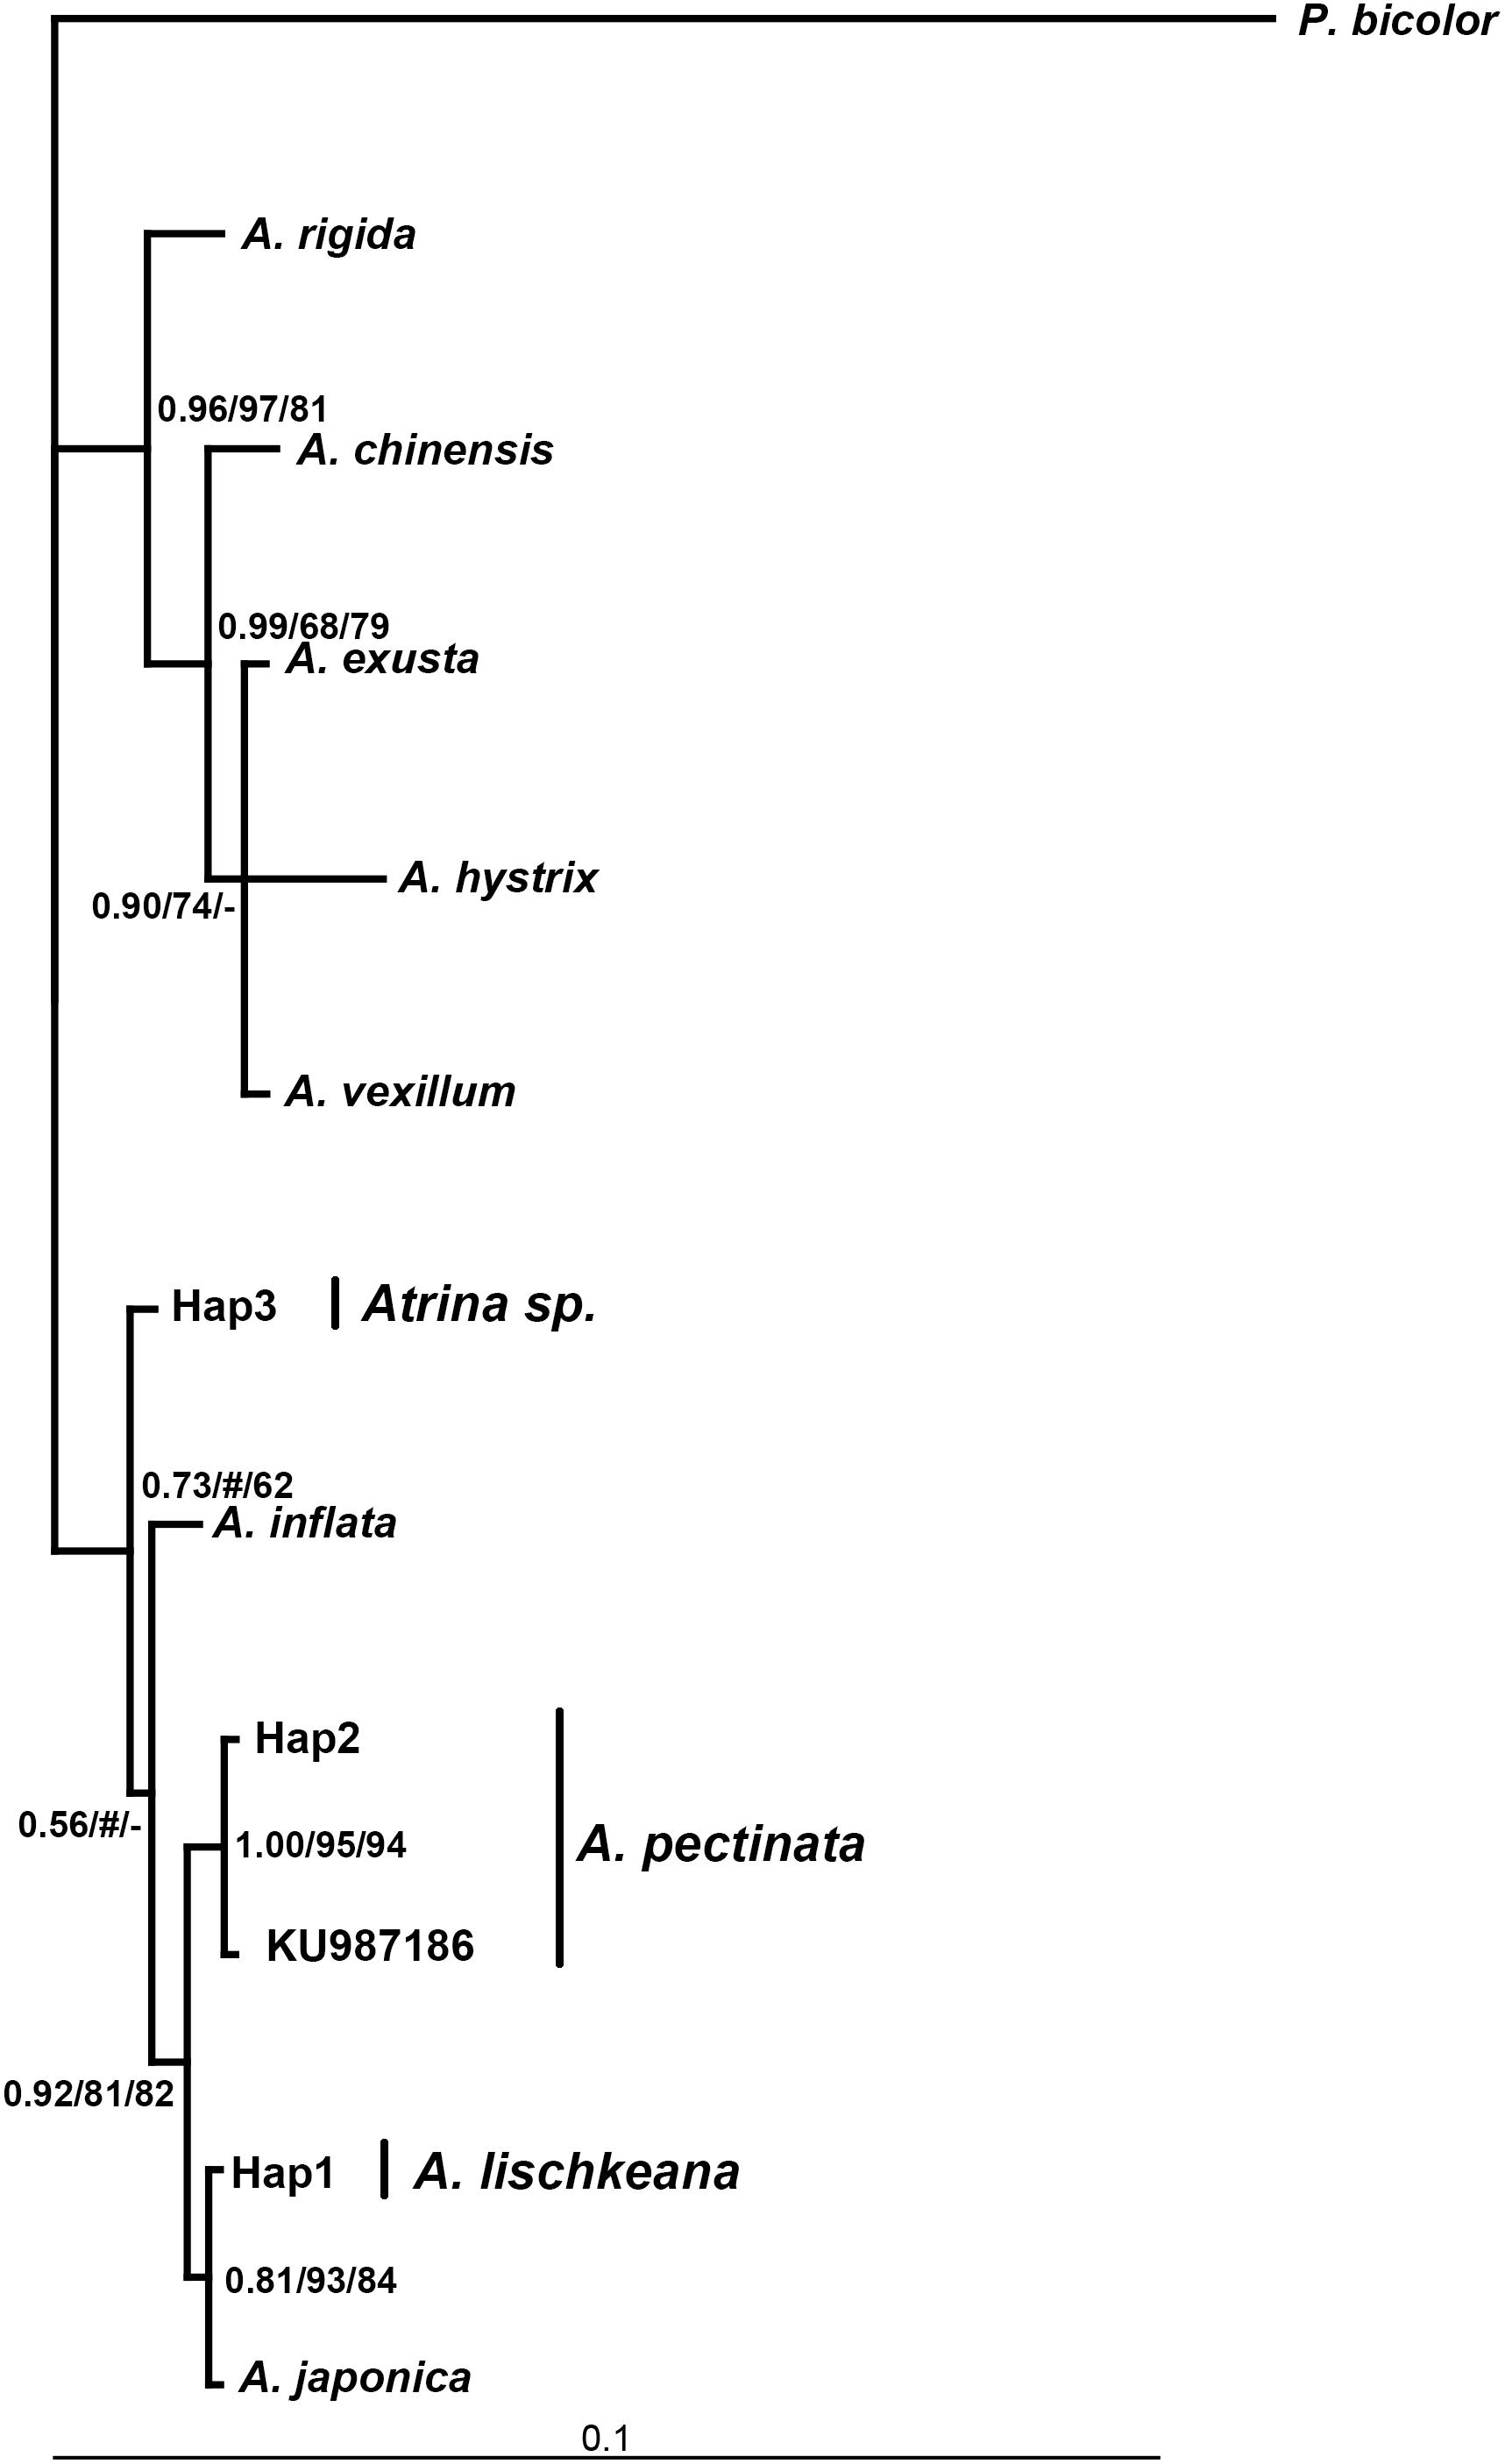
Figure 3. Bayesian tree of 28S rRNA showing the phylogenetic placement of the four species in the A. pectinata species complex. The numbers at the nodes represent the Bayesian inference posterior probabilities, neighbor-joining, and maximum likelihood probability support.
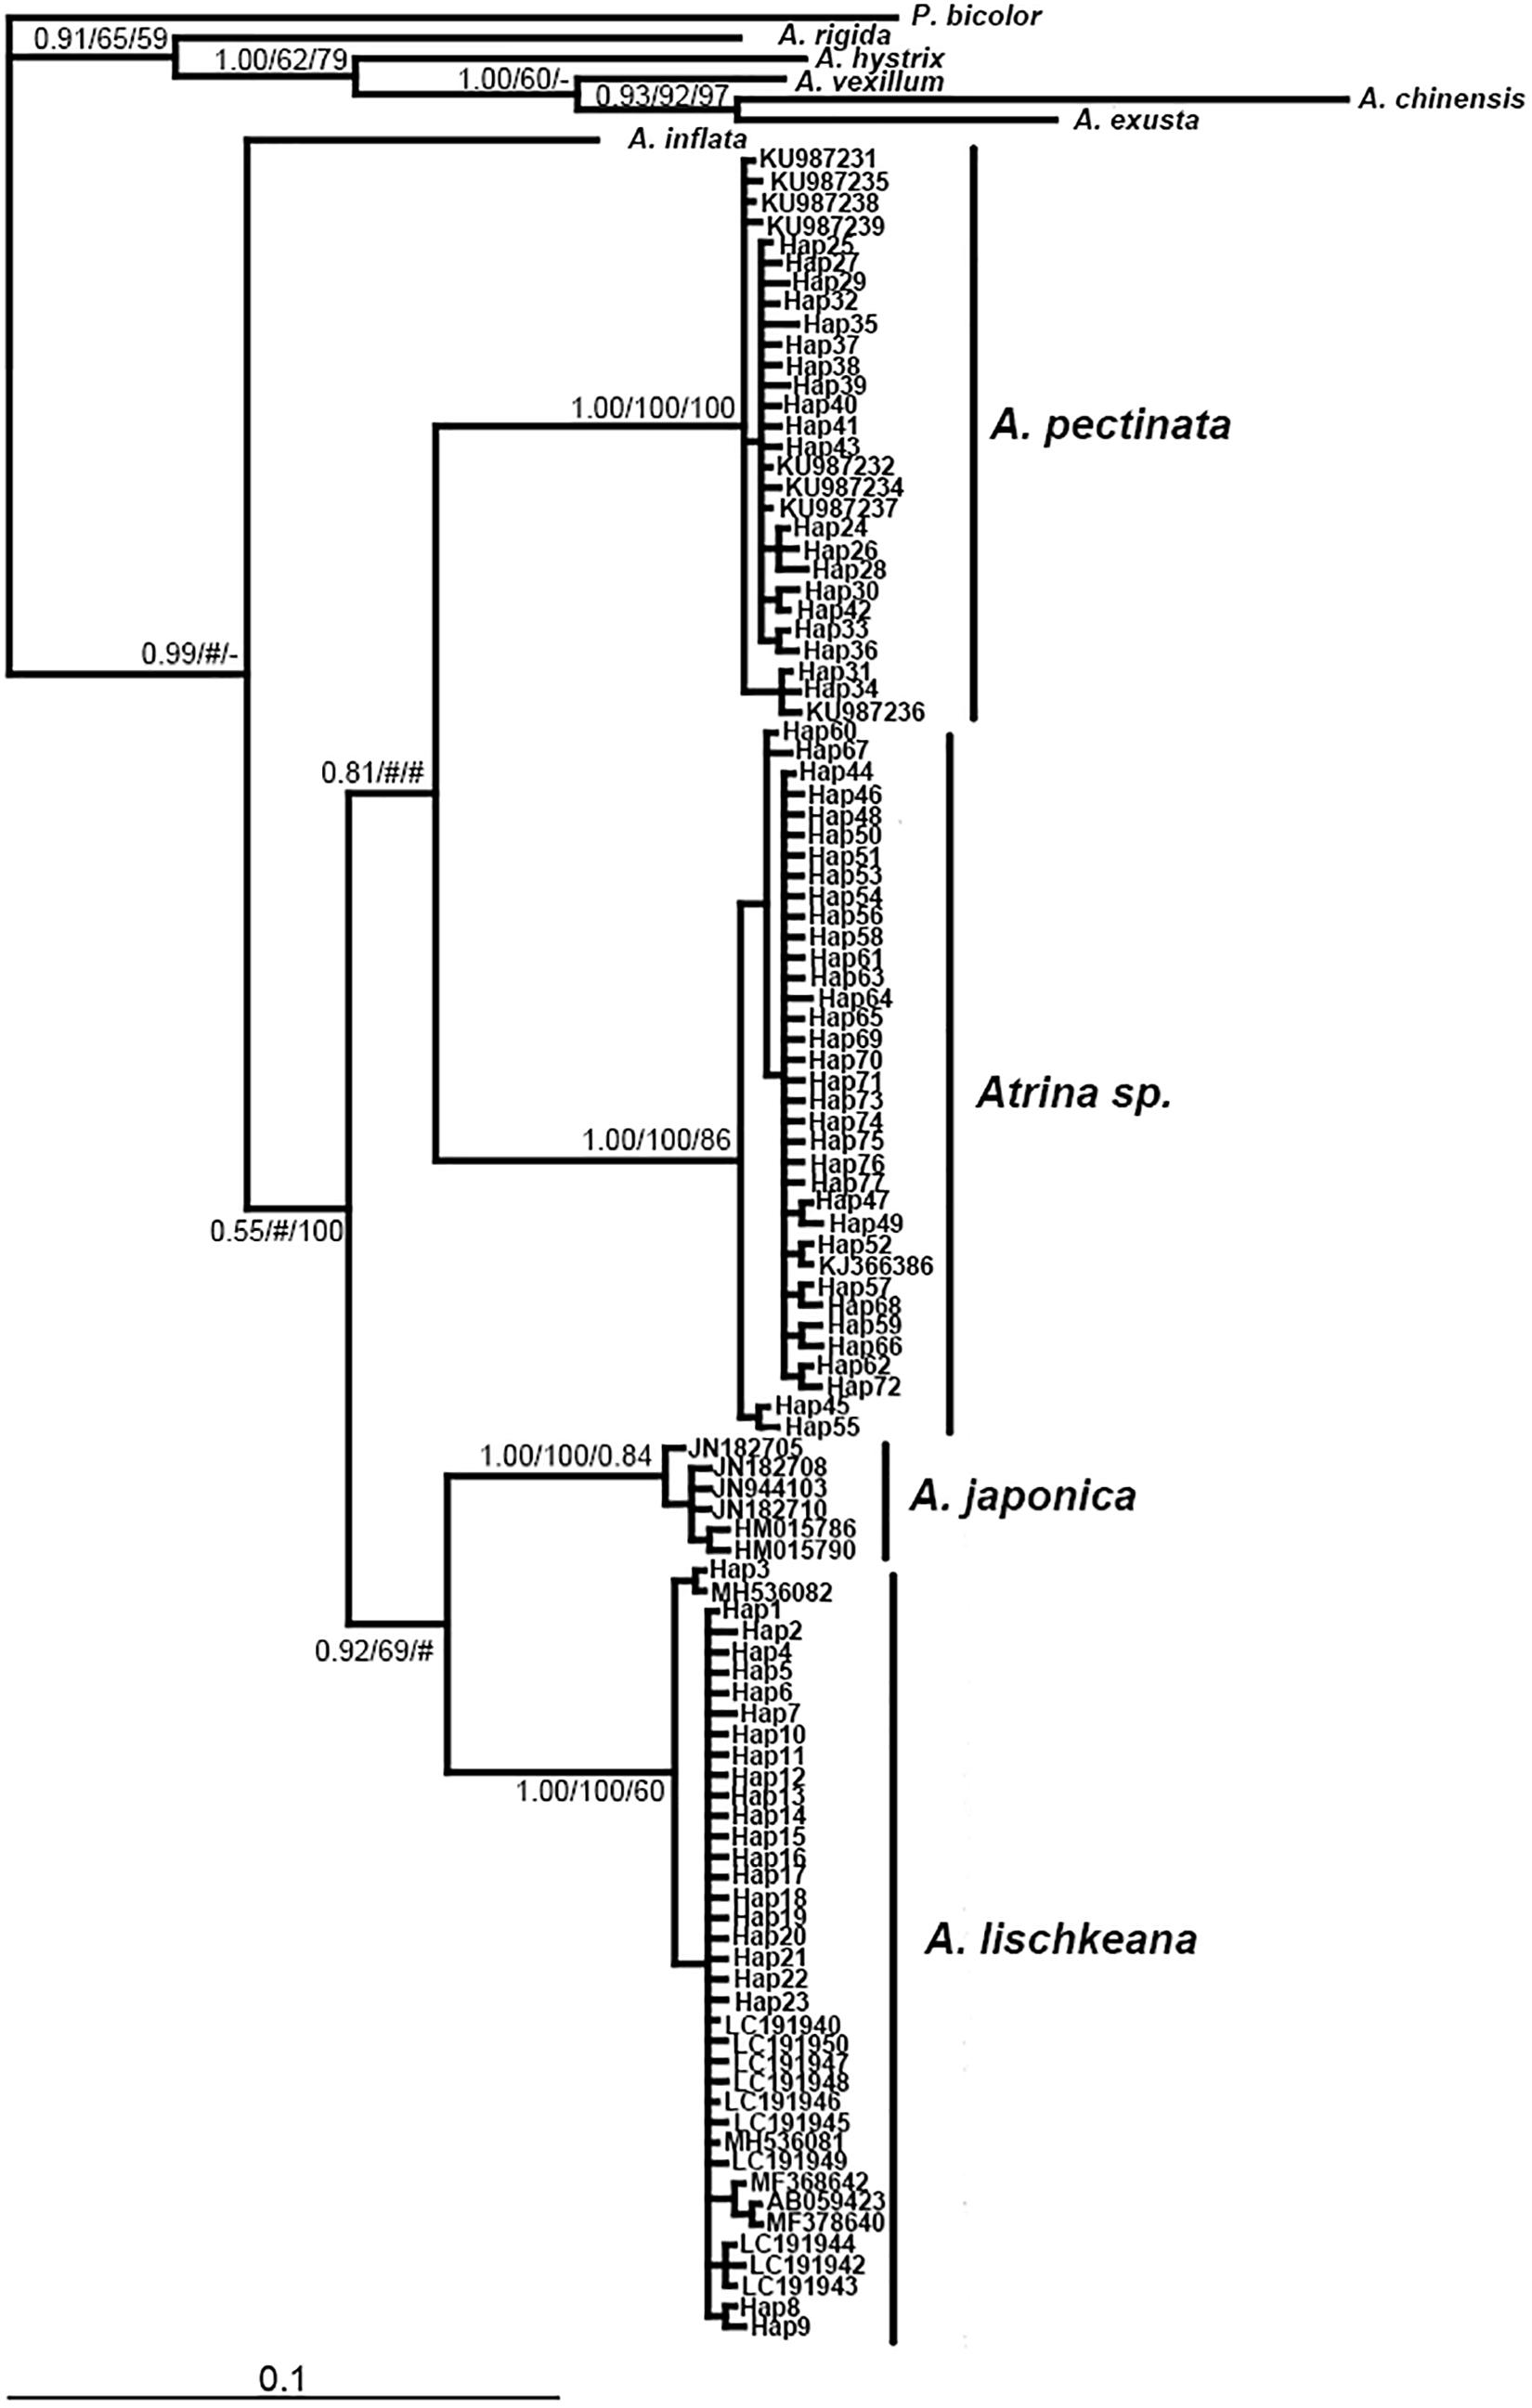
Figure 4. Bayesian tree of mtCOI showing the phylogenetic placement of the four species in the A. pectinata species complex. The numbers at the nodes represent the Bayesian inference posterior probabilities, neighbor-joining, and maximum likelihood probability support.

Figure 5. Bayesian tree of mt16S rRNA showing the phylogenetic placement of the four species in the A. pectinata species complex. The numbers at the nodes represent the Bayesian inference posterior probabilities, neighbor-joining, and maximum likelihood probability support.
Table 3 presents the K2P genetic distances obtained based on the three gene fragments for the above taxa. The pairwise genetic distances among A. lischkeana, Atrina sp., A. pectinata and A. japonica based on 28S sequences were ranged from 0.000 (A. lischkeana and A. japonica) to 0.006 (Atrina sp. and A. pectinata). The pairwise genetic distances among A. lischkeana, Atrina sp., A. pectinata and A. japonica based on the mtCOI gene fragments were ranged from 0.082 (A. lischkeana and A. japonica) to 0.127 (A. lischkeana and A. pectinata). The pairwise genetic distances among A. lischkeana, Atrina sp., A. pectinata and A. japonica based on the mt16S rRNA gene fragments were ranged from 0.018 (A. lischkeana and A. japonica) to 0.059 (Atrina sp. and A. pectinata). The net genetic distances of the four species were also calculated by MEGA 6.06 as follows: A. japonica/A. lischkeana, 0.081; A. japonica/A. pectinata, 0.110; A. japonica/Atrina sp., 0.117; A. lischkeana/A. pectinata, 0.127; A. lischkeana/Atrina sp., 0.099; and A. pectinata/Atrina sp., 0.114. Applying the mtCOI divergence rate (0.7–2.4%/million years) (Liu et al., 2011), divergence events among these genealogical clades occurred approximately 3.4–18.1 million years ago during the Neogene period.
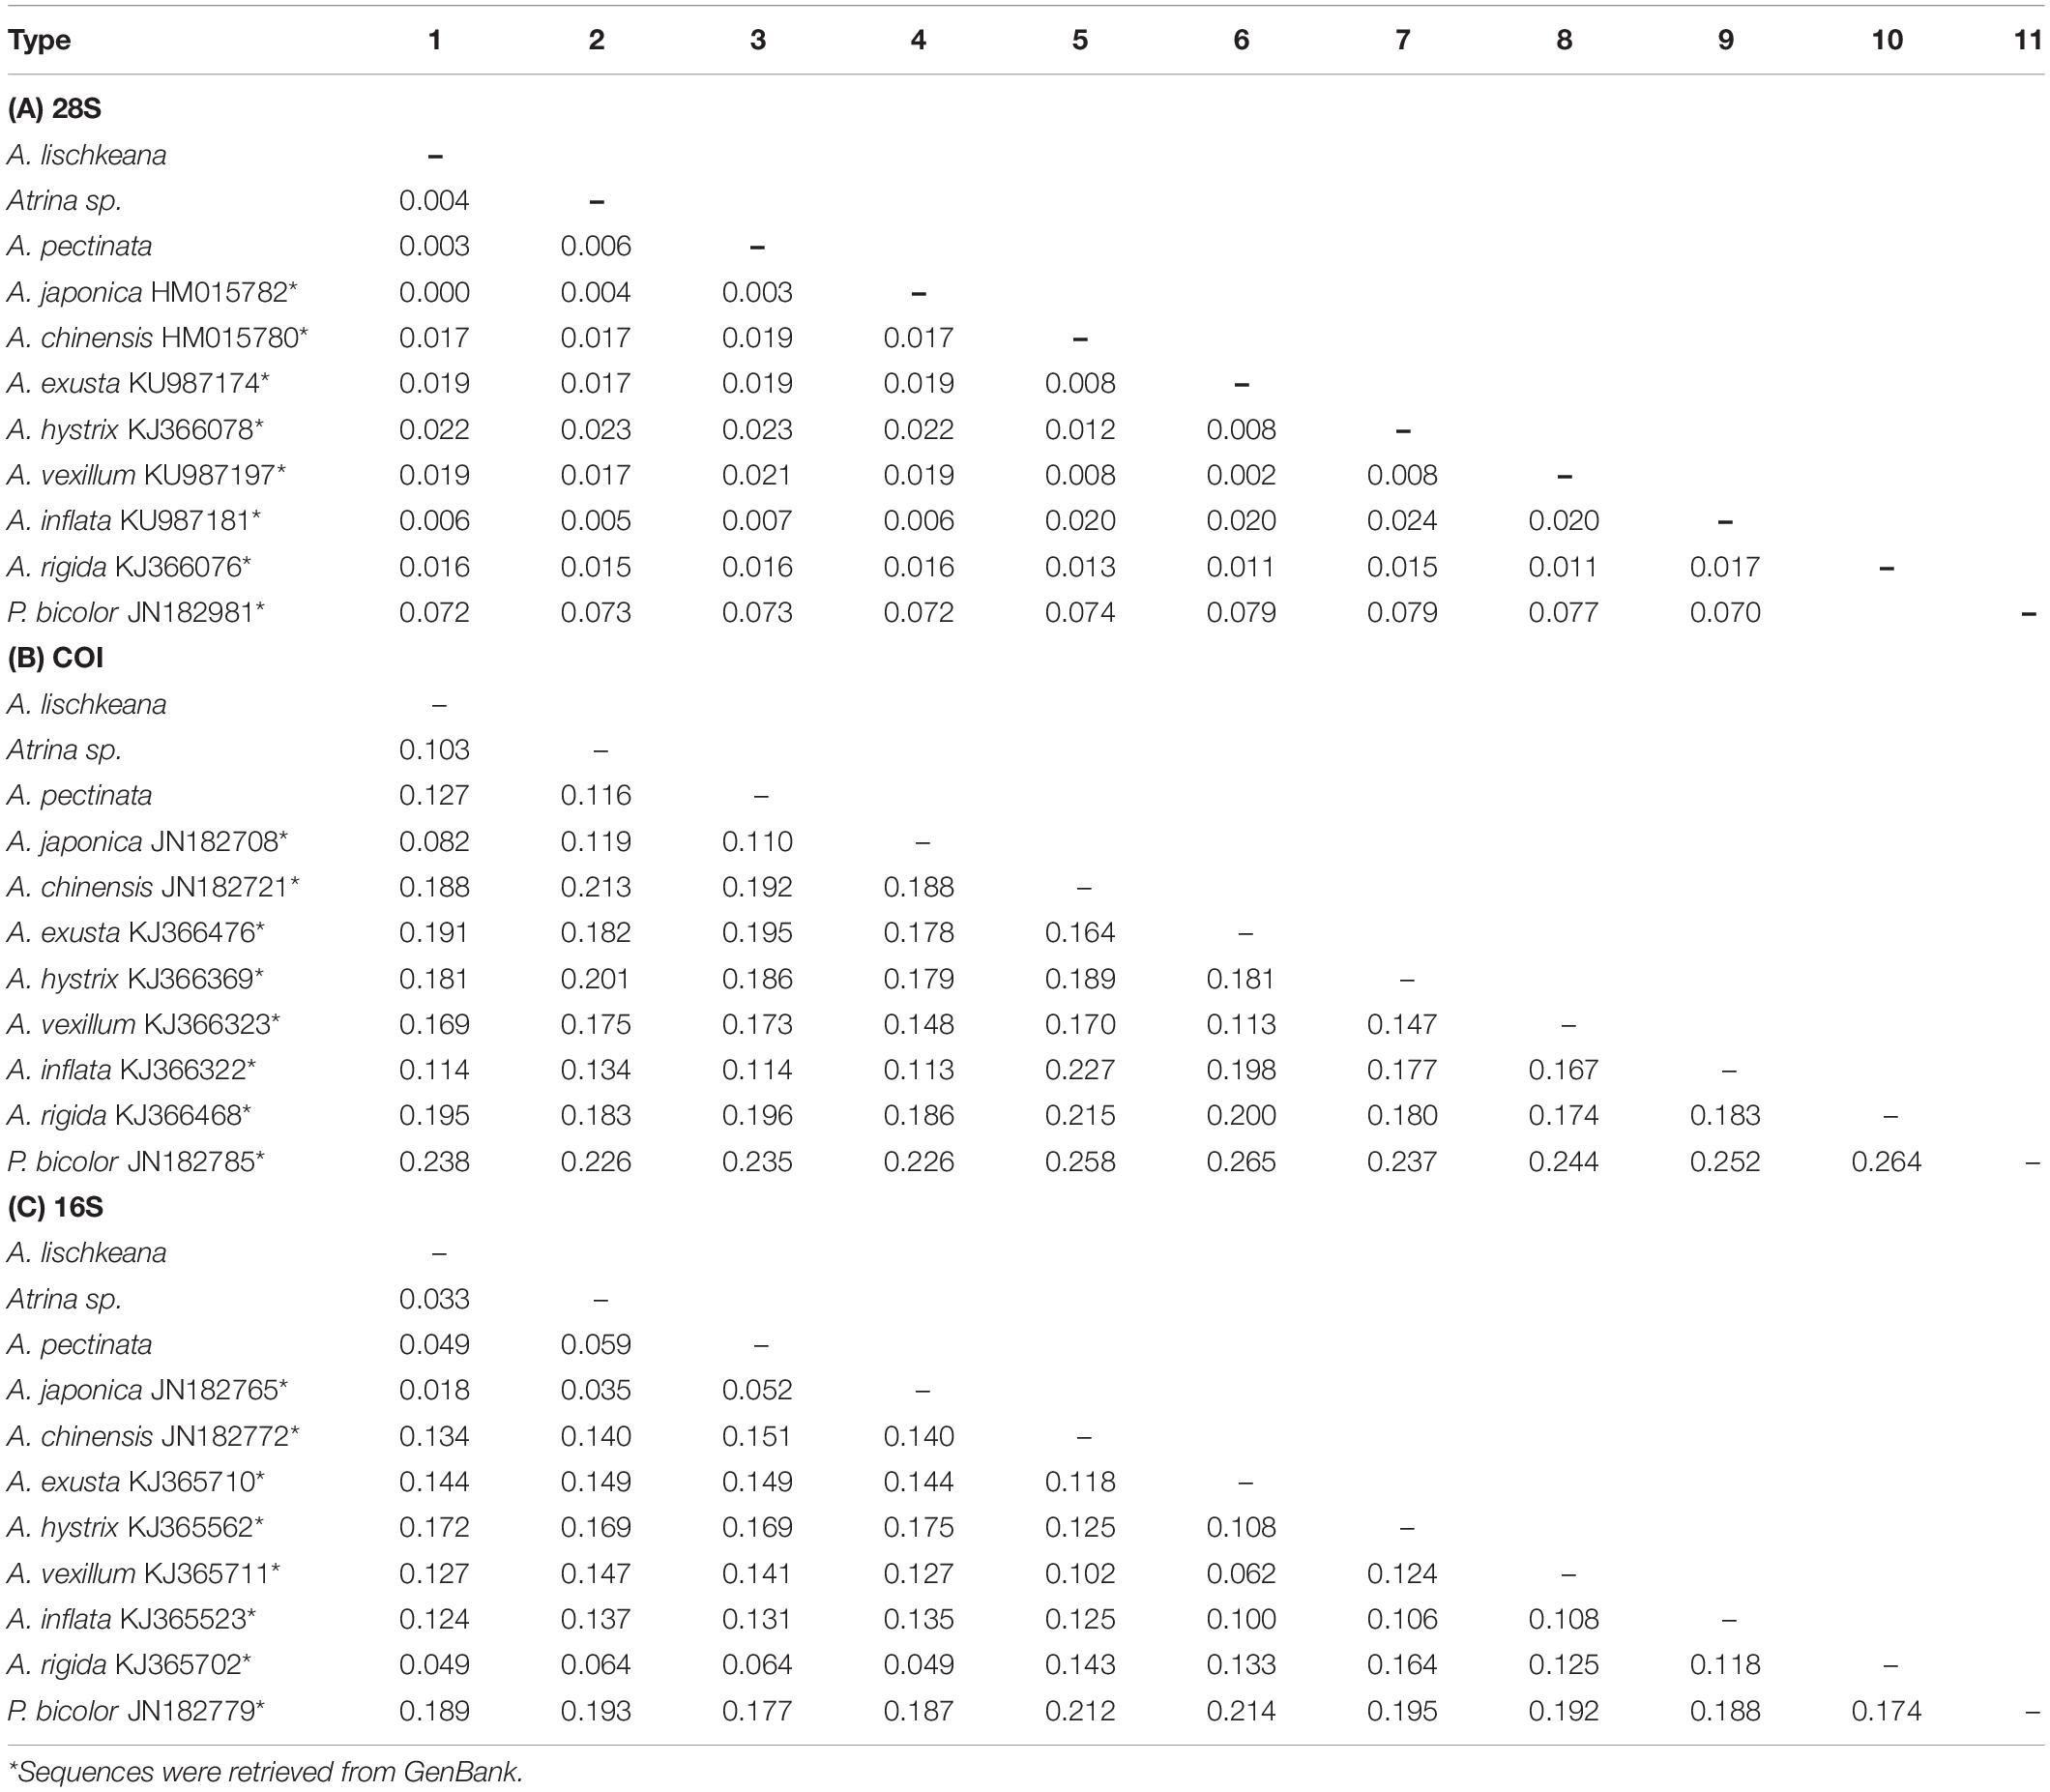
Table 3. Distance matrix of (A) 28S, (B) mtCOI, and (C) 16S DNA between (below the diagonal) various Atrina species as assessed using the Kimura two-parameter (K2P) model.
Population Demography
The results of Tajima’s D and Fu’s Fs tests for A. lischkeana, Atrina sp., A. pectinata based on the mtCOI datasets are shown in Table 2. The output values of both tests were significantly negative for all three species, indicating a possible historical population expansion. Furthermore, mismatch distributions for the three species were unimodal (Figure 6), indicating that each of them has experienced a demographic expansion. The low and non-significant SSD (expect A. pectinata) and RI value coincided with the null hypothesis of sudden expansion model (Table 2). The Bayesian skyline plots demonstrated demographic expansion in each of the three species (Figure 7). Based on the mtCOI divergence rate of 2.4%/Myr, the population expansion times of the A. pectinata and Atrina sp. linkages occurred approximately 60,000 years ago, while that of A. lischkeana was older than those of the other two lineages, occurring approximately 90,000 years ago.
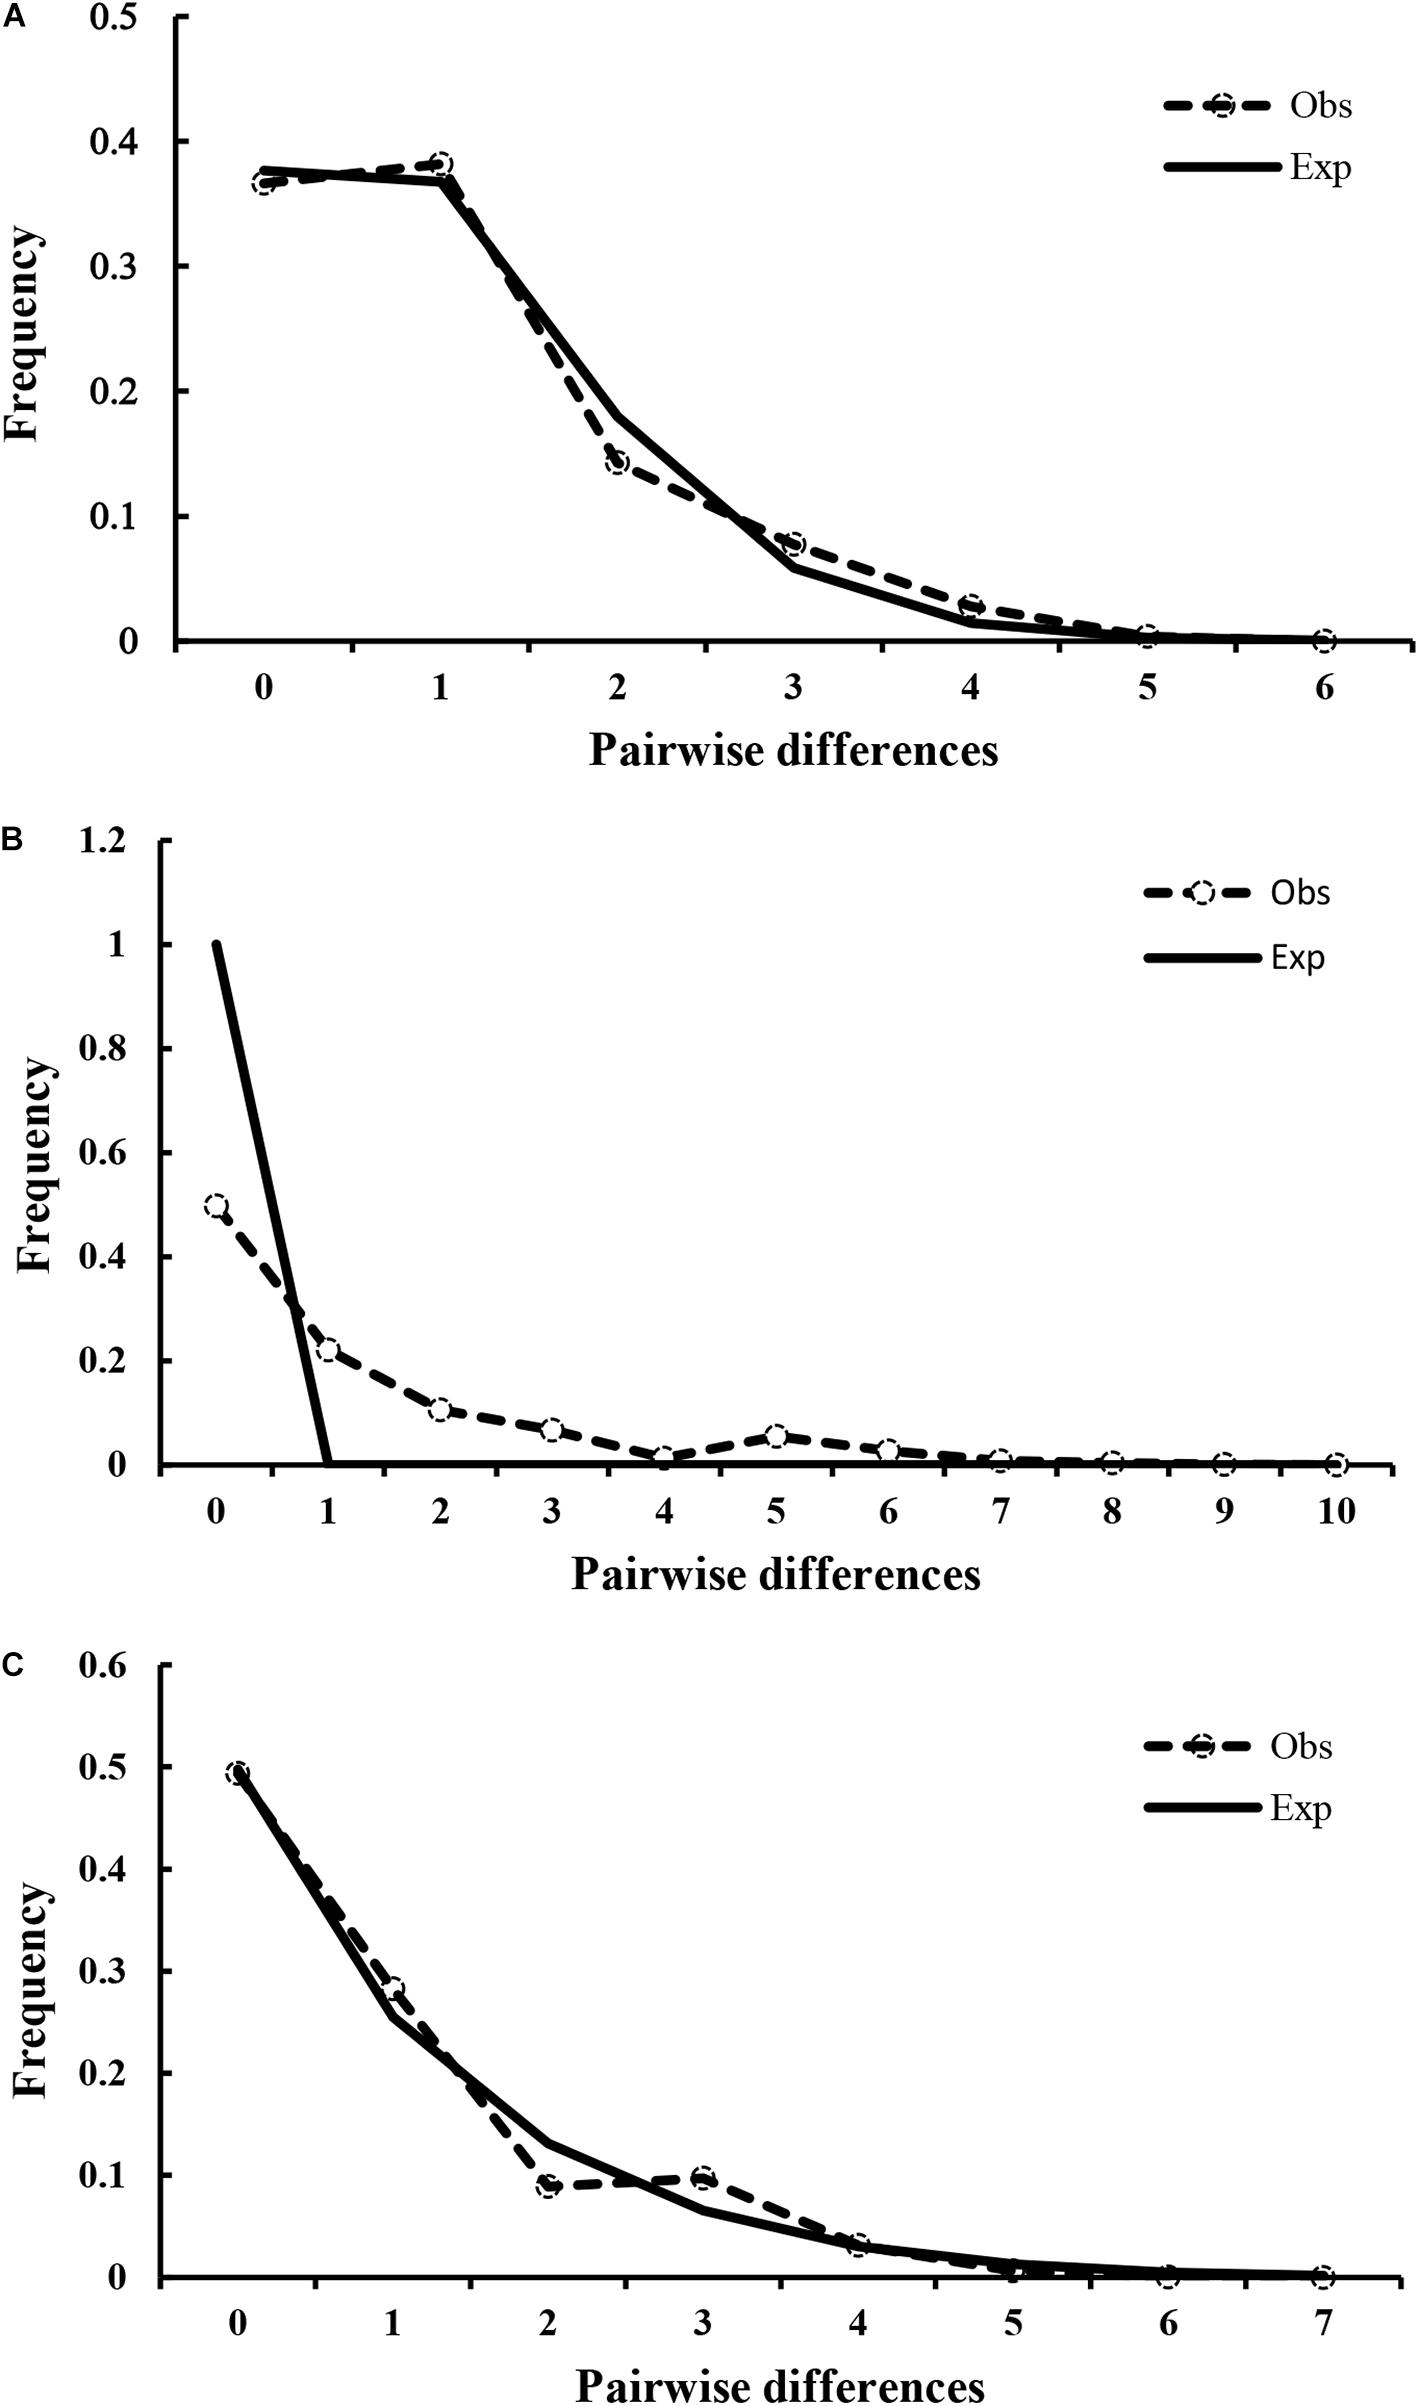
Figure 6. Observed pairwise differences and expected mismatch distribution. Observed pairwise differences (dotted line with circles) and expected mismatch distribution (solid line) under the sudden expansion model for (A) A. lischkeana, (B) A. pectinata, and (C) Atrina sp.
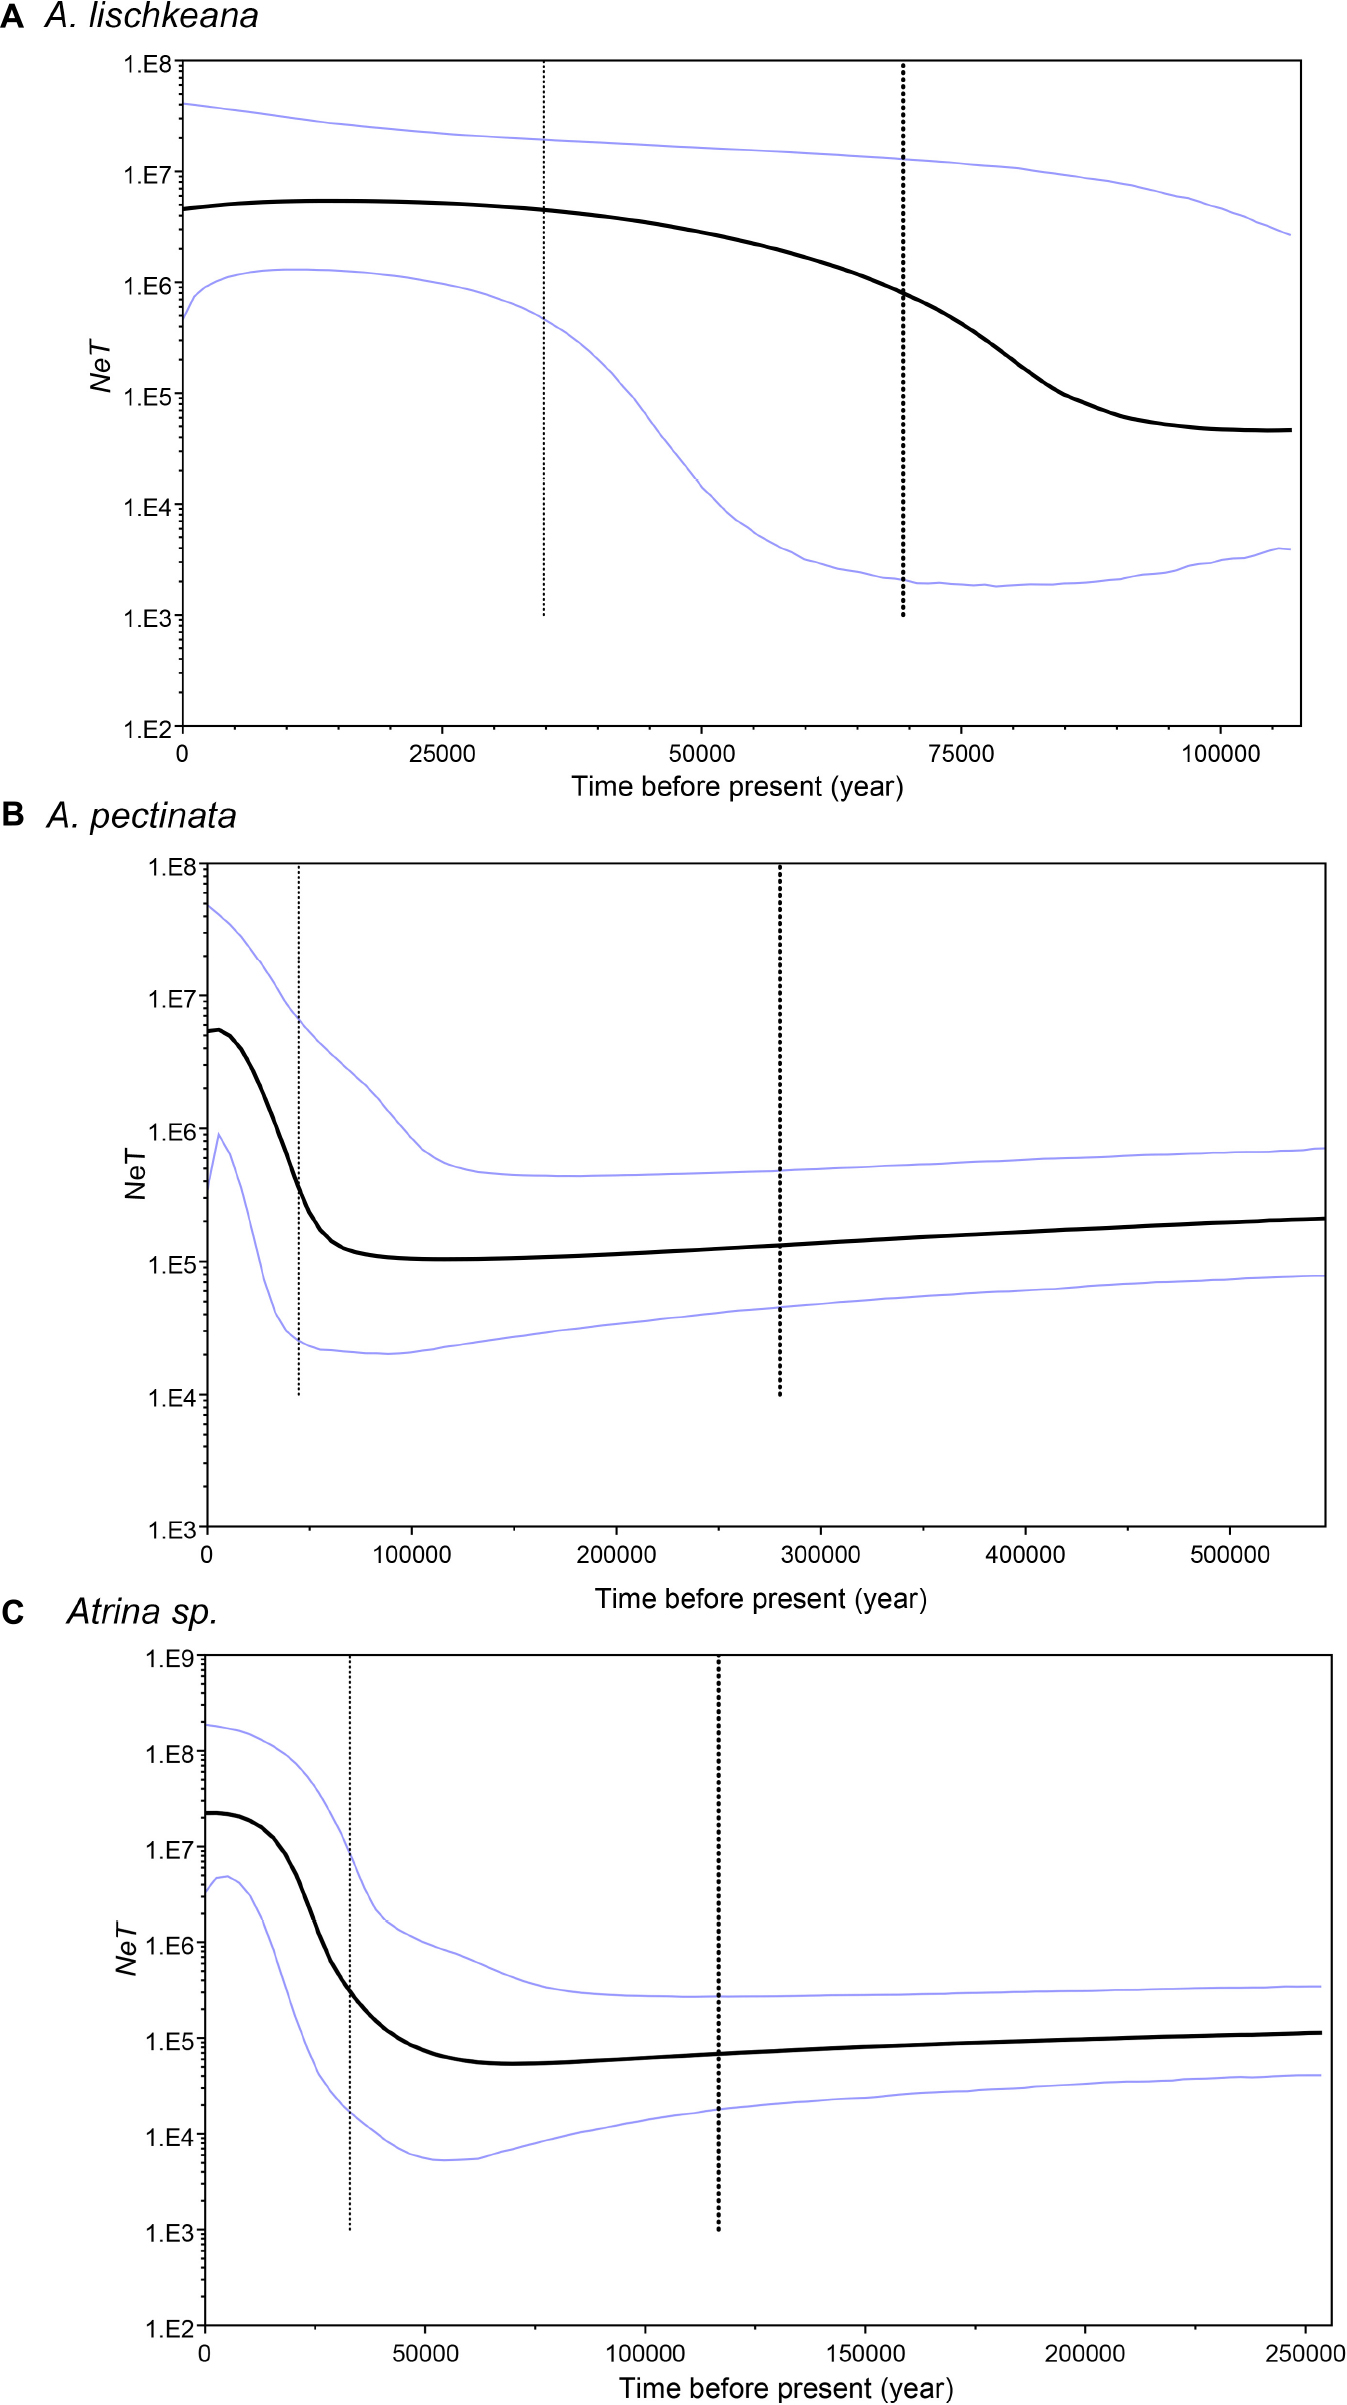
Figure 7. Demographic history of (A) A. lischkeana, (B) A. pectinata, and (C) Atrina sp. estimated using Bayesian skyline plots from mtCOI sequences. The figure shows changes in NeT (Ne, effective population size; T, generation time) over time. The black lines represent median estimates of NeT; the light lines are the upper and lower 95% highest posterior density (HPD) limits of NeT; and the vertical light dashed line represents the median estimates of the time to the most recent common ancestor (TMRCA). The upper 95% HPD on TMRCA is shown at the right of the plot, whereas the lower 95% HPD is the black dashed line to the left of the median. The y-axis is plotted on a logarithmic scale.
Population Structure
For A. lischkeana, Atrina sp., A. pectinata, the topology of the minimum spanning tree of haplotypes revealed three lineages that corresponded to the three species and were characterized by star shapes (Figure 8). The haplotype network for each of the three species was composed of a central haplotype that corresponded to the haplotype shared by most individuals (A. lischkeana: 61.11%, A. pectinata: 70.59%, and Atrina sp.: 70.59%) and the remaining descendant haplotypes. Within each of the three species, no distinct phylogeographic apportioning localities were observed (Figure 6).
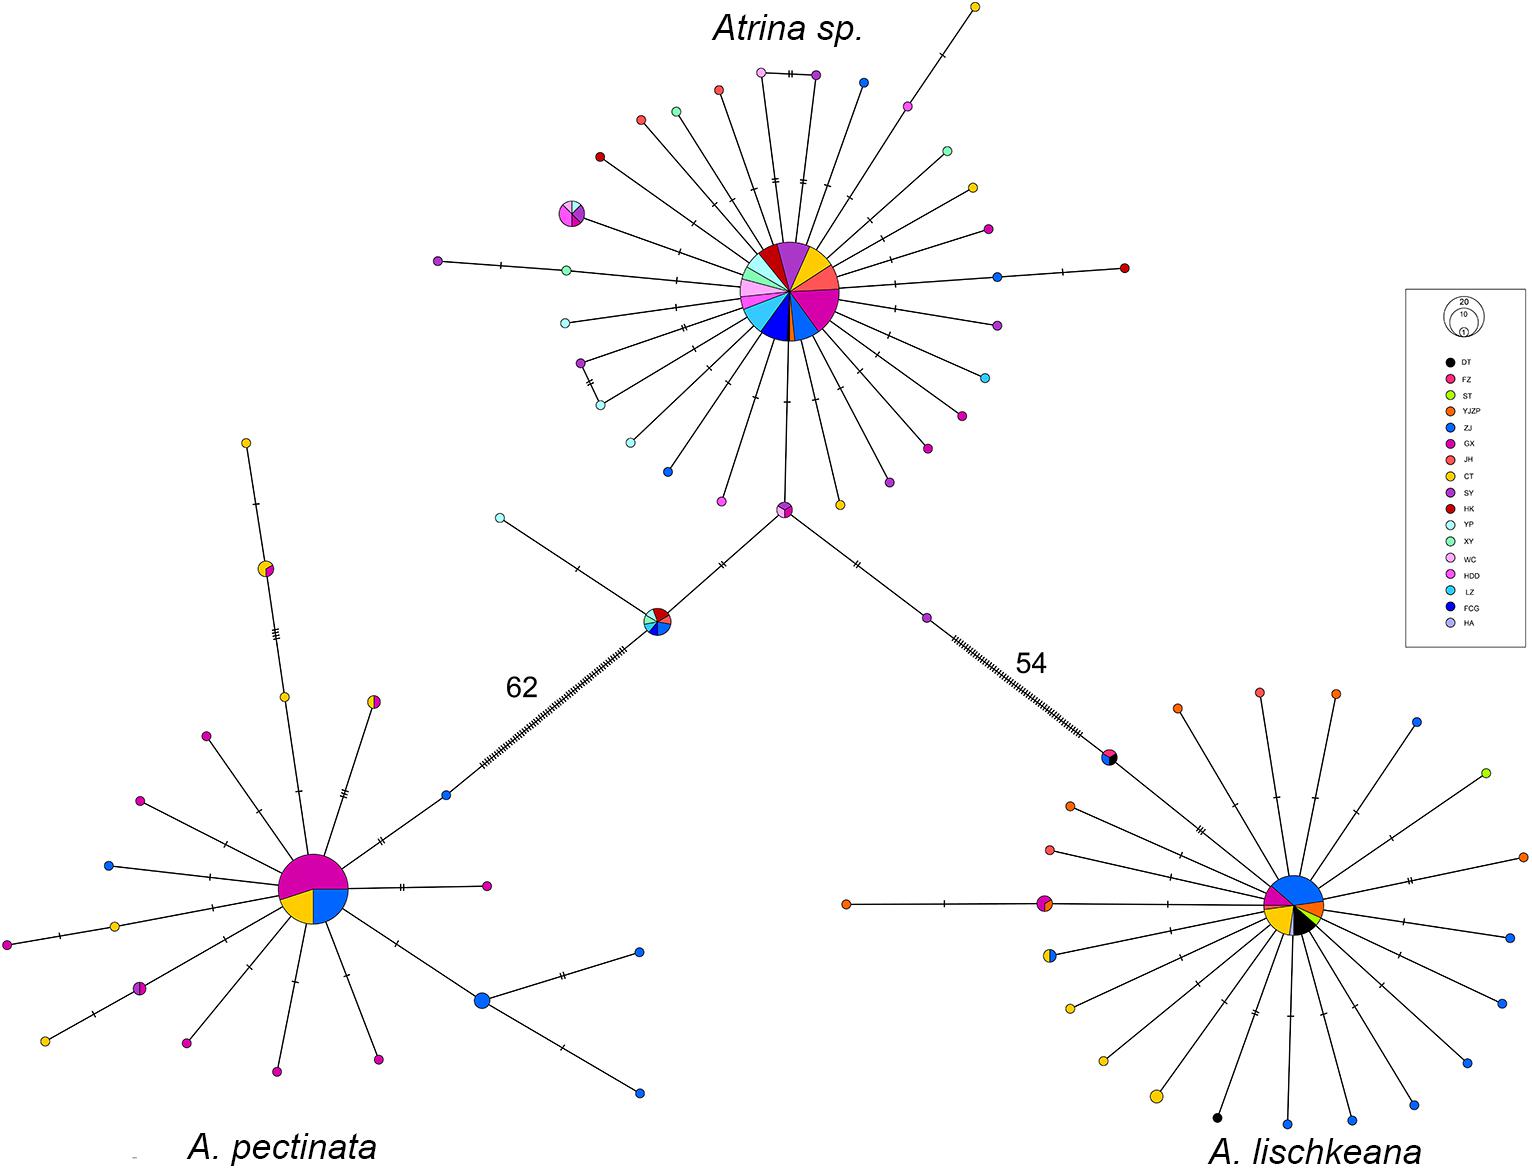
Figure 8. Minimum spanning tree showing genetic relationships among the mtCOI haplotypes of A. lischkeana, A. pectinata, and Atrina sp.. The circles represent the haplotypes, and their sizes are proportional to their respective frequencies. The population origins of the haplotypes are indicated by patterns. Tick marks represent the deduced numbers of nucleotide substitutions along each branch.
For A. lischkeana, the global AMOVA analysis showed that there was a shallow but significant amount of variance at only one level (among populations within groups, FSC = 0.045, P = 0.049). For A. pectinata, there were significant genetic subdivisions among populations within groups (FSC = 0.063, P = 0.030) and within populations (FST = 0.061, P = 0.006). For Atrina sp., the global AMOVA analysis indicated no significant genetic differentiation at any level (among groups, among populations within groups, or within populations) (Table 4).
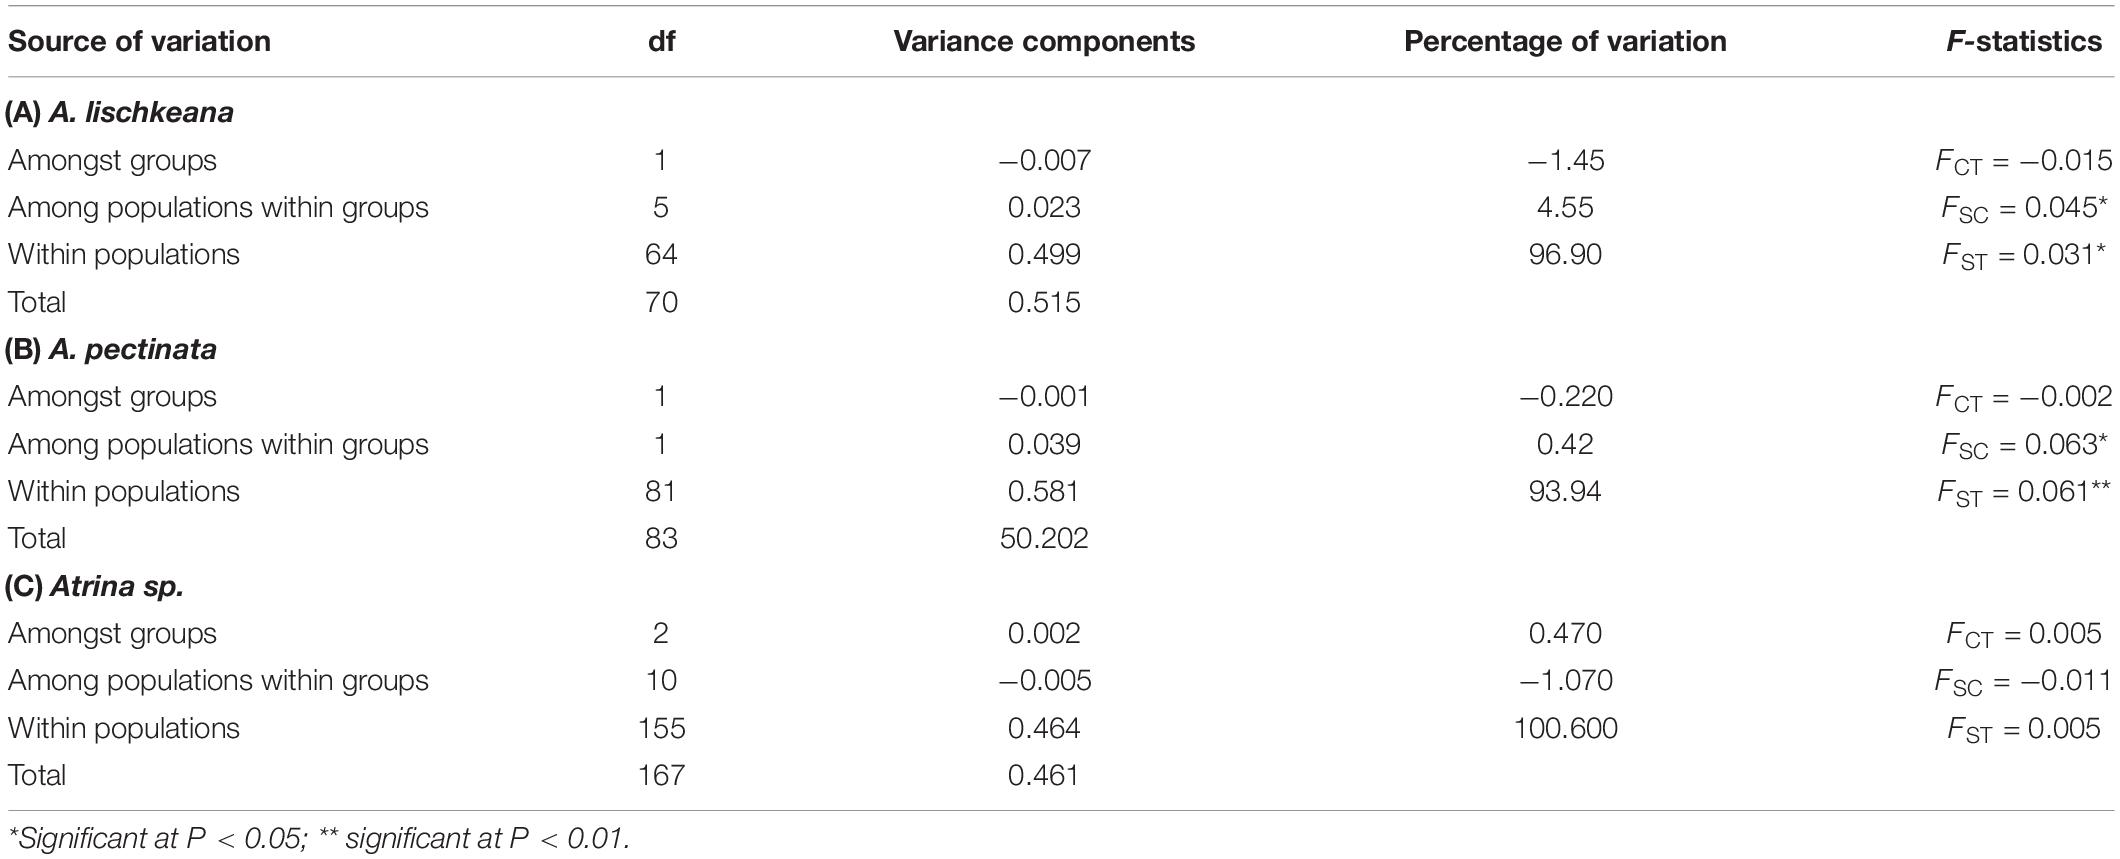
Table 4. Analysis of molecular variance (AMOVA) based on mtCOI datasets.
For A. pectinata, the pairwise FST values ranged from 0.0476 (the ZJ population and BH population) to 0.0921 (the ZJ population and CT population), and two (both involving the ZJ samples) out of three pairwise FST values were significant after sequential Bonferroni corrections (Table 5), indicating significant genetic differentiation between Zhanjiang and Beibu Gulf (the CT population and BH population). However, no significant pairwise FST values were detected after sequential Bonferroni corrections for A. lischkeana or Atrina sp.
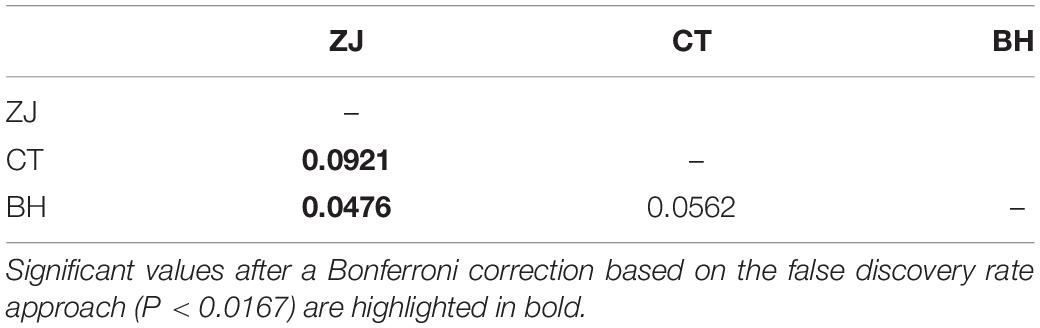
Table 5. Matrix of pairwise FST values (below diagonal) (above diagonal) between A. pectinata populations based on mtCOI datasets.
Discussion
To reach a conclusion on the taxonomy of the A. pectinata species complex, we analyzed the phylogenetic relationships and species delimitations of the A. pectinata species complex in the South China Sea based on the mtCOI, 16S rRNA, and nr28S rRNA gene fragments. In phylogenetic analyses, specimens of the A. pectinata species complex from the South China Sea formed three clusters, and species delimitation analyses indicated that the three lineages revealed in phylogenetic analyses represented three distinct species. These results strongly implied that there is less phenotypic plasticity in A. pectinata than was previously thought. Finally, our data and analyses confirmed previous inferences (Liu et al., 2011) that the four cryptic species of the A. pectinata species complex are genetically valid, and we defined lineage 1-lineage 4 described in Liu et al. (2011) as A. japonica, A. lischkeana, Atrina sp. and A. pectinata based on our results as well as on previous morphological and genetic studies.
Identification and Distribution of the Four Atrina Species in China
Rosewater (1961)’s masterpiece was the reduction of a dozen distinct Indo-Pacific Atrina species into a single species: A. pectinata. However, Winckworth (1936) and Huber (2010) suggested that A. pectinata is restricted to the Indian Ocean and Indonesia and that A. pectinata Linnaeus was distributed in India. A. pectinata specimens collected from the South China Sea shared common haplotypes of mtCOI, 16S rRNA, and nr28S rRNA gene fragments with A. pectinata specimens collected from the Philippine archipelago (Lemer et al., 2016), indicating that A. pectinata is also distributed in the South China Sea. A. pectinata is tan to brownish, rather fragile, narrow, and weakly ribbed, with occasional small spines on the ventral shell surface (Figure 2C).
A. japonica is a large, dark, olive-green to brownish, rather smooth, weakly ribbed, rather inflated species with a very large, central, round muscle scar (Figure 2A) and is mainly distributed from the Yellow Sea to Japan. It was first described by Reeve (1858) in Japan and then synonymized with A. pectinata by some taxonomists (Winckworth, 1936; Habe, 1953; Rosewater, 1961; Wang, 1997). However, Huber (2010) kept it as a distinct species, and Fuxue and Zhang (1959) kept it as a subspecies of A. pectinata. Our results supported A. japonica as a valid species.
The shell of A. lischkeana is rather small, fragile and brownish with radiating scaly ribs (Figure 2B). We differentiated A. lischkeana and A. japonica based on the presence/absence of scales on the dorsal and posterior shell surfaces. A. lischkeana is mainly distributed in Ariake Bay, the Seto Inland Sea in Japan, South Korea and the South Sea in China. A. lischkeana, as described by Clessin (1861) in Yokohama, was synonymized with A. pectinata by Winckworth (1936); Habe (1953), Rosewater (1961), and Wang (1997). However, Huber (2010) kept it as a distinct species, and Fuxue and Zhang (1959) kept it as a subspecies of A. pectinata. Our results supported A. lischkeana as a valid species.
Atrina sp. corresponds to the pen shells with green morphological forms (Yu et al., 2000) and with lineage 3 in Liu et al. (2011). Atrina sp. comprises rather small, thin, wedge-shaped smooth and green species (Figure 2D). A BLAST search of the three gene fragments of Atrina sp. specimens in this study in GenBank only obtained similar sequences with the highest specimen matches (99–100%) in the South China Sea, indicating that Atrina sp. may be mainly distributed in the South China Sea.
A. japonica is widely distributed over the central to northern seas in China and is more northerly distributed than A. lischkeana, Atrina sp. and A. pectinata, which are mainly distributed in the South China Sea. In areas such as the Leizhou Peninsula and Beibu Gulf, collections of pen shells from Zhanjiang, Caotan, and Beihai have shown that A. lischkeana, Atrina sp. and A. pectinata are sympatric. In collections from Hainan Island, Atrina sp. is most common species found, with only one recorded A. pectinata individual. Two scenarios may potentially account for this distribution pattern: (1) sympatric speciation, in which the speciation process was unrelated to geographic isolation, or (2) pen shells may have originated in tropical regions and expanded their ranges from southern to northern regions after glaciation, giving rise to new lineages/species (Kim et al., 2017). Recently, sympatric speciation has come to be understood as a major generator of marine biodiversity, but it remains among the most controversial evolutionary processes (Quesada et al., 2007; Bowen et al., 2013; Richards et al., 2019). Nearly all existing case studies of sympatric speciation involve some form of automatic magic traits, such as assortative mating by habitat, along a depth gradient, or environment-induced phenology shifts (Richards et al., 2019). However, there is little information on any magic traits associated with the three sympatric pen shell species considered herein, and genomic, physiological, environmental, morphological and reproductive datasets must be combined to reveal speciation mechanisms. According to the lineage-level divergence rates utilized in the present study, the three species separated from one another approximately 3.4–18.1 million years ago during the Neogene period.
Historical Demography of the Four Atrina Species in China
The late Pleistocene period was punctuated by a series of large glacial-interglacial changes that have been proven to affect the phylogeographic distribution and evolutionary processes of marine species (Maggs et al., 2008; Ni et al., 2014). When ice caps formed during Pleistocene glacial periods, coastal marine organisms either went extinct or survived in isolated refugial habitats characterized by the survival of ancestral relict species (Maggs et al., 2008; Hu et al., 2018). The isolation of species within and among glacial refugia and the timing and mode of expansion when glaciers retreated have been widely recognized as important topics for understanding recent speciation and extinction events (Hu et al., 2018). During Pleistocene glacial periods, the sea level in the East China Sea, the Bohai Gulf, and the Yellow Sea (hereafter considered a single sea with no geographical barrier) declined by approximately 150 m, and the East China Sea shelf was completely exposed as the coastline migrated approximately 1,200 km seaward and then consequently receded into an elongated enclosed sea (with the Okinawa Trough) with an area <1/3 of its present size. Meanwhile, the sea level in the South China Sea became approximately 100∼120 m lower than the present day level, and the sea became a semiclosed sea connected to the Pacific Ocean mainly through the Bashi Strait (Ni et al., 2014). The East China Sea and the South China Sea have been proposed as independent marine refugia where taxa adapted to environmental changes by retaining their ancestral polymorphisms during glaciation events, and the dramatic population expansion times of various marine species in these marginal seas were estimated to occur in a period 120,000∼140,000 years ago assuming an mtCOI divergence rate of 2%/Myr (Ni et al., 2014). The mtCOI was utilized as the stable reference marker in historical demography analyses (Marko et al., 2010; Ni et al., 2014). There was neither an accurate mutation rate nor a clear fossil record available for the species. In the former molluscan studies on demographic history, the mtCOI divergence rates estimated ranged from 0.7 to 2.4% per million years (MY) [e.g., Crassostrea gigas: 2∼2.4%/MY (Li et al., 2015); Thais clavigera: 0.79%/MY (Guo et al., 2015); Cyclina sinensis: 0.7∼2.4%/MY (Ni et al., 2012); Atrina pectinata: 0.7∼2.4%/MY (Liu et al., 2011); Tegula brunnea: 2.4%/MY (Hellberg and Vacquier, 1999)]. Conversion of population genetic parameters with the relatively fast 2.4% rate was expected to yield conservative demographic results with respect to our conclusions: slower mutation rates would increase divergence time estimates and make inferred population expansion times older (Marko et al., 2010). The neutrality test, mismatch distribution and network analyses results combined with Bayesian skyline plots consistently showed that all three studied species in the South China Sea had populations that were relatively stable over time and then subjected to sudden expansion during the late Pleistocene (60,000–90,000 years ago), assuming an mtCOI divergence rate of 2.4%/Myr. This divergence rate is just a rough approximation, causing our estimates of absolute time and population size values to be unreliable. However, the fold-change in Ne and the relative placement of expansions and declines along the temporal axis do not depend on these assumptions and can therefore be evaluated more reliably (Rippe et al., 2021). In our previous study (Xue et al., 2014), the population demographic expansion of A. japonica started approximately 160,000 years ago assuming an mtCOI divergence rate of 2.4%/Myr, which was earlier than those of A. lischkeana (90,000 years ago), Atrina sp. (60,000 years ago), and A. pectinata (60,000 years ago). These results supported the following hypothesis: the East China Sea and the South China Sea have been proposed as independent marine refugia during glaciation, and Pleistocene glaciations more drastically affected species in temperate regions than in tropical regions (Hewitt, 2000; Ni et al., 2014). The expansion time of the northern group of Siphonaria japonica limpet (Gastropoda: Siphonariidae) (313,900∼682,400 years ago) was reported to be earlier than that of the southern group (104,400∼259,300 years ago) (Wang et al., 2015).
The Genetic Population Structure of the Three Atrina Species From Southern China
Since we sampled landscapes within the distributions of the three studied species along the coasts of the South China Sea, we were able to compare the population structures within the three species. We discovered significant genetic differentiation of A. pectinata between Zhanjiang and Beibu Gulf (the CT population and BH population), but this differentiation was not detected in the A. lischkeana or Atrina sp. populations in southern China. In our previous study, A. chinensis in southern China contained two lineages: the Beibu Gulf lineage and the northern South China Sea lineage (Xue et al., 2012). The Beibu Gulf is a semienclosed gulf with only one sea gate in the Qiongzhou Strait connected to the northern South China Sea. The seasonal mean current through the Qiongzhou Strait is oriented eastward from late spring through summer and westward during the rest of the year. In the Beibu Gulf, the spawning peaks of the A. pectinata species complex generally occur in the middle of May and October, and spawning troughs occur between June and July. However, we did not obtain accurate spawning periods for the three Atrina species, and we speculated that the formation of different genetic population structures among the three Atrina species may be related to their own life history characteristics (spawning period, larval diffusivity, fixed habitat, mobility, etc.). Similar population structure patterns to those of A. pectinata in southern China were also detected in Macridiscus multifarius (Bivalvia: Veneridae) (Ye et al., 2015).
Conclusion
The results of our study support the validity of A. japonica, A. lischkeana, and Atrina sp. as separate taxonomic units instead of as a synonyms of A. pectinata. These findings should provide useful information for developing appropriate conservation and management strategies for the A. pectinata species complex in China. Sympatric speciation illustrates how natural and sexual selection may create new species in isolation without geographic barriers. Future analyses of genome-wide diversity in these three Atrina species could provide further insight into the strength, formation and maintenance of oceanic dispersal barriers.
Data Availability Statement
The datasets generated for this study can be found in the NCBI GenBank under accession numbers MN817547–MN817579.
Ethics Statement
The animal study was reviewed and approved by the Animal Care Quality Assurance of the Institute of Oceanology, Chinese Academy of Sciences.
Author Contributions
D-XX and TZ conceived the project. D-XX conducted the molecular experiments, data collection, analysis, and writing. H-YW assisted in data analysis and writing, provided the partial samples, assisted data interpretation, commented the results, and modified the manuscript to final version. All authors contributed to the article and approved the submitted version.
Funding
This study was supported by National Key R&D Program of China (No. 2019YFD0901300), National Natural Science Foundation of China (No. 31972793), Major Scientific and Technological Innovation Project of Shandong Provincial Key Research and Development Program (2019JZZY020708), China Agriculture Research System of MOF and MARA, Industry Leading Talents Project of Taishan Scholars (Recipient: TZ, Grant No. LJNY201704), “Double Hundred” Blue Industry Leader Team of Yantai (Recipient: TZ), and Creative Team Project of the Laboratory for Marine Ecology and Environmental Science, Qingdao Pilot National Laboratory for Marine Science and Technology (No. LMEES-CTSP-2018-1).
Conflict of Interest
The authors declare that the research was conducted in the absence of any commercial or financial relationships that could be construed as a potential conflict of interest.
Publisher’s Note
All claims expressed in this article are solely those of the authors and do not necessarily represent those of their affiliated organizations, or those of the publisher, the editors and the reviewers. Any product that may be evaluated in this article, or claim that may be made by its manufacturer, is not guaranteed or endorsed by the publisher.
Supplementary Material
The Supplementary Material for this article can be found online at: https://www.frontiersin.org/articles/10.3389/fmars.2021.753553/full#supplementary-material
Footnotes
References
Agapow, P. M., Bininda-Emonds, O. R., Crandall, K. A., Gittleman, J. L., Mace, G. M., Marshall, J. C., et al. (2004). The impact of species concept on biodiversity studies. Q. Rev. Biol. 79, 161–179.
Bandelt, H.-J., Forster, P., and Röhl, A. (1999). Median-joining networks for inferring intraspecific phylogenies. Mol. Biol. Evol. 16, 37–48. doi: 10.1093/oxfordjournals.molbev.a026036
Bickford, D., Lohman, D. J., Sodhi, N. S., Ng, P. K. L., Meier, R., Winker, K., et al. (2007). Cryptic species as a window on diversity and conservation. Trends Ecol. Evol. 22, 148–155. doi: 10.1016/j.tree.2006.11.004
Bouckaert, R., Vaughan, T. G., Barido-Sottani, J., Duchêne, S., Fourment, M., Gavryushkina, A., et al. (2019). BEAST 2.5: an advanced software platform for Bayesian evolutionary analysis. PLoS Comput. Biol. 15:e1006650. doi: 10.1371/journal.pcbi.1006650
Bowen, B. W., Rocha, L. A., Toonen, R. J., and Karl, S. A. (2013). The origins of tropical marine biodiversity. Trends Ecol. Evol. 28, 359–366. doi: 10.1016/j.tree.2013.01.018
Drummond, A. J., Suchard, M. A., Xie, D., and Rambaut, A. (2012). Bayesian phylogenetics with beauti and the beast 1.7. Mol. Biol. Evol. 29, 1969–1973. doi: 10.1093/molbev/mss075
Excoffier, L., and Lischer, H. E. L. (2010). Arlequin suite ver 3.5: a new series of programs to perform population genetics analyses under Linux and Windows. Mol. Ecol. Resour. 10, 564–567. doi: 10.1111/j.1755-0998.2010.02847.x
Ezard, T., Fujisawa, T., and Barraclough, T. G. (2009). Splits: Species’ Limits By Threshold Statistics. R package version 1.0. Available online at: http://R-Forge.R-project.org/projects/splits/
Folmer, O., BLACK, M., Hoeh, W., Lutz, R., and Vrijenhoek, R. (1994). DNA primers for amplification of mitochondrial cytochrome c oxidase subunit I from diverse metazoan invertebrates. Mol. Mar. Biol. Biotechnol. 3, 294–299.
Fu, Y.-X. (1997). Statistical tests of neutrality of mutations against population growth, hitchhiking and background selection. Genetics 147, 915–925. doi: 10.1093/genetics/147.2.915
Fujisawa, T., and Barraclough, T. G. (2013). Delimiting species using single-locus data and the generalized mixed yule coalescent approach: a revised method and evaluation on simulated data sets. Syst. Biol. 62, 707–724. doi: 10.1093/sysbio/syt033
Fuxue, L., and Zhang, B. (1959). Studies on the pinnidae of fukien province. J. Xiamen Univ. (Nat. Sci.) 2, 78–103.
Goldstein, P. Z., and DeSalle, R. (2011). Integrating DNA barcode data and taxonomic practice: determination, discovery, and description. Bioessays 33, 135–147. doi: 10.1002/bies.201000036
Guindon, S., Dufayard, J.-F. O., Lefort, V., Anisimova, M., Hordijk, W., and Gascuel, O. (2010). New algorithms and methods to estimate maximum-likelihood phylogenies: assessing the performance of PhyML 3.0. Syst. Biol. 59, 307–321. doi: 10.1093/sysbio/syq010
Guo, X., Zhao, D., Jung, D., Li, Q., Kong, L.-F., Ni, G., et al. (2015). Phylogeography of the rock shell thais clavigera (Mollusca): evidence for long-distance dispersal in the Northwestern Pacific. PLoS One 10:e0135540. doi: 10.1371/journal.pone.0129715
Hashimoto, K., Yamada, K., Nagae, A., and Matsuyama, Y. (2018). Lineage specific detection of the scaly form of the pen shell Atrina spp. by a loop-mediated isothermal amplification method. Fish. Sci. 84, 837–848. doi: 10.1007/s12562-018-1231-4
Hellberg, M. E., and Vacquier, V. D. (1999). Rapid evolution of fertilization selectivity and lysin cDNA sequences in teguline gastropods. Mol. Biol. Evol. 16, 839–848. doi: 10.1093/oxfordjournals.molbev.a026168
Hewitt, G. (2000). The genetic legacy of the quaternary ice ages. Nature 405, 907–913. doi: 10.1038/35016000
Ho, S. Y., and Shapiro, B. (2011). Skyline−plot methods for estimating demographic history from nucleotide sequences. Mol. Ecol. Resour. 11, 423–434. doi: 10.1111/j.1755-0998.2011.02988.x
Hu, Z.-M., Kantachumpoo, A., Liu, R.-Y., Sun, Z.-M., Yao, J.-T., Komatsu, T., et al. (2018). A late pleistocene marine glacial refugium in the south-west of Hainan Island, China: phylogeographical insights from the brown alga Sargassum polycystum. J. Biogeogr. 45, 355–366. doi: 10.1111/jbi.13130
Kessing, B., Croom, H., Mcintosh, A., McMillan, O., and Palumbi, S. (1989) The Simple Fool’s Guide to PCR. Honolulu, HI: Department of Zoology, University of Hawaii.
Kim, D., Hyun Soo, R., and Jongwoo, J. (2017). Mitochondrial genetic variation of pen shell, Atrina pectinata in Korea and Japan. Anim. Syst. Evolut. Divers. 33, 169–175.
Kimura, M. (1980). A simple method for estimating evolutionary rates of base substitutions through comparative studies of nucleotide sequences. J. Mol. Evol. 16, 111–120. doi: 10.1007/bf01731581
Larkin, M. A., Blackshields, G., Brown, N. P., Chenna, R., McGettigan, P. A., McWilliam, H., et al. (2007). Clustal W and Clustal X version 2.0. Bioinformatics 23, 2947–2948. doi: 10.1093/bioinformatics/btm404
Lemer, S., Buge, B., Bemis, A., and Giribet, G. (2014). First molecular phylogeny of the circumtropical bivalve family Pinnidae (Mollusca, Bivalvia): evidence for high levels of cryptic species diversity. Mol. Phylogenet. Evol. 75, 11–23. doi: 10.1016/j.ympev.2014.02.008
Lemer, S., Combosch, D., Sotto, F., Dumale, D., and Giribet, G. (2016). The family pinnidae (Bivalvia) in the Philippine archipelago: observations on its distribution and phylogeography. Nautilus 130, 137–145.
Li, S., Li, Q., Yu, H., Kong, L., and Liu, S. (2015). Genetic variation and population structure of the Pacific oyster Crassostrea gigas in the northwestern Pacific inferred from mitochondrial COI sequences. Fish. Sci. 81, 1071–1082. doi: 10.1007/s12562-015-0928-x
Liu, J., Cui, D., Wang, H., Chen, J., Liu, H., and Zhang, H. (2020). Extensive cryptic diversity of giant clams (Cardiidae: Tridacninae) revealed by DNA-sequence-based species delimitation approaches with new data from Hainan Island, South China Sea. J. Molluscan Stud. 86, 56–63. doi: 10.1093/mollus/eyz033
Liu, J., Li, Q., Kong, L., and Zheng, X. (2011). Cryptic diversity in the pen shell Atrina pectinata (Bivalvia: Pinnidae): high divergence and hybridization revealed by molecular and morphological data. Mol. Ecol. 20, 4332–4345. doi: 10.1111/j.1365-294x.2011.05275.x
Maggs, C. A., Castilho, R., Foltz, D., Henzler, C., Jolly, M. T., Kelly, J., et al. (2008). Evaluating signatures of glacial refugia for North Atlantic benthic marine taxa. Ecology 89(11 Suppl), S108–S122.
Marko, P. B., Hoffman, J. M., Emme, S. A., McGovern, T. M., Keever, C. C., and Cox, L. N. (2010). The ‘expansion-contraction’ model of pleistocene biogeography: rocky shores suffer a sea change? Mol. Ecol. 19, 146–169. doi: 10.1111/j.1365-294x.2009.04417.x
Narum, S. R. (2006). Beyond bonferroni: less conservative analyses for conservation genetics. Conserv. Genet. 7, 783–787. doi: 10.1007/s10592-005-9056-y
Ni, G., Li, Q., Kong, L., and Yu, H. (2014). Comparative phylogeography in marginal seas of the northwestern Pacific. Mol. Ecol. 23, 534–548. doi: 10.1111/mec.12620
Ni, G., Li, Q., Kong, L., and Zheng, X. (2012). Phylogeography of bivalve Cyclina sinensis: testing the historical glaciations and Changjiang River outflow hypotheses in northwestern Pacific. PLoS One 7:e49487. doi: 10.1371/journal.pone.0049487
Park, J. K., and Foighil, D. Ó. (2000). Sphaeriid and corbiculid clams represent separate heterodont bivalve radiations into freshwater environments. Mol. Phylogenet. Evol. 14, 75–88. doi: 10.1006/mpev.1999.0691
Posada, D., and Crandall, K. A. (1998). Modeltest: testing the model of DNA substitution. Bioinformatics 14, 817–818. doi: 10.1093/bioinformatics/14.9.817
Previšić, A., Gelemanović, A., Urbanič, G., and Ternjej, I. (2016). Cryptic diversity in the Western Balkan endemic copepod: four species in one? Mol. Phylogenet. Evol. 100, 124–134. doi: 10.1016/j.ympev.2016.04.010
Puillandre, N., Lambert, A., Brouillet, S., and Achaz, G. (2012). ABGD, automatic barcode gap discovery for primary species delimitation. Mol. Ecol. 21, 1864–1877. doi: 10.1111/j.1365-294x.2011.05239.x
Quesada, H., Posada, D., Caballero, A., Morán, P., and Rolán-Alvarez, E. (2007). Phylogenetic evidence for multiple sympatric ecological diversification in a marine snail. Evolution 61, 1600–1612. doi: 10.1111/j.1558-5646.2007.00135.x
Rambaut, A., and Drummond, A. (2007). Tracer v1.5. Available online at: http://tree.bio.ed.ac.uk/software/tracer (accessed February 20, 2020).
Reeve, L. A. (1858). “Monograph of the genus pinna,” in Conchologia Iconica, Or, Illustrations Of The Shells Of Molluscous Animals, Vol. 11, (London: L. Reeve & Co), 1–34.
Richards, E. J., Servedio, M. R., and Martin, C. H. (2019). Searching for sympatric speciation in the genomic era. bioRxiv [Preprint] doi: 10.1002/bies.201900047 bioRxiv: 367623
Rippe, J. P., Dixon, G., Fuller, Z. L., Liao, Y., and Matz, M. (2021). Environmental specialization and cryptic genetic divergence in two massive coral species from the Florida keys reef tract. Mol. Ecol. 30, 3468–3484. doi: 10.1111/mec.15931
Rogers, A. R., and Harpending, H. (1992). Population growth makes waves in the distribution of pairwise genetic differences. Mol. Biol. Evol. 9, 552–569.
Ronquist, F., Teslenko, M., van der Mark, P., Ayres, D. L., Darling, A., Hohna, S., et al. (2012). MrBayes 3.2: efficient bayesian phylogenetic inference and model choice across a large model space. Syst. Biol. 61, 539–542. doi: 10.1093/sysbio/sys029
Rozas, J., Ferrer-Mata, A., Sánchez-DelBarrio, J. C., Guirao-Rico, S., Librado, P., Ramos-Onsins, S. E., et al. (2017). DnaSP 6: DNA sequence polymorphism analysis of large datasets. Mol. Biol. Evol. 34, 3299–3302. doi: 10.1093/molbev/msx248
Sun, S., Li, Q., Kong, L., Yu, H., Zheng, X., Yu, R., et al. (2016). DNA barcoding reveal patterns of species diversity among northwestern Pacific molluscs. Sci. Rep. 6:33367.
Swofford, D. (2002). PAUP 4.0 b10: Phylogenetic Analysis Using Parsimony. Sunderland, MA: Sinauer Associates.
Tajima, F. (1989). Statistical method for testing the neutral mutation hypothesis by DNA polymorphism. Genetics 123, 585–595. doi: 10.1093/genetics/123.3.585
Tamura, K., Stecher, G., Peterson, D., Filipski, A., and Kumar, S. (2013). MEGA6: molecular evolutionary genetics analysis Version 6.0. Mol. Biol. Evol. 30, 2725–2729. doi: 10.1093/molbev/mst197
Wang, J., Tsang, L. M., and Dong, Y. W. (2015). Causations of phylogeographic barrier of some rocky shore species along the Chinese coastline. BMC Evol. Biol. 15: 114. doi: 10.1186/s12862-015-0387-0
Wang, M., Yu, X., Yang, S., and Gui, J. (2000). A comparative study on isozyme phenotypic divergence among four types of pen shell Atrina pectinata Linnaeus. Tropic Oceanol. 19, 45–50.
Wiens, J. J., and Servedio, M. R. (2000). Species delimitation in systematics: inferring diagnostic differences between species. Proc. R. Soc. Lond. Ser. B 267, 631–636. doi: 10.1098/rspb.2000.1049
Xue, D., Wang, H., Zhang, T., Gao, Y., Zhang, S., and Xu, F. (2012). Morphological and genetic identification of the validity of the species Atrina chinensis (Bivalvia: Pinnidae). J. Shellfish Res. 31, 739–747. doi: 10.2983/035.031.0318
Xue, D.-X., Wang, H.-Y., Zhang, T., and Liu, J.-X. (2014). Population genetic structure and demographic history of Atrina pectinata based on mitochondrial DNA and microsatellite markers. PLoS One 9:e95436. doi: 10.1371/journal.pone.0095436
Yang, Z. (2015). The BPP program for species tree estimation and species delimitation. Curr. Zool. 61, 854–865. doi: 10.1093/czoolo/61.5.854
Yang, Z., and Rannala, B. (2010). Bayesian species delimitation using multilocus sequence data. Proc. Natl. Acad. Sci. U.S.A. 107:9264. doi: 10.1073/pnas.0913022107
Ye, Y. Y., Wu, C. W., and Li, J. J. (2015). Genetic population structure of Macridiscus multifarius (Mollusca: Bivalvia) on the basis of mitochondrial markers: strong population structure in a species with a short planktonic larval stage. PLoS One 10:e0146260. doi: 10.1371/journal.pone.0146260
Yu, F.-F., Zhi-Ming, Z., Su-Fang, N., Xiao-Dong, D., Kai-Hang, X., Zi-Teng, L., et al. (2019). Genetic diversity of Atrina pectinata from the northern South China Sea based on mitochondrial DNA COI sequence. Acta Hydrobiol. Sin. 43, 494–503.
Yu, X., Mao, Y., Wang, M., Zhou, L., Gui, J., Yu, X., et al. (2004). Genetic heterogeneity analysis and RAPD marker detection among four forms of Atrina pectinata Linnaeus. J. Shellfish Res. 23, 165–171.
Yu, X.-Y., Wang, M., Li, H.-W., and Cai, Y.-Y. (2000). Comparison on morphological difference inside species of pen shell Atrina pectinata. Tropic Oceanol. 19, 39–43.
Keywords: South China Sea, phylogeography, taxonomic revision, species identification and delimitation, Atrina pectinata species complex
Citation: Xue D-X, Wang H-Y and Zhang T (2021) Phylogeography and Taxonomic Revision of the Pen Shell Atrina pectinata Species Complex in the South China Sea. Front. Mar. Sci. 8:753553. doi: 10.3389/fmars.2021.753553
Received: 05 August 2021; Accepted: 27 September 2021;
Published: 18 October 2021.
Edited by:
Jin Sun, Ocean University of China, ChinaReviewed by:
Yi Lan, Hong Kong University of Science and Technology, Hong Kong SAR, ChinaÖzgül Doğan, Cumhuriyet University, Turkey
Copyright © 2021 Xue, Wang and Zhang. This is an open-access article distributed under the terms of the Creative Commons Attribution License (CC BY). The use, distribution or reproduction in other forums is permitted, provided the original author(s) and the copyright owner(s) are credited and that the original publication in this journal is cited, in accordance with accepted academic practice. No use, distribution or reproduction is permitted which does not comply with these terms.
*Correspondence: Tao Zhang, dHpoYW5nQHFkaW8uYWMuY24=