 Linlong Wang
 Li Lin1
 Lu Zhai
 Shen Ye
- 1Fisheries College, Ocean University of China, Qingdao, China
- 2The Key Laboratory of Sustainable Exploitation of Oceanic Fisheries Resources, National Engineering Research Center for Oceanic Fisheries, College of Marine Science, Shanghai Ocean University, Shanghai, China
- 3Zhejiang Mariculture Research Institute, Wenzhou, China
- 4Zhejiang Key Laboratory of Exploitation and Preservation of Coastal Bio-Resource, Wenzhou, China
China has become the largest contributor to marine fisheries in the world with its fishing fleets explosively increasing their fishing effort and resulting catch, but its fishery composition and sustainability have deteriorated. Limited information on fishery exploitation status encumbers effective resource management. In this study, a data-poor Monte Carlo method, the Catch-Maximum Sustainable Yield (CMSY) method, was used to estimate the historical exploited dynamics and current stock status of ten Chinese economic marine fish stocks, including Trichiurus lepturus, Larimichthys crocea, Larimichthys polyactis, Thamnaconus modestus, Scomberomorus niphonius, Ilisha elongate, Decapterus maruadsi, Scomber japonicus, Engraulis japonicus, and Clupea pallasii, which accounted for about 50% of total fish catches in the coastal waters of China and covered five functional groups (i.e., large, medium benthopelagic, large, medium, and small pelagic). Species L. crocea and L. polyactis had been subjected to overfishing since the 1950s. The others showed a decreasing trend in biomass along with the explosively increasing fishing efforts since the 1990s. Benthopelagic fish experienced overfishing pressure about a decade earlier than pelagic species. All the fish stocks investigated in this study were depleted (current biomass lower than the biomass capable of producing maximum sustainable yields, i.e., B < Bmsy) in 2019, and most species were still facing high-fishing pressure (current fishing mortality higher than the mortality capable of producing maximum sustainable yields, i.e., F > Fmsy). Also, a Schaefer model was used to assess stocks rebuilding status until 2030 under four exploitation scenarios, i.e., fishing mortality equals 0.5, 0.6, 0.8, or 0.95 times Fmsy. Most species stocks will likely recover to the Bmsy, which indicates that reduction of fishing pressure is probably the most effective way for fishery recovery.
Introduction
Overfishing has altered structures of fish population (Zhang W. et al., 2019) and caused the continual decline of global fisheries (Link and Watson, 2019). The total fishing vessel power in China had incredibly increased from 0.02 × 10⁶ kilowatts (kW) in 1951 to 140 × 106 kW in 2017 (Ministry of agriculture of China, 2017), which contributed to the highest marine fishery catches in the world (Cao et al., 2015; FAO, 2016). However, the aggravating fishing pressure has imposed a significant impact on fish stocks (Shan et al., 2011, 2013; Zhang W. et al., 2019) and changed fishery composition (Li et al., 2011; Shan et al., 2013). For example, the catch per unit effort (CPUE) in the Bohai Sea in 2011 (3.62 kg⋅haul–1⋅h–1) has dropped to 0.86% of that in 1959 (421.66 kg⋅haul–1⋅h–1) (Shan et al., 2013; Zhang W. et al., 2019), and the dominant species had been altered from the high-valued and large-sized species, e.g., largehead hairtail Trichiurus lepturus, to the species in lower trophic level, such as Scaly hairfin anchovy Setipinna taty and Japanese anchovy Engraulis japonicus. In the Yellow Sea and the East China Sea, CPUE has reduced 46.7% from 1991 (73.54 kg⋅haul–1⋅h–1) to 2000 (39.19 kg⋅haul–1⋅h–1), accompanied by miniaturization and early maturing of catch species (Cheng and Yu, 2004; Li et al., 2011). In the South China Sea, overfishing was the main driver that led to the biomass declination of fishery resources (Zhang W. et al., 2019) and even to the extinction of some coral reef fishes (Arai, 2015).
Fisheries can be managed effectively when understanding the population exploited status through the stock assessment (Demirel et al., 2020). Comprehensive stock assessments based on biological characteristics (e.g., life history and age) have been implemented in some developed countries for many fishes, and specific requirements for rebuilding fisheries have been proposed (Ricard et al., 2012; Free et al., 2020). For example, the Common Fisheries Policy (CFP) of the European Union has become a basic legally binding regulation (Froese et al., 2018), which explicitly required that the biomass (B2020) of all commercially developed fish stocks should be rebuilt above the level at which the biomass is capable of producing the best maximum sustainable yields (Bmsy) by 2020. Even so, the majority of fish stocks in other parts of the world remain unassessed (Costello et al., 2012), which hindered the development of species-specific management. For example, the Mediterranean and Black Seas were generally classified as “fishery data-poor regions” due to unavailable landing yields, insufficient biological data, and lack of stock assessment (Demirel et al., 2020). Similarly in China, fishery resources are still poorly managed due to a lack of effective data accumulation.
The Monte Carlo Catch-Maximum Sustainable Yield (CMSY) method is a data-poor and low-cost assessment approach that relies on less input, including time-series data of catch, maximum intrinsic rate of population increase (r), and the ratio of biomass to carrying capacity (B/k) at the beginning and the end of the time series. The current biomass status (Bend/Bmsy) and remaining level of exploitation (Fend/Fmsy) obtained from CMSY provide references to promote effective management toward fishery sustainability and useful information for the recovery of the overexploited stocks (Martell and Froese, 2013; Froese et al., 2017). In Europe, CMSY indicated that 69% of the stocks were suffering from overfishing when evaluating the current status and exploitation patterns of fisheries based on catch data since 2000. However, by reducing 40–50% fishing efforts, nearly 80% of stocks could rebuild in 10 years with higher catches than currently obtained (Froese et al., 2018). Demirel et al. (2020) examined the exploitation levels of 34 species utilizing CMSY analyses in the Black Sea and the Mediterranean Sea and proposed that 85% of them were overfished. They also estimated the stock rebuilding time under four varying scenarios and suggested more than 60% of the populations could recovery by 2032 under the scenario of fishing mortality (F) equals 0.5 Fmsy (the fishing mortality capable of producing maximum sustainable yields).
In this study, based on the time-serial catch data extracted from China Fishery Statistical Yearbook, ten coastal economic fish species, accounting for approximate 50% of Chinese total domestic landing catch (Ministry of agriculture of China, 2019), were selected to estimate their historical dynamics using the CMSY model, including T. lepturus, large yellow croaker Larimichthys crocea, small yellow croaker Larimichthys polyactis, black scraper Thamnaconus modestus, Japanese Spanish mackerel Scomberomorus niphonius, Elongate ilisha Ilisha elongate, Japanese scad Decapterus maruadsi, Pacific chub mackerel Scomber japonicus, E. japonicus, and Pacific herring Clupea pallasii. These species included top predators, middle carnivores, omnivores, and plankton feeders, which covered the large benthopelagic, medium benthopelagic, large pelagic, medium pelagic, and small pelagic groups of species. Then, the reference points for management such as MSY, current exploited status (B2019/Bmsy), and remaining level of exploitation (F2019/Fmsy) of these species were modeled. Finally, the fishery rebuilding trajectories under different exploitation scenarios, i.e., fishing mortality equals 0.5, 0.6, 0.8, or 0.95 times mortality capable of producing maximum sustainable yields (0.5 Fmsy, 0.6 Fmsy, 0.8 Fmsy, or 0.95 Fmsy), were projected. We hope this work could help giving recovery opinions to sustainable fishery management.
Materials and Methods
Data Sets
All the data for the analysis were extracted from China Fishery Statistical Yearbooks (Ministry of Agriculture of China, 1956–2019) and were shown in Supplementary Table 1. More than 30-year catch data were selected to improve the model performance (Table 1).
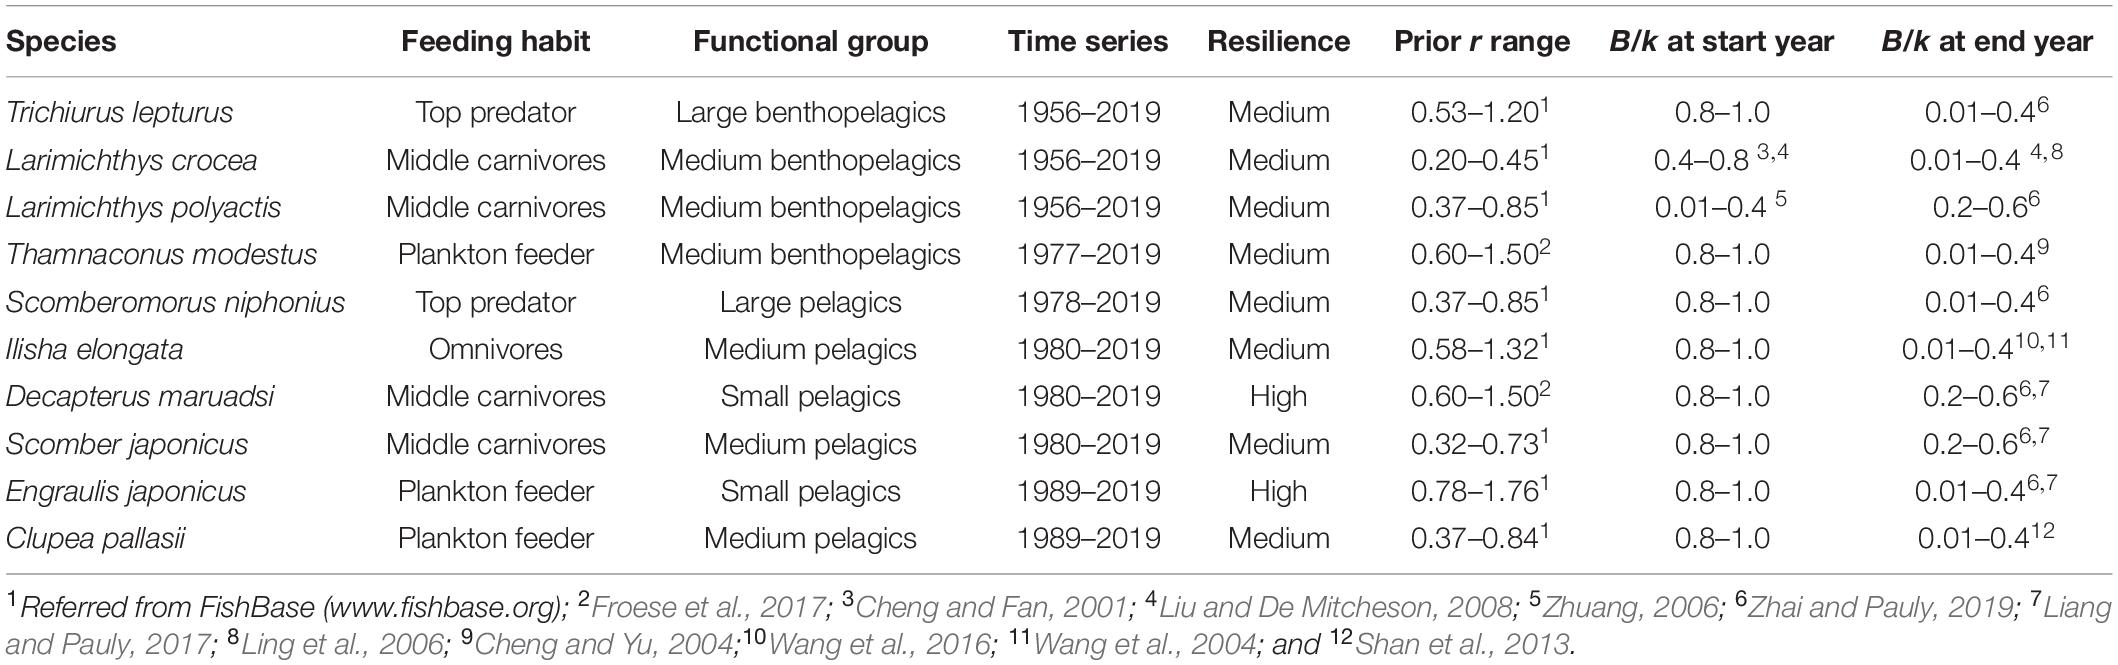
Table 1. The prior range for r and B/k and other information of the investigated stocks in China.
Catch-Maximum Sustainable Yield Modeling
Using the maximum intrinsic rate of population increase (r), catch data, and stock status (B/k) at the beginning year and the end year as a prior input, CMSY based on the Monte Carlo approach estimates fishery reference indices, including viable r-k (maximum intrinsic rate of population increase and carrying capacity) and fishery reference points for management (e.g., MSY, B2019/Bmsy, and F2019/Fmsy). Values of r (Table 1) were obtained from FishBase1 or estimated by the empirical equation (Froese et al., 2017):
where, r is maximum intrinsic rate of population increase, M is natural mortality, Fmsy is fishing mortality at the maximum sustainable yields, K is von-Bertalanffy somatic growth rate, tgen is generation time, and tmax is the maximum age. CMSY requires “expert” prior information of biomass consumption (i.e., very low, low, medium, strong, and very strong depletion) specified at the beginning and end of the time series and also the relative biomass range suggested by Froese et al. (2017) and CMSY User Guide2. In this study, given the low total power of fishing boats before the mid-1980s (Supplementary Table 1), the depletion status of each species at the start year was defined as “very low depletion” (prior B/k range: 0.8–1.0), except values of L. crocea and L. polyactis directly from relevant studies (Cheng and Fan, 2001; Zhuang, 2006; Liu and De Mitcheson, 2008). The prior ranges of B/k at the end year of the time series of all the species were cited from previous stock assessments in Chinese coastal waters (Cheng and Yu, 2004; Wang et al., 2004, 2016; Ling et al., 2006; Liu and De Mitcheson, 2008; Shan et al., 2013; Liang and Pauly, 2017; Zhai and Pauly, 2019).
The Catch-Maximum Sustainable Yield method determines the prior range of k by Equation (2) for lower relative biomass or Equation (3) with higher biomass in the end year (Froese et al., 2017):
where, klow and khigh are the lower and upper bounds for k respectively, max (C) is the recorded maximum catch, and rlow and rhigh are the bounds for prior r values.
The r-k pairs from the prior input were randomly selected in the first year to predict biomass in subsequent years along the time series using Equation (4) (Schaefer, 1954):
where, Bt is biomass in year t, r is the maximum intrinsic rate of population increase, k is carrying capacity, and Ct is a catch in year t. When Bt+1 is not smaller than 0.01 k and the predicted value of final biomass falls into the prior range, the corresponding r-k pair is feasible and can be retained. CMSY will subsequently calculate the MSY, Bmsy, Ft, and Fmsy using Equations (5–8) (Schaefer, 1954; Ricker, 1975):
Fisheries Rebuilding
Based on the estimates of B2019, Bmsy, F2019, and Fmsy by CMSY, a Schaefer model was used to assess stock rebuilding status until 2030. The time needed for rebuilding fisheries to the level of Bmsy was calculated by Equation (9) (Quinn and Deriso, 1999):
where, Δt is the time consumption, Bmsy and Fmsy are the biomass and fishing pressure that could produce MSY, B, and F as the biomass and fishing pressure at the last year.
The biomass in the next year (Bt+1) was calculated by Equations (10, 11) from the Schaefer model (Schaefer, 1954):
Four future exploitation scenarios were used to predict the stock rebuilding status until 2030: (1) 0.5 Fmsy, i.e., no fishing when biomass was lower than 0.5 Bmsy (B < 0.5); otherwise, the fishing mortality (F) equaled 0.5 Fmsy (F = 0.5 Fmsy). (2) 0.6 Fmsy, i.e., F = 0.6 Fmsy when B ≥ 0.5Bmsy; otherwise, F was linearly reduced to 0 along with the decrease in biomass when B < 0.5 Bmsy. The reduction in the fishing mortality (Freduced) was calculated in Equation (12) (Froese et al., 2018):
(3) 0.8 Fmsy exploitation scenario, F = 0.8 Fmsy when B ≥ 0.5 Bmsy; otherwise, F was also linearly reduced. (4) 0.95 Fmsy exploitation scenario, F = 0.95 Fmsy in any cases.
The change of stock biomasses and fishing catches along with rebuilding times under four exploitation scenarios was projected and presented. The catch in 2019 served as the starting year of the prediction trajectory, and the fishing pressure in 2019 was used to calculate the biomass and catches for 2020–2021. Then, resource recovery times until 2030 were predicted under these four exploitation scenarios.
All the analyses were executed in R (R Development Core Team, 2020). CMSY R codes were downloaded from http://oceanrep.geomar.de/34476/ and revised accordingly.
Results
Model Diagnostics and Prior-Posterior Variance Ratio
The model diagnostics and prior-posterior variance ratios for T. lepturus, L. crocea, I. elongate, and E. japonicus were selected as the surrogates of top predators, middle carnivores, omnivores, and plankton feeders, respectively, and shown in Supplementary Figures 1, 2. Diagnostics present a good fitting for all species, with the relative lower prior-posterior variance ratio (PPVR) of key parameters, indicating that the posterior knowledge is more improved relative to prior knowledge.
Historical Exploitation Dynamics
The historical exploitation dynamics of the ten species were presented as catches, relative biomass to the biomass capable of producing maximum sustainable yields (B/Bmsy), and relative fishing mortality to the mortality capable of producing maximum sustainable yields (F/Fmsy) (Figure 1). The F/Fmsy of two benthopelagic species, i.e., T. lepturus and T. modestus, increased sharply since the mid-1980s, with drastic changes in catches, and then B/Bmsy began to decline rapidly, with the catches reaching MSY in 1998 and 1985, respectively. Six pelagic species S. niphonius, I. elongata, D. maruadsi, S. japonicus, E. japonicus, and C. pallasii showed similar patterns with T. lepturus and T. modestus, but the timeline has been pushed back by the mid-1990s. The historical exploitation records documented that L. crocea had been overfished (F > Fmsy) since the beginning of records and showed no signs of recovery so far. Species L. polyactis sustained three stages, namely, overexploited at the beginning with biomass depletion (B < Bmsy), a contemporary recovery to some extent, and a continuously decline as a result of re-enhanced fishing pressure (Figure 1).
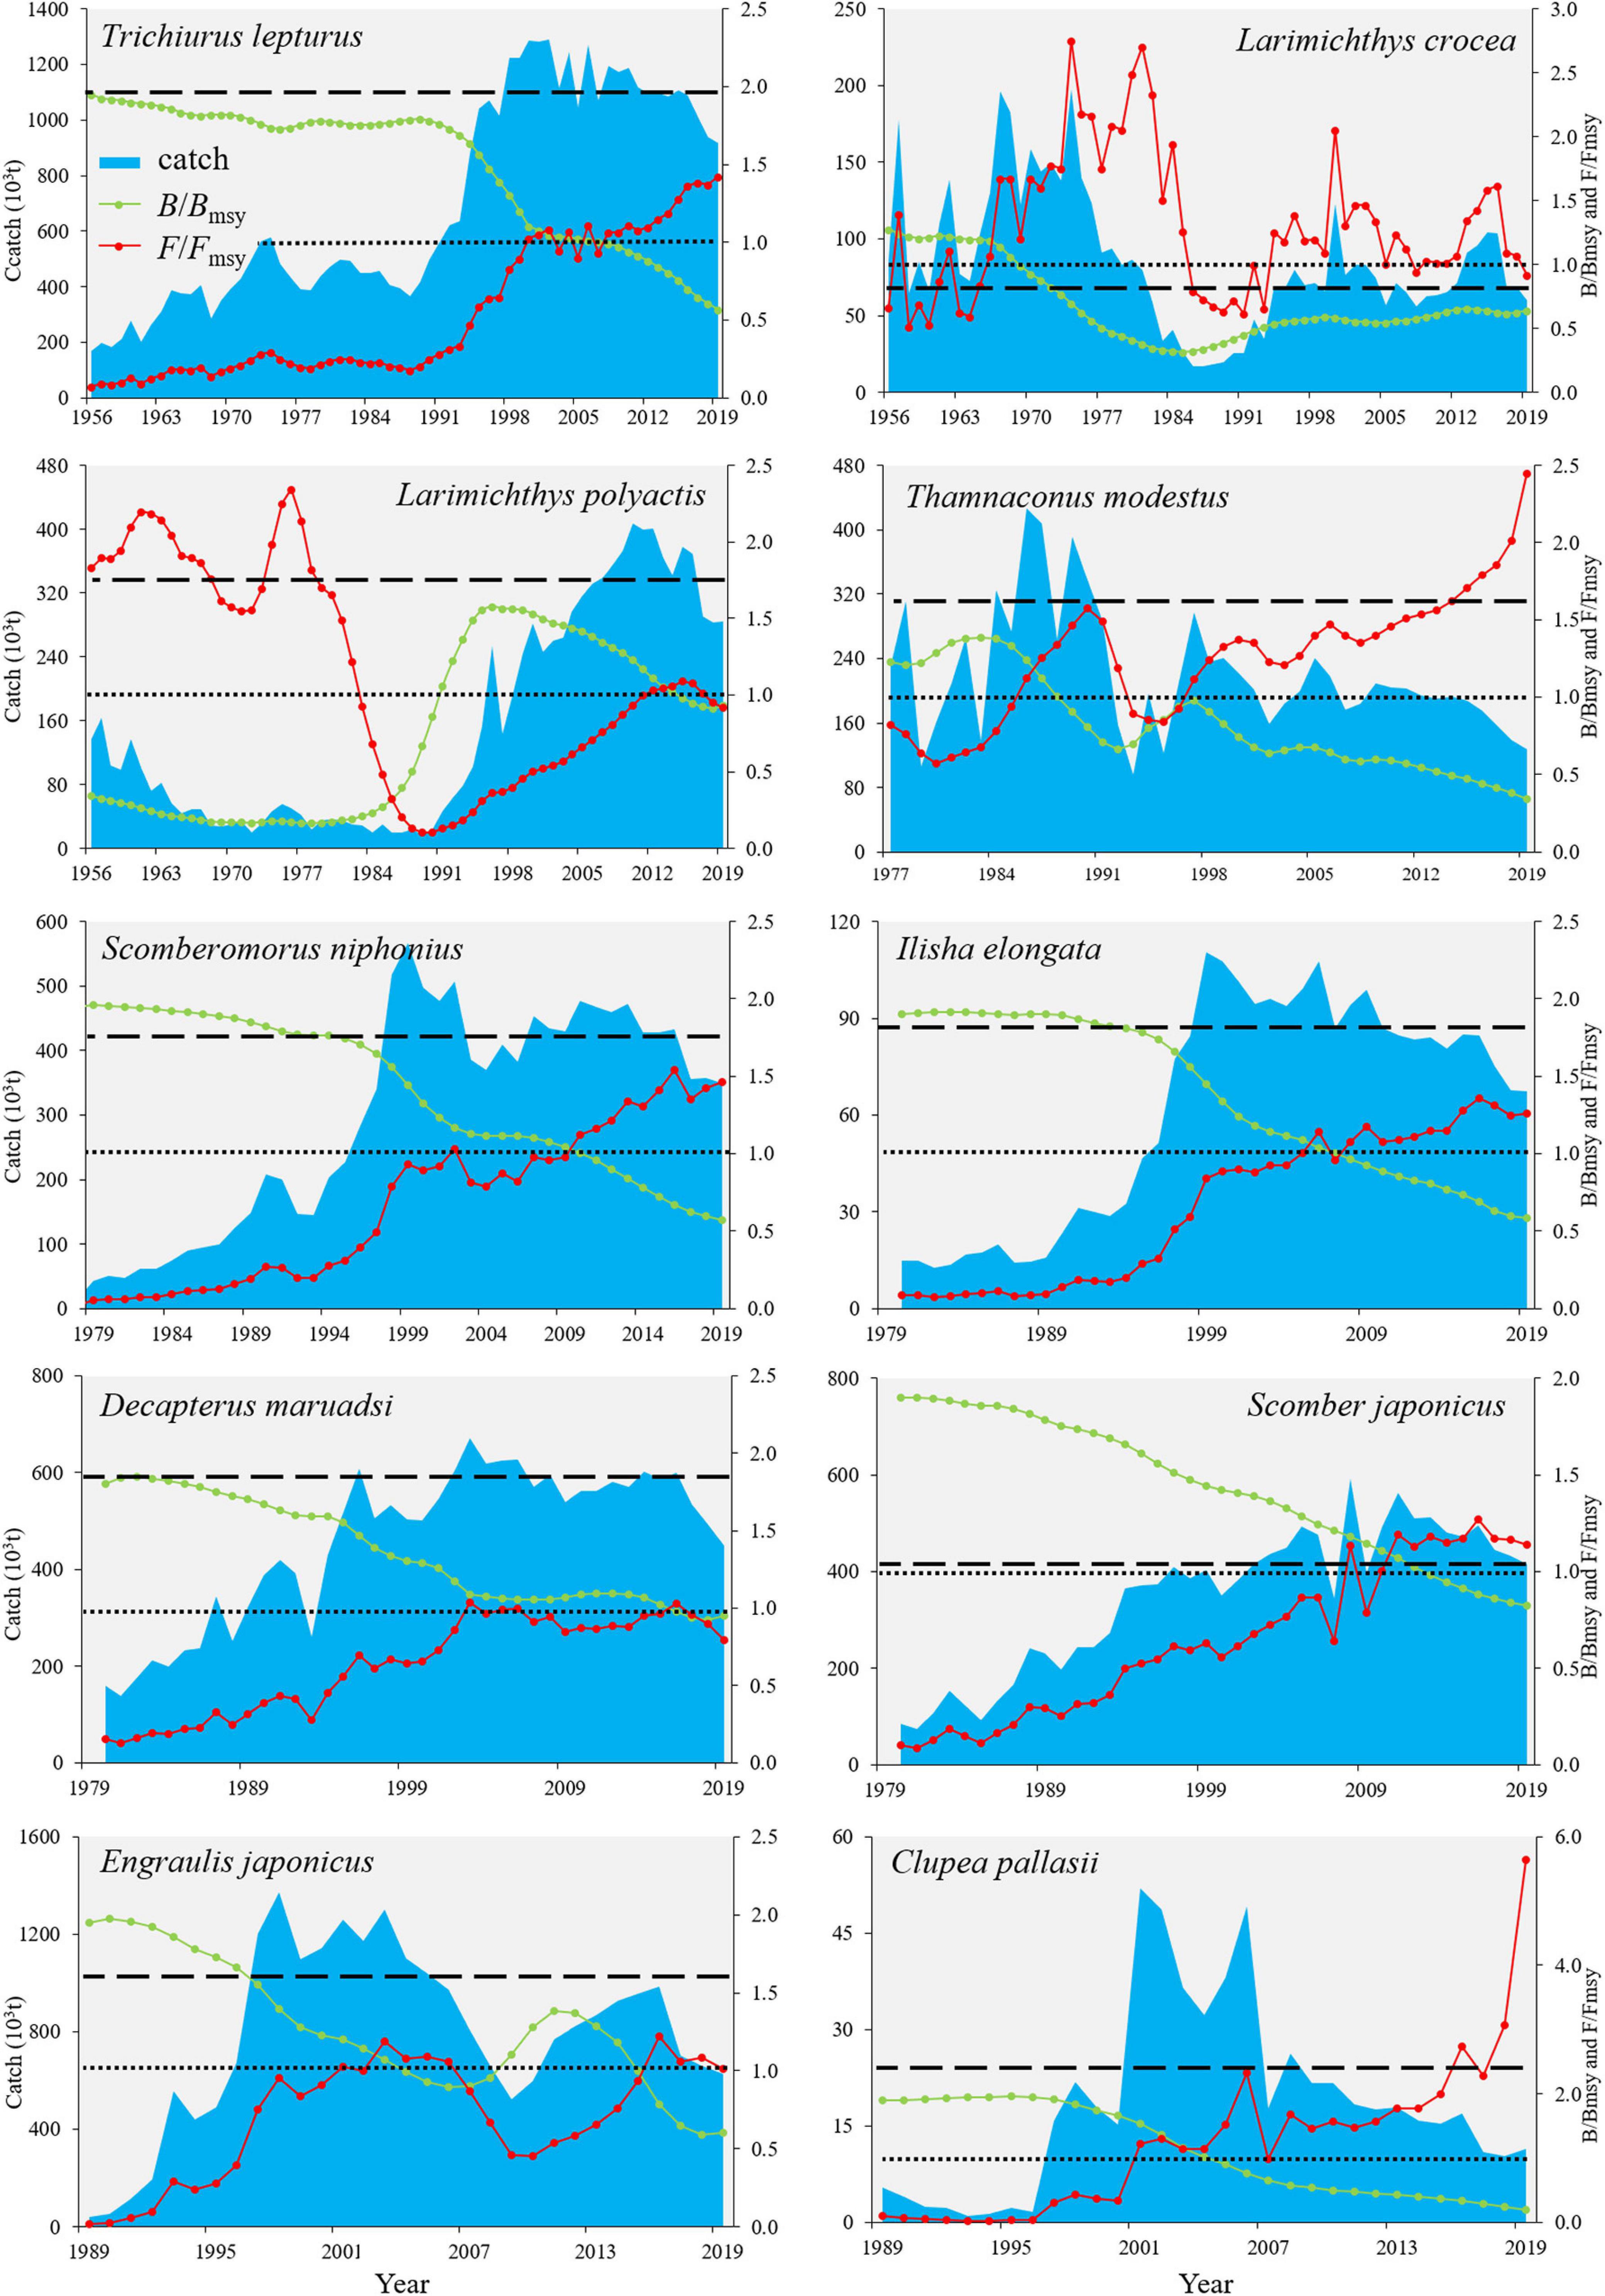
Figure 1. Time-serial stock exploitation dynamics of ten Chinese commercial fishes extracted from Catch-Maximum Sustainable Yield (CMSY) method. Dashed line indicated the maximum sustainable yield (MSY), the dotted line signified that the biomass/fishing mortality is capable of producing the best maximum sustainable yields (i.e., B/Bmsy = 1 or F/Fmsy = 1), the green line signified the relative biomass to the biomass capable of producing maximum sustainable yields (B/Bmsy), and the red line indicated the relative fishing mortality to the mortality capable of producing maximum sustainable yields (F/Fmsy).
Fisheries Reference Points for Management and Current Status
The maximum intrinsic rate of population increase (r) ranged from 0.24 of L. crocea to 1.29 of E. japonicus. Environmental carrying capacity (k) ranged from 203 × 103 metric tons of C. pallasii to 5,151 × 103 metric tons of T. lepturus. All species had fewer catches in 2019 than MSY (Table 2). Clupea pallasii had the lowest B2019/Bmsy (0.19) value, while D. maruadsi had the highest (0.95). The F2019/Fmsy ranged from 0.79 of D. maruadsi to 5.64 of C. pallasii, with the fishing mortalities for seven species of the ten were higher than Fmsy. The Kobe plot (Figure 2) based on the relationship between current exploited status (B2019/Bmsy), and the remaining level of exploitation (F2019/Fmsy) showed that seven fish species, i.e., T. lepturus, T. modestus, S. niphonius, I. elongata, S. japonicus, E. japonicus, and C. pallasii, were in the red area (B2019 < Bmsy and F2019 > Fmsy), indicating overexploited stocks that were suffering overfishing. C. pallasii was in the worst condition, followed by T. modestus. D. maruadsi, L. crocea, and L. polyactis were in the yellow area, indicating the recovering of overexploited stocks from reduced fishing pressure (Figure 2).
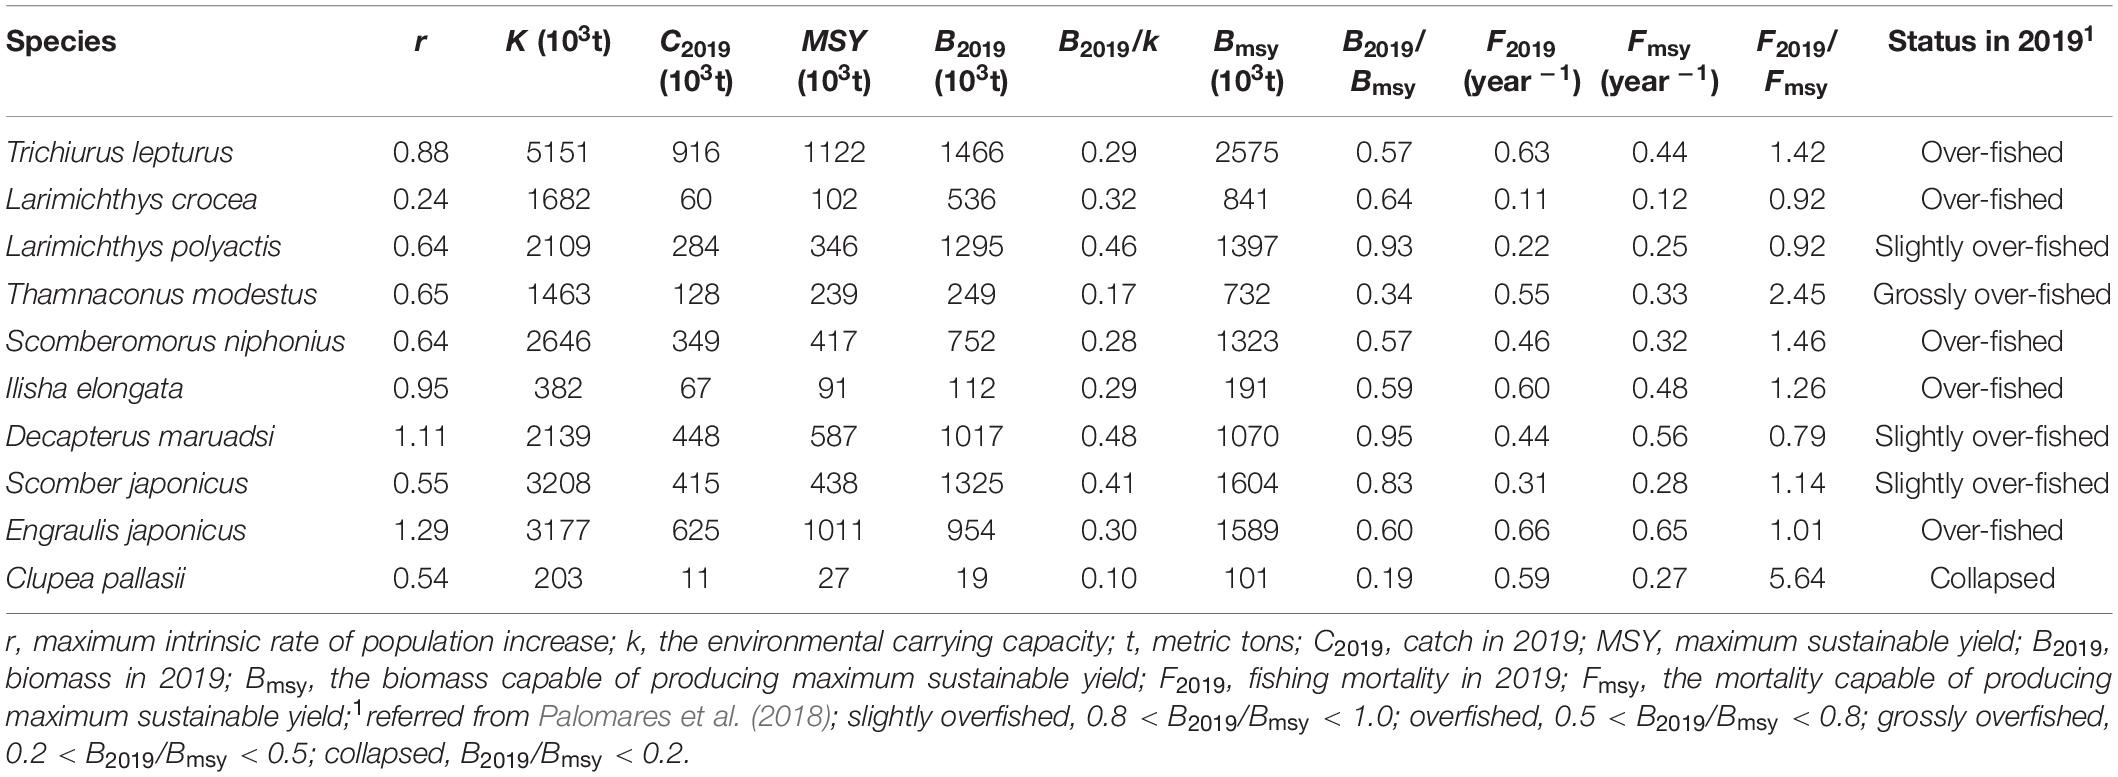
Table 2. Model outputs of reference points for fish management.
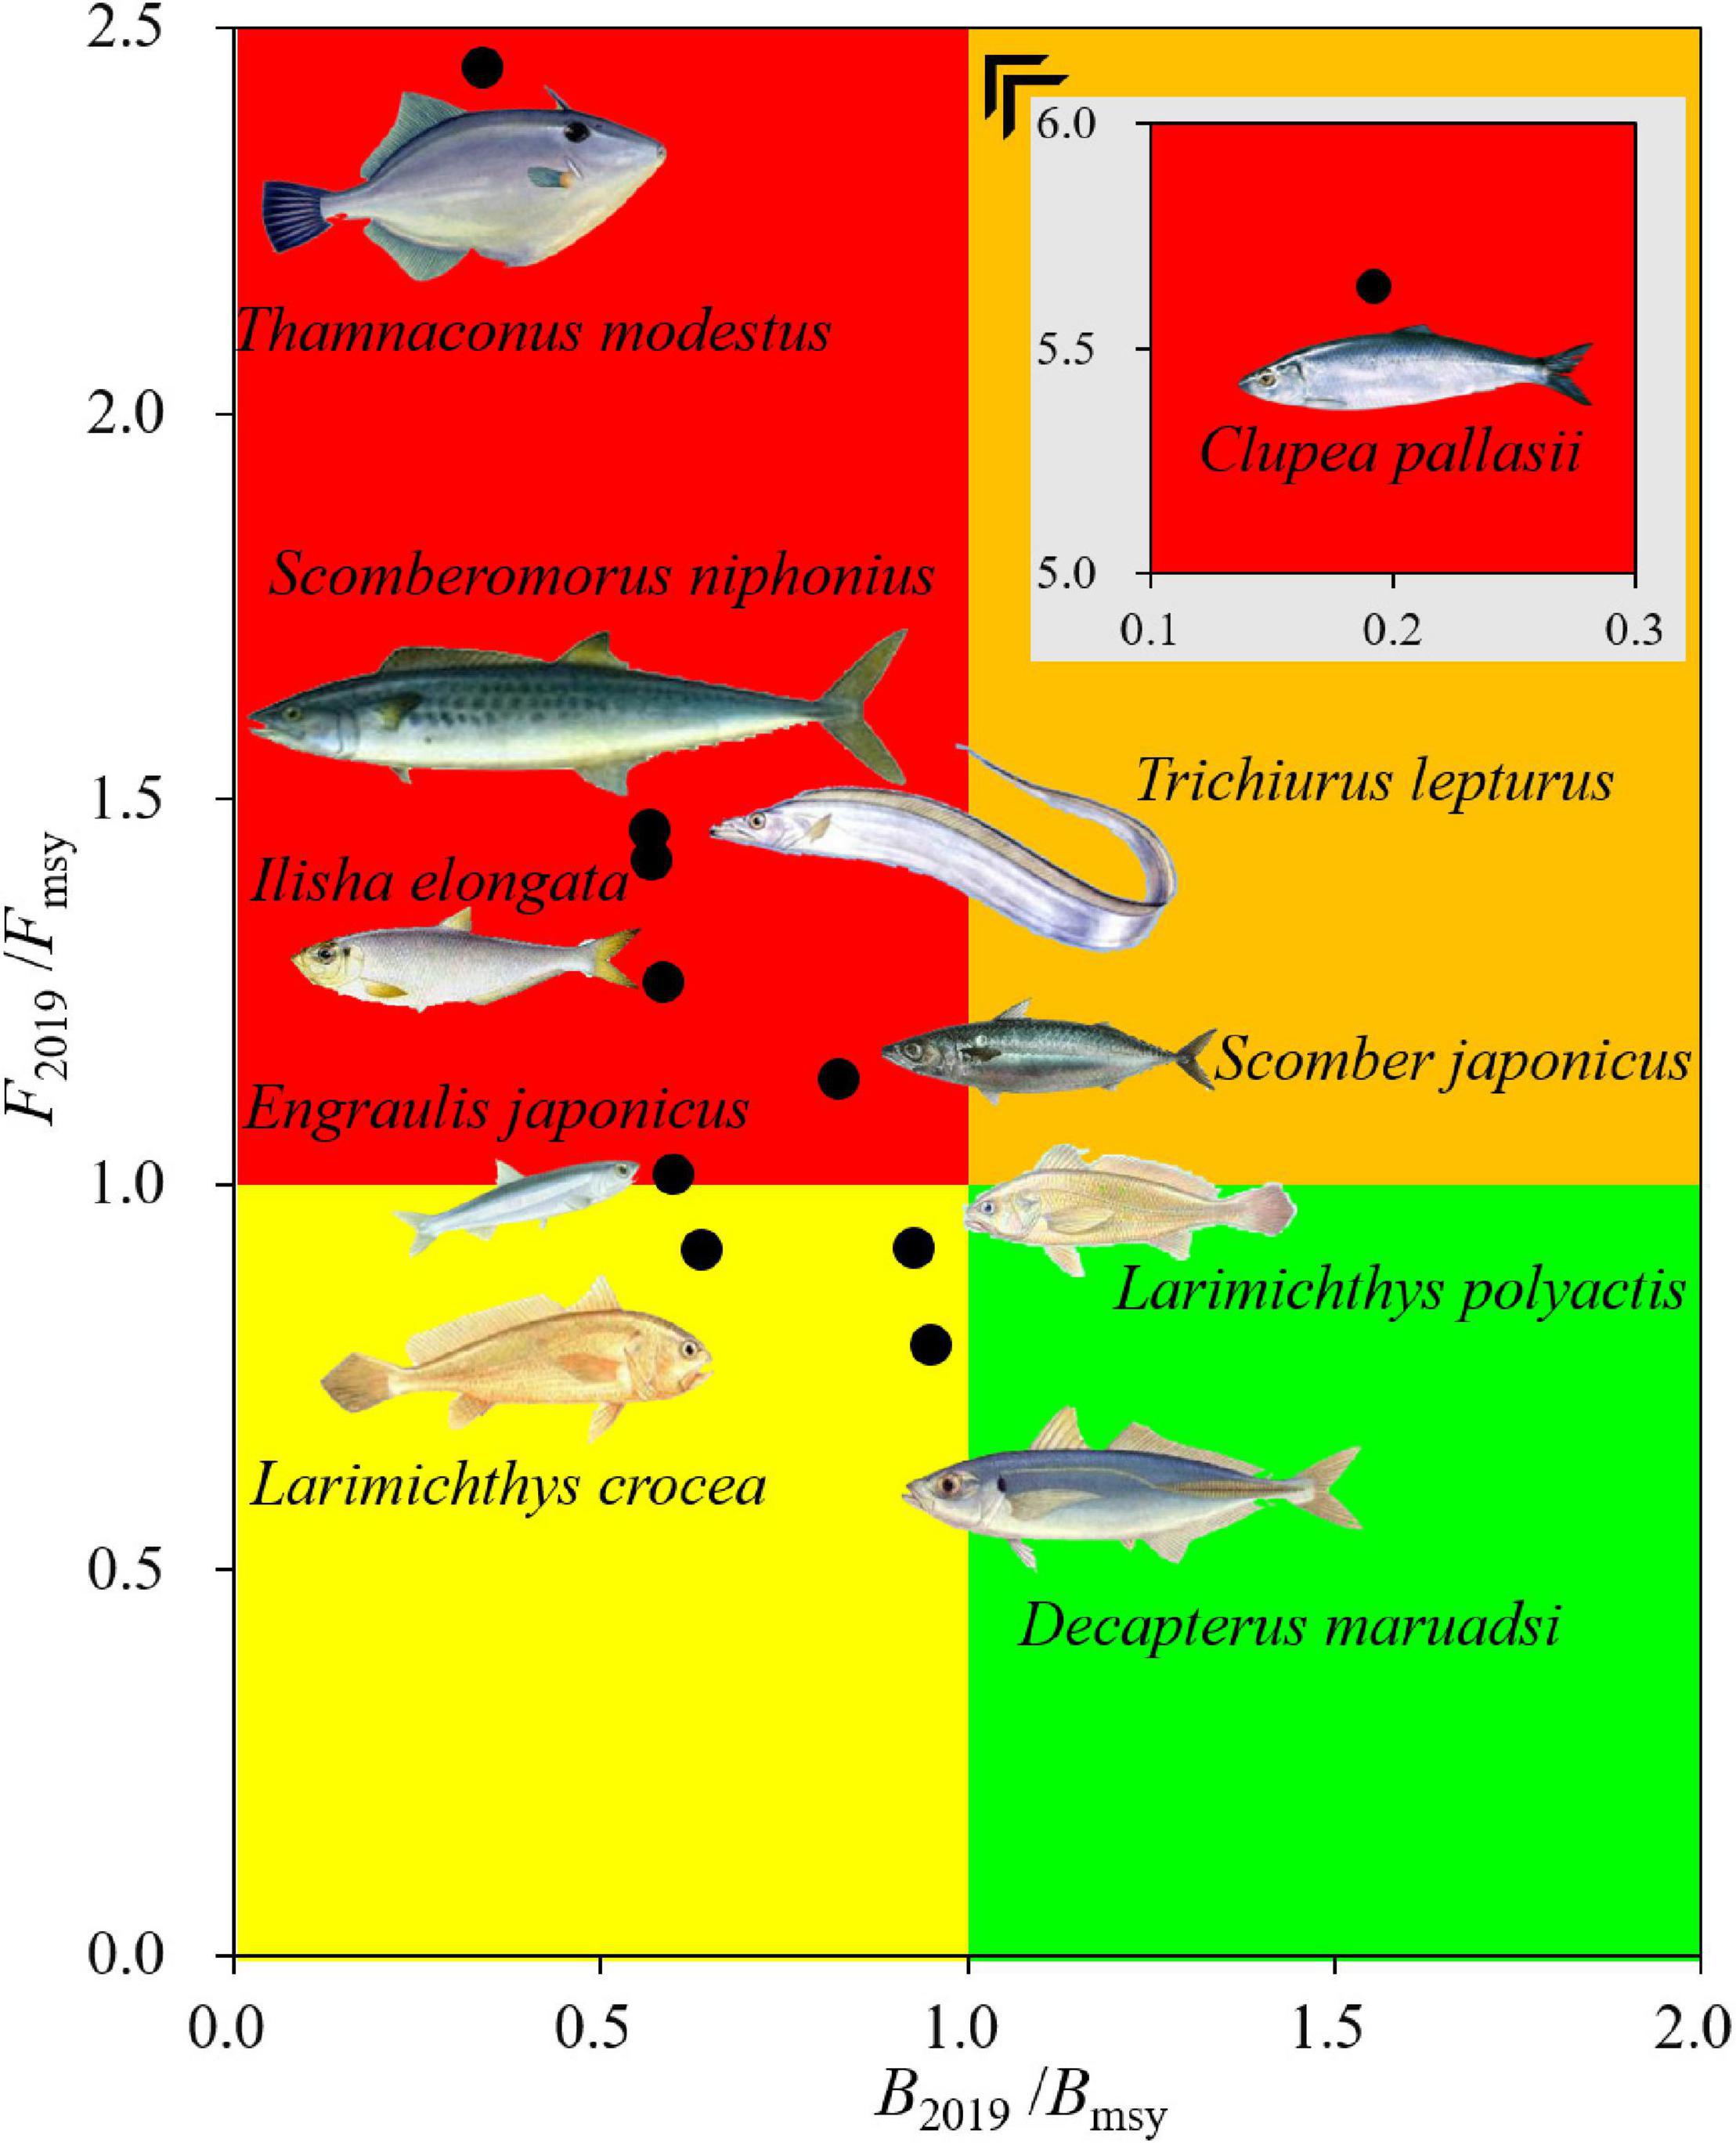
Figure 2. Fishing pressure Kobe plot for the fishes in 2019 based on current exploitation status (B2019/Bmsy) and remaining level of exploitation (F2019/Fmsy). The red area indicates the worst conditions of overexploited stocks under overfishing; the yellow area indicates recovering of overexploited stocks from reduced fishing pressure; the green area indicates a healthy stock size with sustainable fishing pressure; and the brown area indicates healthy stock sizes but facing overfishing.
Fisheries Rebuilding and Catch Changes
Under the four future predictive exploitation scenarios, most Chinese coastal fisheries show more or less recovery of biomass by 2030, and the catches are rising to similar or even higher than they were in 2019 (Table 3 and Supplementary Figure 1). Two species, T. lepturus and I. elongata were selected as the surrogates of carnivores and omnivores, respectively, to show the fishery rebuilding trajectories and catch changes (Figure 3A, other species were shown in Supplementary Figure 1). The fastest biomass recovery rate was found under the scenario of 0.5 Fmsy. Nine of the species would likely rebuild the optimum status (B2030 > Bmsy) by 2030. Under the 0.95 Fmsy scenario, the biomasses of only four species would likely reach the Bmsy. The recovery of stock biomasses under both 0.6 Fmsy and 0.8 Fmsy scenarios was intermediate, among which 0.6 scenario was faster. For catch changes, species T. lepturus, S. niphonius, and I. elongata would increase the most under the scenario of 0.8 Fmsy by 2030, while L. crocea, L. polyactis, D. maruadsi, S. japonicus, and E. japonicus increase the most under the scenario of 0.95 Fmsy (Table 3). The fishery rebuilding trajectories and catch changes of two plankton feeders T. modestus and C. pallasii were different from other species. Under the scenario of 0.95 Fmsy by 2030, the biomass of both species will likely be degenerating instead of recovering (Table 3 and Figure 3B).
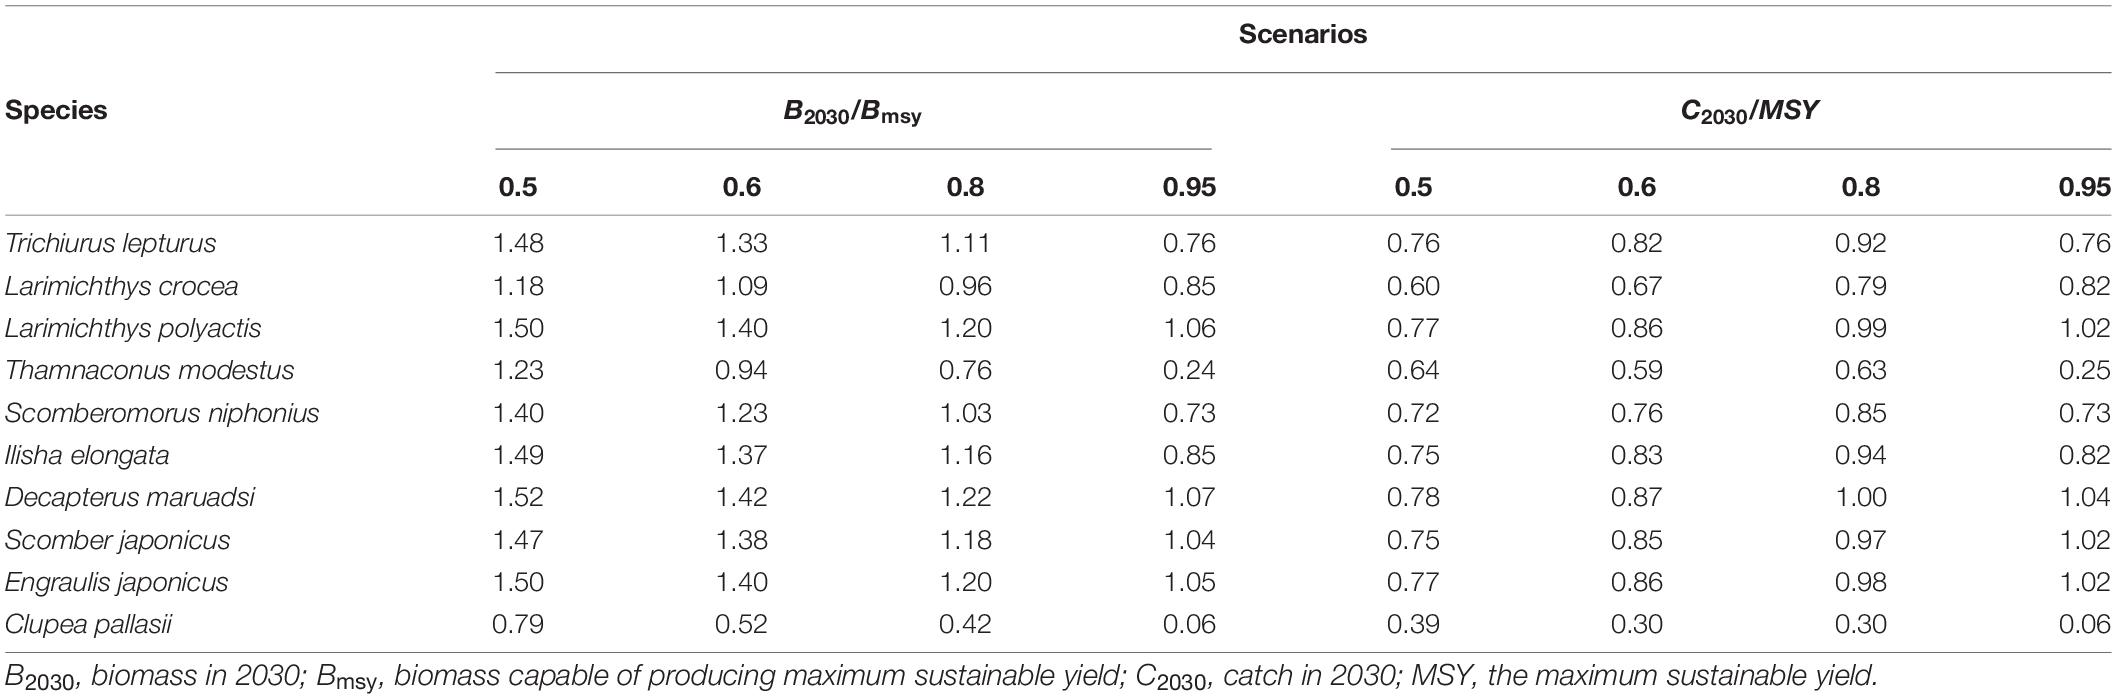
Table 3. The predicted fishery biomasses and catch recoveries in 2030 under four exploitation scenarios (i.e., F = 0.5, Fmsy, 0.6 Fmsy, 0.8 Fmsy, and 0.95 Fmsy).
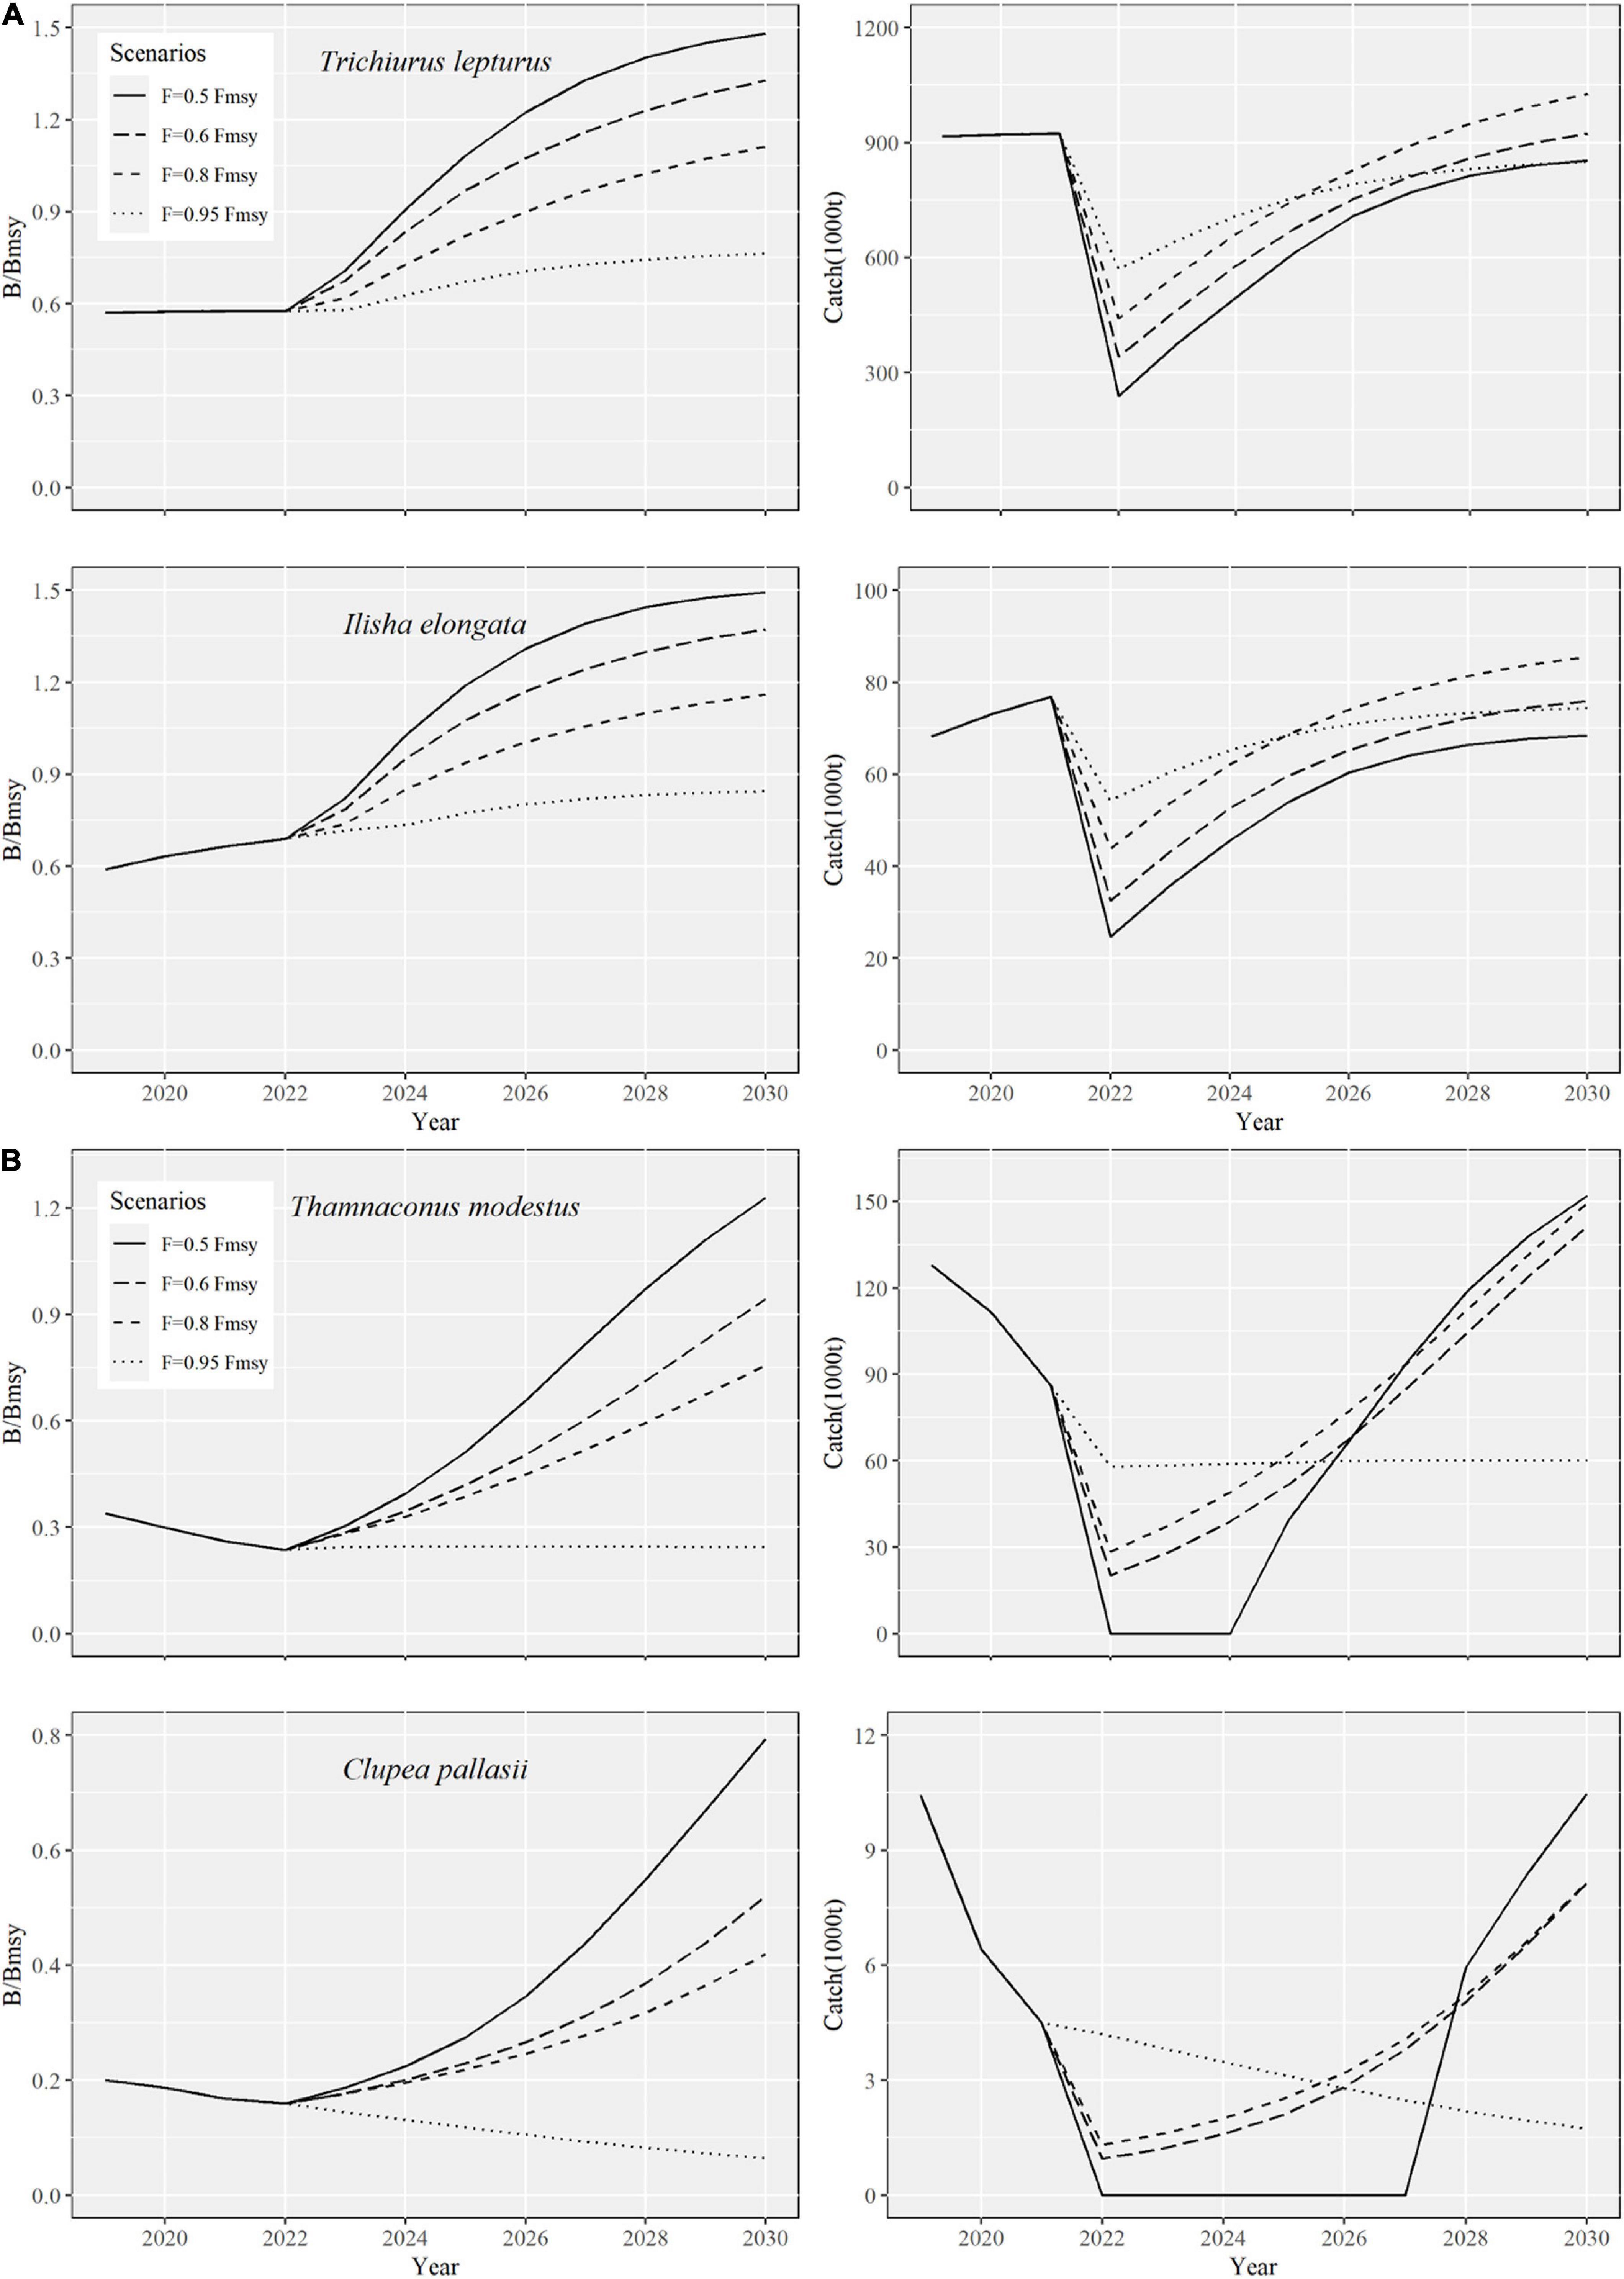
Figure 3. The predicted stock recoveries under four exploitation scenarios (2020–2030), i.e., fishing mortality equals 0.5, 0.6, 0.8, or 0.95 times mortality capable of producing maximum sustainable yields (0.5 Fmsy, 0.6 Fmsy, 0.8 Fmsy, or 0.95 Fmsy). The left panels show the recovery trends of the relative biomasses, i.e., ratios of biomass to the biomass capable of producing maximum sustainable yields (B/Bmsy); the right panels show the predicted catch trajectories under the different scenarios. (A) T. lepturus and I. elongata were selected to show the fishery rebuilding trajectories and catch changes; (B) T. modestus and C. pallasii will likely be degenerating under the scenario of 0.95.
Discussion
Model Fitting
The China Fishery Statistical Yearbook serves as a record of the overall capture of the national fishery but contains only catch data that can be used for resource assessment. As an assessment approach relies on less input, CMSY has been proved to have a good evaluation effect, and its estimated parameters can match well with Schaefer, Fox, and BSM models (Ji et al., 2019; Angelini et al., 2021). In this study, the r-k pairs predicted by CMSY were found to be compatible with the catches and the prior information, with the most likely r-k pair and confidence limits in the range of the priors. The equilibrium curve predicted by CMSY also showed good fitting with the Schaefer equilibrium curve (Supplementary Figure 1). In addition, a common misconception of Bayesian analyses is that the priors determine the results. The comparison of prior and posterior densities showed the PPVR were very low (Supplementary Figure 2); the lower the PPVR, the more the posterior knowledge is improved relative to prior knowledge, indicating the good performance of CMSY constructed in this study.
Historical Exploitation Dynamics of Species
Except L. crocea and L. polyactis, the fisheries of the other eight fish species were all good, and the catches were low before the 1990s. Then, the catches increased rapidly, and the stocks continued to decline. The total power of domestic marine fishing vessels had increased by 2 × 10⁶ kW from the 1950s to 1980s and continued to increase rapidly by about 12 × 106 kW in the following 20 years, which led to the continuous increase in the total catch but decline in CPUE (Ministry of Agriculture of China, 1956–2019). This was the key factor accounting for most fisheries declination since the 1990s in Chinese coastal waters. CMSY indicated that although these eight species showed similar dynamic changes in biomass and catches, benthopelagic species T. lepturus and T. modestus experienced a sharp increase in fishing pressure about 10 years earlier than pelagic species S. niphonius, I. elongata, D. maruadsi, S. japonicus, E. japonicus, and C. pallasii. This was most possibly correlated with when bottom trawling, gill netting, and seine netting were widely used in coastal waters of China. Bottom trawling catches demersal organisms, while seine nets and gill nets mainly catch pelagic fish. In 1985, the domestic catch of trawls was only 1.39 × 10⁶ metric tons, but it had increased 2.86 times to 5.36 × 10⁶ metric tons by 1995. During the same period, the catches of seine nets and gill nets only increased from 0.96 × 10⁶ to 1.82 × 10⁶ metric tons (Ministry of Agriculture of China, 1985–1995). The wide use of bottom trawls seriously damaged seabed habitats and diminished benthic fish populations such as T. lepturus and T. modestus (McConnaughey et al., 2019). Then, from 1995 to 2005, the total catch of seine nets and gill nets increased continuously from 1.82 × 10⁶ to 3.35 × 10⁶ metric tons (Ministry of Agriculture of China, 1995–2005), and the spreading use of seine nets and gill nets correlated with the decline of the pelagic fish stocks.
Traditional economic species, large yellow croaker L. crocea and small yellow croaker L. polyactis, were caught by non-mechanical boats before the 1950s (Zhuang, 2006). For example, the relative biomass L. polyactis in the first documented year (B1956/Bmsy = 0.34) had already exceeded the safe biological limit (B/Bmsy = 0.5, Demirel et al., 2020; Froese et al., 2018). This status lasted until the implementation of summer fishing banning in the 1990s. L. polyactis spawns from February to April (Lin, 2009). Summer fishing banning (May to August) ensures the survival of juveniles from commercial catches, which effectively support population supplement and stock restoration. In the East China Sea, yields of this fish increased significantly after the 1990s and peaking at 160 × 103 metric tons in 2000 (Zhuang, 2006). However, its population structure did not improve in the short term. According to the field survey data, the minimum length of maturity (L50) of this species changed from 152.8 mm in 1960 to 105.3 mm in 2003 in the Bohai Sea and 184.4 mm in 1960 to 110.1 mm in 2010 in the Yellow Sea (Li et al., 2011). With increasing fishing pressure in recent years, the biomass of L. polyactis has gradually declined again due to its fragile population structure. For L. crocea, large-scale fishing operations such as a knock on the boats (by knocking the bamboo pole on the wooden boats, to send out a huge sound wave into the sea, causing otolith resonance of L. crocea, and resulting in its coma and death) were carried out in their spawning grounds and feeding grounds before the mid-1960s, which diminished its stocks in Zhoushan fishing ground, Zhenan fishing ground, and Mindong fishing ground (Zhang Q. et al., 2017). Then, in the mid-1970s, a large number of L. crocea were captured in the overwintering grounds such as Jiangwai fishing ground and Zhouwai fishing ground, and the catch reached the highest record in history, which also caused the serious depletion of its population (Zheng et al., 2013). As an important measure to restore its fishery, Fujian Province carried out the first artificial propagation and releasing with an average total length of 93.1 mm in 1987 combined with the implementation of the fishing banning in the 1990s, which facilitated its gradual stock recovery (Zhang et al., 2010). However, the age structure of the L. crocea population is complex, and the maximum age is up to 30 years. In addition, the slow growth and weak stock renewal ability are the main reasons for its slow fishery recovery (Zhuang, 2006; Zheng et al., 2013).
Fisheries Current Exploitation Status
In 2019, all the species were strongly depleted in biomass (B2019 < Bmsy) due to overfishing. Except for L. crocea, L. polyactis, and D. maruadsi, the others were still under higher fishing mortality (F2019 > Fmsy), which possibly lead to a further decline in stocks. This corroborates the results proposed in other regional stock assessments or fishery surveys in coastal waters of China (Zhang K. et al., 2017; Zhang C. et al., 2019; Liang and Pauly, 2020). For example, Zhai and Pauly (2019) and Zhai et al. (2020) proposed that S. niphonius was grossly overfished (B2013/Bmsy = 0.48) in the East China Sea in 2013, and L. polyactis and E. japonicus were grossly overfished (B2018/Bmsy = 0.42) and overfished (B2018/Bmsy = 0.71) in 2018, respectively. In the coastal waters of China, the status for the D. maruadsi and S. japonicus was evaluated as slightly overfished (B2014/Bmsy = 0.83) and overfished (B2017/Bmsy = 0.70) in 2014 and 2017, respectively (Liang et al., 2020). While it may be due to differences in the conducted time and sea area that cause B/Bmsy and F/Fmsy in these studies to differ slightly from our results, it does not change the indisputable fact that overfishing has contributed to the decline of fishery resources in the coastal waters of China. In addition, in the Bohai Sea, T. lepturus, C. pallasii, and I. elongate had been locally extinct in 2011 (Shan et al., 2013). At the same time, the high-trophic species T. modestus exhibited an obvious decreasing trend in the northern East China Sea and suffered a significant resources decline since 2000 (Cheng and Yu, 2004). Based on fishery survey in Fujian Province in 2011, the dominant body length of L. crocea was 110–150 mm (L∞ = 385 mm), and the exploitation rate was 0.8, suggested the obvious individual miniaturized and serious resource decline (Ye et al., 2012).
Fisheries Rebuilding and Managements
Excessive exploitation had resulted in both declinations of marine catches and economic values simultaneously of Chinese coastal fisheries (Zhai and Pauly, 2019). Therefore, not only could the rebuilding of fishery stocks improve the structures and functions of the ecosystems but also help to increase catches and fishery profitability. Under the four future exploitation scenarios (F = 0.5 Fmsy, 0.6 Fmsy, 0.8 Fmsy, and 0.95 Fmsy), scenario 0.5 Fmsy was the fastest way. All fish species except C. pallasii had likely reached Bmsy in 2030 (B2030 > Bmsy). On the other hand, scenario 0.95 Fmsy was the slowest way, and only four fish species, including L. polyactis, D. maruadsi, S. japonicus, and E. japonicus, could likely recover to the Bmsy by 2030. Although the species recovery on biomass at 0.8 Fmsy and 0.95 Fmsy was slower, it would increase the catches compared with 0.5 Fmsy and 0.6 Fmsy (Supplementary Figure 5). The fishery rebuilding can be adjusted flexibly according to management objectives. For example, if 2030 is taken as the cut-off year for fish stocks to be rebuilt above that can produce the maximum sustainable yield (B > Bmsy), T. lepturus, S. niphonius, and I. elongate can choose 0.8 Fmsy exploitation scenario; L. polyactis, D. maruadsi, and E. japonicus can be 0.95 Fmsy; L. crocea can be 0.6 Fmsy; T. modestus and C. pallasii can be 0.5 Fmsy.
The time needed for rebuilding their fisheries to the level of Bmsy is different. According to Equations (10, 11), the fisheries biomass in the next year (Bt+1) is mainly related to the current biomass (Bt), the fishing pressure that could produce MSY (Fmsy), and the current fishing pressure (Ft). Under future exploitation scenarios, Ft has a linear relationship with Fmsy (i.e., Ft = 0.5 Fmsy, 0.6 Fmsy, 0.8 Fmsy, and 0.95 Fmsy), so Bt+1/Bmsy is only related with Bt/Bmsy and Fmsy. As Equation (8) shows, Fmsy is twice as much as the maximum intrinsic rate of population increase (r); thus, the different recovery rates among ten stocks are related to the biomass status in the initial year (B2019) and species-specific r. For example, the less damage to the B2019, the better the recovery of the B2030 (as illustrated by L. polyactis vs. S. niphonius), and the bigger the r, the faster the stock’s recovery (as illustrated by T. lepturus vs. S. niphonius). According to Equation (1), many factors affect r, such as von-Bertalanffy somatic growth rate (K), reproductive strategy (r-k selection), generation time (tgen), and maximum age (tmax). Species with higher r such as D. maruadsi (r = 1.11) and E. japonicus (r = 1.29) both mature early and have a short generation time (tgen < 1.25 year) to double population size (FishBase, see text footnote 1), while the stock of L. crocea with the smallest r has a more complex population structure and bigger tmax (tmax = 30 years, Zheng et al., 2013; Zhuang, 2006).
The cases of T. modestus and C. pallasii deserved cautious attention and alert vigilance. Our fisheries rebuilding results implied that fish with severe biomass depletion might recover more slowly. Moreover, these stocks even further declined under 0.95 Fmsy scenario. Many managers take F = Fmsy as the best fishing pressure for fisheries exploitation and rebuilding (Demirel et al., 2020), but our results demonstrated that this fishing level did not have any positive effect on fisheries rebuilding for T. modestus and C. pallasii. The relative biomass of T. modestus and C. pallasii in 2019 (B2019/Bmsy) both exceeded the safe biological limits (B/Bmsy = 0.5), suggesting the stocks were on the edge of collapse (B/k = 0.17 and 0.10, respectively, Palomares et al., 2018). Fish species with serious biomass depletion were also deficient in population recruitment capacity (Myers et al., 1994). In addition, the lower population r of T. modestus (0.65) and C. pallasii (0.54) would further degrade the fisheries recovery rate.
To ease the decline of fishery resources, China has introduced several fishery policies, such as the “Dual Control” policy proposed in 1987 to control the number and power of fishing vessels, the “Proliferation and Release” of commercial fishes proposed in 1989, the “Summer Fishing Banning” proposed in 1995, the “Zero-Growth” in fishery catches proposed in 2000, the construction of “Marine Conservation Areas” in 2011, and the development of “Marine Ranching” in 2015 (Han, 2018). Some of these policies have shown good results, such as the policy of “Proliferation and Release” (Zhang et al., 2010) and “Summer Fishing Banning” (Cheng et al., 2004; Jiang et al., 2009; He et al., 2019), which have played an active role in the resource conservation of the L. crocea and L. polyactis, respectively, and the relevant events were also reflected in the results of this article. Thus, this feasible measure should be continued. In addition, policies such as “Total Resource Management” and “Quota Catch Management” were also proposed in 2017 (Han, 2018); the fishery reference points such as MSY estimated in this study could provide a reference for them. However, the results of this article showed that China’s fishery resources were declined (B < Bmsy), and most of them were still facing high fishing pressure (F > Fmsy), which was mainly caused by the current high fishing intensity (Supplementary Table 1). Our results indicated that cutting fishing efforts down (e.g., strict implementation of policies such as “Dual Control” and “Zero-Growth”) was probably the most effective way for fishery sustainability. We have to admit that this measure would probably be a hard decision as a trade-off between economics and conservation, but the fisheries structure will benefit from this, and finally, the catches will be enhanced. Moreover, gears selection must be taken into serious considerations to avoid the capture of juvenile fishes before sexual maturity (Wang et al., 2020).
Conclusion
General pictures of the basic situation of these economic fishes in China’s coastal waters provide reference information to fisheries management. CMSY indicates a decreasing trend in biomass along with the explosively increasing fishing efforts since the 1980s–1990s for most species. All the fish stocks have seriously depleted in 2019 (B2019 < Bmsy), and most were still facing high-fishing pressure (F2019 > Fmsy). Corresponding protection measures should be taken into immediate action to rebuild the fisheries. Otherwise, the fish stocks would further decline and their recoveries would be much more difficult. Most species stocks would likely rebuild to Bmsy level, and the more the fishing pressure is reduced, the faster the fisheries will be recovered. Although there would be several years of reduction in catches during the rebuilding process, the recovered fisheries would bring more production and economic and social benefits.
Data Availability Statement
The original contributions presented in the study are included in the article/Supplementary Material, further inquiries can be directed to the corresponding author.
Ethics Statement
The animal study was reviewed and approved by Animal Care and Ethics Committee of the Ocean University of China.
Author Contributions
LW contributed to conceptualization, methodology, investigation, resources, writing – original draft, and writing – review and editing. LL, YL, and LZ contributed to data curation and investigation. SY contributed to supervision, project administration, conceptualization, methodology, resources, and writing – review and editing. All authors contributed to the article and approved the submitted version.
Funding
This study was supported by the National Natural Science Foundation of China (Grant No. 41976091) and Fundamental Research Funds for the Central Universities (Grant No. 202012023). National Key Research and Development Program of China (Grant No. 2020YFD0900805) and Investigation of Fishery Resources Program of Zhejiang (Grant No.158053).
Conflict of Interest
The authors declare that the research was conducted in the absence of any commercial or financial relationships that could be construed as a potential conflict of interest.
Publisher’s Note
All claims expressed in this article are solely those of the authors and do not necessarily represent those of their affiliated organizations, or those of the publisher, the editors and the reviewers. Any product that may be evaluated in this article, or claim that may be made by its manufacturer, is not guaranteed or endorsed by the publisher.
Acknowledgments
The authors thank Rainer Froese for his help with R code regarding fishery rebuilding.
Supplementary Material
The Supplementary Material for this article can be found online at: https://www.frontiersin.org/articles/10.3389/fmars.2021.757503/full#supplementary-material
Footnotes
References
Angelini, S., Armelloni, E. N., Costantini, I., De Felice, A., Isajlović, I., Leonori, I., et al. (2021). Understanding the Dynamics of Ancillary Pelagic Species in the Adriatic Sea. Front. Mar. Sci. 8:728948. doi: 10.3389/fmars.2021.728948
Arai, T. (2015). Diversity and conservation of coral reef fishes in the Malaysian South China Sea. Rev. Fish. Biol. Fisher. 25, 85–101. doi: 10.1007/s11160-014-9371-9
Cao, L., Naylor, R., Henriksson, P., Leadbitter, D., Metian, M., Troell, M., et al. (2015). China’s aquaculture and the world’s wild fisheries. Science 347, 133–135. doi: 10.1126/science.1260149
Cheng, J. H., Lin, L. S., Ling, J. Z., Li, J. S., and Ding, F. Y. (2004). Effects of summer close season and rational utilization on redlip croaker (Larimichthys polyactis Bleeker) resource in the East China Sea Region. J. Fish. Sci. China 11, 554–560.
Cheng, J. S., and Yu, L. F. (2004). The change of structure and diversity of demersal fish communities in the Yellow Sea and East China Sea in winter. J. Fish. China 1, 29–35.
Cheng, Y. H., and Fan, W. (2001). Study of time-serial analysis of marine capture yield in the East China Sea region. J. Fish. Sci. China 8, 31–34.
Costello, C., Ovando, D., Hilborn, R., Gaines, S. D., Deschenes, O., and Lester, S. E. (2012). Status and solutions for the world’s unassessed fisheries. Science 338, 517–520. doi: 10.1126/science.1223389
Demirel, N., Zengin, M., and Ulman, A. (2020). First large-scale Eastern Mediterranean and Black Sea stock assessment reveals a dramatic decline. Front. Mar. Sci. 7:103. doi: 10.3389/fmars.2020.00103
FAO (2016). Fishery and Aquaculture Statistics. Rome: Food and Agriculture Organization of the United Nation.
Free, C. M., Jensen, O. P., Anderson, S. C., Gutierrez, N. L., Kleisner, K. M., Longo, C., et al. (2020). Blood from a stone: performance of catch-only methods in estimating stock biomass status. Fish. Res. 223:105452. doi: 10.1016/j.fishres.2019.105452
Froese, R., Demirel, N., Coro, G., Kleisner, K. M., and Winker, H. (2017). Estimating fisheries reference points from catch and resilience. Fish Fish. 18, 506–526. doi: 10.1111/faf.12190
Froese, R., Winker, H., Coro, G., Demirel, N., Tsikliras, A. C., Dimarchopoulou, D., et al. (2018). Status and rebuilding of European fisheries. Mar. Policy 93, 159–170. doi: 10.1016/j.marpol.2018.04.018
Han, Y. (2018). Marine Fishery Resources Management and Policy Adjustment in China Since 1949. Chin. Rural Econ. 9, 14–28.
He, X., Li, J., Shen, C., Shi, Y., Feng, C., Guo, J., et al. (2019). Length-weight relationship and population dynamics of Bombay duck (Harpadon nehereus) in the Min River Estuary, East China Sea. Thalassas 35, 253–261. doi: 10.1007/s41208-018-0117-7
Ji, Y. P., Liu, Q., Liao, B. C., Zhang, Q. Q., and Han, Y. N. (2019). Estimating biological reference points for largehead hairtail (Trichiurus lepturus) fishery in the Yellow Sea and Bohai Sea. Acta Oceanol. Sin. 38, 20–26. doi: 10.1016/j.fishres.2011.05.007
Jiang, Y. Z., Cheng, J. H., and Li, S. F. (2009). Temporal changes in the fish community resulting from a summer fishing moratorium in the northern East China Sea. Mar. Ecol. Prog. Ser. 387, 265–273. doi: 10.3354/meps08078
Li, Z., Shan, X., Jin, X., and Dai, F. (2011). Long-term variations in body length and age at maturity of the small yellow croaker (Larimichthys polyactis Bleeker, 1877) in the Bohai Sea and the Yellow Sea. China. Fish. Res. 110, 67–74. doi: 10.1016/j.fishres.2011.03.013
Liang, C., and Pauly, D. (2017). Growth and mortality of exploited fishes in China’s coastal seas and their uses for yield-per-recruit analyses. J. Appl. Ichthyol. 33, 746–756. doi: 10.1111/jai.13379
Liang, C., and Pauly, D. (2020). Masking and unmasking fishing down effects: the Bohai Sea (China) as a case study. Ocean Coast. Manag. 184:105033. doi: 10.1016/j.ocecoaman.2019.105033
Liang, C., Xian, W., and Pauly, D. (2020). Assessments of 15 Exploited Fish Stocks in Chinese, South Korean and Japanese Waters Using the CMSY and BSM Methods. Front. Mar. Sci. 7:623. doi: 10.3389/fmars.2020.00623
Lin, L. S. (2009). Study on the Fishery Biology and Management Strategy of Larimichthys polyactis in the Southern Yellow Sea and the East China Sea. Ph.D thesis, Qingdao: Ocean University of China.
Ling, J. Z., Li, S. F., and Yan, L. P. (2006). Analysis on the utilization of main fishery resources in the East China Sea. Mar. Fish 28, 111–116.
Link, J. S., and Watson, R. A. (2019). Global ecosystem overfishing: clear delineation within real limits to production. Sci. Adv. 5:eaav0474. doi: 10.1126/sciadv.aav0474
Liu, M., and De Mitcheson, Y. S. (2008). Profile of a fishery collapse: why mariculture failed to save the large yellow croaker. Fish Fish. 9, 219–242. doi: 10.1111/j.1467-2979.2008.00278.x
Martell, S., and Froese, R. (2013). A simple method for estimating MSY from catch and resilience. Fish Fish. 14, 504–514. doi: 10.1111/j.1467-2979.2012.00485.x
McConnaughey, R. A., Hiddink, J. G., Jennings, S., Pitcher, C. R., Kaiser, M. J., Suuronen, P., et al. (2019). Choosing best practices for managing impacts of trawl fishing on seabed habitats and biota. Fish Fish. 21, 319–337. doi: 10.1111/faf.12431
Ministry of Agriculture of China (1956–2019). China Fishery Statistical Yearbook. Beijing: China Agriculture Press.
Myers, R. A., Rosenberg, A. A., Mace, P. M., Barrowman, N., and Restrepo, V. R. (1994). In search of thresholds for recruitment overfishing. ICES. J. Mar. Sci. 51, 191–205. doi: 10.1006/jmsc.1994.1020
Palomares, M. L. D., Froese, R., Derrick, B., Noel, S. L., Tsui, G., Woroniak, J., et al. (2018). A Preliminary Global Assessment of the Status of Exploited Marine Fish and Invertebrate Populations. Vancouver: Sea Around Us.
Quinn, T. J., and Deriso, R. B. (1999). Quantitative Fish Dynamics. New York, NY: Oxford University Press.
R Development Core Team (2020). R: A Language and Environment for Statistical Computing. Austria: R Development Core Team.
Ricard, D., Minto, C., Jensen, O. P., and Baum, J. K. (2012). Examining the knowledge base and status of commercially exploited marine species with the RAM Legacy Stock Assessment Database. Fish Fish. 13, 380–398. doi: 10.1111/j.1467-2979.2011.00435.x
Ricker, W. E. (1975). Computation and Interpretation of Biological Statistics of fish Populations. Bull. Fish. Res. Bd Can. 191:382.
Schaefer, M. B. (1954). Some aspects of the dynamics of populations important to the management of the commercial marine fisheries. Inter. Am. Trop. Tuna Commission Bull. 1, 27–56.
Shan, X., Jin, X., Zhou, Z., and Dai, F. (2011). Fish community diversity in the middle continental shelf of the East China Sea. Chin. J. Oceanol. Limn. 29, 1199–1208. doi: 10.1007/s00343-011-0321-2
Shan, X., Sun, P., Jin, X., Li, X., and Dai, F. (2013). Long-term changes in fish assemblage structure in the Yellow River Estuary ecosystem. China. Mar. Coast. Fish. 5, 65–78. doi: 10.1080/19425120.2013.768571
Wang, L., Lin, L., Li, Y., Xing, Y., and Kang, B. (2020). Sustainable exploitation of dominant fishes in the largest estuary in Southeastern China. Water 12:3390. doi: 10.3390/w12123390
Wang, Q., Zhang, J., Matsumoto, H., Kim, J., and Li, C. (2016). Population structure of elongate ilisha Ilisha elongata along the Northwestern Pacific Coast revealed by mitochondrial control region sequences. Fish. Sci. 82, 771–785. doi: 10.1007/s12562-016-1018-4
Wang, X. H., Qiu, Y. S., and Du, F. Y. (2004). Estimation of growth and mortality parrameters of Chinese herring (Ilisha elongata) in Zhujiang River estruary. J. Trop. Oceanogr. 23, 42–48.
Ye, J. Q., Xu, Z. L., Chen, J. J., and Kang, W. (2012). Resources status analysis of large yellow croaker in Guanjinyang using von Bertalanffy growth equation and fishing mortality parameters. J. Fish. China 36, 238–246. doi: 10.3724/SP.J.1231.2012.27640
Zhai, L., Liang, C., and Pauly, D. (2020). Assessments of 16 Exploited Fish Stocks in Chinese Waters Using the CMSY and BSM Methods. Front. Mar. Sci. 7:483993. doi: 10.3389/fmars.2020.483993
Zhai, L., and Pauly, D. (2019). Yield-per-recruit, utility-per-recruit, and relative biomass of 21 exploited fish species in China’s coastal seas. Front. Mar. Sci. 6:724. doi: 10.3389/fmars.2019.00724
Zhang, C., Seo, Y., Kang, H., and Lim, J. (2019). Exploitable carrying capacity and potential biomass yield of sectors in the East China Sea, Yellow Sea, and East Sea/Sea of Japan large marine ecosystems. Deep Sea Res. Part II. 163, 16–28. doi: 10.1016/j.dsr2.2018.11.016
Zhang, K., Liao, B. C., Xu, Y. W., Zhang, J., Sun, M. S., Qiu, Y. S., et al. (2017). Assessment for allowable catch of fishery resources in the South China Sea based on statistical data. Acta Oceanol. Sin. 39, 25–33. doi: 10.3969/j.issn.0253-4193
Zhang, Q., Hong, W., and Chen, S. (2017). Stock changes and resource protection of the large yellow croaker (Larimichthys crocea) and ribbon fish (Trichiurus Japonicus) in coastal waters of China. J. Appl. Oceanogr. 36, 438–445.
Zhang, Q., Hong, W., Yang, S., and Liu, M. (2010). Review and prospects in the restocking of the large yellow croaker (Larimichthys crocea). Mod. Fish. Inf. 25, 3–5.
Zhang, W., Liu, M., De Mitcheson, S. Y., Cao, L., Leadbitter, D., Newton, R., et al. (2019). Fishing for feed in China: facts, impacts and implications. Fish Fish. 21, 47–62. doi: 10.1111/faf.12414
Zheng, Y., Hong, W., and Zhang, Q. (2013). Review and prospects for resource biology of main marine demersal food fishes along the coastal waters of China. J. Fish. China 37, 151–160. doi: 10.3724/SP.J.1231
Keywords: data-poor method, CMSY, stock assessment, Chinese coastal fisheries, fishery rebuilding, fishery protection
Citation: Wang L, Lin L, Liu Y, Zhai L and Ye S (2022) Fishery Dynamics, Status, and Rebuilding Based on Catch-Only Data in Coastal Waters of China. Front. Mar. Sci. 8:757503. doi: 10.3389/fmars.2021.757503
Received: 12 August 2021; Accepted: 20 December 2021;
Published: 03 February 2022.
Edited by:
Giuseppe Scarcella, National Research Council (CNR), ItalyReviewed by:
Maria Rita Pegado, Marine and Environmental Sciences Centre (MARE), PortugalShanshan Zhang, Quanzhou Normal University, China
Copyright © 2022 Wang, Lin, Liu, Zhai and Ye. This is an open-access article distributed under the terms of the Creative Commons Attribution License (CC BY). The use, distribution or reproduction in other forums is permitted, provided the original author(s) and the copyright owner(s) are credited and that the original publication in this journal is cited, in accordance with accepted academic practice. No use, distribution or reproduction is permitted which does not comply with these terms.
*Correspondence: Shen Ye, bGVhZmRlZXBAMTYzLmNvbQ==