 Sólvá Káradóttir Eliasen1*
 Eydna Í. Homrum1
 Jan Arge Jacobsen1
 Inga Kristiansen1
 Guðmundur J. Óskarsson2Are Salthaug3
 Erling Kåre Stenevik3
- 1Faroe Marine Research Institute (FAMRI), Tórshavn, Faroe Islands
- 2Marine and Freshwater Research Institute, Hafnarfjörður, Iceland
- 3Institute of Marine Research (IMR), Bergen, Norway
The commercially important Norwegian spring spawning herring is characterized by its extensive annual migrations and, on a decadal timescale, large shifts in migration patterns. These changes are not well understood, but have previously been linked to temperature, food availability, and size and age composition of the stock. Acoustic and trawl data from the International Ecosystem Surveys in the Nordic Seas, carried out annually in May since 1996, were used to analyze the spatial distribution of herring in the period 1996–2020. The dataset was disaggregated into age classes, and information about where the different age classes feed in May was derived. The analysis of herring feeding patterns in May confirms that the youngest age classes are generally found close to the Norwegian shelf, whereas the older age classes display larger variations in where they are distributed. During the period 1996–1998, the oldest age classes were found in the central and western Norwegian Sea. During the period 1999–2004, the whole stock migrated north after spawning, leaving the regions in the southern Norwegian Sea void of herring. Since 2005 the oldest herring has again congregated in the south-western Norwegian Sea, in the frontal zone between the cooler East Icelandic water and the warmer Atlantic water. There was a significant positive relationship both between stock size and distribution area and between stock size and density. Moreover, it is likely that the strong year classes 1991/1992 and 1998/1999, which were relatively old when the respective changes in migration patterns occurred, were important contributors to the changes observed in 1999 and 2005, respectively.
Introduction
The Norwegian spring spawning herring (hereafter herring) stock varies greatly, both in size and distribution area. After the collapse of the stock in the late 1960s, the stock was confined along the Norwegian coast where it also fed throughout the year. The stock started to grow again in the late 1980s after the strong 1983 year class recruited, and in the mid 1990s the herring reoccupied large parts of the Norwegian Sea following good recruitment in the early 1990s. In 2008–2009 the stock reached its maximum size since the 1950s, after which it has declined again (Dragesund, 1980; Dragesund et al., 1997; ICES, 2021b).
Since the reappearance of the stock in the Norwegian Sea (Figure 1), spawning has occurred along the Norwegian coast from around 62°30′N to 68°20′N (Holst and Slotte, 1998; Salthaug et al., 2020). After spawning, the mature part of the stock starts its feeding migration. The feeding season is from April to September, with the main feeding period being May–July (Langøy et al., 2012; [opetwcitep]B3,B2[clotwcitep]Bachiller et al., 2018, 2016). As prior to the stock collapse in the 1960s, the main feeding is now in the Norwegian Sea and adjacent waters (Marti, 1956; Misund et al., 1997; Nøttestad et al., 1999; ICES, 2021b). However, since the reappearance, some variation has been observed in the distribution pattern during summer, with a more northerly distribution during the period 1999–2004 as compared to the period prior and after this (Utne et al., 2012; Gudmundsdottir et al., 2014).
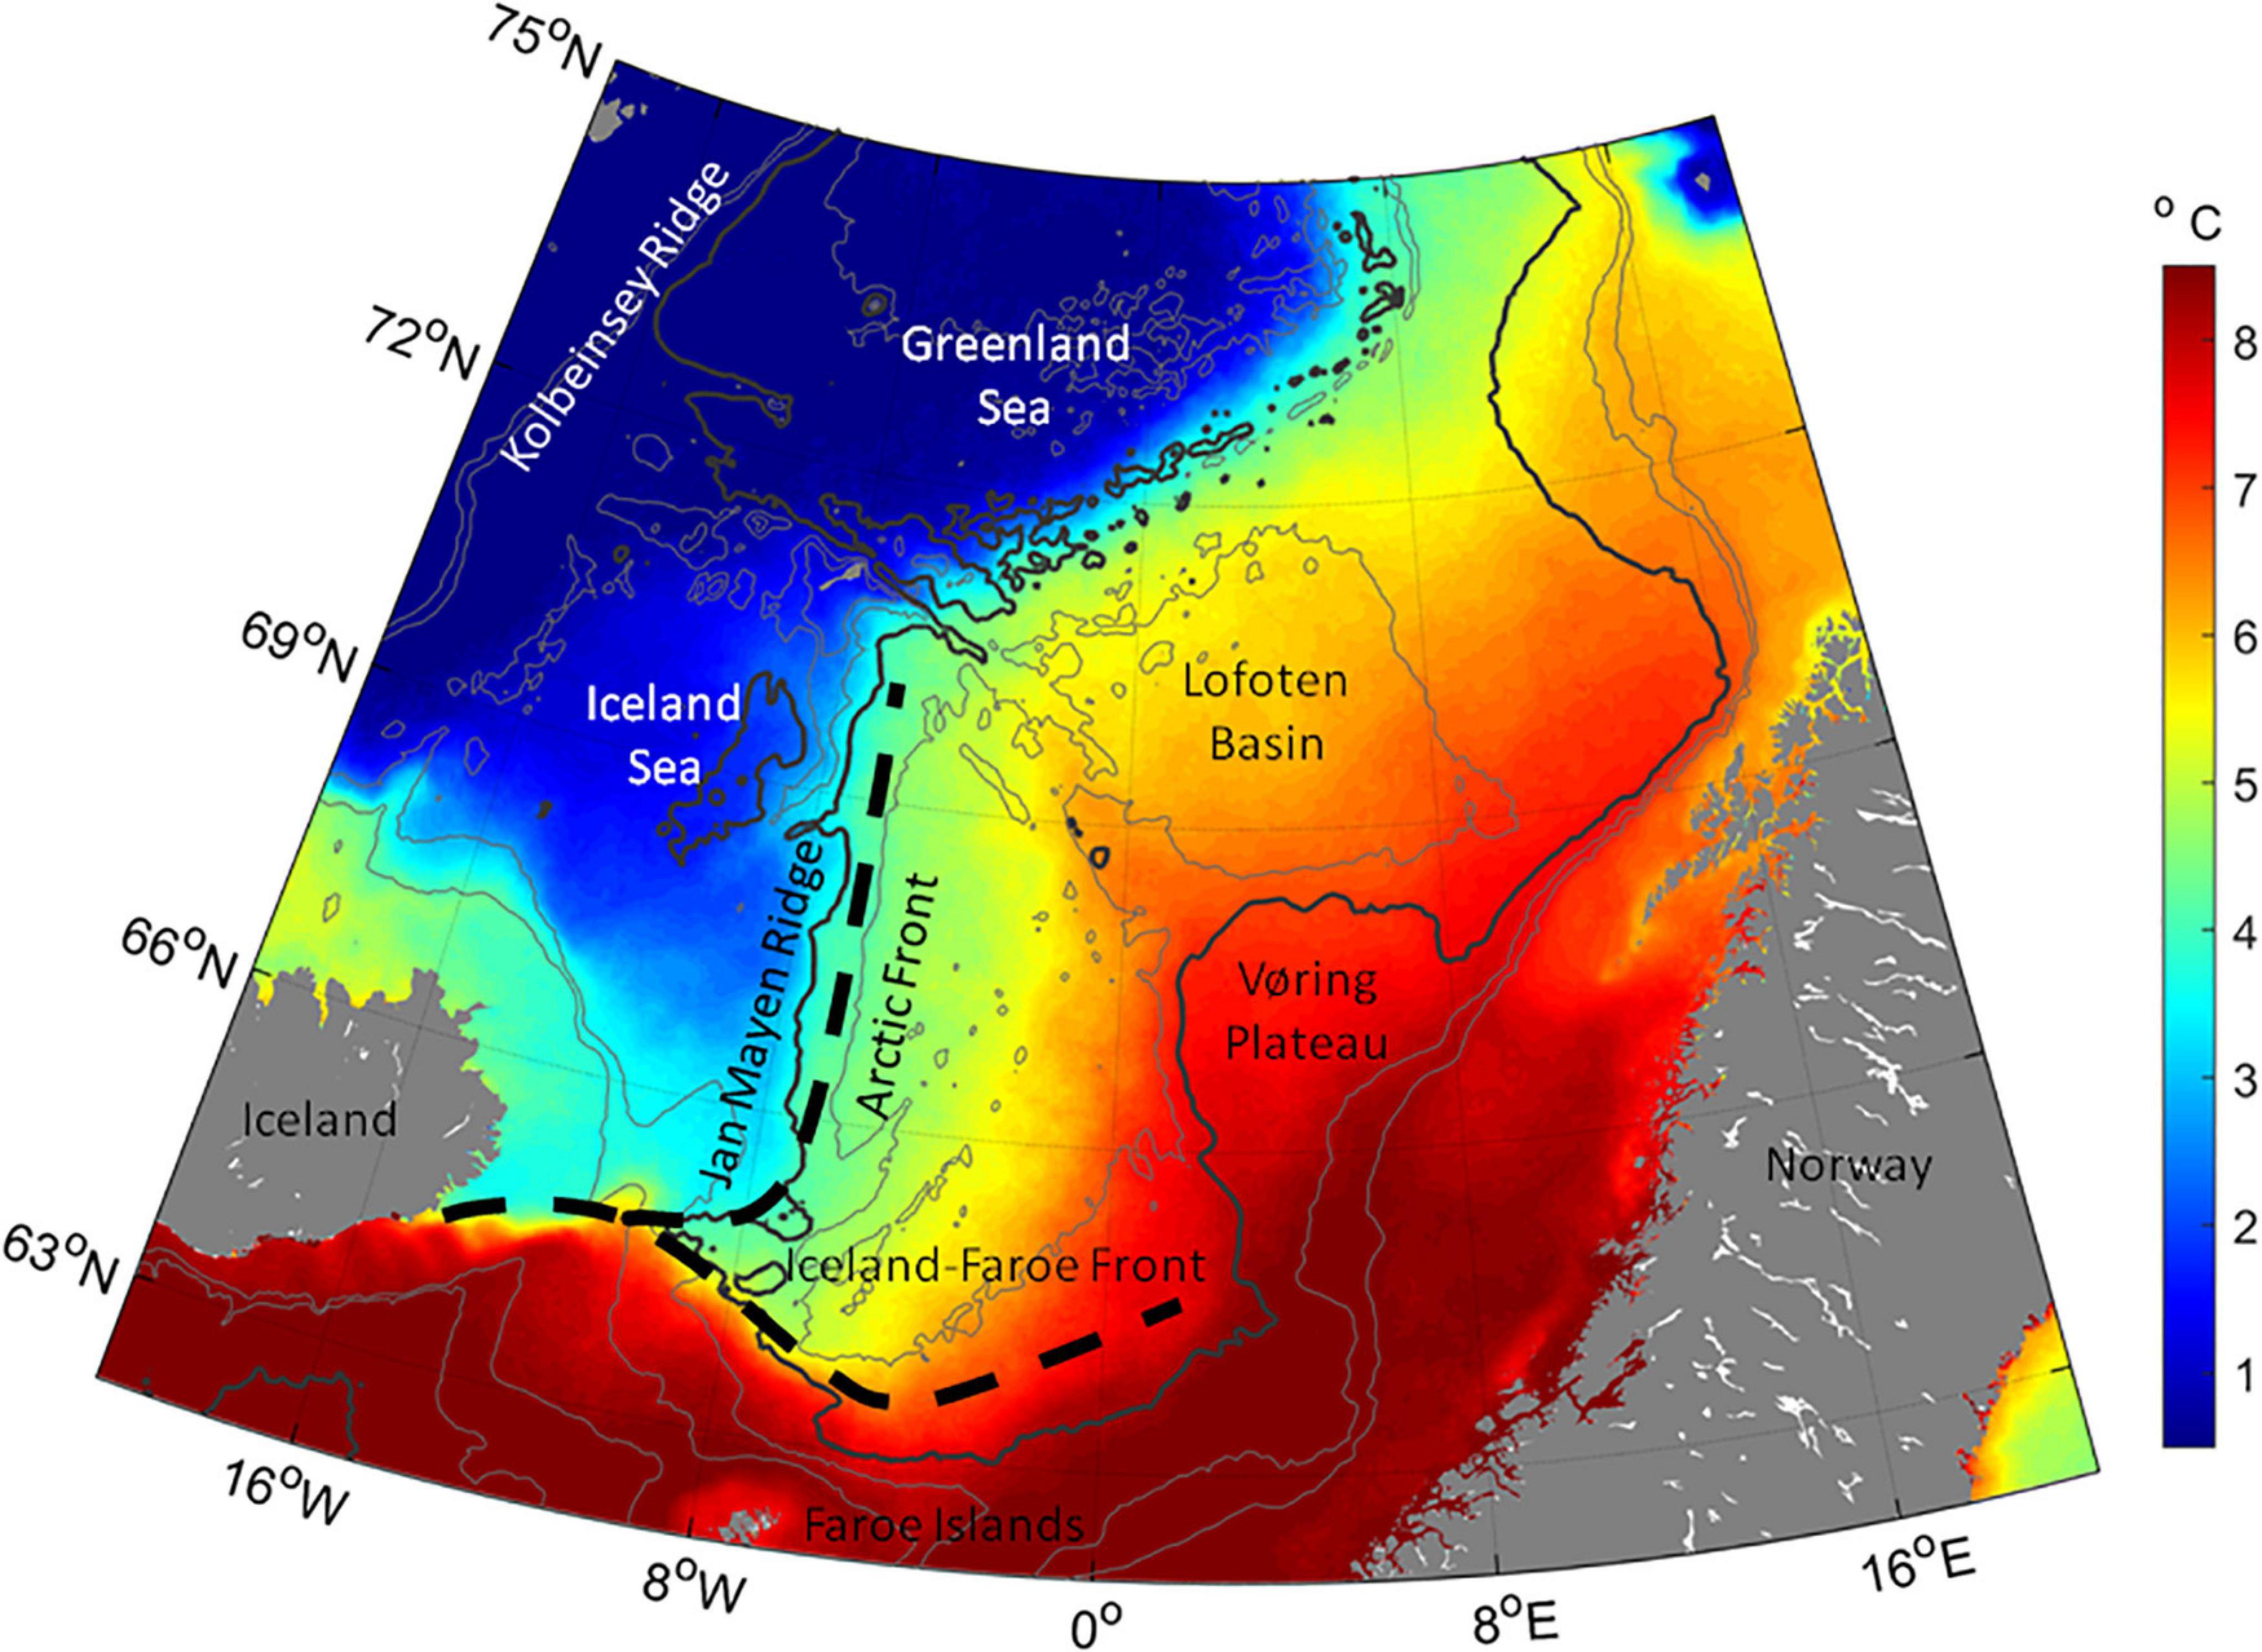
Figure 1. Map of the Norwegian Sea and adjacent waters with the main frontal zones in the area. Map overlaid with average sea surface temperature in May 2003–2020, based on remotely sensed data (from NASA Goddard Space Flight Center, Ocean Ecology Laboratory, Ocean Biology Processing Group). 500, 1,000, 2,000, and 3,000 m depth contours are shown in gray – with the 2,000 m contour in bold.
The Norwegian Sea, where the herring feed in the uppermost ∼3–400 m (Misund et al., 1997; Huse et al., 2012; Melle et al., 2020), is characterized by relatively warm water masses in the central and eastern part. The western area is dominated by relatively cold East Icelandic water and water of Arctic origin, thereby creating the sharp Jan Mayen Front along the Jan Mayen Ridge (Figure 1). In the south, the sharp Iceland-Faroe Front delineates the Norwegian Sea toward south. On the southern side of the Iceland-Faroe Front, Atlantic water flows eastward toward Norway. The Atlantic water enters the Norwegian Sea in the southeast and flows northward along the Norwegian coast, thus causing this region to be the warmest part of the Norwegian Sea (Read and Pollard, 1992; Blindheim and Østerhus, 2005). The herring has a general diel vertical migration pattern, ascending to the sea surface during the night and residing around 250–400 m during the daytime. However, herring is also occasionally observed in the surface during the daytime and in the deeper layers during the night time (Misund et al., 1997; Huse et al., 2012; Melle et al., 2020).
Numerous studies have shown that the main prey of herring is calanoid copepods, in particular Calanus finmarchicus (Rudakova, 1956; Dalpadado et al., 2000; Varpe et al., 2005; Prokopchuk and Sentyabov, 2006; Prokopchuk, 2009; Broms et al., 2012; Langøy et al., 2012; Bachiller et al., 2016; Melle et al., 2020). However, the larger and more nutritious copepod species, Calanus hyperboreus, is also considered to be a key component of the herring diet, especially in the south-western areas (Rudakova, 1956; Dalpadado et al., 2000; Gislason and Astthorsson, 2002). Other prey such as amphipods, krill (e.g., Meganyctiphanes norvegica and Thysanoessa inermis) and pearlside (Maurolicus muelleri) are also ingested by the herring when copepods are not available (Rudakova, 1956; Dalpadado et al., 2000; Gislason and Astthorsson, 2002; Prokopchuk and Sentyabov, 2006; Olsen et al., 2007; Melle et al., 2020).
Calanus finmarchicus is the most abundant zooplankton species in the Norwegian Sea (Wiborg, 1955; Dommasnes et al., 2004; Broms et al., 2009). Calanus hyperboreus is generally found in waters of more arctic origin, west of the Jan Mayen Front and also in the Jan Mayen frontal zone (Rudakova, 1956; Varpe et al., 2005; Gislason and Silva, 2012; Kristiansen et al., 2019; Melle et al., 2020), where it is an important food item of the herring (Holst et al., 2004). Krill is found on both sides of the Jan Mayen Front, pearlside more along the Norwegian coast, whereas amphipods are found more abundantly west of the Jan Mayen Front (Dalpadado et al., 2000).
Herring is a selective feeder (Pavshtiks, 1956; Rudakova, 1956; Dalpadado et al., 2000; Langøy et al., 2012) and it prefers the largest individuals of copepods which are more energetically beneficial for the herring to ingest compared to small items (Dalpadado et al., 2000). Feeding also has been found to be more intensive near the Jan Mayen Front, where C. hyperboreus is found in high concentrations (Rudakova, 1956; Olsen et al., 2007; Kristiansen et al., 2019).
There are several mechanisms thought to influence the herring feeding migration. Interspecies competition between herring, mackerel and blue whiting could affect the food availability and thus the migration (Prokopchuk and Sentyabov, 2006; Utne and Huse, 2012). Experience and learning may help guide the herring toward richer feeding areas (Fernö et al., 1998; Misund et al., 1998; Corten, 2002), and accordingly, predictive orientation mechanisms might improve with age, with the oldest herring being most successful in finding good prey (Kvamme et al., 2003). Also, larger fish have an advantage in the feeding migration as they are able to travel faster and longer distances (Nøttestad et al., 1999). Other environmental cues, such as food availability, predator abundance, sea temperature, currents, differences in day length at boreal latitudes and phytoplankton bloom development, which links to zooplankton abundance, have also been suggested to influence the herring migration (Misund et al., 1997; Fernö et al., 1998; Nøttestad et al., 1999; Broms et al., 2012; Langård et al., 2015; Melle et al., 2020).
Changes in migration pattern have been observed to co-occur with drastic changes in stock size (Dragesund et al., 1997), and have been hypothesized to be caused by changes in stock size as well as by environmental factors (McQuinn, 1997; Corten, 2002; Huse et al., 2002). However, conservatism through previous experience is possibly also causing inertia toward changes in feeding migration (Corten, 2002). Modeling experiments confirm that the relative abundance of determined individuals in a school plays an important role in the collective behavior (Huse et al., 2002). Thus, age composition within the stock could also affect the behavioral choices made during the feeding migration and therefore determine where the stock feeds during the summer (Huse et al., 2010).
The joint International Ecosystem Survey in the Norwegian Sea (IESNS), which targets Norwegian spring spawning herring during its feeding migration, has been carried out every year in May since 1996. Biological and acoustic data are gathered and used to provide age disaggregated abundance indices of herring used in the assessment of the stock by the “Working Group on Widely Distributed Stocks” (WGWIDE) (ICES, 2021b). This 25 years long time-series from the survey therefore provides quantitative information about spatial distribution of different age groups.
The objective of the study is to use these data to investigate patterns in the herring feeding distribution in May, density dependent spatial dynamics in the stock and whether the spatial herring distribution in May changes when drastic changes occur in stock size and age distribution within the stock.
Materials and Methods
Data from the IESNS survey in the period 1996–2020 was used in this work. Generally, the survey starts in the south and progresses northward, after which it continues into the Barents Sea to survey the youngest herring, i.e., immature herring at ages 1–2 years. However, in the current analysis, the survey from the Barents Sea is not included. During this 25 years period, three to five vessels have covered the Norwegian Sea in the IESNS survey. The acoustic and biological data from these surveys are stored in a joint database (PGNAPES), and were retrieved from there by the courtesy of all participating parties.
Unfortunately, the survey data in the database are not complete when it comes to the earliest years, where data from one of the participating vessels is missing each of the years 1997, 1998, 1999, 2001, 2003, 2004, and 2007. Except for 2003, the missing data are always from the south-eastern part of the survey area. This area is always surveyed by two vessels that do alternating transects or in some way cross each other’s path. Thus, although some data were missing, its impacts on the results are less than anticipated because of the survey design. The database is complete in 1996, 2000, 2002, 2005–2006, and from 2008 onward.
After quality check of the IESNS data, acoustic data from 92 IESNS cruises, carried out by two to five different vessels each year, were available (Supplementary Tables 1–3). The IESNS survey defines the area between 14°W–20°E and 62°N–75°N as the area of consideration and thus the same procedure has been used here.
Fish Data From Trawl Stations
Trawling is carried out opportunistically in IESNS, with varying pelagic trawls, to support the acoustical interpretations with regards to species and size composition of the fish. The trawl stations are spread out intermittently over the whole survey area and at each station, total length (L), whole body weight (W) and age sampling is recorded. Usually 100–300 herring (or as many as the catches allow) are length measured and a subsample of these (30–100) are aged using otoliths or scales. The sample sizes vary among participating countries.
After quality check, data were sorted according to year and geographical rectangle (2° longitudes × 1° latitude). For each rectangle, an age-length-key (ALK) was calculated, based on fish from a slightly larger rectangle (4° longitudes × 2° latitude) that had the same center as the original rectangle, and the ALK from the larger rectangle was then used to assign ages to fish in the original rectangle that were not aged.
A yearly regression was made between age and weight in order to assign weights to fish without recorded weights and in order to compute average weights in each age class after the ALK was applied. Assuming that the length-weight relationship is given as:
the Matlab routine “polyfit” was used to compute annual α and β.
Subsequently, based on the distribution of fish in each rectangle after the application of the ALK, in rectangles with more than 100 fish with ages, abundance ratios of each year class (i) of herring (rai) was computed, as well as the average individual length and weight for each year class (i):
where N is the total number of fish and Ni is the number of fish of year class i.
The abundance ratios were then gridded onto a regular grid (2° longitudes × 1° latitude) using objective mapping (Böhme and Send, 2005), with a 2° longitude and 1° latitude smoothing factor, resulting in spatial fields of ratios of each age, each year. Investigation of error estimates were used to determine how far away from the actual observations the gridded data can extend. Where error estimates were too high, NaNs were filled onto the grid. The error limit was each year subjectively set, based on the internal consistency of the data, which varies from year to year. This way, the maximum spatial range each year was obtained.
In the same manner, mean individual lengths and weights were computed for year and rectangle and gridded onto a regular grid.
Acoustic Data
The acoustic data available in the database are mean Nautical Area Scattering Coefficient (NASC) values over 1 nautical mile with varying depth channels (10–50 m) along the survey tracks. The sampling depth was normally 0–500 m. The analyses of the data were constrained to year and geographical rectangles (2° longitudes × 1° latitude) and were as follows:
• Acoustic data were summed vertically for each acoustic log, resulting in the so-called Sa2 value (with the unit Sa2 nm–2).
• Mean Sa2 nm–2 was computed for each rectangle.
• The Sa2 nm–2 were gridded (see section “Fish Data From Trawl Stations”) to estimate acoustic strengths nm–2 in rectangles that were left out of the surveyed area.
• Average target strengths and cross sections (Eqs 4, 5) in each rectangle were computed based on the average lengths and weights in each rectangle.
• Total abundance in each rectangle was computed (Eq. 6).
• Based on the relative age distribution and average weights of each age in each rectangle, the abundances and subsequently biomasses of each year class were computed.
The equations describing the above procedure are found in Foote (1987) and are as follows.
The average target strength in each rectangle is calculated based on the weighted average length:
The cross-section in each rectangle is given as:
The total abundance, N, in each rectangle is given as:
where A is the area (km2) of each rectangle.
The average abundances and biomasses, derived from the acoustic values per geographical rectangle, were gridded in the same manner as the abundance ratios, see section “Fish Data From Trawl Stations.” These fields were multiplied with the ratio fields in order to compute age and year specific spatial distribution of fish and biomasses.
Area Calculations and Center of Gravity Calculations
The area occupied by the herring stock was computed by adding the areas of rectangles with a biomass higher than 2 tons km–2. This limit was derived by investigating how large part of the biomass is included from year to year with various limits. With the 2 tons km–2 limit, more than 86% of the total biomass is always included.
Center of gravity (CG) of each year class was computed from the gridded fields as:
where i,j, indicates grid points. In order to avoid signals from areas with very low abundances, rectangles where the abundance was less than 5% of the maximum abundance were set to 0 before calculating the CG.
Quality Check of the Biological and Acoustic Dataset
Conversion of the acoustic signals to abundance and biomass in general show the same features as the numbers provided by WGWIDE (ICES, 2021b), in particular the last decade of the period (Supplementary Figures 1A–C). The deviation from the WGWIDE results is largest for the earliest years, where data from some of the participating vessels were missing in the dataset. The internal consistency between the age groups is relatively high (Supplementary Figure 1D).
Results
General Distribution Pattern
The total distribution of adult herring in May for the period 1996–2020 is shown in Figure 2. Generally the herring was distributed along a southwest – northeast axis in May. The most significant deviation from this general pattern was in the 6-year period 1999–2004, where the entire stock only resided in the northernmost part of the Norwegian Sea. Most years the distribution was continuous, from the northeast to the southwest, but, e.g., in 2017–2019 there was a bimodal distribution, with high abundances both in the northeast and southwest, but with almost no herring in the center of the Norwegian Sea (Figure 2). The CG of the total stock (Figure 3) shows how the stock has switched from a southerly (1996–1998), to a northerly (1999–2004) and again to a southerly (2005–2020) distribution.
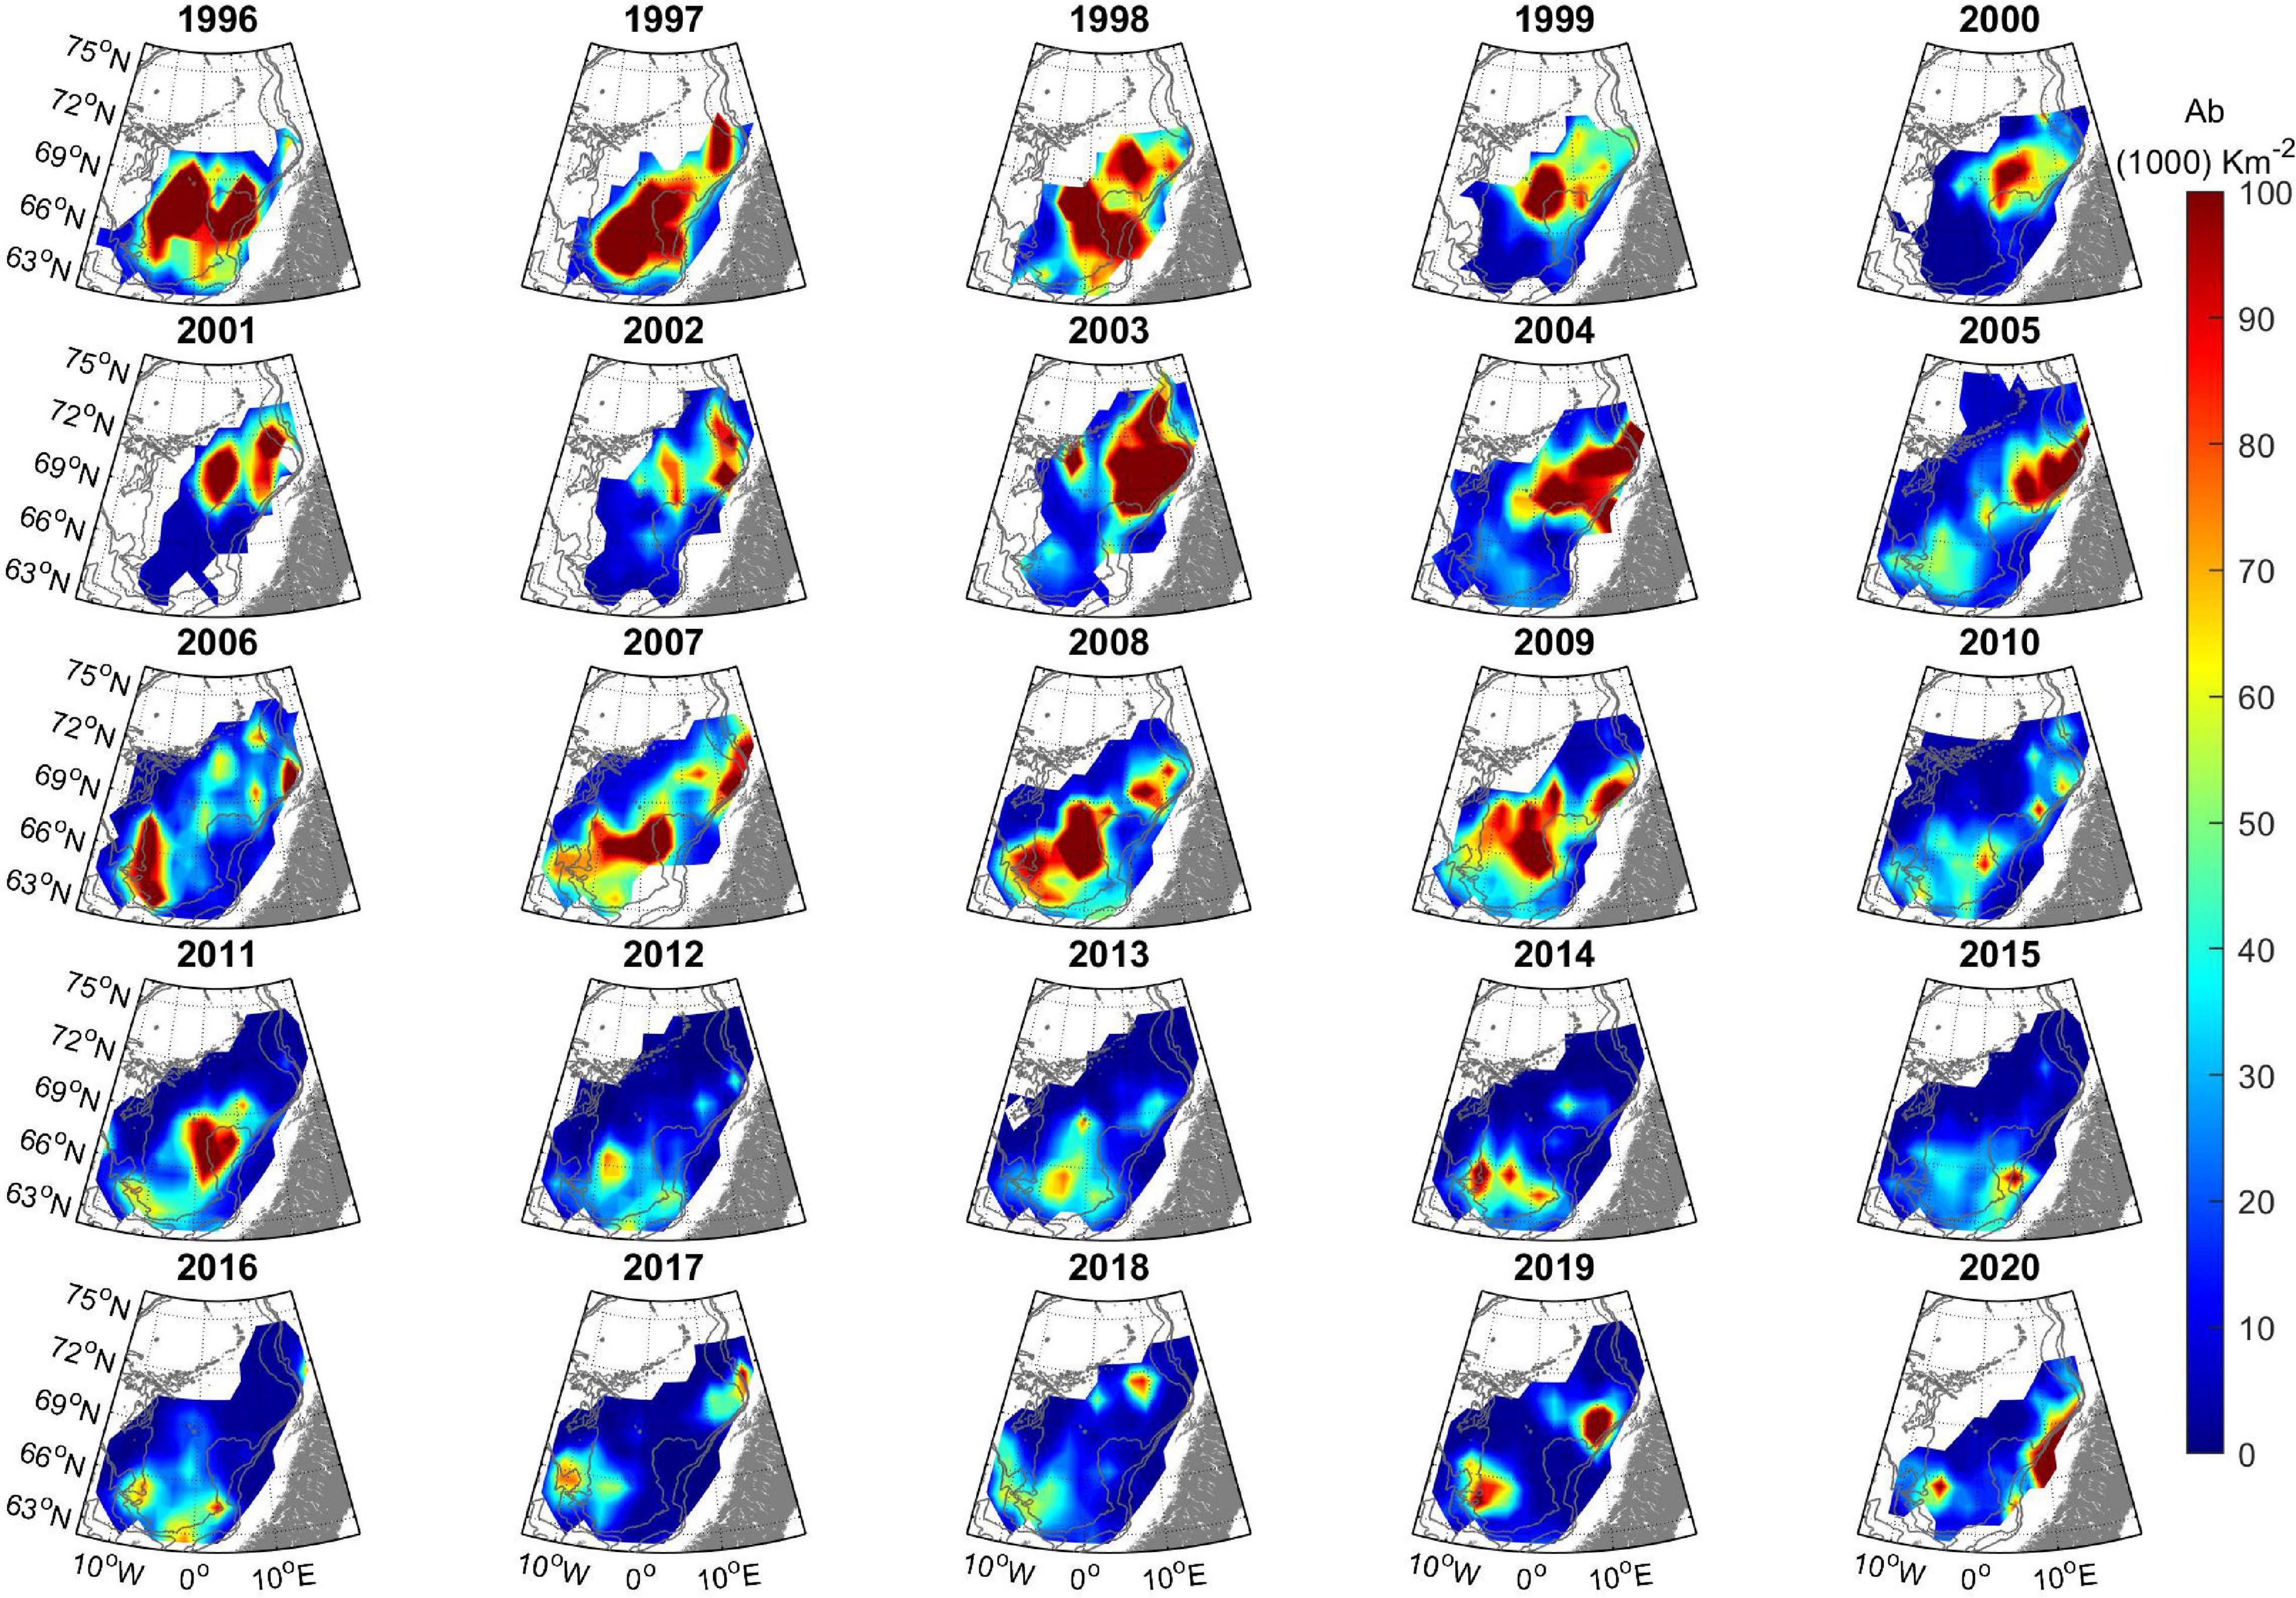
Figure 2. Herring stock distribution in May by year in the period 1996–2020 (Abundance, 103 km–2). The colored areas bordering the white non-colored areas denote the boundaries and extent of the survey coverage each year. The darkest blue regions indicate surveyed areas void of herring. 500, 1,000, and 2,000 m depth contours are shown in gray.
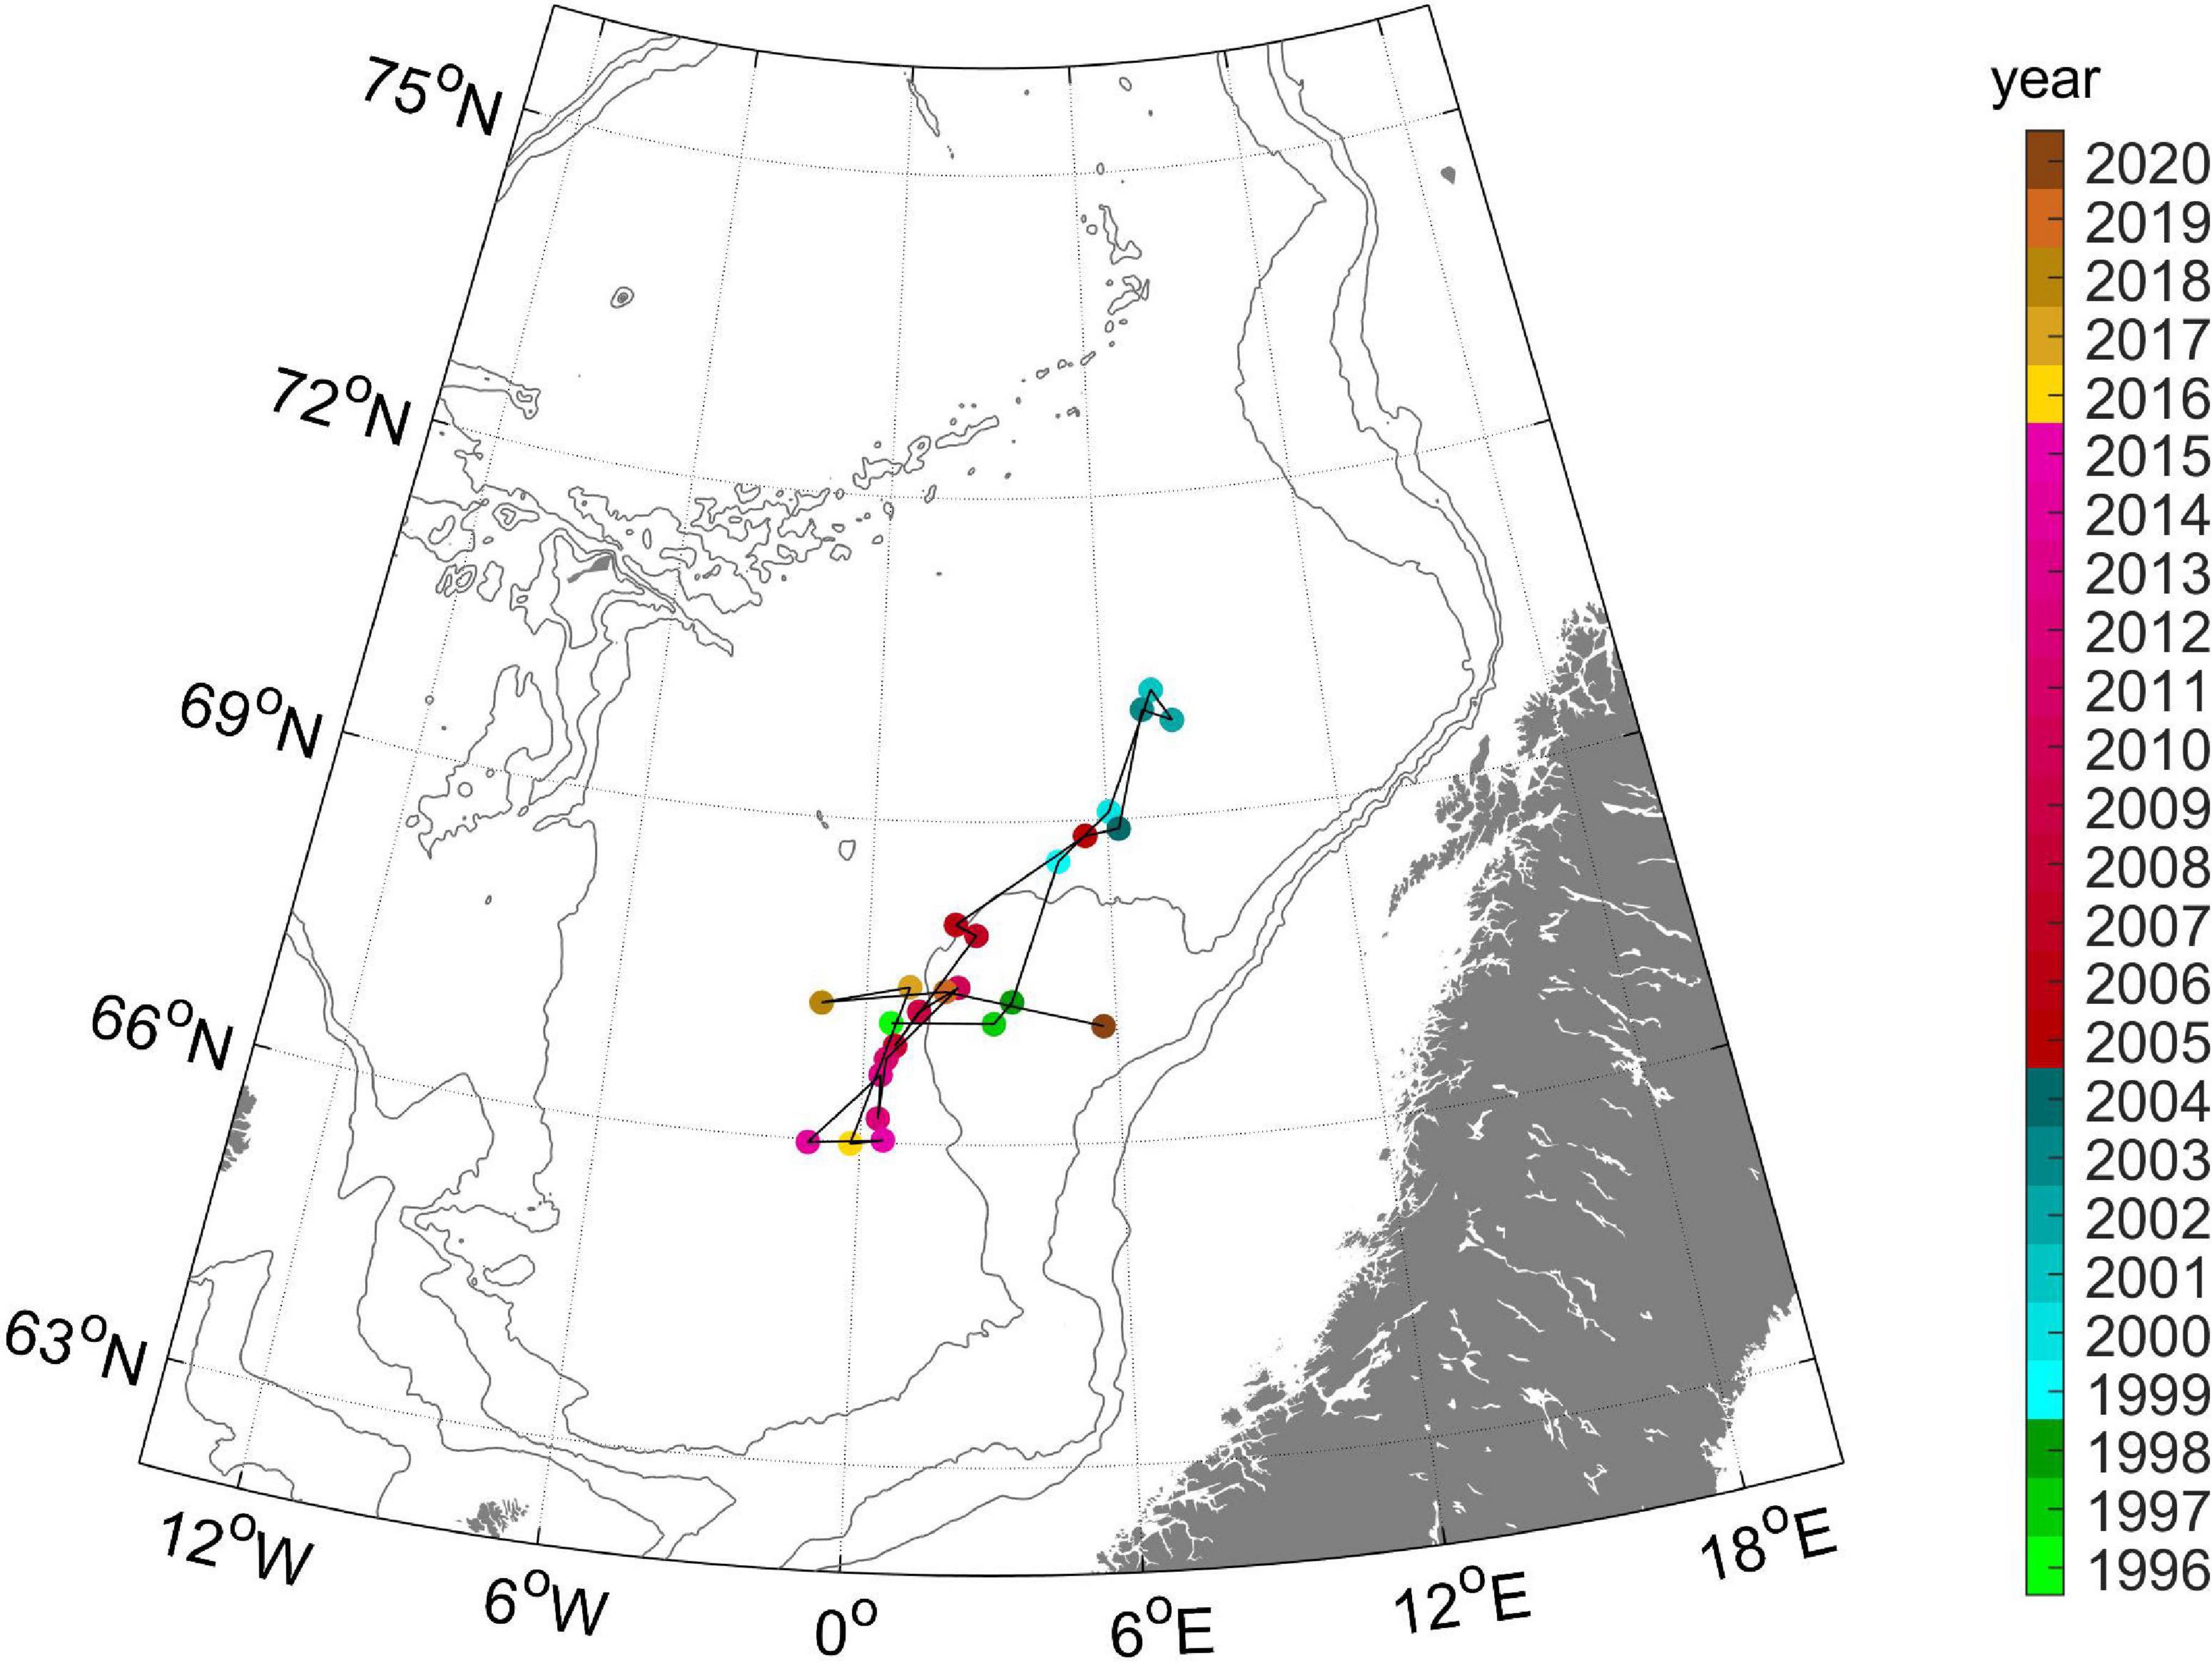
Figure 3. Center of gravity of herring in May in the period 1996–2020. The colors of the markers denote year (as indicated in the scale bar to the right). The 500, 1,000, and 2,000 m depth contours are shown in gray.
Density Dependent Spatial Dynamics
There is a significant positive relationship (Pearson’s correlation coefficient p < 0.01) between the size of the adult stock (biomass of ages 3+) and size of the distribution area in May. When the stock was large, the distribution area was large and vice versa (Figure 4A). Moreover, there is also a significant positive relationship (Pearson’s correlation coefficient p < 0.01) between the stock size and the stock density (biomass/area) (Figure 4B), implying that there are also more tons of herring per km2 when the stock is large than when it is small, i.e., there is density dependence within the stock.
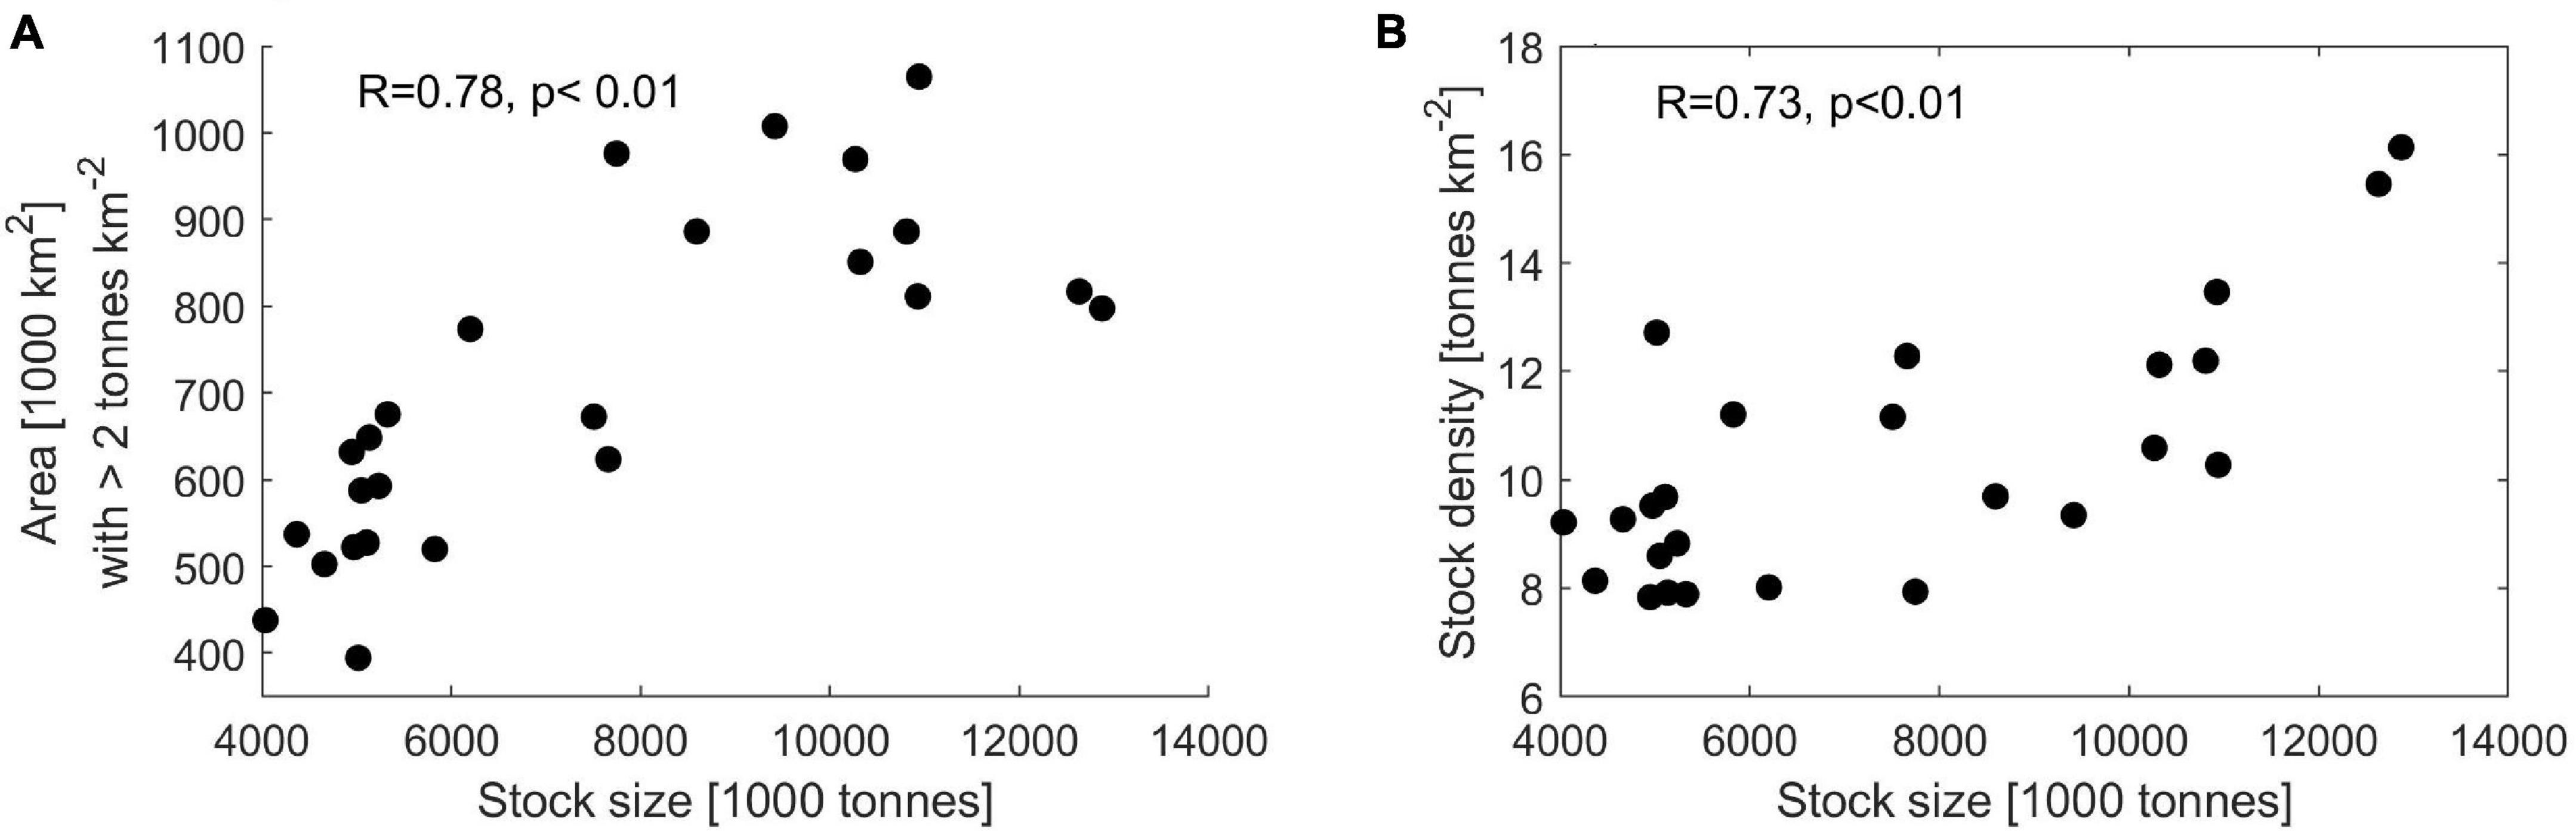
Figure 4. Herring stock size and distribution area (A) and herring density (tons km–2) versus stock size (B). The Pearson’s linear correlation coefficient has been computed for the data in both panels. In both cases the p-value < 0.01.
Disaggregation of the Stock Into Year Classes and Age Groups
Separating the adult herring stock into year classes shows that the youngest year classes (<5 years old) were found more or less just off the Norwegian shelf, on the eastern slopes of the Norwegian Basin and Lofoten Basin (Supplementary Figure 2). However, abundant year classes tend to spread out further west into the central Norwegian Sea as compared to smaller year classes. The older age groups were found further west and southwest, irrespective of year class strength.
The youngest fish (3–4 year olds) quite consistently were gathered along the eastern shelf slope of the Norwegian Shelf, mostly in the Lofoten Basin (Figure 5, left column). The 5–7 year olds had a more variable distribution, and these year classes were distributed mainly in the central Norwegian Sea (Figure 5, middle column). The older herring (age 8+) were mainly distributed in the southwest area of the Norwegian Sea (Figure 5, right column).
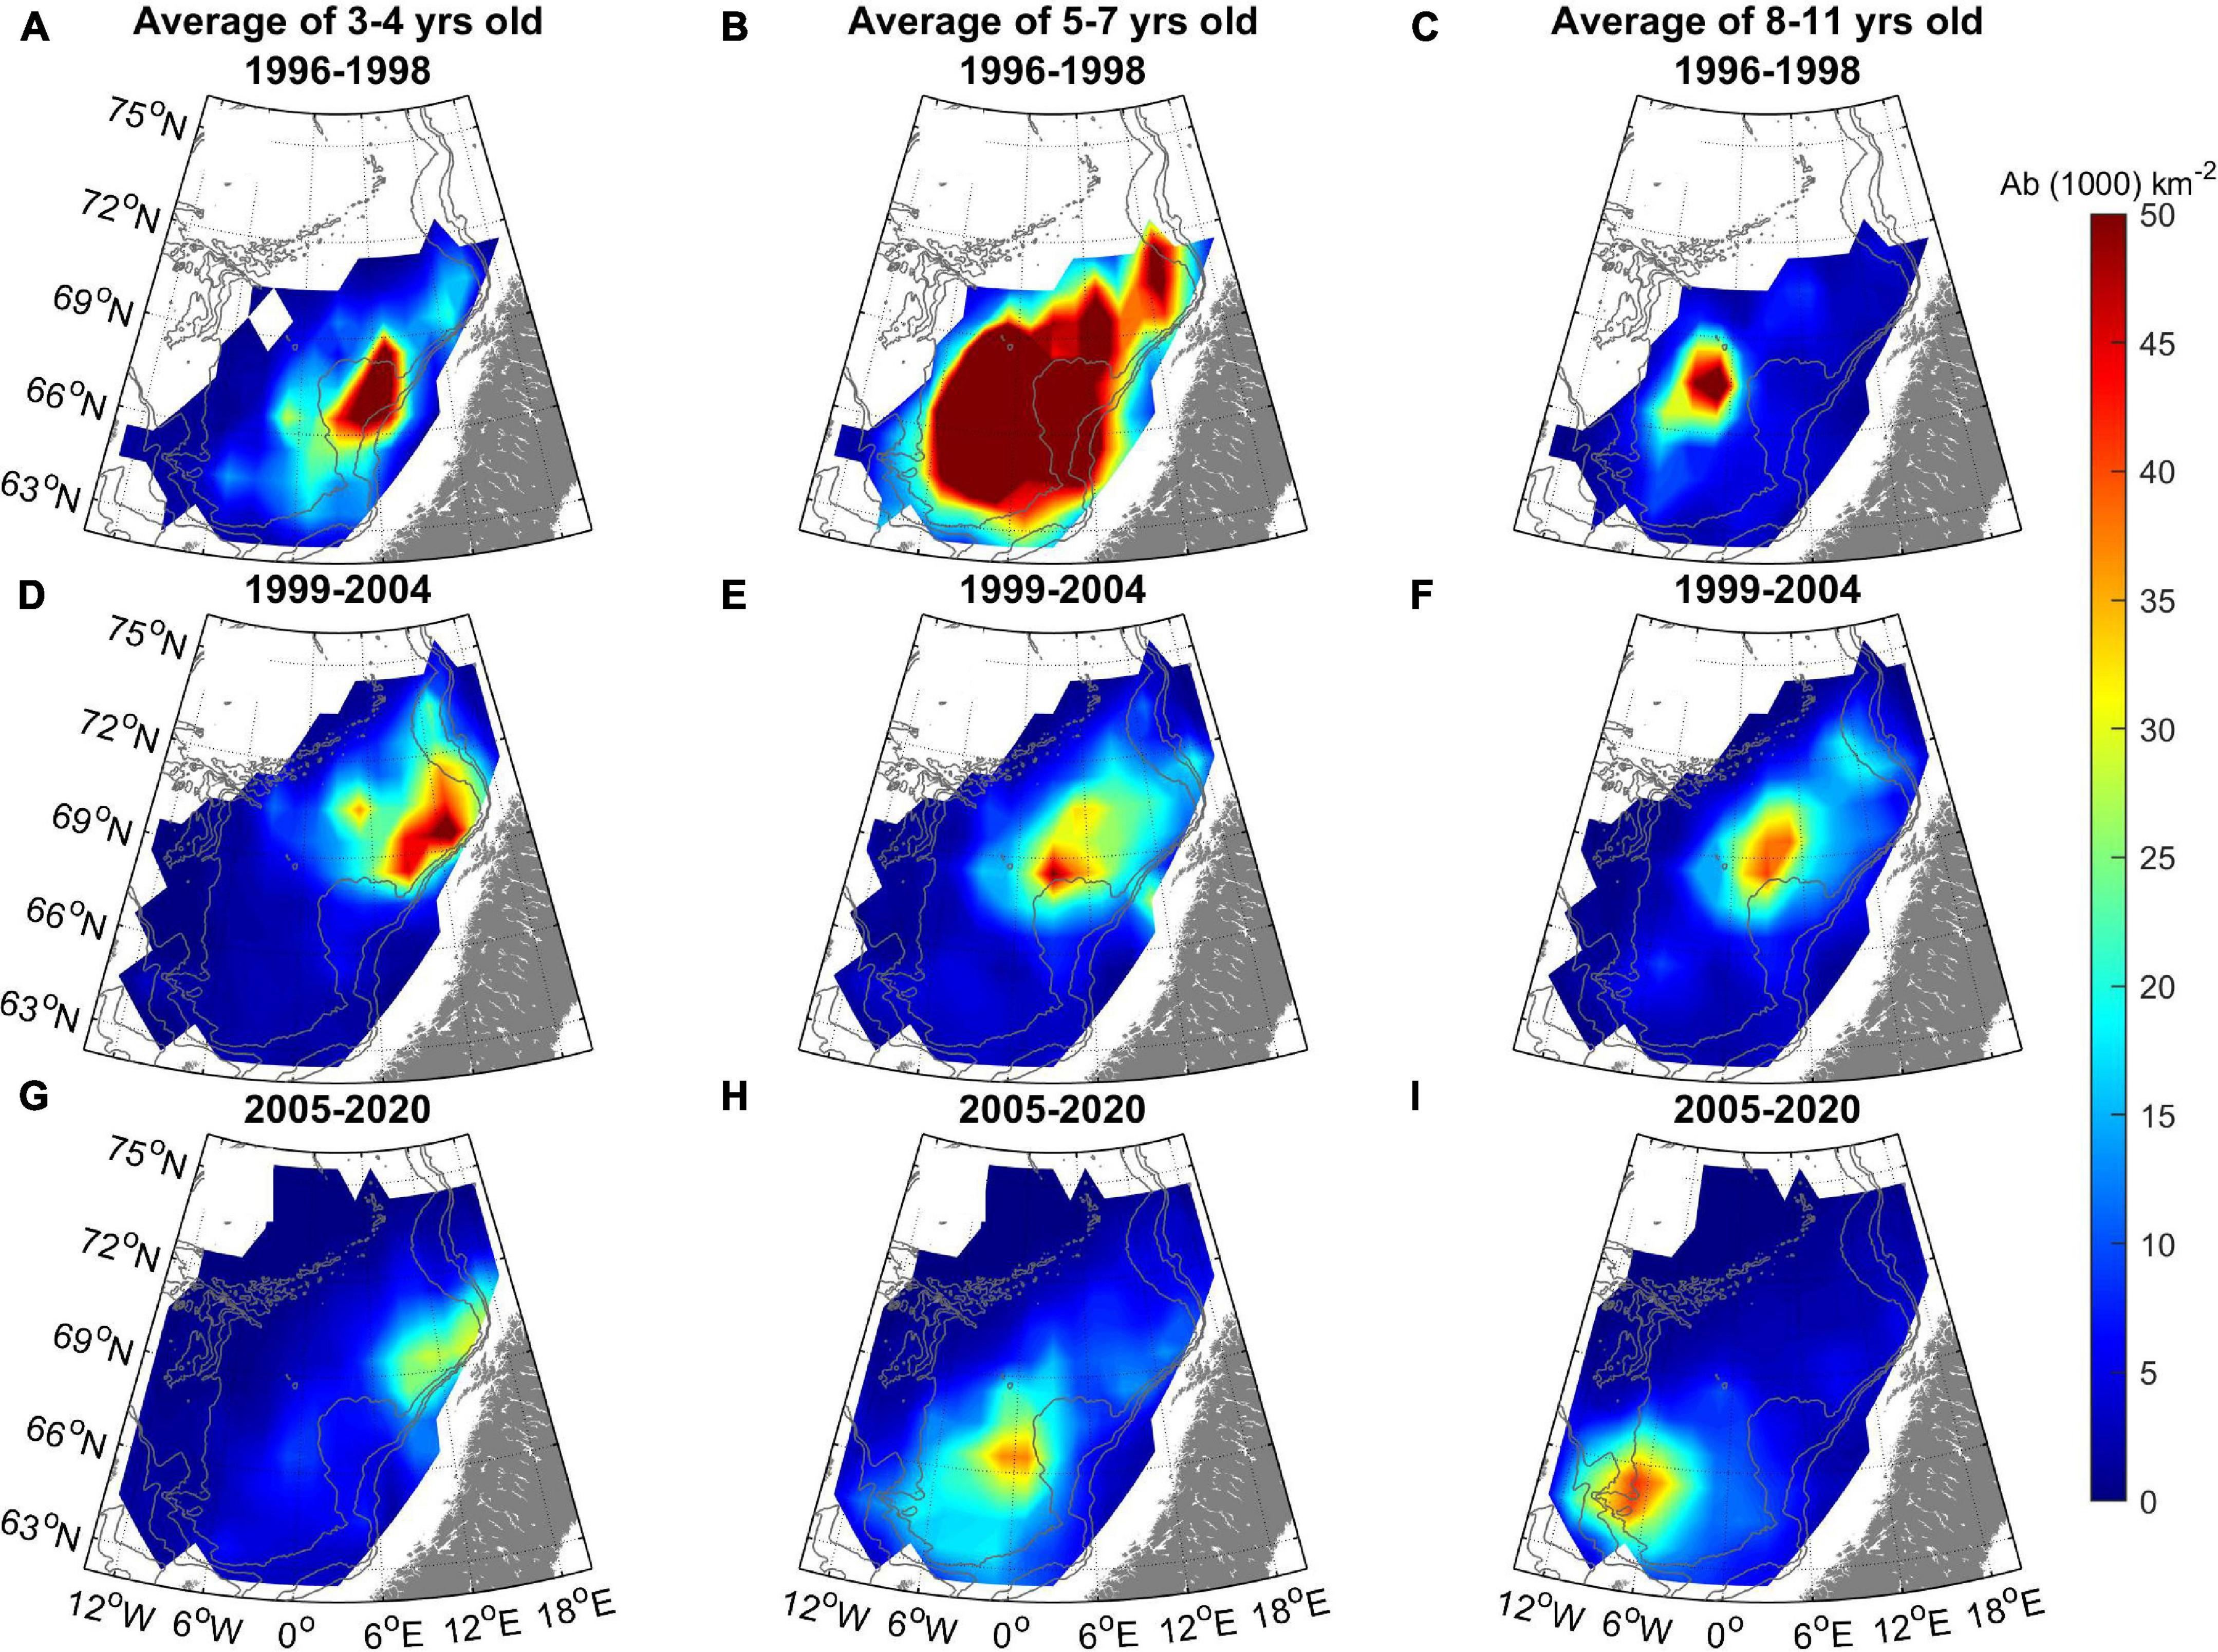
Figure 5. Herring distribution (Abundance, 103 km–2) grouped by three age groups [3–4 year olds left column (A,D,G), 5–7 year olds middle column (B,E,H), and 8+ year olds right column (C,F,I)] and three periods (1996–1998 upper row, 1999–2004 middle row, and 2005–2020 bottom row). The 500, 1,000, and 2,000 m depth contours are shown in gray.
In the period 1996–1998, the oldest (age 8+) fish were found in the western part of the Norwegian Sea – between the Vøring Plateau and the Jan Mayen ridge. In the period 1999–2004, both the 8+ and the 5–7 year olds were distributed relatively far north in the Norwegian Sea, but from 2005 and onward the old fish migrated south and west into the southern part of the Norwegian Sea again after spawning, south and west of the Vøring Plateau, and also far west and south in the areas north of the Faroes and east of Iceland (Figure 5).
Center of Gravity Analysis
The CG of the youngest herring was located mostly in the northeast, on the Norwegian Shelf slope (Figure 6). Herring from 6 years and older were gradually found more southerly and westerly with increasing age and the oldest herring was found farthest away from the Norwegian Shelf. The northern displacement in 1999–2004 was also evident from colored dots in Figure 6. Since 2005 the oldest herring congregated in a narrow area where the Jan Mayen Front and the Iceland-Faroe Front meet.
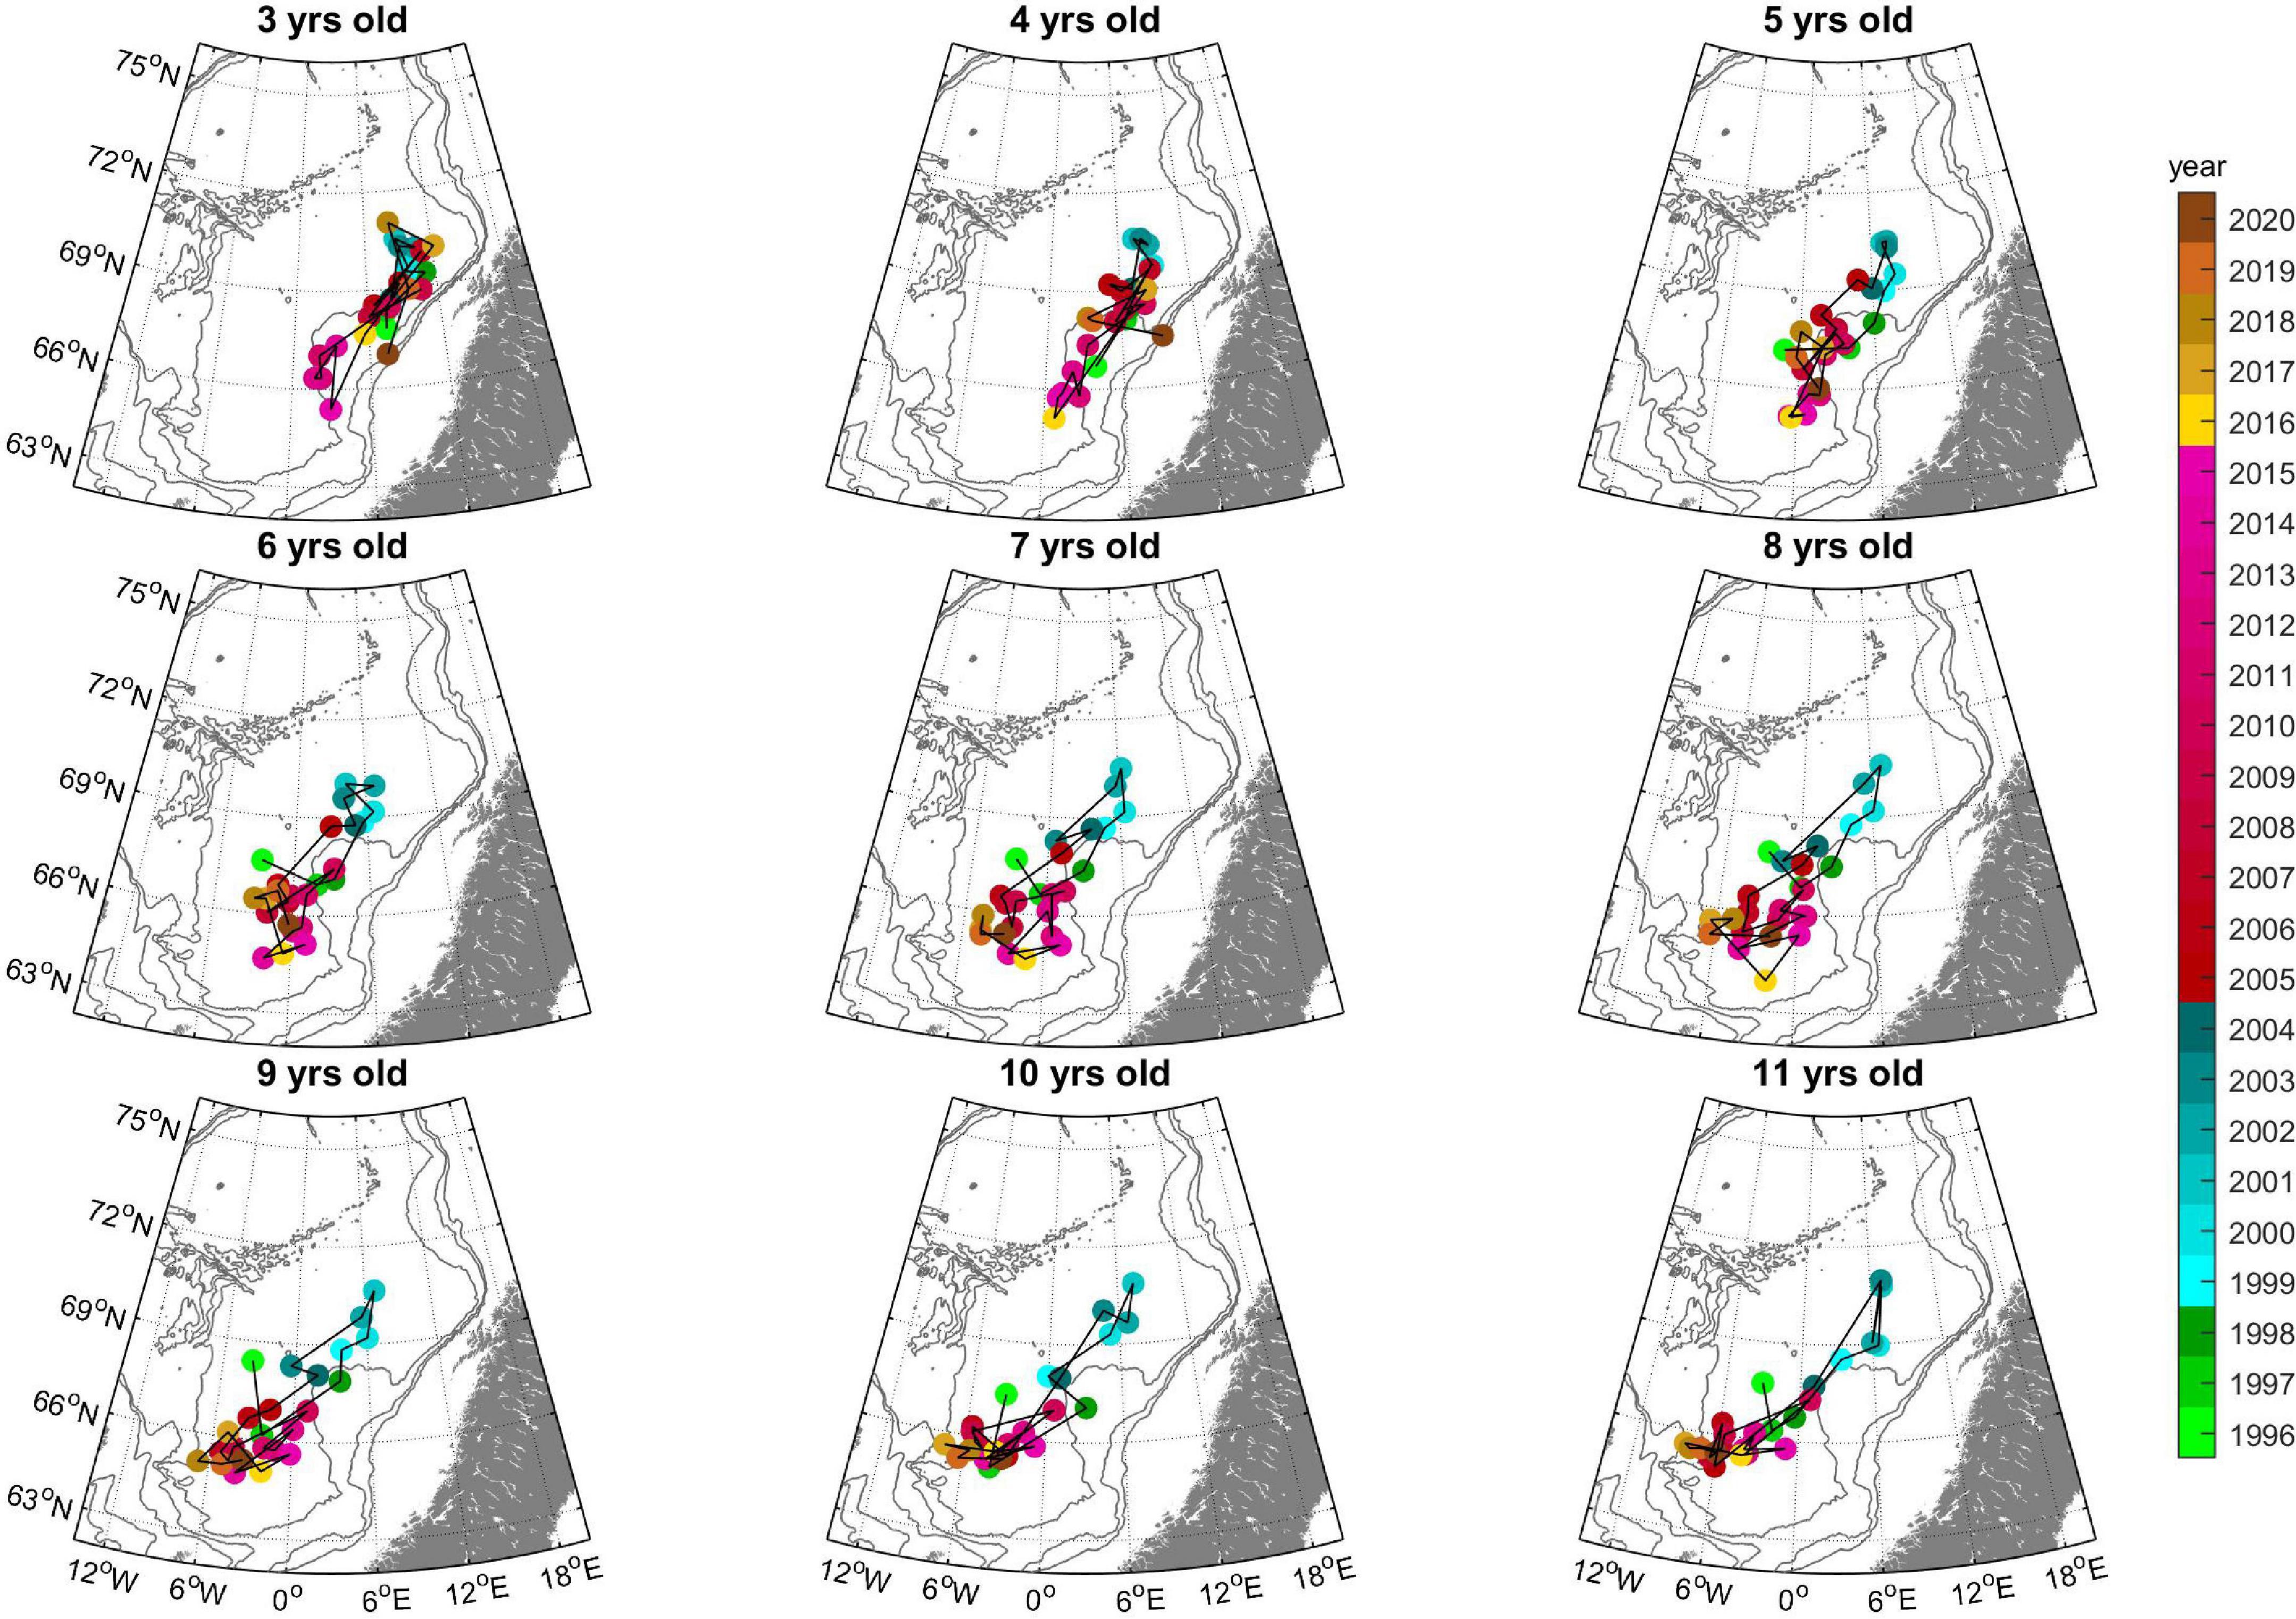
Figure 6. Center of gravity of herring for age groups 3–10 and 11+ in May during 1996–2020. The colors of the markers denote year (as indicated in the scale bar to the right). The 500, 1,000, and 2,000 m depth contours are shown in gray.
The CG by year class (Figure 7) show the typical changes from a location in the north-eastern Norwegian Sea when they were young and the gradual south-western displacement with age. There were, however, some notable exceptions to this pattern, as seen in the early period for the year classes 1989 to 1993. These year classes, when age 6 and older, fed further north in contrast to later year classes, again as a consequence of the northern shift in the summer feeding distribution during the years 1999–2004.
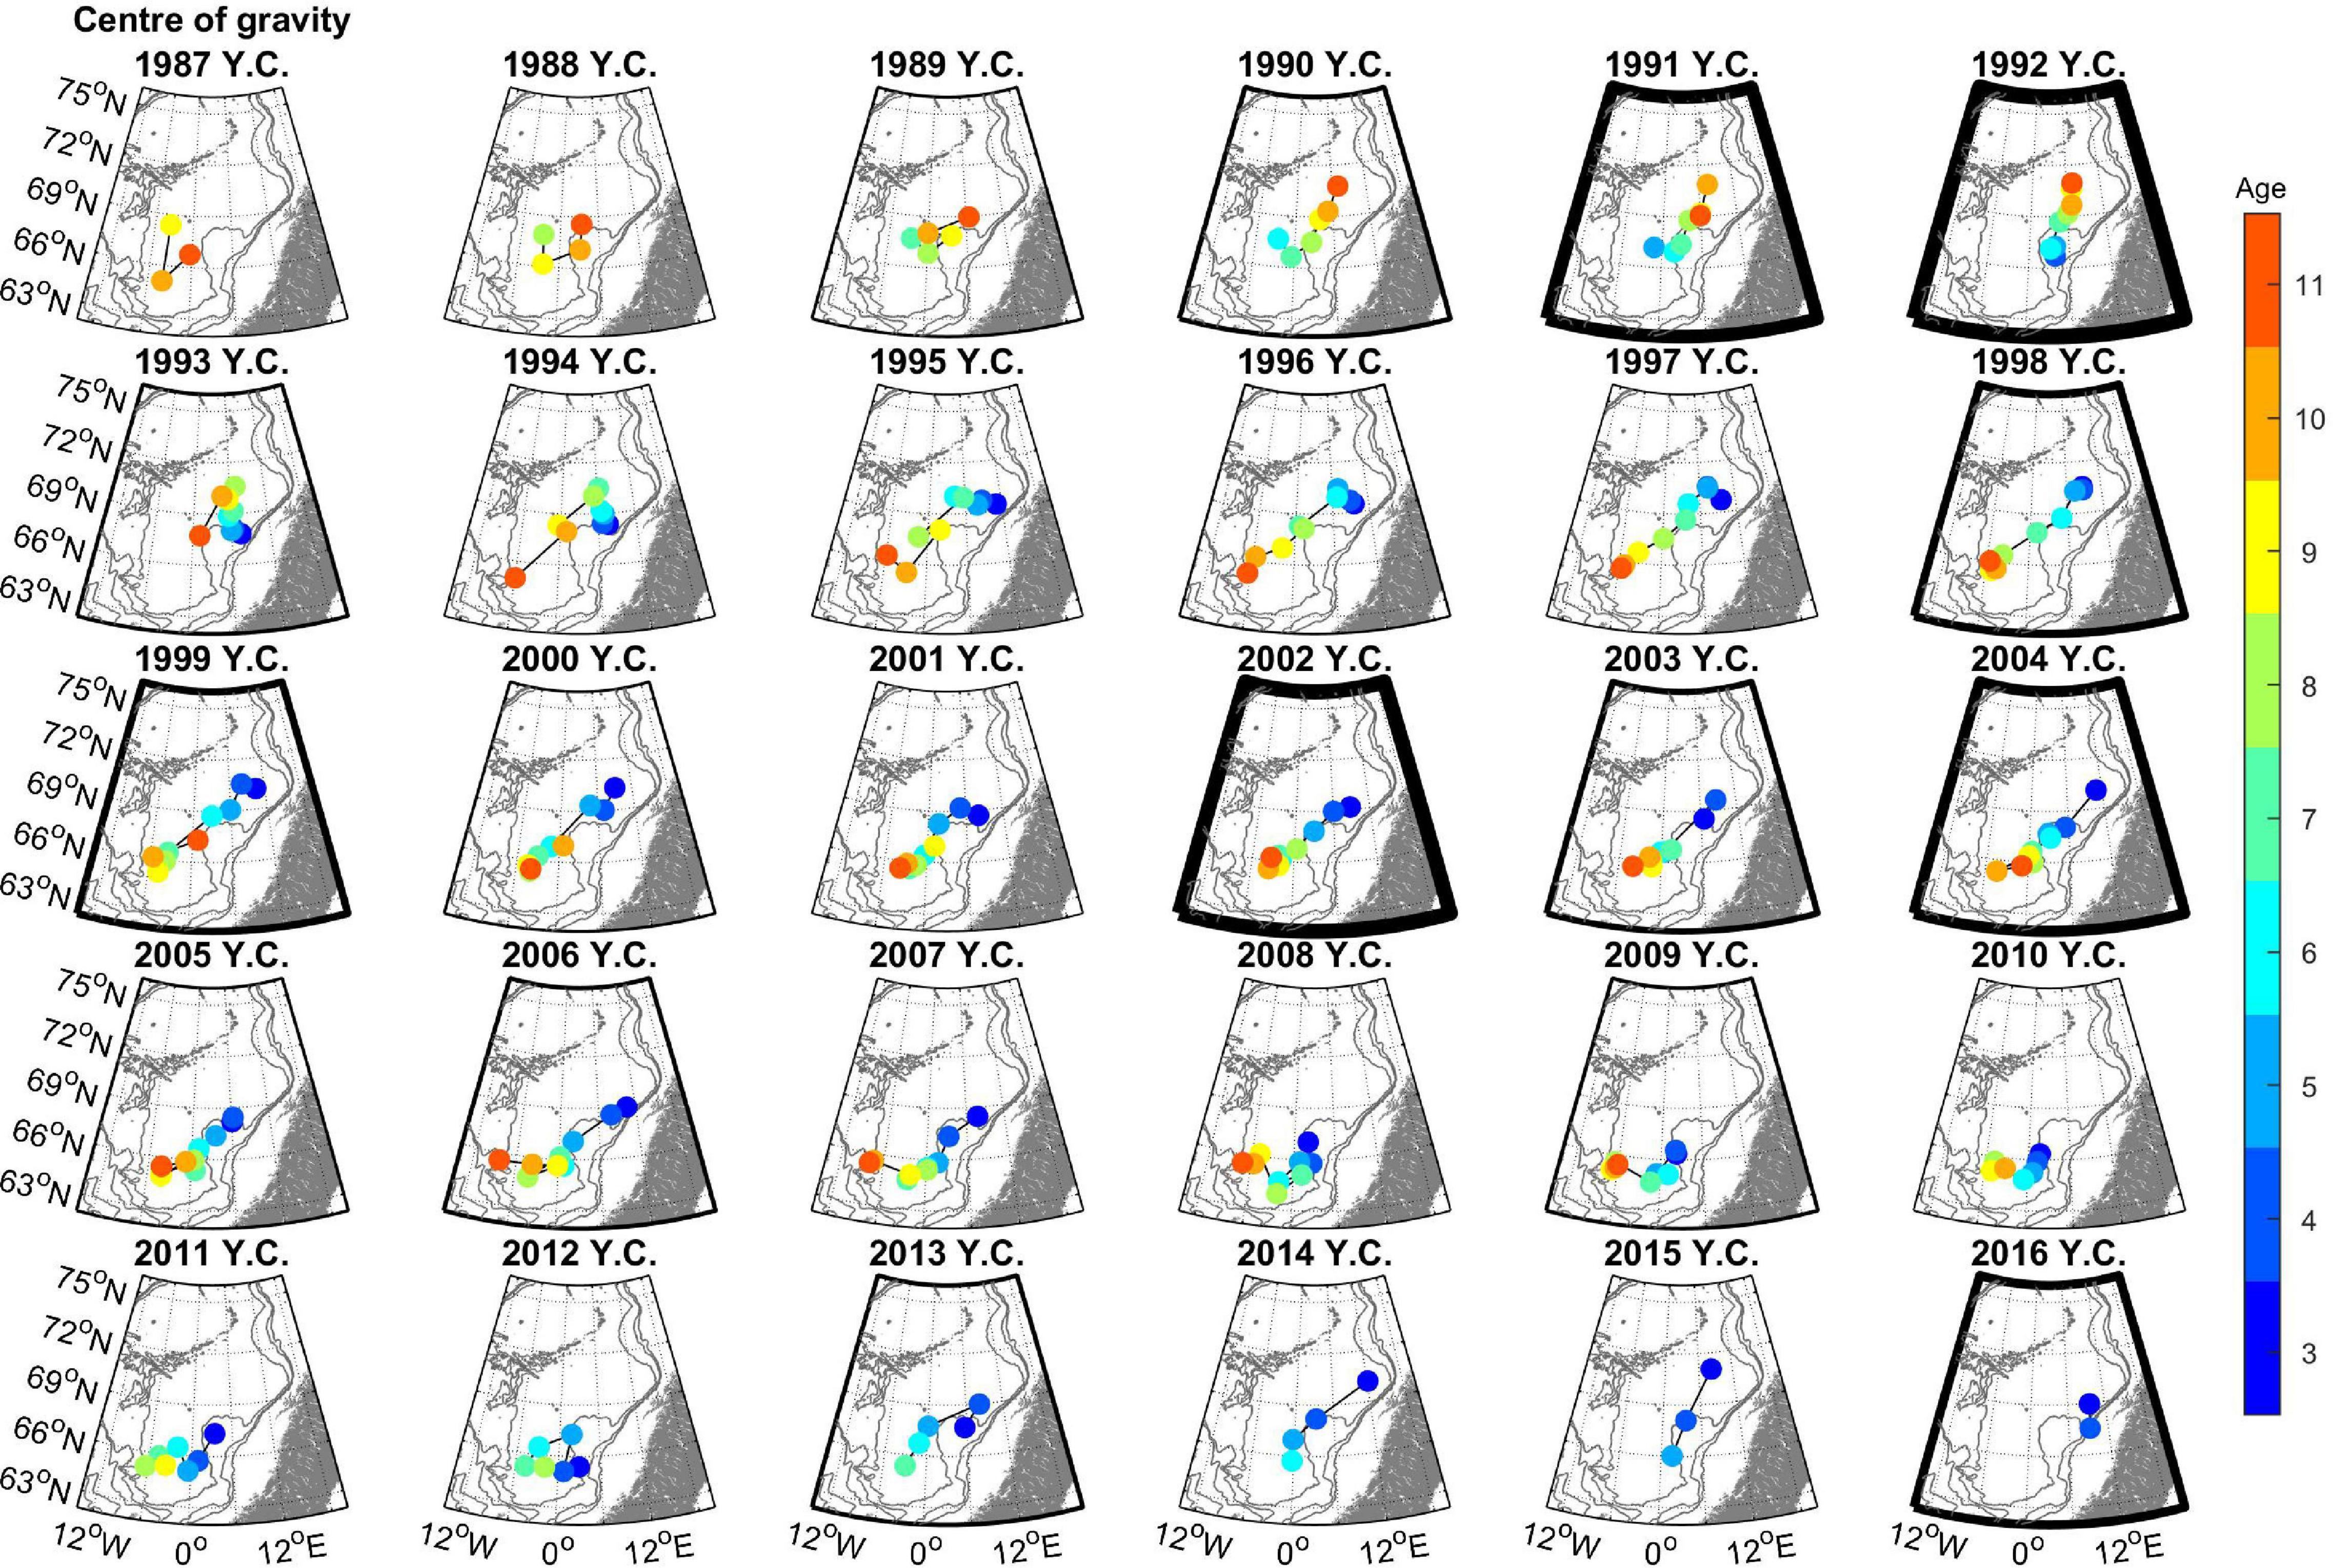
Figure 7. Center of gravity of herring for year classes 1986–2016, in the years where they were 3–10 years old, on separate maps. The colors of the markers denote age (as indicated in the scale bar to the right). Note that the “11 years” dot represents the center of gravity of the year class as 11 years and older. The thickness of the map-frames indicates the strength of each year-class at age 5 (ICES, 2021b). The 500, 1,000, and 2,000 m depth contours are shown in gray.
Figure 8 shows the CG’s latitude of each year class in May as a function of time. The northern displacement can be seen as a northward shift in the latitude of the CG from 1999 to 2003, and a rather abrupt southward change from 2002 to 2003 of 7–9 year old herring, but surprisingly not age 10 and 11+ herring. However, these followed in 2004. The CG of adult herring has remained in the south since 2004, but with regards to latitude, the younger herring seem to have varied more in recent times, with a slight southward displacement during the period 2011–2016. From 2017, the youngest herring again has been located far north in the Norwegian Sea (Figure 8). Figure 8 also shows that the stock occupies more space when it’s large (around 2,008) than when it’s small (e.g., around 2,000). The bimodal distribution in 2017–2019 causes the CG’s latitude of each year class to be spread out over a wide range of latitudes. However, investigation of the data confirms that the total area, which the stock occupied in this period, was always less than 700 × 103 km2 (see also Figures 2, 4).
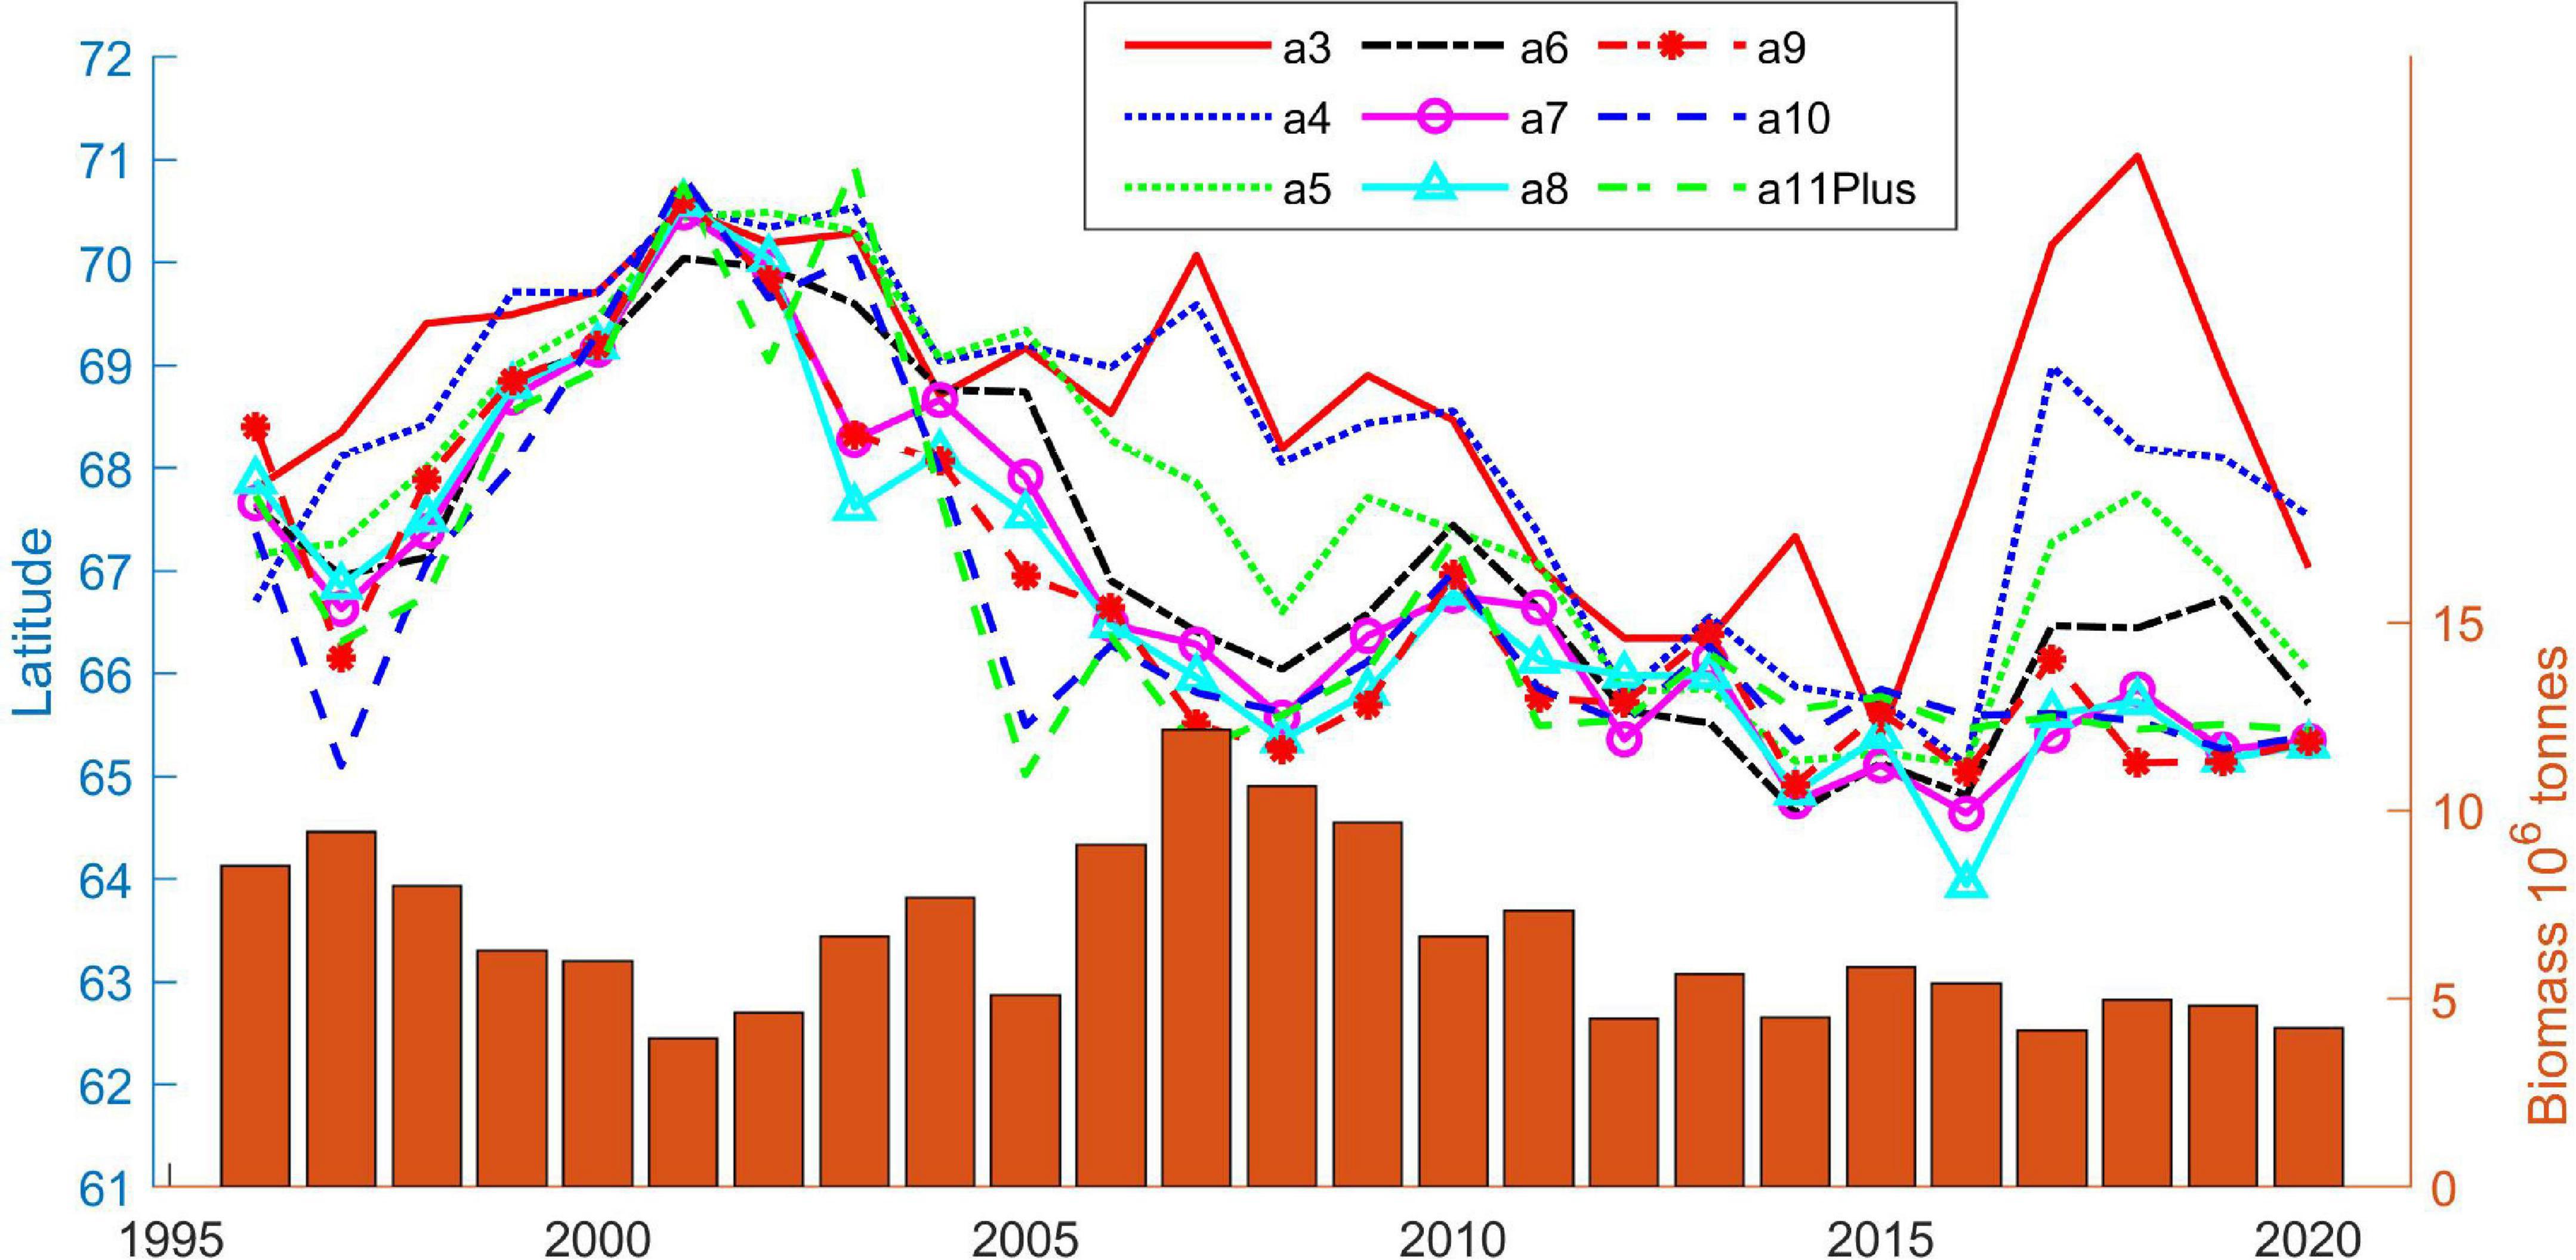
Figure 8. Latitude of center of gravity for age 3–11+, 1996–2020 (lines). Each age group has a different color. Orange bars, with reference to the right axis, show total stock size (including ages 1 and 2) as estimated by the IESNS survey (ICES, 2021b).
Discussion
Distribution Pattern
Our results confirm density dependent spatial dynamics within the herring stock. The herring stock both occupies a larger area and the stock’s density is higher, i.e., higher biomass per km2, when the stock is large. This might in turn affect the feeding conditions and growth of individual fish when the stock is large. However, the relationship between density and distribution area only considers biomass per square kilometer, and does not take the vertical dimension into account. It is possible that the stock occupies more space in the water column when the stock is large than when it is small and thereby increase their feeding opportunities. This analysis does not infer anything about biomass per volume.
Suitable “habitat area” for herring has previously been estimated based on temperature conditions in the Norwegian Sea ([opetwcitep]B31,B30[clotwcitep]ICES, 2020, 2014). According to that, the herring most years does not seem to fully occupy its potential habitat since there is not a close relationship between calculated potential habitat size and stock size. If the size of the distribution area depends on the size of the stock, one would expect the size of the potential habitat to be a limiting factor only when the stock is large.
A change in distribution during the feeding period in May occurred during the period 1999–2004 when all age groups were distributed in the northern Norwegian Sea. Therefore, three periods were chosen to analyze the age disaggregated distribution: 1996–1998, 1999–2004, and 2005–2020, where the mid period 1999–2004 represents the northern displacement period of the stock.
The CG analysis of each age and each year class confirm that the youngest age classes are the ones that are seen in the eastern part of the Norwegian Sea in May. Furthermore, as the herring grows older, it migrates farther west during the feeding seasons. Surveys conducted close to the spawning period (e.g., Slotte et al., 2018; Salthaug et al., 2020) show that young fish spawn more northerly and later than older fish (Slotte, 1999; Slotte et al., 2000), and thus, the observed difference in positions of the younger and older age classes in May can be due to three different non-exclusive factors: (1) the difference in spawning location at the start of the feeding migration, (2) the fact that older age classes start their feeding migration earlier, due to their earlier spawning, and (3) that old fish have larger body size and are thus able to migrate a longer distance for a given amount of energy used compared to younger and smaller fish (Nøttestad et al., 1999). Regarding the last point there might be a trade-off between food abundance and migration distance. Considering that a small individual needs less food than a large individual, a young fish’s need to migrate far from the spawning and wintering areas might not be as great as for a large and old fish.
With regards to where the herring migrate after spawning, the older age groups displayed a larger variation in where they fed in May compared to the younger age groups. The northward shift of the whole stock in 1999 was dominated by the relatively large 1991 and 1992 year classes, which at the time were 7 and 8 years old and accounted for more than 65% of the spawning stock abundance. The stock was at this time 5.853 million tons (ICES, 2021b), which is well above the reference point MSY Btrigger (3.184 million tons). The MSY Btrigger reference point is a safeguard against an undesirable or unexpected low spawning stock biomass when the fishing pressure is not higher than the so-called “Maximum Sustainable Yield” (MSY) level (ICES, 2021a). In 1998, both the 1991–1992 year classes and other year classes as well, were found in large parts of the Norwegian Sea – including the southern area. However, in 1999 the stock did not migrate into the southern part of the Norwegian Sea to feed in May, but instead only occupied the northern part of the Norwegian Sea. Since year classes 1993 and older had been feeding in the southern part of the Norwegian Sea the previous years, the herring “knew” this migration route and this area. Moreover, this change in migration pattern was not associated with any drastic change in stock size. It is therefore likely something in the oceanic environment in 1998–1999, that either was attractive in the north or repulsive in the south, which caused the whole herring stock to be absent in the southern part of the Norwegian Sea in May 1999. We do not consider it likely that the herring had first tested the “usual” southern feeding areas before they “decided” to migrate northward to feed. Presumably they “made” this behavioral decision on the way out from the spawning areas, based on some environmental or biological cues.
The northerly displacement in 1999 continued until 2005. At this time the stock was numerically dominated by the 1998 and 1999 year classes and the large 2002 year class was just entering the stock. In May 2005, the 2002 year class only stayed in the north-eastern part of the Norwegian Sea and it was mainly the 1998–1999 year classes that migrated into the south-western part of the Norwegian Sea to feed. This change in migration pattern for these year classes (1998–1999) was not an entirely “new pattern,” even though these year classes had not previously been in the southern Norwegian Sea in May. Closer inspection of the distribution areas shows that the 1993 and 1994 year classes already in 2003 migrated south to the area east of Iceland.
Since 2005, the distribution pattern in May has been more or less the same, with only small inter annual variations which can also be seen in the CG for each year class for the herring age-disaggregated distribution. However, since 2017 the youngest year classes have been found more and more north. This new trend in distribution pattern was initiated by the relatively strong 2013 year class, but became more pronounced by the following year classes.
The herring stock is characterized by a large variability in recruitment (Toresen and Østvedt, 2000; ICES, 2021b). The recruitment can vary at least two orders of magnitude and it has been suggested that large year classes are able to change the behavior of the whole stock ([opetwcitep]B27,B28[clotwcitep]Huse et al., 2010, 2002). However, the main changes seen in the last two decades have not been initiated by the youngest age groups of large year classes, but rather by older age groups.
Potential External Drivers
As mentioned in the introduction, changes in migration pattern have been hypothesized – and to some extent linked to – either abrupt changes in stock size or environmental factors. Based on our analyses, the observed changes in feeding migration pattern in 1999 and 2005, respectively, cannot be linked to abrupt changes in stock size. Thus an investigation of environmental factors, that possibly could have influenced the shift, is needed.
The waters north of Iceland became very cold (∼0°C) in 1995 (Astthorsson and Gislason, 2003) and this to some degree continued until 1998 (Malmberg and Valdimarsson, 2003) and relatively high volumes of fresh water were also observed in the East Icelandic Current at the same time (Jónsson, 2007; González-Pola et al., 2020; ICES, 2020). The herring distribution in 1998 did not extend as far west as in the period 2005–2020, which could be due to low temperatures west of and in the Jan Mayen Front during this period. Misund et al. (1997) documented that herring migrated to the Jan Mayen Front, but instead of crossing the front, the herring remained on the eastern side of the front. It is possible that low temperatures west of the Jan Mayen Front in May 1995–1998 acted as a barrier to the herring, prohibiting it to enter the frontal zone area as usual and consequently resulting in a withdrawal from the westernmost areas already in 1998. The mean winter weights of herring prior to this withdrawal were also below average which also can have affected the migration pattern or – vice versa, the low weights were perhaps due to suboptimal feeding conditions (Homrum et al., 2021).
Nonetheless, this withdrawal from the westernmost areas was followed by the northerly shift in 1999, when herring, which in 1996–1998 had occupied the southernmost areas in the Norwegian Sea, also abandoned these. The period in the mid 1990s and the first decade of this millennium was characterized by a weakening Subpolar Gyre, and thus a change in water mass composition and increased salinities and temperatures west of the British Isles (Hátún et al., 2005; Holliday et al., 2020). Whereas a strong Subpolar Gyre implies a stronger influence of nutrient rich subpolar water masses from the Labrador Sea, a weaker Gyre implies larger amounts of southern, nutrient poor water in this region (Hátún et al., 2016). Hátún et al. (2017) linked the weakening of the Subpolar Gyre to decreasing silicate concentration in the water masses entering the Nordic Seas, i.e., downstream from the region west of the British Isles and suggest that decreasing nutrients will cause a decrease in phytoplankton and thus, in turn, a decrease in zooplankton. The water masses that reached the Norwegian Sea were possibly also affected by these changes, both with regards to climate and prey for herring. Moreover, the mean winter weights of herring also continued to be low until around 2002, when they started to increase again (Homrum et al., 2021). It is therefore possible that it was bad feeding conditions that caused the herring to dismiss the southern part of the Norwegian Sea as feeding area in the period 1999–2005.
A decrease in zooplankton biomass indices from the IESNS survey occurred around 2003 ([opetwcitep]B35,B37[clotwcitep]Kristiansen et al., 2016, 2019; ICES, 2020) which was also accompanied by a shift in species composition. The C. hyperboreus disappeared from the south-western Norwegian Sea and the abundances of the large overwintered C. finmarchicus individuals decreased. Further to this, Kristiansen et al. (2019), showed that the inflow of East Icelandic Water, which originates from the Iceland Sea and flows north and east of Iceland into the Norwegian Sea, where is submerges the Iceland-Faroe Front, decreased at this time, and has been fluctuating at a lower level until around 2017. It is possible that these changes in hydrography and zooplankton phenology and composition, in 2003–2005 caused the herring to again migrate to the previous feeding spot east of Iceland, since this is the source of the C. hyperboreus inflow into the Norwegian Sea and chances of finding large copepods are highest there at times when concentrations are low. It is also noteworthy that the CG since 2005 for the oldest fish in the stock, which are the most experienced (Misund et al., 1998; Corten, 2002; Huse et al., 2010), has been in a rather confined area around 65.5°N, 5°W, which is also where the Jan Mayen Front and the Iceland Faroe Front meet. Since the oldest herring has congregated there every May since 2005, it is likely that this area, which has been shown to be rich in the large and nutritious C. hyperboreus and large stages of C. finmarchicus (e.g., Kristiansen et al., 2021), has been a feeding hotspot for the herring in recent years. This is further supported by the fact that herring has continued to feed in this area during the summer/autumn season and has had relatively high mean weights since 2005 (Homrum et al., 2021).
A discussion on external drivers during the study period requires mentioning the largest freshening event in the eastern subpolar North Atlantic in 120 years, which occurred 2012–2016 (González-Pola et al., 2020; Holliday et al., 2020). Although it’s not likely that changes in salinity would affect the herring directly, changes in salinities are often associated with changes in water mass composition (Hátún et al., 2009; Kristiansen et al., 2019) and thus it could affect the zooplankton composition and thereby the herring feeding conditions. However, the most drastic change in the herring stock distribution during this period was the northerly shift observed in the youngest year classes from 2016 to 2018 (2013–2016 year classes). The 2013 year class was relatively strong (∼16% of the total stock abundance in 2016), but it was in particular the following two small year classes that drove the shift. Even though this is not a major change in distribution and young year classes were found northerly in the period 2005–2008 as well, this minor change in distribution could have been driven by the debut of a new relatively strong year class and by environmental factors.
In order to statistically verify or dismiss possible effects of environmental factors, a multidimensional study of all variables thought to affect the herring is needed. This could, e.g., be a multidimensional modeling or machine learning approach, where significant patterns and relationships are identified. However, the scope of this manuscript only allows a general discussion of external factors, since the aim of the analysis was to investigate whether the observed changes in spatio-temporal distribution of the herring during the feeding phase were caused by changes in age distribution within the stock.
Conclusion
The changes in the spatial distribution of Norwegian spring spawning herring in its main feeding period (May) were analyzed with regards to age distribution in the stock. The analysis implies a positive density dependent spatial dynamic in the stock.
The youngest herring were found in the eastern part of the Norwegian Sea closest to the Norwegian shelf and the proportion of older age classes gradually increased in the western areas. In the period 1999–2004, the whole stock abandoned the southern and western part of the Norwegian Sea and only occupied the northernmost parts for 4–6 years. These changes in distribution pattern were not driven by episodic changes, e.g., after a strong year class had just entered the stock. On the contrary, it was older fish (6–8 years old), that were dominating the stock during these changes. Thus, it is likely that external factors drove these changes. During the northern displacement, temperature and salinities increased and zooplankton abundances decreased in the Atlantic water masses upstream from the Norwegian Sea, which could be a reason for why the herring abandoned the southern part of the Norwegian Sea 1999–2004.
The little variation in the center of gravity and high weights for the oldest year classes after 2005 indicates that the frontal zone where the Jan Mayen Front and the Iceland-Faroe Front intersect is a feeding hotspot for herring.
We hope that this work will form a basis for further investigation of links between the herring stock and environmental factors through a multidimensional modeling or machine learning approach.
Data Availability Statement
The data analyzed in this study is subject to the following licenses/restrictions: The data used in the manuscript are stored in a joint database (PGNAPES), and can only be accessed by the consent of all parties. Requests to access these datasets should be directed to GÓ, Z2pvc0BoYWZvZ3ZhdG4uaXM=; AS, YXJpbC5zbG90dGVAaGkubm8=; and JJ, amFuYXJnZUBoYXYuZm8=.
Ethics Statement
Ethical review and approval was not required for the animal study because no ethics approval was required as per institutional and national guidelines for this study and no animal experiments were performed.
Author Contributions
SE composed the story told, did the data analyses, and led the writing process. EH, JJ, GÓ, AS, and ES gave input to the analysis process and to the discussion part of the manuscript. IK gave input to the discussion part of the manuscript. All authors have read, commented, and agreed to the manuscript before submission.
Funding
This study was carried out as part of the project “Sustainable multi-species harvest from the Norwegian Sea and adjacent ecosystems” funded by the Research Council of Norway (project number 299554).
Conflict of Interest
The authors declare that the research was conducted in the absence of any commercial or financial relationships that could be construed as a potential conflict of interest.
Publisher’s Note
All claims expressed in this article are solely those of the authors and do not necessarily represent those of their affiliated organizations, or those of the publisher, the editors and the reviewers. Any product that may be evaluated in this article, or claim that may be made by its manufacturer, is not guaranteed or endorsed by the publisher.
Acknowledgments
All researchers and crew on the IESNS cruises 1996–2020 are thanked for their valuable work in collecting and processing data used in this analysis.
Supplementary Material
The Supplementary Material for this article can be found online at: https://www.frontiersin.org/articles/10.3389/fmars.2021.778725/full#supplementary-material
References
Astthorsson, O. S., and Gislason, A. (2003). Seasonal variations in abundance, development and vertical distribution of Calanus finmarchicus, C. hyperboreus and C. glacialis in the East Icelandic Current. J. Plankton Res. 25, 843–854. doi: 10.1093/plankt/25.7.843
Bachiller, E., Skaret, G., Nøttestad, L., and Slotte, A. (2016). Feeding ecology of Northeast Atlantic Mackerel, Norwegian spring-spawning herring and blue whiting in the Norwegian Sea. PLoS One 11:e0149238. doi: 10.1371/journal.pone.0149238
Bachiller, E., Utne, K. R., Jansen, T., and Huse, G. (2018). Bioenergetics modeling of the annual consumption of zooplankton by pelagic fish feeding in the Northeast Atlantic. PLoS One 13:e0190345. doi: 10.1371/journal.pone.0190345
Blindheim, J., and Østerhus, S. (2005). The Nordic Seas, Main Oceanographic Features. Geophys. Monogr. Ser. 158, 11–37. doi: 10.1029/158GM03
Böhme, L., and Send, U. (2005). Objective analyses of hydrographic data for referencing profiling float salinities in highly variable environments. Deep Sea Res. Part II Top. Stud. Oceanogr. 52, 651–664. doi: 10.1016/j.dsr2.2004.12.014
Broms, C., Melle, W., and Horne, J. K. (2012). Navigation mechanisms of herring during feeding migration: the role of ecological gradients on an oceanic scale. Mar. Biol. Res. 8, 461–474. doi: 10.1080/17451000.2011.640689
Broms, C., Melle, W., and Kaartvedt, S. (2009). Oceanic distribution and life cycle of Calanus species in the Norwegian Sea and adjacent waters. Deep. Res. Part II Top. Stud. Oceanogr. 56, 1910–1921. doi: 10.1016/j.dsr2.2008.11.005
Corten, A. (2002). The role of “conservatism” in herring migrations. Rev. Fish Biol. Fish. 11, 339–361. doi: 10.1023/A:1021347630813
Dalpadado, P., Ellertsen, B., Melle, W., and Dommasnes, A. (2000). Food and feeding conditions of Norwegian spring-spawning herring (Clupea harengus) through its feeding migrations. ICES J. Mar. Sci. 57, 843–857. doi: 10.1006/jmsc.2000.0573
Dommasnes, A., Melle, W., Dalpadado, P., and Ellertsen, B. (2004). Herring as a major consumer in the Norwegian Sea. ICES J. Mar. Sci. 61, 739–751. doi: 10.1016/j.icesjms.2004.04.001
Dragesund, O. (1980). Biology and population dynamics of the Norwegian spring-spawning herring. Rapp. Réun. Cons. Int. Explor. Mer. 177, 43–71.
Dragesund, O., Johannessen, A., and Ulltang, Ø (1997). Varlation in migration and abundance of norwegian spring spawning herring (Clupea harengus l.). Sarsia 82, 97–105. doi: 10.1080/00364827.1997.10413643
Fernö, A., Pitcher, T. J., Melle, W., Nøttestad, L., Mackinson, S., Hollingworth, C., et al. (1998). The challenge of the herring in the Norwegian sea: making optimal collective spatial decisions. Sarsia 83, 149–167. doi: 10.1080/00364827.1998.10413679
Foote, K. G. (1987). Fish target strengths for use in echo integrator surveys. J. Acoust. Soc. Am. 82, 981–987.
Gislason, A., and Astthorsson, O. S. (2002). The food of Norwegian spring-spawning herring in the western Norwegian Sea in relation to the annual cycle of zooplankton. Sarsia 87, 236–247. doi: 10.1080/00364820260294860
Gislason, A., and Silva, T. (2012). Abundance, composition, and development of zooplankton in the Subarctic Iceland Sea in 2006, 2007, and 2008. ICES J. Mar. Sci. 69, 1263–1276. doi: 10.1093/icesjms/fss070
González-Pola, C., Larsen, K. M. H., Fratantoni, P., and Beszczynska-Möller, A. (eds) (2020). ICES Report on Ocean Climate 2019. Copenhagen: International Council for the Exploration of the Sea.
Gudmundsdottir, A., Óskarsson, G., Krysov, A., Salthaug, A., Paulsrud Mjørlund, R., Høines, Å., et al. (2014). Report of the Coastal States Working Group on the Distribution of Norwegian Spring Spawning Herring in the North-East Atlantic and the Barents Sea. Coastal States WG Herring 2014. Available online at: https://lms.cdn.fo/media/5731/coastal_states_nssh_final_report.pdf?s=Qeeyyg_1gNyRlcPW3dCOMC-VNAw
Hátún, H., Lohmann, K., Matei, D., Jungclaus, J. H., Pacariz, S. V., Bersch, M., et al. (2016). An inflated subpolar gyre blows life towards the northeastern Atlantic. Prog. Oceanogr. 147, 49–66. doi: 10.1016/j.pocean.2016.07.009
Hátún, H., Olsen, B., and Pacariz, S. V. (2017). The Dynamics of the North Atlantic Subpolar Gyre Introduces Predictability to the Breeding Success of Kittiwakes. Front. Mar. Sci. 4:123. doi: 10.3389/fmars.2017.00123
Hátún, H., Payne, M. R., Beaugrand, G., Reid, P. C., Sandø, A. B., Drange, H., et al. (2009). Large bio-geographical shifts in the north-eastern Atlantic Ocean: from the subpolar gyre, via plankton, to blue whiting and pilot whales. Prog. Oceanogr. 80, 149–162. doi: 10.1016/j.pocean.2009.03.001
Hátún, H., Sandø, A. B., Drange, H., Hansen, B., and Valdimarsson, H. (2005). Influence of the Atlantic subpolar gyre on the thermohaline circulation. Science 309, 1841–1844. doi: 10.1126/science.1114777
Holliday, N. P., Bersch, M., Berx, B., Chafik, L., Cunningham, S., Florindo-López, C., et al. (2020). Ocean circulation causes the largest freshening event for 120 years in eastern subpolar North Atlantic. Nat. Commun. 11:585. doi: 10.1038/s41467-020-14474-y
Homrum, E., Óskarsson, G. J., Ono, K., Hølleland, S., and Slotte, A. (2021). Large-scale changes in the spatiotemporal distribution of Norwegian spring spawning herring (Clupea harengus) following warming and freshening of the Norwegian Sea: effects on body growth, somatic condition and gonad development. Front. Mar. Sci.
Holst, J. C., Røttingen, I., and Melle, W. (2004). “The Herring,” in The Norwegian Sea Ecosystem, ed. H. R. Skjoldal (Trondheim: Tapir Academic Press), 203–226.
Holst, J. C., and Slotte, A. (1998). Effects of juvenile nursery on geographic spawning distribution in Norwegian spring-spawning herring (Clupea harengus L.). ICES J. Mar. Sci. 55, 987–996. doi: 10.1006/jmsc.1998.0371
Huse, G., Fernö, A., and Holst, J. C. (2010). Establishment of new wintering areas in herring co-occurs with peaks in the “first time/repeat spawner” ratio. Mar. Ecol. Prog. Ser. 409, 189–198. doi: 10.3354/meps08620
Huse, G., Railsback, S., and Fernö, A. (2002). Modelling changes in migration pattern of herring: collective behaviour and numerical domination. J. Fish Biol. 60, 571–582. doi: 10.1006/jfbi.2002.1874
Huse, G., Utne, K. R., and Fernö, A. (2012). Vertical distribution of herring and blue whiting in the Norwegian Sea. Mar. Biol. Res. 8, 488–501. doi: 10.1080/17451000.2011.639779
ICES (2014). 2nd Interim Report of the Working Group on Integrated Assessments of the Norwegian Sea (WGINOR). Torshavn: ICES.
ICES (2020). Working Group on the Integrated Assessments of the Norwegian Sea (WGINOR; Outputs From the 2019 Meeting), ICES Scientific Reports. 2:29. Copenhagen: ICES. doi: 10.17895/ices.pub.5996
ICES (2021b). Working Group on Widely Distributed Stocks (WGWIDE), Ices Scientific Reports. 3:95. Copenhagen: ICES. doi: 10.17895/ices.pub.8298
ICES (2021a). ICES Fisheries Management Reference Points for Category 1 and 2 Stocks; Technical Guidelines. In Report of the ICES Advisory Committee, 2021. Copenhagen: ICES. doi: 10.17895/ices.advice.7891
Jónsson, S. (2007). Volume flux and fresh water transport associated with the East Icelandic Current. Prog. Oceanogr. 73, 231–241. doi: 10.1016/j.pocean.2006.11.003
Kristiansen, I., Gaard, E., Hátún, H., Jónasdóttir, S. H., and Ferreira, A. S. A. (2016). Persistent shift of Calanus spp. in the southwestern Norwegian Sea since 2003, linked to ocean climate. ICES J. Mar. Sci. 73:fsv222. doi: 10.1093/icesjms/fsv222
Kristiansen, I., Hátún, H., Jacobsen, J. A., Eliasen, S. K., Petursdottir, H., and Gaard, E. (2021). Spatial variability of the feeding conditions for the Norwegian spring spawning herring in May. Front. Mar. Sci.
Kristiansen, I., Hátún, H., Petursdóttir, H., Gislason, A., Broms, C., Melle, W., et al. (2019). Decreased influx of Calanus spp. into the south-western Norwegian Sea since 2003. Deep. Res. Part I Oceanogr. Res. Pap. 149:103048. doi: 10.1016/j.dsr.2019.05.008
Kvamme, C., Nøttestad, L., Fernö, A., Misund, O. A., Dommasnes, A., Axelsen, B. E., et al. (2003). Migration patterns in Norwegian spring-spawning herring: why young fish swim away from the wintering area in late summer. Mar. Ecol. Prog. Ser. 247, 197–210. doi: 10.3354/meps247197
Langård, L., Skaret, G., Jensen, K. H., Johannessen, A., Slotte, A., Nøttestad, L., et al. (2015). Tracking individual herring within a semi-enclosed coastal marine ecosystem: 3-dimensional dynamics from pre- to post-spawning. Mar. Ecol. Prog. Ser. 518, 267–279. doi: 10.3354/meps11065
Langøy, H., Nøttestad, L., Skaret, G., Broms, C., and Fernö, A. (2012). Overlap in distribution and diets of Atlantic mackerel (Scomber scombrus), Norwegian spring-spawning herring (Clupea harengus) and blue whiting (Micromesistius poutassou) in the Norwegian Sea during late summer. Mar. Biol. Res. 8, 442–460. doi: 10.1080/17451000.2011.642803
Malmberg, S.-A., and Valdimarsson, H. (2003). Hydrographic conditions in Icelandic waters, 1990-1999. ICES Mar. Sci. Symp. 219, 50–60.
Marti, Y. Y. (1956). “The fundamental stages of the life cycle of Atlantic-Scandinavian herring,” in Herring of the North European Basin and Adjacent Seas, ed L. W. Scattergood (Washington: United States Fish and Wildlife Service), 5–68.
McQuinn, I. H. (1997). Metapopulations and the Atlantic herring. Rev. Fish Biol. Fish 7, 297–329. doi: 10.1023/A
Melle, W., Klevjer, T., Strand, E., Wiebe, P. H., Slotte, A., and Huse, G. (2020). Fine-scale observations of physical and biological environment along a herring feeding migration route. Deep. Res. Part II Top. Stud. Oceanogr. 180:104845. doi: 10.1016/j.dsr2.2020.104845
Misund, O. A., Melle, W., and Fernö, A. (1997). Migration behaviour of norwegian spring spawning herring when entering the cold front in the norwegian sea. Sarsia 82, 107–112. doi: 10.1080/00364827.1997.10413644
Misund, O. A., Vilhjálmsson, H., Jákupsstovu, S. H. í, Røttingen, I., Belikov, S., Astthorsson, O. S., et al. (1998). Distribution, migration and abundance of norwegian spring spawning herring in relation to the temperature and zooplankton biomass in the Norwegian Sea as recorded by coordinated surveys in spring and summer 1996. Sarsia 83, 117–127. doi: 10.1080/00364827.1998.10413677
Nøttestad, L., Giske, J., Holst, J. C., and Huse, G. (1999). A length-based hypothesis for feeding migrations in pelagic fish. Can. J. Fish. Aquat. Sci. 56, 26–34. doi: 10.1139/f99-222
Olsen, E. M., Melle, W., Kaartvedt, S., Holst, J. C., and Mork, K. A. (2007). Spatially structured interactions between a migratory pelagic predator, the Norwegian spring-spawning herring Clupea harengus L., and its zooplankton prey. J. Fish Biol. 70, 799–815. doi: 10.1111/j.1095-8649.2007.01342.x
Pavshtiks, E. A. (1956). Seasonal Changes in Plankton and Feeding Migrations of Herring. Herring North Eur. Basin Adjac. Seas 1, 104–139.
Prokopchuk, I. (2009). Feeding of the Norwegian spring spawning herring Clupea harengus (Linne) at the different stages of its life cycle. Deep. Res. Part II Top. Stud. Oceanogr. 56, 2044–2053. doi: 10.1016/j.dsr2.2008.11.015
Prokopchuk, I., and Sentyabov, E. (2006). Diets of herring, mackerel, and blue whiting in the Norwegian Sea in relation to Calanus finmarchicus distribution and temperature conditions. ICES J. Mar. Sci. 63, 117–127. doi: 10.1016/j.icesjms.2005.08.005
Read, J. F., and Pollard, R. T. (1992). Water Masses in the Region of the Iceland-Fćroes Front. J. Phys. Oceanogr. 22:1365–1378. doi: 10.1175/1520-04851992022<1365
Rudakova, V. A. (1956). “Data on the food of the Atlantic herring,” in Herring of the North European Basin and Adjacent Seas, ed L. W. Scattergood (Washington: United States Fish and Wildlife Service), 140–155.
Salthaug, A., Stenevik, E. K., Vatnehol, S., Anthonypillai, V., Ona, E., and Slotte, A. (2020). Survey Report: Distribution and Abundance of Norwegian Spring Spawning Herring During The Spawning Season in 2020. Bergen: Institute of Marine Research.
Slotte, A. (1999). Effects of fish length and condition on spawning migration in Norwegian spring spawning herring (Clupea harengus L.). Sarsia 84, 111–127. doi: 10.1080/00364827.1999.10420439
Slotte, A., Johannessen, A., and Kjesbu, O. S. (2000). Effects of fish size on spawning time in Norwegian spring-spawning herring. J. Fish Biol. 56, 295–310. doi: 10.1006/jfbi.1999.1161
Slotte, A., Salthaug, A., Højnes, Å, Stenevik, E. K. K., Vatnehol, S., Ona, E., et al. (2018). Survey Report: Distribution and Abundance of Norwegian Spring Spawning Herring During the Spawning Season in 2018. Bergen: Institute of Marine Research.
Toresen, R., and Østvedt, O. J. (2000). Variation in abundance of Norwegian spring-spawning herring (Clupea harengus, Clupeidae) throughout the 20th century and the influence of climatic fluctuations. Fish Fish. 1, 231–256. doi: 10.1111/j.1467-2979.2000.00022.x
Utne, K. R., and Huse, G. (2012). Estimating the horizontal and temporal overlap of pelagic fish distribution in the Norwegian Sea using individual-based modelling. Mar. Biol. Res. 8, 548–567. doi: 10.1080/17451000.2011.639781
Utne, K. R., Huse, G., Ottersen, G., Holst, J. C., Zabavnikov, V., Jacobsen, J. A., et al. (2012). Horizontal distribution and overlap of planktivorous fish stocks in the Norwegian Sea during summers 1995 -2006. Mar. Biol. Res. 8, 420–441. doi: 10.1080/17451000.2011.640937
Varpe, Ø, Fiksen, Ø, and Slotte, A. (2005). Meta-ecosystems and biological energy transport from ocean to coast: the ecological importance of herring migration. Oecologia 146, 443–451. doi: 10.1007/s00442-005-0219-9
Keywords: Norwegian spring spawning herring, abundance, year class abundance, spatial distribution, climatic shifts, density dependent spatial dynamics
Citation: Eliasen SK, Homrum EI, Jacobsen JA, Kristiansen I, Óskarsson GJ, Salthaug A and Stenevik EK (2021) Spatial Distribution of Different Age Groups of Herring in Norwegian Sea, May 1996–2020. Front. Mar. Sci. 8:778725. doi: 10.3389/fmars.2021.778725
Received: 17 September 2021; Accepted: 29 November 2021;
Published: 23 December 2021.
Edited by:
Peter Grønkjær, Aarhus University, DenmarkReviewed by:
Tommaso Russo, University of Rome Tor Vergata, ItalySusanne Eva Tanner, University of Lisbon, Portugal
Torstein Pedersen, UiT The Arctic University of Norway, Norway
Copyright © 2021 Eliasen, Homrum, Jacobsen, Kristiansen, Óskarsson, Salthaug and Stenevik. This is an open-access article distributed under the terms of the Creative Commons Attribution License (CC BY). The use, distribution or reproduction in other forums is permitted, provided the original author(s) and the copyright owner(s) are credited and that the original publication in this journal is cited, in accordance with accepted academic practice. No use, distribution or reproduction is permitted which does not comply with these terms.
*Correspondence: Sólvá Káradóttir Eliasen, c29sdmFlQGhhdi5mbw==