 Vladimir Maderich
 Kyeong Ok Kim
 Roman Bezhenar
 Kyung Tae Jung3
 Vazira Martazinova
- 1Institute of Mathematical Machine and System Problems, Kyiv, Ukraine
- 2Korea Institute of Ocean Science and Technology, Busan, Republic of Korea
- 3Oceanic Consulting and Trading, Seoul, Republic of Korea
- 4Ukrainian Hydrometeorological Institute, Kyiv, Ukraine
The North Atlantic and Arctic oceans, along with the North Pacific, are the main reservoirs of anthropogenic radionuclides introduced in the past 75 years. The POSEIDON-R compartment model was applied to the North Atlantic and Arctic oceans to reconstruct 137Cs contamination in 1945–2020 due to multiple sources: global fallout, exchange flows with other oceans, point-source inputs in the ocean from reprocessing plants and other nuclear facilities, the impact of the Chernobyl accident and secondary contamination resulting from river runoff and redissolution from bottom sediments. The model simulated the marine environment as a system of 3D compartments comprising the water column, bottom sediment, and biota. The dynamic model described the transfer of 137Cs through the pelagic and benthic food chains. The simulation results were validated using the marine database MARIS. The calculated concentrations of 137Cs in the seaweed and non-piscivorous and piscivorous pelagic fish mostly followed the concentration of 137Cs in water. The concentration in coastal predator fish lagged behind the concentration in water as a result of a diet that includes both pelagic and benthic organisms. The impact of each considered source on the total concentration of 137Cs in non-piscivorous fish in the regions of interest was analyzed. Whereas the contribution from global fallout dominated in 1960–1970, in 1970–1990, the contribution of 137Cs released from reprocessing plants exceeded the contributions from other sources in almost all considered regions. Secondary contamination due to river runoff was less than 4% of ocean influx. The maximum total inventory of 137Cs in the Arctic Ocean (31,122 TBq) was reached in 1988, whereas the corresponding inventory in the bottom sediment was approximately 6% of the total. The general agreement between simulated and observed 137Cs concentrations in water and bottom sediment was confirmed by the estimates of geometric mean and geometric standard deviation, which varied from 0.89 to 1.29 and from 1.22 to 1.87, respectively. The approach used is useful to synthesize measurement and simulation data in areas with observational gaps. For this purpose, 13 representative regions in the North Atlantic and Arctic oceans were selected for monitoring by using the “etalon” method for classification.
Introduction
The North Atlantic and Arctic oceans along with the North Pacific are the main reservoirs of anthropogenic radionuclides introduced in the past 75 years from different sources (Nyffeler et al., 1996; Kershaw, 2011; Zaborska and Carroll, 2011). Both oceans are connected through the Nordic seas (Greenland, Iceland, and Norwegian seas). Therefore, they should be considered as one system. Global fallout from atmospheric nuclear weapon tests dominated in the sixties, and the main contributors were 137Cs and 90Sr. Regional contamination of the sea also occurred as a result of nuclear weapon tests in the atmosphere over Novaya Zemlya and as a result of underwater explosions in Chernaya Bay on the southern island of the Novaya Zemlya Archipelago. Point-source inputs in the ocean from reprocessing plants Sellafield (United Kingdom) and Cap de La Hague (France) were also significant. Several nuclear facilities located in the basins of Siberian rivers contaminated the Arctic Ocean. Two global-scale accidents [Chernobyl and Fukushima Daiichi nuclear power plants (NPPs)] and several local accidents (e.g., Thule accident) resulted in contamination of areas in both the North Atlantic and Arctic oceans. Potential point sources of radioactivity include dumped liquid and solid nuclear wastes and sunken submarines. The released radionuclides were inhomogeneously distributed in the ocean where they were transported by currents and migrated in the bottom sediments and through the food web. Marine and river bottom sediments and river flood plains were secondary sources of contamination.
The 137Cs distributions in the North Atlantic and Arctic oceans have been monitored since the sixties and have reported in several surveys (IAEA, 1995, 2005; AMAP, 1998, 2004, 2010, 2016; OSPAR, 2021). Data were collected in the frame of the ongoing LAMER (2017–2021) project and the IAEA MARIS database (MARIS, 2021). However, the monitoring data are distributed very heterogeneously in time and space. Therefore, modeling is necessary to reconstruct the distribution of radioactivity and to estimate doses for population and biota in areas with sparse measurements. Several studies have been devoted to the modeling of the intake and redistribution of cesium during the entire nuclear era in water, sediments, and biota in the marginal seas of the Atlantic Ocean, such as the Mediterranean Sea, North Sea, and Baltic Sea (e.g., CEC, 1990; EC, 2002; Maderich et al., 2018a,b; Bezhenar et al., 2019), as well as in the Arctic Ocean (Iosjpe et al., 2002; Johannessen et al., 2010). However, these studies did not consider in detail the North Atlantic and Arctic oceans as a system or the contribution from different sources to local concentrations of 137Cs.
In this study, our objective was to assess long-term changes in 137Cs distribution in the marine environment of the North Atlantic-Arctic Ocean system in the 1945–2020 period. The POSEIDON-R compartment model (Lepicard et al., 2004; Maderich et al., 2018b) was applied to estimate the time-varying contribution from different sources to the distribution of 137Cs in water, sediments, and biota and to select representative areas for monitoring purposes. This paper is organized as follows. The compartment model and the dynamic food web model are briefly described in Section “MATERIALS AND METHODS,” as well as the model setup to the area of interest. The modeling results for the water, sediments, and biota are presented in Section “RESULTS.” Our findings are summarized in the Conclusions.
Materials and Methods
Compartment Model POSEIDON-R
The compartment model was chosen in this study because it is well suited for long-term and large-scale assessments of radionuclide dispersion and transfer in biota (Periáñez et al., 2019). The marine environment is considered a system of 3D compartments (boxes) in the POSEIDON-R compartment model (Lepicard et al., 2004; Bezhenar et al., 2016; Maderich et al., 2018b). The compartment system includes the water column, bottom sediment, and biota compartments (Supplementary Figure 1). The water column compartment is vertically subdivided into layers and contains suspended matter that continuously settles down. Radionuclides in the water column are assumed to be partitioned into dissolved and particulate fractions by the distribution coefficient Kd. The radionuclide concentration in each water compartment is found as a solution of a set of differential equations, in which temporal variations in the concentration depend on the exchange of radionuclides between adjacent compartments, the exchange between radionuclides in solute, suspended sediments, and bottom sediments, and the radioactivity sources and decay. Exchanges between the water column compartments include radionuclide fluxes due to advection, sediment settling, and turbulent diffusion. The bottom sediment in each compartment consists of three layers. The transfer of radioactivity between the upper sediment layer and the water column is governed by resuspension, diffusion, and bioturbation processes. Only diffusion is active between the upper and middle sediment layers. Downward burial processes occur in all three sediment layers. Maderich et al. (2018b) described the POSEIDON-R compartment model in detail. The POSEIDON-R model can handle different types of radioactive releases, such as atmospheric fallout, river runoff of land-deposited radionuclides, point sources associated with both routine direct releases and accidental releases from nuclear facilities located on the coast or inland in rivers (Lepicard et al., 2004).
The uptake of radionuclides by marine organisms is dynamically modeled in the POSEIDON-R compartment model. All organisms take in radionuclides both via the food web and directly from the water. Pelagic and benthic food chains are described in the model (Bezhenar et al., 2016). All marine organisms are grouped into classes according to trophic level and type of species (Supplementary Figure 1B). In turn, radionuclides are grouped into four classes according to the type of fish tissue where they preferentially accumulate (e.g., 137Cs tends to accumulate in muscle). These simplifications allow for a limited number of standard input parameters. The pelagic food chain includes primary producers (phytoplankton) and consumers [zooplankton, non-piscivorous (forage) fish, and piscivorous fish]. In the benthic food chain, radionuclides are transferred from algae and organic components of contaminated bottom sediments to deposit-feeding invertebrates, demersal fish, and benthic predators. It is assumed that radioactivity is assimilated by benthic organisms only from the organic component of the bottom deposits, which is in mutual equilibrium with an inorganic component. Crustaceans (detritus feeders), mollusks (filter feeders), and coastal predators, which feed throughout the water column in shallow coastal waters, are also considered in the model. Details of the transfer of radiocesium through the marine food web are presented by Bezhenar et al. (2016) and Maderich et al. (2018b).
Model Setup
A box system for the North Atlantic and Arctic Ocean (Figures 1, 2) was built by using bathymetry data from the Copernicus Marine Environment Monitoring Service (CMEMS, 2021). The water column in each box was divided vertically into up to five layers: 0–50 (surface layer), 50–250, 250–1,000, 1,000–2,500 m, and from 2,500 m to the bottom; the number of layers in each box depends on the total water depth in that box. These boxes include three layers of bottom sediment. The total number of boxes covering the North Atlantic-Arctic Ocean is 159, of which 16 boxes correspond to the main rivers in the region (Supplementary Table 1). Each box in Figures 1, 2 has a surface layer in the water column. Blue dots denote the number of layers under the surface layer. Advective and diffusional water transport between boxes was calculated by averaging three-dimensional currents in the available CMEMS (2021) reanalysis data over 10 years (2008–2017).
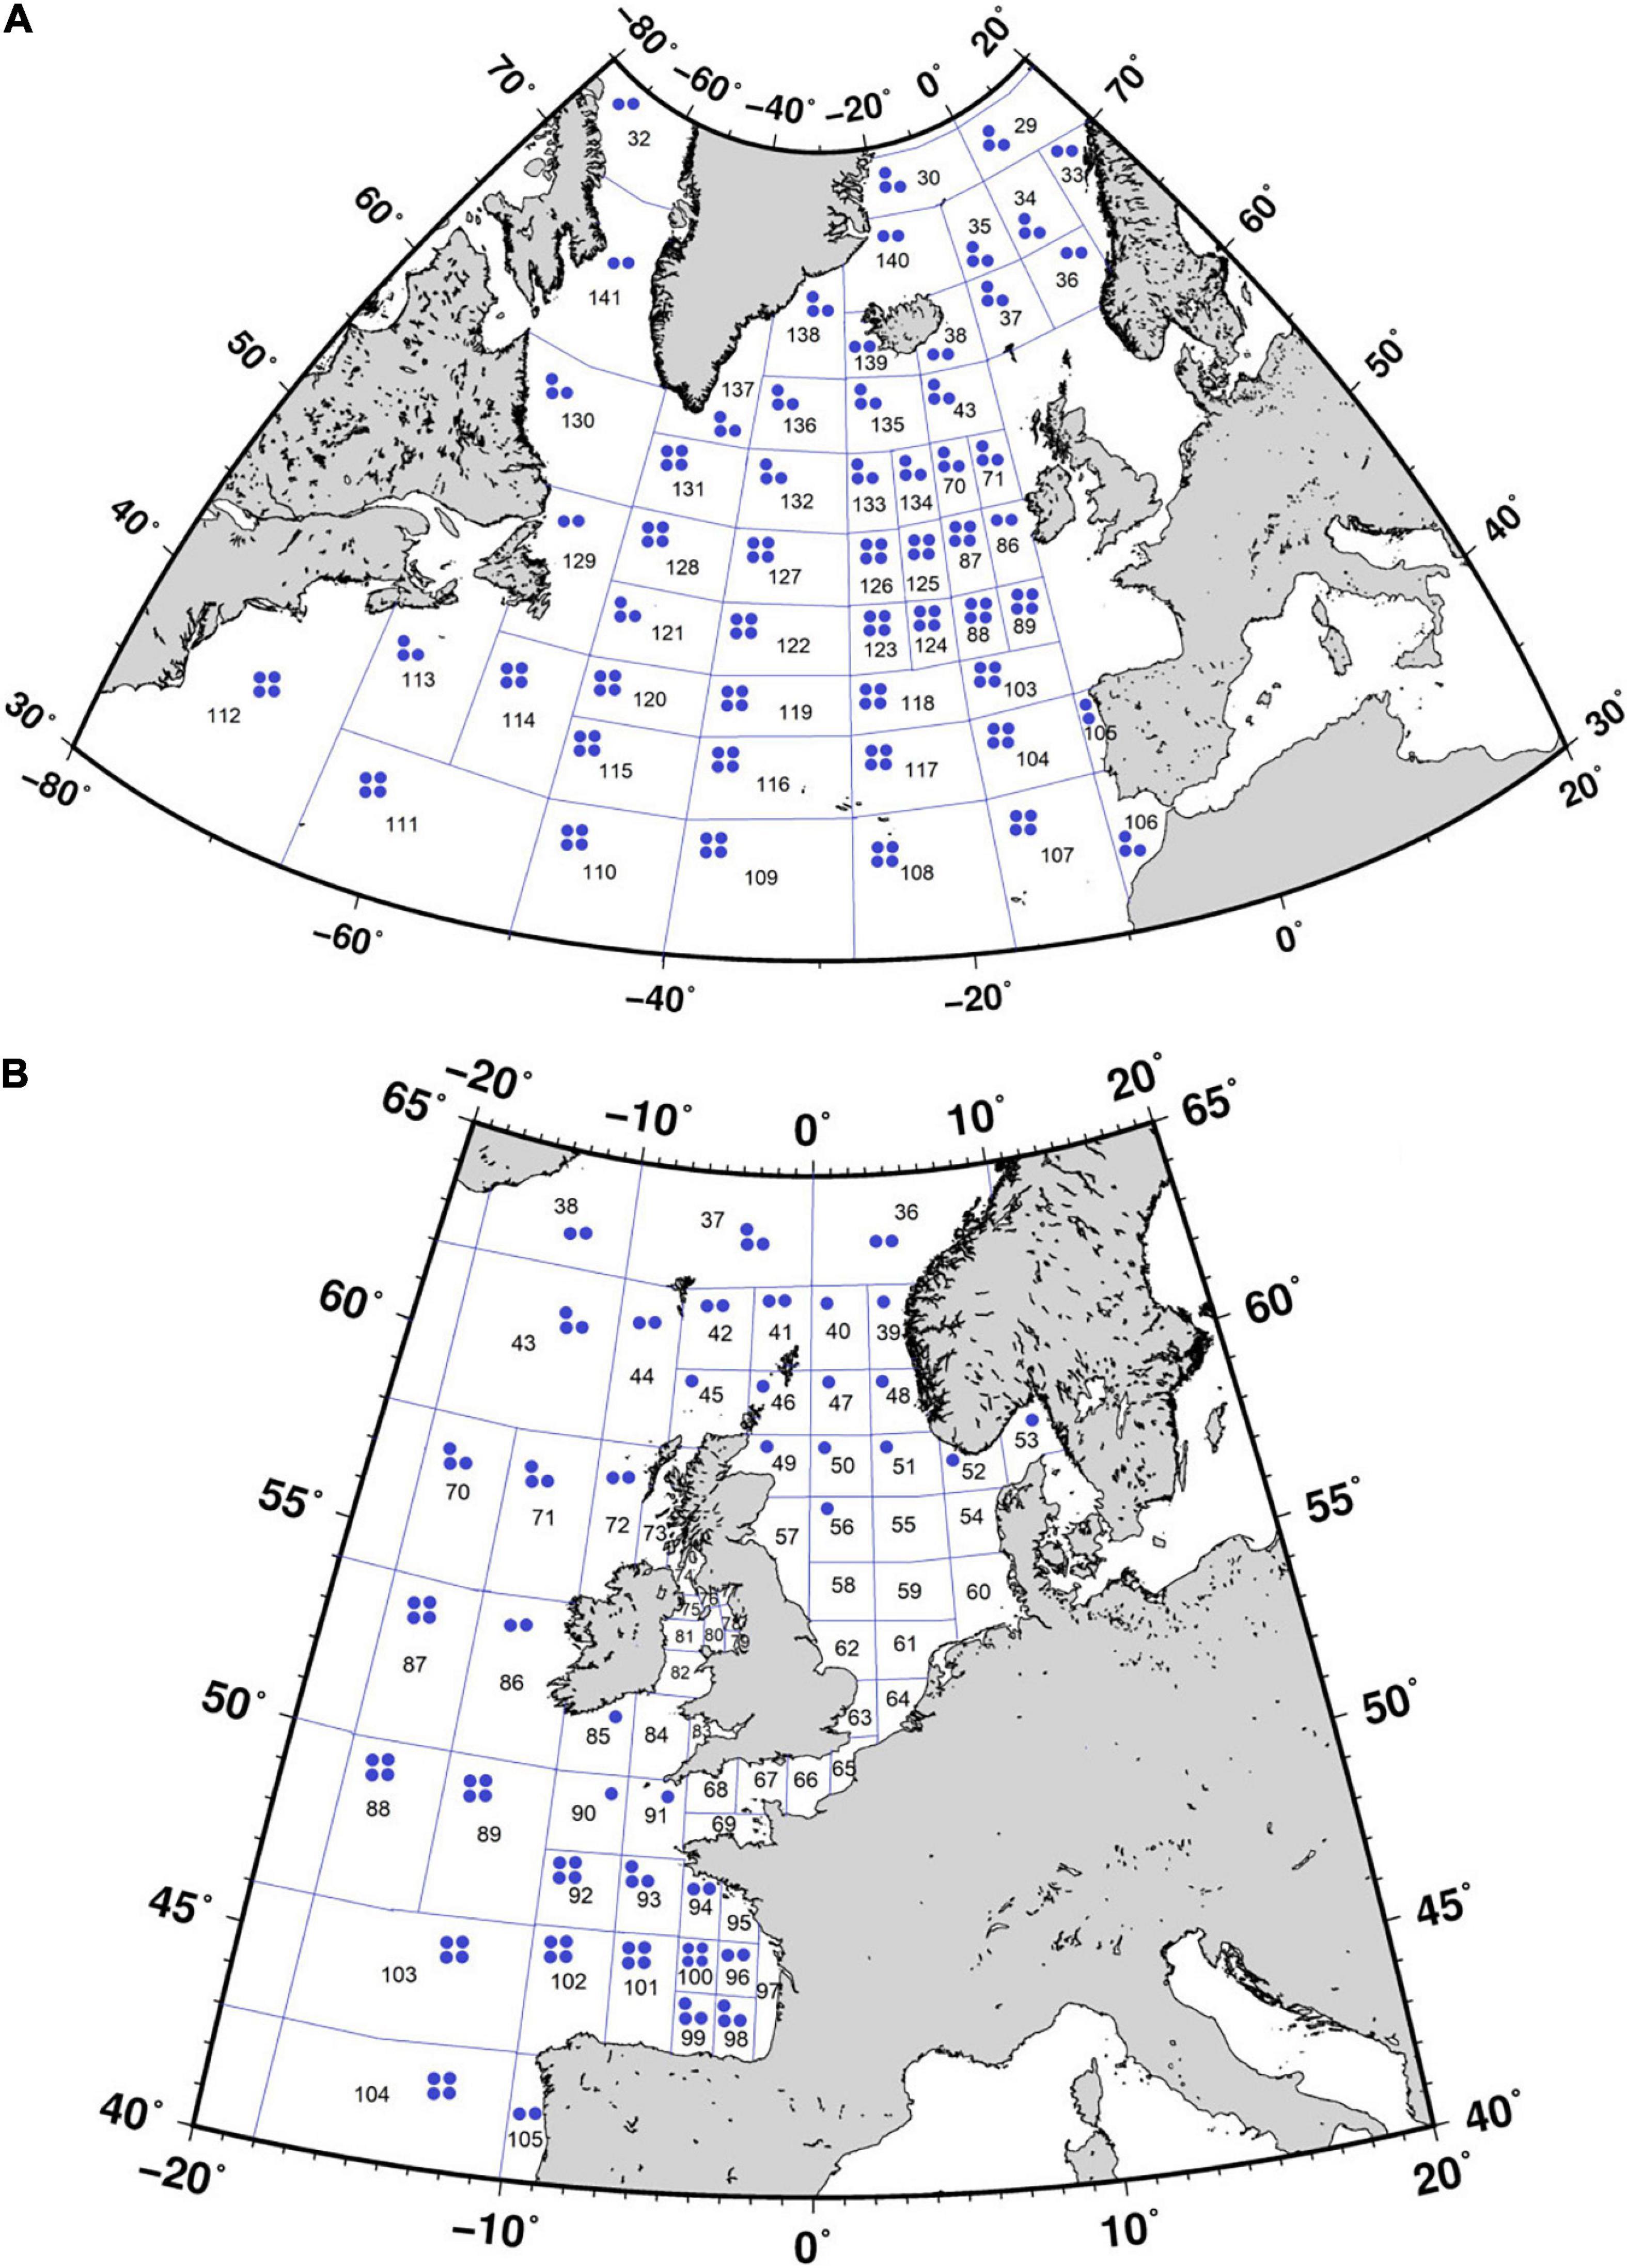
Figure 1. Box system for the North Atlantic (A) and the North Sea, Irish Sea, and Biscay Bay (B). Box numbers are shown. Each box includes a surface layer in the water column. Blue dots denote the number of layers under the surface layer.
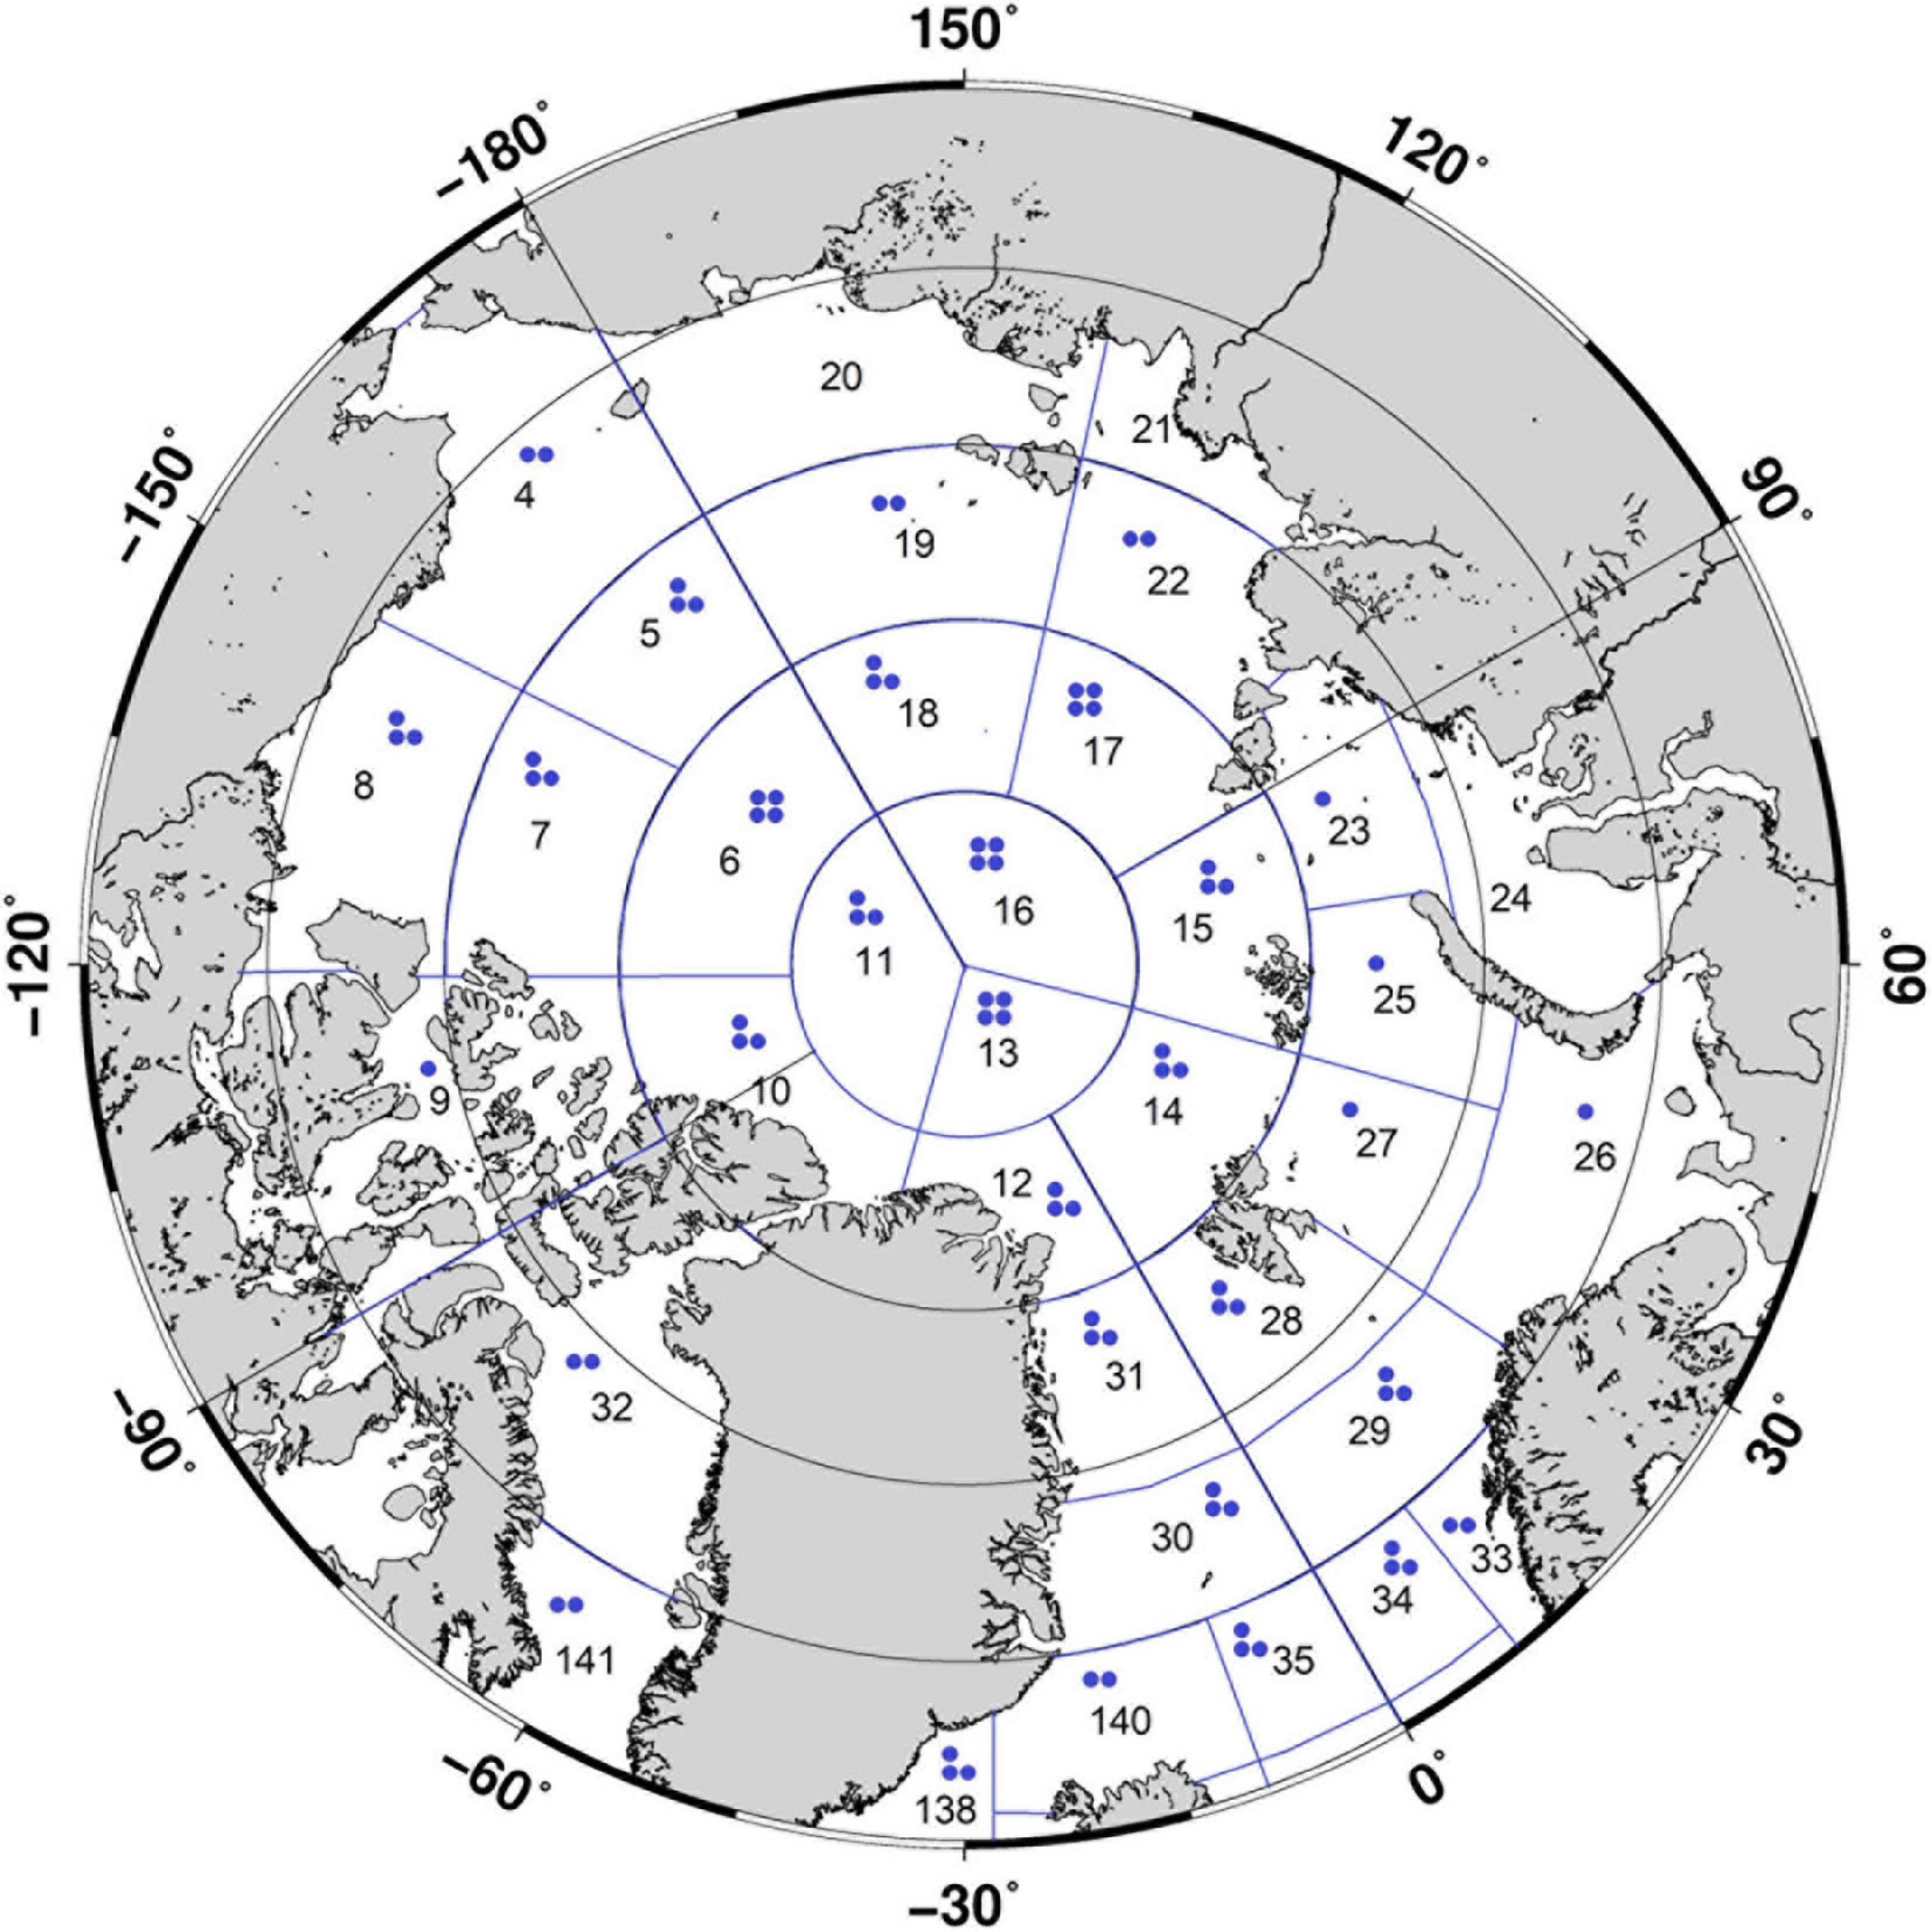
Figure 2. Box system for the Arctic Ocean. Box numbers are shown. Each box includes a surface layer in the water column. Blue dots denote the number of layers under the surface layer.
The time-average surface currents calculated from reanalysis in the North Atlantic and Arctic oceans are shown in Figure 3. The main currents include the Gulfstream, North Atlantic Current, Atlantic/Norwegian Current, Beaufort Gyre, Transpolar Drift, and East Greenland Current. They transport contamination from sources. Subsurface currents complete the circulation. The compartment structure was chosen to describe fluxes by these main currents in the North Atlantic-Arctic Ocean system and to take into account all important coastal sources of radioactivity entering the ocean from coastal facilities and rivers. The model includes exchange flows of a radionuclide with the Mediterranean Sea obtained from the regional compartment model of the Mediterranean Sea (Bezhenar et al., 2019) and contamination fluxes through Danish straits from the regional compartment model of the Baltic Sea (Maderich et al., 2018a). Fluxes through the Bering Strait and the southern boundary of the North Atlantic were based on corresponding observed concentrations of the radionuclide. In Figure 2B, the box system for the North and Irish seas is shown. This box system is based on the North Sea model (Maderich et al., 2018b), and it describes in detail areas around reprocessing plants (Sellafield and Cap de la Hague).
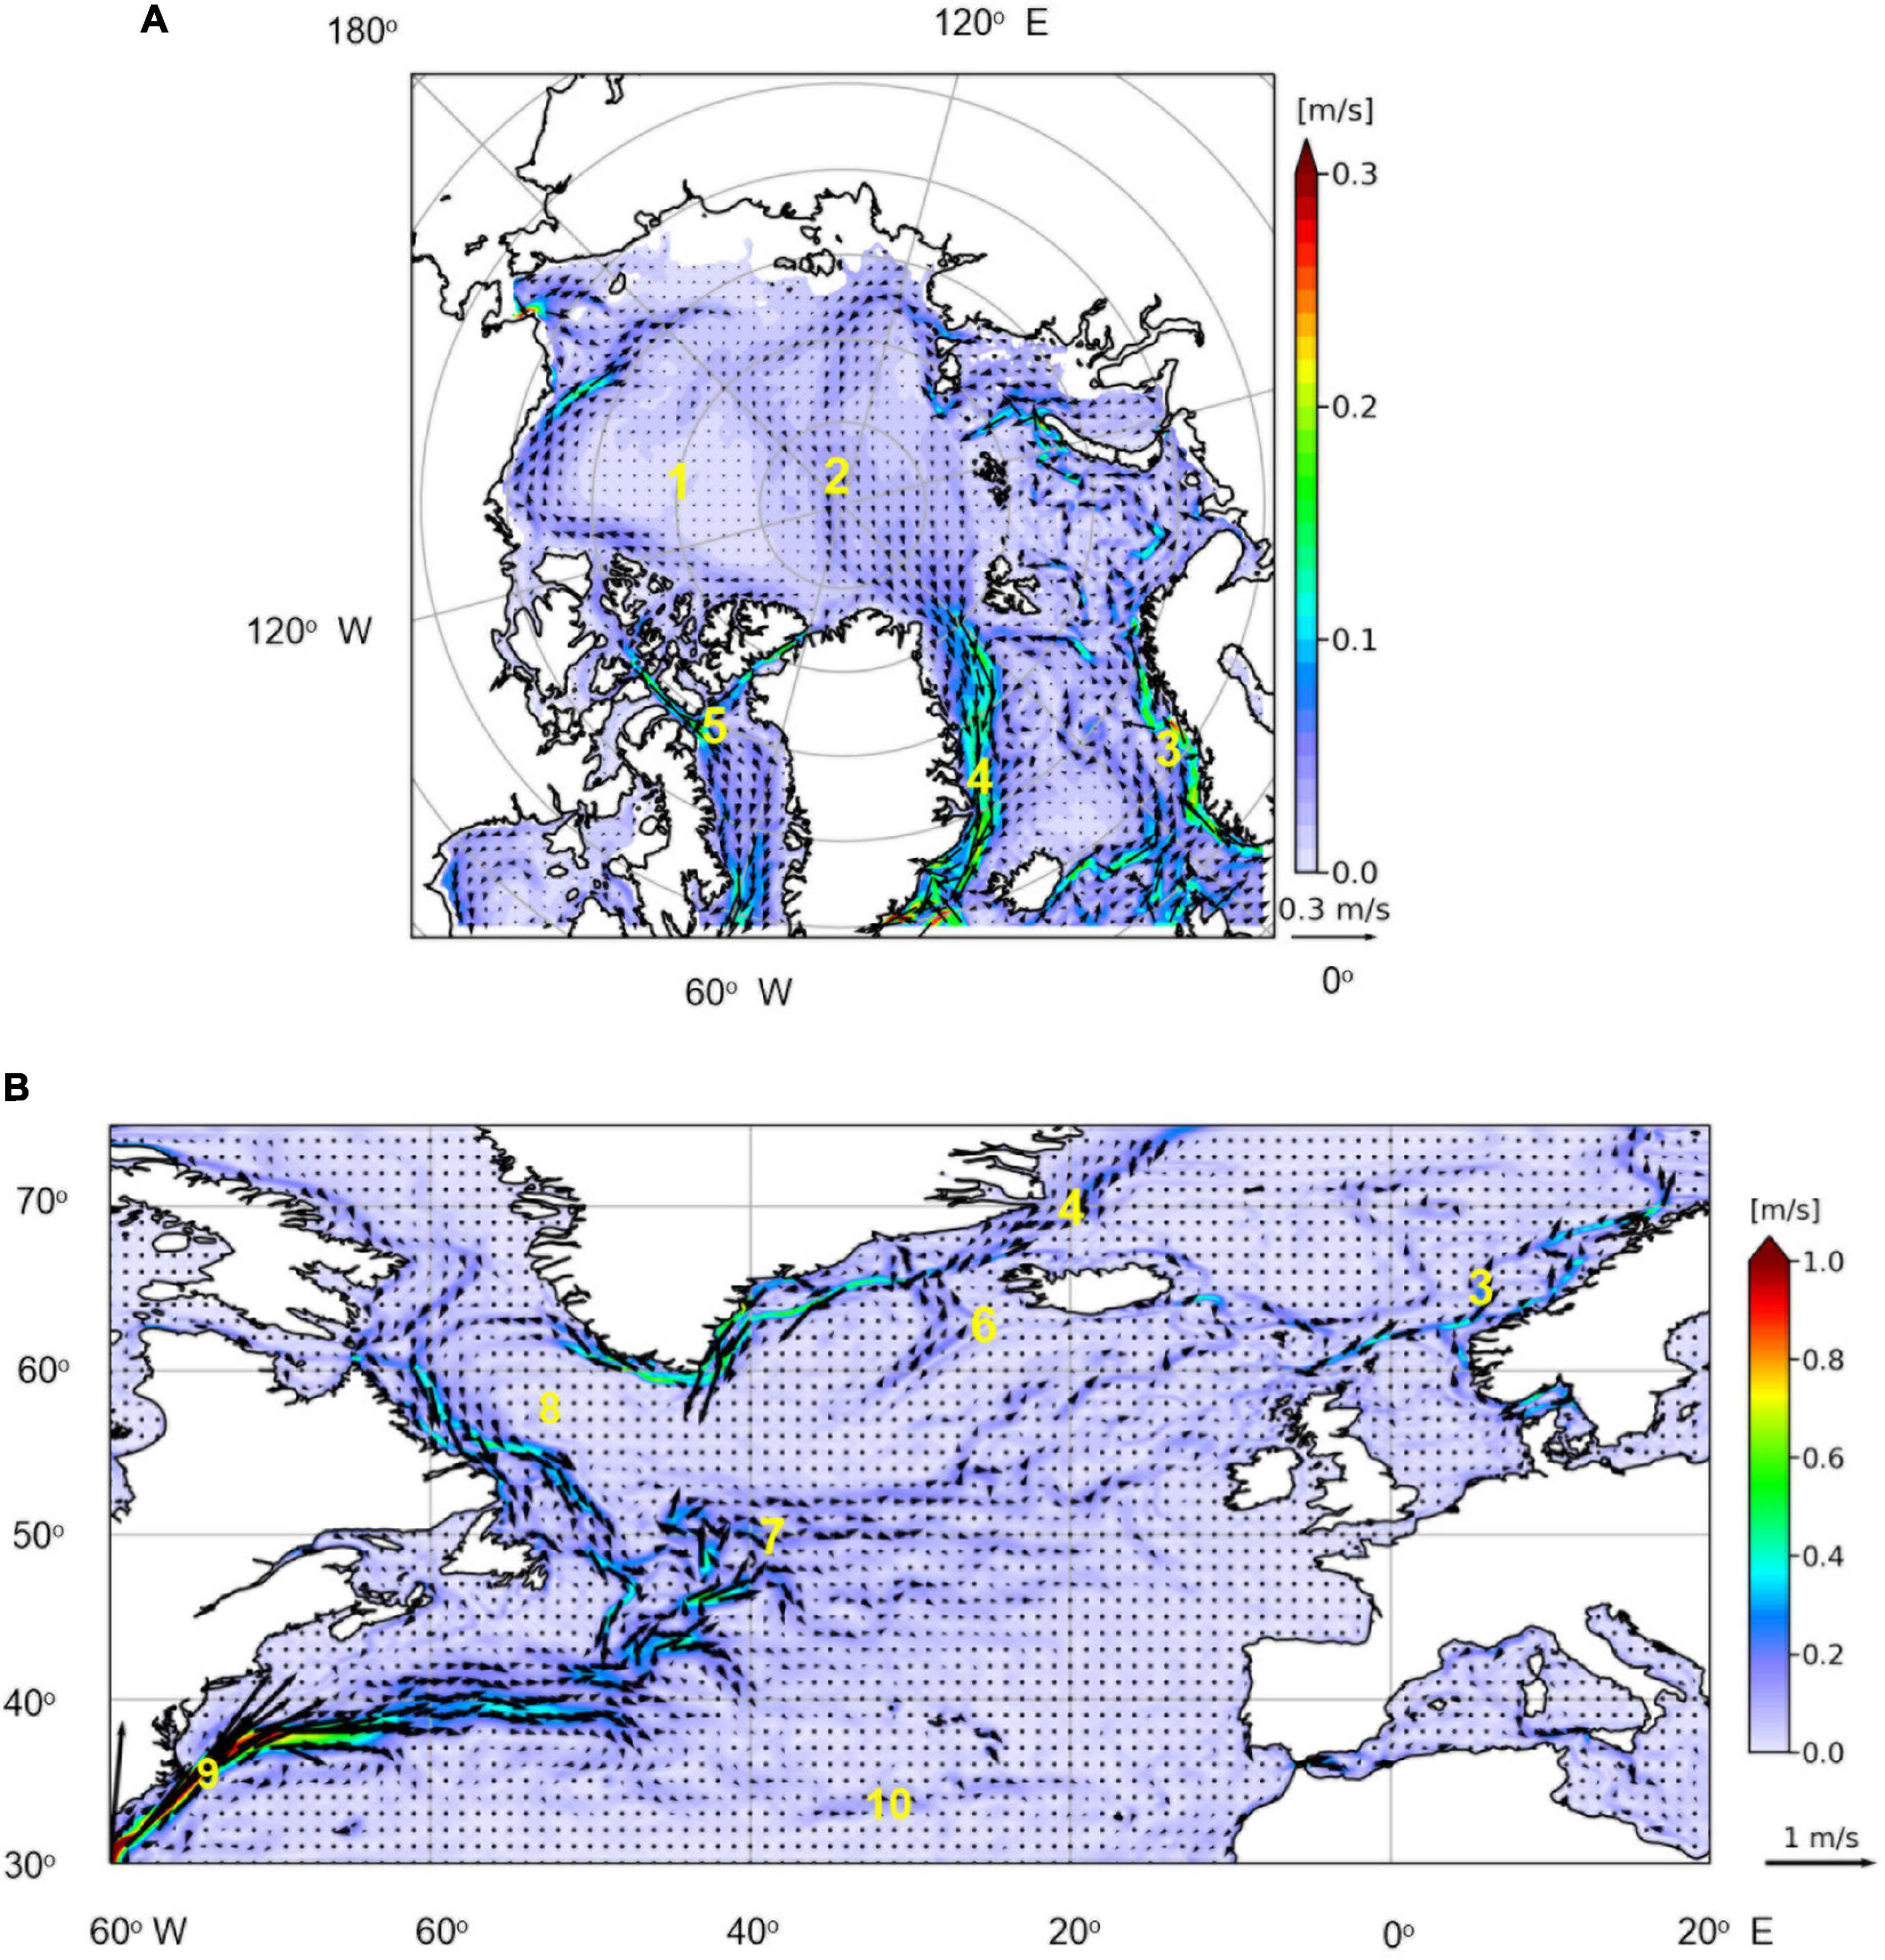
Figure 3. Time-average surface currents calculated from CMEMS (2021) ocean reanalysis data in the Arctic (A) and North Atlantic (B) oceans. Main currents: 1—Beaufort Gyre, 2—Transpolar Drift, 3—Atlantic/Norwegian Current, 4—East Greenland Current, 5—Irminger Current, 6—North Atlantic Current, 7—Subpolar gyre, 8—Subtropical gyre, and 9—Gulfstream.
Global Deposition of 137Cs Due to Nuclear Weapon Tests
Atmospheric nuclear tests in the 1950s–1960s contaminated oceans and land globally. In this study, the annual deposition of 137Cs in each box due to global fallout was calculated using data (UNSCEAR, 2000) on deposition density, which depends on latitude (Figure 4), and box surface area. These data are available for the 1950–1987 period. For the 1988–2020 period, we made the conservative assumption that the deposition flux was equal to the average value in 1982–1987 corrected for radioactive decay. Note that the values obtained in this extrapolation are very low in comparison with historical values in previous decades; therefore, they did not affect the concentration of radionuclides in the marine environment. In the Arctic, regional fallout occurred as a result of atmospheric tests on Novaya Zemlya (Miroshnikov et al., 2017). However, there are no data on the deposition distribution. Note that the effect of underwater nuclear weapon tests conducted in the 1950s in Chernaya Bay was local (Smith et al., 2000), and this source was also not taken into account.
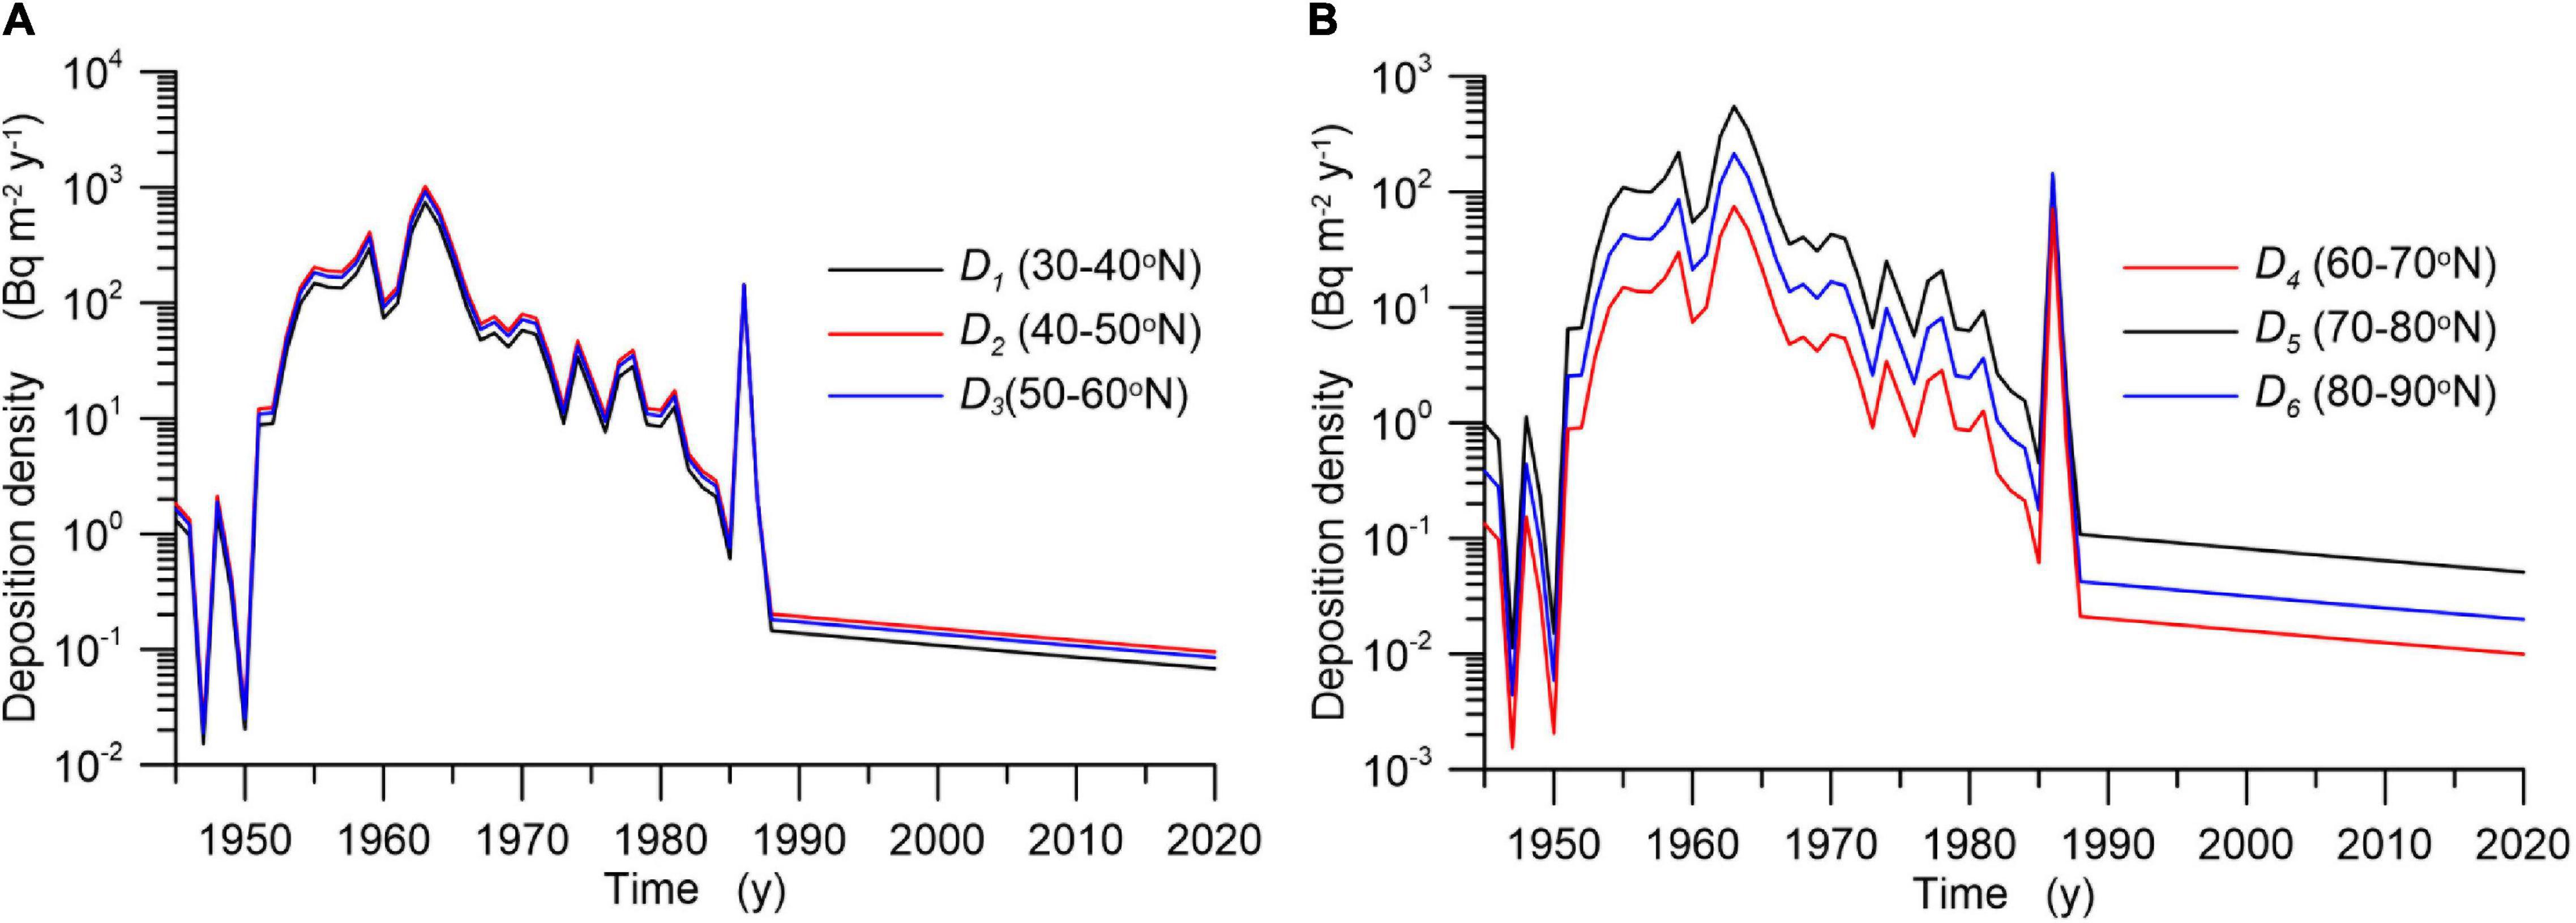
Figure 4. Global deposition densities Di (Bq m– 2) for the i-th latitude belts. i = 1,..,3 (A), i = 4,…,6 (B).
Source of 137Cs Due to Nuclear Accidents
Two major accidents (Chernobyl and Fukushima-Daiichi) affected the contamination of the oceans. Deposition as a result of the Chernobyl accident was an important factor in northwestern Europe. Following Mitchell and Steele (1988), the apparent deposition density onto the northern area of the North Sea was 3,400 Bq m–2 in 1986, whereas it was 1,500 Bq m–2 onto the central area and 320 Bq m–2 onto the southern area. These values were distributed between compartments covering the North Sea accordingly. In addition, deposition due to the Chernobyl accident was included as an additional component of global deposition in 1986 (Figure 4). It was estimated based on measurements conducted far from the Chernobyl NPP, e.g., in Tsukuba (Japan), the deposition density of 137Cs in 1986 was measured to be equal to 135 Bq m–2 (Aoyama, 2018). The measurements (Smith et al., 2015) suggest that the Fukushima-derived radionuclides were not deposited within the Arctic Ocean in 2011.
An increase in the 137Cs concentration in the Bering Sea in 2017 (Kumamoto et al., 2017) was caused by large-scale ocean circulation resulting in an increase in transport through the Bering Strait into the Arctic Ocean [see Subsection Releases From Reprocessing Plants, Sellafield (United Kingdom) and Cap de la Hague (France)].
Releases From Reprocessing Plants, Sellafield (United Kingdom) and Cap de la Hague (France)
In the 1951–2020 period, an amount of 41.4 PBq of 137Cs was released from the Sellafield reprocessing plant located in the Irish Sea, and 1.04 PBq of 137Cs was released from the Cap de La Hague reprocessing plant. In Figure 5A, the annual values of these releases for both reprocessing plants are shown (OSPAR, 2021).
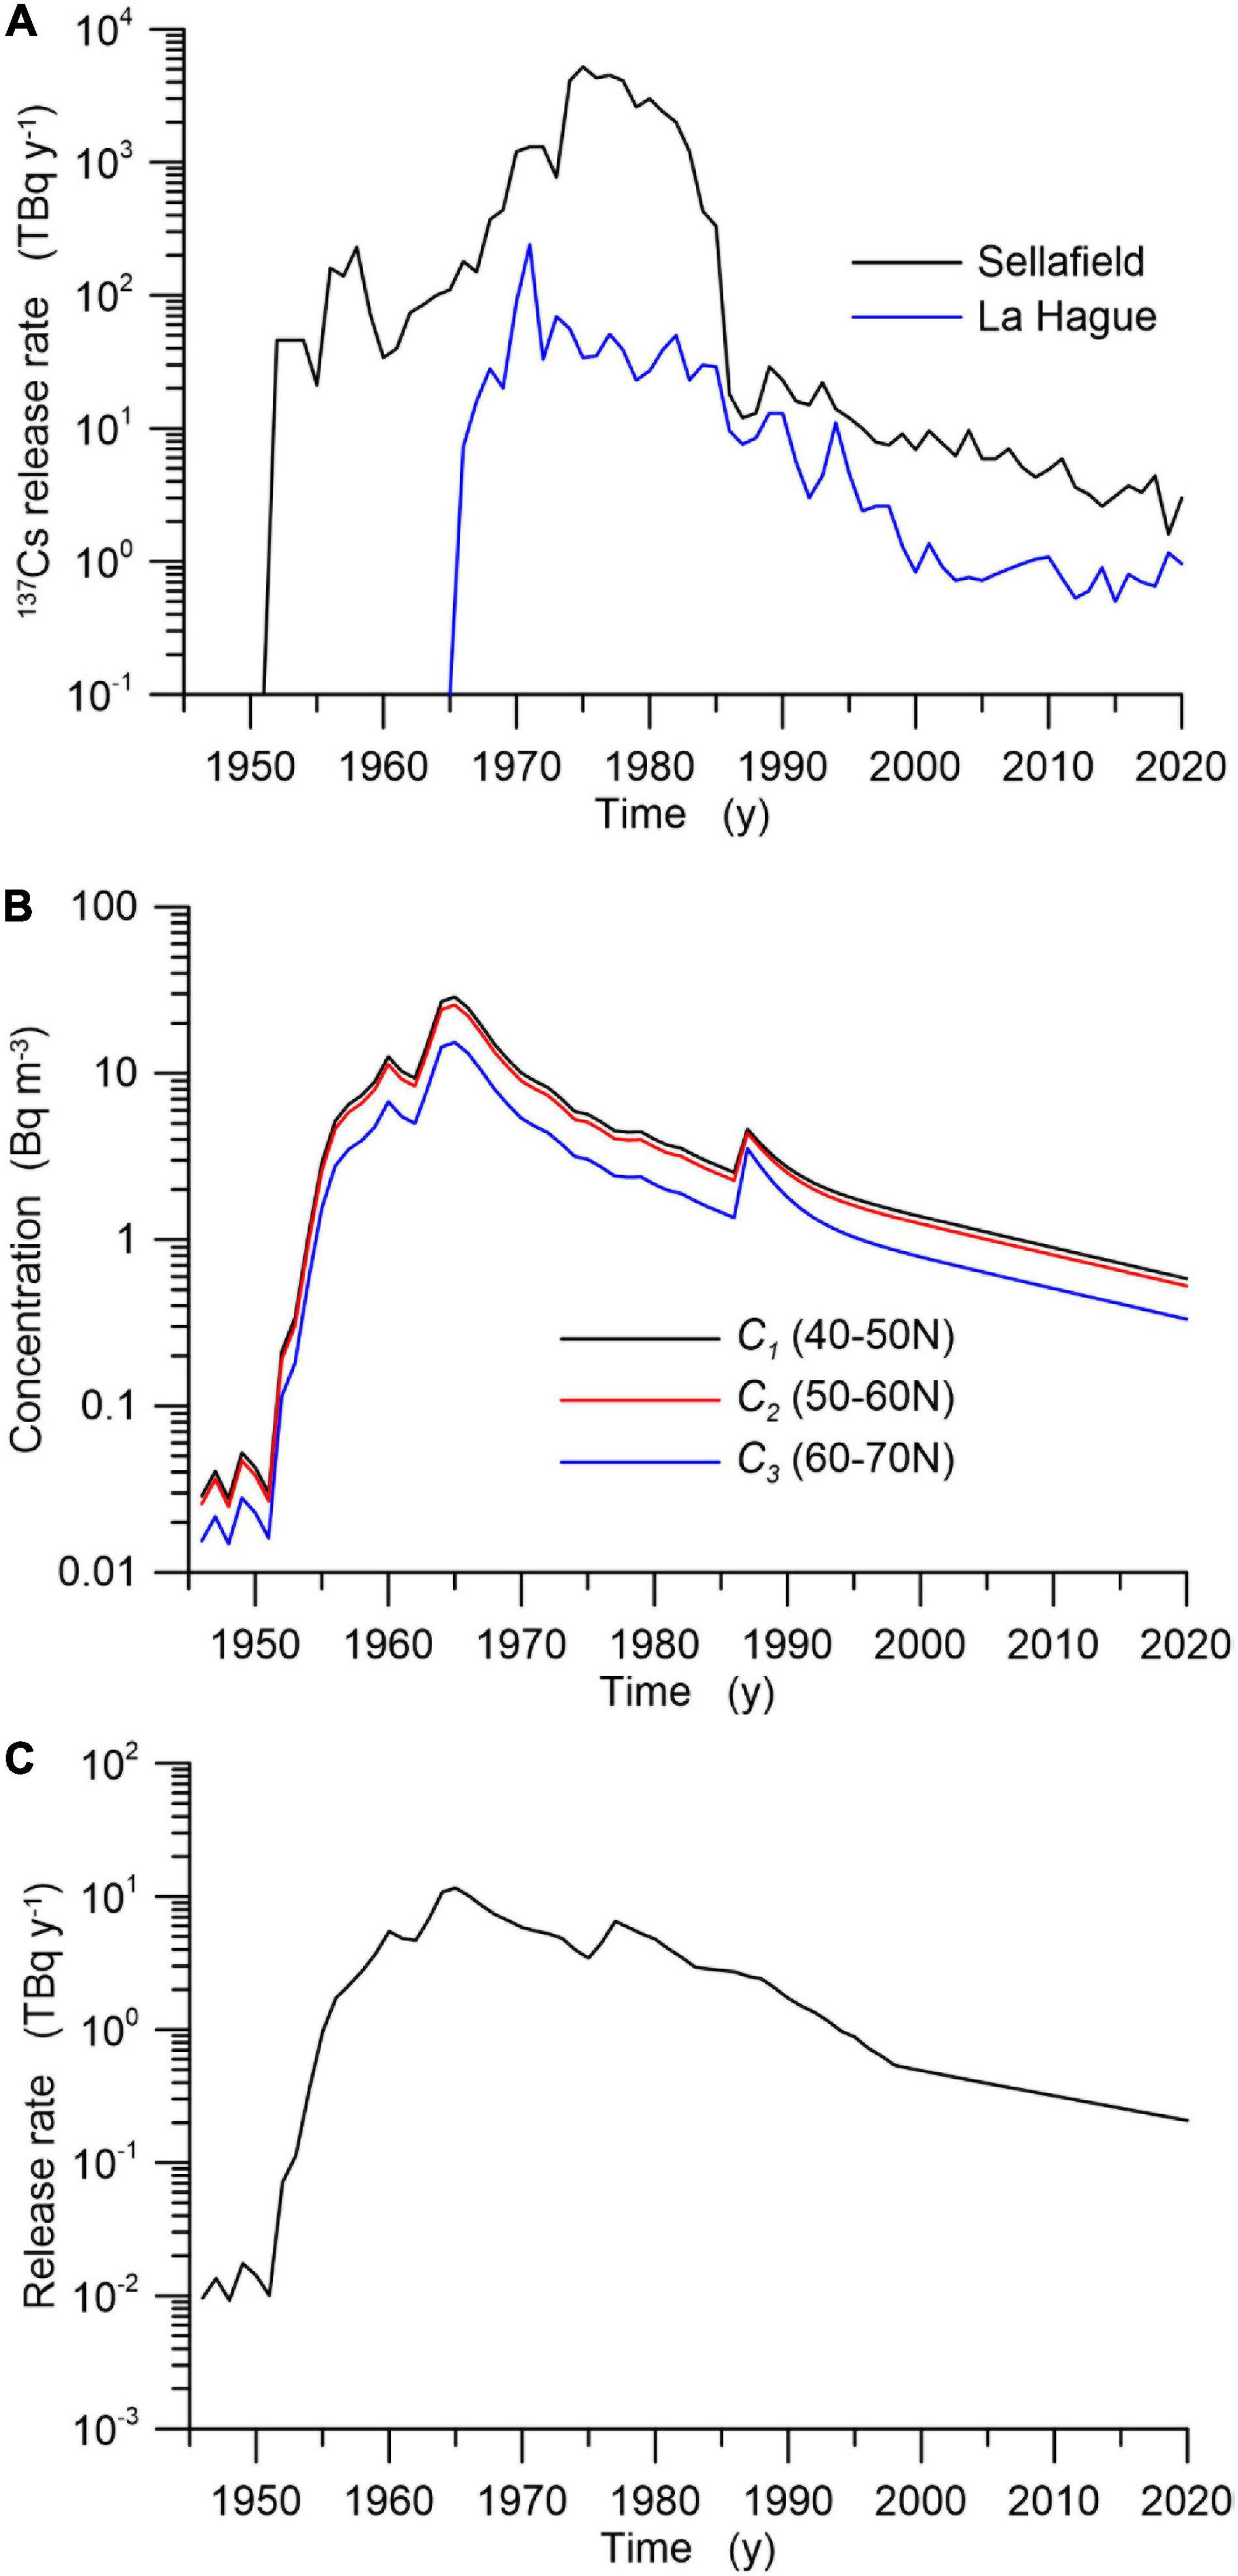
Figure 5. Release rate of 137Cs from the reprocessing plants (Bq y– 1) (A); 137Cs in the river mouth for different latitude belts (B); and the influx of 137Cs to the Kara Sea from the Yenisei River (C).
The Mayak Production Association (Mayak PA) is located within the Ob′ River drainage basin. Direct discharges of radionuclides from the Mayak PA were made between 1949 and 1956 to the Techa River system, which is part of the Ob′ drainage basin. The estimated amount of released 137Cs varied from 1.9 to 13 PBq (Semenkov and Miroshnikov, 2015). There were no direct measurements of the concentration in water in the estuary of the Ob′ River during this period; however, some estimates show that less than 1% could have reached the mouth of the Ob′ River due to the long distance to the location of release (more than 2,000 km) and significant sedimentation on the entire path (Semenkov and Miroshnikov, 2015). The measurements of deposited 137Cs and 239,240Pu in the Ob River delta suggested that both were delivered from atmospheric fallout (Sayles et al., 1997). Therefore, we assumed no input 137Cs from the Mayak PA to the Kara Sea. The inflow of 137Cs in the Kara Sea from another nuclear facility in the Ob′ River basin (Siberian Chemical Combine) was also negligible (Semenkov and Miroshnikov, 2015).
The Krasnoyarsk Mining and Chemical Industrial Combine (KMCIC) is located on the Yenisei River at a distance of approximately 2,500 km upstream from the Kara Sea. The influx of 137Cs with Yenisei River waters in the Kara Sea (Figure 5C) was estimated as the sum of the model-predicted distribution from the KMCIC source from Johannessen et al. (2010) and the generic river runoff model (Smith et al., 2004). The estimated input of 137Cs into the Kara Sea as a result of KMCIC routine release was approximately 74 TBq, which was in the range of estimated 30–100 TBq by Vakulovsky et al. (1995).
Discharges of 137Cs With River Waters
The influx of 137Cs into the sea with river waters due to flushing of deposited radionuclide in the river basin was estimated by using a generic river runoff model (Smith et al., 2004) for the total period of calculations. In this study, we consider 16 main rivers with climatic yearly average runoff (Supplementary Table 1). The calculated generic model concentration of 137Cs in the river water (Figure 5B) was multiplied by river water flux to estimate the influx of 137Cs. The influx of 137Cs in the Kara Sea from both river runoff and discharge from KMCIC is given in Figure 5C.
Fluxes of 137Cs at the Open Boundaries
Four boundaries are considered in the model: Bering Strait, Central Atlantic, Gibraltar, and Danish straits. For this purpose, the source of 137Cs was prescribed for the Bering Sea box to obtain the concentration, which would be in agreement (Supplementary Figure 2C) with corresponding measurements (MARIS, 2021). Note that the increase in 137Cs concentration after 2010 was caused by contamination due to the Fukushima NPP accident (Kumamoto et al., 2017). Similarly, the fluxes of activity were prescribed for boxes on the open boundary with the Central Atlantic, where an agreement obtained in the model concentrations with measurements (MARIS, 2021) was also achieved (Supplementary Figure 2A). The concentration in the Gibraltar Strait (Supplementary Figure 2B) calculated using simulation output from the Mediterranean Sea modeling (Bezhenar et al., 2019) was in agreement with measurements (MARIS, 2021). The results of modeling for 137Cs transport in the Baltic Sea (Bezhenar et al., 2016) were used to obtain the flux of activity from the Baltic Sea to the North Sea through the Danish straits (Supplementary Figure 2D).
Results
Concentration of 137Cs in the Water
In Figure 6, the calculated model concentrations of 137Cs in the water layers in the different boxes are compared with the corresponding measurements (MARIS, 2021). The temporal changes in concentration across the Nordic seas (Norwegian, Greenland, and Iceland seas) are shown in Figures 6A–C. Released from the Sellafield reprocessing plant, 137Cs is transported by the Norwegian current to the northeast (see Figure 3B). Part of the contaminated water turns to the North Sea, whereas another part is transported by the Norwegian Current along the Norway coast (Figure 6A, Box no. 33). The Sellafield signal is also visible in Box nos. 35 and 138 placed in the center of the ocean and in the Denmark Strait, where contamination is transported by the East Greenland Current. The meridional distribution of 137Cs is shown in Figures 6D–F. As seen in these figures, 137Cs of Sellafield origin is transported to Spitsbergen by the West Spitsbergen Current (Box no. 33, 29, and 28), but this signal in Box 14 is weak, suggesting that radioactivity is transported by Transpolar Drift from the central Arctic. The agreement of model predictions with observations is quite good.
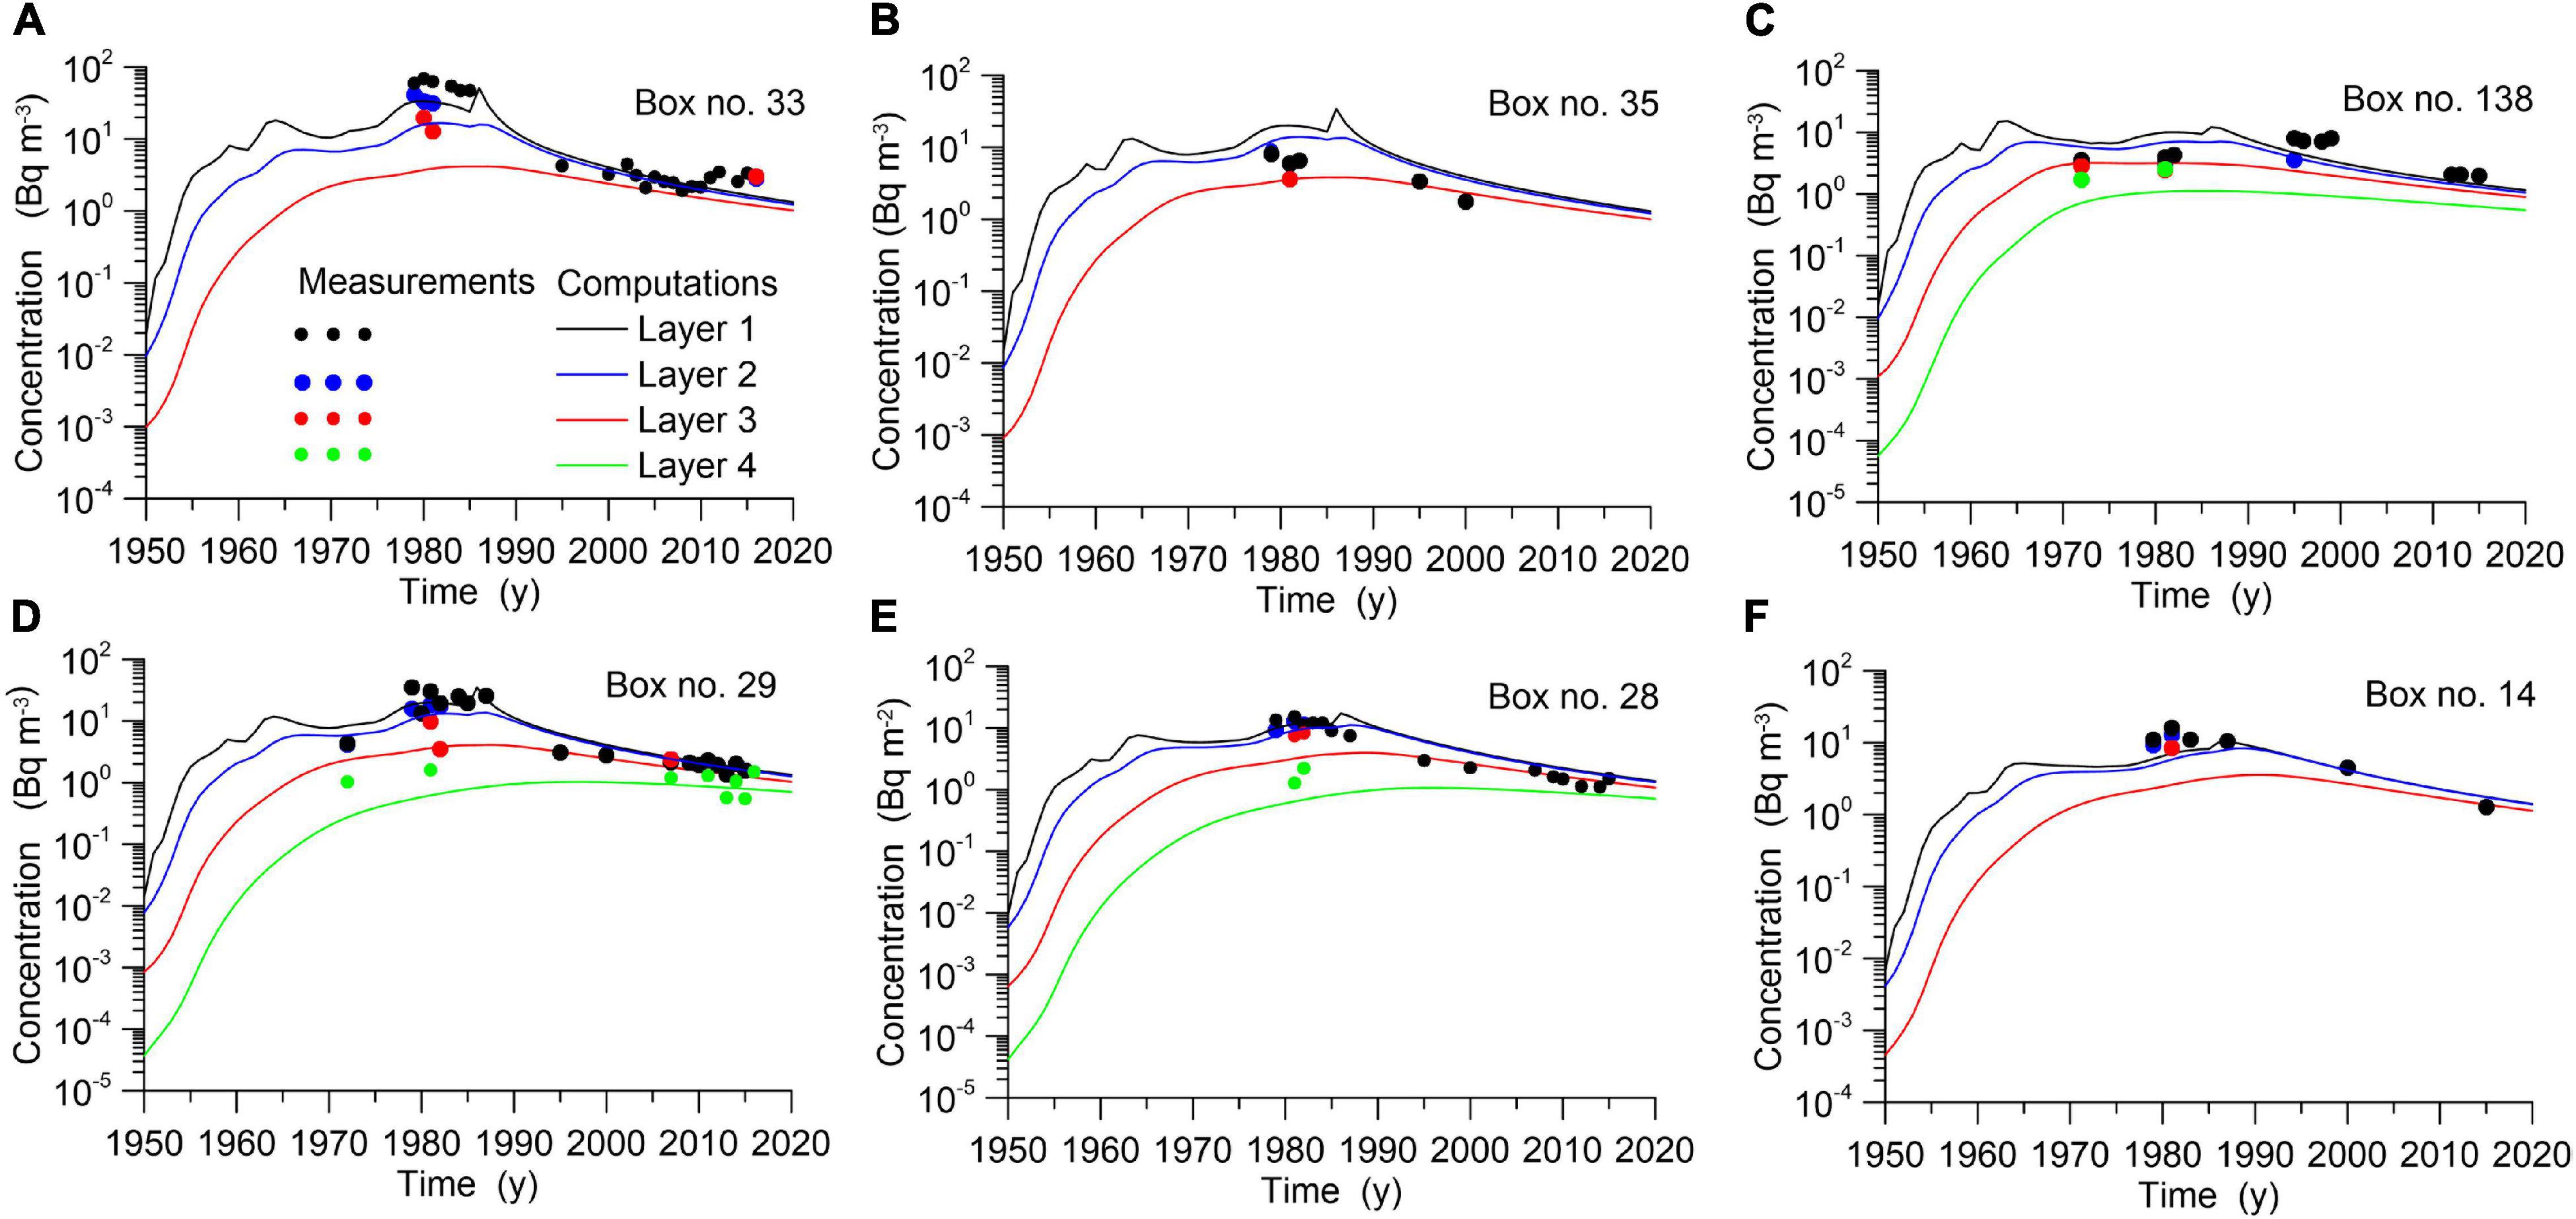
Figure 6. The comparison of simulated temporal changes of 137Cs in the water with measured (MARIS, 2021) concentration in Box no. 33 (A), 35 (B), 138 (C), 29 (D), 28 (E), and 14 (F).
Concentration of 137Cs in the Sediments
The temporal changes in 137Cs concentration in the bottom sediments differ for different regions of the North Atlantic and Arctic oceans. In Figures 7A–C, the computed concentrations in the surface layer of bottom sediment were compared with measurements (MARIS, 2021). Box no. 14 (Figure 7A) is located in the central Arctic. As seen in the figure, here, concentration monotonously increases in the total 1950–2020 period, which indicates a gradual influx of activity due to transport by Transpolar Drift. At the same time, the maximum in Figure 7B (Box no. 27) indicates the inflow of contaminated waters from Sellafield along the Norwegian coast. Following the decrease in the source intensity, the 137Cs concentration decreased after 1980. In the Kara Sea (Figure 7C, Box no. 24), the concentration changes slightly due to gradual inflow of radioactivity: initially due to global fallout, then from river inflow, and later from the inflow of water from reprocessing plants.
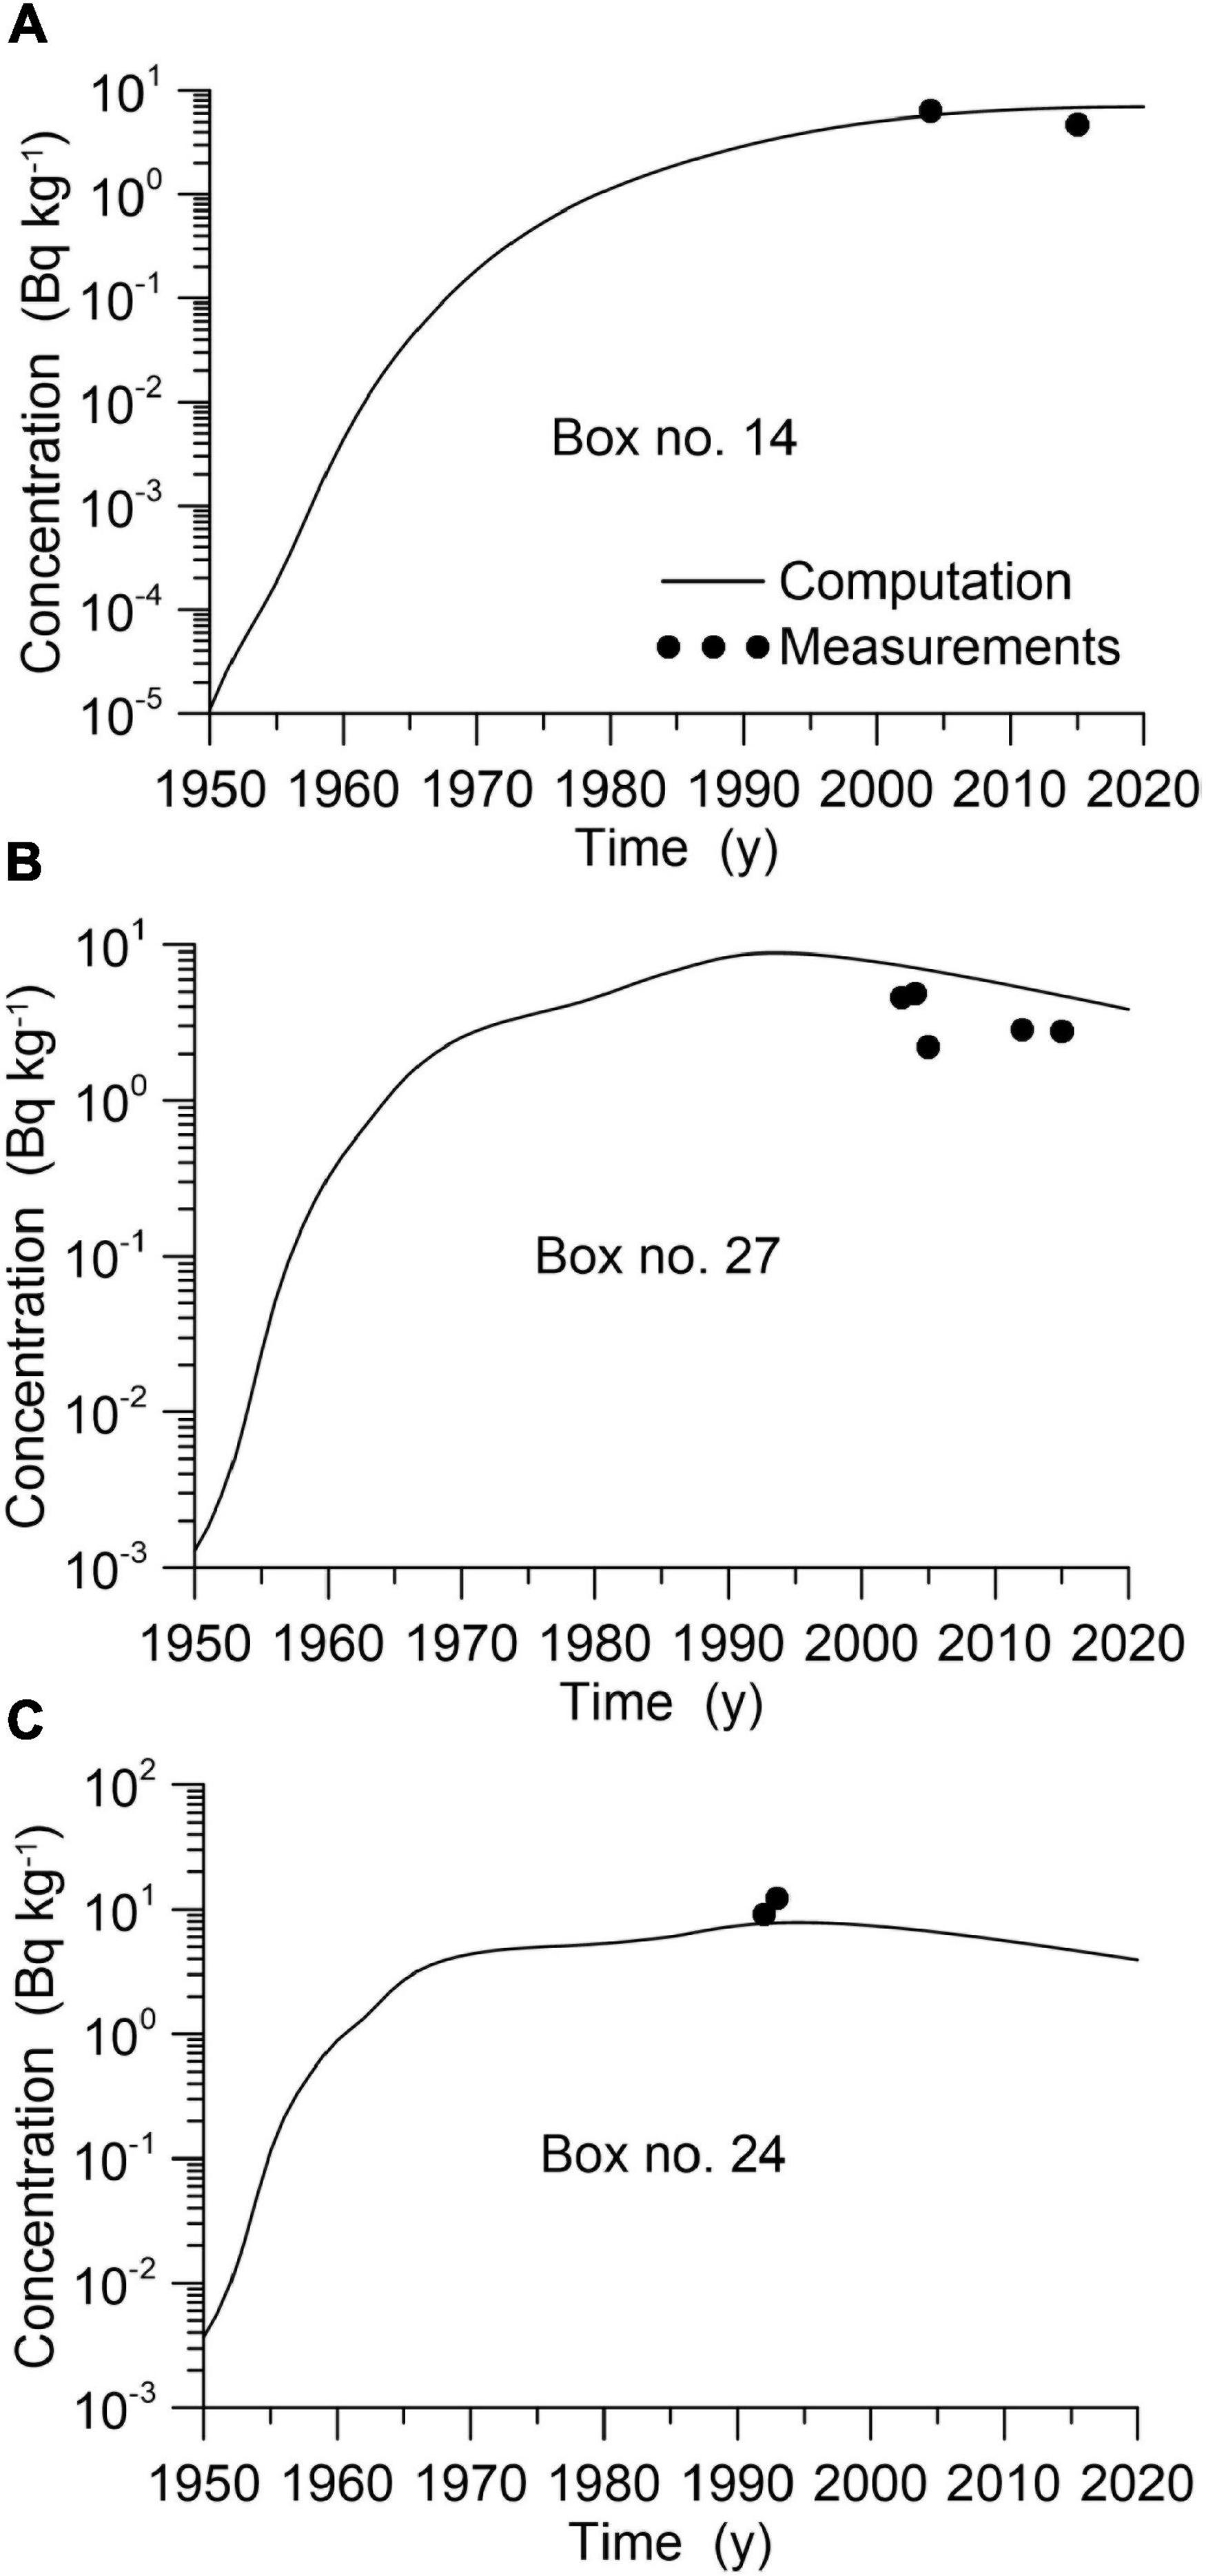
Figure 7. The comparison of simulated temporal changes of 137Cs in the bottom sediment with measured (MARIS, 2021) concentration in Box no. 14 (A), 27 (B), and 24 (C).
Concentration of 137Cs in the Barents Sea
The Barents Sea, represented by three boxes (nos. 25, 26, and 27), is a case of particular interest due to the location of the sea and the presence of multiple sources of pollution. The Barents Sea is a shallow marginal shelf sea of the Arctic Ocean located between the continent and the Spitsbergen, Franz Josef, and Novaya Zemlya archipelagos. Atlantic water inflows from the south, whereas Polar water enters the sea from the north. Multiple sources of pollution include global fallout, river influx, the inflow of water from reprocessing plants, and exchange with the Kara Sea. Therefore, the Barents Sea has been intensively monitored in the past 40 years (Zaborska et al., 2010; Gwynn et al., 2012; Leppanen et al., 2013). The temporal changes in 137Cs concentration in the water, bottom sediments, and biota in Box no. 26 are given in Figure 8. As seen in Figure 8, the first maximum 137Cs concentration in water caused by global fallout was observed in 1963, whereas the second maximum 137Cs concentration in water in 1980–1985 was due to the influx of contaminated water from Sellafield. The last maximum in 1986–1987 was associated with Chernobyl atmospheric deposition and the subsequent inflow of Chernobyl contamination from the North Atlantic by currents. Then, the concentration in water gradually decreased. The maximum 137Cs concentration in the upper layer of bottom sediments was delayed by 10 years (Figure 8B). Subsequently, the 137Cs concentration decreased following a decrease in the intensity of the source. The concentrations of 137Cs in the seaweed (Figure 8C) and the non-piscivorous and piscivorous pelagic fishes (Figures 8D,E) mostly following the concentration of 137Cs dissolved in the water. At the same time, the concentration in coastal predators (represented by cod, Gadus morhua) lagged behind the concentration in water (Figure 8F). This is explained by the diet of coastal predators, which includes both pelagic and benthic organisms feeding on organic matter in the bottom sediments (Bezhenar et al., 2016).
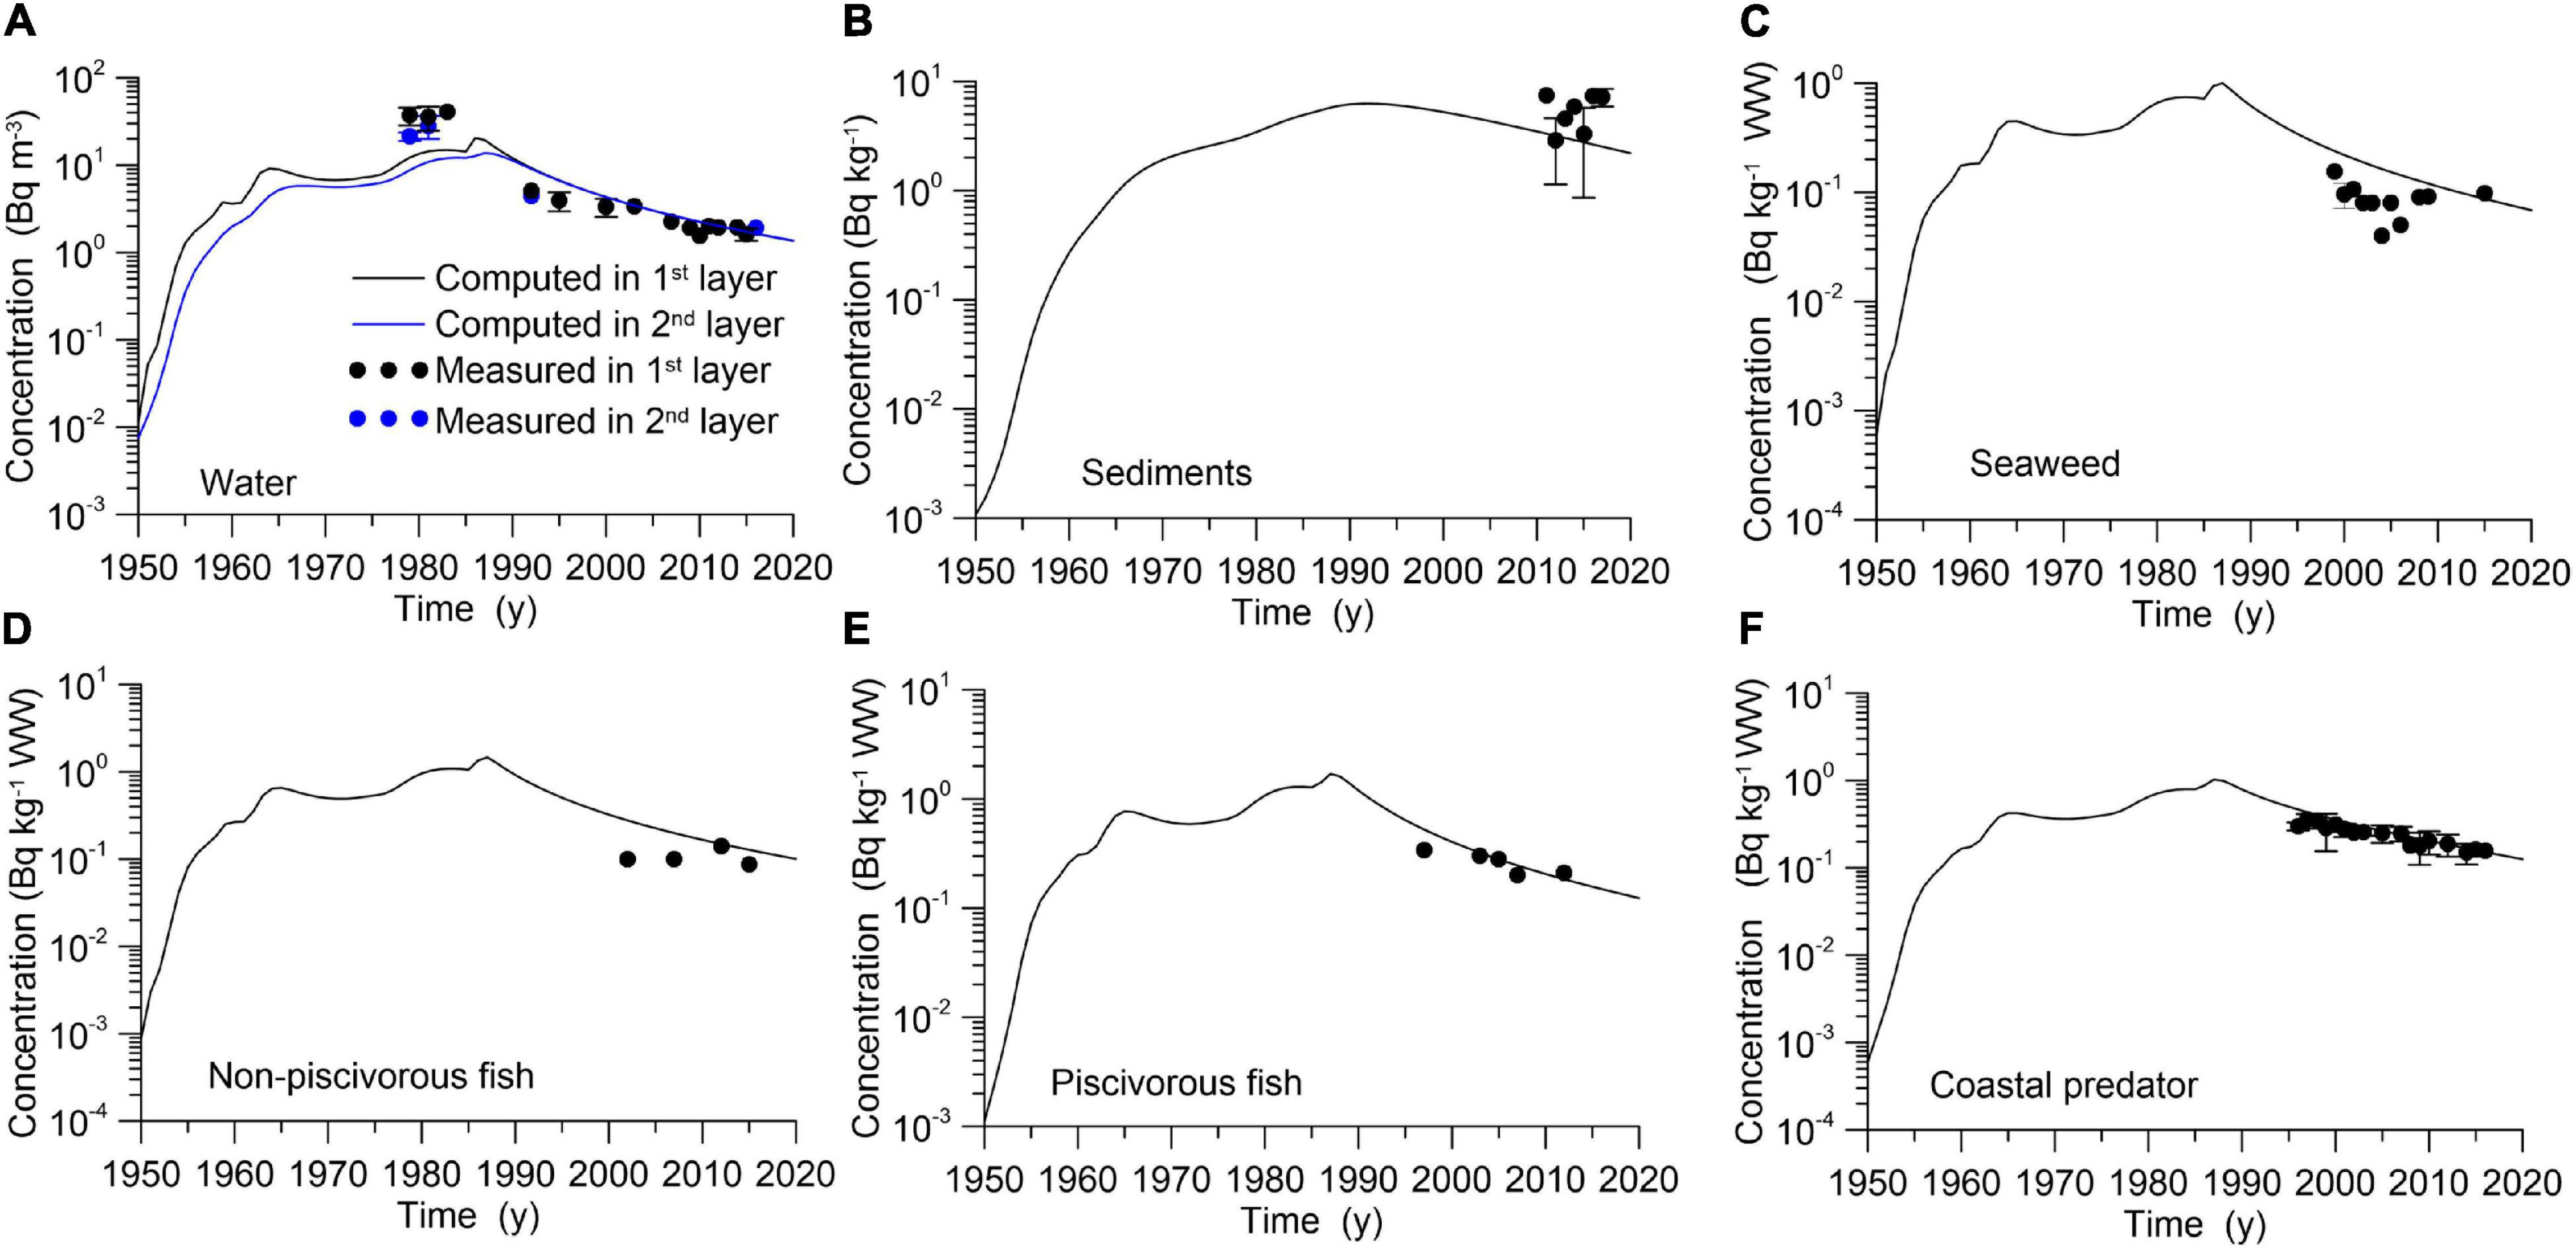
Figure 8. The comparison of simulated temporal changes of 137Cs with measured (MARIS, 2021) concentration in the Barents Sea (Box no. 26) in the water (A), bottom sediments (B), seaweed (Fucus vesiculosus) (C), non-piscivorous fish (Clupea harengus) (D), piscivorous fish (Pollachius virens) (E), benthic predator (Reinhardtius hippoglossoides) (F), and coastal predator (Gadus morhua) (G).
Contribution From Different Sources to the Concentration of 137Cs in Non-piscivorous Fish
Compartment modeling allows us to easily estimate the contribution from each of the sources to the pollution of the marine environment. The non-piscivorous fish were selected as the object of comparison for the contribution from different sources to the concentration of 137Cs in the organism. Figure 9 shows the contribution from (i) global deposition due to weapon testing and the Chernobyl accident (see Figure 4), (ii) Sellafield reprocessing plant release (Figure 5A), (iii) Cap La Hague reprocessing plant release (Figure 5A), (iv) inflow from the Yenisey River caused by release from KMCIC, (v) influx from the Baltic Sea (Supplementary Figure 2D), and (vi) Chernobyl accident deposition on the North Sea. As seen in Figure 9A, in the Irish Sea, almost all contamination in 1970–1985 was caused by routine discharge from the Sellafield plant; even in the 1990–2020 period, this contribution exceeded 90%. The contaminated water flowed from the Irish Sea to the North Atlantic and then to the North Sea, where part of the flow turned to the south (Figure 3), whereas the rest of the contaminated water was transported by the Norwegian Current into the Arctic Ocean. Therefore, the input from the Sellafield plant dominated (80–90%) in the North Sea (Figures 9B,C) in the 1975–1985 period and in the Norwegian Sea (Figure 9D) in the 1980–1985 period. Then, the contribution from reprocessing plants decreased, and similarly to 1950–1970, the contribution from global deposition dominated after 2000–2010. The Baltic Sea outflux contribution was relatively small in the central parts of the North Sea. The contribution from the La Hague plant dominated over the Sellafield contribution only in the southern North Sea in 1970–1975. The regional deposition on the North Sea due to the Chernobyl accident was comparable with the Sellafield contribution in the northern North Sea (Figure 9B) in 1986–1987 and reached 40% of the total content of 137Cs, whereas global deposition was only 10% in that period. The fluxes of water from the La Hague plant and Baltic Sea were less important (maximum contributions reached 18 and 4%, respectively). As discussed in the previous section, three sources were most important in the Barents Sea (Figure 8E): global deposition in the 1950–1970 period and after 2010, Sellafield release (approximately 80% in 1980–1985), and Chernobyl deposition in the North Sea, whose contribution reached approximately 30% in 1988. Note that in Box no. 33, the direction of exchange between the water column and bottom deposit changed sign in 2000, indicating that sediments in the Norwegian Sea became a secondary source of contamination for the Barents Sea (see also Matishov et al., 2011). The contribution from KMCIC to contamination in the Kara Sea (Figure 9F) was insignificant (6%) in comparison with the input of global deposition and inflow contaminated water of Sellafield and Chernobyl origin from the Barents Sea. Note that the maximal contribution from Sellafield was reached in 1985, whereas the corresponding maximum for Chernobyl contamination was reached in 1995. The contribution from Sellafield was approximately 1.5 times less than global deposition along the Arctic coast of Canada and Baffin Bay after 1995 (Figures 9G,H), although these two sources dominated all others. At the same time, the corresponding maximum contribution from the Sellafield plant near Newfoundland (Figure 9I) was reached in 1985, indicating a shorter trajectory of water masses than in the Arctic Ocean.
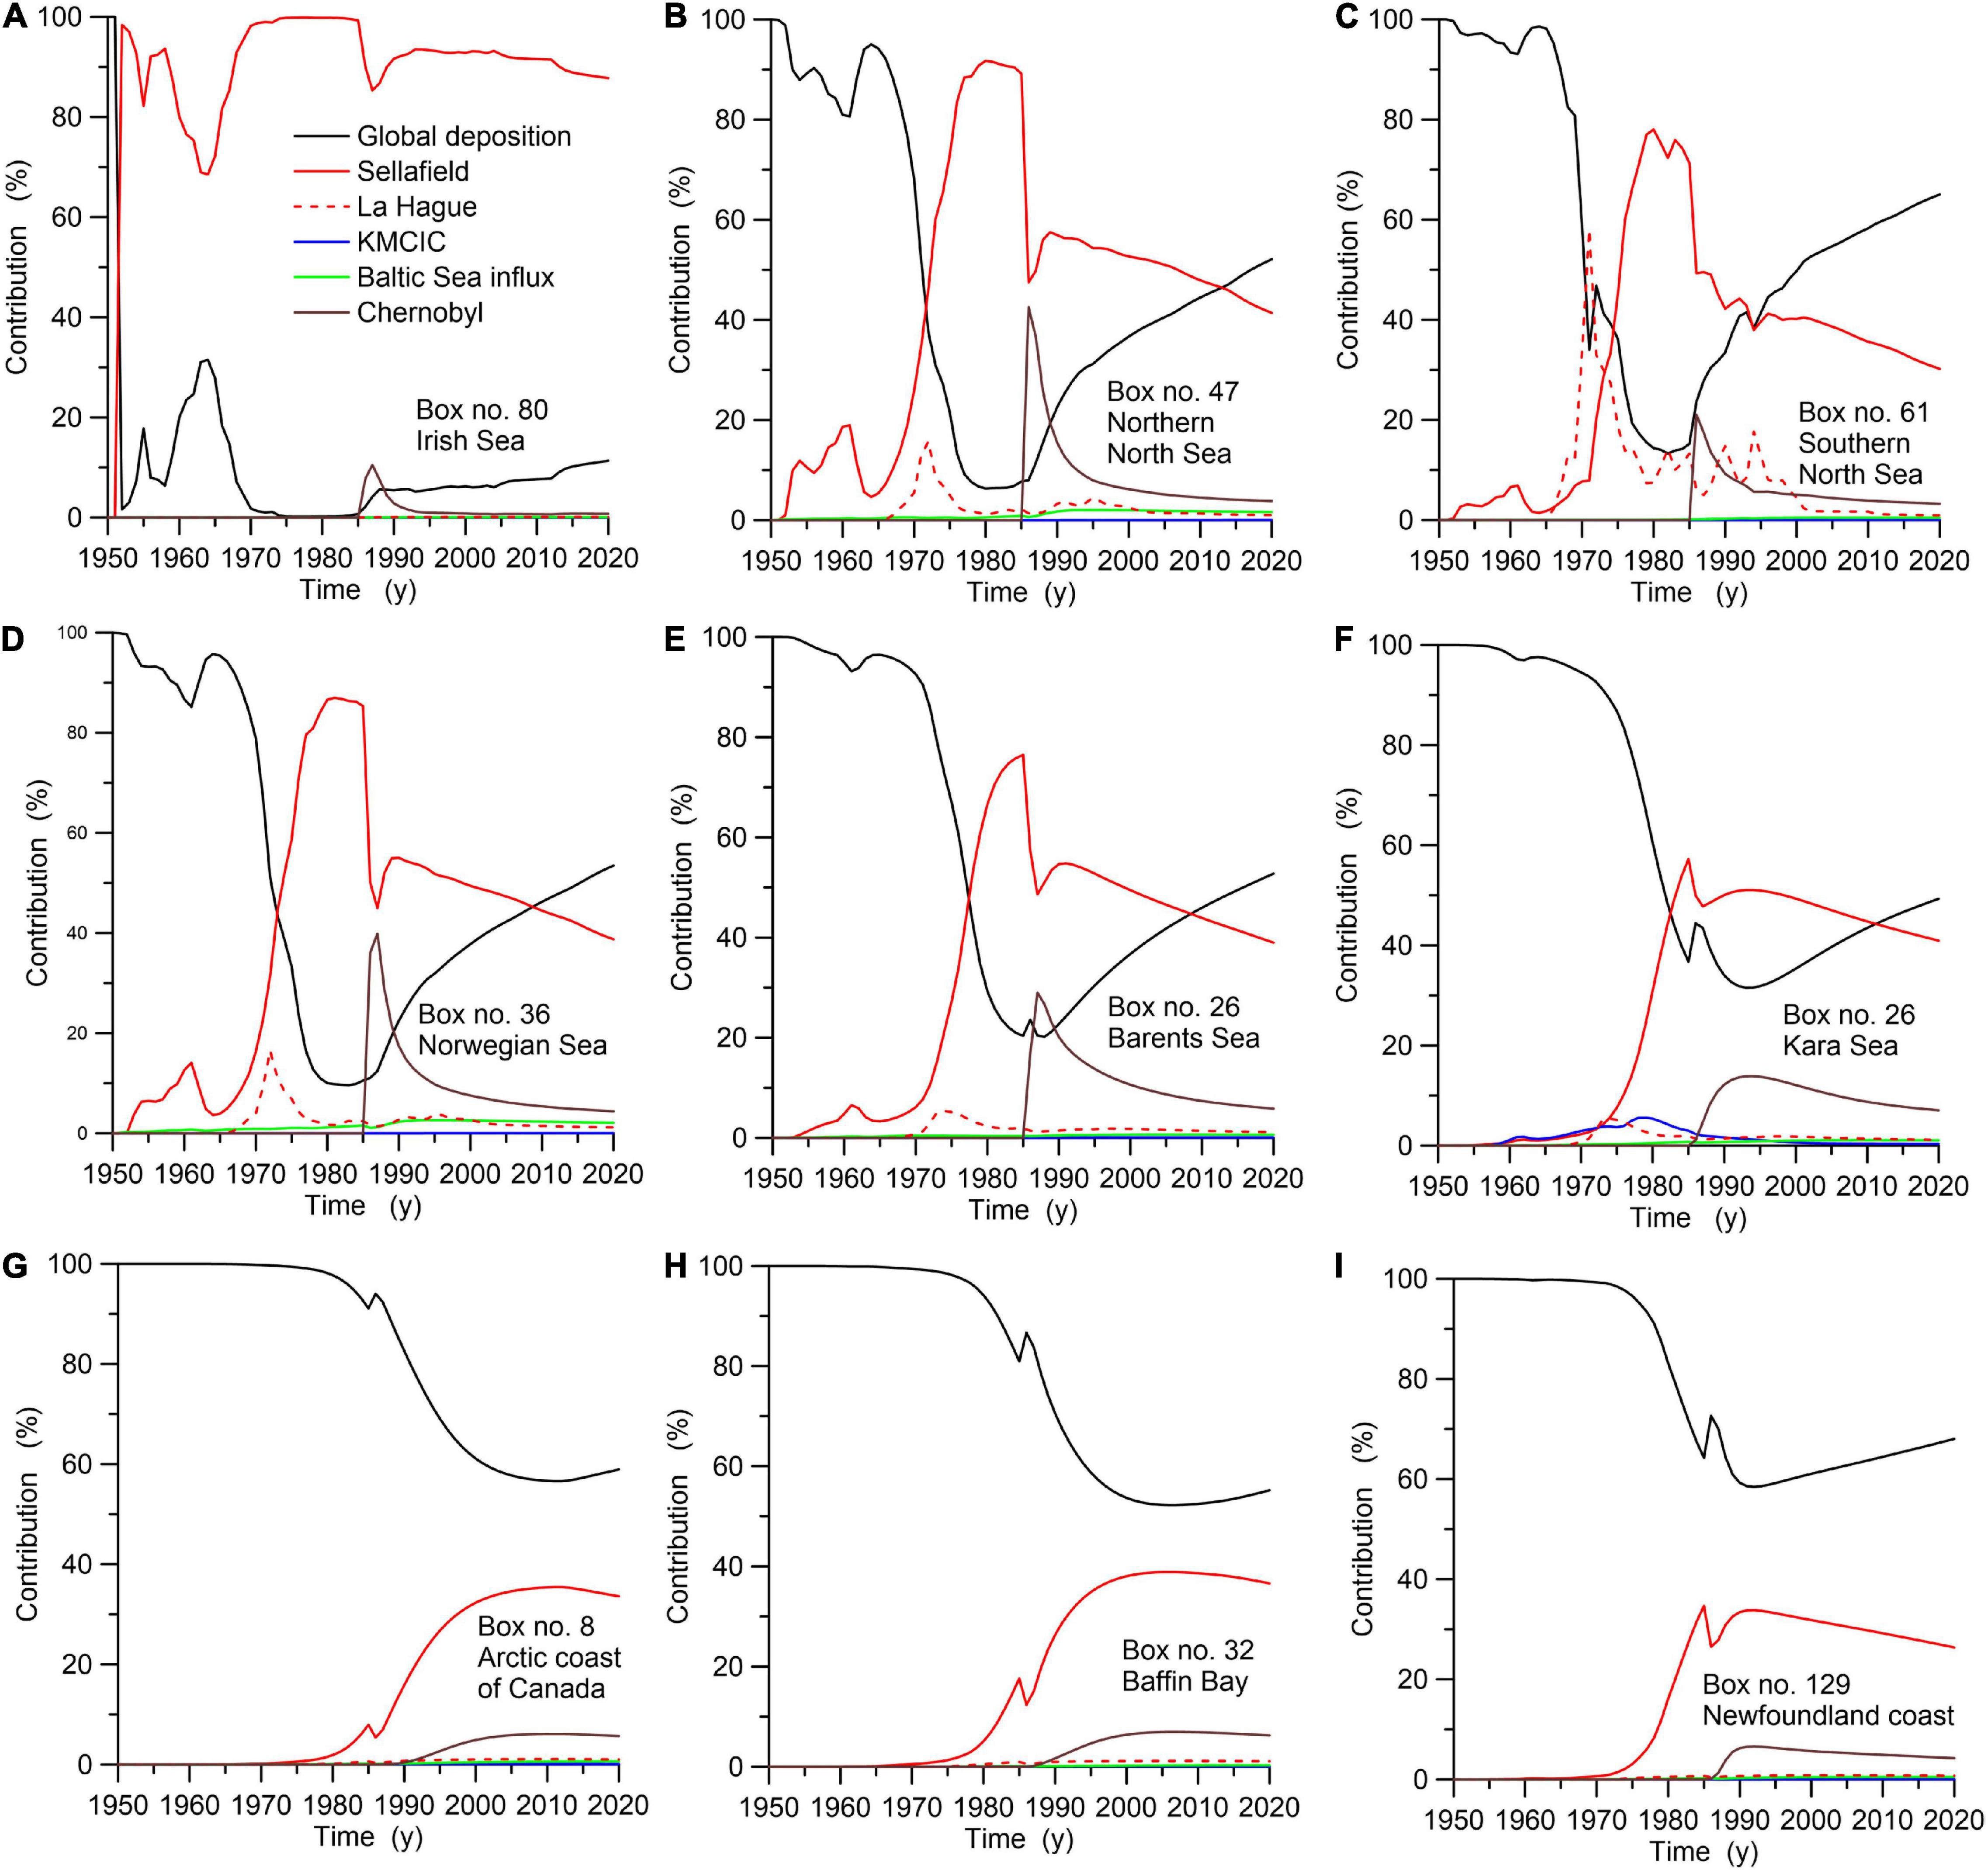
Figure 9. Contribution from different sources to the concentration of 137Cs in non-piscivorous fish in the Irish Sea (A), northern North Sea (B), southern North Sea (C), Norwegian Sea (D), Barents Sea (E), Kara Sea (F), Arctic coast of Canada (G), Baffin Bay (H), and Newfoundland coast (I).
Statistical Evaluation of the Model Predictions
The geometric means (GM) and the geometric standard deviation (GSD) were calculated for simulated-to-observed ratios of 137Cs concentration values in the water, sediment, and marine biota. The data for different marine organisms from MARIS (2021) were used: macroalgae (Fucus vesiculosus), non-piscivorous fish (herring, Clupea harengus), piscivorous fish (coalfish, Pollachius virens), benthic predatory fish (halibut, Reinhardtius hippoglossoides), and coastal predatory fish (cod, Gadus morhua). The general agreement between simulated and observed 137Cs concentrations in water and bottom sediment in the North Atlantic and Arctic oceans was confirmed by the GM and GSD values, which varied from 0.89 to 1.28 and from 1.48 to 1.87, respectively (Table 1). The model accurately predicted the 137Cs concentrations in the different biota species in the North Atlantic and Arctic Ocean, where GM and GSD values varied in a range from 1.01 to 1.29 and from 1.22 to 1.48, respectively. The exceptions were estimates of GM and GSD for macroalgae and non-piscivorous fish in the Arctic Ocean, for which simulated concentrations overestimated measurements by almost two times.
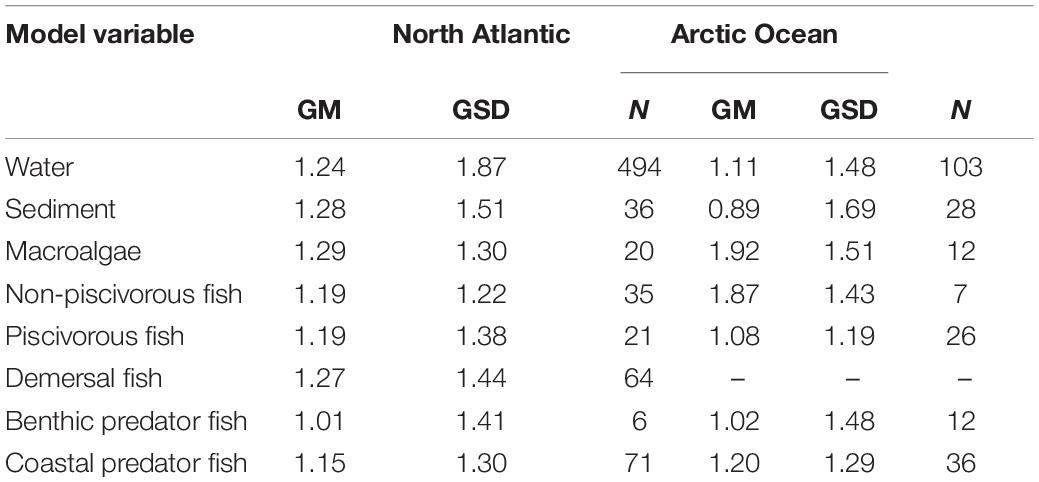
Table 1. Geometric mean simulated-to-observed ratios (GM), geometric standard deviations (GSD), and the number of measurements (N) of each model variable for the Mediterranean and Black seas.
Budget of 137Cs in the Arctic Ocean
The Arctic Ocean is surrounded by Eurasia, North America, and Greenland and connected with the Pacific Ocean by the narrow and shallow Bering Strait and with the North Atlantic through the Canadian Archipelago and wide deep openings between Scandinavia and Greenland. Therefore, the Arctic Ocean is often called the Arctic Mediterranean (Østerhus et al., 2019). The long-term variations in the Arctic Ocean inventory of 137Cs in water and the bottom sediments (see Supplementary Figure 3) depend on exchange flows with other oceanic basins as well as distributed and point sources. The maximum total inventory (sum of the inventory in the water and sediment) in the Arctic Ocean (31,122 TBq) was reached in 1988 as a result of nuclear weapon tests, releases from nuclear facilities, and the Chernobyl accident. The corresponding inventory in the bottom sediments was approximately 6% of the maximum in the water. The maximum in the bottom sediments (2,306 TBq) was reached in 2004. The estimates from the simulation and decay corrected to 1960, 1980, 2000, and 2020 sources and sinks of 137Cs in the Arctic Ocean are given in Table 2. As seen in the table, global fallout dominated in the sixties, whereas influx by currents from the North Atlantic of water contaminated due to global fallout, release from reprocessing plants, and instantaneous input after the Chernobyl accident increased with time. The influx from the Pacific Ocean was comparable to the influx from the North Atlantic in the sixties, whereas in 2020, it was only a few percent of the North Atlantic transport. Secondary contamination due to river runoff was less than 4% of ocean influx. The gradual purification of water occurred due to the removal of water into the North Atlantic, deposition of 137Cs at the bottom, and decay.
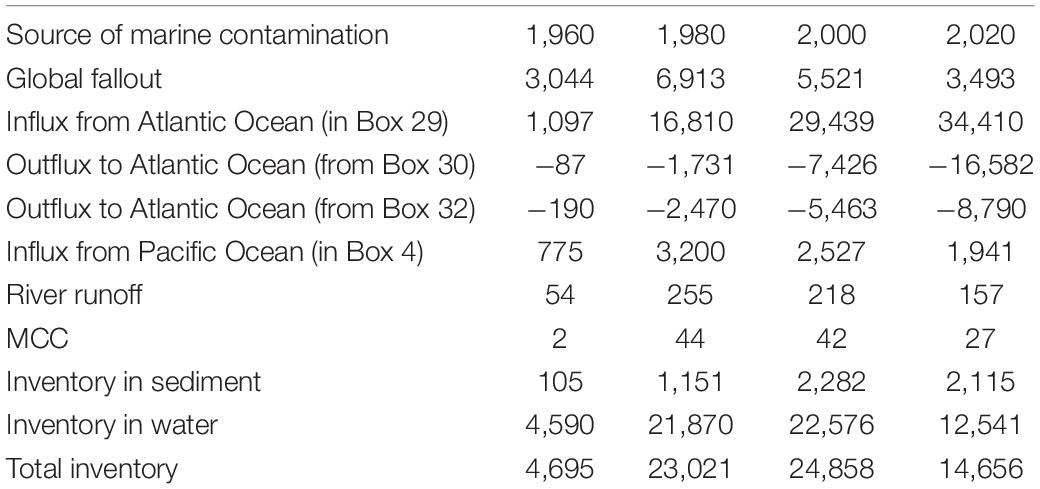
Table 2. Estimated inventories from simulations and decay corrected to 1960, 1980, 2000, and 2020 sources and sinks (TBq) of 137Cs in the Arctic Ocean (Boxes 4 to 32).
Classification of 137Cs Levels in the North Atlantic and Arctic Ocean
The data from monitoring the radioactivity concentration in the World Ocean collected within the framework of several projects of IAEA (1995, 2005) were grouped in large compartments to present their distribution in time and corresponding trends. These compartments were allocated on the empirical basis of knowledge of main currents in the seas and the location of sources. However, as previously noted (IAEA, 2005), “It is difficult to give meaningful average concentrations for these radionuclides in marginal seas such as the North Sea, the Baltic Sea, the Black Sea and especially, the Irish Sea.” Therefore, a more detailed division of marine basins based on an objective method is necessary. The purpose of the classification of time series of radionuclide concentrations in the set of boxes is to select groups of boxes with similar temporal distributions of concentrations. The selection method is based on the “etalon” approach (Martazinova, 2005). The description of the method in detail was given by Maderich et al. (2020). This method makes it possible to identify areas of contamination with a similar distribution over time. For each area, the etalon distribution, i.e., temporal distribution that was representative of allocated areas, was determined.
The classification results are shown in Figures 10–11, where 13 regions with similar 137Cs concentration time distributions were distinguished. Corresponding etalon distributions are shown in Supplementary Figure 4. The distribution of regions is due to the pattern of currents and the distribution of pollution sources. Region I (Central Arctic) in Figure 10 is located in the Canadian Basin, and the Canadian Archipelago is separated from the western Arctic (Region III) by the Alpha/Mendeleev Ridge. An anticyclonic Beaufort Gyre governs circulation in Region I, whereas water is transported from the Central Arctic to the western Arctic by Transpolar Drift (see Figure 3A). As seen in etalon Box no. 18 (Supplementary Figure 4), the dominant factor for Region I is global deposition. Region II (eastern Arctic) is under the influence of water inflowing from the Bering Sea (Supplementary Figure 2C). This leads to a doubling of the 137Cs concentration compared with region I. Region III (Western Arctic) covers almost half of the Arctic Basin. Water inflows from the North Atlantic form the Atlantic/Norwegian Current (Figure 3A), and outflows from the East Greenland Current (Figure 3A). According to Figures 9E,F, in this region in 1950–1970, global deposition dominated, whereas in 1980–1990, the main source was contamination from Sellafield. This is confirmed by the temporal distribution of 137Cs in etalon Box no. 25, where the importance of Chernobyl contamination inflow from the North Sea is also shown. Region IV (Nordic seas) covers three seas: the Norwegian, Iceland, and Greenland seas with complicated multidirectional flows. As seen in Supplementary Figure 4, the effects of the inflow of contaminated water from Sellafield and the contamination of Chernobyl origin from the North Sea is doubled in etalon Box no. 35 compared with Region III.
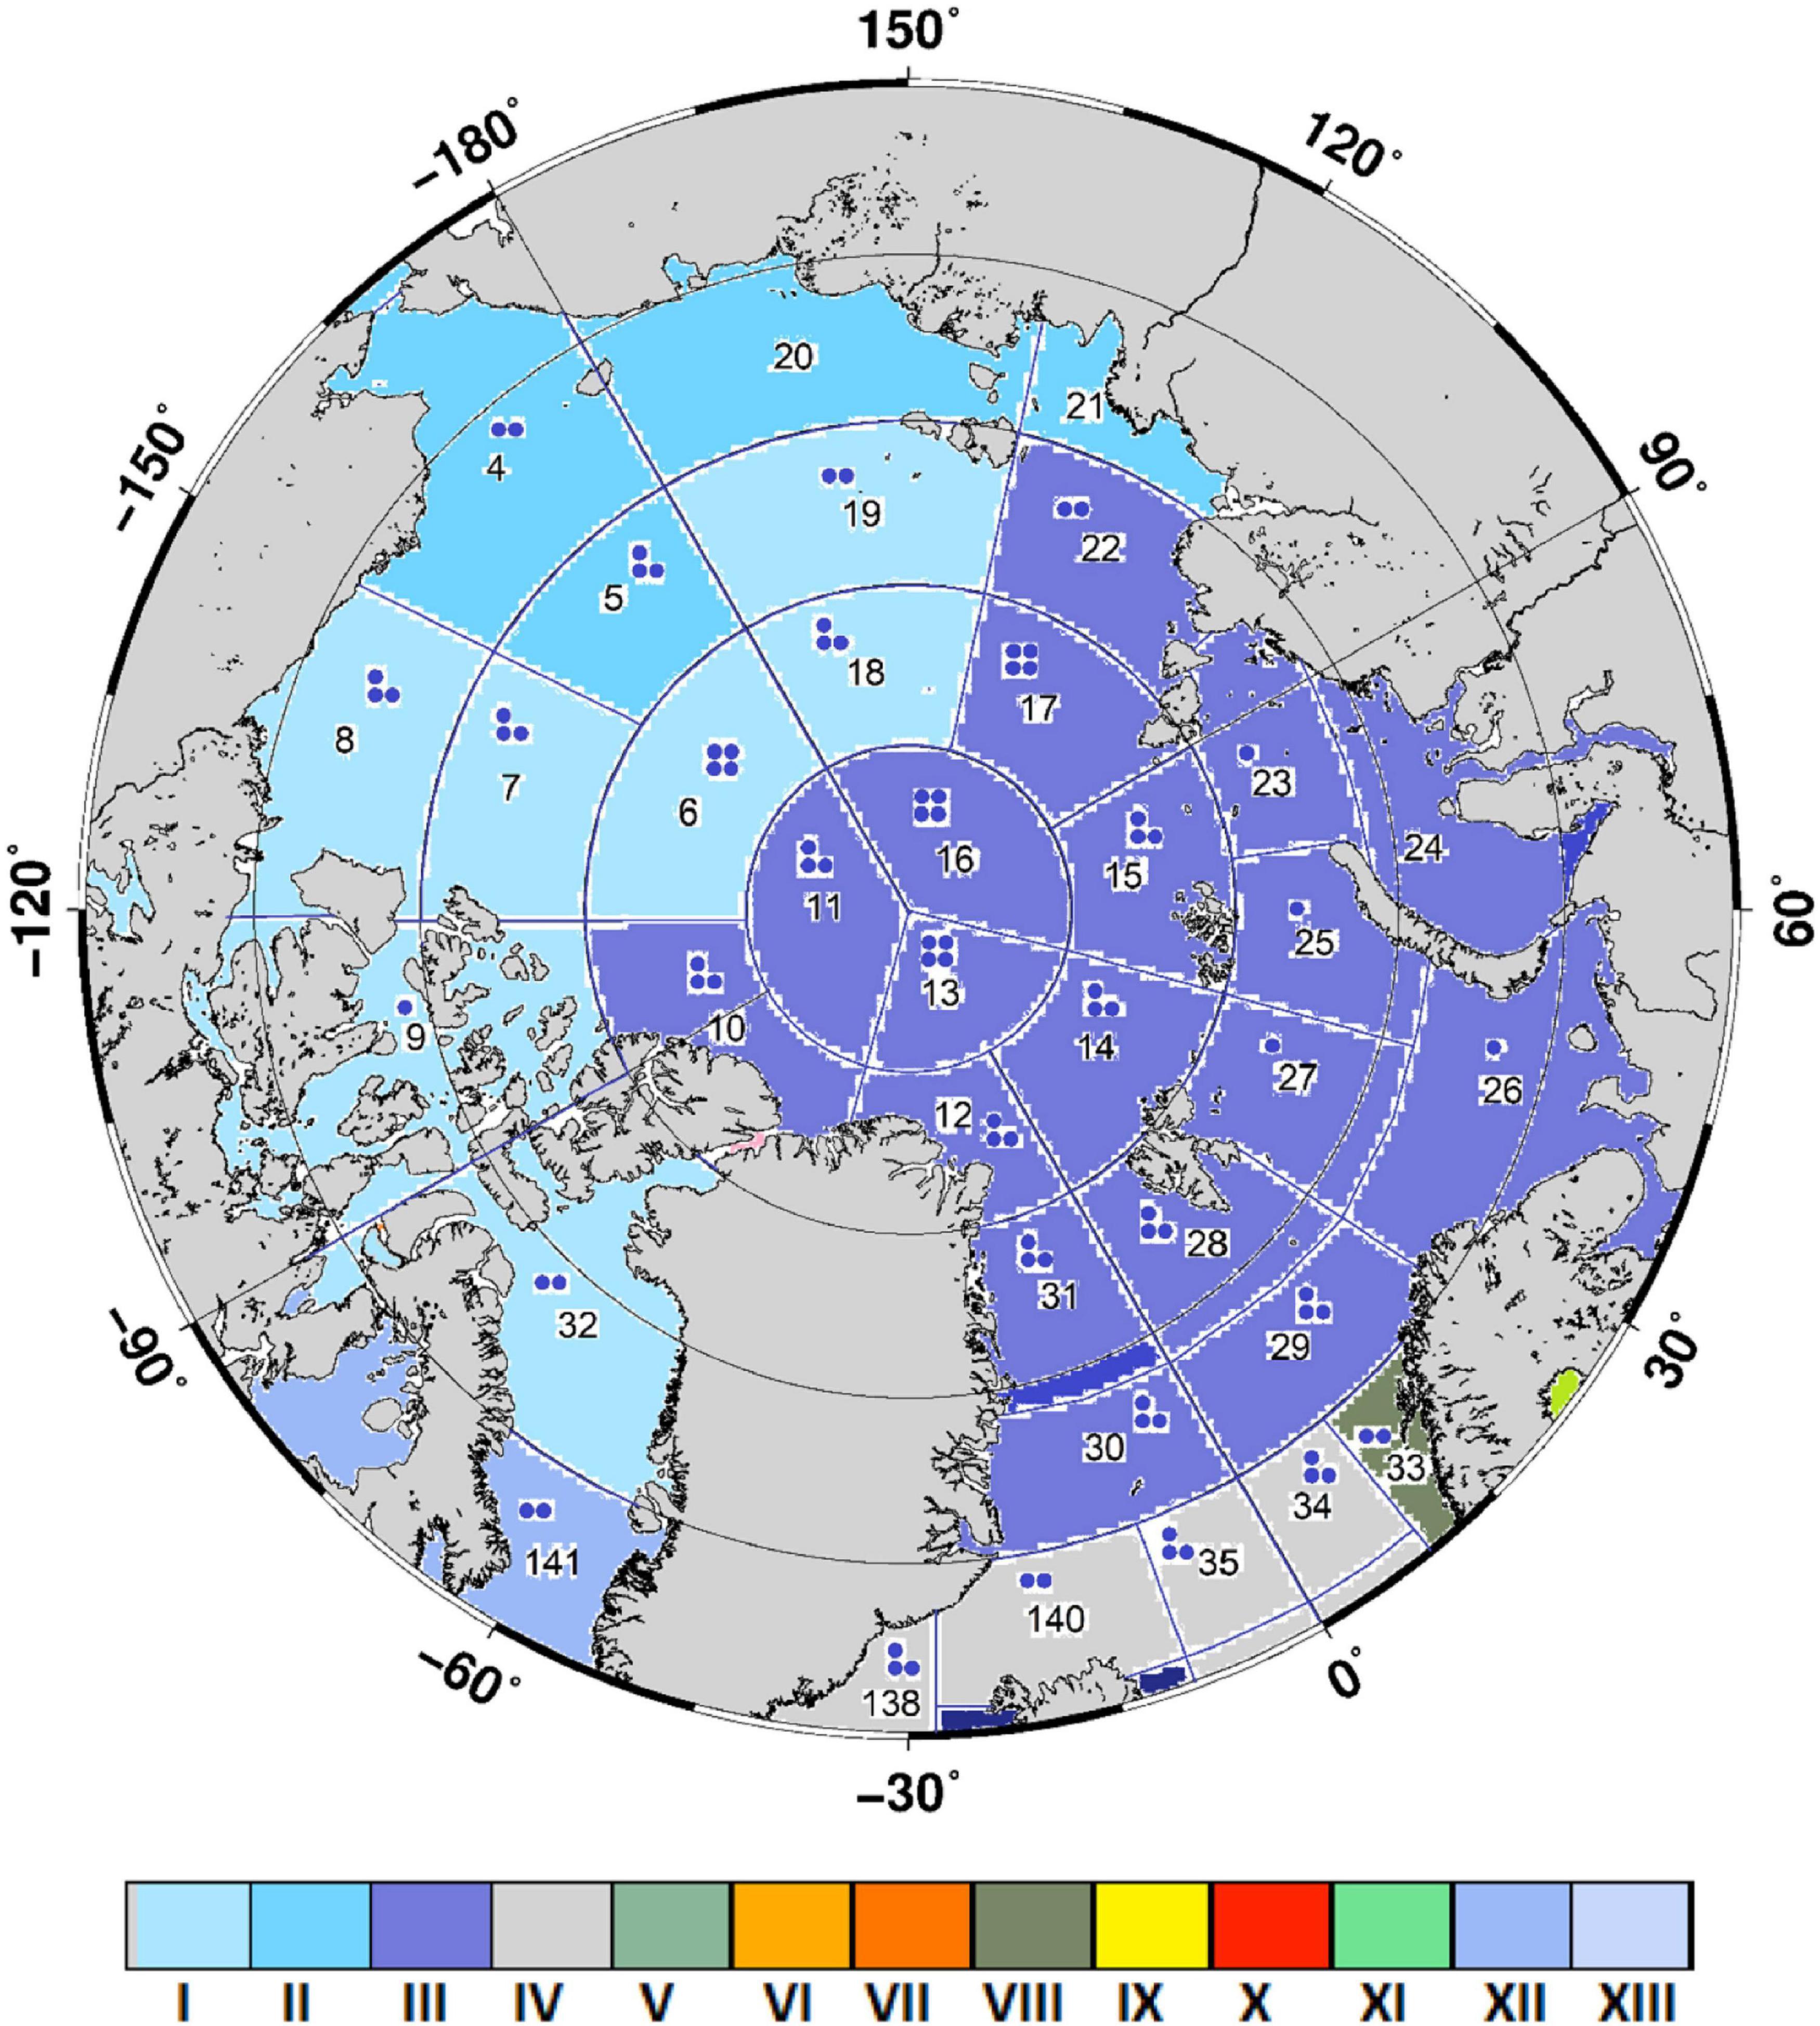
Figure 10. The regions allocated in the Arctic Ocean as a result of the classification.
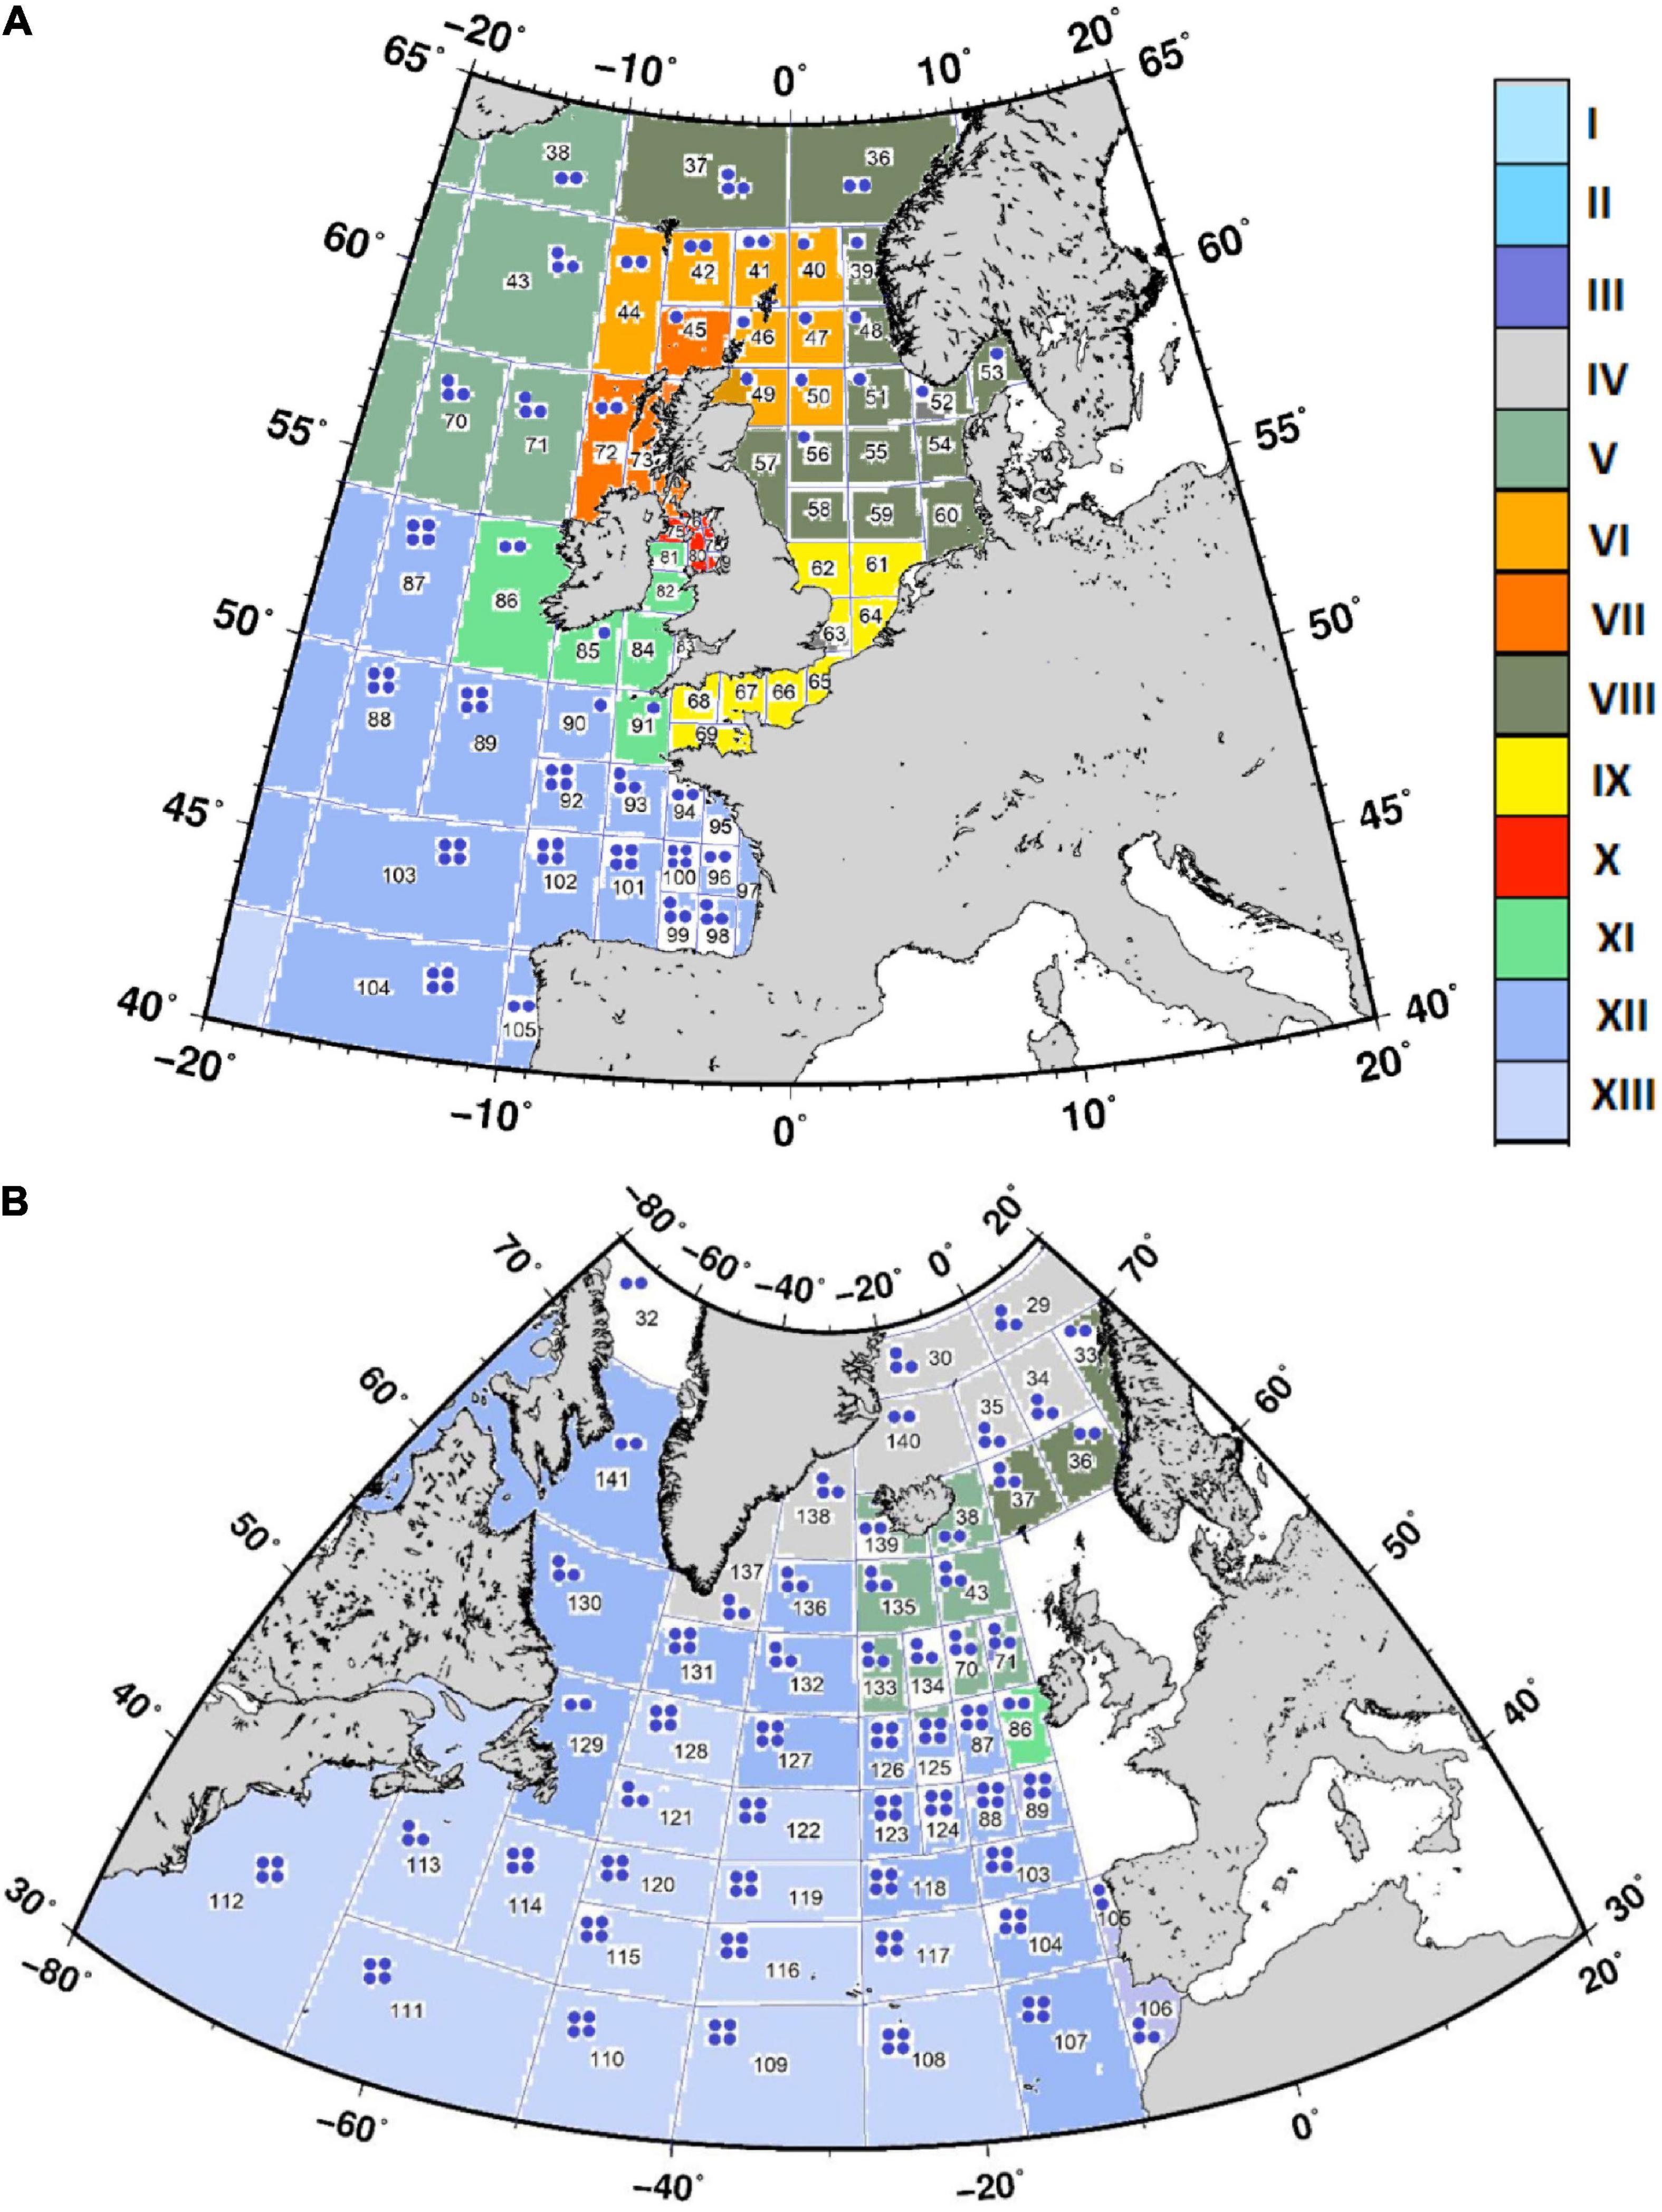
Figure 11. The regions allocated in the North Sea area (A) and the North Atlantic (B) as a result of the classification.
Region V (East Atlantic) is located between Iceland and Ireland, where the North Atlantic Current splits into Atlantic/Norwegian currents and the Irminger Current, as shown in Figure 3B. The three main sources (global deposition, release from Sellafield, and 137Cs outflow of Chernobyl origin from the North Sea) were comparable in different periods, as shown in Supplementary Figure 4 (etalon Box no. 43). Flows in Region VI (Faroe-Shetland Channel), indicated in Figure 11, transported essentially diluted 137Cs from Sellafield. Part of the flow turns into the North Sea. The etalon Box no. 44 in Supplementary Figure 4 shows only one maximum concentration. Only one maximum existed in Region VII (Malin Sea), which was contaminated by Sellafield plant release in 1970–1990. The main sources of contaminated water in the northern North Sea (Region VIII) were global deposition, release from the Cap de La Hague and Sellafield plants, and regional Chernobyl deposition, as shown in Supplementary Figure 4 (etalon Box no. 55). Region IX is located in the southern North Sea and English Channel. The effects of global deposition and release from the Cap de La Hague and Sellafield plants were comparable, as seen in Supplementary Figure 4 (etalon Box no. 66). In the Irish Sea (Region X), the Sellafield release dominated, as shown in Supplementary Figure 4 (etalon Box no. 76). Region XI is located in the southern Irish Sea and Celtic Sea. Here, both global deposition and outflow of contaminated water from Sellafield were important, as shown in Supplementary Figure 4 (etalon Box no. 85). Region XII is the area covering a wide strip of water formed by the spreading of the waters of the North Atlantic Current and entraining in the Subpolar and Subtropical gyres (see Figure 3B). Region XIII covers the Subtropical Gyre where global deposition dominated, as seen in Supplementary Figure 4 (etalon Box no. 125).
Conclusion
The POSEIDON-R compartment model was applied to the North Atlantic and Arctic oceans to reconstruct 137Cs contamination in 1945–2020 due to multiple sources: global fallout from atmospheric nuclear weapon tests, exchange flows with other oceans, point-source inputs in the ocean from reprocessing plants and other nuclear facilities, the impact of the Chernobyl accident and secondary contamination resulting from river runoff. The simulation results were validated using the marine database MARIS (2021). The POSEIDON-R model simulated the marine environment as a system of 3D compartments comprising the water column, bottom sediment, and biota. The dynamic model described the transfer of 137Cs through the pelagic and benthic food chains. The total number of boxes covering the North Atlantic/Arctic oceans was 159, with a multilayer layer water column structure and three layers of bottom sediment. Advective and diffusional water transport between boxes was calculated by averaging three-dimensional currents from the CMEMS (2021) reanalysis over 10 years (2008–2017).
The contribution from different sources varied over time and depended on the ocean region. Model results were used for the analysis of the impact of each considered source on the total concentration of 137Cs in non-piscivorous fish in the regions of interest. Whereas the contribution from global fallout dominated in 1960–1970, in 1970–1990, the contribution of 137Cs released from reprocessing plants exceeded the contributions from other sources in almost all considered regions. Secondary contamination due to river runoff was less than 4% of ocean influx for the Arctic Ocean, where several large rivers flow. The maximum total inventory in the Arctic Ocean (31,122 TBq) was reached in 1988, whereas the corresponding inventory in the bottom sediment was approximately 6% of the total. The gradual purification of water in the Arctic Ocean occurred due to the removal of water into the North Atlantic, deposition of 137Cs at the bottom, and decay.
Particular attention has been given to the Barents Sea due to the impact of various contamination sources and the importance of fisheries. The first maximum 137Cs concentration in water caused by global fallout was observed in 1963, whereas the second maximum 137Cs concentration in water in 1980–1985 was due to the influx of contaminated water from the Sellafield reprocessing plant. The last maximum in 1986–1987 was associated with Chernobyl deposition and subsequent inflow of Chernobyl contamination from the North Atlantic by currents. The concentration in coastal predators (represented by cod, Gadus morhua) lagged behind the concentration in water as a result of their diet that includes both pelagic and benthic organisms feeding on organic matter in the bottom sediments.
The general agreement between simulated and observed 137Cs concentrations in water and bottom sediment in the North Atlantic and Arctic oceans was confirmed by the estimates of GM and GSD values, which varied from 0.89 to 1.29 and from 1.22 to 1.87, respectively. This confirmed that the approach used is useful in synthesizing measurement and simulation data. A useful application of the modeling for monitoring purposes was the selection of 13 representative regions in the North Atlantic and Arctic oceans using the “etalon” method for classification.
The considered model can be a tool for estimating contamination and corresponding dose estimates in the event of potential accidents related to sunken submarines and dumped radioactive material. An important model application is predicting contamination due to climate warming when radionuclides buried in glaciers leak into the sea as a result of glacial melting (Miroshnikov et al., 2017; Zaborska, 2017; Matishov et al., 2018). In addition, significant changes in the circulation and corresponding transport of radionuclides in the North Atlantic and Arctic oceans should be expected (Johannessen et al., 2010) due to climate warming.
Data Availability Statement
Publicly available datasets were analyzed in this study. This data can be found here: https://maris.iaea.org/home.
Author Contributions
VlM designed the study and wrote the manuscript with support from all authors. RB contributed to the method development, simulation, and interpretation of the results. KK contributed to the simulation data analysis. KJ contributed to the data collection and manuscript editing. VaM wrote the code and carried out classification. IB contributed to the processing of circulation data and interpretation of the results. All authors contributed to the article and approved the submitted version.
Funding
This study was partially supported by the National Research Foundation of Ukraine project no. 2020.02/0048 (VlM), Grant for the Group of Young Scientists from the National Academy of Sciences of Ukraine (RB), KIOST major project PE99912 (KK), IAEA CRP K41017 (VlM), and the European Union’s Horizon 2020 research and innovation programme under grant agreement no. 101003590 (IB).
Conflict of Interest
KJ was employed by the company Oceanic Consulting and Trading.
The remaining authors declare that the research was conducted in the absence of any commercial or financial relationships that could be construed as a potential conflict of interest.
Publisher’s Note
All claims expressed in this article are solely those of the authors and do not necessarily represent those of their affiliated organizations, or those of the publisher, the editors and the reviewers. Any product that may be evaluated in this article, or claim that may be made by its manufacturer, is not guaranteed or endorsed by the publisher.
Supplementary Material
The Supplementary Material for this article can be found online at: https://www.frontiersin.org/articles/10.3389/fmars.2021.806450/full#supplementary-material
References
AMAP (1998). AMAP Assessment Report: Arctic Pollution Issues. Oslo: Arctic Monitoring and Assessment Programme (AMAP).
AMAP (2004). AMAP Assessment 2002. Radioactivity in the Arctic. Oslo: Arctic Monitoring and Assessment Programme (AMAP).
AMAP (2010). AMAP Assessment 2009: Radioactivity in the Arctic. Oslo: Arctic Monitoring and Assessment Programme (AMAP).
AMAP (2016). AMAP Assessment 2015: Radioactivity in the Arctic. Oslo: Arctic Monitoring and Assessment Programme (AMAP), vii+89.
Aoyama, M. (2018). Long-range transport of radiocaesium derived from global fallout and the Fukushima accident in the Pacific Ocean since 1953 through 2017—Part I: source term and surface transport. J. Radioanal. Nucl. Chem. 318, 1519–1542. doi: 10.1007/s10967-018-6244-z
Bezhenar, R., Jung, K. T., Maderich, V., Willemsen, S., de With, G., and Qiao, F. (2016). Transfer of radiocesium from contaminated bottom sediments to marine organisms through benthic food chain in post-Fukushima and post-Chernobyl periods. Biogeosciences 13, 3021–3034.
Bezhenar, R., Maderich, V., Schirone, A., Conte, F., and Martazinova, V. (2019). Transport and fate of 137Cs in the Mediterranean and Black Seas system during 1945-2020 period: a modelling study. J. Environ. Radioact. 20:106023. doi: 10.1016/j.jenvrad.2019.106023
CEC (1990). The Radiation Exposure of the Population of the European Community from Radioactivity in North European Marine Waters. Project ‘Marina’, RP 47, EUR-12483. Luxembourg: Commission of the European Communities, 572.
CMEMS (2021). Copernicus Marine Environment Monitoring Service. Available online at: http://marine.copernicus.eu/ (accessed September 26, 2021).
EC (2002). MARINA II – Update of the MARINA Project on the Radiological Exposure of the European Community from Radioactivity in North European Marine Waters. Radiation Protection 132, Vol. II. Luxembourg: European Commission, 365.
Gwynn, J. P., Heldal, H. E., Gafvert, T., Blinova, O., Eriksson, M., Svaeren, I., et al. (2012). Radiological status of the marine environment in the Barents Sea. J. Environ. Radioact. 113, 155–162. doi: 10.1016/j.jenvrad.2012.06.003
IAEA (1995). Sources of Radioactivity in the Marine Environment and Their Relative Contribution to Overall Dose Assessment From Marine Radioactivity (MARDOS), IAEA-TECDOC-838. Vienna: IAEA, 54.
IAEA (2005). Worldwide Marine Radioactivity Studies (WOMARS). Radionuclide Levels in Oceans and Seas, IAEA-TECDOC-1429. Vienna: IAEA, 187.
Iosjpe, M., Brown, J., and Strand, P. (2002). Modified approach for box modelling of radiological consequences from releases into marine environment. J. Environ. Radioact. 60, 91–103. doi: 10.1016/s0265-931x(01)00098-4
Johannessen, O. M., Volkov, V. A., Pettersson, L. M., Maderich, V. S., Zheleznyak, M. J., et al. (2010). Radioactivity and Pollution in the Nordic Seas and Arctic Region. Observations, Modelling and Simulations. Springer Praxis Books Book Series (PRAXIS). Berlin: Springer, 408.
Kershaw. (2011). “Atlantic ocean,” in Radionuclides in Environment. Encyclopedia of Inorganic and Bioinorganic Chemistry, ed. D. Atwood (Hoboken, NJ: John Wiley & Sons), 361–373.
Kumamoto, Y., Aoyama, M., Hamajima, Y., Nishino, S., Murata, A., and Kikuchi, T. (2017). Radiocesium in the western subarctic area of the North Pacific ocean, Bering Sea, and Arctic ocean in 2015 and 2017. Polar Sci. 21, 228–232. doi: 10.1016/j.apradiso.2017.02.036
Lepicard, S., Heling, R., and Maderich, V. (2004). POSEIDON/RODOS model for radiological assessment of marine environment after accidental releases: application to coastal areas of the Baltic, Black and North seas. J. Environ. Radioact. 72, 153–161. doi: 10.1016/S0265-931X(03)00197-8
Leppanen, A.-P., Kasatkina, N., Vaaramaa, K., Matishov, G. G., and Solatie, D. (2013). Selected anthropogenic and natural radioisotopes in the Barents Sea and off the western coast of Svalbard. J. Environ. Radioact. 126, 196–208. doi: 10.1016/j.jenvrad.2013.08.007
Maderich, V., Bezhenar, R., Brovchenko, I., and Martazinova, V. (2020). “Classification of radioactivity levels in the regions of the World ocean using compartment modelling,” in Mathematical Modeling and Simulation of Systems. MODS 2019. Advances in Intelligent Systems and Computing, Vol. 1019, eds A. Palagin, A. Anisimov, A. Morozov, and S. Shkarlet (Cham: Springer), doi: 10.1007/978-3-030-25741-5_2
Maderich, V., Bezhenar, R., Tateda, Y., Aoyama, M., and Tsumune, D. (2018a). Similarities and differences of 137Cs distributions in the marine environments of the Baltic and Black seas and off the Fukushima Dai-ichi nuclear power plant in model assessments. Mar. Pollut. Bull. 135, 895–906. doi: 10.1016/j.marpolbul.2018.08.026
Maderich, V., Bezhenar, R., Tateda, Y., Aoyama, M., Tsumune, D., Jung, K. T., et al. (2018b). The POSEIDON-R compartment model for the prediction of transport and fate of radionuclides in the marine environment. MethodsX 5, 1251–1266. doi: 10.1016/j.mex.2018.10.002
MARIS (2021). Radioactivity and Stable Isotope Data in the Marine Environment. Available online at: http://maris.iaea.org (accessed October 5, 2021).
Martazinova, V. (2005). The classification of synoptic patterns by method of analogs. J. Environ. Eng. 7, 61–65.
Matishov, G. G., Ilyin, G. V., Usyagina, I. S., Valuyskaya, D. A., and Deryabin, A. A. (2018). Results of marine radioecological study of fjords of western Spitsbergen. Dokl. Earth Sci. 480, 679–684.
Matishov, G. G., Matishov, D. G., Usyagina, I. S., Kasatkina, N. E., and Pavel’skaya, E. V. (2011). Assessment of 137Cs and 90Sr fluxes in the Barents Sea. Doklady Earth Sci. 439(Pt 2), 1190–1195.
Miroshnikov, A. Y., Laverov, N. P., Chernov, R. A., Kudikov, A. V., Ysacheva, A. A., Semenkov, I. N., et al. (2017). Radioecological investigations on the Northern Novaya Zemlya archipelago. Oceanology 57, 204–214.
Mitchell, N. T., and Steele, A. K. (1988). The marine impact of caesium-134 and -137 from the Chernobyl reactor accident. J. Environ. Radioact. 6, 163–175.
Nyffeler, F., Cigna, A. A., Dahlgaard, H., and Livingston, H. D. (1996). “Radionuclides in the Atlantic ocean: a survey,” in Radionuclides in the Oceans, Inputs and Inventories, eds P. Guegueniat and P. Germain (Paris: Les Editions de Physique), 1–28.
OSPAR (2021). Discharges From Nuclear Installations. Available online at: https://www.ospar.org/work-areas/rsc/nuclear-discharges (accessed October 5, 2021).
Østerhus, S., Woodgate, R., Valdimarsson, H., Turrell, B., de Steur, L., Quadfasel, D., et al. (2019). Arctic Mediterranean exchanges: a consistent volume budget and trends in transports from two decades of observations. Ocean Sci. 15, 379–399. doi: 10.5194/os-15-379-2019
Periáñez, R., Bezhenar, R., Brovchenko, I., Duffa, C., Iosjpe, M., Jung, K. T., et al. (2019). Marine radionuclide transport modelling: recent developments, problems and challenges. Environ. Model. Softw. 122:104523. doi: 10.1016/j.envsoft.2019.104523
Sayles, F. L., Livingston, H. D., and Panteleyev, G. P. (1997). The history and source of particulate 137Cs and 239,240Pu deposition in sediments of the Ob River Delta, Siberia. Sci. Total Environ. 202, 25–41. doi: 10.1016/s0048-9697(97)00102-2
Semenkov, I., and Miroshnikov, A. (2015). Sources of cesium-137 pollution of bottom sediments in the Kara Sea continental catchment, Russia. Int. J. Res. Environ. Sci. 1, 19–29.
Smith, J. N., Brown, R. M., Williams, W. J., Robert, M., Nelson, R., and Moran, S. B. (2015). Arrival of the Fukushima radioactivity plume in North American continental waters. Proc. Natl. Acad. Sci. U.S.A. 112, 1310–1315. doi: 10.1073/pnas.1412814112
Smith, J. N., Ellis, K. M., Polyak, L., Ivanov, G., Forman, S. L., and Moran, S. B. (2000). 239,240Pu transport into the Arctic ocean from underwater nuclear tests in Chernaya Bay, Novaya Zemlya. Cont. Shelf Res. 20, 255–279.
Smith, J. T., Wright, S. M., Cross, M. A., Monte, L., Kudelsky, A. V., Saxen, R., et al. (2004). Global analysis of the riverine transport of 90Sr and 137Cs. Environ. Sci. Technol. 38, 850–857. doi: 10.1016/j.scitotenv.2014.06.136
UNSCEAR (2000). Exposures of the Public From Man-Made Sources of Radiation. In: Sources and Effects of Ionizing Radiation. New York, NY: United Nations.
Vakulovsky, S. M., Kryshev, I. I., Nikitin, A. I., Savitsky, Y. V., Malyshev, S. V., and Tertyshnik, E. G. (1995). Radioactive contamination of the Yenisei River. J. Environ. Radioact. 29, 225–236.
Zaborska, A. (2017). Sources of 137Cs to an arctic fjord (Hornsund, Svalbard). J. Environ. Radioact. 180, 19–26. doi: 10.1016/j.jenvrad.2017.09.021
Zaborska, A., and Carroll, J. (2011). “Arctic ocean,” in Radionuclides in environment. Encyclopedia of Inorganic and Bioinorganic Chemistry, ed. D. Atwood (Hoboken, NJ: John Wiley & Sons), 389–399.
Keywords: North Atlantic, Arctic Ocean, Nordic Seas, 137Cs, compartment model, dynamic food web model, classification
Citation: Maderich V, Kim KO, Bezhenar R, Jung KT, Martazinova V and Brovchenko I (2021) Transport and Fate of 137Cs Released From Multiple Sources in the North Atlantic and Arctic Oceans. Front. Mar. Sci. 8:806450. doi: 10.3389/fmars.2021.806450
Received: 31 October 2021; Accepted: 08 December 2021;
Published: 23 December 2021.
Edited by:
Jixin Qiao, Technical University of Denmark, DenmarkReviewed by:
Neven Cukrov, Ruđer Bošković Institute, CroatiaLuca Giorgio Bellucci, National Research Council (CNR), Italy
Copyright © 2021 Maderich, Kim, Bezhenar, Jung, Martazinova and Brovchenko. This is an open-access article distributed under the terms of the Creative Commons Attribution License (CC BY). The use, distribution or reproduction in other forums is permitted, provided the original author(s) and the copyright owner(s) are credited and that the original publication in this journal is cited, in accordance with accepted academic practice. No use, distribution or reproduction is permitted which does not comply with these terms.
*Correspondence: Vladimir Maderich, dmxhZG1hZEBnbWFpbC5jb20=