 Dong Li
 Bin Li
 Yuxin Zhang1,3,4
 He Xu
He Xu Xiyong Hou
- 1Yantai Institute of Coastal Zone Research, Chinese Academy of Sciences, Yantai, China
- 2Beijing VMinFull Limited, Beijing, China
- 3CAS Key Laboratory of Coastal Environmental Processes and Ecological Remediation, Yantai Institute of Coastal Zone Research, Chinese Academy of Sciences, Yantai, China
- 4Shandong Key Laboratory of Coastal Environmental Processes, Yantai, China
- 5University of Chinese Academy of Sciences, Beijing, China
In recent decades, large-scale reclamation projects have been performed in the intertidal flat area of Shanghai, China. Due to the self-weight consolidation of the foundation and dynamic load caused by human activities, the newly reclamation area will sink within a period of time after the land is formed. Therefore, it is necessary to carry out surface deformation monitoring for taking preventive measures in advance. In this research, the PS-InSAR technology, mostly used for urban subsidence monitoring, was applied to obtain the ground deformation information of Shanghai coastal area based on ENVISAT/ASAR (2007.07-2010.02) and Sentinel-1A (2017.07-2020.02) datasets. The results showed that: 1) Compared with ASAR data, the Sentinel-1A data could distinguish more coherent points and get more comprehensive deformation distribution characteristics. 2) Most high-coherent points were detected in artificial objects, especially airport runways, buildings, roads and seawalls. 3) There was obvious uneven land subsidence in the study area during the two monitoring periods, the PS points with high subsidence rates (<-20 mm/a) mainly distributed around Dishui Lake and artificial seawalls. 4) The ground subsidence velocity of the newly formed land gradually slowed down over times, with the average subsidence rate decreased from -10.45 mm/a to -4.94 mm/a. Our study proved that remote sensing monitoring for ground subsidence in reclaimed land could be realized based on PS-InSAR technology, which could provide the spatial distribution characteristics of subsidence in large-scale and long-term series and help the sustainable development of coastal engineering construction.
1 Introduction
Subsidence, the lowering of land surface, is a potentially damaging hazard, mainly resulting from a diversity of natural or man-made triggers (Herrera-García et al., 2021), such as settlement of loose sediments, compression of unconsolidated strata and overexploitation of underground resources (Li et al., 2020). At present, it has developed into one of the major global environmental geological disasters. For example, land subsidence occurs in 22 provinces (cities) in China including megacities such as Shanghai, whose maximum cumulative subsidence has reached 2.63 m from 1921 to 2013 (Ye et al., 2016). In Indonesia, the coastal of Jakarta has sunk by as much as 2.5 m in the past decade, and government authorities are planning to move the capital to the island of Borneo (Herrera-García et al., 2021). Other large cities in the world, such as Tokyo (Japan), Mexico City (Mexico), Houston (United States), Venice (Italy) and so on also suffer from land subsidence.
The direct or potential results of land subsidence involve aquifer systems degradation and damage to the utility infrastructure, buildings, roads, and bridges, threatening people’s lives and property (Zhang et al., 2019). Traditional land subsidence monitoring methods, such as ground leveling and GPS technique, are always single-point measurements (Luo et al., 2014), which are inefficient and not suitable for large-scale implementation. The interferometric synthetic aperture radar (InSAR) measurement technique, especially multi-temporal In-SAR (MT-InSAR), developed in recent years has significant advantages in spatiotemporal monitoring, and has been widely used in remote sensing inversion of land subsidence, with millimetric accuracy. Although the accuracy of monitoring points can be guaranteed, the traditional land subsidence monitoring methods have obvious shortcomings to achieve long-term land subsidence monitoring in large areas. The investment in manpower and material resources during the setting and implementation of monitoring point density, monitoring network range, and measurement frequency is much higher than that of InSAR measurement technique. Persistent scatterer InSAR (PS-InSAR) (Ferretti et al., 2000) and small baseline subset (SBAS) (Berardino et al., 2002) are the two most widely utilized MT-InSAR technique. Especially, the PS-InSAR method focuses on the temporally coherent radar targets in a time series of SAR images (Liu et al., 2009), which are regarded as persistent scatterers (PS). It is mostly applied in urban subsidence monitoring because of dense man-made buildings usually giving out a stable signal phase, easy to be detected as PS. There have been a great number of application cases of using PS-InSAR in land subsidence, providing valuable insights for urban sustainable development planning and subsidence control policy formulation. Malik et al. (2022) estimated the ground subsidence of New Delhi, India, finding a twenty centimeter of land settlement in some areas, and indicated that compared with ground-based conventional technology, PS-InSAR method is time-saving and can be carried out in a limited area due to the financial implication. Agarwal et al. (2021) used PS-InSAR methodology to study land movement for London, which is closely related to groundwater level, suggesting that the PS-InSAR inversion results could help to examine the potential implications of ground-level movement on the city’s resource management, safety, and economics. Moreover, it was demonstrated the validity of the PS-InSAR technique as a monitoring way to investigate the space-time evolution of surface deformation patterns during tunneling activities (Ramirez et al., 2022).
Compared with inland areas, the disaster risk caused by land subsidence in low-level coastal zones is more significant. In addition to the above-mentioned disasters, in coastal zones, the combined effects of land subsidence and absolute sea level rise contribute to relative sea level rise (Syvitski et al., 2009), leading to seawater intrusion, soil salinization and inundation hazard. Therefore, the monitoring and control of land subsidence in the coastal zone is more urgent. Shanghai is a typical city with land subsidence in China’s coastal zone, with a history of subsidence for about a hundred years. The local government had taken various measures, such as reduce of groundwater exploitation, artificial recharge of groundwater to control subsidence in the central urban area, making it with a low settlement rate (about -6 mm/a) (Wang and Jiao, 2015). However, the ground subsidence of suburbs, especially the reclamation area, has not been paid enough attention. At present, Shanghai has the largest newly reclaimed land in China’s coastal areas (Wu et al., 2020). Dredger fill in the reclamation area is characterized by high porosity, high compressibility, high water content, low permeability, and a low bearing capacity (Yuan et al., 2018). After dredged soils are deposited, consolidation can occur not only in dredger fill but also in underlying soil layers. As a result, land subsidence is an unavoidable problem (Yu et al., 2020). However, subsidence monitoring network is imperfect or even missing in most of the newly reclaimed zones. Limited distribution of benchmarks and GPS measurements with low sampling frequency are deficient to analyze the spatiotemporal features of subsidence in macro-scale level (Zhao et al., 2019). It is necessary to use remote sensing means to monitor land subsidence in reclaimed areas. There have been some reports on the analysis of ground deformation in Shanghai coastal zone through In-SAR technology. For instance, Zhao et al. (2019) evaluated the ground displacement of Shanghai coastal area in the period of 2007-2017, Ding et al. (2020) analyzed the land subsidence velocity of ocean-reclaimed lands from 2007 to 2016, and Yu et al. (2020) obtained the map of velocity distribution and accumulated deformation of ground deformation in reclamation area over a 5-year period (2015-2019). Previous research mostly applied the SBAS method to perform remote sensing inversion of subsidence in reclamation area. There are few studies on the settlement analysis using PS-InSAR method and the status of recent subsidence are unknown. In fact, roads, airport, seawalls and buildings, easily being identified as PS targets, provide the basis for the effective application of PS-InSAR technique. They form the basic structure of the Shanghai reclamation area, and their subsidence features basically reflect the situation of the whole area.
Therefore, the goal of this research is to (1) explore the feasibility of PS-InSAR technique in inversion of land subsidence in Shanghai reclamation area; (2) compare the performance differences between two kinds of SAR data (ENVISAT/ASAR and Sentinel-1A) in subsidence inversion and (3) clarify the spatial distribution characteristics and development trend of ground subsidence in different periods. This paper is organized as follows. Section 2 describes the materials and methods, including the introduction of the study area, the data used and PS-InSAR technique. Main results of this research are displayed and discussed in Section 3 and 4. Finally, the conclusions are presented in Section 5.
2 Materials and methods
2.1 Study area
Shanghai is located at the Yangtze River Delta, eastern coast of China (Figure 1). The sediments carried by the Yangtze River are deposited because of the comprehensive effect of the widened river, seawater support and flocculation phenomenon, creating natural conditions for coastal land reclamation (Jiang et al., 2002; Yu et al., 2020). Shanghai has undertaken large-scale land reclamation along coast in recent decades to meet the growing demands of rapid industrial and urban development (Ma et al., 2018).
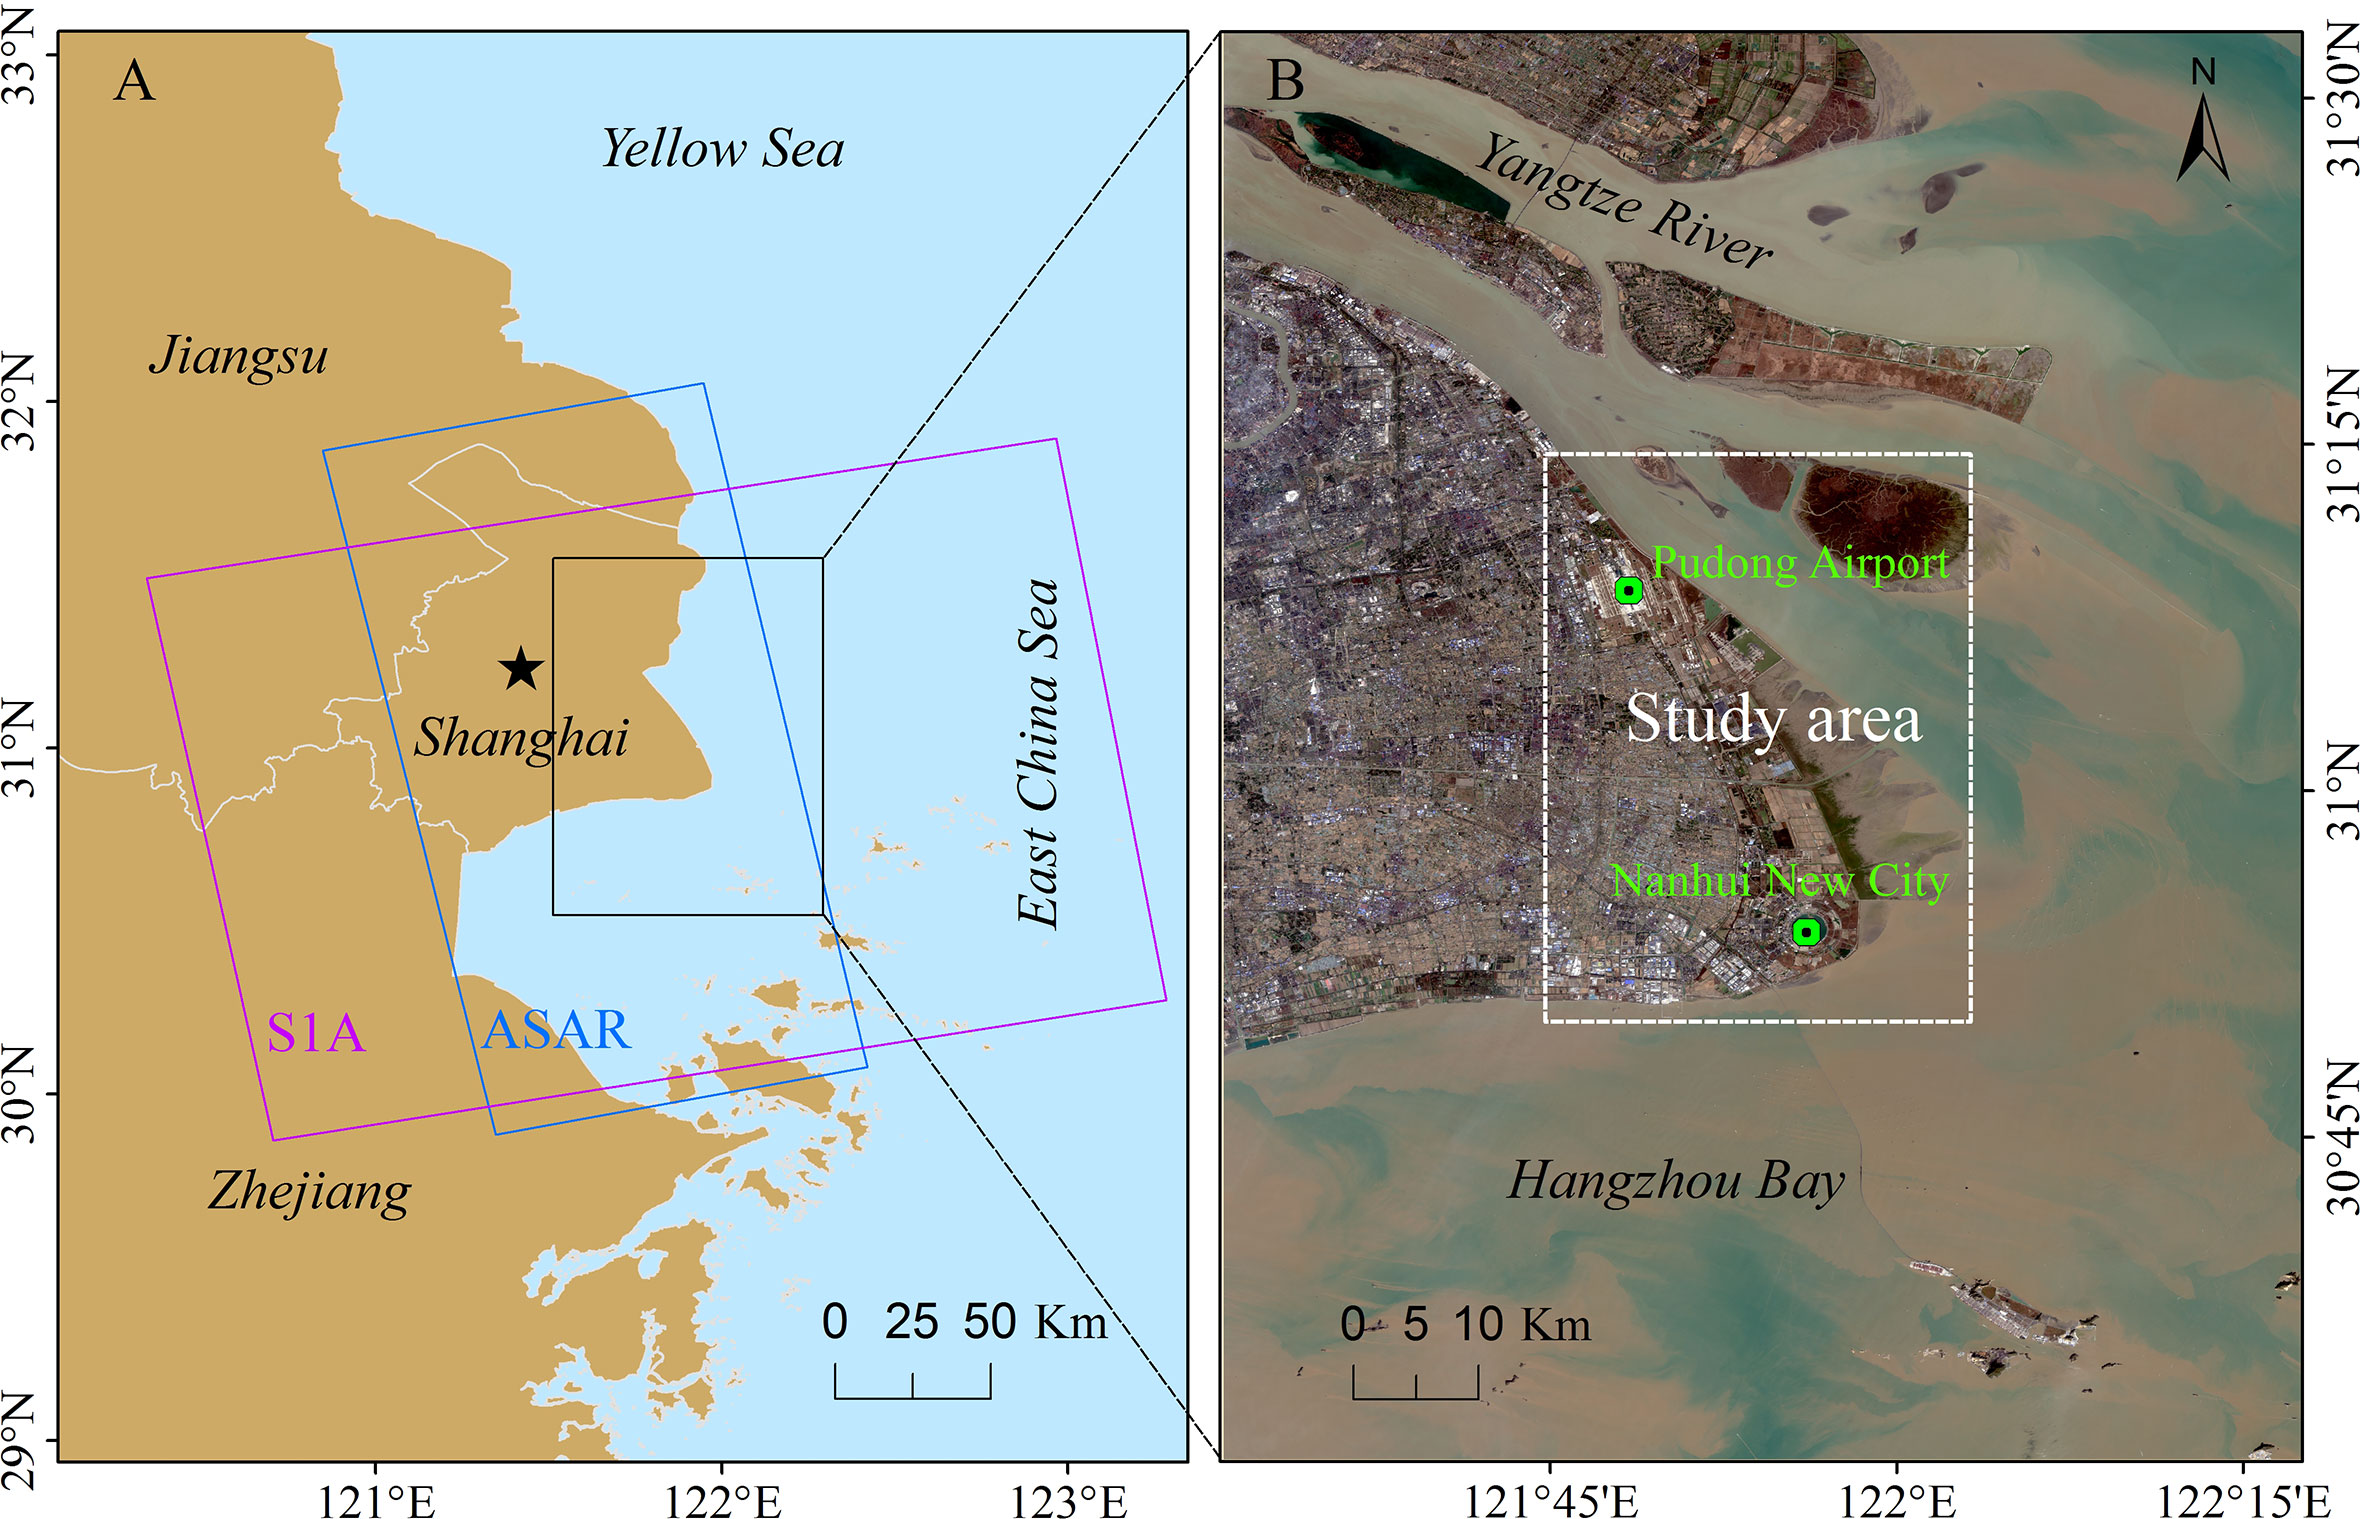
Figure 1 (A) Location of Shanghai city with the coverage of the datasets used; and (B) the study area outlined by a white rectangle.
In our research, the eastern coastal zone was selected as the study area (Figure 1), where several magnificent reclamation projects have been carried out in recent years (Figures 2A-E). The main projects include: (1) Pudong Airport Reclamation Project (1995-2001), (2) Lingang New City Reclamation Project (1999-2004), (3) Reclamation Project outside Pudong Airport (1999-2006), (4) Nanhui Dongtan Reclamation Project (2007-2009) and (5) the Second Phase Project of Nanhui Dongtan Reclamation (2016-2020). These projects are represented by Project I, II, III, IV and V respectively in the following text.
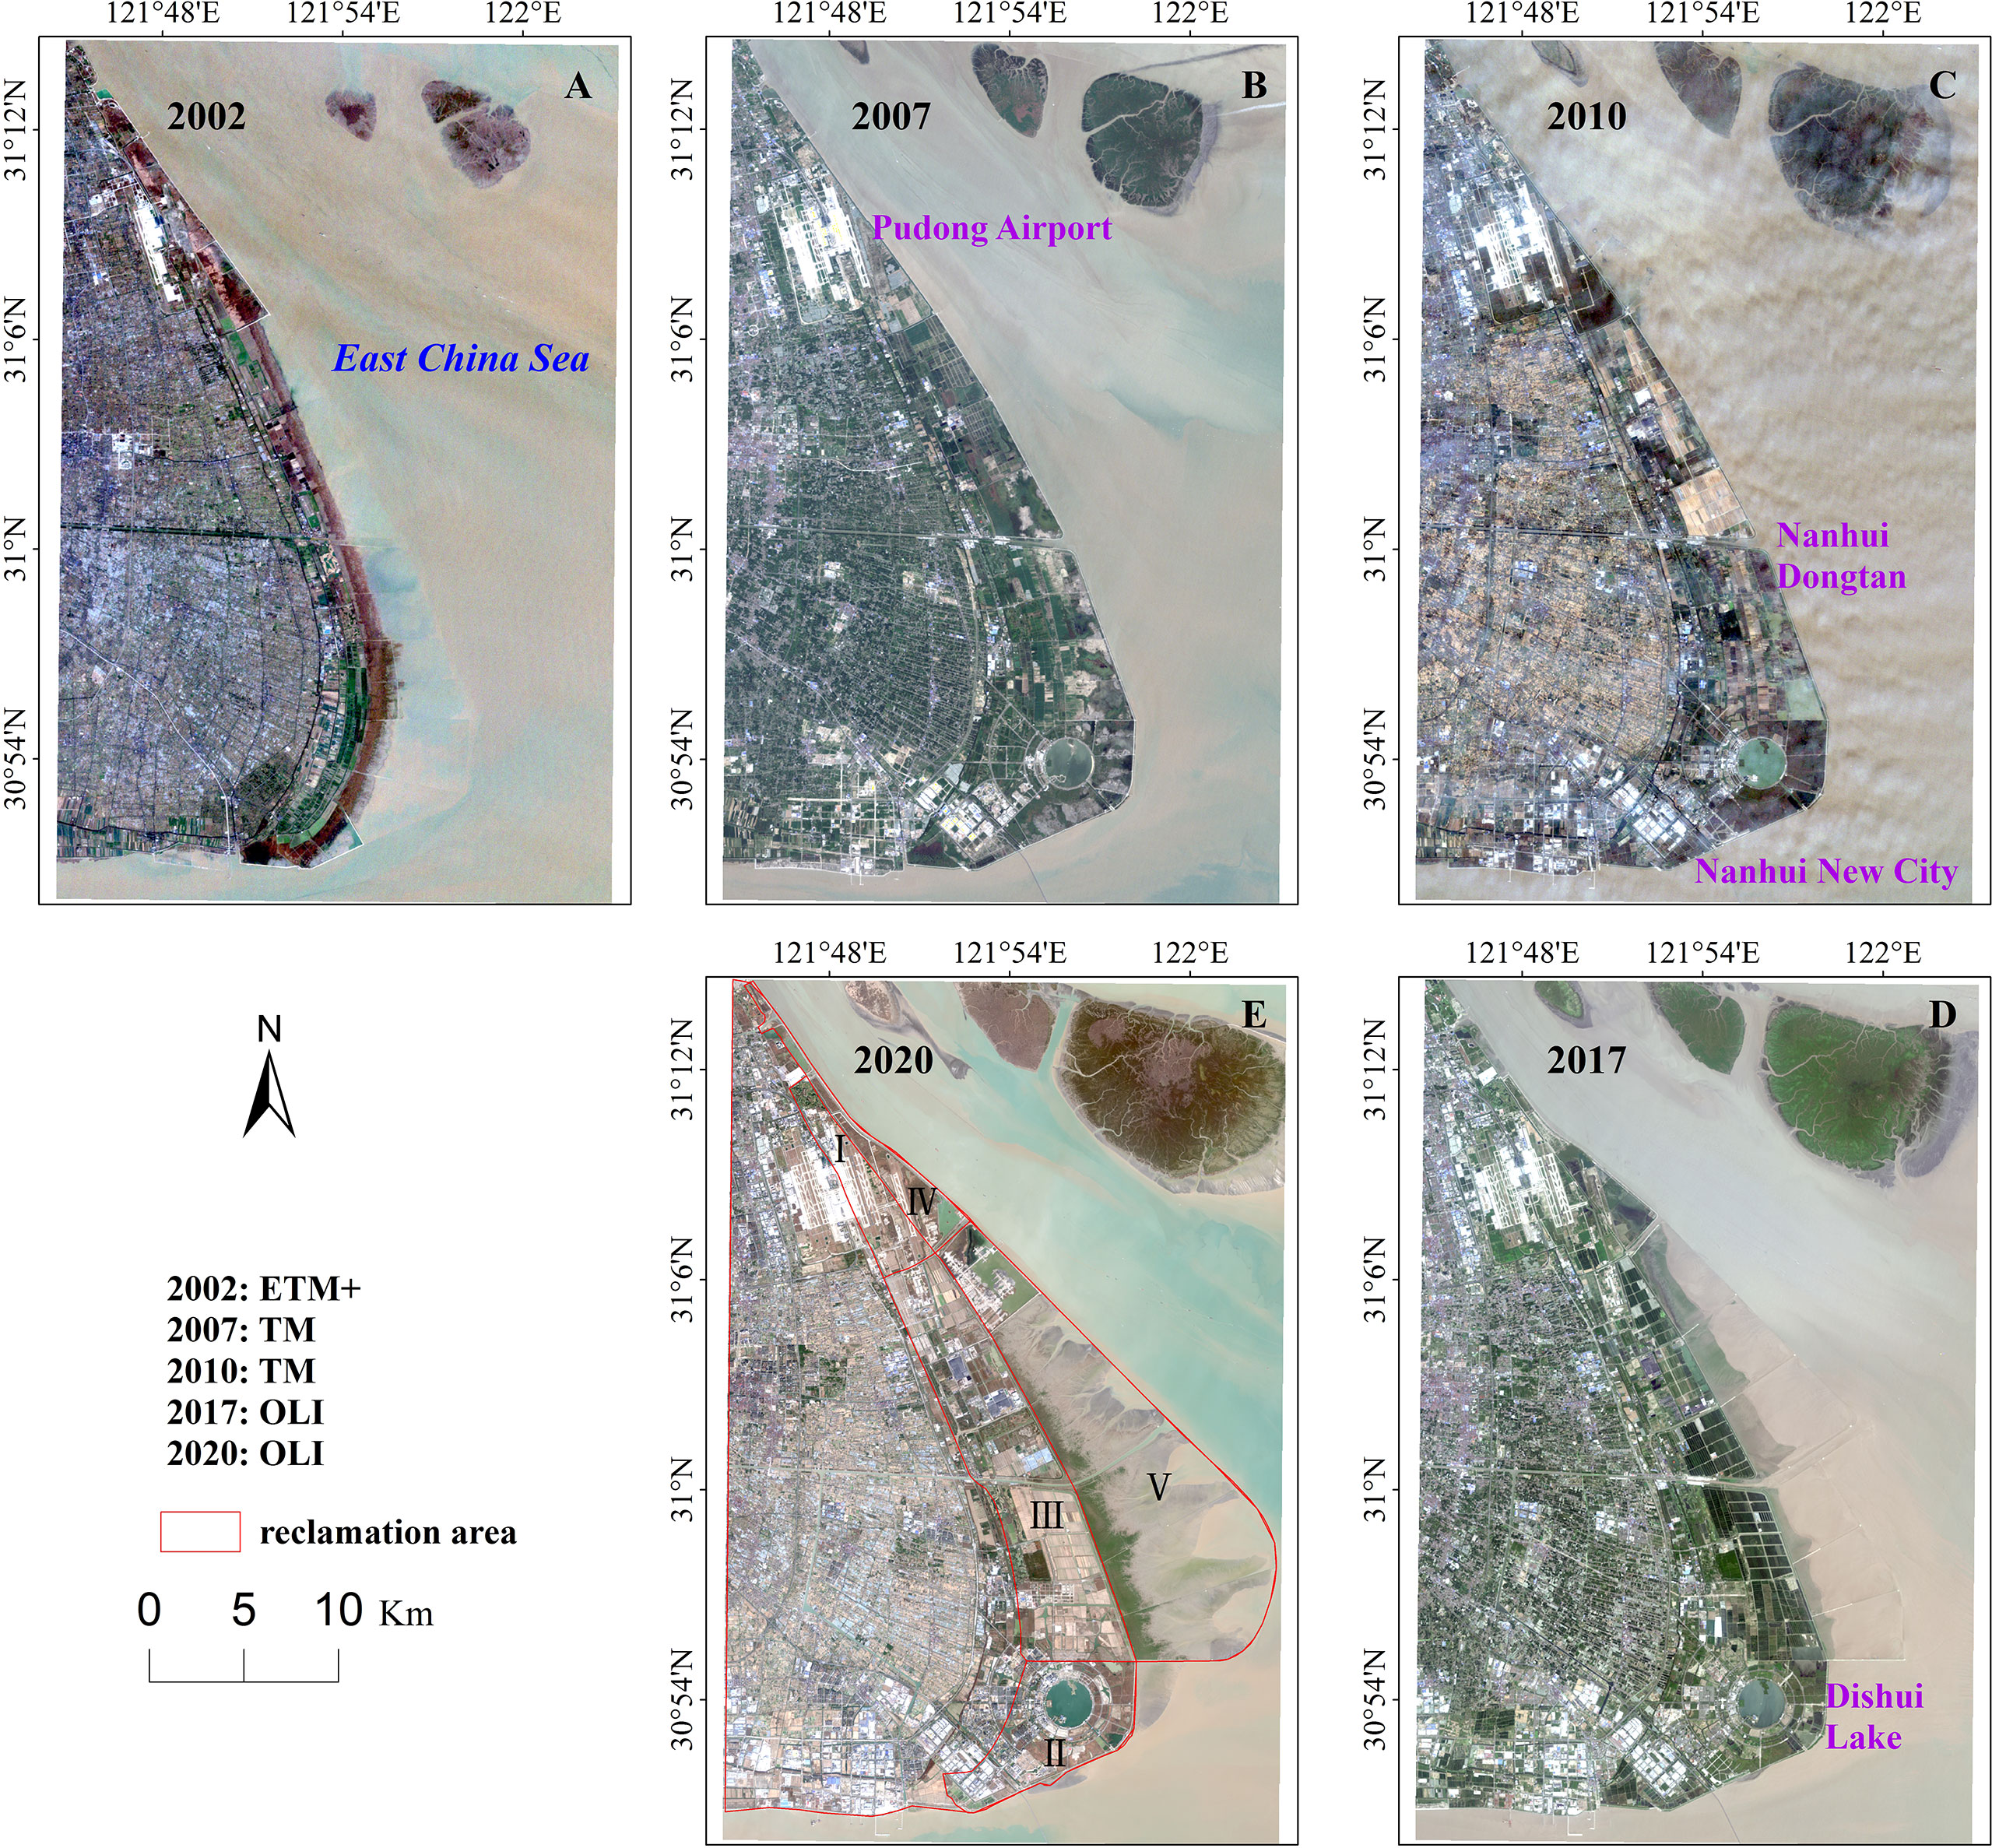
Figure 2 Satellite monitoring of land reclamation along the east coast of Shanghai from 2002 to 2020 (A–E). The reclamation projects, including (1) Pudong Airport Reclamation Project (1995-2001), (2) Lingang New City Reclamation Project (1999-2004), (3) Reclamation Project outside Pudong Airport (1999-2006), (4) Nanhui Dongtan Reclamation Project (2007-2009) and (5) the Second Phase Project of Nanhui Dongtan Reclamation (2016-2020), are represented by Project I, II, III, V and VI, respectively in (E).
Dense man-made facilities are mainly distributed in the reclamation areas of Project I and II, i.e., Pudong Airport and Nanhui New City were constructed on these two reclaimed lands. Pudong Airport with an area of 40 km2 was built on an old and recently reclaimed land formed by both artificial fill materials and natural sediments (Jiang et al., 2016). As the largest hub airport in East China, it currently has five runways (R1-R5) and two terminals (T1-T2). Nanhui New City, 37 km from Pudong Airport, is located at the intersection of Hangzhou Bay and the mouth of Yangtze River. The total planned area of the new satellite city is about 312 km2, nearly 42% created through reclamation projects (Yang et al., 2018; Ding et al., 2020). Some commercial complex, residential districts, parks, new university campuses and supporting facilities have been built around Dishui Lake, the landmark of Nanhui New City. The density of artificial buildings in the other 3 reclaimed projects is relatively small, mainly including seawalls along the coastline and scattered ecological agricultural land, waste comprehensive utilization base and other environmental protection land.
2.2 Data description
Two different SAR datasets, ENVISAT/ASAR from July 2007 to February 2010 (25 images) and Sentinel-1A from July 2017 to February 2020 (32 images), both working in the C-band, were used to get ground deformation in the study area. The coverage of these two types of data is shown in Figure 1 and some of their parameters are listed in Supplementary Table S1.
In the process of land subsidence inversion based on PS-InSAR method, the corresponding precise orbit determination ephemerides released by Europe Space Agency (ESA) were adopted to perform the orbital refinement and phase reflattening procedure. The Shuttle Radar Topography Mission (SRTM) data product with a spatial resolution of 30 m, provided by U.S. Geological Survey (USGS) was utilized to remove topographic phase. In addition, Google Earth images, multi-spectral Sentinel-2A image and field survey were used to explain PS-InSAR results.
2.3 PS-InSAR method
PS-InSAR distinguishes the PS points by analyzing the amplitude and phase variation in a series of interferograms, produced by a group of SAR image pairs (Chen et al., 2018). These PS points, with stable phase information over long time periods, are selected for generating a displacement velocity map at a millimeter level (Jiang et al., 2016).
During the PS-InSAR processing, a Delaunay triangle network is created from the PS points (Hooper et al., 2004). The wrap phase at the point i in the k th interferogram is expressed by the following formula (Chen et al., 2022):
where W{·} means the wrapping operator, is the phase from ground deformation, stands for the phase related to height errors, indicates the phase caused by orbit errors, denotes the atmospheric phase delay, and represents the noise.
Topographic phase can be removed using external DEM, while the phase associated with orbit and atmosphere will be separated through spatial and temporal filtering. At last, displacement phase in sequence time and average deformation velocity of line-of-sight (LOS) direction are gained. The phase change caused by PS deformation can be expressed as follows (Chen et al., 2022):
where λ means radar signal’s wavelength, and DefLOS represents deformation of LOS direction. A detailed description of the PS-InSAR method is given in Ferretti et al. (2000).
In this research, the PS-InSAR was applied to process the two kinds of datasets, which is incorporated into the ENVI platform through the SARScape module. The PS-InSAR processing steps are summarized in Li et al. (2020) and spatio-temporal baselines of interferometric pairs of the two datasets are shown in Figure 3.
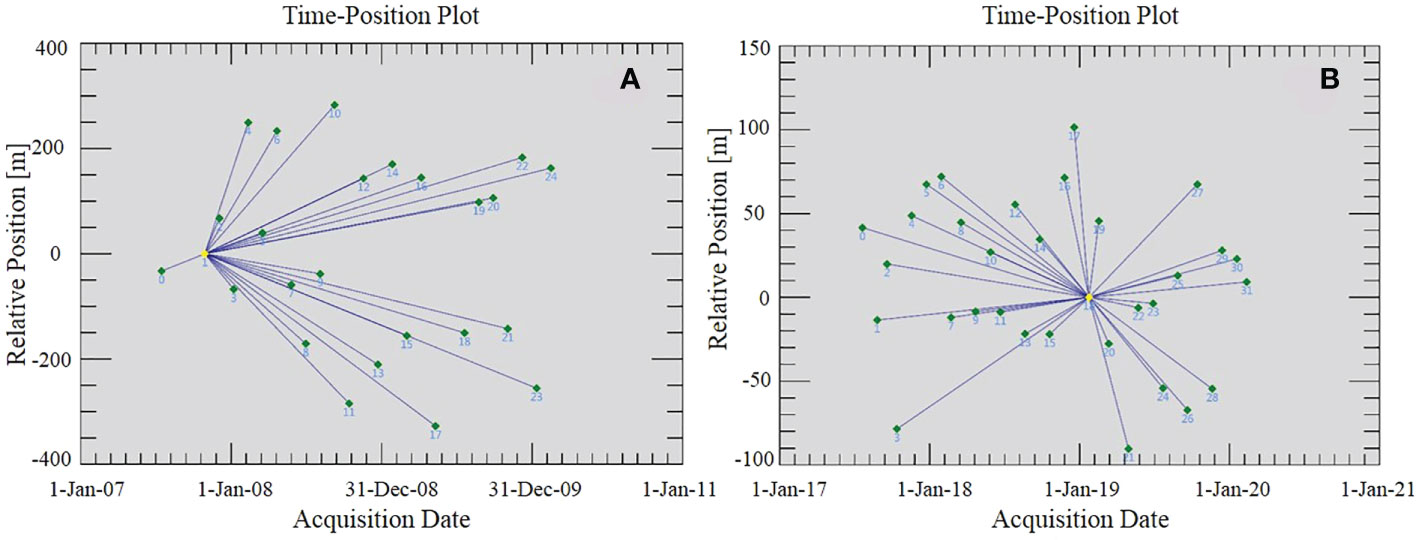
Figure 3 Temporal and spatial baseline distribution of (A) ENVISAT/ASAR and (B) Sentinel-1A interferograms based on PS-InSAR method. The blue lines stand for the interferometric pairs, the yellow diamond represents the super master image and the green diamonds indicate slave images.
3 Results
3.1 Precision evaluation
The available ENVISAT/ASAR and Sentinel-1A datasets were processed using the PS-InSAR technique, described in Section 2.3.
In the study area, there were 244,330 and 626,097 PS points detected in the two periods of 2007-2010 and 2017-2020, respectively. In order to assess the accuracy of the PS-InSAR technology, the standard deviation value of the PS points’ velocity in the LOS direction were calculated for the two datasets. The formula used for the precision calculation is:
where γ is the interferometric coherence. This output product, which is derived from parameters such as coherence and wavelength, provides an estimate of the measurement precision. The lower this value the higher the measurement precision.
Results showed that the P values for both datasets were in the low range (Figure 4), less than 2.0 mm/a. The standard deviation value of the derived velocity for ASAR PS points was between 0.03 mm/a to 1.99 mm/a, while the Sentinel-1 PS points was 0.19 mm/a to 1.73 mm/a. In the study area, for nearly 60% of the ASAR and more than 93% of the Sentinel-1A PS points, the standard deviation was less 1 mm/a, suggesting the PS points retained a relatively high precision and deformation derived by PS-InSAR are reliable.
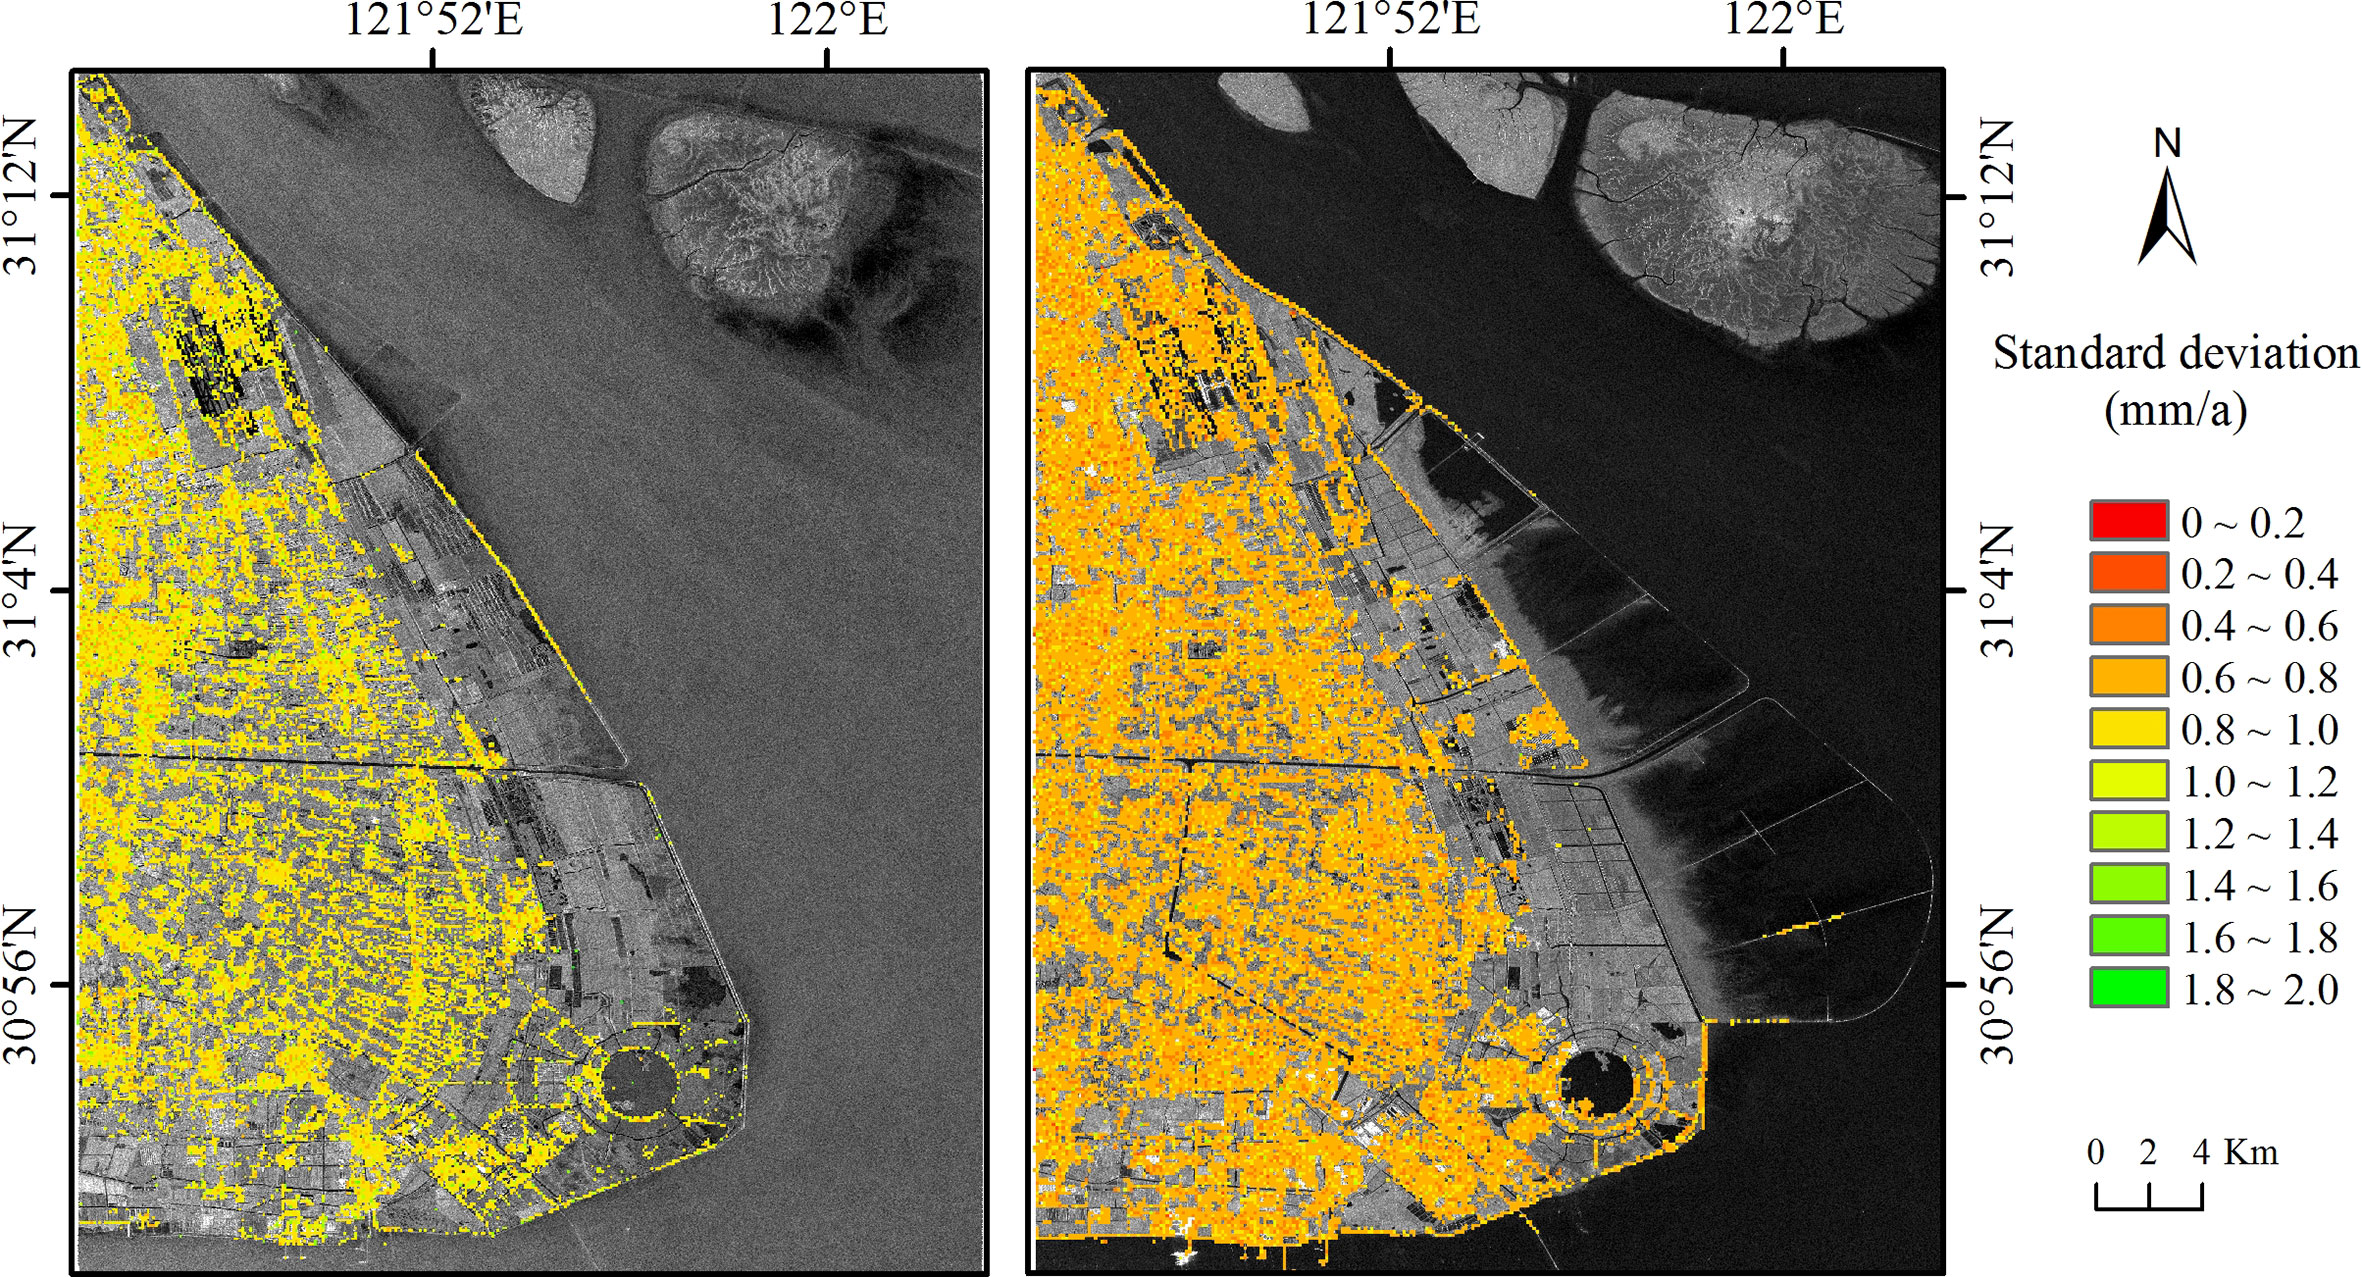
Figure 4 Distribution of the standard deviation of the velocity for PS points in the direction of LOS.
3.2 Comparison of results gained from the two datasets
These detected PS points were mainly distributed in man-made objects. It is evident that more PS points existed in the non-reclamation area than in the reclamation zone (Figure 5). In particular, in the zone of Project I and IV, most stable targets were detected in Pudong Airport and corresponding infrastructure; in Project II, Nanhui New City with a great quantity of buildings and roads contributed a large percentage of PS points, while in Project III and V, a part of high-coherent points were linearly distributed on the seawalls. Table 1 showed the statistical results of PS points in different reclamation areas during the two periods. On the whole, the PS points acquired from Sentinel-1A in the period of 2017-2020 were more than that of ASAR from 2007-2010. In Project I, the density of PS points obtained from Sentinel-1A dataset was 447.62 units/km2, and ASAR was 257.85 units/km2, respectively. Likewise, in Project II, the Sentinel-1A PS points density was also significantly higher than that from ASAR, reaching 5.83 times. In the zone of Project III, the number of PS points were 5,312 and 11,157 in the two periods, respectively. Combined with the Google image map, it is found that in the period of 2017-2020, except for the seawall, there were more PS points distributed on the factory buildings, which belonged to some new companies such as garbage disposal company and ecological agriculture development company. In Project IV, the Sentinel-1A PS points density was 173.33 units/km2, and the ASAR was 75.26 units/km2. Objectively, because of Project V starting on the year of 2016, there were no PS points during the period of 2007-2010 in the zone of Second Phase Project of Nanhui Dongtan Reclamation. The high-coherent points from 2017 to 2020 were mainly detected on artificial seawalls, such as breakwater and diversion dike in the zone of Project V.
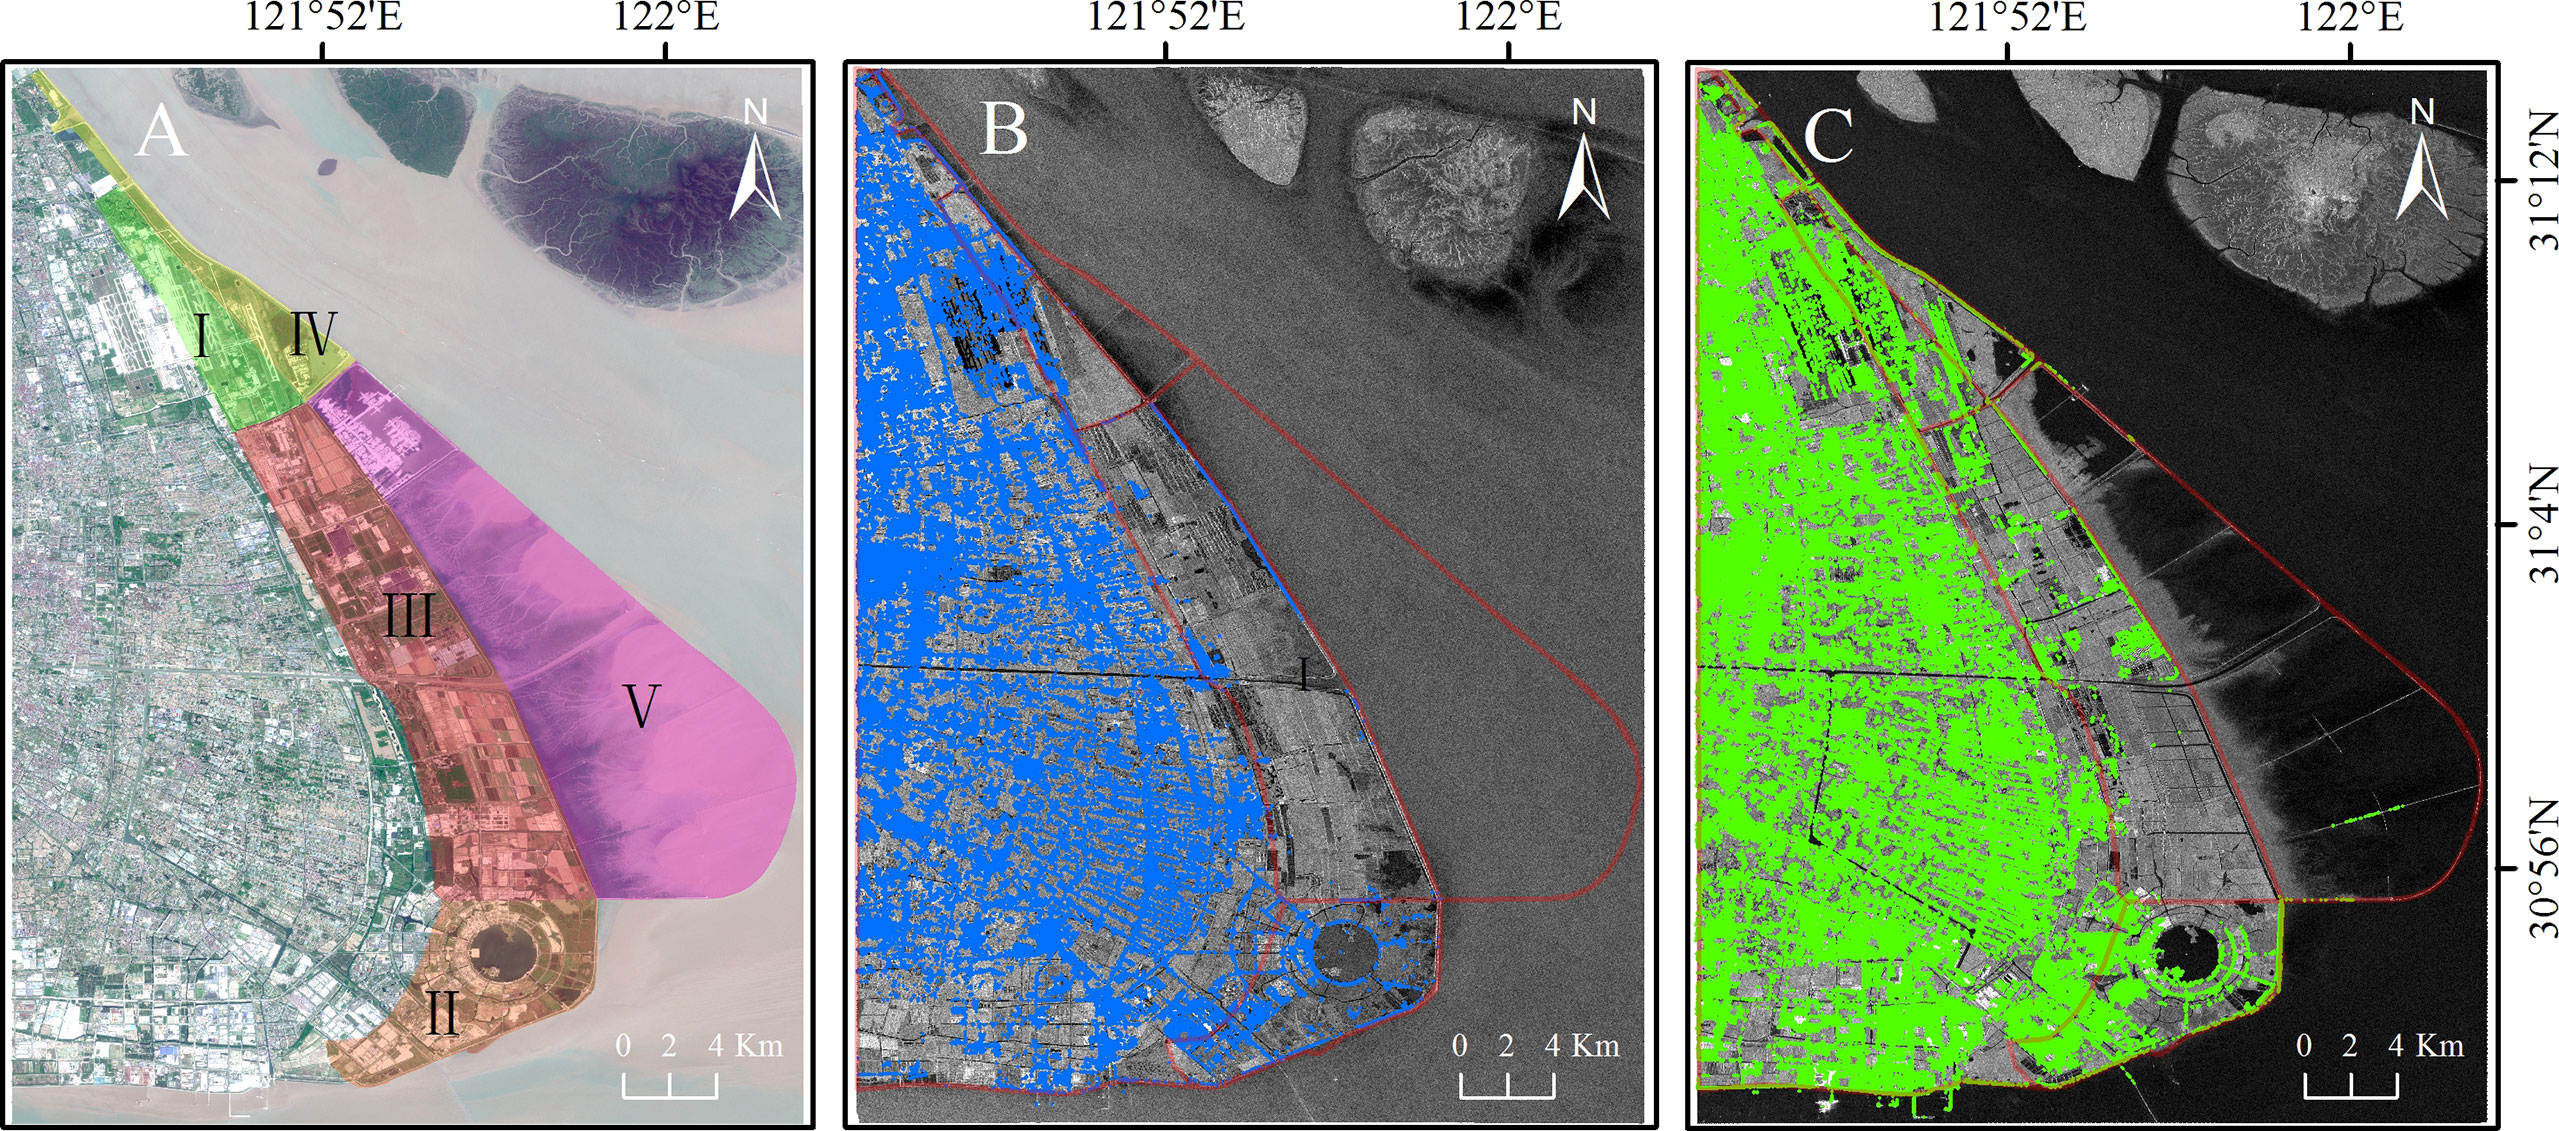
Figure 5 (A) The scope of the five reclamation projects with the background of Sentinel-2A images acquired in 2020; (B) Distribution of PS points (marked in blue) obtained by ENVISAT/ASAR images; and (C) Distribution of PS points (marked in green) obtained by Sentinel-1A images. The background of (B, C) is a mean SAR intensity map of the two kinds of used dataset, respectively.
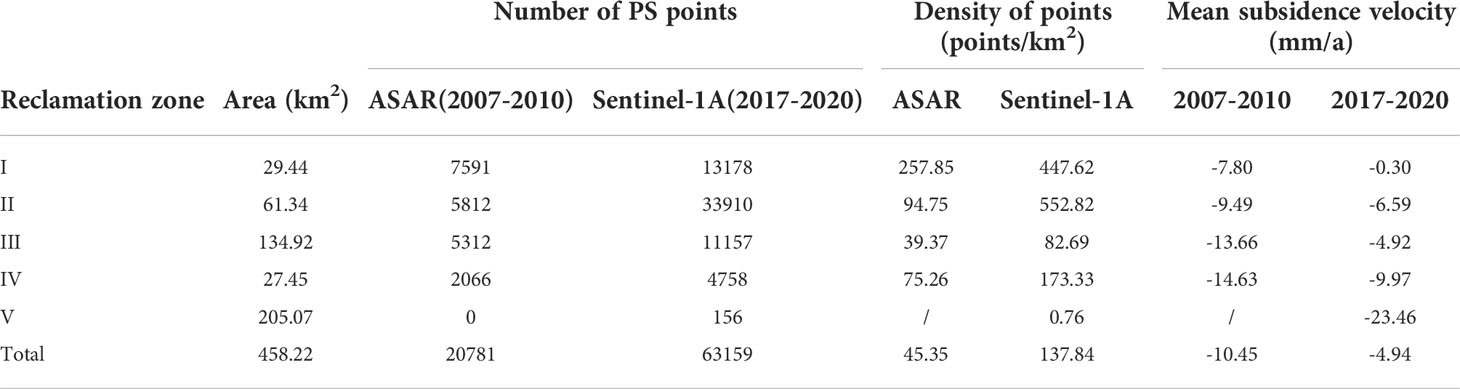
Table 1 Statistics of PS points and subsidence value in reclamation zone.
The annual mean ground deformation velocity maps during the periods of 2007-2010 and 2017-2020 are shown in Figure 6. The PS-InSAR method measures the projection of 3D land deformation in the LOS direction. Negative values correspond to an increase of the sensor-to-object slant range distance (Guo et al., 2017), suggesting the land surface is sinking, whereas positive values mean the ground uplift. As can be seen, uneven land subsidence apparently existed in both periods in the study area, with the spatial distribution characteristics of gradually increasing subsidence rates from inland to offshore.
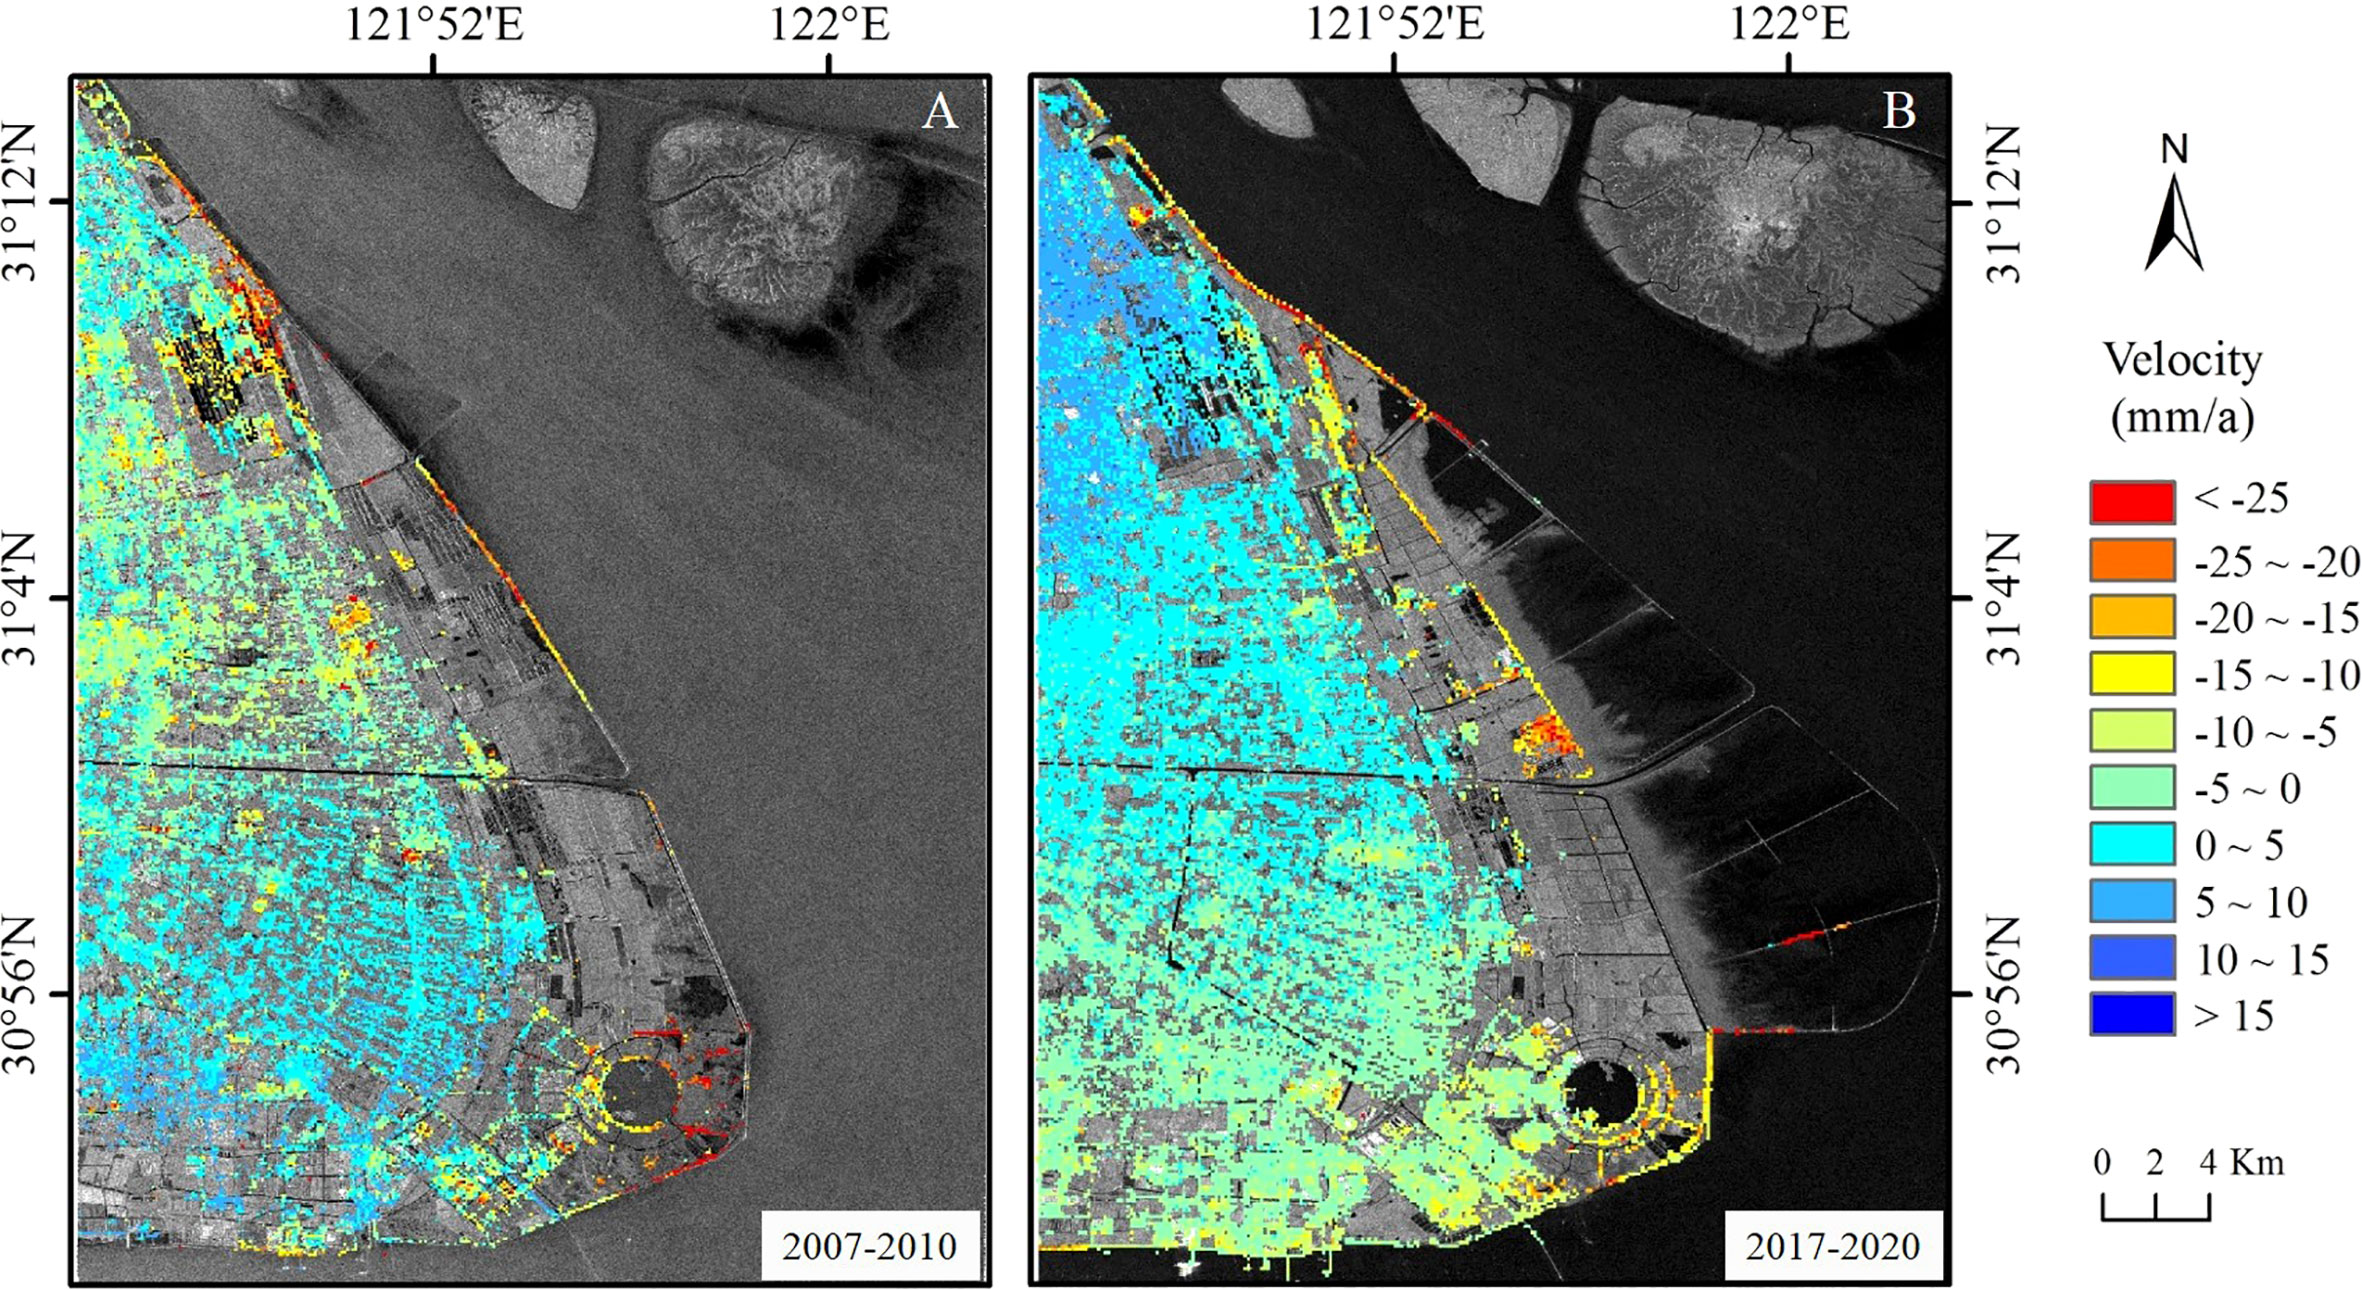
Figure 6 Inversion results of ground deformation in the study area during 2007-2010 (A) and 2017-2020 (B). The background of (A, B) is a mean SAR intensity map of the two kinds of used dataset, respectively.
In the period of 2007-2010, the mean deformation rate of the study area was -2.41 mm/a, and the maximum subsidence velocity was -39.50 mm/a. A total of 5,829 out of 244,330 PS points in the study area had a high subsidence rate (less than -20 mm/a), and 70.18% (i.e., 4091 points) of the PS points with high subsidence rate were located within the reclamation area. By comparison, from 2017 to 2020, the mean deformation rate of the study area was -1.09 mm/a, and the maximum subsidence velocity was -29.50 mm/a. A total of 2,404 out of 626,097 PS points in the study area had a subsidence rate less than -20 mm/a, and 85.12% (i.e., 2047 points) of the PS points with high settlement rate were located in the reclamation area.
The specific ground deformation situation of the reclamation area is as follows. Statistics (described in Table 1) showed that, the average annual subsidence rate of the overall reclamation areas changed from -10.45 mm/a to -4.94 mm/a during the two monitoring periods. In the zone of Project I, the mean subsidence velocities in the two periods were -7.80 mm/a and -0.30 mm/a, respectively, suggesting that the surface deformation of Pudong Airport gradually slowed down and stabilized over the 10 years. Similarly, in the Project II area, the average settlement rate also decreased, from -9.49 mm/a to -6.59 mm/a. It is worth noting that although the subsidence rate of Nanhui New City had decreased over times, compared with the Pudong Airport, its subsidence situation was still serious, especially the roads and buildings around Dishui Lake, most of which had a subsidence velocity of< -15 mm/a in both periods. In the reclamation area of Project III, PS points with subsidence rate< -20 mm/a accounted for 19.49% (1136 out of 5829 points) and 33.01% (794 out of 2404 points) in these two periods, respectively. The mean subsidence velocity in the period of 2007-2010 was -13.66 mm/a, and it decreased to -4.92 mm/a after 10 years. Possibly, due to the fact that the Project IV was only completed in the year of 2009, the subsidence process in this area was still in progress during the study periods, resulting that the average settlement rate had not decreased too much, just from -14.63 mm/a to -9.97 mm/a. In the newly reclaimed zone, the ground subsidence was even more obvious. In Project V zone, a total of 156 PS points, detected on the seawalls from the Sentinel-1A dataset, has a mean subsidence rate of -23.46 mm/a, significantly higher than that in other reclamation zones in the same period.
3.3 Comparison of the corresponding points
Considering the difference in the construction time of the reclamation projects, it could help to clarify the variation trend of land subsidence by comparing the deformation characteristics of the corresponding points, with the same geographical location in the two PS points datasets of ASAR and Sentinel-1A. In our study, the corresponding points were defined in the following manner. First, the Sentinel-1A PS point a’ in the area within a radius of 30 m (pixel resolution of ASAR data) of the ASAR PS point a was selected, then points a and a’ together formed the corresponding points. If there were multiple Sentinel-1A PS points in the defined area, these points were averaged as one point.
A total of 11,211 pairs of corresponding points were identified in the reclamation area for the two PS points datasets, and their spatial distribution was shown in Figure 7A. Nearly 75% of the corresponding points were distinguished in the area of Project I and II (Table 2), mainly concentrated on the Pudong Airport, Nanhui New City and seawalls. Most of these targets are artificial buildings, which are hardly affected by speckle noise in time-series SAR images, with stable scattering characteristics over long time. Since no PS points was detected by ASAR data in Project V zone, there was no corresponding point in this area.
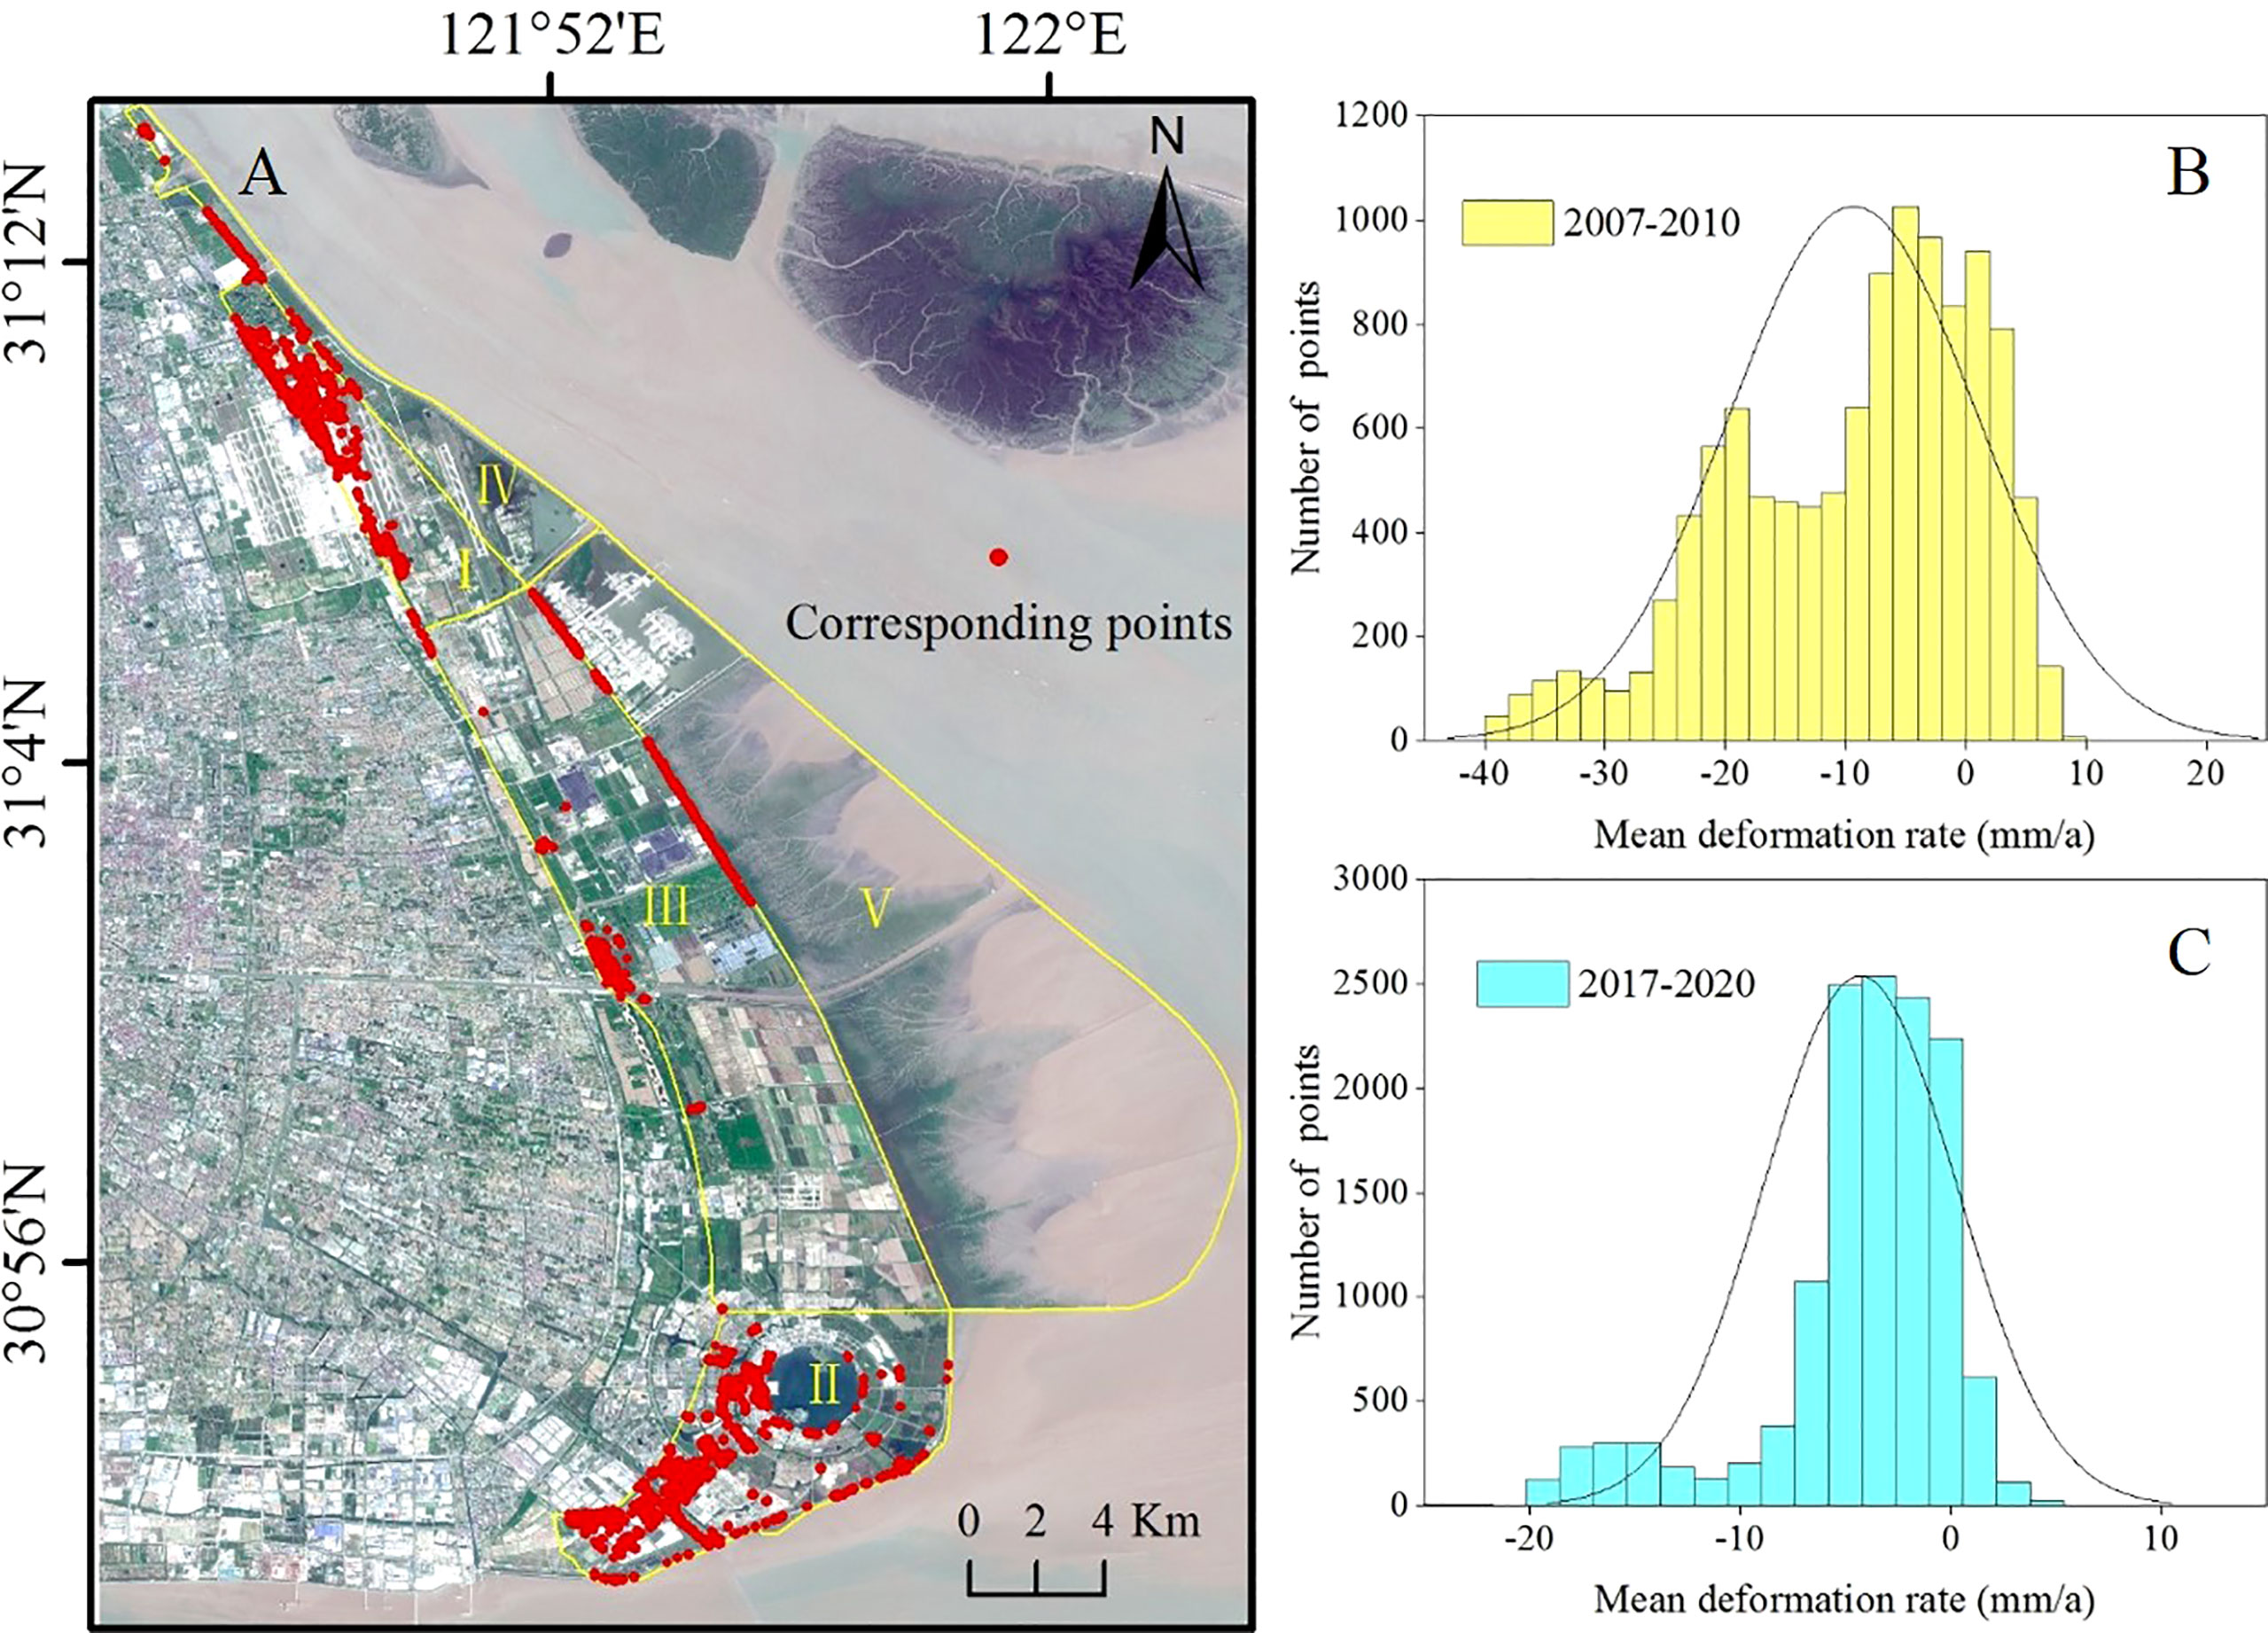
Figure 7 (A) Distribution of corresponding points (CPs) in the reclamation area, superimposed on the Sentinel-2A image; (B, C) Deformation rate statistics of CPs.
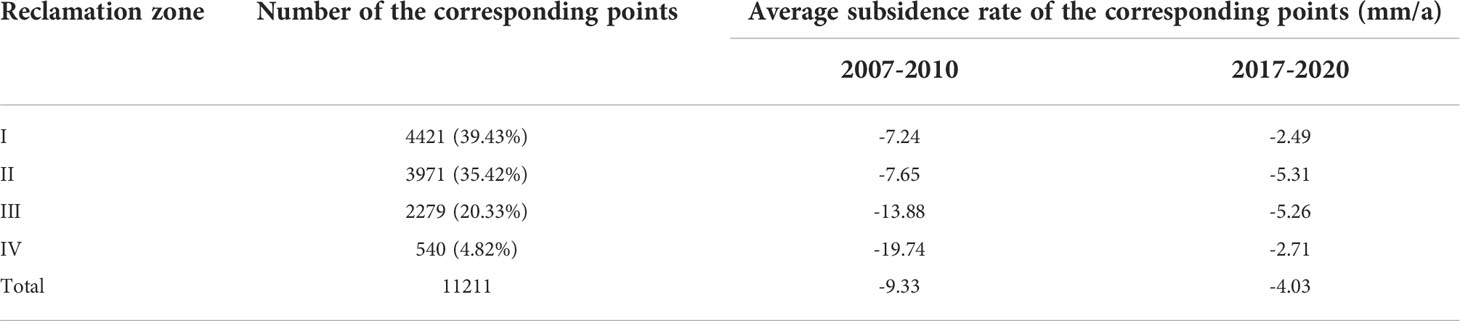
Table 2 Statistics of corresponding points and subsidence value in reclamation zone.
In terms of the average subsidence rate of all the corresponding points, it decreased from -9.33 mm/a to -4.03 mm/a over the ten years (Table 2). From the perspective of the proportion of PS points with settlement rates, the percentage of corresponding points with settlement velocity<-10 mm/a accounted for 40.13% in the period of 2007-2010, while during the 2017-2020 period, that was 6.64% (Figures 7B, C).
The subsidence characteristics of the corresponding points in the four reclamation project areas were different (Figures 8–11). The specific location of typical corresponding points P1, P2, P3 and P4 are shown in Figure 8C, 9C, 10C and 11C.
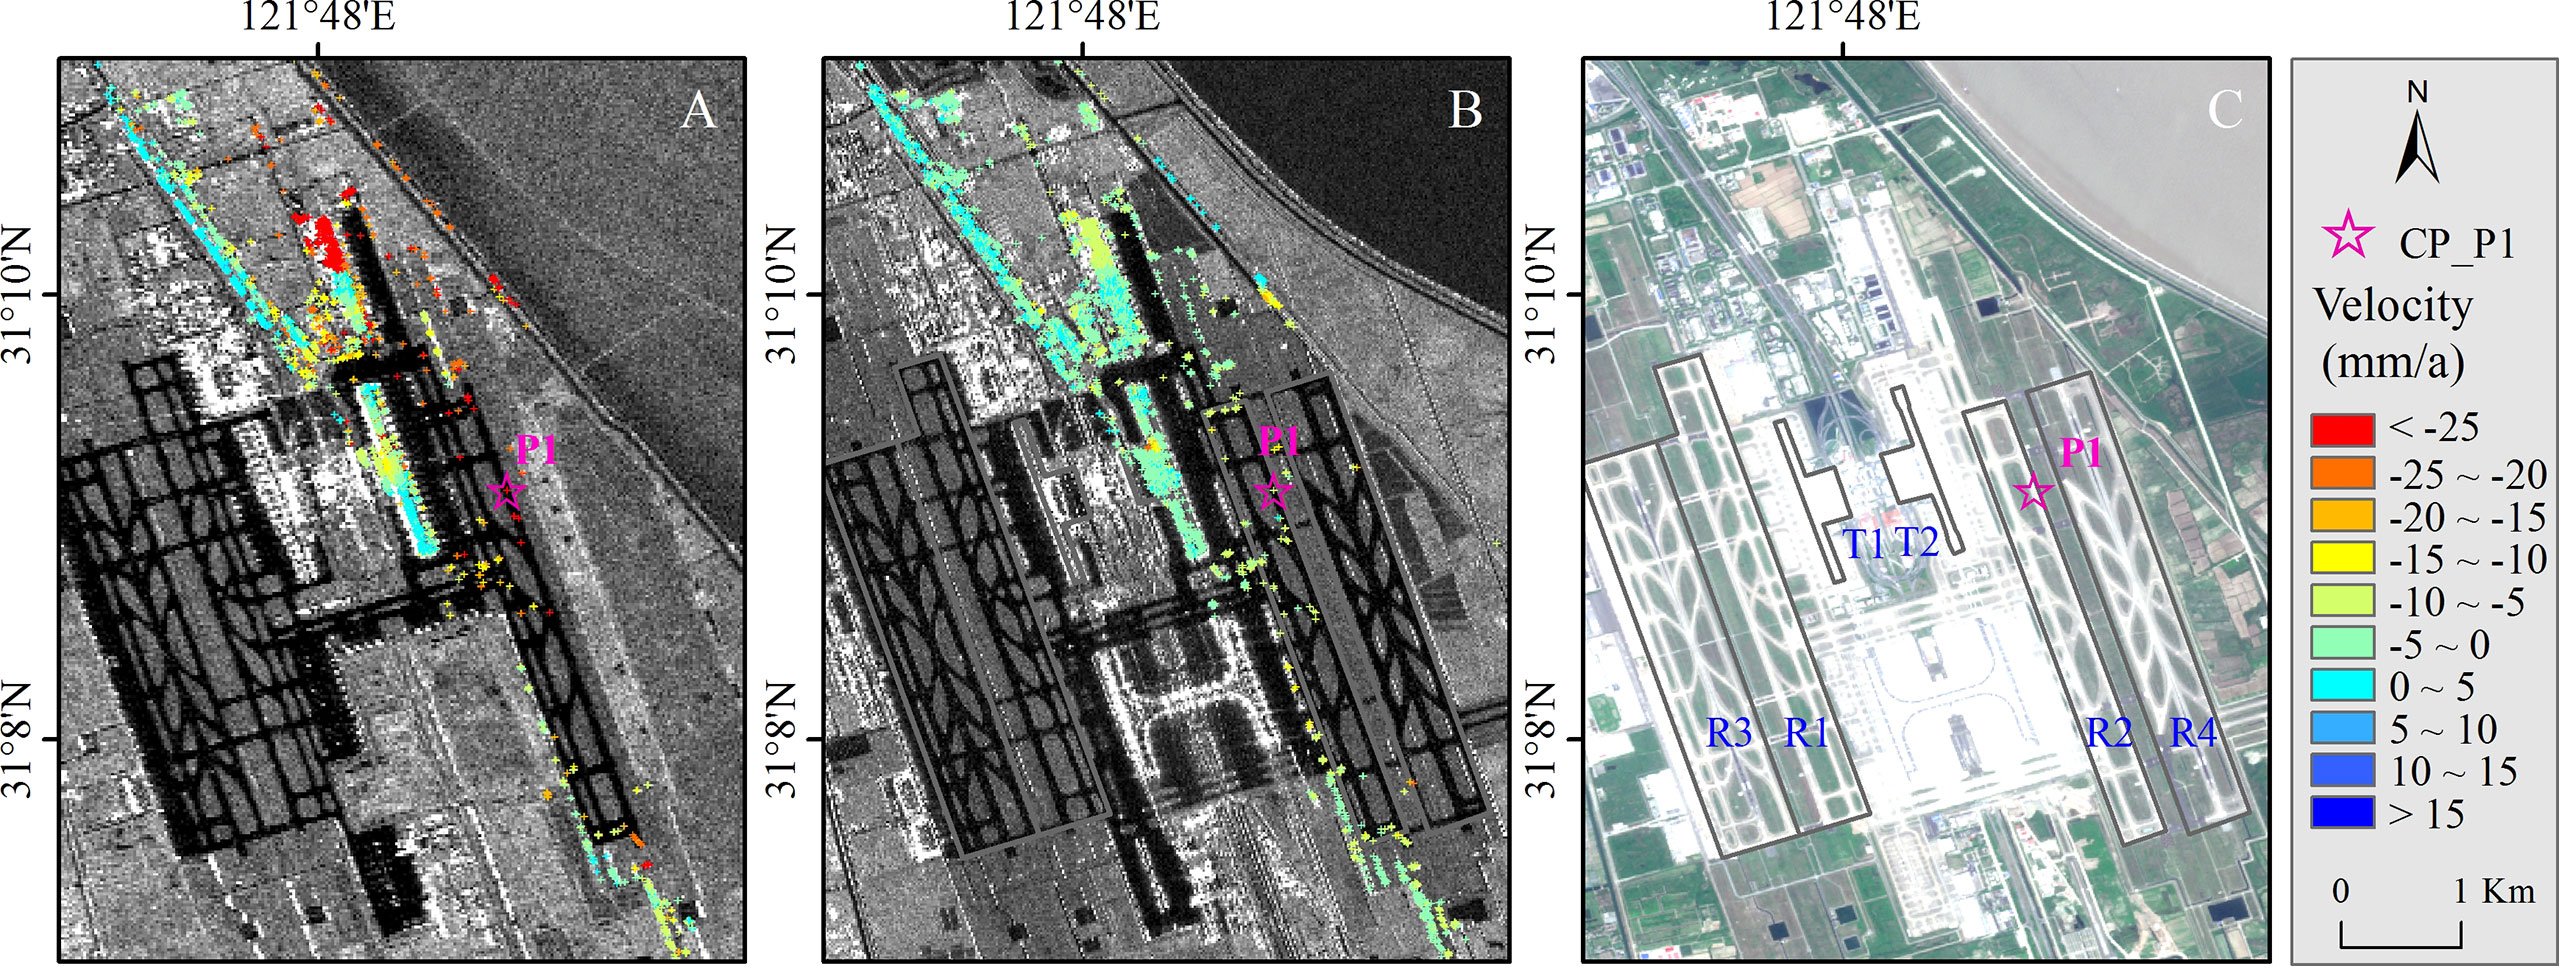
Figure 8 Subsidence comparison of typical site (CP_P1) in Pudong Airport Reclamation Project during the two periods of 2007-2010 (A) and 2017-2020 (B). The background of (A, B) is a mean SAR intensity map of the two kinds of used dataset, respectively, and (C) is superimposed on the Sentinel-2A image.
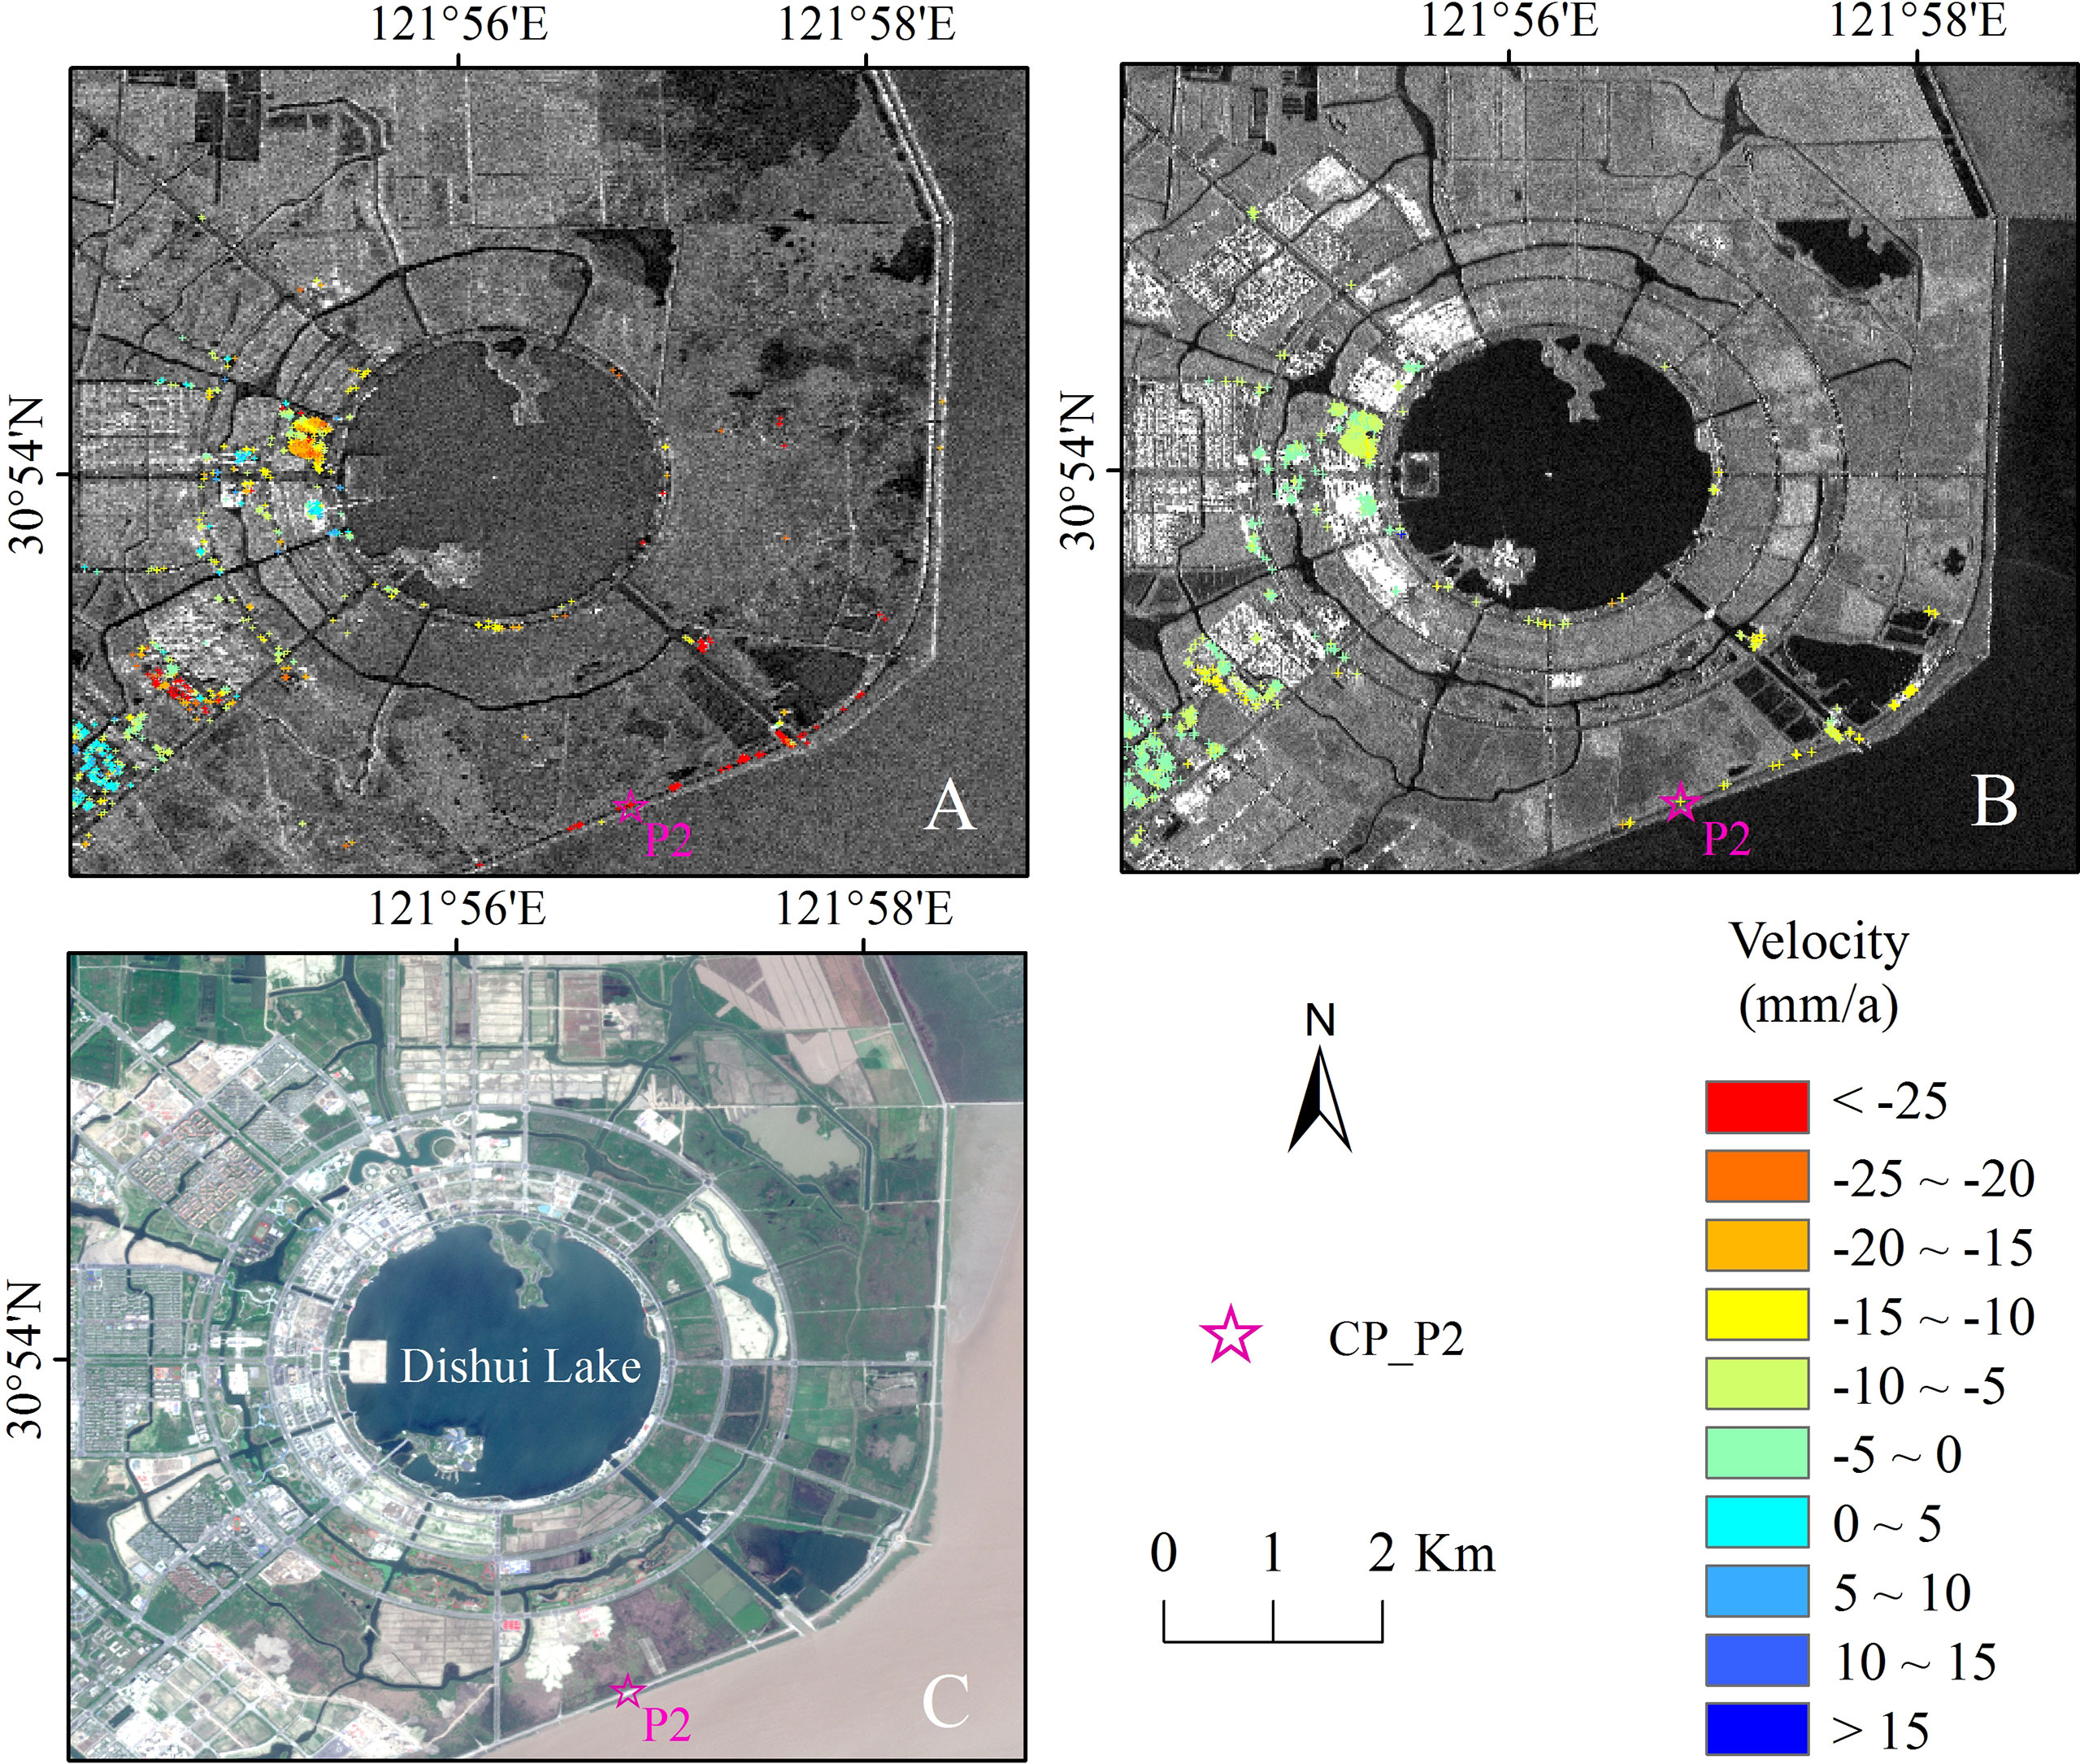
Figure 9 Subsidence comparison of typical site (CP_P2) in Nanhui New City (i.e., Lingang New City Reclamation Project) during the two periods of 2007-2010 (A) and 2017-2020 (B). The background of this figure (A–C) is the same as that of Figure 8.
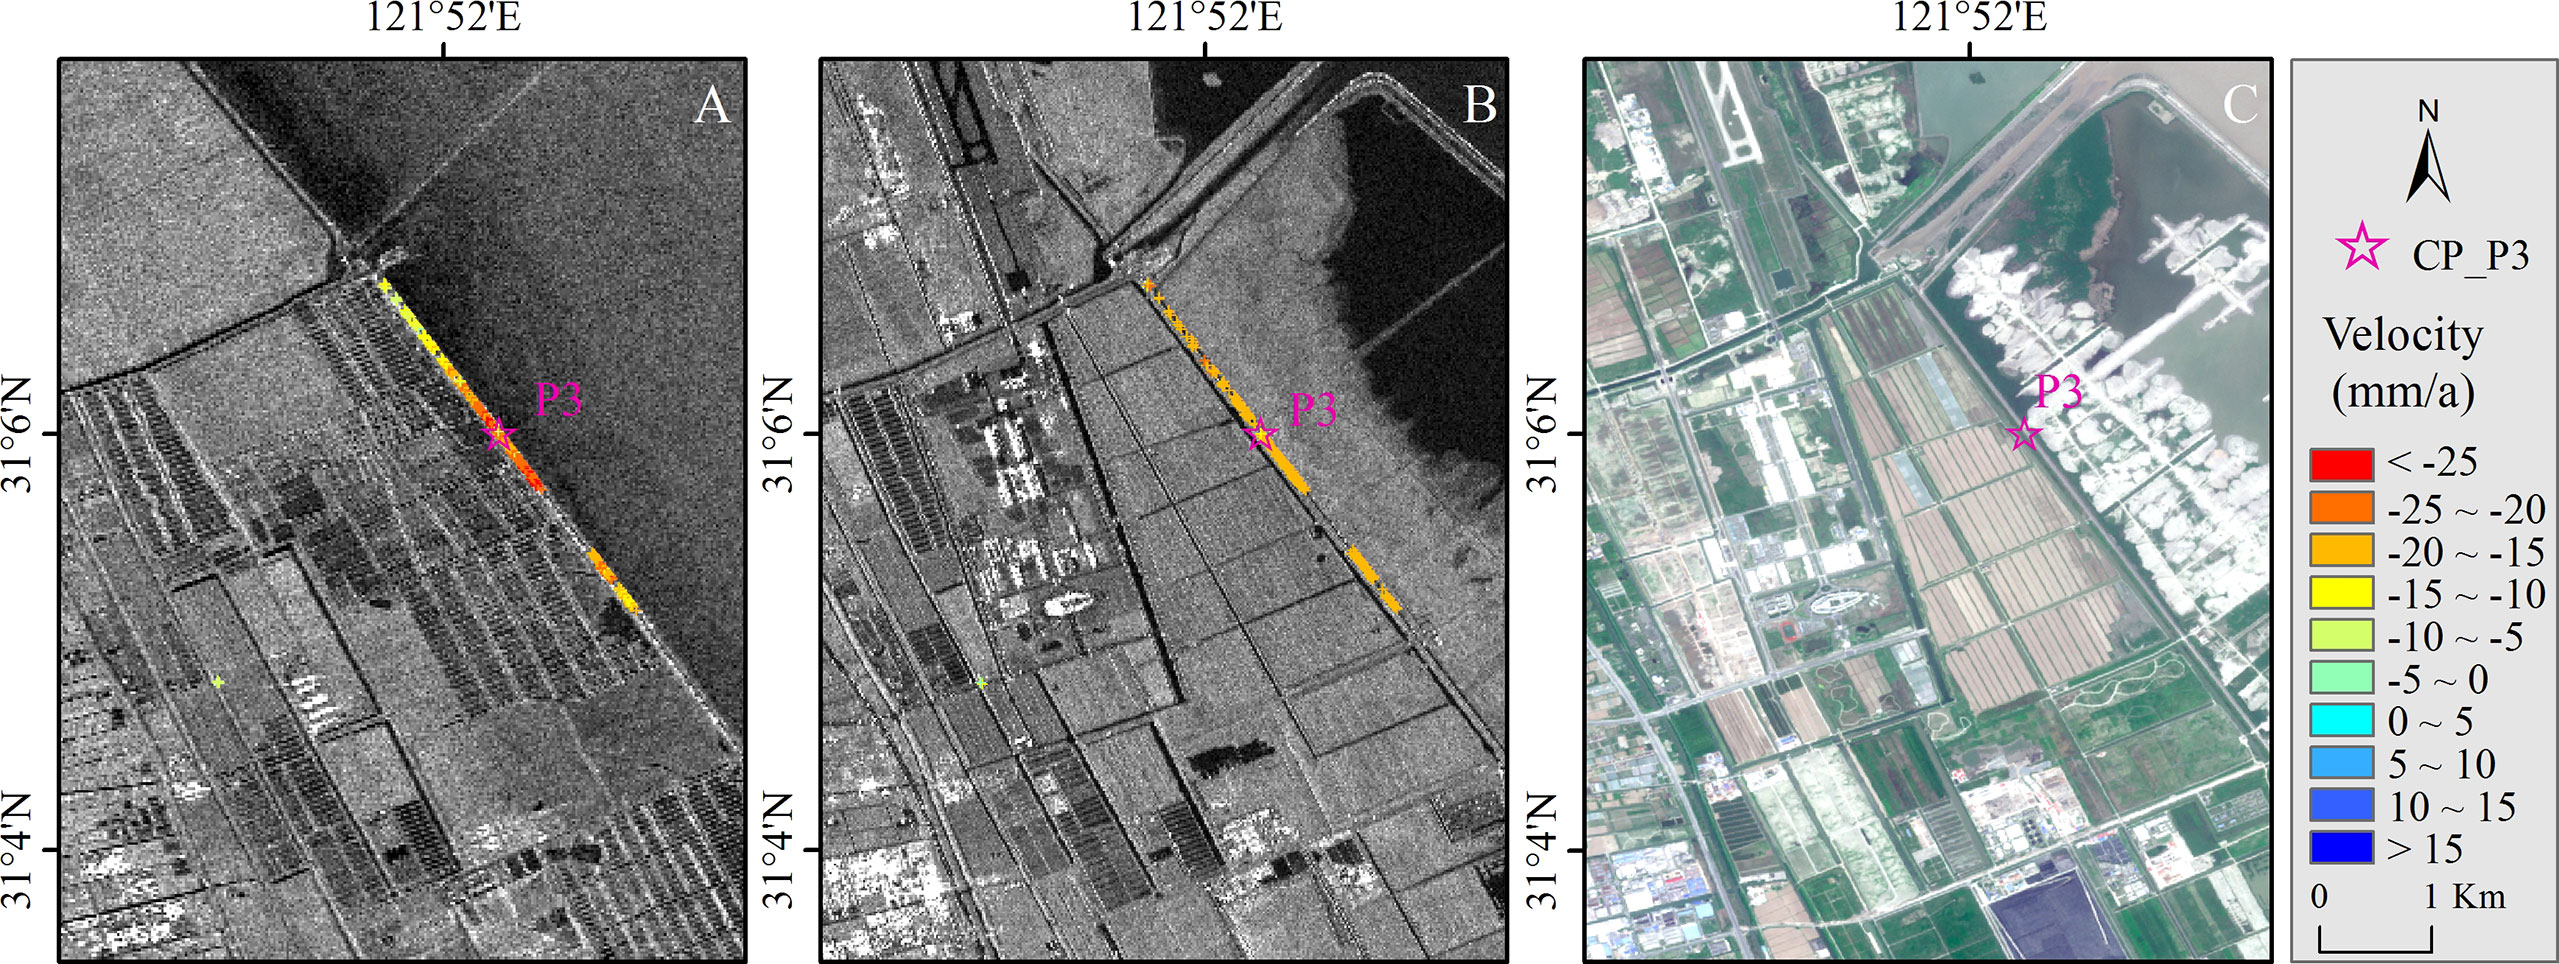
Figure 10 Subsidence comparison of typical site (CP_P3) in Nanhui Dongtan Reclamation Project during the two periods of 2007-2010 (A) and 2017-2020 (B). The background of this figure (A–C) is the same as that of Figure 8.
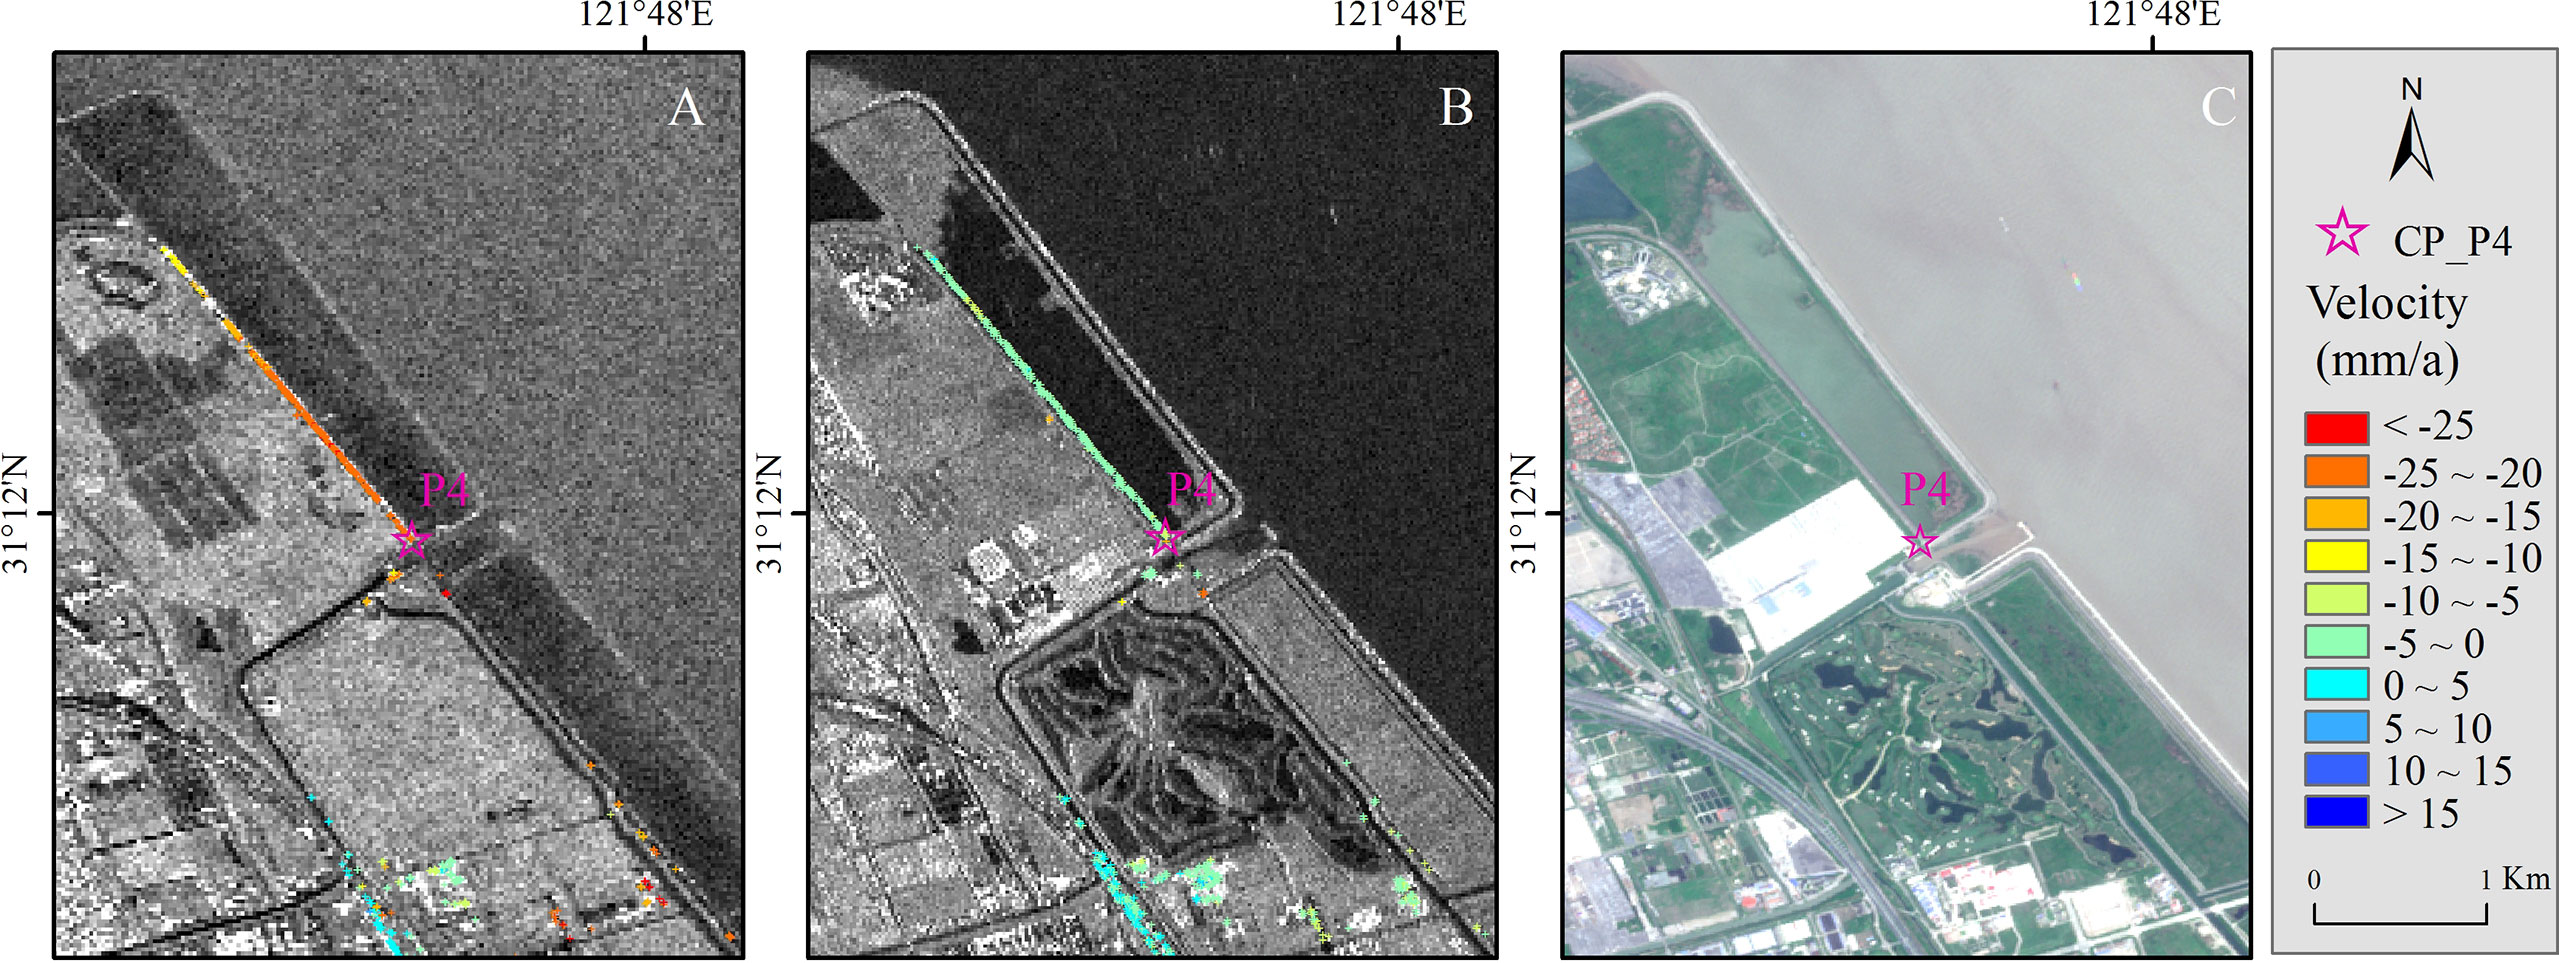
Figure 11 Subsidence comparison of typical site (CP_P4) in Reclamation Project outside Pudong Airport during the two periods of 2007-2010 (A) and 2017-2020 (B). The background of this figure (A–C) is the same as that of Figure 8.
In Project I area, the average subsidence rates were -7.24 mm/a (2007-2010) and -2.49 mm/a (2007-2010), respectively (Table 2). Especially, the settlement trend of the building on the north side of the T2 terminal had slowed down significantly (Figure 8), with the average subsidence rate changing from -17.57 mm/a to -3.05 mm/a. Figure 12A showed the cumulative deformation statistics for the two periods of the typical corresponding point P1, located on the R2 airport runway. From 2007 to 2010, the cumulative deformation value reached -72.42 mm, while it was only -18.52 mm from 2017 to 2020.
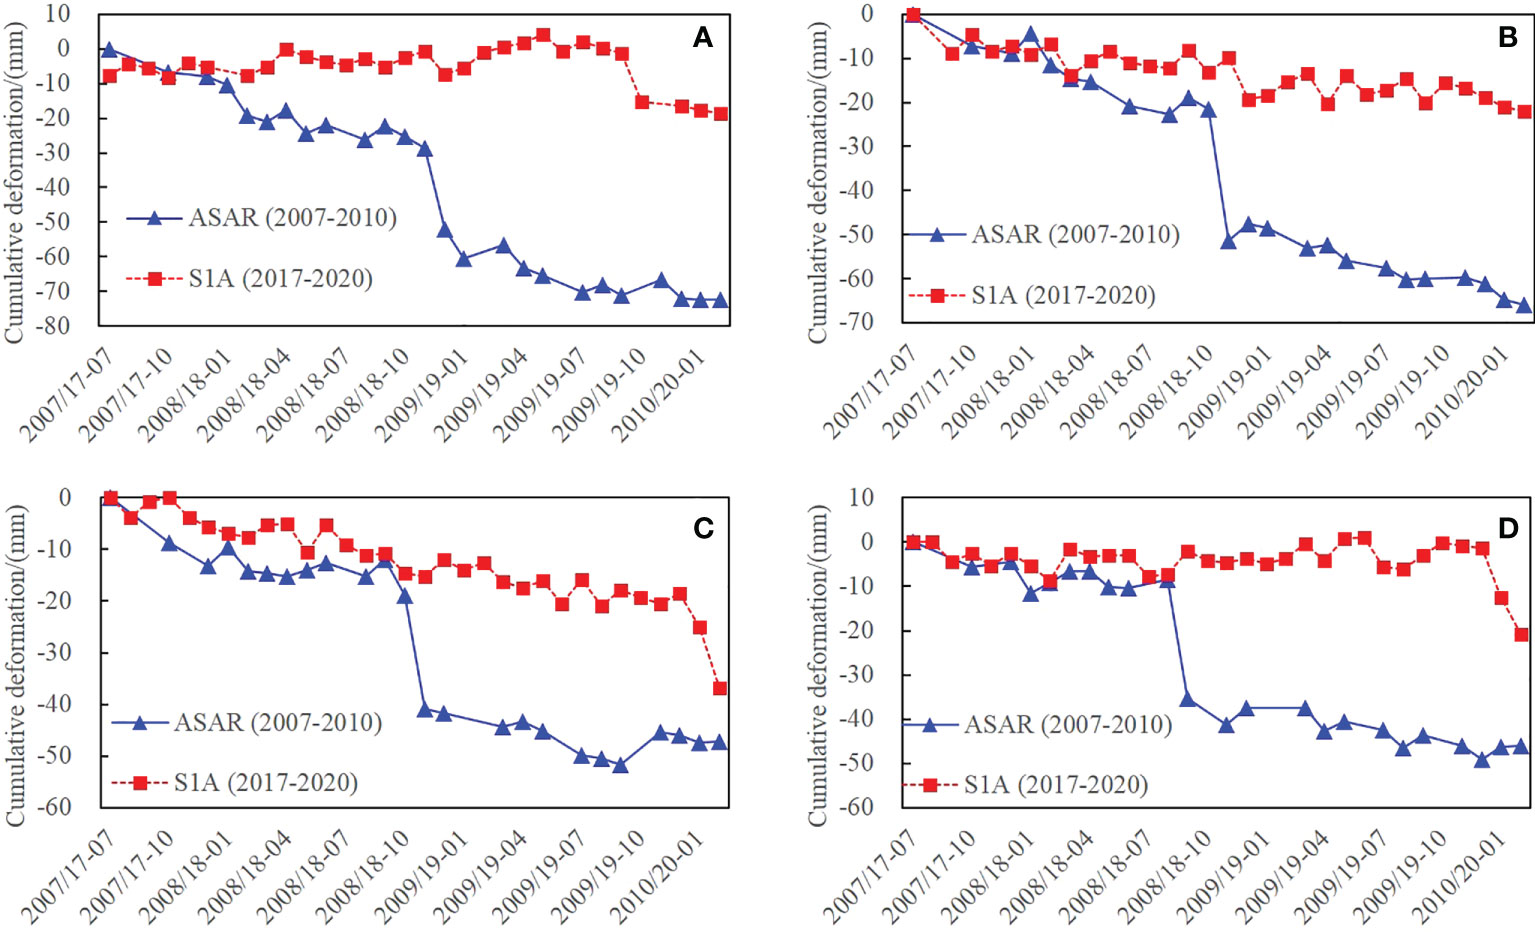
Figure 12 Time series of the surface subsidence at selected points CP_P1 (A), CP_P2 (B), CP_P3 (C) and CP_P4 (D) during the two periods of 2007-2010 and 2017-2020.
In the zone of Project II, although the mean settlement velocity of corresponding points had decreased, the decline degree was not great, just from -7.65 mm/a to -5.31 mm/a during the two periods (Table 2). The corresponding points with subsidence rate of less than -10 mm/a were mainly concentrated on the seawalls in the south and buildings on the west of Dishui Lake (Figure 9). As a whole, the subsidence of this zone was still serious, however, the subsidence trend of the seawalls had been relieved comparatively, of which the average deformation rate changed from -21.06 mm/a to -10.02 mm/a. For example, the cumulative deformation value of the corresponding point P2 was -65.89 mm during the period of 2007-2010, and it decreased to -22.03 mm from 2017 to 2020 (Figure 12B).
Although Project III is the largest of the four reclaimed areas, it has only 1/5 of all the corresponding points, and nearly 60% of them are located on the seawall (Figure 7A). The average subsidence rates were -13.88 mm/a (2007-2010) and -5.26 mm/a (2017-2020), respectively (Table 2). It is worth noting that the subsidence of corresponding points on the seawall in this area had not been effectively improved. The mean settlement velocity of the northern seawall only decreased from -17.91 mm/a to -16.21 mm/a (Figure 10). Figure 12C displayed the cumulative deformation results for the two periods of the corresponding point P3. During the period of 2007 to 2010, the cumulative deformation value was -47.26 mm, and it was still at a high value of -36.85 mm from 2017 to 2020.
There were the least corresponding points in the area of Project IV, accounting for less than 5% of the total number of reclamation areas. All the corresponding points in this zone were distributed on the seawall (Figure 7A), the subsidence of which had been obviously mitigated (Figure 11), with the mean settlement velocity decreasing from -19.74 mm/a to -2.71 mm/a during the two periods (Table 2). Taking the typical corresponding point P4 as an example, its cumulative deformation value was -46.04 mm from 2007 to 2010, and it decreased to -20.76 mm during the period of 2017 to 2020 (Figure 12D).
4 Discussion
4.1 Performance of the two datasets for monitoring land subsidence
The ENVISAT/ASAR and Sentinel-1A datasets, Image Mode (IM) and interferometric wide swath (IW) images, respectively, selected in our study have been proved to be effective in inverting ground subsidence. This concurs with many previous similar research. For instance, Foroughnia et al. (2019) used these two kinds of SAR data stack to analyze the deformation rate in south-west of Tehran, Iran, finding that LOS velocities obtained from both them were highly compatible with each other. Besides, the accuracy of land subsidence obtained by the two datasets had also been verified. After comparing the InSAR results and leveling measurements, Lyu et al. (2020) found that they showed good consistency with each other and the coefficient of determination of the linear regression between them were 0.96 and 0.98, respectively. However, in previous studies, ground subsidence monitoring based on these two kinds of SAR data using PS technique is usually applied in urban areas, and relatively less in non-urban areas. In this research, we attempted to apply them to monitor the ground deformation for newly reclamation area. Some man-made objects, easy to detect as PS point targets, such as the airport, buildings, and seawalls constitute the basic ‘skeleton’ of the reclaimed zone, whose deformation information basically represents the spatial distribution characteristics of the subsidence in the entire study area. Further, this makes it possible to have a macroscopic understanding of the development trend of land subsidence. In our research, the high-coherent points were successfully identified using PS method based on the two datasets, showing that there was obvious uneven land subsidence during the two monitoring periods (Figure 6), which provides data support for understanding the subsidence history and tendency in the study area.
In general, there were more PS points obtained from Sentinel-1A data than from ASAR data in our study area (Figure 5, Table 1). This is mainly due to the following two reasons. Firstly, the spatial resolutions of the two kinds of SAR data are different. Compared with ENVISAT/ASAR data, Sentinel-1A has higher spatial resolution, i.e., 30 m vs 20 m. Higher spatial resolution means that the number of scatterers in a single resolution unit is reduced, which is beneficial to maintain the stability of a single resolution unit, facilitating the extraction of more coherent target points. Secondly, the two SAR datasets used in the study have different acquisition time. The ASAR data detected the ground PS points in the period of 2007-2010, while Sentinel-1A data reflected the situation ten years later. Generally speaking, after the reclamation project is completed, infrastructure construction will be carried out according to the plan, which can be confirmed in multi-phase optical satellite images (Figures 2A–E). With the continuous increase of man-made facilities, PS points would also increase accordingly. In order to exclude the impact of new infrastructure construction on PS detection in the reclamation area in the later stage, the area of Project I, completed in 2001 and no new infrastructure had been built in subsequent periods, can be selected to compare the performance of the two kinds of data for PS point detection. Statistics (Table 1) showed that the density of PS points obtained from Sentinel-1A dataset was 1.74 times higher than that of ASAR data in Project I zone, and more detailed and comprehensive features of the ground subsidence could be reflected from Sentinel-1A results than ASAR. Therefore, it can be concluded that the new generation of Sentinel-1A satellite SAR data has obvious advantages over ENVISAT/ASAR data in detecting PS points and inverting land subsidence characteristics in reclaimed area.
4.2 Influencing factors of subsidence in different reclaimed areas
Land subsidence is the result of a combination of multiple factors, with obvious spatial and temporal differences. It is confirmed that the land vertical movements in Shanghai reclamation area are closely related to soil consolidation and engineering construction (Yu et al., 2020; Yuan et al., 2020).
After land reclamation, there is a natural consolidation and compression process, which often varies to some extent due to the different reclamation time and soil type. Previous studies have pointed out that initial consolidation, lasting secondary consolidation of alluvial clay deposits under the dredger fill, and creep within the dredger fill are regarded as the three mechanisms relative to ground subsidence in reclamation zones (Jiang and Lin, 2010; Yu et al., 2020). As described in Section 2.1, the eastern part of Pudong Airport is built on the reclaimed land of Project I and IV, and its foundation consists of both artificial fill materials and natural sediments. The ground of the airport’s second runway was formed by blown sand and backfill in the year of 2001 when Project I ended, whose geological foundation was soft and weak due to the lack of a crust layer (silty clay) (Jiang et al., 2016). Therefore, analysis of the deformation of the second runway, being in operation since 2005, can illustrate the influence of consolidation time and soil type on the subsidence. Jiang and Lin (2010) suggested that the normal secondary consolidation starts gradually three years after the completion of the airport reclamation project. The first monitoring period in this study was from 2007 to 2010, and the ground consolidation settlement was still at the stage of secondary consolidation. So, during this period, the maximum and mean subsidence velocities of the runway were as high as -37.59 mm/a and -16.70 mm/a, respectively. In addition, pumping and pouring water experiment showed it would take about 30 years for the deformation of the reclamation area to be steady and reach the level of micro-subsidence (Gong, 1995). Our monitoring results showed the foundation of the airport’s second runway gradually stabilized over time. Ten years later, the maximum and mean velocities decreased to –9.91 mm/a and -2.31 mm/a, respectively.
Engineering construction is another crucial factor affecting land deformation, which is evident in the subsidence analysis of the seawall. As the main means of resisting storm surge disasters, seawall engineering is an important artificial barrier to ensure urban safety, and the elevation changes of it have a significant impact on flood control decisions. Because the reclaimed land advances to the sea, new seawalls need to be built in some areas. For example, in the Project IV area, a new seawall was constructed in a near-parallel direction 500 m outside the old one (Figure 13). The existence of the new seawall significantly reduced the impact of waves on the old, which led to the slowing of its deformation to a certain extent. Some dated ground fragmentation caused by subsidence was found during the field inspection in the year of 2021 (Figure 13D), which had been repaired a few years ago. As described in Section 3.2, the average subsidence of the corresponding points on the old seawall substantially decreased from -19.74 mm/a to -2.71 mm/a during the two periods of 2007-2010 and 2017-2020. However, if there was large-scale continuous engineering construction around the seawall, it would likely make a great difference to its deformation. This can be reflected in the seawall settlement in the zone of Project III. From 2016 to 2020, the Second Phase Project of Nanhui Dongtan Reclamation (Project V) was carried out in the outer area of Project III (Figures 2D, E), resulting the deformation of seawall in Project III area had not been effectively relieved, and the mean settlement rate of the northern seawall only decreased from -17.91 mm/a (2007-2010) to -16.21 mm/a (2017-2020) (Figure 10).
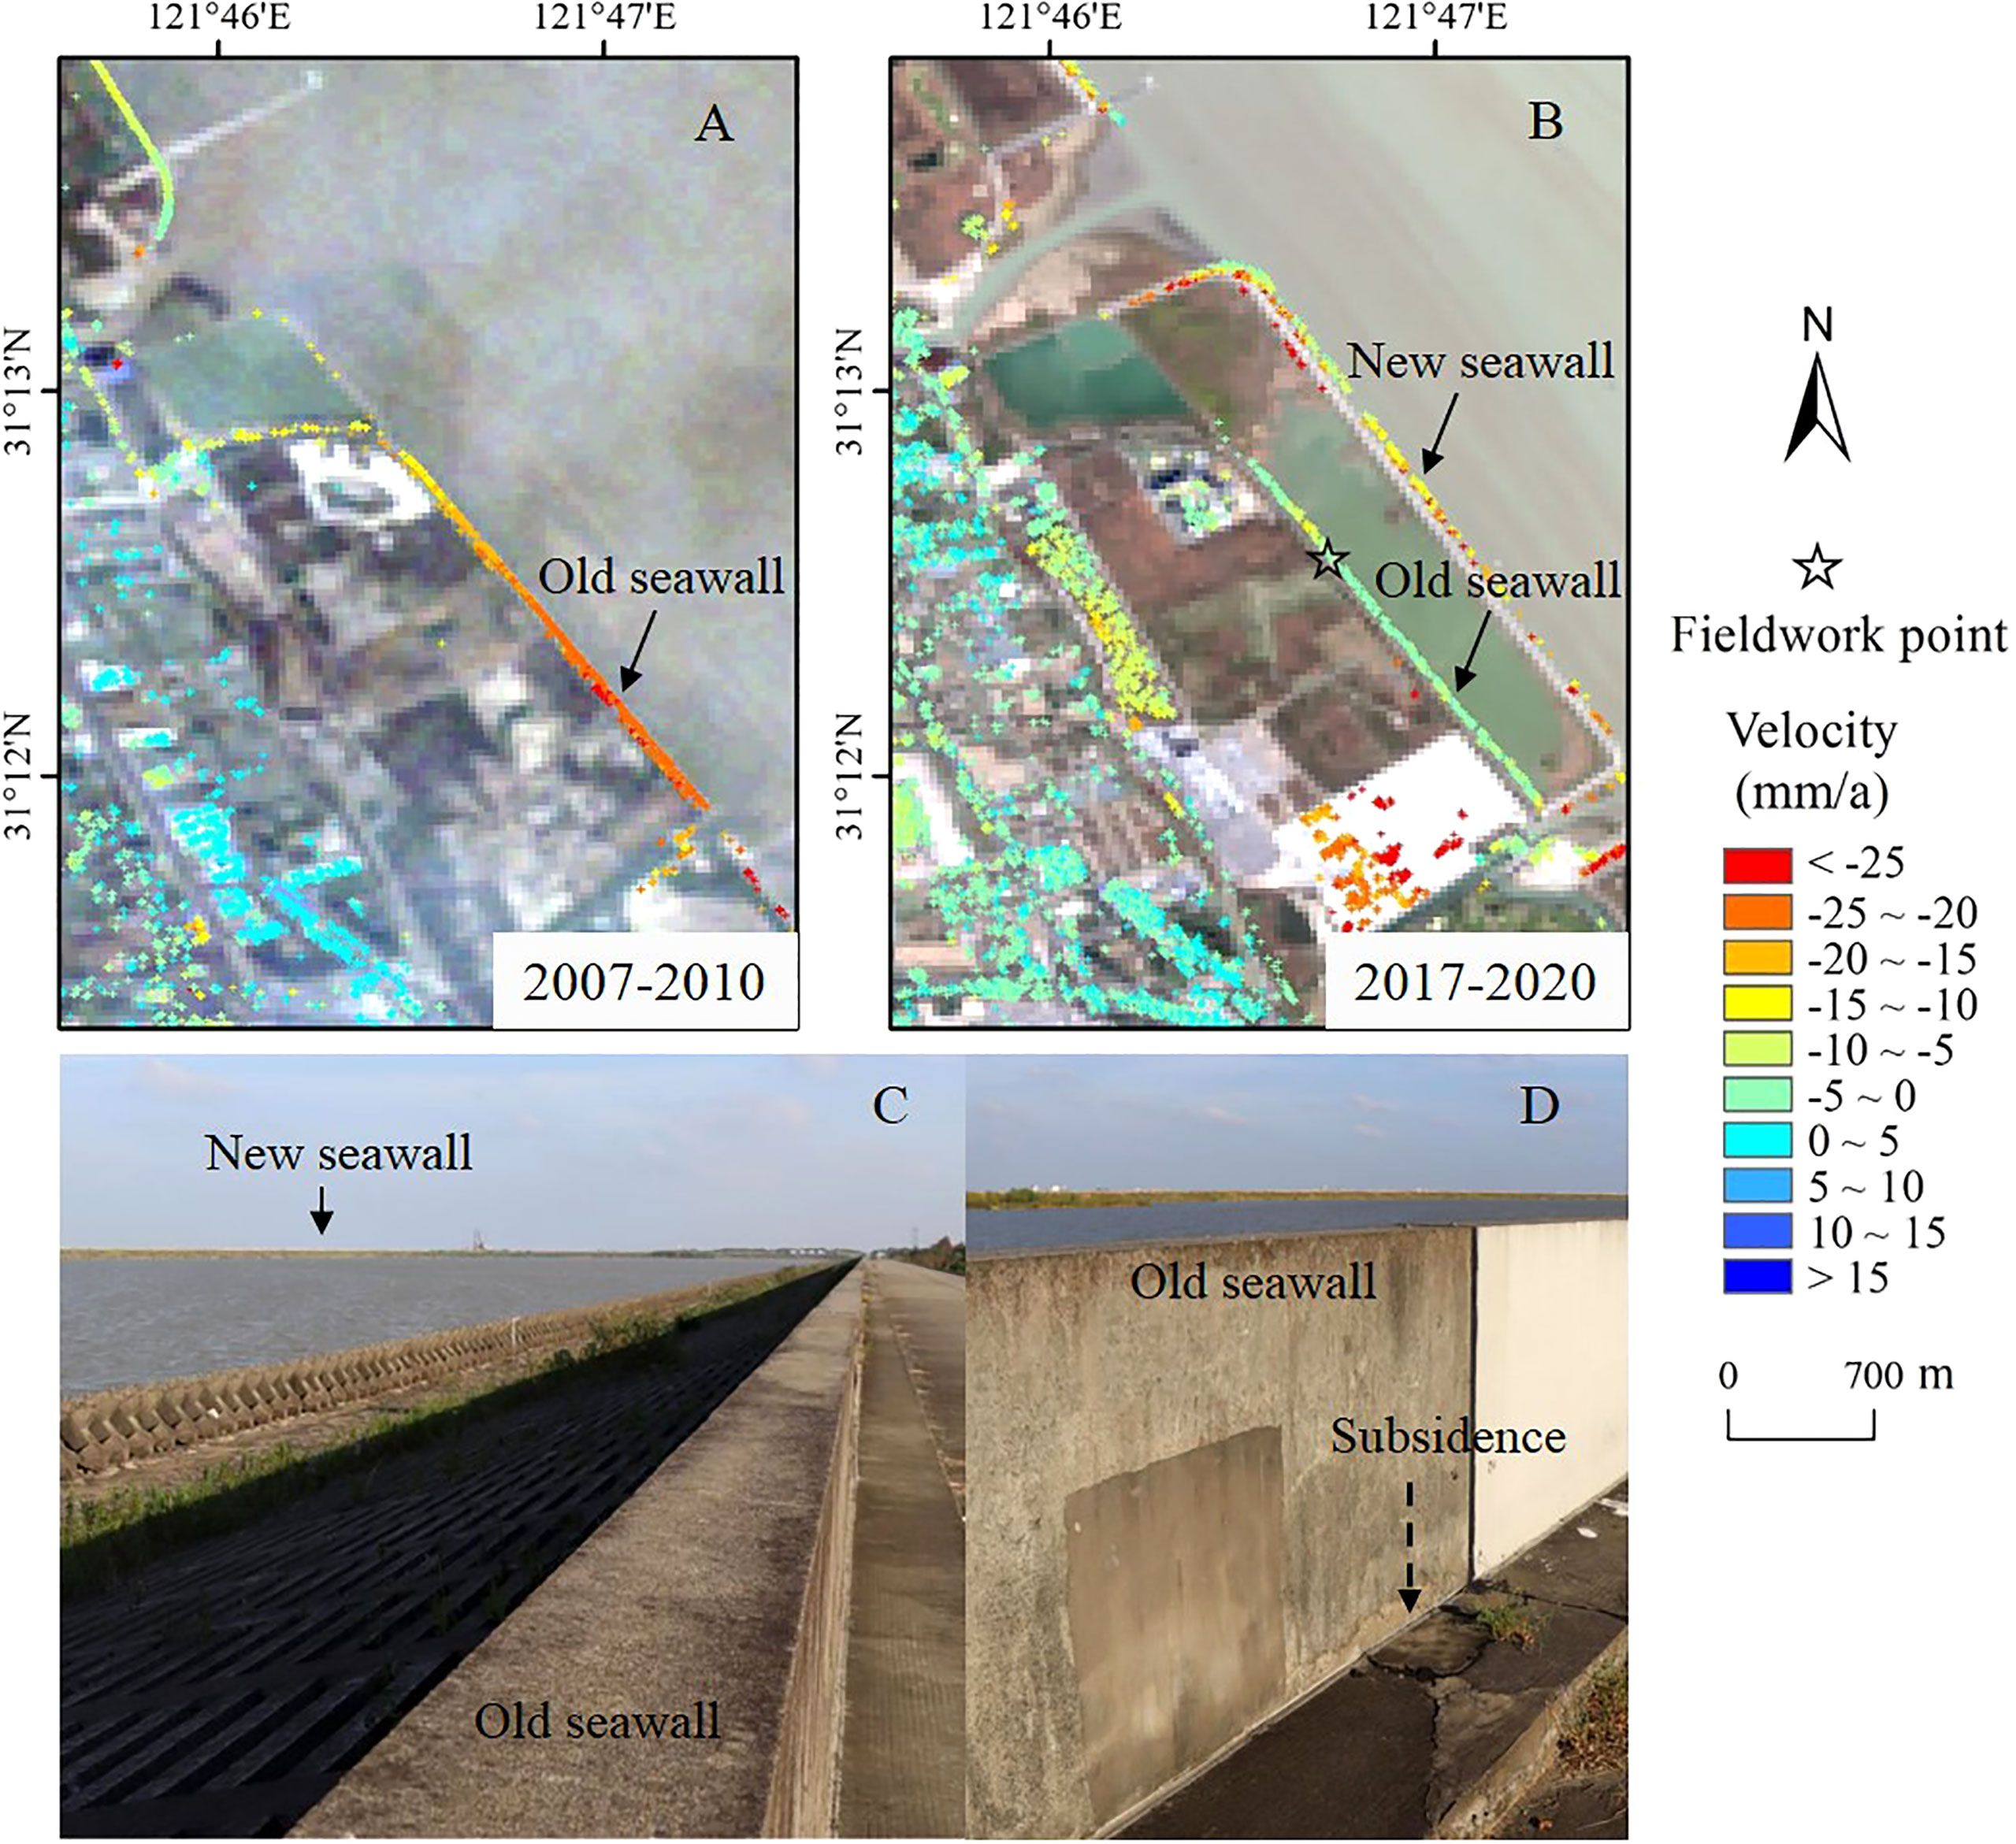
Figure 13 Comparison of land subsidence between old and new seawalls in different periods. Land subsidence velocity maps (A, B) are superimposed on Landsat 5 and Landsat 8 images of the area in 2010 and 2020, respectively. (C) shows the field photograph of the seawalls, while (D) displays a ground breakage restoration of the old seawall.
4.3 Significance of remote sensing monitoring of land subsidence for coastal zone’s sustainable development
Storm flooding is a major threat to the safety and sustainability of the low-lying coastal cities (Wang et al., 2018). In the past ten years, the average annual direct economic loss caused by storm surges in Shanghai has reached ¥11.94 million (Bulletin of China Marine Disaster in 2021, http://www.mnr.gov.cn). The double accumulative effect of land subsidence and sea level rise has become a key factor directly related to the risk of inundation, especially in sedimentary coastal lowlands (Nicholls et al., 2021). The contribution of land subsidence may exceed that of absolute sea level rise by a factor of 10 or more (Herrera-García et al., 2021). Hydrological simulation showed that for long-term scenarios, land subsidence is the most important factor for the changes in Shanghai coastal flooding, and it accounts for more flooding than sea level rise and bathymetric change to the year of 2050 (Wang et al., 2018).
In fact, compared with sea level rise, land subsidence, with regional characteristics and closely related to human activities, has relatively larger change rate. In the past 100 years, the maximum cumulative subsidence of Shanghai has reached 2.63 m (Ye et al., 2016), while it is expected that the sea level along Shanghai coast will rise by 70 to 175 mm in the next 30 years (China Sea Level Bulletin of 2021, http://www.mnr.gov.cn). Therefore, it is particularly urgent to monitor and control the land subsidence in Shanghai reclaimed areas. However, the lack of an on-site monitoring network in reclaimed area limits the understanding of the development of its subsidence pattern to a certain extent. Fortunately, the settlement characteristics of ocean-reclaimed lands can be obtained by remote sensing means. In theory, the ground deformation information in any area covered by remote sensing images can be obtained by differential interferometry. In-SAR method, the emerging and potential earth observation technique, can obtain the surface deformation characteristics of monitoring area from the macro level. It could help to find out the history and current situation of land subsidence development in the study area, understand its spatial distribution features and delineate key monitoring areas according to analysis of In-SAR inversion information. Particularly, the current solidification degree of basement can be judged according to the subsidence velocity. For example, in our study, the subsidence rate and settlement area in the offshore were both larger than those in the inland zone in the two different monitoring periods (Figure 6), indicating that the foundation of Shanghai new land area was still in the process of consolidation and has not reached a stable state. In-SAR inversion results showed that the seawall subsidence rates varied in different time periods and regions (Figures 10, 11 and 13), which can provide intuitive information for the arrangement of seawall monitoring points, saving time and labour costs. In addition, the information on the uneven subsidence characteristics of Nanhui New City (Figures 6, 9) is also helpful to urban planning and engineering construction, promoting sustainable development of Shanghai’s new reclamation land.
Human-induced subsidence in reclaimed areas can be reduced with appropriate policy, which would offer substantial and rapid benefits to reduce growth of coastal flood exposure. Considering the advantages of remote sensing inversion methods, the monitoring and control measures for land subsidence in Shanghai new reclaimed land should focus on the following aspects.
(1) Both traditional and emerging land subsidence monitoring methods should be applied to understand the overall and key subsidence characteristics of the new reclamation area. For example, a practical face-to-point approach can be considered for generalization. Firstly, the spatial distribution features and development trend of the ground subsidence in large-scale and long-term sequence of the reclamation area are obtained using In-SAR technique. Based on this, key monitoring areas are determined, and then a subsidence monitoring network in key areas is established using traditional methods, such as GPS, ground leveling and so on.
(2) Land subsidence mechanism of Shanghai new reclamation area needs to be further studied. Although the fact is well known that land subsidence of new reclamation area is largely caused by soil consolidation, the evaluation on consolidation degree of soil layers and its influence have rarely been reported (Yu et al., 2021). It is critical to monitor land settlement continuously and to estimate the soil consolidation towards better construction planning for the subsequent coastal engineering. Therefore, in addition to the need for a multi-scale comprehensive analysis for the soil consolidation subsidence mechanism, In-SAR measurements and geotechnical-derived modes are suggested to combine for predicting the forthcoming time evolution of ground subsidence over reclaimed land.
(3) The laws and regulations on subsidence control in the new reclamation area are supposed to be dynamically adjusted and to be seriously implemented. Though the Regulations for the Prevention of Land Subsidence in Shanghai has come into effect since 2013, and the land subsidence risk level of each district in Shanghai has been determined, the management system of its prevention and control needs to be further improved. For example, the settlement control plan should be refined by subdivision according to subsidence monitoring data and local conditions. At the same time, the formulation of the implementation programme of civil engineering project needs to be based on the scientific evaluation of the impact of land subsidence, which should weigh the short and long-term interests to ensure the sustainable development of the new reclamation area.
4.4 Limitations and future work
The remote sensing inversion results can be compared with previous ones. For example, in the period of 2007-2010, the subsidence area and magnitude of settlement obtained in our research are consistent with the study of Yang et al. (2018) and Zhao et al. (2019). Yet, the reliability of recent subsidence (2017-2020) needs to be further confirmed. In future research, we can try to verify the results with leveling observation data, compare the results of different datasets using the same method, or compare the results of different inversion methods for the same dataset. However, the precision evaluation for PS points proved that the subsidence information is reliable in our study (stated in 3.1), and the inversion results are valuable for understanding the characteristics of land subsidence in Shanghai reclaimed area from a macroscopic and long-term perspective.
5 Conclusions
The spatial-temporal distribution of land subsidence in Shanghai new reclaimed area was presented in the research based on ENVIST ASAR and Sentinel-1A SLC images, respectively. It was proved that PS-InSAR technique can obtain large-scale and long-term land subsidence characteristics of new reclaimed land, reveal the strength trend and spatial distribution of the ground deformation field, and provide guidance for the network monitoring of field measurement methods. Compared with ASAR data, Sentinel-1A, with higher temporal and spatial resolution, can detect more coherent point targets, displaying more comprehensive and detailed deformation field distribution features. Settlement rates showed that there was uneven subsidence in the reclaimed area, gradually slowing down over the 10 years, and the subsidence in offshore was more significant than that in the inland area, serious zones (subsidence rate exceeding -20 mm/a) mainly concentrated around Dishui Lake and the seawall. The subsidence monitoring of the reclamation area in Shanghai will help to provide data and technical support for the development and construction of Shanghai’s coastal zone and the risk assessment of urban inundation.
Data availability statement
The original contributions presented in the study are included in the article/Supplementary Material. Further inquiries can be directed to the corresponding author.
Author contributions
Data processing, DL. Funding acquisition, XH and BL. Investigation, DL, YZ, CF and HX. Methodology, DL. Software, DL and HX. Supervision, XH. Writing – original draft, DL. Writing – review and editing, XH. All authors contributed to manuscript revision, read and approved the submitted version.
Funding
This work was supported by Strategic Priority Research Program of the Chinese Academy of Sciences (Grant No. XDA19060205), Research Funds of Beijing VMinFull Limited (Grant No. VMF2021RS), and Shandong Provincial Natural Science Foundation (Grant No. ZR2020QD090).
Acknowledgments
The authors would like to thank the ESA for providing the ENVISAT/ASAR and Sentinel-1A data. USGS holds the ownership of SRTM digital elevation model (DEM).
Conflict of interest
Authors DL and BL are employed by Beijing VMinFull Limited.
The remaining authors declare that the research was conducted in the absence of any commercial or financial relationships that could be construed as a potential conflict of interest.
The authors declare that this study received funding from Beijing VMinFull Limited. The funder was involved in the writing of this article and the decision to submit it for publication.
Publisher’s note
All claims expressed in this article are solely those of the authors and do not necessarily represent those of their affiliated organizations, or those of the publisher, the editors and the reviewers. Any product that may be evaluated in this article, or claim that may be made by its manufacturer, is not guaranteed or endorsed by the publisher.
Supplementary material
The Supplementary Material for this article can be found online at: https://www.frontiersin.org/articles/10.3389/fmars.2022.1000523/full#supplementary-material
References
Agarwal V., Kumar A., Gee D., Grebby S., Gomes R. L., Marsh S. (2021). Comparative study of groundwater-induced subsidence for London and Delhi using PSInSAR. Remote Sens. 13 (23), 4741. doi: 10.3390/rs13234741
Berardino P., Fornaro G., Lanari R., Sansosti E. (2002). A new algorithm for surface deformation monitoring based on small baseline differential SAR interferograms. IEEE Trans. Geosci. Remote Sens. 40 (11), 2375–2383. doi: 10.1109/TGRS.2002.803792
Chen Y., Liao M., Wu J., Li X., Xiong F., Liu S., et al. (2022). Elastic and inelastic ground deformation in shanghai lingang area revealed by sentinel-1, leveling, and groundwater level data. Remote Sens. 14 (11), 2693. doi: 10.3390/rs14112693
Chen G., Zhang Y., Zeng R., Yang Z., Chen X., Zhao F., et al. (2018). Detection of land subsidence associated with land creation and rapid urbanization in the Chinese loess plateau using time series InSAR: A case study of lanzhou new district. Remote Sens. 10 (2), 270. doi: 10.3390/rs10020270
Ding J., Zhao Q., Tang M., Calò F., Zamparelli V., Falabella F., et al. (2020). On the characterization and forecasting of ground displacements of ocean-reclaimed lands. Remote Sens. 12 (18), 2971. doi: 10.3390/rs12182971
Ferretti A., Prati C., Rocca F. (2000). Nonlinear subsidence rate estimation using permanent scatterers in differential SAR interferometry. IEEE Trans. Geosci. Remote Sens. 38 (5), 2202–2212. doi: 10.1109/36.868878
Foroughnia F., Nemati S., Maghsoudi Y., Perissin D. (2019). An iterative PS-InSAR method for the analysis of large spatio-temporal baseline data stacks for land subsidence estimation. Int. J. Appl. Earth Obs. Geoinf. 74, 248–258. doi: 10.1016/j.jag.2018.09.018
Gong S. (1995). Analysis of land subsidence in shanghai pudong new area. Shanghai Geol. 16 (2), 9–18. doi: CNKI:SUN:SHAD.0.1995-02-001
Guo J., Hu J., Li B., Zhou L., Wang W. (2017). Land subsidence in tianjin for 2015 to 2016 revealed by the analysis of sentinel-1A with SBAS-InSAR. J. Appl. Remote Sens. 11 (2), 026024. doi: 10.1117/1.JRS.11.026024
Herrera-García G., Ezquerro P., Tomás R., Béjar-Pizarro M., López-Vinielles J., Rossi M., et al. (2021). Mapping the global threat of land subsidence. Science 371 (6524), 34–36. doi: 10.1126/science.abb8549
Hooper A., Zebker H., Segall P., Kampes B. (2004). A new method for measuring deformation on volcanoes and other natural terrains using InSAR persistent scatterers. Geophys. Res. Lett. 31 (23), L23611. doi: 10.1029/2004GL021737
Jiang Y., Liao M., Wang H., Zhang L., Balz T. (2016). Deformation monitoring and analysis of the geological environment of pudong international airport with persistent scatterer SAR interferometry. Remote Sens. 8 (12), 1021. doi: 10.3390/rs8121021
Jiang L., Lin H. (2010). Integrated analysis of SAR interferometric and geological data for investigating long-term reclamation settlement of chek lap kok airport, Hong Kong. Eng. Geol. 110 (3), 77–92. doi: 10.1016/j.enggeo.2009.11.005
Jiang G., Yao Y., Tang Z. (2002). The analysis for influencing factors of fine sediment flocculation in the changjiang estuary. Acta Oceanol. Sin. 24 (4), 51–57. doi: 10.3321/j.issn:0253-4193.2002.04.006
Li D., Hou X., Song Y., Zhang Y., Wang C. (2020). Ground subsidence analysis in tianjin (China) based on sentinel-1A data using MT-InSAR methods. Appl. Sci.-Basel 10 (16), 5514. doi: 10.3390/app10165514
Liu G., Buckley S. M., Ding X., Chen Q., Luo X. (2009). Estimating spatiotemporal ground deformation with improved permanent-scatterer radar interferometry. IEEE Trans. Geosci. Remote Sens. 47 (8), 2762–2772. doi: 10.1109/TGRS.2009.2016213
Luo Q., Perissin D., Zhang Y., Jia Y. (2014). L- and X-band multi-temporal InSAR analysis of tianjin subsidence. Remote Sens. 6 (9), 7933–7951. doi: 10.3390/rs6097933
Lyu M., Ke Y., Guo L., Li X., Zhu L., Gong H., et al. (2020). Change in regional land subsidence in Beijing after south-to-north water diversion project observed using satellite radar interferometry. GISci. Remote Sens. 57 (1), 140–156. doi: 10.1080/15481603.2019.1676973
Malik K., Kumar D., Perissin D., Pradhan B. (2022). Estimation of ground subsidence of new Delhi, India using PS-InSAR technique and multi-sensor radar data. Adv. Space Res. 69 (4), 1863–1882. doi: 10.1016/j.asr.2021.08.032
Ma G., Zhao Q., Wang Q., Liu M. (2018). On the effects of InSAR temporal decorrelation and its implications for land cover classification: The case of the ocean-reclaimed lands of the shanghai megacity. Sensors 18 (9), 2939. doi: 10.3390/s18092939
Nicholls R. J., Lincke D., Hinkel J., Brown S., Vafeidis A. T., Meyssignac B., et al. (2021). A global analysis of subsidence, relative sea-level change and coastal flood exposure. Nat. Clim. Change 11 (4), 338–342. doi: 10.1038/s41558-021-00993-z
Ramirez R. A., Lee G.-J., Choi S.-K., Kwon T.-H., Kim Y.-C., Ryu H.-H., et al. (2022). Monitoring of construction-induced urban ground deformations using sentinel-1 PS-InSAR: The case study of tunneling in dangjin, Korea. Int. J. Appl. Earth Obs. Geoinf. 108, 102721. doi: 10.1016/j.jag.2022.102721
Syvitski J. P. M., Kettner A. J., Overeem I., Hutton E. W. H., Hannon M. T., Brakenridge G. R., et al. (2009). Sinking deltas due to human activities. Nat. Geosci. 2 (10), 681–686. doi: 10.1038/ngeo629
Wang H., Jiao X. (2015). Control strategy of land subsidence in shanghai under sea-level rise. Clim. Change Res. 11 (4), 256–262. doi: 10.3969/j.issn.1673-1719.2015.04.004
Wang J., Yi S., Li M., Wang L., Song C. (2018). Effects of sea level rise, land subsidence, bathymetric change and typhoon tracks on storm flooding in the coastal areas of shanghai. Sci. Total Environ. 621, 228–234. doi: 10.1016/j.scitotenv.2017.11.224
Wu L., Wang J., Zhou J., Yang T., Yan X., Zhao Y., et al. (2020). Multi-scale geotechnical features of dredger fills and subsidence risk evaluation in reclaimed. Mar. Geores. Geotechnol. 38 (8), 947–969. doi: 10.1080/1064119X.2019.1644406
Yang M., Yang T., Zhang L., Lin J., Qin X., Liao M. (2018). Spatio-temporal characterization of a reclamation settlement in the shanghai coastal area with time series analyses of X-, c-, and l-band SAR datasets. Remote Sens. 10 (2), 329. doi: 10.3390/rs10020329
Ye S., Xue Y., Wu J., Yan X., Yu J. (2016). Progression and mitigation of land subsidence in China. Hydrogeol. J. 24 (3), 685–693. doi: 10.1007/s10040-015-1356-9
Yuan L., Cui Z., Yang J., Jia Y. (2020). Land subsidence induced by the engineering-environmental effect in shanghai, China. Arab. J. Geosci. 13, 251. doi: 10.1007/s12517-020-5224-0
Yuan X., Wang Q., Lu W., Zhang W., Chen H., Zhang Y. (2018). Indoor simulation test of step vacuum preloading for high-clay content dredger fill. Mar. Geores. Geotechnol. 36 (1), 83–90. doi: 10.1080/1064119X.2017.1285381
Yu Q., Wang Q., Yan X., Yang T., Song S., Yao M., et al. (2020). Ground deformation of the chongming East shoal reclamation area in shanghai based on SBAS-InSAR and laboratory tests. Remote Sens. 12 (6), 1016. doi: 10.3390/rs12061016
Yu Q., Yan X., Wang Q., Yang T., Lu W., Yao M., et al. (2021). A spatial-scale evaluation of soil consolidation concerning land subsidence and integrated mechanism analysis at macro-, and micro-scale: A case study in chongming East shoal reclamation area, shanghai, China. Remote Sens. 13 (12), 2418. doi: 10.3390/rs13122418
Zhang T., Shen W., Wu W., Zhang B., Pan Y. (2019). Recent surface deformation in the tianjin area revealed by sentinel-1A data. Remote Sens. 11 (2), 130. doi: 10.3390/rs11020130
Zhao Q., Ma G., Wang Q., Yang T., Liu M., Gao W., et al. (2019). Generation of long-term InSAR ground displacement time-series through a novel multi-sensor data merging technique: The case study of the shanghai coastal area. ISPRS-J. Photogramm. Remote Sens. 154, 10–27. doi: 10.1016/j.isprsjprs.2019.05.005
Keywords: land subsidence, reclamation area, Shanghai, PS-InSAR, sustainability
Citation: Li D, Li B, Zhang Y, Fan C, Xu H and Hou X (2022) Spatial and temporal characteristics analysis for land subsidence in Shanghai coastal reclamation area using PS-InSAR method. Front. Mar. Sci. 9:1000523. doi: 10.3389/fmars.2022.1000523
Received: 22 July 2022; Accepted: 21 September 2022;
Published: 10 October 2022.
Edited by:
Shuisen Chen, Guangzhou Institute of Geography, ChinaReviewed by:
Xuguang Chen, Ocean University of China, ChinaKunchao Lei, Institute of Geology and Geophysics, (CAS), China
Copyright © 2022 Li, Li, Zhang, Fan, Xu and Hou. This is an open-access article distributed under the terms of the Creative Commons Attribution License (CC BY). The use, distribution or reproduction in other forums is permitted, provided the original author(s) and the copyright owner(s) are credited and that the original publication in this journal is cited, in accordance with accepted academic practice. No use, distribution or reproduction is permitted which does not comply with these terms.
*Correspondence: Xiyong Hou, eHlob3VAeWljLmFjLmNu