 Christina Bienhold1,2*
 Vibe Schourup-Kristensen3
 Thomas Krumpen4
 Eva-Maria Nöthig5
 Frank Wenzhöfer1,2,6
 Meri Korhonen7
 Myriel Vredenborg8
 Laura Hehemann9
 Antje Boetius1,2,10
- 1HGF-MPG Group for Deep Sea Ecology and Technology, Alfred Wegener Institute Helmholtz Center for Polar and Marine Research, Bremerhaven, Germany
- 2HGF-MPG Group for Deep Sea Ecology and Technology, Max Planck Institute for Marine Microbiology, Bremen, Germany
- 3Department of Ecoscience, Aarhus University, Roskilde, Denmark
- 4Sea Ice Physics, Alfred Wegener Institute Helmholtz Center for Polar and Marine Research, Bremerhaven, Germany
- 5Polar Biological Oceanography, Alfred Wegener Institute Helmholtz Center for Polar and Marine Research, Bremerhaven, Germany
- 6Department of Biology, HADAL – Danish Center for Hadal Research, University of Southern Denmark Nordcee, Odense, Denmark
- 7Department of Polar and Marine Research, Institute of Geophysics Polish Academy of Sciences, Warsaw, Poland
- 8Physical Oceanography of the Polar Seas, Alfred Wegener Institute Helmholtz Center for Polar and Marine Research, Bremerhaven, Germany
- 9Division Geosciences | Geophysics, Alfred Wegener Institute Helmholtz Center for Polar and Marine Research, Bremerhaven, Germany
- 10Marum Center for Marine Environmental Sciences, University of Bremen, Bremen, Germany
The central Arctic Ocean is rapidly changing due to amplified warming and sea ice retreat. Nonetheless, it remains challenging to document and decipher impacts on key ecosystem processes such as primary production and pelagic-benthic coupling, due to limited observations in this remote area. Here we investigated environmental changes at the Laptev Sea continental slope (60-3400 m water depth) from the surface to the seafloor, by replicating sample transects two decades apart. Mean break-up of sea ice occurred earlier and mean freeze-up occurred later in 2012 compared to 1993, extending the ice-free period by more than 30 days. On average, observations and model results showed an annual increase in primary production of 30% and more in the study area in 2012. In contrast, calculated and modelled fluxes of particulate organic carbon (POC) to the seafloor were only slightly higher in 2012 and did not extend as far into the deep Laptev Sea as the increase in primary production, possibly due to a more developed retention system. Nevertheless, benthic surveys revealed a substantial increase in phytodetritus availability at the seafloor along the entire transect from the shelf edge to the deep sea. This calls for carbon input by lateral advection from the shelves, additional input from sea ice, and/or a late summer bloom. We also investigated the composition and activity of bacterial communities at the seafloor and potential linkages to the observed environmental changes. While bacterial abundance, biomass and overall community structure showed no systematic differences between the two contrasting years at all depths, extracellular enzymatic activities had increased as a result of higher food availability. This was partly reflected in higher benthic oxygen uptake, indicating a moderate impact on benthic remineralization rates at the time of sampling. Our results show considerable effects of ocean warming and sea ice loss on the ecosystem from the surface ocean to the seafloor in the Laptev Sea, which are likely to continue in the coming decades.
1. Introduction
The Central Arctic Ocean and its vast surrounding shelves are undergoing rapid changes due to increasing air temperatures, ocean warming and the loss of sea ice (Janout et al., 2020; Previdi et al., 2021; Nicolaus et al., 2022). Across the Arctic Ocean, sea ice coverage has declined by about 13% per decade compared to the mean September sea ice extent for 1981-2010 (Perovich et al., 2010; Stroeve et al., 2012; Serreze and Meier, 2019), leading to increased periods of ice-free conditions throughout much of the Arctic Ocean (Notz and Stroeve, 2016; Peng et al., 2018). One important consequence is freshening of the upper ocean, causing increased stratification and limiting nutrient supply (Carmack, 2007; Rabe et al., 2014; Rabe et al., 2022). In addition to the loss in overall sea ice extent, a significant loss of multiyear ice (MYI) has been observed, with a decrease of MYI area by 17% per decade between 1979 and 2011 (Comiso, 2012). This is also reflected in an average thinning of the Arctic sea ice by a factor of two (from 3 m to 1.4 m) from 1957-1976 to 2003-2007 (Kwok and Rothrock, 2009; Perovich, 2011), and changing light transmission in summer by a factor of 3 (Nicolaus et al., 2012; Arndt and Nicolaus, 2014). This in turn has been accompanied by an increase in Arctic Ocean primary production (Arrigo et al., 2008; Vetrov and Romankevich, 2014; Lewis et al., 2020). Satellite-based assessments estimate that net primary production in the Arctic Ocean has increased by 57% since 1998, with highest increases on the eastern interior shelves, including the Laptev Sea (Arrigo et al., 2008; Petrenko et al., 2013; Frey et al., 2014; Lewis et al., 2020). Some studies have investigated the contribution of ice- and ice-associated algae to primary production, which can be considerable (e.g. Fernández-Méndez et al., 2015), but which may decline in the future with decreasing sea ice extent and loss of multi-year ice. All of these changes may lead to variations in the magnitude (Lalande et al., 2009) and composition of organic matter export (Lalande et al., 2019) from the surface. Furthermore, primary production is also limited by nutrient supply, and other potential changes in the pelagic food web (Torres-Valdés et al., 2013; Janout et al., 2016b). Changing growth conditions may favor smaller cells, such as nanoflagellates (Li et al., 2009), whereas melting sea ice favors sinking of aggregates of large diatom cells that grow attached to the underside of sea ice, e.g. Melosira arctica or Nitzschia frigida (Boetius et al., 2013; Lalande et al., 2019; Nöthig et al., 2020a).
Together, these changes (i.e. increasing temperatures, combined with declines in sea-ice extent, ice thickness and multiyear ice) are already impacting the composition of primary producers in the Arctic Ocean (Li et al., 2009; Nöthig et al., 2015a; Assmy et al., 2017), and resulting in shifting habitats for marine species (Kovacs et al., 2011; Wassmann et al., 2011). Much less is known about the propagation of such changes from the surface to the seafloor via pelagic-benthic coupling (e.g. Wassmann et al., 2004; Carmack and Wassmann, 2006; Grebmeier et al., 2006; Wassmann and Reigstad, 2011; Boetius et al., 2013; Rapp et al., 2018; Kedra and Grebmeier, 2021). However, the availability of organic matter at the seafloor is known to be a major driver for the structure and function of benthic communities, including fauna (Smith et al., 2008) and microbes (Boetius and Damm, 1998; Bienhold et al., 2012). Only few studies have investigated benthic communities in the Central Arctic and Laptev Sea, due to the difficult accessibility of these regions (Vanaverbeke et al., 1997; Steffens et al., 2006; Vedenin et al., 2018; Wiedmann et al., 2020b). Even less information is available about benthic bacterial communities (Boetius and Damm, 1998; Bienhold et al., 2012; Rapp et al., 2018; Walker et al., 2021), although they play an essential role in carbon and nutrient cycling (Jørgensen and Boetius, 2007). Thus, temporal changes in benthic community composition and function remain extremely difficult to determine due to the lack of (baseline) data and long-term observations, which are needed to assess changes in physical, chemical, and biological parameters over longer time scales.
Here we focus on the Arctic continental slope which has important functions for the climatology and ecology of the Arctic Ocean (Bluhm et al., 2020). The Laptev Sea and adjacent East Siberian Sea are among the widest continental margins on Earth. The Laptev Sea spans around 500,000 km2, with a mean depth of approximately 50 m (Jakobsson et al., 2004). The Laptev Sea shelf and slope system is relevant to the hydrography and sea ice physics of the entire Arctic, due to its role in sea ice formation (Krumpen et al., 2019). Observations over the past two decades reported negative trends in the timing of ice break-up (-3.8 d/decade between 1992 and 2019) and a significantly delayed onset of freeze-up (+8.5 d/decade between 1992 and 2019) in the Laptev Sea region (Krumpen et al., 2020). Accordingly, open-water area and duration have increased by 20% and 62%, respectively, between 1998 and 2018 (Lewis et al., 2020), with strongest changes in the past decade. At the same time, higher upper ocean temperatures have been recorded, e.g., exceeding 5°C in more recent years, in contrast to sub-zero temperatures in earlier ice-dominated years (Demidov et al., 2020; Janout et al., 2020). A satellite-based study provided first evidence that intensified melt in the marginal zones of the Arctic Ocean interrupts the transarctic conveyor belt and has led to a reduction of the survival rates of sea ice exported from the shallow Siberian shelves (Krumpen et al., 2019). As a consequence, less and less ice formed in shallow water areas has reached the Fram Strait, and more ice and ice-rafted material is released in the northern Laptev Sea and central Arctic Ocean.
The sea ice retreat and longer phytoplankton growing season have led to higher primary production in the area (Arrigo et al., 2008; Kahru et al., 2011; Vetrov and Romankevich, 2014), e.g. the annual production in the Laptev Sea sector was 65% higher in 2007 than mean production from 1998-2002 (Arrigo et al., 2008). Over the past two decades (1998-2018), sea-surface temperature has increased by 158%, satellite-based chlorophyll a concentrations by 11%, and integrated production by 112% (Lewis et al., 2020). Much of the increase in NPP can be attributed to an increase in open water area (Bélanger et al., 2013; Arrigo and van Dijken, 2015; Lewis et al., 2020), but increased storminess may be another contributing factor, by supplying additional nutrients through upwelling (Zhang et al., 2014; Crawford et al., 2020).
Recent studies have provided valuable baseline information and regional comparisons of pelagic communities in the Laptev Sea (Sukhanova et al., 2017; Sukhanova et al., 2019; Polyakova et al., 2021), and few have targeted benthic communities (e.g. Hansen et al., 2020; Kokarev et al., 2021). But even though the Laptev Sea is one of the Arctic regions most strongly affected by changes in sea ice cover, and primary production (Arrigo et al., 2008; Lewis et al., 2020), we lack information about long-term changes in the Laptev Sea ecosystem and its biological components (Schmid et al., 2006).
Here, we specifically investigated environmental differences at the Laptev Sea continental slope from the surface to the seafloor between two contrasting years, two decades apart. Samples from 1993, when the Laptev Sea was still largely ice-covered throughout the year, were used as ecological baseline against which Arctic change can be assessed. We returned to the study area in September 2012 to resample the same stations between 60 and 3400 m water depth. We hypothesized that the decline of sea ice cover over the Laptev Sea shelf and continental slope had led to: i) changes in the supply of organic matter to the seafloor, reflecting increased open water area and associated changes in primary production patterns in the area, and ii) subsequent changes in benthic microbial biomass, activity, and diversity.
2. Material and methods
2.1. Sampling site
Sampling stations were located along the Laptev Sea continental slope between 76-80°N and 110-140°E and covered water depths from 54 to 3427 m (Figure 1 and Table 1). Sampling took place during two expeditions with RV Polarstern: between 3rd and 18th September 1993 on PS27 (ARK-IX/4) and between 28th August and 2nd September 2012 on PS80 (ARK-XXVII/3). Station lists can be accessed via the PANGAEA data publisher for PS27 (Fütterer, 2016) and PS80 (Boetius, 2014). Profiles of temperature and salinity were obtained from CTD measurements during these expeditions in 1993 (Schauer and Rohardt, 2010) and 2012 (Rabe et al., 2012). Data presented here include remote sensing (sea ice and chlorophyll a concentrations), model data (chlorophyll a concentration, net primary production, export production) as well as direct sampling and measurement of parameters on board or in the home laboratory (chlorophyll a, POC, nutrients, benthic biogeochemical parameters). For spatially integrated data by remote sensing or modeling we defined an area of interest (AOI) of 269000 km2 between 76-80°N and 110-140°E (Table S1), which included the sampling stations (Table 1). For the results of this interdisciplinary multi-parameter study, we present individual values and/or averages and ranges, indicating the major trends down the slope and between the years. We refrain from performing statistical tests on the limited, yet valuable, number of samples from this remote Arctic location. Instead we focus on the combination of different datasets to provide a comprehensive overview and comparison from surface to seafloor.
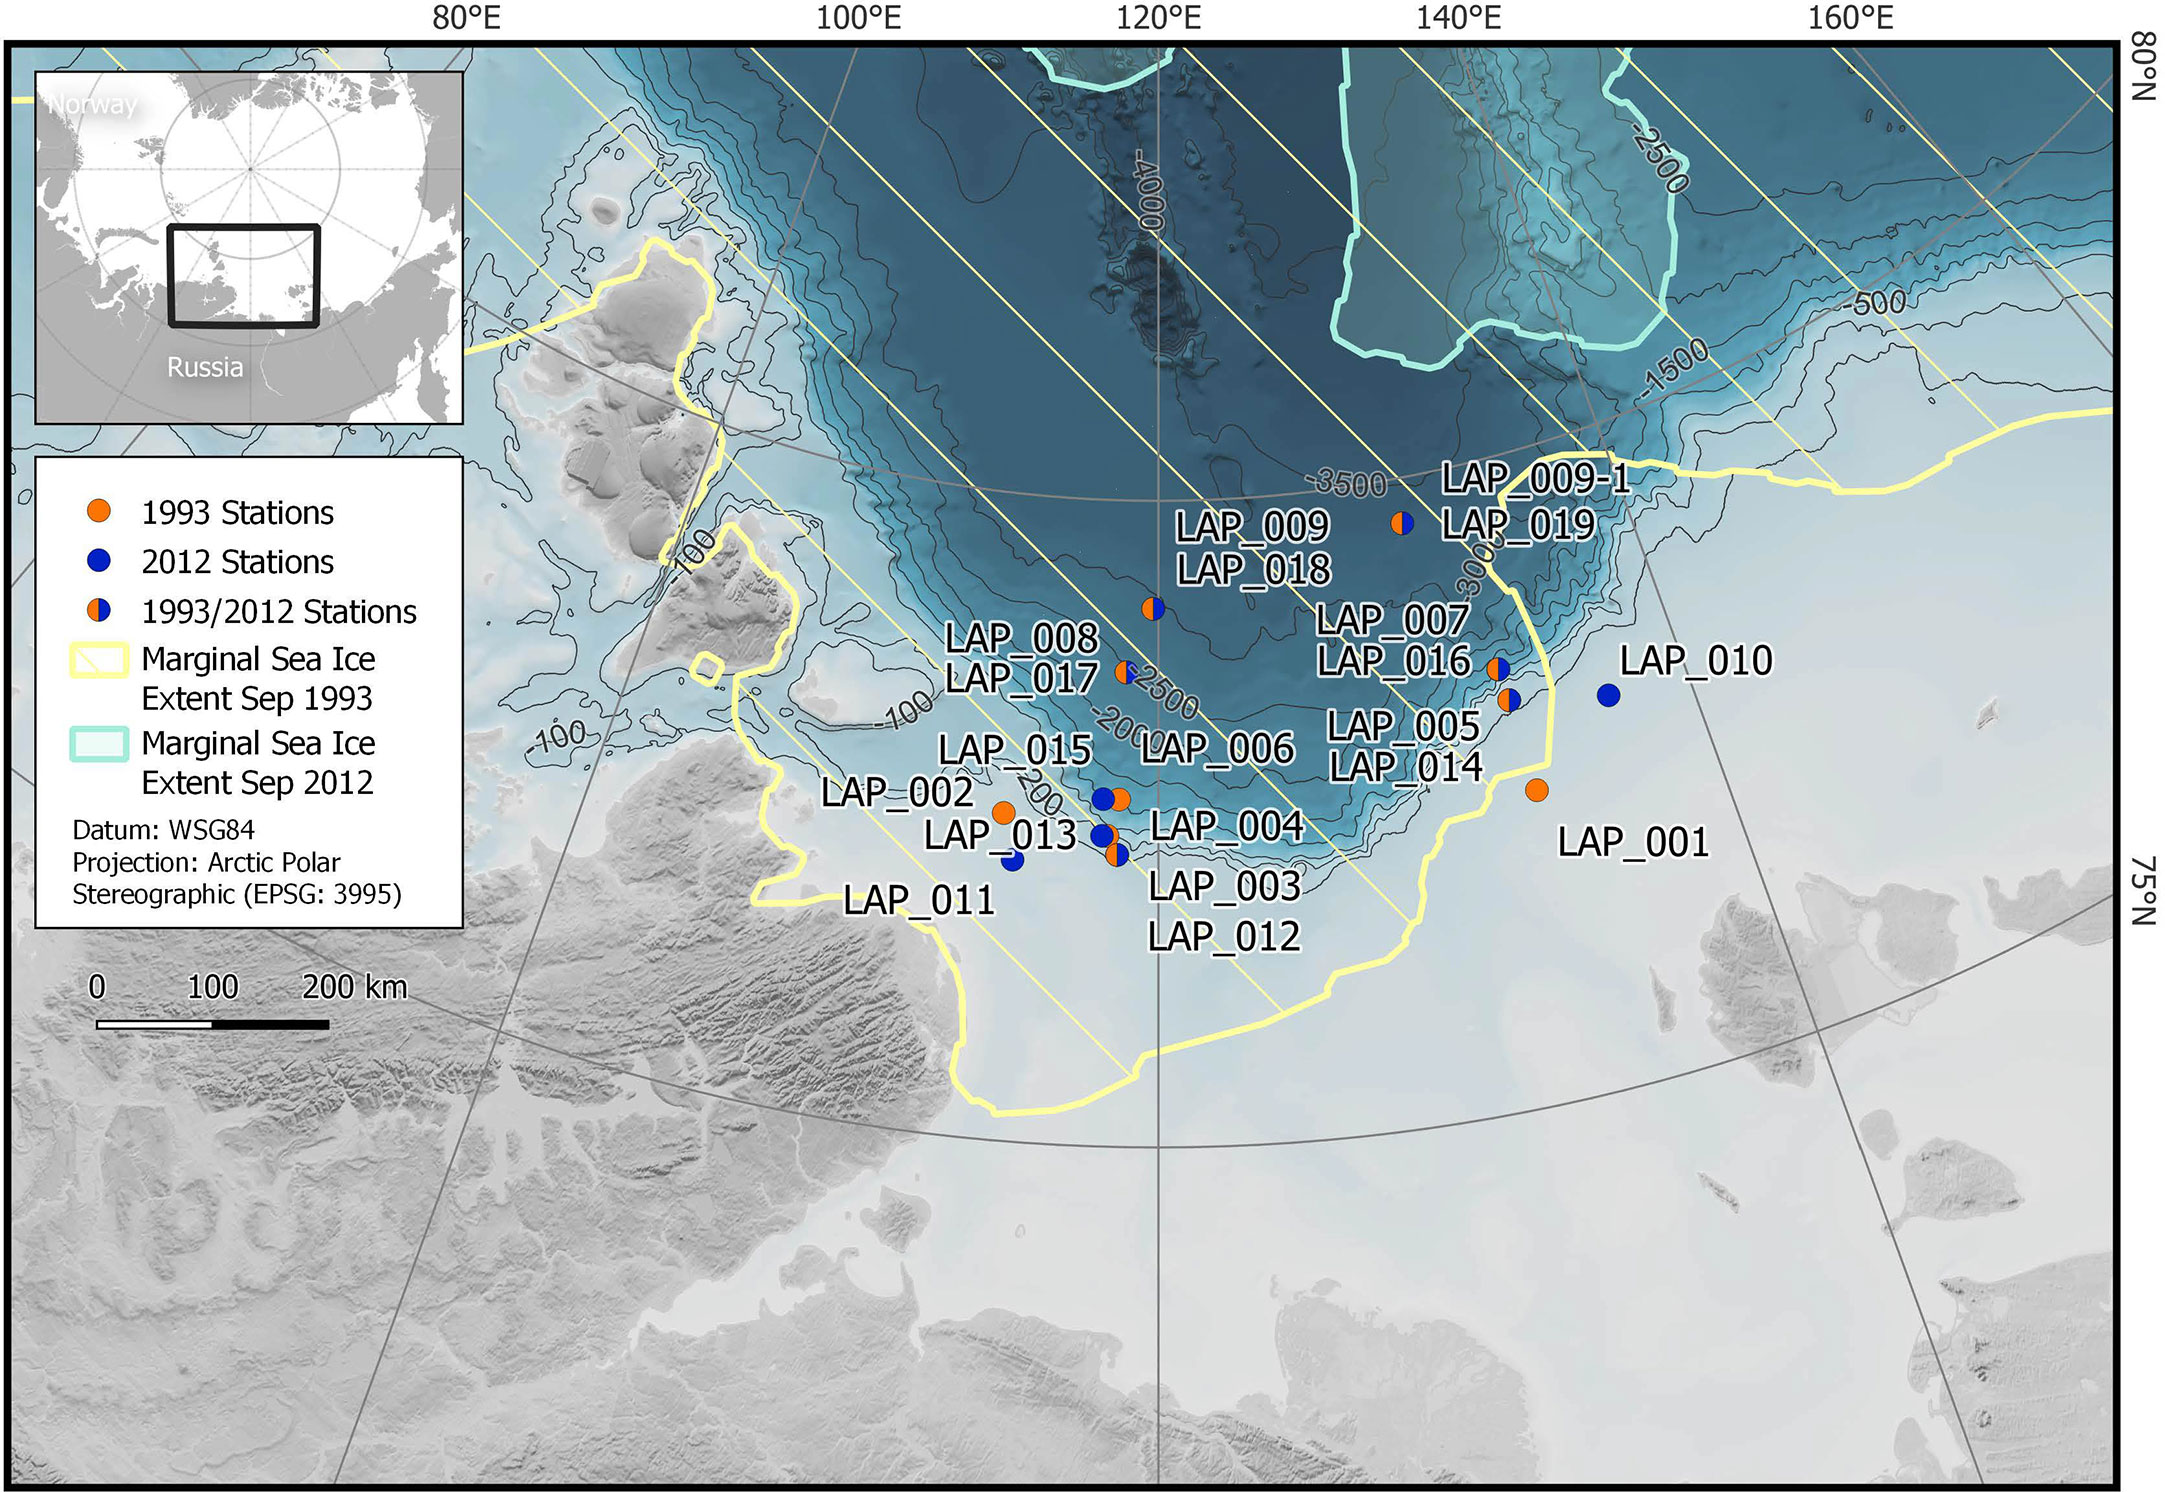
Figure 1 Sampling locations on the Laptev Sea continental slope. The same stations were targeted in 1993 and 2012; sampling took place in August/September (see Table 1 for exact positions and sampling dates). While the Laptev Sea was largely ice-covered throughout the year in 1993, the entire sampling area was ice-free in 2012. The marginal sea ice extent is indicated in yellow (1993) and blue (2012).
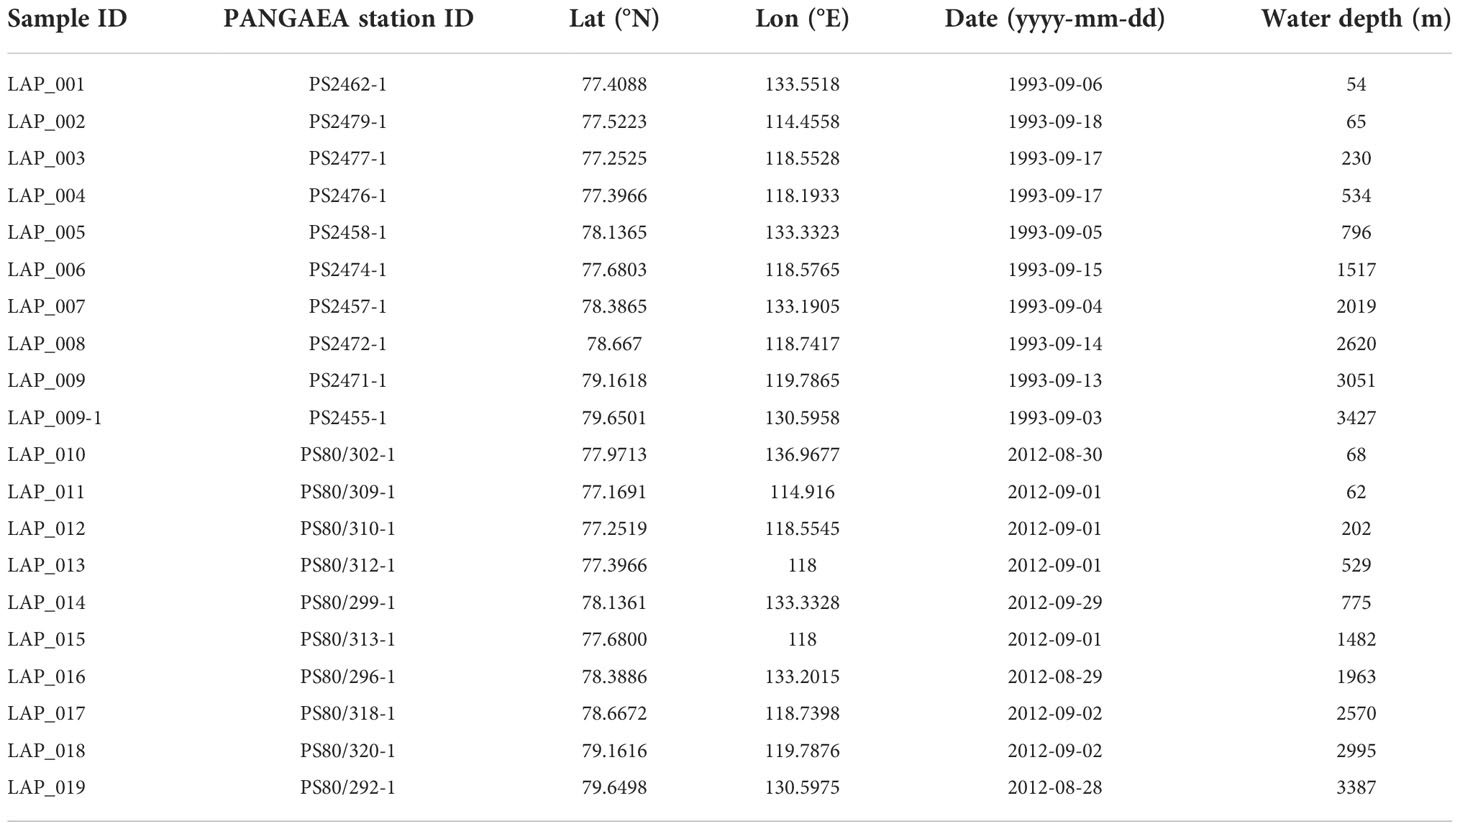
Table 1 Benthic stations down the Laptev Sea continental slope, sampled in September 1993 and August/September 2012.
2.2. Sea ice and sea surface temperature
The seasonal evolution of satellite-based sea ice concentration in the sampling area is based on 85 GHz SSM/I brightness temperatures provided by CERSAT (Center for Satellite Exploitation and Research). Daily sea ice concentration estimates are calculated using the ARTIST Sea Ice (ASI) algorithm and available on a 12.5 km×12.5 km grid (Ezraty et al., 2007). The same product was applied to determine the timing of sea ice break-up and freeze-up for the region between 76° N, 110° E and 80° N, 140° E. An ice-free grid point is defined as the first day in a series of at least 10 d when ice concentration reaches zero (Janout et al., 2016b).
The time series of sea surface temperature (SST) is based on the CMEMS OSTIA reprocessed analysis product. It is a satellite and in-situ foundation SST analysis created by the OSTIA (Operational SST and Ice Analysis) system using re-processed ESA SST CCI, C3S (Merchant et al., 2019) EUMETSAT and REMSS satellite data and in-situ data (Atkinson et al., 2014). The product provides the daily average SST at 20 cm depth on a regular global grid at 0.05° since 1981 (Good et al., 2020).
2.3. Modelled chlorophyll, net primary production and export flux
We used a biogeochemical ocean model to estimate the mean chlorophyll a concentrations, net primary production (NPP) vertically integrated from the surface to the seafloor, as well as the vertical flux of POC to the seafloor in the area of interest. These calculations were carried out for the summer time period from July to September for both 1993 and 2012. Mean values were extracted for the area of interest.
The Regulated Ecosystem Model REcoM2 (Schourup-Kristensen et al., 2014) is a medium-complexity biogeochemical model based on the nutrients nitrate, silicate and iron. It entails two phytoplankton classes (nanophytoplankton and diatoms), one zooplankton and one detritus class. REcoM2 is coupled to the hydrodynamic model FESOM, a Finite Element Sea-ice Ocean Model (Wang et al., 2014), which runs on an unstructured, triangulated grid, making it possible to locally increase resolution for a better description of small scale processes in areas of interest. In the current study we employ a global mesh that has been refined to a 4.5 km resolution in the Arctic Ocean north of 60°N (Wekerle et al., 2017; Wang et al., 2018). Riverine input of DIN, dissolved inorganic silicon (DSi) and organic nitrogen (DON) was supplied by the model-based database Global NEWS version 2 (Beusen et al., 2009; Mayorga et al., 2010). Aeolian input of nitrate to the surface water was incorporated by using global 10-year mean fields from 1850 to 2000 (Lamarque et al., 2010). The effect of sea ice coverage on PAR is taken into account by scaling the surface PAR linearly with the fraction of open water in a given model node, thereby neglecting the fraction of PAR that penetrates the sea ice directly. This simplification is a common technique used in large-scale biogeochemical models (Castellani et al., 2022).
For the biogeochemical setup, the macronutrients DIN and DSi were initialized from World Ocean Atlas 2005 (Garcia and Levitus, 2006) and the dissolved inorganic carbon (DIC) and alkalinity were initialized using the GLODAP database (Key et al., 2004). Due to scarcity of iron measurements, the model’s iron concentration was initialized with an output file from the Pelagic Interaction Scheme for Carbon and Eco-system Studies model [NEMO-PISCES, (Aumont and Bopp, 2006)]. All other tracers were initialized using very small values. After spin-up of FESOM (Wekerle et al., 2017), the coupled REcoM2-FESOM model was run from 1980 to 2015. Atmospheric forcing was provided by the Japanese reanalysis dataset (Japan Meteorological Agency, 2013). The biological model performance has been assessed by (Schourup-Kristensen et al., 2018).
2.4. Satellite chlorophyll and sea ice concentration data for comparison with model
We extracted daily values of satellite-based chlorophyll a estimates from the GlobColour project (MODIS-Aqua L3M algorithm with 4 km resolution), which has been developed, validated, and distributed by ACRI-ST, France (http://globcolour.info). Data were only available for the year 2012. To obtain daily values of chlorophyll a concentration within the area of interest, we masked out positions with data for each day and spatially averaged them. This calculation was done for June to September, as no data are available before June. Sea ice concentration was retrieved from the National Snow and Ice Data Center - NSIDC (Cavalieri et al., 1996, updated yearly, accessed: 15 Mar 2017).
2.5. Water column chlorophyll a, POC, nutrients
All parameters were retrieved from corresponding stations in 1993 (n=10) and 2012 (n=9). Chlorophyll a and POC concentrations from 1993 and 2012 were retrieved from PANGAEA (Nöthig et al., 2015b; Nöthig and Springer, 2015) and from (Nöthig et al., 2020b); measurements covered 5 discrete depths across the upper 50 m. Nutrient concentrations for 1993 (Luchetta et al., 2021) and 2012 (Bakker, 2014) were retrieved from the PANGAEA database, and covered 21 stations across the study area (n=21). Between 0 and 100 m water depth nutrients were measured at 5-7 discrete depths. In 1993, nutrient concentrations were measured according to the method of (Grasshoff et al., 1983), using a Chemlab Continuous Flow Analyzer (see also Olsson et al., 1999). In 2012, nutrient concentrations were measured with a standard photometric method using a Technicon TRAACS 800 continuous flow auto-analyser (Technicon Corporation) according to established methods (Boetius et al., 2013; Fernández-Méndez et al., 2015).
2.6. New production
New primary production was calculated from the seasonal nutrient drawdown in the mixed layer since previous winter (Boetius et al., 2013; Fernández-Méndez et al., 2015). In order to obtain continuous vertical nutrient profiles, the Reiniger-Ross method (Reiniger and Ross, 1968) was used to interpolate between the sampling depths. The maximum depth of winter convection was determined as the temperature minimum located below the summer halocline, following Rudels et al. (1996) and Korhonen et al. (2013). The temperature minimum is considered a remnant of the winter mixed layer, representing conditions in the surface layer during previous winter. Nutrient concentrations in the winter mixed layer were estimated to be equal to the values observed at the depth of the temperature minimum. Using these values as a baseline in the beginning of the productive season, new production was integrated within the surface layer above the temperature minimum. Due to the lack of nutrient sampling near the surface in 1993, the upper 15 m were considered to be completely mixed and thus the observation at 15 m was extrapolated as constant up to the surface. Even when shallower observations existed, they were discarded. For consistency, this approximation was also applied to the nutrient profiles from 2012, although shallower measurements were available. For 2012, results with extrapolated values were compared to results with the observed values and did not show large differences (Table S2). We included additional stations in the area of interest (i.e. not limited to the exact stations sampled for benthic work) for better coverage of the region.
2.7. Biogeochemical measurements of sediment samples
Methods used in 2012 were aligned with procedures in 1993 (Boetius and Damm, 1998), to allow for direct comparisons between the two years (for further information see method descriptions below). Datasets from 1993 were retrieved from PANGAEA, and are listed in Table 2.
Sampling in 2012 was conducted with a TV-guided multiple corer (MUC), in order to retrieve undisturbed sediment cores. Upon retrieval of the MUC, the overlying water was carefully removed from each core and the upper first centimeter of sediment was cut using a steel plate and a custom-made plastic ring. At each station (n=10), sediment samples from three replicate cores were pooled and transferred to a cooling container (0°C), where subsamples for further analyses were taken.
Samples for chloroplastic pigment equivalents, extracellular enzymatic activity and oxygen uptake were processed and measured directly on board, while samples for total organic carbon, bacterial abundance and bacterial diversity were stored and further processed in the home laboratory.
2.7.1. Chloroplastic pigments, total organic carbon, bacterial abundance and extracellular enzymatic activity
Chloroplastic pigments were extracted from 1 ml sediment with 3x8 ml acetone (90%), including the addition of glass beads and grinding of the samples in a cell mill Boetius and Damm (1998). Samples were centrifuged and chlorophyll a and phaeopigment (after addition of 30 µl 25% HCl) concentrations were determined in the supernatant by fluorometric measurement with a Turner Trilogy fluorometer with the “Chlorophyll a Acidification” fluorescence module. Measurements were performed in triplicate for each sample. Chlorophyll and phaeopigment concentrations were calculated as follows:
Where Chl a: chlorophyll a, Phaeo: phaeopgiments, RFUb: relative fluorescence units before acidification, RFUa: relative fluorescence units after acidification, CF: calibration factor (slope of linear regression of calibration curve), AF: Acid factor (see below), f: dilution factor.
The acid factor (AF) is calculated from the acid ratio (AR), the acid ratio being the sum of fluorescence ratios before and after acidification for the calibration standards.
Chloroplastic pigment equivalents (CPE) are the sum of chlorophyll a and phaeopigment concentrations.
Samples for total organic carbon (TOC) measurements were stored at -20°C, before measurements in the home laboratory. TOC was determined with a CNS elemental analyzer (EA/NA, Fisons Instruments) after combustion at 1050°C; inorganic carbon was removed by acidification of a sample aliquot with hydrochloric acid.
For the determination of bacterial abundance, 2 ml sediment were fixed in 9 ml formaldehyde/seawater at a final concentration of 2-4% formaldehyde and stored at 4°C. Bacterial cell counts were performed using acridine orange direct counts (Meyer-Reil, 1983) following the protocol described in (Boetius and Damm, 1998; Hoffmann et al., 2017). A total of 60 grids over two replicate filters were counted for each sample. Bacterial biomass was estimated using a conversion factor of 3 x 10-13 g C µm-3 (Børsheim et al., 1990), and assuming an average cell volume of 0.07 µm3 (Boetius and Lochte, 1996).
The potential extracellular enzymatic activities of the hydrolases beta-glucosidase, chitobiase, aminopeptidase and extracellular enzymes acting as esterases were determined in alignment with Boetius and Lochte (1994). The method uses small substrate proxies linked to a fluorophore (Hoppe, 1983; Arnosti, 2011). When the fluorophore is cleaved from the substrate, enzymatic hydrolysis is measured as an increase in fluorescence with time. The substrates and final concentrations are listed in Table S3. After substrates were added to sediment slurries, samples were incubated at in situ temperature on a test tube shaker. At 3 time points (after ~ 70, 190, 300 Min), 1 ml of incubate was withdrawn and the reaction stopped with the addition of 250 µl borate buffer. After centrifugation at 3500 g for 10 minutes at in situ temperature, the supernatant was transferred to UV cuvettes and fluorescence was measured with a Hitachi F-2000 spectrofluorometer (Boetius and Damm, 1998). Determinations of extracellular enzymatic activities were performed in triplicate for all samples. Fluorescence of methylumbelliferyl (MUF) and methylcoumarin (MCA)-labelled substrates was determined at an excitation and emission wavelength of 365 nm and 445 nm, respectively. Fluorescein diacetate (FDA)-labelled substrates were measured at 470 nm and 510 nm, respectively. The increase in liberated fluorochrome per time is calculated as the average of the differences between time points, each divided by the time of incubation between measurements, and is then converted to enzyme activity (µM h-1).
2.7.2. Oxygen consumption rates
Benthic oxygen consumption rates were determined from ex situ microsensor measurements of diffusive oxygen uptake in retrieved sediment cores (n=8), consistent with Boetius and Damm (1998). Directly after recovery, cores were stored at in situ temperature and the overlying water gently stirred by rotating small magnets to avoid the development of a stagnate water body above the sediment. Core recovery can alter oxygen consumption estimates, especially temperature increase and lysis of organic material can stimulate consumption processes (Glud, 2008). In our case, core heating can be excluded. An increase in oxygen consumption due to short-term availability of labile organic material cannot be ruled out. High-resolution microprofiles across the sediment water interface were measured using Clark-type O2 microelectrodes equipped with a guard cathode (Revsbech, 1989) mounted to motorized micromanipulator (Glud et al., 2009). Sensors were calibrated at in situ temperature against (1) air-saturated bottom water taken from the overlying water from the MUC cores (100% saturation), and (2) dithionate-spiked bottom water (anoxic). Microprofiles across the sediment-water interface were measured with a vertical resolution of 100 μm on a total length of max. 5 cm. The diffusive oxygen uptake (DOU, mmol m-2 d-1) was calculated from the O2 gradient just below the sediment surface and Fick’s first law of diffusion (Rasmussen and Jorgensen, 1992).
where Ds (cm-2 s-1) = molecular diffusion coefficient in sediment, calculated as Ds = D0 * por m-1, where por is the porosity, D0 = diffusion coefficient in water and m = 3 (Berner, 1980; Ullman and Aller, 1982), C (μM) = solute concentration, z (cm) = depth in the sediment.
2.7.3. Bacterial diversity fingerprinting
After retrieval on board, sediment samples (n=10) for DNA extraction were stored at -20°C until further analyses. Samples from PS27 (1993) were continuously stored at -20°C. These samples were extracted in 2007/2008, i.e. after 14.5 years of storage time. Samples from PS80 were extracted after 1 year of storage time.
DNA was extracted from 1 g of sediment using the UltraClean Soil DNA Isolation Kit (MoBio Laboratories, USA) for samples from 1993 and from 0.5 g of sediment using the MoBio Power Soil Kit (MoBio Laboratories, USA) for samples from 2012, using the protocols provided by the manufacturer; DNA was eluted in 60-100 µl Tris-EDTA-buffer and stored at -20°C. DNA concentrations were determined on a NanoDrop ND-1000 Spectrophotometer (NanoDrop Technologies Inc., USA) and ranged between 2-10 ng/µl for samples from 1993 and 5-74 ng/µl for samples from 2012.
Automated ribosomal intergenic spacer analysis (ARISA) was performed according to the procedure described in Bienhold et al. (2012). 16S rRNA gene amplicon sequencing was accomplished with 454 pyrosequencing technology, using primers covering the hypervariable V4-V6 region (530F GTGCCAGCMGCNGCGG, 1100R GGGTTNCGNTCGTTR). Sequencing was performed at the Research and Testing Laboratory, Texas. Flowgram files were processed and converted into an OTU-by-sample table using mothur v.1.37.6 (Schloss et al., 2009) according to the standard operating procedure (Schloss et al., 2011), including the implemented denoising algorithm (Quince et al., 2011). Alignment of sequences and taxonomic classifications were carried out using the SILVA reference database (release 138) (Pruesse et al., 2007) (Supplementary Material). The dataset consisted of 121,204 sequences. Sequences that were assigned to mitochondria, chloroplasts, Archaea, and Eukaryota were removed from the dataset. OTUs were clustered at a threshold of 3% sequence difference. Bacterial richness estimates were calculated with subsampling to the smallest dataset (1172 sequences in sample LAP_013). The corresponding script SubsampleNGS.R is available on github (https://github.com/chassenr/NGS). OTU tables were clr-transformed to compare changes in the abundance of bacterial genera along the water depth gradient and between years. Statistical analyses were performed and data visualized in R Studio (RStudio-Team, 2020) using R version 4.0.0 (R-Core-Team, 2020) and the packages ampvis2 (Andersen et al., 2018), phyloseq (McMurdie and Holmes, 2013), scico (Pedersen and Crameri, 2008), vegan (Oksanen et al., 2010), as well as tidyr, ggplot2, dplyr, and tibble from tidyverse (Wickham et al., 2019). Bioinformatic scripts are provided as Supplementary information.
2.8. Summary of carbon production, export and remineralization
In order to compare carbon production, export and remineralization at the seafloor, we harmonized all measurements to equivalent carbon units where possible, i.e. to g C m-2 yr-1. NPP was estimated to take place at the modelled daily rate for a productive period of ca. 3 months, i.e. from July to September, and was averaged over the area of interest (269,000 km2). New production calculated from nutrient drawdown is provided in Table S2 and was averaged over all stations. In accordance with NPP, modelled POC export flux to the seafloor was also calculated over a productive period of 92 days. POC flux (export production) to the seafloor based on new production from nutrient drawdown was calculated using the relationship of Berger et al. (1988): , where z is given in units of 100 m, and PP is the primary production. For fluxes at depths below 1000 m water depth, we used the following formula, also according to Berger et al. (1988): , where r is 1%.
Carbon remineralization rates were calculated from oxygen uptake at the seafloor assuming a molar ratio of C = 0.77 O2 as in Boetius and Damm (1998) and integrated over the productive season (Jul-Sep) and over one year (365 days). Chlorophyll pigment concentrations at the seafloor were converted to carbon units assuming a C:Chl ratio of 100 (Boon and Duineveld, 1998; Vernet et al., 2017; Demidov et al., 2021). Different C:Chl ratios would either increase or decrease the estimated carbon biomass at the seafloor, but not change the relative difference between years, unless ratios differ significantly between the years, which we cannot resolve here.
2.9. Data availability
Environmental data are provided at the World Data Center PANGAEA (https://www.pangaea.de/) and are referenced in the text and in Table 2. Amplicon sequence data (standard flowgram files) have been deposited in the European Nucleotide Archive (ENA) at EMBL-EBI under accession number PRJEB43433 (https://www.ebi.ac.uk/ena/data/view/PRJEB43433) using the data brokerage service of the German Federation for Biological Data (GFBio, Diepenbroek et al., 2014), in compliance with the Minimal Information about any (X) Sequence (MIxS) standard (Yilmaz et al., 2011).
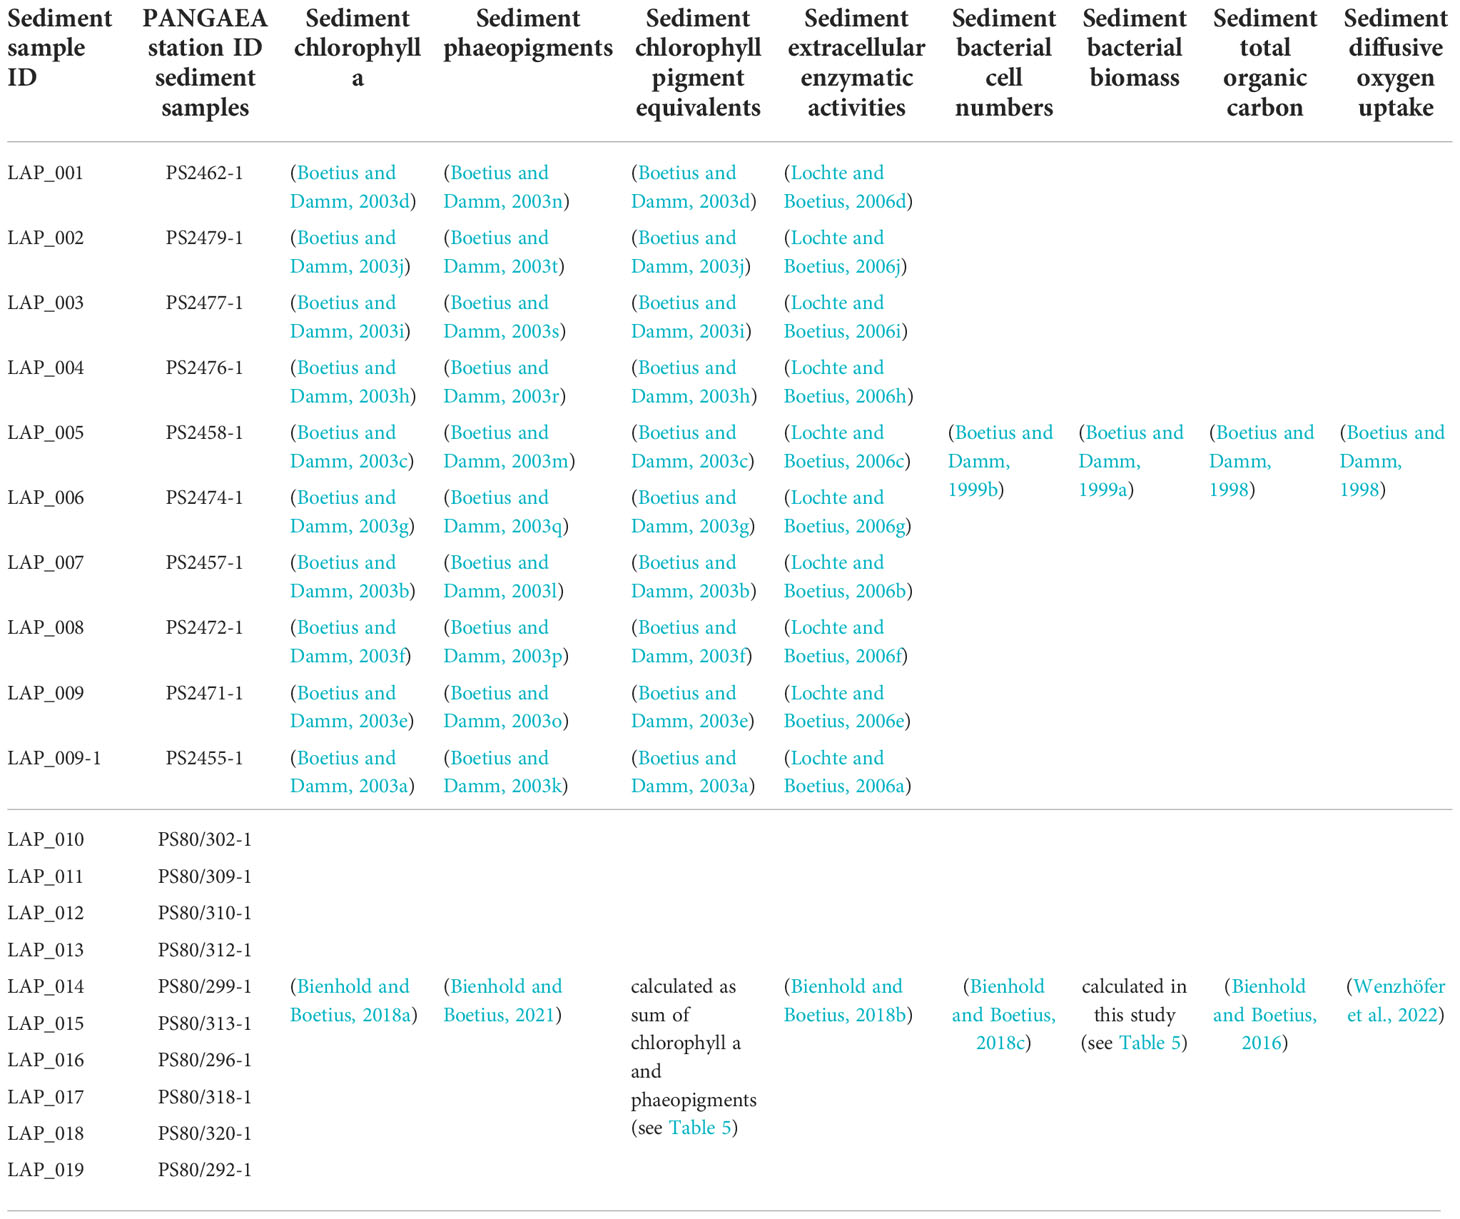
Table 2 Dataset citations for sediment data from the Laptev Sea continental slope in 1993 and 2012.
3. Results
3.1. Differences between ocean surface physical and biogeochemical conditions (1993 vs. 2012)
3.1.1. Sea ice, sea surface temperature and hydrography
Sea ice cover (15 Aug – 14 Sep) in the Laptev Sea AOI decreased from 1992 to 2020. Average ice concentrations were 48% for the period 1992-2005 and 16% for the period 2006-2020 (Figure S1), and 1993 (75%) and 2012 (1%) represent relatively high and low ice concentrations within these periods, respectively. While the sampling area was mostly ice covered in summer 1993, it was completely ice free in summer 2012 (Figure 1). The mean number of ice-free days differed by more than 50 days between the two years, with 29 days in 1993 and 82 days in 2012 (Figure 2). The timing of sea ice retreat shifted to earlier in the season and mean break-up of the ice occurred about 20 days earlier in 2012 (27 July) than it did in 1993 (19 Aug); mean freeze-up occurred later in 2012 (27 Oct) compared to 1993 (16 Sep) (Figure S2). These differences between the two years are also reflected in a positive decadal trend of the number of ice-free days per year between 1992 and 2020 (Figure 2C). SST over the same area increased from an average of -0.6°C for the period 1992-2005 to 1.3°C for the period 2006-2020, with 1993 (-1.5°C) and 2012 (1.9°C) on the lower and higher end of these values. Salinity and temperature measurements from CTD profiles at the time of sampling show a relatively warm and fresh surface layer in the top 10-20 m in 2012 that was not present in 1993 (Figures S3, S4). A more stable stratification in 2012 was also indicated by higher Brunt-Väisälä frequency (BVF) values, calculated from temperature, salinity and pressure using the CSIRO Marine Research MATLAB Seawater Software Library version 3.3 (Morgan, 1994) (Figure S5). For the eastern part of the study area the average BVF for 10 to 40 dbar was 3.5 x 10⁻⁴ s-2 in 1993 and 8.2 x 10⁻⁴ s-2 in 2012. For the western part average BVF was 0.8 x 10⁻⁴ s-2 in 1993 and 8.7 x 10⁻⁴ s-2 in 2012.
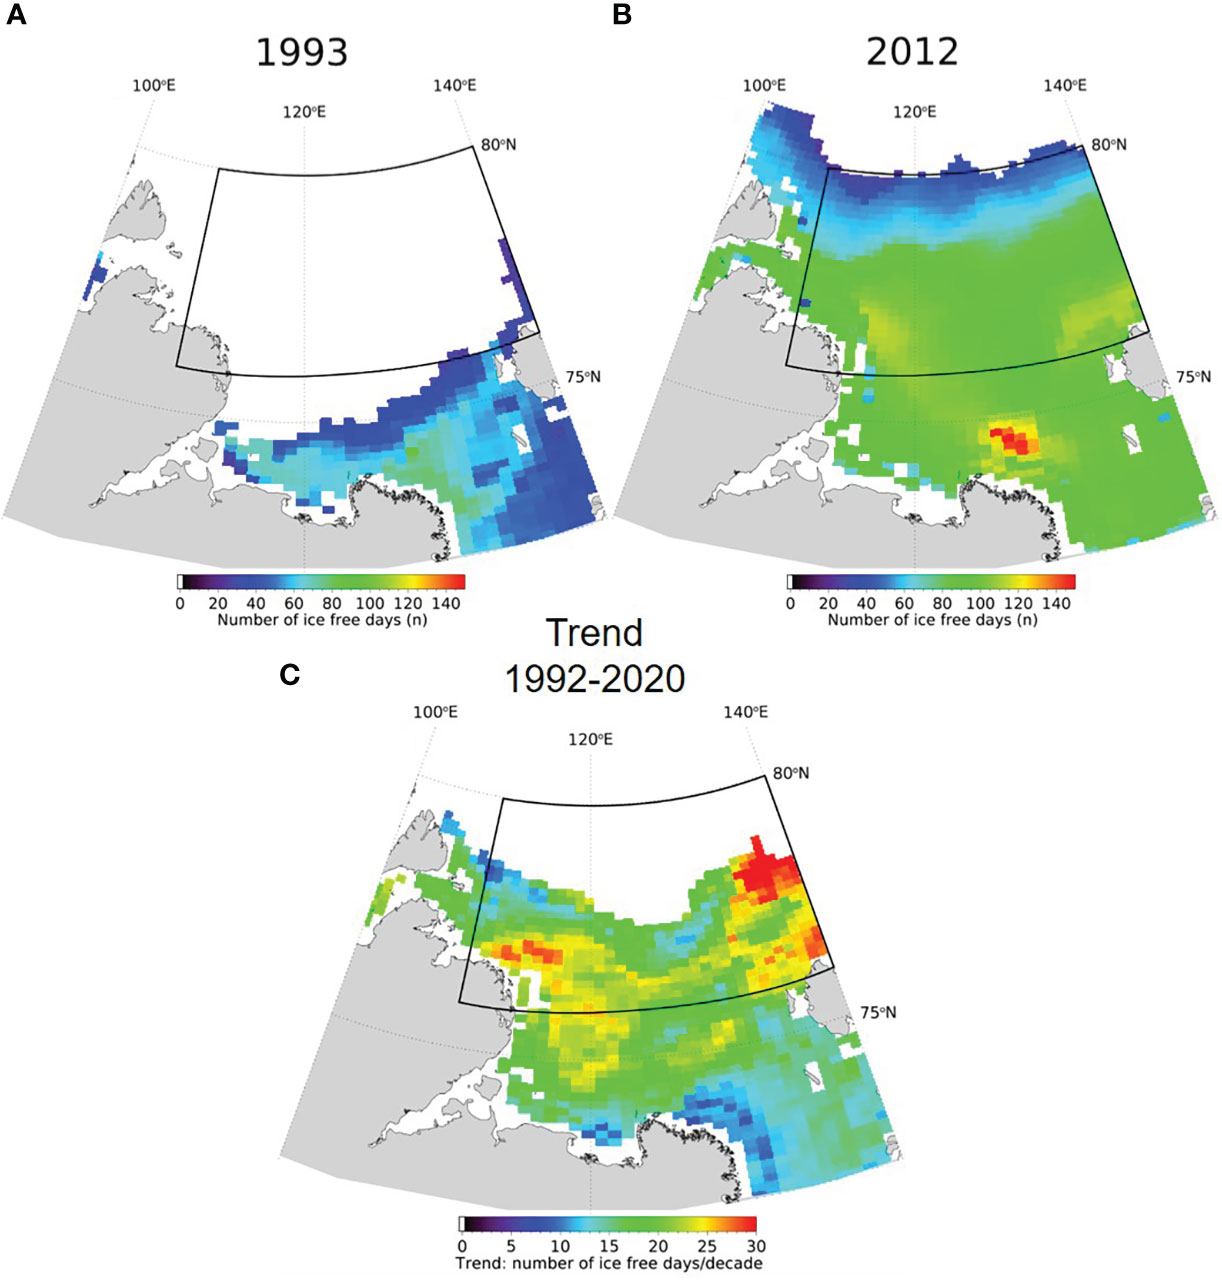
Figure 2 Number of ice free days in 1993 (A) and 2012 (B); white represents fully ice-covered, i.e. no ice-free days. (C) Trend (days/decade) in number of ice free days per year calculated based on remote sensing data from 1992 – 2020, based on 85 GHz SSM/I brightness temperatures provided by CERSAT (Center for Satellite Exploitation and Research). The black rectangles indicate the area of interest.
3.1.2. Primary production and export flux
3.1.2.1 Model and satellite data
There were clear differences in the seasonal development of sea-ice and chlorophyll concentrations between the two years (Figure 3), with an earlier (starting early vs. late June) and more complete retreat of sea ice in the area of investigation in 2012 compared to 1993. Correspondingly, the mean chlorophyll a concentrations showed an earlier increase, and reached slightly higher concentrations in 2012. The chlorophyll concentrations in 2012 were, however, temporally more variable compared to 1993, with higher maximum concentrations.
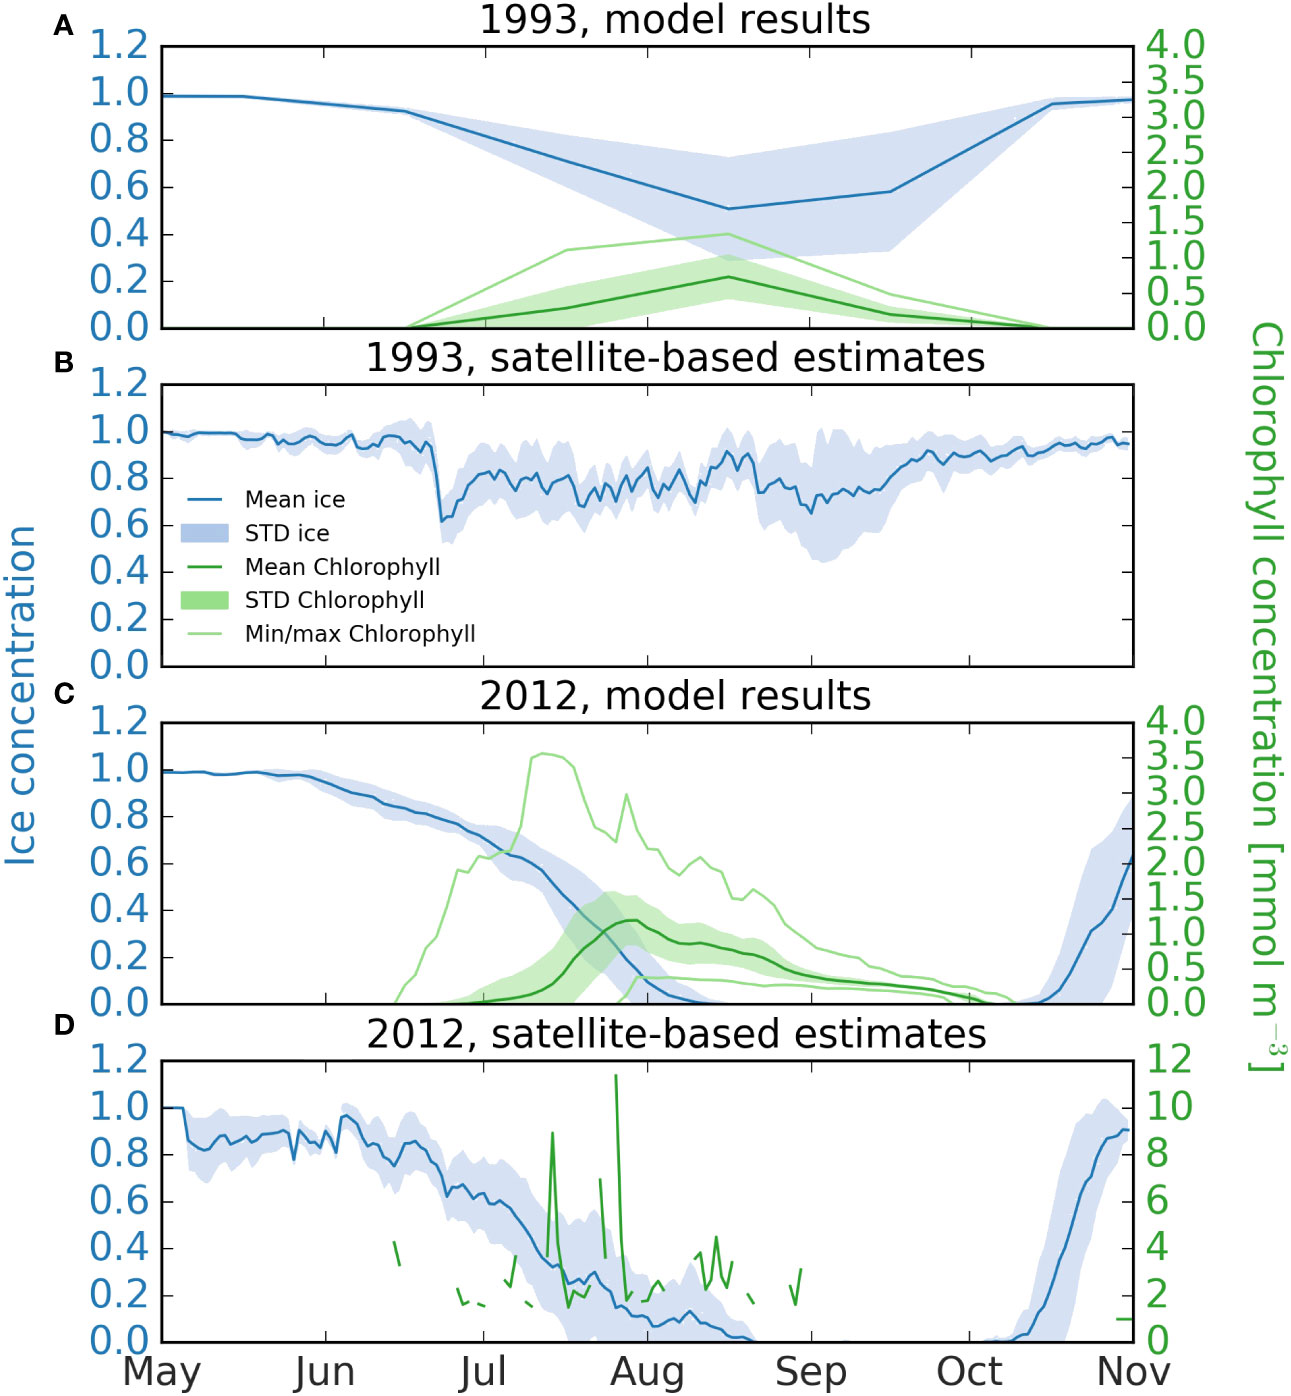
Figure 3 Seasonal development of chlorophyll and sea-ice concentration in the study area of the Laptev Sea for 1993 and 2012. (A, C) 2012 and 1993 from model results (Regulated Ecosystem Model REcoM2 coupled to the hydrodynamic model FESOM, a Finite Element Sea-ice Ocean Model). The dark blue line marks mean sea ice concentration, with the standard deviation indicated in light blue. The mean chlorophyll concentration is calculated from the vertical chlorophyll maximum, and is plotted with a dark green line, the corresponding standard deviation is indicated in light green. The maximum and minimum chlorophyll concentrations in the area are plotted as light green lines. For 1993 (A) data are available as monthly means; for 2012 (C) the output is available for every two days. (B, D) 1993 and 2012 from ocean color; NSIDC sea ice concentration (Cavalieri et al., 1996) is plotted as a dark blue line and the standard deviation in light blue. Both sea ice and chlorophyll fields are available as daily output, but for chlorophyll no ocean color based products exist for 1993.
Chlorophyll a concentrations from model and satellite data followed the same patterns, but differed in magnitude. The average of the modelled chlorophyll maximum from July-September and over the area of investigation was 0.40 mg Chl m-3 for 1993 and 0.58 mg Chl m-3 for 2012 (Figure 3). Satellite-based estimates were higher (2.89 mg Chl m-3 on average), but were only available for 2012. Comparing the chlorophyll concentration from biogeochemical models and satellite-based estimates is challenging, and it is worth noting that the modeled values take the entire area into account, including below the ice, while only a few points in space and time are available for the satellite-based estimates from ice-free areas, contributing to quantitative differences of both approaches. For the summer period of 2012, satellite-based chlorophyll values are available for 53 days, for 39 of these days chlorophyll data was available for less than 5% of the study area, and only 4 days had more than 20% coverage, with the maximum area coverage being 42%. Further, the Arctic Ocean, and especially the Laptev Sea, is an optically complex area, introducing challenges for the ocean-color algorithm developed for blue water conditions (Wang et al., 2005). For example, the presence of colored dissolved organic matter is known to artificially increase chlorophyll concentrations from satellite estimates in areas of high river discharge, such as from the Lena, leading to overestimations (Matsuoka et al., 2007; Chaves et al., 2015). Another difference between the two methods is how the ubiquitous Arctic subsurface chlorophyll maximum (SCM) is taken into account. The biogeochemical model explicitly models the SCM, the chlorophyll concentration of which is plotted in Figure 3, while the satellite-based estimates of chlorophyll concentration are calculated based on a combination of ocean color and a model, which relies on assumptions regarding e.g. the depth of the mixed layer and the subsurface profile of phytoplankton carbon (e.g. Behrenfeld and Falkowski, 1997; Carr et al., 2006). It covers a non-specified depth range, and it is not clear to what extent SCMs are recorded (Arrigo et al., 2011; Hill et al., 2013). Previous studies suggest that a lack of correction for SCM may lead to an underestimate of up to 19% in the Arctic (Cherkasheva et al., 2013). For the biogeochemical model, the extent of the sea ice is somewhat underestimated in 1993, indicating that productivity may have been lower than what the model predicts this year. The resolution of the model is another factor that especially impacts the physical environment; while the study area is well resolved by the model grid, some processes, such as meso- and submesoscale transport of nutrients from the deep water to the surface (Schourup-Kristensen et al., 2021) is only parameterized and not explicitly resolved in the current setup. Despite of these shortcomings both methods indicate similar patterns and provide information about this remote and complex area. Modelled mean rates of NPP were about 2.9 times higher in 2012 than in 1993. Average values were 80 ± 55 mg C m-2 d-1 (range: 0.01 – 211 mg C m-2 d-1) in 1993 and 230 ± 58 mg C m-2 d-1 in 2012 (range: 86 - 472 mg C m-2 d-1) (Figures 4A, B). The average rate of modelled POC export to the seafloor from July-September and over the area of investigation was 4.0 ± 9.3 mg C m-2 d-1 (range: 0.003-38.0 mg C m-2 d-1) in 1993 and 6.4 ± 11.9 mg C m-2 d-1 (range 0.005-78.4 mg C m-2 d-1) in 2012, which corresponds to 1.6-times higher average values in 2012, but with large standard deviations (Figures 4C, D).
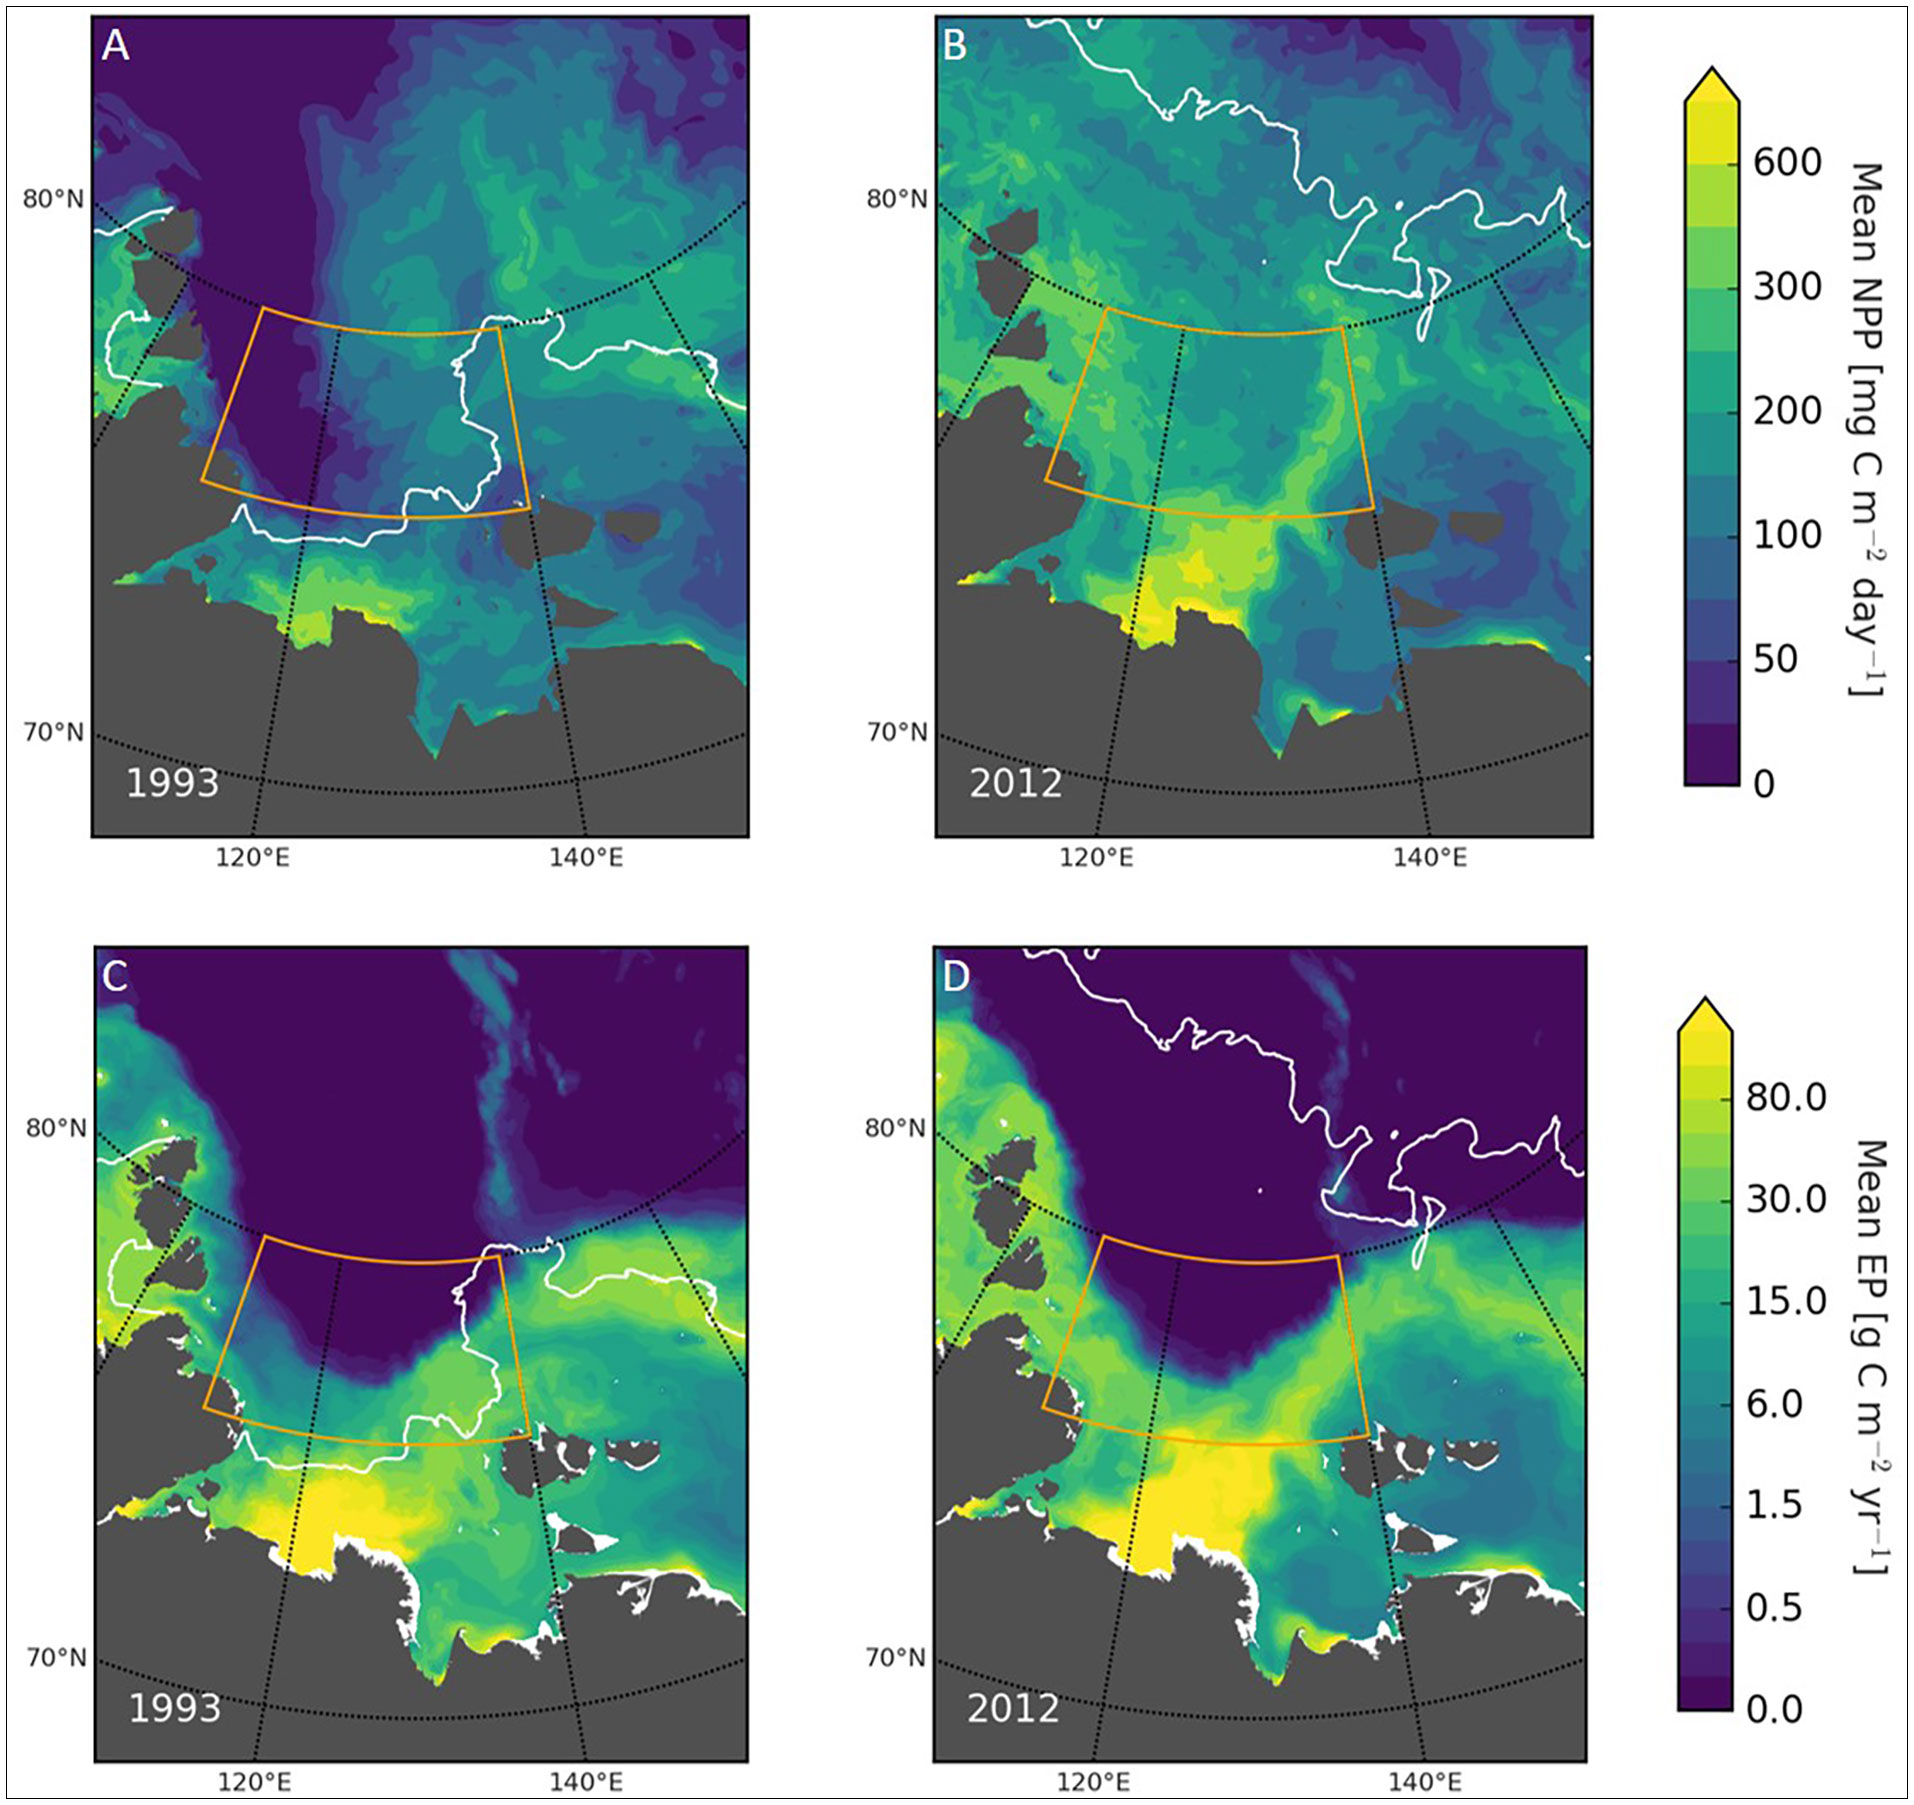
Figure 4 Modelled primary production and POC flux. Top: Modelled mean primary production averaged over July, August and September in 1993 (A) and 2012 (B). Bottom: Modelled vertical POC flux to the seafloor in 1993 (C) and 2012 (D). The orange rectangles indicate the area of interest. The white line indicates the ice margin. Regulated Ecosystem Model 2 (REcoM2) coupled to the Finite Element Sea Ice-Ocean Model (FESOM), with a resolution of 4.5 km.
3.1.2.2 Nutrient drawdown
The average depth of the winter mixed layer as determined from the CTD profiles was 56 ± 11 m in 1993 and 49 ± 8 m in 2012. Seasonal nutrient drawdown in the area was calculated for nitrate, phosphate and silicate (Table S2). Silica drawdown included a few negative values for both years, which were excluded for average calculations, as it is not clear what they were caused by. There may have been additional input of silica, e.g. via release from sea ice, or there were very few diatoms at these stations. Inorganic nitrogen consumption was 106 mmol m-2 in 1993 and 139 mmol m-2 in 2012, phosphate consumption was 7 and 8 mmol m-2, respectively, and silicate consumption was 72 and 85 mmol m-2. N:P was thus shifting from 15 to 17, potentially indicating increasing nitrogen limitation. N:Si was 1.5 and 1.6, i.e in the range for Arctic diatom-based production (Takeda, 1998; Krause et al., 2018). New production calculated from the seasonal DIN drawdown, assuming a Redfield C:N ratio of 6.6, was on average across all stations 8.3 ± 3.8 g C m-2 yr-1 in 1993 and 11.0 ± 4.0 g C m-2 yr-1 in 2012. The estimated POC flux to the seafloor based on the primary production calculated from nutrient drawdown was 0.52 ± 0.66 (range: 0.05-2.16) g C m-2 yr-1 in 1993 and 0.56 ± 1.1 (range: 0.03-3.91) g C m-2 yr-1 in 2012 (Table S2 and Table 3).
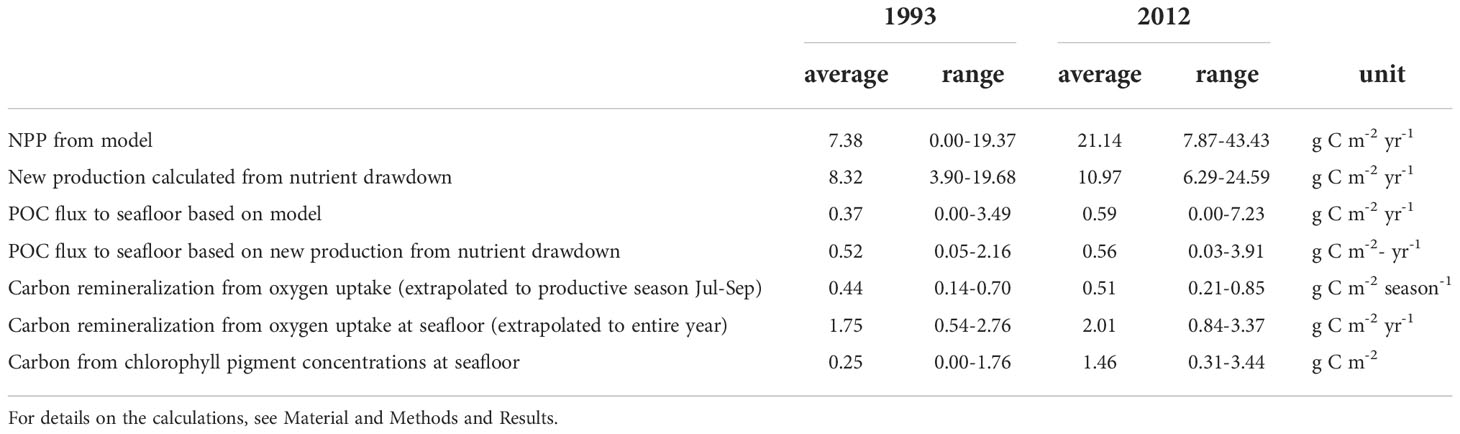
Table 3 Summary of carbon production, export and remineralization down the Laptev Sea continental slope.
3.1.2.3. Measured water column parameters at the time of sampling
Chlorophyll a standing stocks integrated over 50 m water column, were on average 12 mg m-2 (range: 6-20 mg m-2) in 1993 and 17 mg m-2 (range: 1-33 mg m-2) in 2012 (Table 4). POC concentrations were on average 3.8 g m-2 (range: 1.6-7.2 g m-2) in 1993 and 6.3 g m-2 (range: 4.9-6.7 g m-2) in 2012. Nitrate values in surface waters (0-20/25 m) at the time of sampling were much lower in 2012 (0.04-1.1 µmol L-1) compared to 1993 (0.8-4.1 µmol L-1), potentially reflecting the longer productivity phase and the increased stratification. Phosphate values ranged between 0.2-0.5 µmol L-1 in 1993 and between 0.1-0.3 µmol L-1 in 2012. Silica values were between 1.1-4.2 µmol L-1 in 1993 and 1.2-4.4 µmol L-1 in 2012.
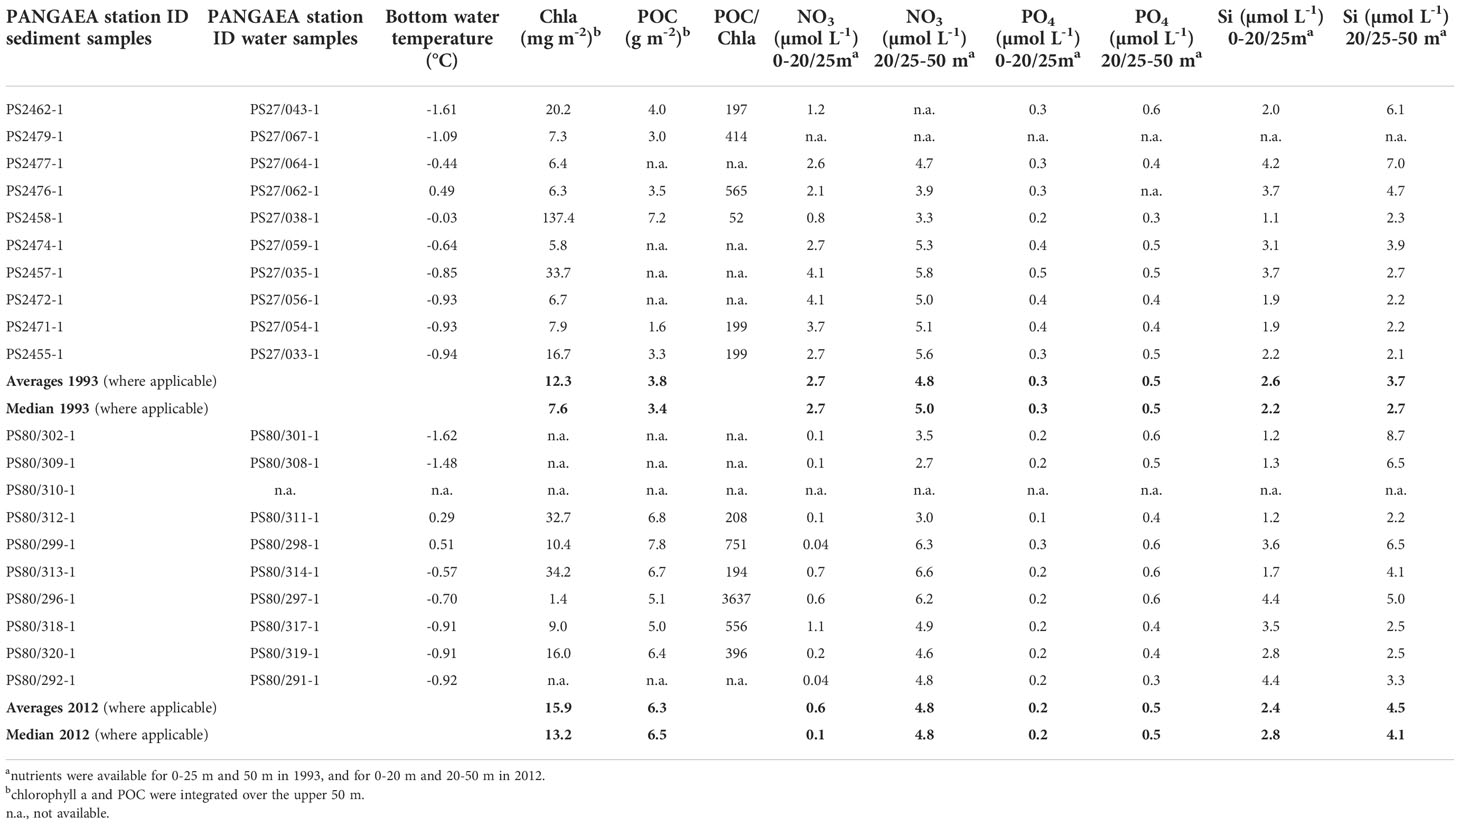
Table 4 Variables derived from water column samples collected from pelagic (CTD/Rosette) stations corresponding to main benthic (MUC) stations sampled in 1993 and 2012.
3.2. Differences between seafloor biogeochemical conditions (1993 vs. 2012)
3.2.1. Biogeochemistry, bacterial abundance and activity
Most benthic stations were revisited in 2012 within a distance of <1km. Stations at ~ 500 m and 1500 m water depth were 5 km and 14 km apart, respectively. Only the two shallowest stations (i.e. at 50-60 m water depth) were 40 and 100 km apart between the two years due to limitations in transit time (Figure 1).
Observations with the TV-guided MUC provided insights into benthic fauna distributions down the Laptev Sea continental slope, but video material was only available for 2012 (Bienhold and Boetius, 2022). On the shelf and upper margin (60-200 m), bottom waters were turbid, indicating a high load of particles. Accordingly, we observed many filter feeders at the seafloor (e.g. crinoids, gorgonians, ophiurids), and also a few fish (Zoarces). At about 1000-1500 m, the bottom water started to become clearer and the benthic landscape changed, i.e. filter feeders decreased in abundance, and there was less megafauna in general. Below 2500 m detritus feeders, especially holothurians, increased in abundance.
Chlorophyll pigment (CPE) concentrations, as a proxy for phytodetritus input to the seafloor, decreased with increasing water depth, but were higher in 2012 for all but two stations when compared to 1993. At several of the revisited stations, concentrations had more than doubled (Figure 5A and Table 5). Contrary to the overall trend between the years, at the shallowest station, CPE was higher in 1993 compared to 2012. Overall, CPE concentrations ranged between 13 and 1 µg cm-3 down the continental slope, with an average of 2.9 µg cm-3 (1.7 µg cm-3 when excluding the shallowest station) in 1993, and 3.5 µg cm-3 in 2012 (Table 5 and Figure 5A). Chla/CPE ratios were considerably lower in 1993 (0-13%) compared to 2012 (34-52%), indicating a higher availability of fresh organic matter (phytodetritus) at the seafloor in 2012.
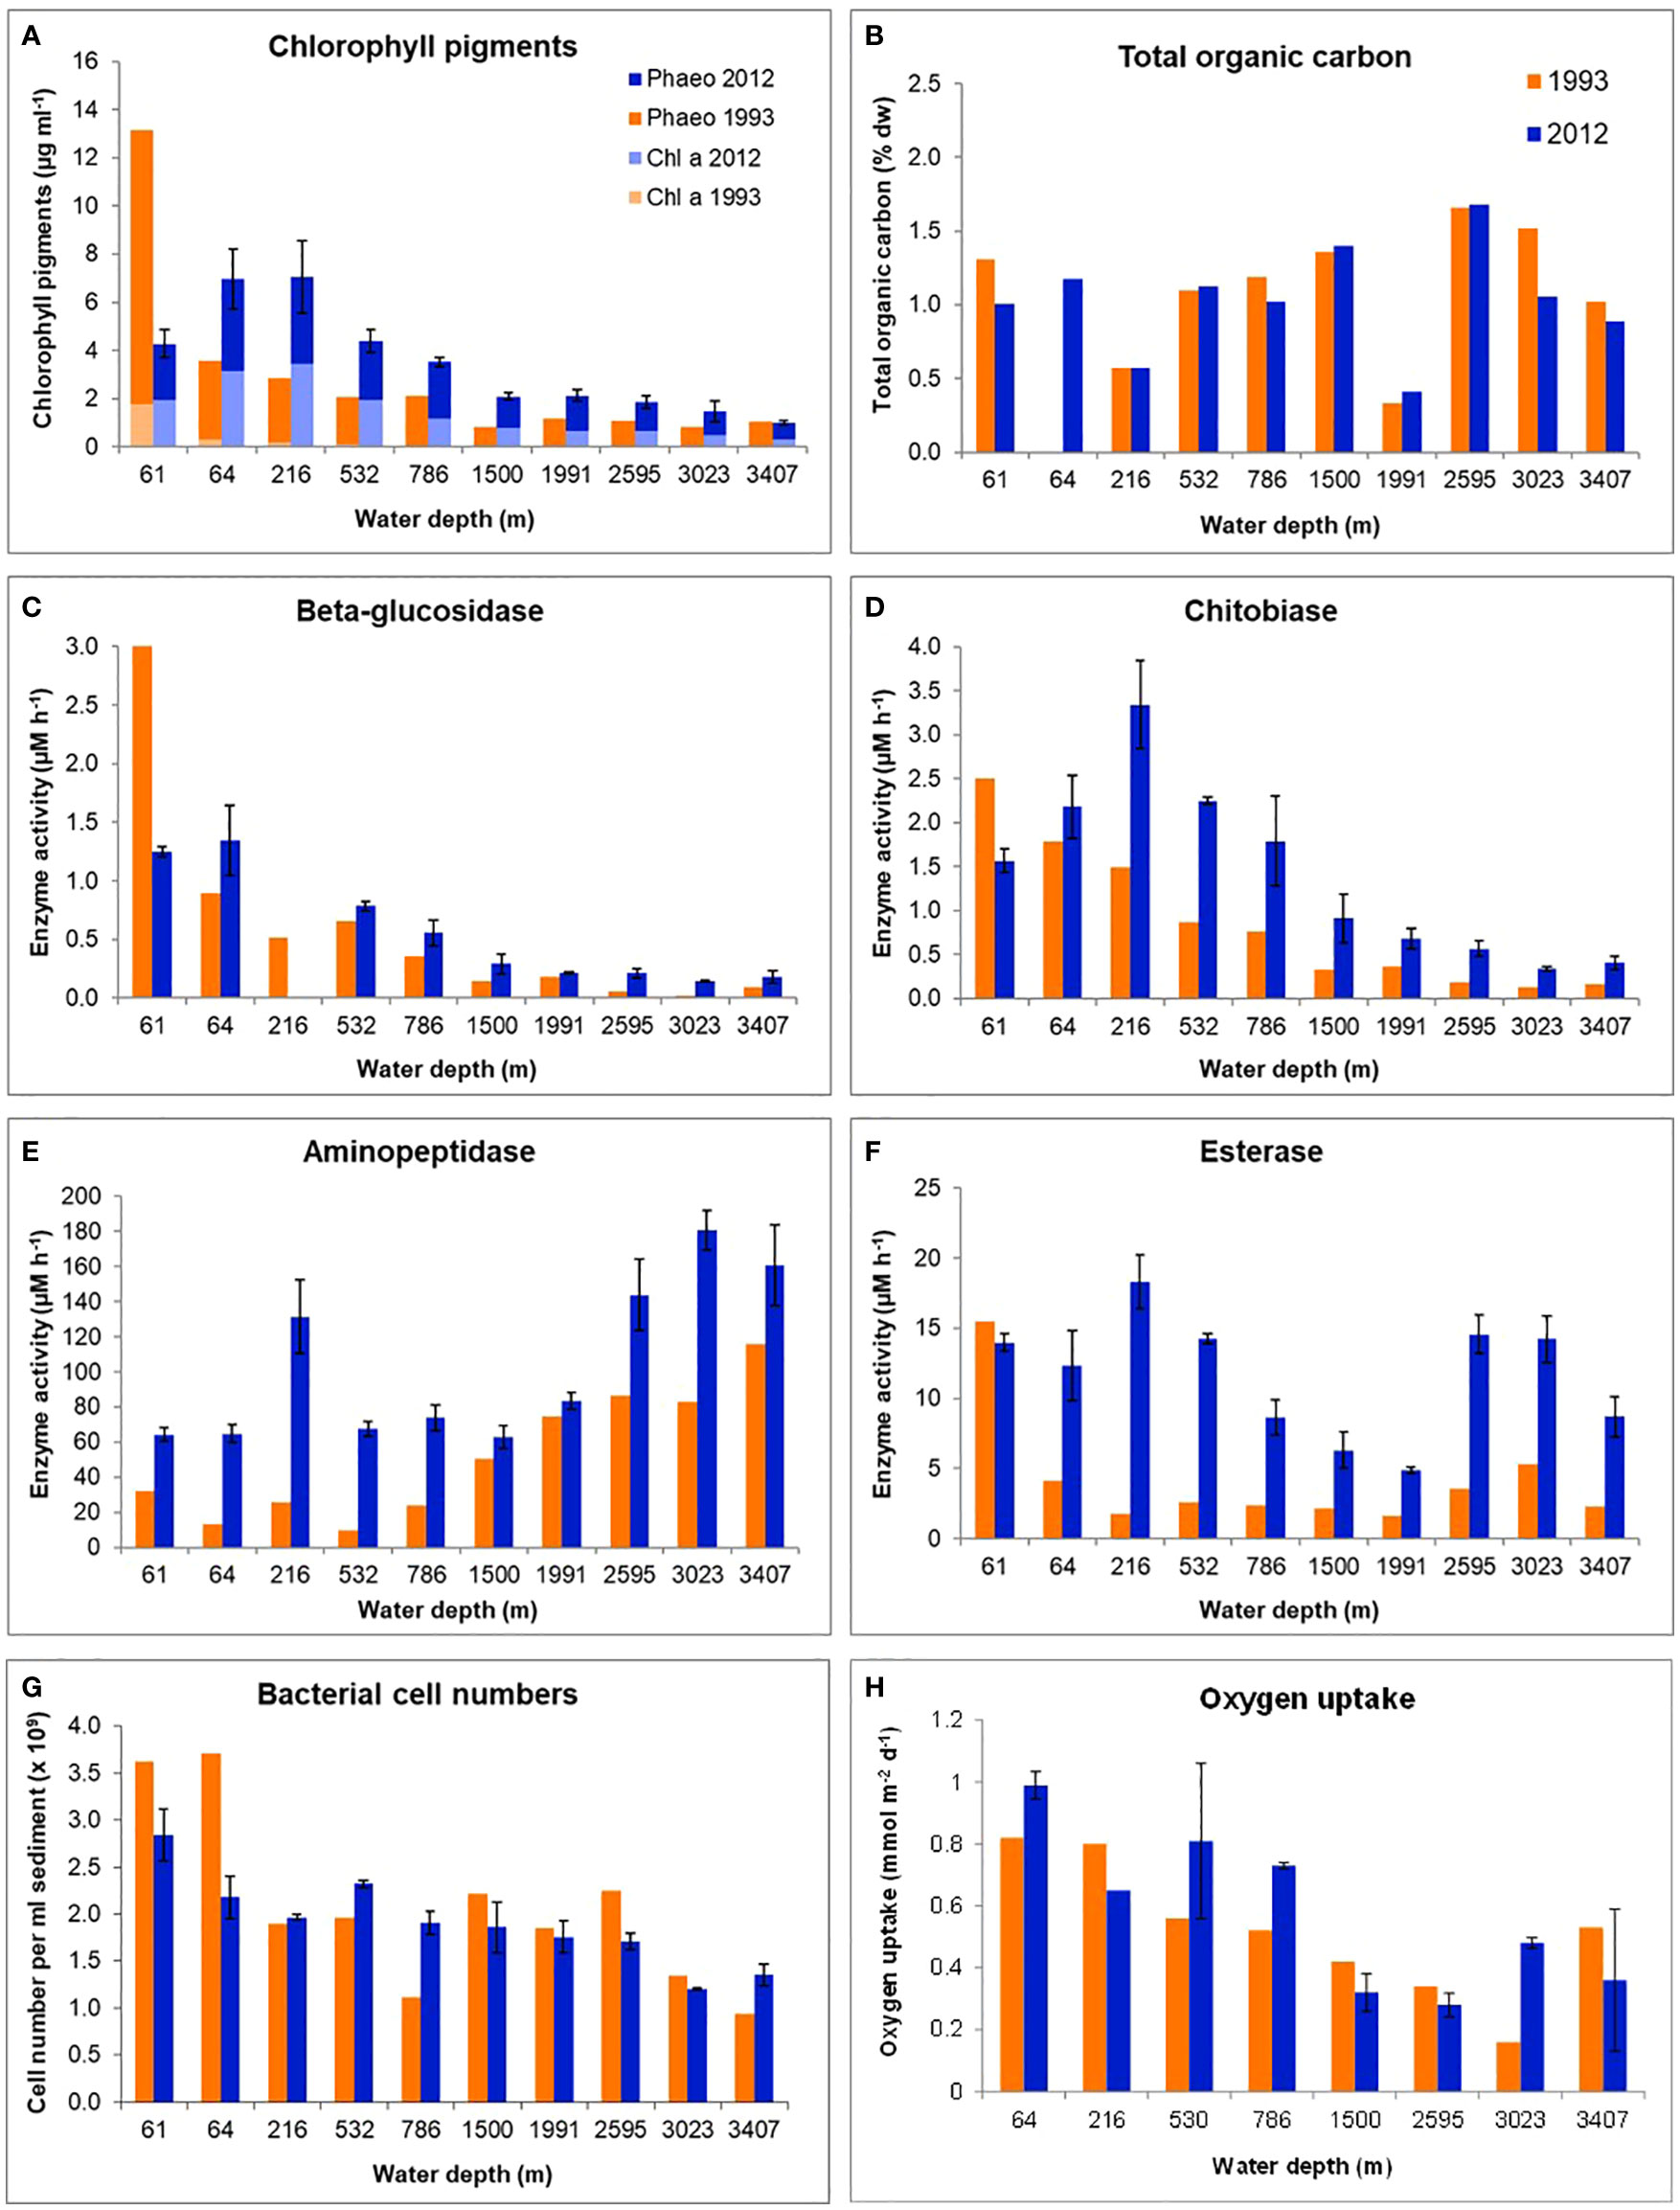
Figure 5 Biogeochemical parameters in surface sediments (0-1 cm) with increasing water depth along the Laptev Sea continental slope in September 1993 and August/September 2012. Water depths are averages of stations sampled in 1993 and 2012 (see also Table 1). (A) Chlorophyll pigment concentrations, (B) Total organic carbon concentrations, (C–F) Extracellular enzymatic activities of beta-glucosidase, chitobiase, aminopeptidase and esterase, (G) Bacterial cell numbers (Numbers correspond to ~ 20 - 80 µg C cm-3), (H) Benthic oxygen uptake. The values correspond to a carbon remineralization rates of 1.5-7.6 mg C m-2 d-1 in 1993 and 2.3-9.2 mg C m-2 d-1 in 2012. (1993: 0.5-2.8 g C m-2 yr-1; 2012: 0.8-3.4 g C m-2 yr-1).
Table 5 Benthic biogeochemical variables determined in surface sediments (0-1 cm) down the Laptev Sea continental slope in September 1993 and August/September 2012.
Total organic carbon (TOC) concentrations in the first cm of sediment ranged between 0.4-1.5% across the slope, and remained largely unchanged between the two years (Figure 5B). The top 1 cm layer reflects an input of about 8 years of sedimentation on the shelf (Vonk et al., 2012) and 26-83 years on the slope (Stein and Fahl, 2004), of which the annual OC input is only 1-2% (Stein and Fahl, 2004), so decadal changes could only be recorded if exceeding a 5-fold increase, for which not enough nutrients are supplied to the surface waters of the Laptev Sea.
Potential extracellular enzymatic activities (EEA) of four selected extracellular enzymes all showed considerably higher values in 2012 (Figures 5C–F). The hydrolases beta-glucosidase and chitobiase showed decreasing values with water depth in both years. Beta-glucosidase is a hydrolytic enzyme involved in the breakdown of beta-glycosidic bonds that may occur in a variety of substrates, such as glycolipids, poly/oligosaccharides, and cellulose. Chitobiases are involved in the breakdown of chitin, the most abundant polymer in the ocean, mostly derived from zooplankton carapaces and fecal pellets. Aminopeptidase activity increased with increasing water depth, as reported previously (Boetius and Damm, 1998 and references therein). This group of enzymes catalyzes the cleavage of amino acids from peptides and proteins, and it may be induced by starvation (Albertson et al., 1990; Boetius and Lochte, 1996). Esterase activities did not show a clear trend with water depth. Esterases are also hydrolytic enzymes and may break down lipids, as for example found in membranes. Both aminopeptidase and esterase were higher in 2012 compared to 1993, indicating an overall increased remineralization potential.
Bacterial cell densities ranged between 1.2x10⁹ and 2.8 x10⁹ cells cm-3 sediment and were on average 1.9x10⁹ cells cm-3 sediment in 1993 and 3.7x10⁹ cells cm-3 sediment in 2012 (range: 9.4x10⁸-3.7 x10⁹ cells cm-3 sediment). Densities decreased with water depth, but remained largely constant between years, with slight variations at the different stations (Figure 5G). Counting errors are usually within 10% of the counts.
Benthic oxygen uptake, as an indicator for carbon supply and remineralization, varied between the years. It only showed a substantial increase of more than 2-fold in 2012 at one of the deepest stations (~ 3000 m water depth; Figure 5H), indicating a higher remineralization of organic material in the deep sea compared to 1993. Diffusive oxygen uptake was on average 0.52 (0.16-0.82) mmol m-2 d-1 in 1993 and 0.60 (0.25-1.00) mmol m-2 d-1 in 2012 (Table 5). Measurements correspond to carbon remineralization rates of 0.44 mg C m-2 d-1 (1.5-7.6 mg C m-2 d-1) in 1993 and 0.51 mg C m-2 d-1 (2.3-9.2 mg C m-2 d-1) in 2012.
3.2.2. Benthic bacterial diversity and community composition
A clustering of OTU at 3% sequence difference resulted in 7098 OTU, ranging between 1172-13603 per sample (Table S4). The dataset contained 2686 singletons, i.e. sequences occurring only once in the entire dataset, corresponding to 2.2% of all sequences and 37.8% of all OTU. These sequences were removed from the dataset before further analyses, resulting in a final number of 4412 OTU.
Bacterial richness estimates calculated with subsampling to the smallest dataset yielded OTU numbers ranging between 326-542, and Chao1 estimates ranging from 511 to 1457. Bacterial richness decreased with increasing water depth, as previously reported (Bienhold et al., 2012). Richness values were slightly higher in 2012 compared to 1993 (Table S4).
Bacterial community structure changed in both years with increasing water depth (Bienhold et al., 2012), with a clear clustering of samples with depth, which can be distinguished into four categories: 54-68 m (shelf), 202-796 m (upper slope), 1482-2620 m (lower slope), and 2995-3387 m (bottom slope) (Figure 6). Depth groupings were confirmed with an analysis of similarity (ANOSIM statistic R=0.62, p=0.001), which also confirmed significant differences (adj. p<0.05, with 1000 permutations) for all pairwise comparisons between depth groups, except for the comparison between 54-68 and 2995-3387 m, which may be an artefact due to the low number of samples (n=2) in the latter group. At the same time there appear to be no systematic shifts in bacterial community structure between the two years, as indicated by both 454 tag sequencing (Figure 6) and ARISA fingerprinting (Figure S6). There is a clear increase in dissimilarity when comparing shallow stations with stations of increasing water depth (Table S5). At the same time, comparisons between any two stations within and between the years did not yield considerable differences. The average dissimilarity (Bray-Curtis) between any two stations was 60% in 1993, 54% in 2012 and 58% when comparing stations between 1993 and 2012 at the level of bacterial OTUs.
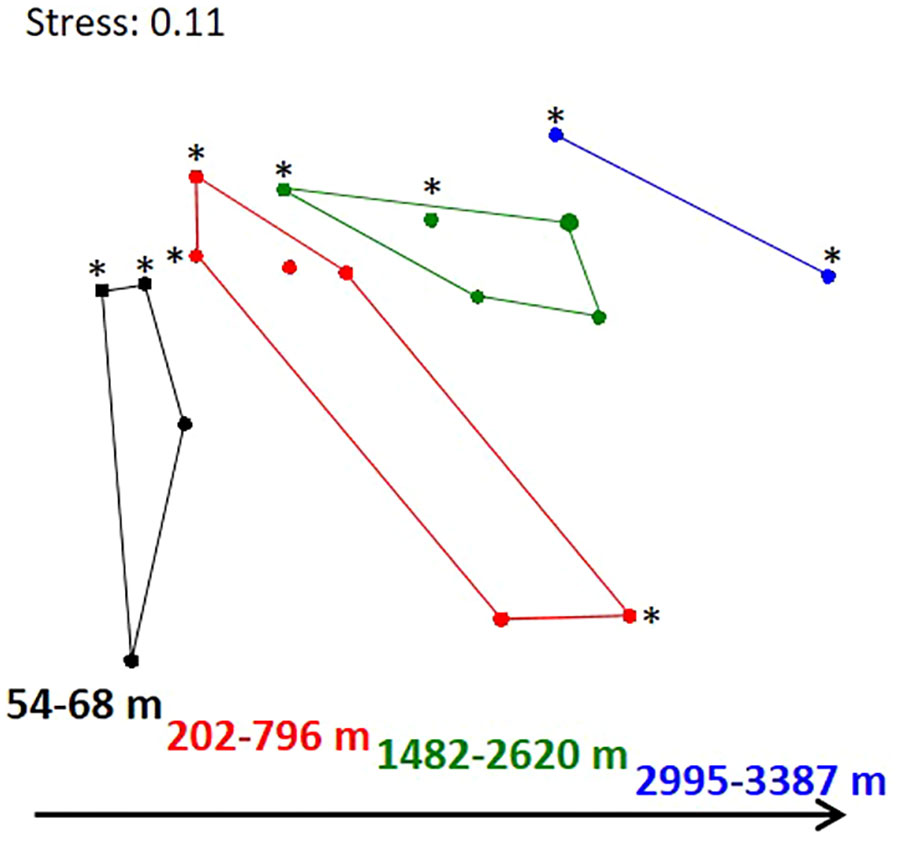
Figure 6 Differences in bacterial community structure with water depth and between 1993 and 2012. Non-metric multidimensional scaling plot based on Bray-Curtis dissimilarities of 454 tag sequencing data. Samples from 2012 are marked with an asterisk (*).
Bacterial communities were dominated by the classes Gammaproteobacteria, Bacteroidia, Alphaproteobacteria, NB1-j_cl, Acidimicrobiia, and Verrucomicrobiae (Figure S7). The top ten most abundant OTU belonged to Woeseia (Gammaproteobacteria), Cellvibrionales (Gammaproteobacteria), Actinomarinales (Actinobacteriota), Nitrosococcales (Gammaproteobacteria), and Flavobacteriales (Bacteroidota) (Table S6). The most abundant bacterial classes and families were shared between the two years, but also showed changes in their relative abundance with water depth and between the years (Figure S8). Flavobacteriaceae and Rubritaleaceae increased in relative abundance in 2012 at the shallower stations, which is reflected in the stronger representation of several group members at the genus level as well (Figure 7). Flavobacteriaceae also showed a conspicuous increase at the deepest station in 2012.
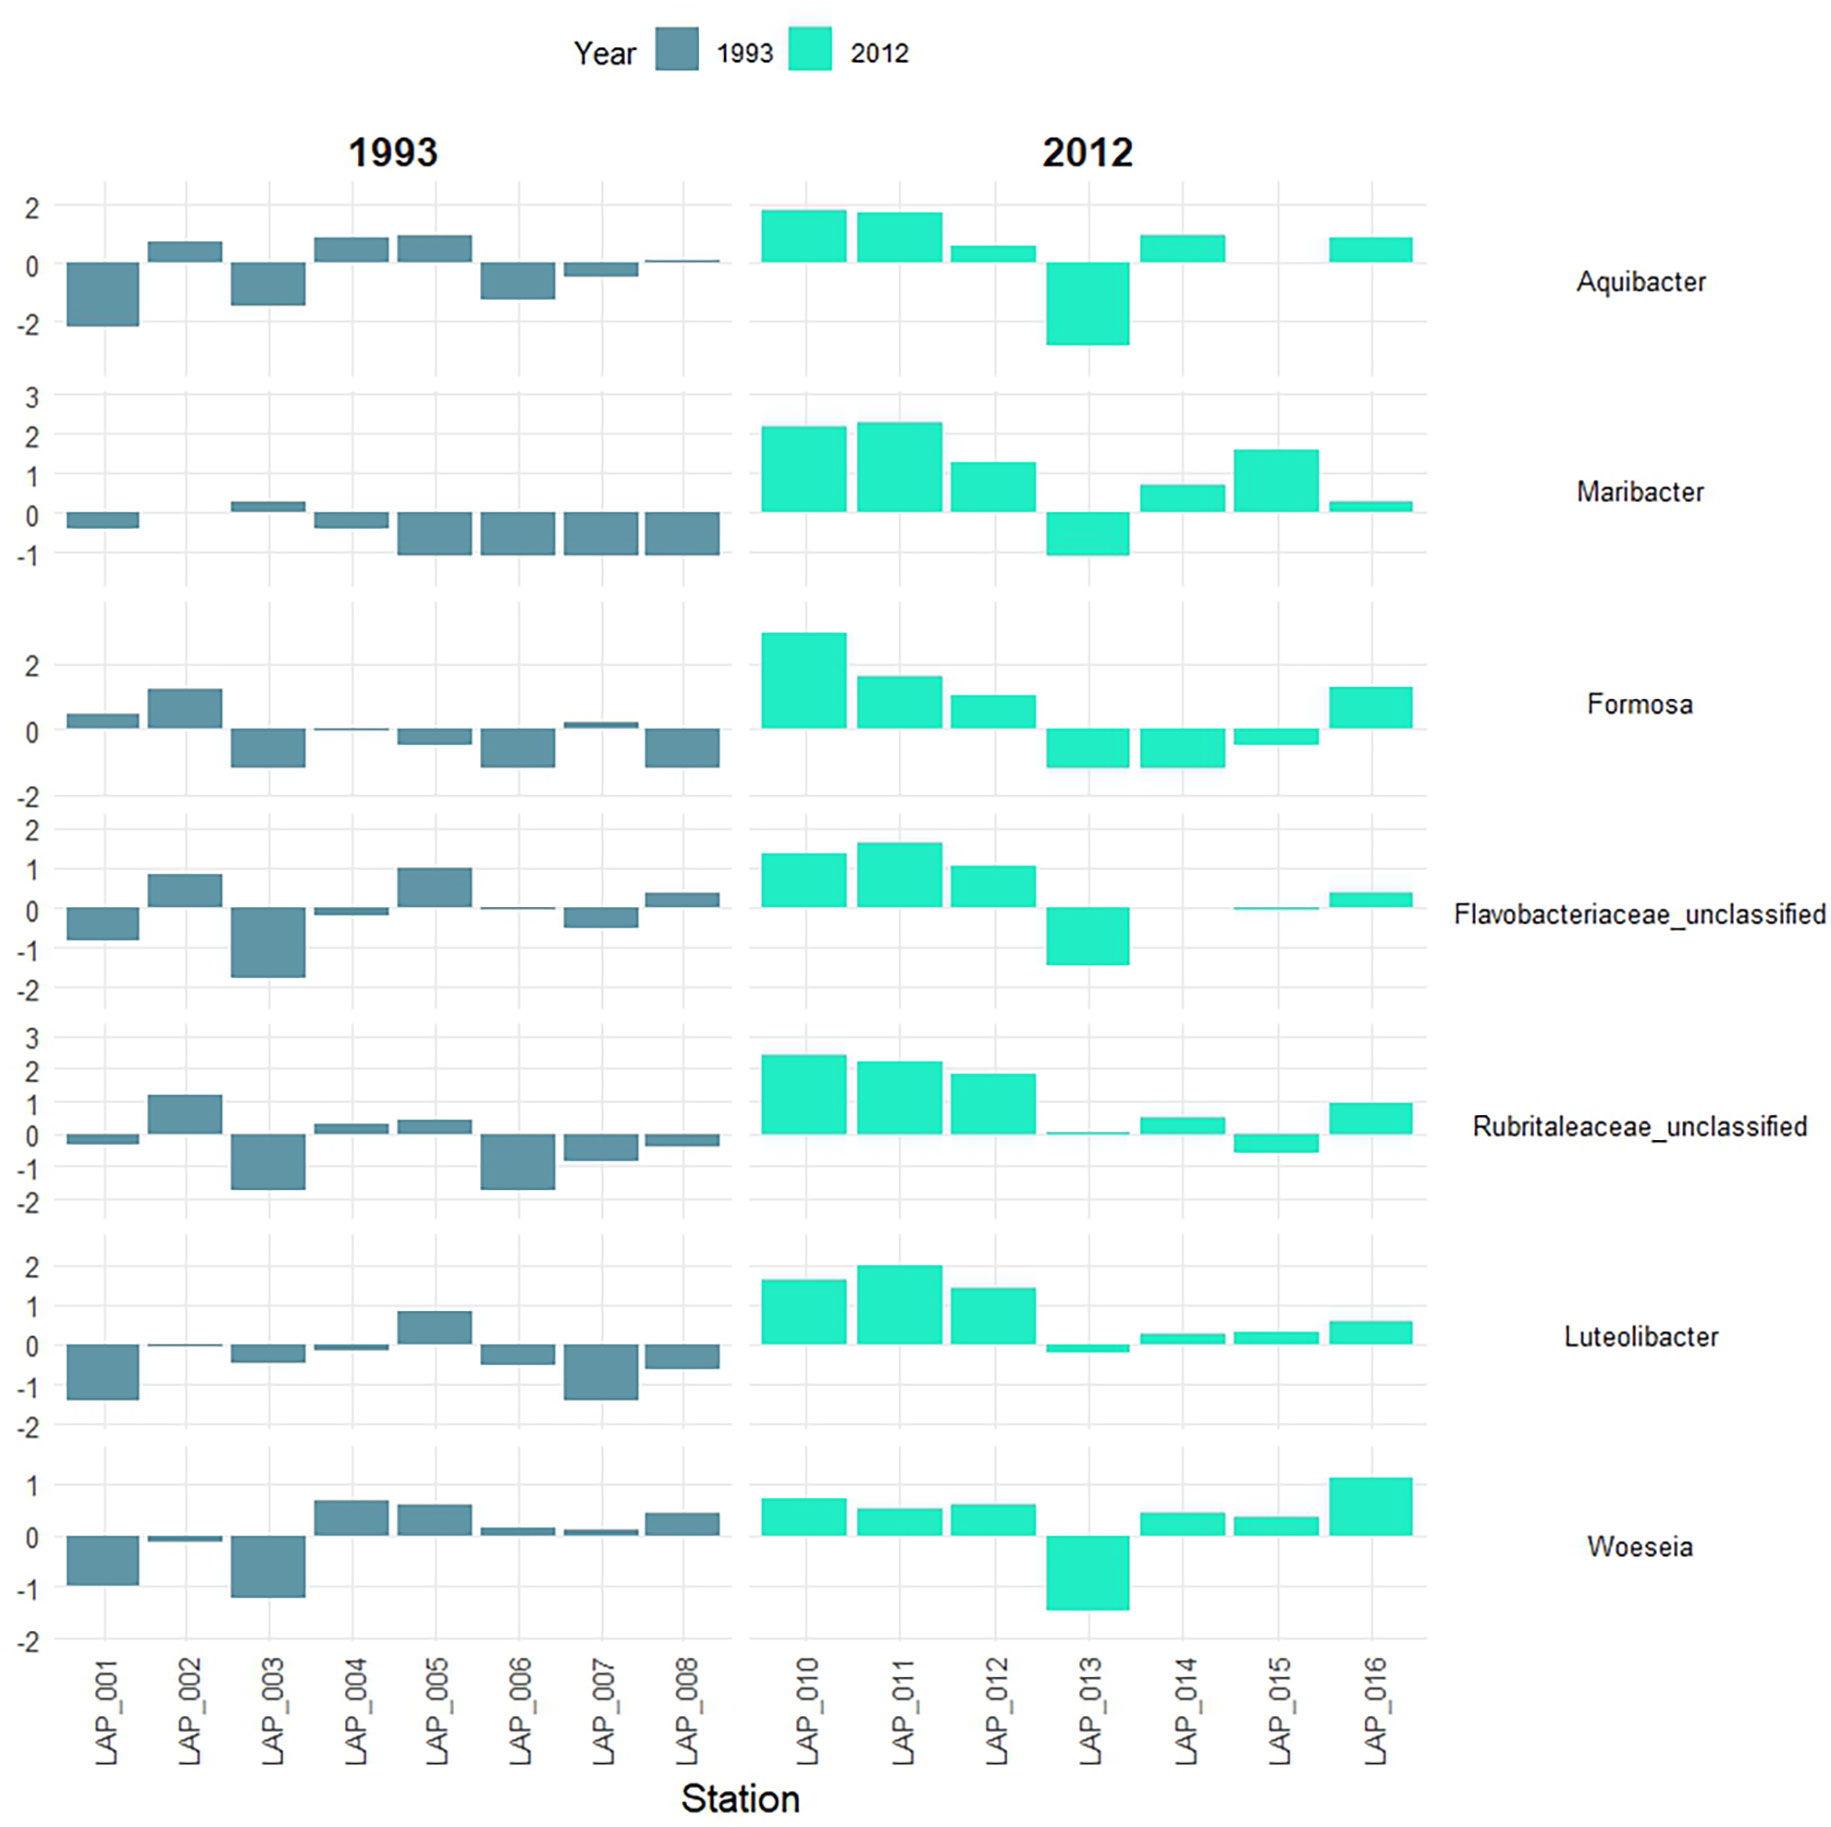
Figure 7 Changes in the abundance (clr-transformed) of bacterial genera in surface sediments along a water depth transect (increasing water depth from left to right, see also Table 1) down the Laptev Sea continental slope in 1993 and 2012. Aquibacter, Maribacter, Formosa, Flavobacteriaceae_unclassified (Bacteroidia); Rubritaleacea_unclassified, Luteolibacter (Verrucomicrobiae); Woeseia (Gammaproteobacteria).
4. Discussion
Here we compared field observational data sets, as well as model runs from two years (1993 and 2012), representative of two different phases of the Central Arctic climatic state with typical ice cover for the phase before 2000, and with the severe summerly decline observed afterwards, in the Central Arctic [https://www.meereisportal.de/en/seaicetrends/monthly-mean-arctic/, (Grosfeld et al., 2016)], as well as in the Laptev Sea (Figure S1). Our results suggest that the climate warming and subsequent sea-ice loss has led to a noticeable but limited increase in primary production in the area, due to enhanced stratification and nutrient limitation, although stratification can be quite variable in the region (Janout et al., 2020). The biggest response was detected in the phytodetritus deposition at the Laptev Sea slope inferred from sedimentary chlorophyll pigments, to an extent that indicates substantial shifts in the development of the pelagic system and timing of POC export.
4.1. Decreasing sea ice cover results in higher primary production at the surface, but not in considerably higher POC fluxes
There was a considerable loss of sea ice between the two investigated phases, resulting in a substantially larger open water area and longer ice-free period in 2012 compared to 1993. This is also reflected in the increase of the number of ice-free days per year between 1992 and 2020 (Bélanger et al., 2013; Arrigo and van Dijken, 2015; Lewis et al., 2020). Strong sea ice melt in 2012 was favored by anomalously warm spring conditions, paired with southerly winds (Janout et al., 2016a). As a consequence, average primary production calculated from observed seasonal nutrient drawdown, and estimated from a coupled biogeochemical/sea ice model, was higher in 2012 compared to 1993 (Table 3) (Arrigo et al., 2008; Kahru et al., 2011; Fernández-Méndez et al., 2015; Lewis et al., 2020).
Nutrient drawdown suggested a 1.3-times increase in new production between the two years, and the model suggested a 2.5-times increase in NPP. While the model integrates over the entire area of interest, new production calculated from nutrient drawdown averages values across the different stations (n=21 for each year). If we upscale the average new production from nutrient drawdown to the respective open water area, which was 4-times larger in 2012 compared to 1993, new production could be as much as 6-times higher across the area of investigation in 2012 (0.5 Tg C yr-1 in 1993 vs. 2.95 Tg C yr-1 in 2012). However, these values are derived from a limited number of measurements, and do not take under-ice production into account.
The increase in modelled NPP over the area of investigation (1.9 Tg C yr-1 in 1993 and 3.5 Tg C yr-1 in 2012) reflects the increase in open water area, rather than higher local production. This is confirmed by a significant positive correlation between September open water area and modelled NPP for the years 1985 to 2015 (r=0.75, p=9.4x10⁻⁷), also consistent with other reports (Pabi et al., 2008). Modelled open water area for September and data from NSIDC (Cavalieri et al., 1996, updated yearly, date accessed: 2017-03-17) were strongly correlated (r=0.86, p=6.5*10-10), indicating a high degree of fit between the two. The observed shift in the Redfield ratio indicates substantial nitrate limitation in 2012, confirming that sea-ice retreat may release light limitation, but is followed by a rapid nutrient limitation of primary production (Lalande et al., 2014b; Duarte et al., 2021; Oziel et al., 2022). This is also supported by higher POC : Chla ratios in 2012. The increased stratification due to a substantial freshening and warming of the surface layer limits nutrient supply from depth. An increased variability of stratification has been reported in the region for the period after the mid-2000s, with the region of freshwater influence being determined by summer winds in the ice-free areas (Janout et al., 2020); trends in stratification are thus difficult to generalize. Riverine influence is expected to be rather low for most of the stations investigated here, as indicated by surface salinities reported in previous studies (Janout et al., 2020; Laukert et al., 2022).
We also upscaled NPP estimated by the model and new production estimated by nutrient demand to the entire Laptev Sea area (105° to 150°E; 301,130 km2) for both years. Modelled NPP was 20 Tg C yr-1 in 1993 and 29 Tg C yr-1 in 2012. In comparison, (Pabi et al., 2008) found that NPP in the Laptev sector varied without a clear cause from approximately 15 to 35 Tg C yr-1 between 1998 and 2006, based on ocean color in ice-free areas that can be observed by remote sensing. Our numbers are thus similar, but in the higher range of these values observed in earlier years. New production estimated from nutrient demand was 2.5 Tg C yr-1 in 1993 and 3.3 Tg C yr-1 in 2012 for the entire area of the Laptev Sea. These values are much lower and represent an underestimate, because they are upscaled from 21 station in the outer shelf and slope region, excluding the highly productive coastal areas.
Measured chlorophyll a standing stocks at the time of sampling were only 1.3-times higher in 2012. Compared to NPP, this suggests a faster turnover of biomass in 2012, which could be due to a shift towards smaller phytoplankton species in the model, in turn caused by a shift from light to nutrient limitation. This assumption is supported by observations from sediment traps in the region, e.g. samples in 1995 showed higher fluxes of ice-associated pennate diatoms, while in 2012 there were higher fluxes of flagellates and centric diatoms (Lalande et al., 2014a; Lalande et al., 2014b). This would also be in agreement with a range of other studies of the wider Arctic region that have evidenced shifts from larger to smaller phytoplankton species during summer with increasing temperatures and decreasing sea ice cover (Nöthig et al., 2015a; Engel et al., 2017). On the Laptev Sea shelf, phytoplankton size structure is also closely connected to riverine input, and dynamics may differ from more central parts of the shelf/slope (Demidov et al., 2021). Few studies have addressed the outer parts of the slope, and further investigations of pelagic communities in the Laptev Sea are required to unravel potential long-term shifts. Microscopic assessments of phytoplankton community composition in our study area, combined with microscopic counting of a sediment trap deployed on the Lomonosov Ridge over one year from 1995 to 1996 (Zernova et al., 2000; Fahl and Nöthig, 2007), indicated spring bloom stages at stations close to the sea ice (with diatoms such as Nitzschia spp. and Fragilaria spp.) and another stage at stations with less or no ice cover (with large numbers of Chaetoceros spp. and Thalassiosira spp.) in 1993. In 2012, most of the microplanktonic community resembled a heterotrophic regenerating late summer community with only little contribution of diatoms (Flores et al., 2019), indicating that for several of the stations the ecosystem was at different states during the two periods of our summer investigations.
To compare POC export fluxes, we looked at interpolated and modeled results, as well as the measured oxygen demand at the seafloor. POC flux estimated from nutrient drawdown based on the relationship by Berger et al. (1988), was only 1.1-times higher in 2012 (0.52 vs. 0.56 g C m-2 yr-1, respectively). The modeled data suggest a 1.4-times higher POC export flux in 2012 compared to 1993 (0.37 vs. 0.59 g C m-2 yr-1, respectively). The calculated and modeled POC flux to the seafloor accounted for 4-5% and 6-7% of the surface production in 1993 and 2012, respectively. In addition to the magnitude of primary production, several factors may influence the amount of material eventually exported to deeper water layers and the seafloor, including the depth of the mixed layer, the sea ice extent and thickness, the timing of blooms and species composition of the primary producers (Wiedmann et al., 2020a; Dybwad et al., 2021; Fadeev et al., 2021), as well as the potential match/mismatch of OM production and export with grazers (Janout et al., 2016b), and finally the magnitude of remineralization by heterotrophic protists and bacteria in the water column.
Some studies have suggested that upon warming, the relative importance of sea-ice biota, pelagic communities and benthic assemblages may shift from a benthos-dominated to a zooplankton dominated mode (Carroll and Carroll, 2003). Indeed, previous studies have shown that an earlier sea-ice retreat in 2014 led to increased zooplankton grazing, compared with a later ice retreat on the Laptev Sea shelf in 2015 (Janout et al., 2016b). Similar observations have been reported from the Pacific Arctic sector (Grebmeier et al., 2006). Increased zooplankton grazing would limit the flux of POC to the seabed despite higher NPP, as observed here, and would limit growth of benthos (Schmid et al., 2006; Degen et al., 2015). However with phytoplankton growth likely starting earlier in the region, due to sea ice thinning, and indicated by an earlier and stronger increase in modeled chlorophyll a concentrations in 2012 compared to 1993, it remains to be shown that zooplankton and other fauna, including their progeny, are able to adapt and feed earlier.
Carbon demand at the seafloor, extrapolated from oxygen consumption rates to the productive season (Jul-Sep), was 0.44 g C m-2 season-1 in 1993 and 0.51 g C m-2 season-1 in 2012. Assuming that the measured rates represent background values rather than elevated rates during high input events, the benthic carbon demand for the entire years would be 1.75 g C m-2 yr-1 in 1993 and 2.01 g C m-2 yr-1 in 2012. Benthic carbon demand extrapolated to the productive season matched with estimated POC flux. However, since our measurements were performed well after the surface water bloom, they likely do not represent elevated benthic remineralization rates. In addition, this calculation assumes no benthic remineralization during the rest of the year, and thus would underestimate annual carbon demand. Benthic carbon demand extrapolated to the entire year, however, exceeded POC flux estimates, a common observation in the Arctic (Wiedmann et al., 2020b) and in other deep sea regions (Jørgensen et al., 2022). This value may overestimate benthic carbon demand, if carbon remineralization rates are lower during winter or underestimate carbon demand, if the measured rates represent background values. Additionally, we may have underestimated the total annual flux of organic matter to the seafloor, because lateral input, as well as input from intermittent sea ice are not accounted for in our estimates of POC flux. Besides these uncertainties, the measured and estimated rates may suggest that carbon input was somewhat enhanced in 2012 compared to 1993, but did not reach a new level likely to cause a benthic regime shift. The values are well in the range of other reports from comparable depths in the Arctic Ocean (Bourgeois et al., 2017; Kiesel et al., 2020; von Appen et al., 2021).
4.2 Higher availability of organic matter at the seafloor and response of benthos
In this study we also measured an increased input of phytodetritus to the seafloor at the time of sampling, with a higher proportion of sedimentary chlorophyll a, suggesting sedimentation of rather fresh material at the end of the summer in 2012, despite the potential earlier onset of primary production. The reason could be a late bloom, i.e. induced by winds in the ice-free zone, by lateral advection from shelves or input of ice rafted debris (Krumpen et al., 2019), which could not be further quantified in this study. Most likely is a relatively fresh deposition from a late summer export event (Ardyna et al., 2014), possibly facilitated by nutrient-upwelling from the shelves during a summer cyclone in August 2012 (Zhang et al., 2014). The deeper/more northern stations between 78° and 80°N may also have experienced input from sea ice, as indicated by low sea surface salinities in 2012, which coincided with an enhanced sea ice melt signal inferred from δ18O oxygen isotope measurements (Janout et al., 2016a). The scenario of a recent export event is matched by the finding of higher potential microbial enzyme activities not yet reflected in substantially higher oxygen uptake rates (except for one of the deepest stations) or higher microbial biomass. Previous studies show that extracellular enzymes are rapidly stimulated by fresh organic matter deposits, but that there is a substantial lag time of weeks to a month before secondary production leading to enhanced consumption sets in (Boetius and Lochte, 1994; Arnosti, 2011).
This conclusion is also supported by the comparison of benthic bacterial community composition across the Laptev Sea slope. Differences in phytodetritus input between the two years (at the same water depths), did not result in substantial changes in bacterial community structure as expected for a regime shift in the area. Community composition was remarkably reproducible between the two sampling years. However, the higher availability of fresh phytodetritus may explain the generally higher proportions of Flavobacteriacea and Rubritaleaceae in 2012, bacteria typically associated with phytoplankton blooms and degradation of polymeric matter (Martinez-Garcia et al., 2012; Cardman et al., 2014; Teeling et al., 2016; Rapp et al., 2018). Our results support earlier evidence of strong changes in bacterial community structure with increasing water depth, consistent with earlier studies of the same samples from 1993 (Bienhold et al., 2012) and in other regions of the Arctic (Jacob et al., 2013). The significant clustering at water depths of 54-68 m (shelf), 202-796 m (upper slope), 1482-2620 m (lower slope), and 2995-3387 m (bottom slope/abyssal plain) is consistent with patterns of benthic meio- and macrofauna in the Laptev Sea and on a pan-Arctic scale (Vanaverbeke et al., 1997; Vedenin et al., 2018; Vedenin et al., 2022). This suggests that to detect changes in biodiversity and biogeochemical functions, any further assessments of community change must provide enough replication across the shelf and slope.
5 Conclusion
This study provides insights into climate change impacts on ecological and biogeochemical functions in a region of the central Arctic Ocean which is rapidly warming and losing its summerly sea ice cover. We have compared observations and modeling results representing the decadal changes in the state of the Arctic before and after 2000. Based on various independent estimates, average primary production was at least 30% higher across the area of investigation in 2012 compared to 1993, although we recorded a substantial variation across individual stations. Our data confirm earlier studies that the decrease in ice cover and longer open water period results in higher production, but that production is rapidly nutrient-limited by increased stratification. This is likely to limit POC build-up and export fluxes, also due to stronger pelagic recycling (Table 3). These may be the main reasons that estimated POC fluxes and benthic carbon remineralization rates did not differ strongly between the years. We conclude that we observed a relatively fresh phytoplankton deposit across the deeper slope at the time of sampling (Aug/Sep) in 2012, which led to high microbial hydrolytic activities but not yet to higher bacterial standing stocks, indicating an early stage of remineralization in response to the organic deposits at the seafloor. The potential temporal shifts in phytoplankton blooms, grazing pressure, vertical POC flux and community composition from the surface ocean to the seafloor deserve further attention. The Arctic Ocean is under rapid change, with presumably significant effects on the entire ecosystem. These open questions should be addressed in future studies, e.g. through moored sediment traps and analyses of phytoplankton and phytodetritus composition in the water column and at the seafloor, also specifically taking into account the relevant time frames over which measured and estimated variables integrate. Key regions of the Arctic such as the Laptev Sea may serve as sentinels for other areas of the Arctic Ocean.
Data availability statement
The datasets presented in this study can be found in online repositories. The names of the repository/repositories and accession number(s) can be found below: https://www.ebi.ac.uk/ena; PRJEB43433. https://www.pangaea.de/. All datasets are fully referenced in the article and reference list.
Author contributions
AB and CB conceived and designed the study. AB led the expedition. Benthic sampling and measurements were performed by CB and FW. VS-K provided model results. TK contributed remote sensing data for sea ice and SST. E-MN provided water column measurements and observations. MK and MV analyzed hydrographic data. FW provided benthic oxygen measurements, and LH provided the map. CB wrote the manuscript with input from all co-authors. All authors contributed to the article and approved the submitted version.
Funding
Funding was received from the ERC Advanced Grant ABYSS (no. 294757) to AB. Additional funding came from the Helmholtz Association and the Max Planck Society. MV was funded by the BMBF project APEAR (#03V01461). This study contributes to the HGF infrastructure program FRAM (Frontiers in Arctic Marine Monitoring). We acknowledge support by the Open Access Publication Funds of Alfred-Wegener-Institut Helmholtz-Zentrum für Polar- und Meeresforschung.
Acknowledgments
We thank the chief scientists and crew of RV Polarstern expeditions PS27 (ARK-IX/4) and PS80 (ARK-XXVII/3). A special thank you goes to Wiebke and Rafael Stiens for their support with sampling and measuring on board during PS80, to Janine Felden for microsensor measurements on board, and to Jörn Patrick Meyer and Steffen Jescheniak for support with TV-MUC deployments. Erika Weiz-Bersch and Martina Alisch are acknowledged for their support with measurements in the home lab. Ivaylo Kostadinov supported the submission of sequence data via GFBio. Thank you to Matthias Wietz for support with amplicon data visualizations, and to Benjamin Rabe for discussions about physical oceanography. We also thank the Editor and two reviewers for their valuable comments and suggestions.
Conflict of interest
The authors declare that the research was conducted in the absence of any commercial or financial relationships that could be construed as a potential conflict of interest.
Publisher’s note
All claims expressed in this article are solely those of the authors and do not necessarily represent those of their affiliated organizations, or those of the publisher, the editors and the reviewers. Any product that may be evaluated in this article, or claim that may be made by its manufacturer, is not guaranteed or endorsed by the publisher.
Supplementary material
The Supplementary Material for this article can be found online at: https://www.frontiersin.org/articles/10.3389/fmars.2022.1004959/full#supplementary-material
References
Albertson N. H., Nyström T., Kjelleberg S. (1990). Exoprotease activity of two marine bacteria during starvation. Appl. Environ. Microbiol. 56 (1), 218–223. doi: 10.1128/aem.56.1.218-223.1990
Andersen K. S., Kirkegaard R. H., Karst S. M., Albertsen M. (2018). ampvis2: an r package to analyse and visualise 16S rRNA amplicon data. bioRxiv, 299537. doi: 10.1101/299537
Ardyna M., Babin M., Gosselin M., Devred E., Rainville L., Tremblay J.-É. (2014). Recent Arctic ocean sea ice loss triggers novel fall phytoplankton blooms. Geophysical Res. Lett. 41 (17), 6207–6212. doi: 10.1002/2014GL061047
Arndt S., Nicolaus M. (2014). Seasonal cycle and long-term trend of solar energy fluxes through Arctic sea ice. Cryosphere 8 (6), 2219–2233. doi: 10.5194/tc-8-2219-2014
Arnosti C. (2011). Microbial extracellular enzymes and the marine carbon cycle. Annu. Rev. Mar. Sci. 3 (1), 401–425. doi: 10.1146/annurev-marine-120709-142731
Arrigo K. R., Matrai P. A., van Dijken G. L. (2011). Primary productivity in the Arctic ocean: Impacts of complex optical properties and subsurface chlorophyll maxima on large-scale estimates. J. Geophysical Research: Oceans 116 (C11). doi: 10.1029/2011JC007273
Arrigo K. R., van Dijken G. L. (2015). Continued increases in Arctic ocean primary production. Prog. Oceanography 136, 60–70. doi: 10.1016/j.pocean.2015.05.002
Arrigo K. R., van Dijken G., Pabi S. (2008). Impact of a shrinking arctic ice cover on marine primary production. Geophysical Res. Lett., 35 L19603. doi: 10.1029/2008gl035028
Assmy P., Fernández-Méndez M., Duarte P., Meyer A., Randelhoff A., Mundy C. J., et al. (2017). Leads in Arctic pack ice enable early phytoplankton blooms below snow-covered sea ice. Sci. Rep. 7 (1), 40850. doi: 10.1038/srep40850
Atkinson C. P., Rayner N. A., Kennedy J. J., Good S. A. (2014). An integrated database of ocean temperature and salinity observations. J. Geophysical Research: Oceans 119 (10), 7139–7163. doi: 10.1002/2014JC010053
Aumont O., Bopp L. (2006). Globalizing results from ocean in situ iron fertilization studies. Global Biogeochemical Cycles 20 (2). doi: 10.1029/2005GB002591
Børsheim K. Y., Bratbak G., Heldal M. (1990). Enumeration and biomass estimation of planktonic bacteria and viruses by transmission electron microscopy. Appl. Environ. Microbiol. 56 (2), 352–356. doi: 10.1128/aem.56.2.352-356.1990
Bakker K. (2014). Nutrients measured on water bottle samples during POLARSTERN cruise ARK-XXVII/3 (IceArc) in 2012. PANGAEA. doi: 10.1594/PANGAEA.834081
Behrenfeld M. J., Falkowski P. G. (1997). Photosynthetic rates derived from satellite-based chlorophyll concentration. Limnology Oceanography 42 (1), 1–20. doi: 10.4319/lo.1997.42.1.0001
Bélanger S., Babin M., Tremblay J.É. (2013). Increasing cloudiness in Arctic damps the increase in phytoplankton primary production due to sea ice receding. Biogeosciences 10 (6), 4087–4101. doi: 10.5194/bg-10-4087-2013
Berger W. H., Fischer K., Lai C., Wu G. (1988). “Ocean carbon flux: Global maps of primary production and export production,” in Biogeochemical cycling and fluxes between the deep euphotic zone and other oceanic realms. Ed. Agegian C. R. (Maryland, USA): National Undersea Research Program, NOAA, 131–176.
Berner R. A. (1980). Early diagenesis: A theoretical approach (New Jersey, USA: Princeton University Press).
Beusen A. H. W., Bouwman A. F., Dürr H. H., Dekkers A. L. M., Hartmann J. (2009). Global patterns of dissolved silica export to the coastal zone: Results from a spatially explicit global model. Global Biogeochemical Cycles 23 (4). doi: 10.1029/2008GB003281
Bienhold C., Boetius A. (2016). Total carbon and total organic carbon from the laptev Sea (MUC stations) during POLARSTERN cruise ARK-XXVII/3 from august-September 2012. PANGAEA. doi: 10.1594/PANGAEA.863150
Bienhold C., Boetius A. (2018a). Chlorophyll pigments from the laptev Sea (Arctic ocean) during POLARSTERN cruise ARK-XXVII/3 from august-September 2012. PANGAEA. doi: 10.1594/PANGAEA.892280
Bienhold C., Boetius A. (2018b). Extracellular enzymatic activity from the Arctic ocean during POLARSTERN cruise ARK-XXVII/3 (IceArc) from august-September 2012. PANGAEA. doi: 10.1594/PANGAEA.892284
Bienhold C., Boetius A. (2018c). Prokaryotic cell abundance from the laptev Sea (Arctic ocean) during POLARSTERN cruise ARK-XXVII/3 from august-September 2012. PANGAEA. doi: 10.1594/PANGAEA.892279
Bienhold C., Boetius A. (2021). Sediment phaeopigment concentrations from the laptev Sea (Arctic ocean) during polarstern expedition ARK-XXVII/3 (PS80) from august-September 2012. PANGAEA. doi: 10.1594/PANGAEA.930784
Bienhold C., Boetius A. (2022). TV-MUC video compilation from the laptev Sea continental slope (Arctic ocean) during polarstern expedition ARK-XXVII/3 (PS80) from august-September 2012. PANGAEA. doi: 10.1594/PANGAEA.947501
Bienhold C., Boetius A., Ramette A. (2012). The energy-diversity relationship of complex bacterial communities in Arctic deep-sea sediments. ISME J. 6, 724–732. doi: 10.1038/ismej.2011.140
Bluhm B. A., Janout M. A., Danielson S. L., Ellingsen I., Gavrilo M., Grebmeier J. M., et al. (2020). The pan-Arctic continental slope: Sharp gradients of physical processes affect pelagic and benthic ecosystems. Front. Mar. Sci. 7 (886). doi: 10.3389/fmars.2020.544386
Boetius A. (2014). Station list and links to master tracks in different resolutions of POLARSTERN cruise ARK-XXVII/3, tromsø - bremerhaven-08-02 - 2012-10-08. PANGAEA. doi: 10.1594/PANGAEA.841008
Boetius A., Albrecht S., Bakker K., Bienhold C., Felden J., Fernández-Méndez M., et al. (2013). Export of algal biomass from the melting Arctic Sea ice. Science 339 (6126), 1430–1432. doi: 10.1126/science.1231346
Boetius A., Damm E. (1998). Benthic oxygen uptake, hydrolytic potentials and microbial biomass at the Arctic continental slope. Deep-Sea Research Part I: Oceanographic Res. Papers 45 (2-3), 239–275. doi: 10.1016/S0967-0637(97)00052-6
Boetius A., Damm E. (1999a). Bacteria biomass in surface sediments. PANGAEA. doi: 10.1594/PANGAEA.54521
Boetius A., Damm E. (1999b). Bacterial abundance in surface sediment samples. PANGAEA. doi: 10.1594/PANGAEA.54520
Boetius A., Damm E. (2003a). Chlorophyll pigment equivalents of sediment core PS2455-1. PANGAEA. doi: 10.1594/PANGAEA.89492
Boetius A., Damm E. (2003b). Chlorophyll pigment equivalents of sediment core PS2457-1. PANGAEA. doi: 10.1594/PANGAEA.89494
Boetius A., Damm E. (2003c). Chlorophyll pigment equivalents of sediment core PS2458-1. PANGAEA. doi: 10.1594/PANGAEA.89495
Boetius A., Damm E. (2003d). Chlorophyll pigment equivalents of sediment core PS2462-1. PANGAEA. doi: 10.1594/PANGAEA.89498
Boetius A., Damm E. (2003e). Chlorophyll pigment equivalents of sediment core PS2471-1. PANGAEA. doi: 10.1594/PANGAEA.89505
Boetius A., Damm E. (2003f). Chlorophyll pigment equivalents of sediment core PS2472-1. PANGAEA. doi: 10.1594/PANGAEA.89506
Boetius A., Damm E. (2003g). Chlorophyll pigment equivalents of sediment core PS2474-1. PANGAEA. doi: 10.1594/PANGAEA.89508
Boetius A., Damm E. (2003h). Chlorophyll pigment equivalents of sediment core PS2476-1. PANGAEA. doi: 10.1594/PANGAEA.89510
Boetius A., Damm E. (2003i). Chlorophyll pigment equivalents of sediment core PS2477-1. PANGAEA. doi: 10.1594/PANGAEA.89511
Boetius A., Damm E. (2003j). Chlorophyll pigment equivalents of sediment core PS2479-1. PANGAEA. doi: 10.1594/PANGAEA.89513
Boetius A., Damm E. (2003k). Phaeopigments of sediment core PS2455-1. PANGAEA. doi: 10.1594/PANGAEA.89627
Boetius A., Damm E. (2003l). Phaeopigments of sediment core PS2457-1. PANGAEA. doi: 10.1594/PANGAEA.89629
Boetius A., Damm E. (2003m). Phaeopigments of sediment core PS2458-1. PANGAEA. doi: 10.1594/PANGAEA.89630
Boetius A., Damm E. (2003n). Phaeopigments of sediment core PS2462-1. PANGAEA. doi: 10.1594/PANGAEA.89633
Boetius A., Damm E. (2003o). Phaeopigments of sediment core PS2471-1. PANGAEA. doi: 10.1594/PANGAEA.89641
Boetius A., Damm E. (2003p). Phaeopigments of sediment core PS2472-1. PANGAEA. doi: 10.1594/PANGAEA.89642
Boetius A., Damm E. (2003q). Phaeopigments of sediment core PS2474-1. PANGAEA. doi: 10.1594/PANGAEA.89645
Boetius A., Damm E. (2003r). Phaeopigments of sediment core PS2476-1. PANGAEA. doi: 10.1594/PANGAEA.89647
Boetius A., Damm E. (2003s). Phaeopigments of sediment core PS2477-1. PANGAEA. doi: 10.1594/PANGAEA.89648
Boetius A., Damm E. (2003t). Phaeopigments of sediment core PS2479-1. PANGAEA. doi: 10.1594/PANGAEA.89650
Boetius A., Lochte K. (1994). Regulation of microbial enzymatic degradation of organic matter in deep-sea sediments. Mar. Ecol. Prog. Ser. 104 (3), 299–307.
Boetius A., Lochte K. (1996). Effect of organic enrichments on hydrolytic potentials and growth of bacteria in deep-sea sediments. Mar. Ecol. Prog. Ser. 140 (1-3), 239–250. doi: 10.3354/meps140239
Boon A. R., Duineveld G. C. A. (1998). Chlorophyll a as a marker for bioturbation and carbon flux in southern and central north Sea sediments. Mar. Ecol. Prog. Ser. 162, 33–43. doi: 10.3354/meps162033
Bourgeois S., Archambault P., Witte U. (2017). Organic matter remineralization in marine sediments: A pan-Arctic synthesis. Global Biogeochemical Cycles 31 (1), 190–213. doi: 10.1002/2016GB005378
Cardman Z., Arnosti C., Durbin A., Ziervogel K., Cox C., Steen A. D., et al. (2014). Verrucomicrobia are candidates for polysaccharide-degrading bacterioplankton in an Arctic fjord of Svalbard. Appl. Environ. Microbiol. 80 (12), 3749–3756. doi: 10.1128/AEM.00899-14
Carmack E. C. (2007). The alpha/beta ocean distinction: A perspective on freshwater fluxes, convection, nutrients and productivity in high-latitude seas. Deep Sea Res. Part II: Topical Stud. Oceanography 54 (23), 2578–2598. doi: 10.1016/j.dsr2.2007.08.018
Carmack E., Wassmann P. (2006). Food webs and physical–biological coupling on pan-Arctic shelves: Unifying concepts and comprehensive perspectives. Prog. Oceanography 71 (2), 446–477. doi: 10.1016/j.pocean.2006.10.004
Carr M.-E., Friedrichs M. A. M., Schmeltz M., Noguchi Aita M., Antoine D., Arrigo K. R., et al. (2006). A comparison of global estimates of marine primary production from ocean color. Deep Sea Res. Part II: Topical Stud. Oceanography 53 (5), 741–770. doi: 10.1016/j.dsr2.2006.01.028
Carroll M. K., Carroll J. (2003). “The Arctic seas,” in Biogeochemistry of marine systems. Eds. Black K. D., Shimmield G. B. (Sheffield: Blackwell).
Castellani G., Veyssière G., Karcher M., Stroeve J., Banas S. N., Bouman A. H., et al. (2022). Shine a light: Under-ice light and its ecological implications in a changing Arctic ocean. Ambio 51 (2), 307–317. doi: 10.1007/s13280-021-01662-3
Cavalieri D. J., Parkinson C. L., Gloersen P., Zwally H. J. (1996). Sea Ice concentrations from nimbus-7 SMMR and DMSP SSM/I-SSMIS passive microwave data, version 1 (NASA National Snow and Ice Data Center Distributed Active Archive Center). doi: 10.5067/8GQ8LZQVL0VL
Chaves J. E., Werdell P. J., Proctor C. W., Neeley A. R., Freeman S. A., Thomas C. S., et al. (2015). Assessment of ocean color data records from MODIS-aqua in the western Arctic ocean. Deep Sea Res. Part II: Topical Stud. Oceanography 118, 32–43. doi: 10.1016/j.dsr2.2015.02.011
Cherkasheva A., Nöthig E. M., Bauerfeind E., Melsheimer C., Bracher A. (2013). From the chlorophyll a in the surface layer to its vertical profile: a Greenland Sea relationship for satellite applications. Ocean Sci. 9 (2), 431–445. doi: 10.5194/os-9-431-2013
Comiso J. C. (2012). Large Decadal decline of the Arctic multiyear ice cover. J. Climate 25 (4), 1176–1193. doi: 10.1175/jcli-d-11-00113.1
Crawford A. D., Krumhardt K. M., Lovenduski N. S., van Dijken G. L., Arrigo K. R. (2020). Summer high-wind events and phytoplankton productivity in the Arctic ocean. J. Geophysical Research: Oceans 125 (9), e2020JC016565. doi: 10.1029/2020JC016565
Degen R., Vedenin A., Gusky M., Boetius A., Brey T. (2015). Patterns and trends of macrobenthic abundance, biomass and production in the deep Arctic ocean. Polar Res. 34, 24008. doi: 10.3402/polar.v34.24008
Demidov A. B., Sheberstov S. V., Gagarin V. I. (2020). Interannual variability of primary production in the laptev Sea. Oceanology 60 (1), 50–61. doi: 10.1134/S0001437020010075
Demidov A. B., Sukhanova I. N., Belevich T. A., Flint M. V., Gagarin V. I., Sergeeva V. M., et al. (2021). Size-fractionated surface phytoplankton in the kara and laptev seas: environmental control and spatial variability. Mar. Ecol. Prog. Ser. 664, 59–77. doi: 10.3354/meps13652
Diepenbroek M., Glöckner F. O., Grobe P., Güntsch A., Huber R., König-Ries B., et al. (2014). “Towards an integrated biodiversity and ecological research data management and archiving platform: the German federation for the curation of biological data (GFBio),” in Informatik 2014. Eds. Plödereder E., Grunske L., Schneider E., Ull D. (Bonn: Gesellschaft für Informatik e.V), 1711–1721.
Duarte P., Meyer A., Moreau S. (2021). Nutrients in water masses in the Atlantic sector of the Arctic ocean: Temporal trends, mixing and links with primary production. J. Geophysical Research: Oceans 126 (8), e2021JC017413. doi: 10.1029/2021JC017413
Dybwad C., Assmy P., Olsen L. M., Peeken I., Nikolopoulos A., Krumpen T., et al. (2021). Carbon export in the seasonal Sea ice zone north of Svalbard from winter to late summer. Front. Mar. Sci. 7 (1137). doi: 10.3389/fmars.2020.525800
Engel A., Piontek J., Metfies K., Endres S., Sprong P., Peeken I., et al. (2017). Inter-annual variability of transparent exopolymer particles in the Arctic ocean reveals high sensitivity to ecosystem changes. Sci. Rep. 7 (1), 4129. doi: 10.1038/s41598-017-04106-9
Ezraty R., Girard-Ardhuin F., Piolle J. F., Kaleschke L., Heygster G. (2007). Arctic And Antarctic Sea ice concentration and Arctic Sea ice drift estimated from special sensor microwave data (Brest, France: Technical Report. Departement d'Oceanographie Physique et Spatiale).
Fadeev E., Rogge A., Ramondenc S., Nöthig E.-M., Wekerle C., Bienhold C., et al. (2021). Sea Ice presence is linked to higher carbon export and vertical microbial connectivity in the Eurasian Arctic ocean. Commun. Biol. 4 (1), 1255. doi: 10.1038/s42003-021-02776-w
Fahl K., Nöthig E.-M. (2007). Lithogenic and biogenic particle fluxes on the lomonosov ridge (central Arctic ocean) and their relevance for sediment accumulation: Vertical vs. lateral transport. Deep Sea Res. Part I: Oceanographic Res. Papers 54 (8), 1256–1272. doi: 10.1016/j.dsr.2007.04.014
Fernández-Méndez M., Katlein C., Rabe B., Nicolaus M., Peeken I., Bakker K., et al. (2015). Photosynthetic production in the central Arctic ocean during the record sea-ice minimum in 2012. Biogeosciences 12 (11), 3525–3549. doi: 10.5194/bg-12-3525-2015
Flores H., David C., Ehrlich J., Hardge K., Kohlbach D., Lange B. A., et al. (2019). Sea-Ice properties and nutrient concentration as drivers of the taxonomic and trophic structure of high-Arctic protist and metazoan communities. Polar Biol. 42 (7), 1377–1395. doi: 10.1007/s00300-019-02526-z
Frey K. E., Comiso J. C., Cooper L. W., Gradinger R. R., Grebmeier J. M., Saitoh S.-I., et al. (2014). “Arctic Ocean primary productivity,” in Arctic Report card 2014. NOAA, USA Available at: http://www.arctic.noaa.gov/reportcard.
Fütterer D. K. (2016). Station list and links to master tracks in different resolutions of POLARSTERN cruise ARK-IX/4, tromsø - Bremerhaven 1993-08. PANGAEA. doi: 10.1594/PANGAEA.858863
Garcia H. E., Levitus S. (2006). World ocean atlas 2005. vol. 4, nutrients (phosphate, nitrate, silicate). (Maryland, USA: NOAA National Oceanographic Data Center)
Glud R. N. (2008). Oxygen dynamics of marine sediments. Mar. Biol. Res. 4 (4), 243–289. doi: 10.1080/17451000801888726
Glud R. N., Stahl H., Berg P., Wenzhöfer F., Oguri K., Kitazato H. (2009). In situ microscale variation in distribution and consumption of 2: A case study from a deep ocean margin sediment (Sagami bay, Japan). Limnology Oceanography 54 (1), 1–12. doi: 10.4319/lo.2009.54.1.0001
Good S., Fiedler E., Mao C., Martin M. J., Maycock A., Reid R., et al. (2020). The current configuration of the OSTIA system for operational production of foundation Sea surface temperature and ice concentration analyses. Remote Sens. 12 (4), 720. doi: 10.3390/rs12040720
Grasshoff K., Ehrhardt M., Kremling K. (1983). Methods of seawater analysis (Weinheim: Verlag Chemie).
Grebmeier J. M., Cooper L. W., Feder H. M., Sirenko B. I. (2006). Ecosystem dynamics of the pacific-influenced northern Bering and chukchi seas in the amerasian Arctic. Prog. Oceanography 71 (2-4), 331–361. doi: 10.1016/j.pocean.2006.10.001
Grosfeld K., Treffeisen R., Asseng J., Bartsch A., Bräuer B., Fritzsch B., et al. (2016). Online sea-ice knowledge and data platform Vol. 85 (Polarforschung Alfred Wegener Institute for Polar and Marine Research & German Society of Polar Research), 143–155. Available at: www.meereisportal.de. doi: 10.2312/polfor.2016.011
Hansen M. L. S., Piepenburg D., Pantiukhin D., Kraan C. (2020). Unraveling the effects of environmental drivers and spatial structure on benthic species distribution patterns in Eurasian-Arctic seas (Barents, kara and laptev seas). Polar Biol. 43 (11), 1693–1705. doi: 10.1007/s00300-020-02737-9
Hill V. J., Matrai P. A., Olson E., Suttles S., Steele M., Codispoti L. A., et al. (2013). Synthesis of integrated primary production in the Arctic ocean: II. In situ and remotely sensed estimates. Prog. Oceanography 110, 107–125. doi: 10.1016/j.pocean.2012.11.005
Hoffmann K., Hassenrück C., Salman-Carvalho V., Holtappels M., Bienhold C. (2017). Response of bacterial communities to different detritus compositions in Arctic deep-sea sediments. Front. Microbiol. 8 (266). doi: 10.3389/fmicb.2017.00266
Hoppe H.-G. (1983). Significance of exoenzymatic activities in the ecology of brackish water: measurements by means of methylumbelliferyl-substrates. Mar. Ecol. Prog. Ser. 11 (3), 299–308. doi: 10.3354/meps011299
Jacob M., Soltwedel T., Boetius A., Ramette A. (2013). Biogeography of deep-Sea benthic bacteria at regional scale (LTER HAUSGARTEN, fram strait, Arctic). PLos One 8 (9), e72779. doi: 10.1371/journal.pone.0072779
Jakobsson M., Grantz A., Kristoffersen Y., Macnab R., MacDonald R. W., Sakshaug E., et al. (2004). “The Arctic ocean: Boundary conditions and background information,” in The organic carbon cycle in the Arctic ocean. Eds. Stein R., MacDonald R. W. (Berlin, Heidelberg: Springer Berlin Heidelberg), 1–32.
Janout M., Hölemann J., Juhls B., Krumpen T., Rabe B., Bauch D., et al. (2016a). Episodic warming of near-bottom waters under the Arctic sea ice on the central laptev Sea shelf. Geophysical Res. Lett. 43 (1), 264–272. doi: 10.1002/2015GL066565
Janout M. A., Hölemann J., Waite A. M., Krumpen T., von Appen W.-J., Martynov F. (2016b). Sea-Ice retreat controls timing of summer plankton blooms in the Eastern Arctic ocean. Geophysical Res. Lett. 43 (24), 12,493–412,501. doi: 10.1002/2016gl071232
Janout M. A., Hölemann J., Laukert G., Smirnov A., Krumpen T., Bauch D., et al. (2020). On the variability of stratification in the freshwater-influenced laptev Sea region. Front. Mar. Sci. 7 (753). doi: 10.3389/fmars.2020.543489
Japan Meteorological Agency (2013). JRA-55: Japanese 55-year reanalysis, daily 3-hourly and 6-hourly data (Research Data Archive at the National Center for Atmospheric Research, Computational and Information Systems Laboratory). doi: 10.5065/D6HH6H41
Jørgensen B. B., Boetius A. (2007). Feast and famine - microbial life in the deep-sea bed. Nat. Reviews: Microbiol. 5 (10), 770–781. doi: 10.1038/nrmicro1745
Jørgensen B. B., Wenzhöfer F., Egger M., Glud R. N. (2022). Sediment oxygen consumption: Role in the global marine carbon cycle. Earth-Science Rev. 228, 103987. doi: 10.1016/j.earscirev.2022.103987
Kahru M., Brotsas V., Manzano-Sarabia M., Mitchell B. G. (2011). Are phytoplankton blooms occurring earlier in the Arctic? Global Change Biol. 17 (4), 1733–1739. doi: 10.1111/j.1365-2486.2010.02312.x
Kedra M., Grebmeier J. M. (2021). “Ecology of Arctic shelf and deep ocean benthos,” in Arctic Ecology. Ed. Thomas D. N., Wiley-Blackwell 325–355.
Key R. M., Kozyr A., Sabine C. L., Lee K., Wanninkhof R., Bullister J. L., et al. (2004). A global ocean carbon climatology: Results from global data analysis project (GLODAP). Global Biogeochemical Cycles 18 (4). doi: 10.1029/2004GB002247
Kiesel J., Bienhold C., Wenzhöfer F., Link H. (2020). Variability in benthic ecosystem functioning in Arctic shelf and deep-Sea sediments: Assessments by benthic oxygen uptake rates and environmental drivers. Front. Mar. Sci. 7 (426). doi: 10.3389/fmars.2020.00426
Kokarev V. N., Vedenin A. A., Polukhin A. A., Basin A. B. (2021). Taxonomic and functional patterns of macrobenthic communities on a high Arctic shelf: A case study from the East Siberian Sea. J. Sea Res. 174, 102078. doi: 10.1016/j.seares.2021.102078
Korhonen M., Rudels B., Marnela M., Wisotzki A., Zhao J. (2013). Time and space variability of freshwater content, heat content and seasonal ice melt in the Arctic ocean from 1991 to 2011. Ocean Sci. 9 (6), 1015–1055. doi: 10.5194/os-9-1015-2013
Kovacs K. M., Lydersen C., Overland J. E., Moore S. E. (2011). Impacts of changing sea-ice conditions on Arctic marine mammals. Mar. Biodiversity 41 (1), 181–194. doi: 10.1007/s12526-010-0061-0
Krause J. W., Duarte C. M., Marquez I. A., Assmy P., Fernández-Méndez M., Wiedmann I., et al. (2018). Biogenic silica production and diatom dynamics in the Svalbard region during spring. Biogeosciences 15 (21), 6503–6517. doi: 10.5194/bg-15-6503-2018
Krumpen T., Belter H. J., Boetius A., Damm E., Haas C., Hendricks S., et al. (2019). Arctic Warming interrupts the transpolar drift and affects long-range transport of sea ice and ice-rafted matter. Sci. Rep. 9, 5459 (1). doi: 10.1038/s41598-019-41456-y
Krumpen T., Birrien F., Kauker F., Rackow T., von Albedyll L., Angelopoulos M., et al. (2020). The MOSAiC ice floe: sediment-laden survivor from the Siberian shelf. Cryosphere 14 (7), 2173–2187. doi: 10.5194/tc-14-2173-2020
Kwok R., Rothrock D. A. (2009). Decline in Arctic sea ice thickness from submarine and ICESat records: 1958–2008. Geophysical Res. Lett. 36 (15). doi: 10.1029/2009GL039035
Lalande C., Belanger S., Fortier L. (2009). Impact of a decreasing sea ice cover on the vertical export of particulate organic carbon in the northern laptev Sea, Siberian Arctic ocean. Geophysical Res. Lett. 36, L21604. doi: 10.1029/2009gl040570
Lalande C., Nöthig E.-M., Fortier L. (2019). Algal export in the Arctic ocean in times of global warming. Geophysical Res. Lett. 46 (11), 5959–5967. doi: 10.1029/2019GL083167
Lalande C., Nöthig E.-M., Somavilla R., Bauerfeind E., Shevchenko V., Okolodkov Y. (2014b). Variability in under-ice export fluxes of biogenic matter in the Arctic ocean. Global Biogeochemical Cycles 28 (5), 571–583. doi: 10.1002/2013gb004735
Lalande C., Nöthig E.-M., Somavilla Cabrillo R., Bauerfeind E., Shevchenko V., Okolodkov Y. (2014a). Under-ice export flux measurements by short-term drifting sediment traps at 27 stations in the Arctic ocean during summer 1995, 1997, and 2012. PANGAEA. doi: 10.1594/PANGAEA.828349
Lamarque J. F., Bond T. C., Eyring V., Granier C., Heil A., Klimont Z., et al. (2010). Historical, (1850–2000) gridded anthropogenic and biomass burning emissions of reactive gases and aerosols: methodology and application. Atmos. Chem. Phys. 10 (15), 7017–7039. doi: 10.5194/acp-10-7017-2010
Laukert G., Grasse P., Novikhin A., Povazhnyi V., Doering K., Hölemann J., et al. (2022). Nutrient and silicon isotope dynamics in the laptev Sea and implications for nutrient availability in the transpolar drift. Global Biogeochemical Cycles 36 (9), e2022GB007316. doi: 10.1029/2022GB007316
Lewis K. M., van Dijken G. L., Arrigo K. R. (2020). Changes in phytoplankton concentration now drive increased Arctic ocean primary production. Science 369 (6500), 198–202. doi: 10.1126/science.aay8380
Li W. K. W., McLaughlin F. A., Lovejoy C., Carmack E. C. (2009). Smallest algae thrive as the Arctic ocean freshens. Science 326 (5952), 539–539. doi: 10.1126/science.1179798
Lochte K., Boetius A. (2006a). Enzyme activities and porosity of sediment core PS2455-1. PANGAEA. doi: 10.1594/PANGAEA.400310
Lochte K., Boetius A. (2006b). Enzyme activities and porosity of sediment core PS2457-1. PANGAEA. doi: 10.1594/PANGAEA.400312
Lochte K., Boetius A. (2006c). Enzyme activities and porosity of sediment core PS2458-1. PANGAEA. doi: 10.1594/PANGAEA.400313
Lochte K., Boetius A. (2006d). Enzyme activities and porosity of sediment core PS2462-1. PANGAEA. doi: 10.1594/PANGAEA.400316
Lochte K., Boetius A. (2006e). Enzyme activities and porosity of sediment core PS2471-1. PANGAEA. doi: 10.1594/PANGAEA.400323
Lochte K., Boetius A. (2006f). Enzyme activities and porosity of sediment core PS2472-1. PANGAEA. doi: 10.1594/PANGAEA.400324
Lochte K., Boetius A. (2006g). Enzyme activities and porosity of sediment core PS2474-1. PANGAEA. doi: 10.1594/PANGAEA.400326
Lochte K., Boetius A. (2006h). Enzyme activities and porosity of sediment core PS2476-1. PANGAEA. doi: 10.1594/PANGAEA.400328
Lochte K., Boetius A. (2006i). Enzyme activities and porosity of sediment core PS2477-1. PANGAEA. doi: 10.1594/PANGAEA.400329
Lochte K., Boetius A. (2006j). Enzyme activities and porosity of sediment core PS2479-1. PANGAEA. doi: 10.1594/PANGAEA.400331
Luchetta A., Ponitz P., Ilyin G. V. (2021). Chemical oceanography during POLARSTERN cruise ARK-IX/4. PANGAEA. doi: 10.1594/PANGAEA.927130
Martinez-Garcia M., Brazel D. M., Swan B. K., Arnosti C., Chain P. S. G., Reitenga K. G., et al. (2012). Capturing single cell genomes of active polysaccharide degraders: An unexpected contribution of verrucomicrobia. PLos One 7 (4), e35314. doi: 10.1371/journal.pone.0035314
Matsuoka A., Huot Y., Shimada K., Saitoh S.-I., Babin M. (2007). Bio-optical characteristics of the western Arctic ocean: implications for ocean color algorithms. Can. J. Remote Sens. 33 (6), 503–518. doi: 10.5589/m07-059
Mayorga E., Seitzinger S. P., Harrison J. A., Dumont E., Beusen A. H. W., Bouwman A. F., et al. (2010). Global nutrient export from WaterSheds 2 (NEWS 2): Model development and implementation. Environ. Model. Software 25 (7), 837–853. doi: 10.1016/j.envsoft.2010.01.007
McMurdie P. J., Holmes S. (2013). Phyloseq: an r package for reproducible interactive analysis and graphics of microbiome census data. PLos One 8 (4), e61217. doi: 10.1371/journal.pone.0061217
Merchant C. J., Embury O., Bulgin C. E., Block T., Corlett G. K., Fiedler E., et al. (2019). Satellite-based time-series of sea-surface temperature since 1981 for climate applications. Sci. Data 6 (1), 223. doi: 10.1038/s41597-019-0236-x
Meyer-Reil L. A. (1983). Benthic response to sedimentation events during autumn to spring at a shallow-water station in the Western Kiel bight. Mar. Biol. 77 (3), 247–256. doi: 10.1007/BF00395813
Morgan P. P. (1994). “SEAWATER: A library of MATLAB computational routines for the properties of Sea water,” in CSIRO marine laboratories report 222. CSIRO Australia
Nicolaus M., Katlein C., Maslanik J., Hendricks S. (2012). Changes in Arctic sea ice result in increasing light transmittance and absorption. Geophysical Res. Lett. 39 (24). doi: 10.1029/2012GL053738
Nicolaus M., Perovich D. K., Spreen G., Granskog M. A., von Albedyll L., Angelopoulos M., et al. (2022). Overview of the MOSAiC expedition: Snow and sea ice. Elementa: Sci. Anthropocene 10 (1). doi: 10.1525/elementa.2021.000046
Nöthig E.-M., Bracher A., Engel A., Metfies K., Niehoff B., Peeken I., et al. (2015a). Summertime plankton ecology in fram strait–a compilation of long- and short-term observations. Polar Res. 34 (1), 23349. doi: 10.3402/polar.v34.23349
Nöthig E.-M., Lalande C., Fahl K., Metfies K., Salter I., Bauerfeind E. (2020a). Annual cycle of downward particle fluxes on each side of the gakkel ridge in the central Arctic ocean. Philos. Trans. R. Soc. A 378, 20190368. doi: 10.1098/rsta.2019.0368
Nöthig E.-M., Lalande C., Xiao X., Lorenzen C. (2015b). Chlorophyll a measured on water bottle samples during POLARSTERN cruise ARK-XXVII/3. PANGAEA. doi: 10.1594/PANGAEA.855806
Nöthig E.-M., Ramondenc S., Haas A., Hehemann L., Walter A., Bracher A., et al. (2020b). Summertime chlorophyll a and particulate organic carbon standing stocks in surface waters of the fram strait and the Arctic ocean (1991–2015). Front. Mar. Sci. 7 (350). doi: 10.3389/fmars.2020.00350
Nöthig E.-M., Springer K. (2015). Chlorophyll a measured on water bottle samples during POLARSTERN cruise ARK-IX/4. PANGAEA. doi: 10.1594/PANGAEA.855780
Notz D., Stroeve J. (2016). Observed Arctic sea-ice loss directly follows anthropogenic CO2 emission. Science 354 (6313), 747–750. doi: 10.1126/science.aag2345
Oksanen J., Blanchet G. F., Kindt R., Legendre P., O'Hara B. R. (2010). Vegan: Community ecology package.
Olsson K., Anderson L. G., Frank M., Luchetta A., Smethie W. (1999). Carbon utilization in the Eurasian sector of the Arctic ocean. Limnology Oceanography 44 (1), 95–105. doi: 10.4319/lo.1999.44.1.0095
Oziel L., Schourup-Kristensen V., Wekerle C., Hauck J. (2022). The pan-Arctic continental slope as an intensifying conveyer belt for nutrients in the central Arctic ocean, (1985–2015). Global Biogeochemical Cycles 36 (6), e2021GB007268. doi: 10.1029/2021GB007268
Pabi S., van Dijken G. L., Arrigo K. R. (2008). Primary production in the Arctic ocean 1998-2006. J. Geophysical Research-Oceans 113 (C8). doi: 10.1029/2007jc004578
Pedersen T. L., Crameri F. (2008) Scico: Colour palettes based on the scientific colour-maps. Available at: https://github.com/thomasp85/scico.
Peng G., Steele M., Bliss A. C., Meier W. N., Dickinson S. (2018). Temporal means and variability of Arctic Sea ice melt and freeze season climate indicators using a satellite climate data record. Remote Sens. 10 (9). 1328 doi: 10.3390/rs10091328
Perovich D. K. (2011). The changing Arctic Sea ice cover. Oceanography 24 (3), 162–173. doi: 10.5670/oceanog.2011.68
Perovich D., Meier M., Maslanik J., Richter-Menge J. (2010). “Sea Ice,” in Arctic Report card: 2010. Available at: http://www.arctic.noaa.gov/reportcard.
Petrenko D., Pozdnyakov D., Johannessen J., Counillon F., Sychov V. (2013). Satellite-derived multi-year trend in primary production in the Arctic ocean. Int. J. Remote Sens. 34 (11), 3903–3937. doi: 10.1080/01431161.2012.762698
Polyakova Y. I., Kryukova I. M., Martynov F. M., Novikhin A. E., Abramova E. N., Kassens H., et al. (2021). Community structure and spatial distribution of phytoplankton in relation to hydrography in the laptev Sea and the East Siberian Sea (autumn 2008). Polar Biol. 44 (7), 1229–1250. doi: 10.1007/s00300-021-02873-w
Previdi M., Smith K. L., Polvani L. M. (2021). Arctic Amplification of climate change: a review of underlying mechanisms. Environ. Res. Lett. 16 (9), 093003. doi: 10.1088/1748-9326/ac1c29
Pruesse E., Quast C., Knittel K., Fuchs B. M., Ludwig W., Peplies J., et al. (2007). SILVA: a comprehensive online resource for quality checked and aligned ribosomal RNA sequence data compatible with ARB. Nucleic Acids Res. 35 (21), 7188–7196. doi: 10.1093/nar/gkm864
Quince C., Lanzen A., Davenport R. J., Turnbaugh P. J. (2011). Removing noise from pyrosequenced amplicons. BMC Bioinf. 12, 38. doi: 10.1186/1471-2105-12-38
Rabe B., Heuzé C., Regnery J., Aksenov Y., Allerholt J., Athanase M., et al. (2022). Overview of the MOSAiC expedition: Physical oceanography. Elementa: Sci. Anthropocene 10 (1). doi: 10.1525/elementa.2021.00062
Rabe B., Karcher M., Kauker F., Schauer U., Toole J. M., Krishfield R. A., et al. (2014). Arctic Ocean basin liquid freshwater storage trend 1992–2012. Geophysical Res. Lett. 41 (3), 961–968. doi: 10.1002/2013GL058121
Rabe B., Wisotzki A., Rettig S., Somavilla Cabrillo R., Sander H. (2012). Physical oceanography during POLARSTERN cruise ARK-XXVII/3 (IceArc). PANGAEA. doi: 10.1594/PANGAEA.802904
Rapp J. Z., Fernández-Méndez M., Bienhold C., Boetius A. (2018). Effects of ice-algal aggregate export on the connectivity of bacterial communities in the central Arctic ocean. Front. Microbiol. 9 (1035). doi: 10.3389/fmicb.2018.01035
Rasmussen H., Jorgensen B. B. (1992). Microelectrode studies of seasonal oxygen uptake in a coastal sediment: role of molecular molecular diffusion. Mar. Ecol. Prog. Ser. 81 (3), 289–303. doi: 10.3354/meps081289
R-Core-Team (2020). R: A language and environment for statistical computing (Vienna, Austria: R Foundation for Statistical Computing).
Reiniger R. F., Ross C. K. (1968). A method of interpolation with application to oceanographic data. Deep Sea Res. Oceanographic Abstracts 15 (2), 185–193. doi: 10.1016/0011-7471(68)90040-5
Revsbech N. P. (1989). An oxygen microsensor with a guard cathode. Limnology Oceanography 34 (2), 474–478. doi: 10.4319/lo.1989.34.2.0474
Rudels B., Anderson L. G., Jones E. P. (1996). Formation and evolution of the surface mixed layer and halocline of the Arctic ocean. J. Geophysical Research: Oceans 101 (C4), 8807–8821. doi: 10.1029/96JC00143
Schauer U., Rohardt G. (2010). Physical oceanography during POLARSTERN cruise ARK-XXI/1b. PANGAEA. doi: 10.1594/PANGAEA.742621
Schloss P. D., Gevers D., Westcott S. L. (2011). Reducing the effects of PCR amplification and sequencing artifacts on 16S rRNA-based studies. PLos One 6 (12), e27310. doi: 10.1371/journal.pone.0027310
Schloss P. D., Westcott S. L., Ryabin T., Hall J. R., Hartmann M., Hollister E. B., et al. (2009). Introducing mothur: Open-source, platform-independent, community-supported software for describing and comparing microbial communities. Appl. Environ. Microbiol. 75 (23), 7537–7541. doi: 10.1128/aem.01541-09
Schmid M. K., Piepenburg D., Golikov A. A., Juterzenka K. V., Petryashov V. V., Spindler M. (2006). Trophic pathways and carbon flux patterns in the laptev Sea. Prog. Oceanography 71 (2–4), 314–330. doi: 10.1016/j.pocean.2006.09.002
Schourup-Kristensen V., Sidorenko D., Wolf-Gladrow D. A., Völker C. (2014). A skill assessment of the biogeochemical model REcoM2 coupled to the finite element Sea ice–ocean model (FESOM 1.3). Geosci. Model. Dev. 7 (6), 2769–2802. doi: 10.5194/gmd-7-2769-2014
Schourup-Kristensen V., Wekerle C., Danilov S., Völker C. (2021). Seasonality of mesoscale phytoplankton control in Eastern fram strait. J. Geophysical Research: Oceans 126 (10), e2021JC017279. doi: 10.1029/2021JC017279
Schourup-Kristensen V., Wekerle C., Wolf-Gladrow D. A., Völker C. (2018). Arctic Ocean biogeochemistry in the high resolution FESOM 1.4-REcoM2 model. Prog. Oceanography 168, 65–81. doi: 10.1016/j.pocean.2018.09.006
Serreze M. C., Meier W. N. (2019). The arctic's sea ice cover: trends, variability, predictability, and comparisons to the Antarctic. Ann. N Y Acad. Sci. 1436 (1), 36–53. doi: 10.1111/nyas.13856
Smith C. R., De Leo F. C., Bernardino A. F., Sweetman A. K., Arbizu P. M. (2008). Abyssal food limitation, ecosystem structure and climate change. Trends Ecol. Evol. 23 (9), 518–528. doi: 10.1016/j.tree.2008.05.002
Steffens M., Piepenburg D., Schmid M. K. (2006). Distribution and structure of macrobenthic fauna in the eastern laptev Sea in relation to environmental factors. Polar Biol. 29 (10), 837–848. doi: 10.1007/s00300-006-0122-9
Stein R., Fahl K. (2004). “The laptev Sea: Distribution, sources, variability and burial of organic carbon,” in The organic carbon cycle in the Arctic ocean. Eds. Stein R., Macdonald R. W. (Berlin: Springer-Verlag).
Stroeve J. C., Serreze M. C., Holland M. M., Kay J. E., Malanik J., Barrett A. P. (2012). The arctic’s rapidly shrinking sea ice cover: a research synthesis. Climatic Change 110 (3), 1005–1027. doi: 10.1007/s10584-011-0101-1
Sukhanova I. N., Flint M. V., Fedorov A. V., Sakharova E. G., Artemyev V. A., Makkaveev P. N., et al. (2019). Phytoplankton of the khatanga bay, shelf and continental slope of the Western laptev Sea. Oceanology 59 (5), 648–657. doi: 10.1134/S0001437019050205
Sukhanova I. N., Flint M. V., Georgieva E. J., Lange E. K., Kravchishina M. D., Demidov A. B., et al. (2017). The structure of phytoplankton communities in the eastern part of the laptev Sea. Oceanology 57 (1), 75–90. doi: 10.1134/S0001437017010209
Takeda S. (1998). Influence of iron availability on nutrient consumption ratio of diatoms in oceanic waters. Nature 393 (6687), 774–777. doi: 10.1038/31674
Teeling H., Fuchs B. M., Bennke C. M., Krüger K., Chafee M., Kappelmann L., et al. (2016). Recurring patterns in bacterioplankton dynamics during coastal spring algae blooms. eLife 5, e11888. doi: 10.7554/eLife.11888
Torres-Valdés S., Tsubouchi T., Bacon S., Naveira-Garabato A. C., Sanders R., McLaughlin F. A., et al. (2013). Export of nutrients from the Arctic ocean. J. Geophysical Research: Oceans 118 (4), 1625–1644. doi: 10.1002/jgrc.20063
Ullman W. J., Aller R. C. (1982). Diffusion coefficients in nearshore marine sediments1. Limnology Oceanography 27 (3), 552–556. doi: 10.4319/lo.1982.27.3.0552
Vanaverbeke J., Arbizu P. M., Dahms H. U., Schminke H. K. (1997). The metazoan meiobenthos along a depth gradient in the Arctic laptev Sea with special attention to nematode communities. Polar Biol. 18 (6), 391–401. doi: 10.1007/s003000050205
Vedenin A., Gusky M., Gebruk A., Kremenetskaia A., Rybakova E., Boetius A. (2018). Spatial distribution of benthic macrofauna in the central Arctic ocean. PLos One 13 (10), e0200121. doi: 10.1371/journal.pone.0200121
Vedenin A. A., Mironov A. N., Bluhm B. A., Käß M., Degen R., Galkin S. V., et al. (2022). Uniform bathymetric zonation of marine benthos on a pan-Arctic scale. Prog. Oceanography 202, 102764. doi: 10.1016/j.pocean.2022.102764
Vernet M., Richardson T. L., Metfies K., Nöthig E.-M., Peeken I. (2017). Models of plankton community changes during a warm water anomaly in Arctic waters show altered trophic pathways with minimal changes in carbon export. Front. Mar. Sci. 4 (160). doi: 10.3389/fmars.2017.00160
Vetrov A. A., Romankevich E. A. (2014). Primary production and fluxes of organic carbon to the seabed in the Eurasian arctic seas 2003–2012. Doklady Earth Sci. 454 (1), 44–46. doi: 10.1134/S1028334X14010073
von Appen W.-J., Waite A. M., Bergmann M., Bienhold C., Boebel O., Bracher A., et al. (2021). Sea-Ice derived meltwater stratification slows the biological carbon pump: results from continuous observations. Nat. Commun. 12 (1), 7309. doi: 10.1038/s41467-021-26943-z
Vonk J. E., Sánchez-García L., van Dongen B. E., Alling V., Kosmach D., Charkin A., et al. (2012). Activation of old carbon by erosion of coastal and subsea permafrost in Arctic Siberia. Nature 489 (7414), 137–140. doi: 10.1038/nature11392
Walker A. M., Leigh M. B., Mincks S. L. (2021). Patterns in benthic microbial community structure across environmental gradients in the Beaufort Sea shelf and slope. Front. Microbiol. 12 (37). doi: 10.3389/fmicb.2021.581124
Wang J., Cota G. F., Ruble D. A. (2005). Absorption and backscattering in the Beaufort and chukchi seas. J. Geophysical Res: Oceans 110 (C4). doi: 10.1029/2002JC001653
Wang Q., Danilov S., Sidorenko D., Timmermann R., Wekerle C., Wang X., et al. (2014). The finite element Sea ice-ocean model (FESOM) v.1.4: formulation of an ocean general circulation model. Geosci. Model. Dev. 7 (2), 663–693. doi: 10.5194/gmd-7-663-2014
Wang Q., Wekerle C., Danilov S., Wang X., Jung T. (2018). A 4.5km resolution Arctic ocean simulation with the global multi-resolution model FESOM 1.4. Geosci. Model. Dev. 11 (4), 1229–1255. doi: 10.5194/gmd-11-1229-2018
Wassmann P., Bauerfeind E., Fortier M., Fukuchi M., Hargrave B., Moran B., et al. (2004). “Particulate organic carbon flux to the Arctic ocean Sea floor,” in The organic carbon cycle in the Arctic ocean. Eds. Stein R., MacDonald R. W. (Berlin, Heidelberg: Springer Berlin Heidelberg), 101–138.
Wassmann P., Duarte C. M., Agustí S., Sejr M. K. (2011). Footprints of climate change in the Arctic marine ecosystem. Global Change Biol. 17 (2), 1235–1249. doi: 10.1111/j.1365-2486.2010.02311.x
Wassmann P., Reigstad M. (2011). Future Arctic ocean seasonal ice zones and implications for pelagic-benthic coupling. Oceanography 24 (3), 220–231. doi: 10.5670/oceanog.2011.74
Wekerle C., Wang Q., Danilov S., Schourup-Kristensen V., von Appen W.-J., Jung T. (2017). Atlantic Water in the Nordic seas: Locally eddy-permitting ocean simulation in a global setup. J. Geophysical Res: Oceans 122 (2), 914–940. doi: 10.1002/2016JC012121
Wenzhöfer F., Bienhold C., Boetius A. (2022). Diffusive oxygen uptake from the laptev Sea (Arctic ocean) during POLARSTERN cruise ARK-XXVII/3 (IceArc) from august-September 2012. PANGAEA. doi: 10.1594/PANGAEA.945454
Wickham H., Averick M., Bryan J., Chang W., D'Agostino McGowan L., Francois R., et al. (2019). Welcome to the tidyverse. J. Open Source Software 4 (43). doi: 10.21105/joss.01686
Wiedmann I., Ceballos-Romero E., Villa-Alfageme M., Renner A. H. H., Dybwad C., van der Jagt H., et al. (2020a). Arctic Observations identify phytoplankton community composition as driver of carbon flux attenuation. Geophysical Res. Lett. 47 (14), e2020GL087465. doi: 10.1029/2020GL087465
Wiedmann I., Ershova E., Bluhm B.A., Nöthig E.-M., Gradinger R.R., Kosobokova K.(2020). What Feeds the Benthos in the Arctic Basins? Assembling a Carbon Budget for the Deep Arctic Ocean. Front. Mar. Sci. 7(224). doi: 10.3389/fmars.2020.00224
Yilmaz P., Kottmann R., Field D., Knight R., Cole J. R., Amaral-Zettler L., et al. (2011). Minimum information about a marker gene sequence (MIMARKS) and minimum information about any (x) sequence (MIxS) specifications. Nat. Biotechnol. 29 (5), 415–420. doi: 10.1038/nbt.1823
Zernova V. V., Nöthig E.-M., Shevchenko V. P. (2000). Vertical microalga flux in the northern laptev Sea (from the data collected by the yearlong sediment trap). Oceanology 40 (6), 801–808.
Keywords: siberian shelf, laptev sea, arctic ocean, continental slope, sea ice
Citation: Bienhold C, Schourup-Kristensen V, Krumpen T, Nöthig E-M, Wenzhöfer F, Korhonen M, Vredenborg M, Hehemann L and Boetius A (2022) Effects of sea ice retreat and ocean warming on the Laptev Sea continental slope ecosystem (1993 vs 2012). Front. Mar. Sci. 9:1004959. doi: 10.3389/fmars.2022.1004959
Received: 27 July 2022; Accepted: 28 November 2022;
Published: 21 December 2022.
Edited by:
Paul E. Renaud, Akvaplan niva, NorwayReviewed by:
Bodil Annikki Bluhm, UiT The Arctic University of Norway, NorwayLisa Clough, Division of Polar Programs (NSF), United States
Copyright © 2022 Bienhold, Schourup-Kristensen, Krumpen, Nöthig, Wenzhöfer, Korhonen, Vredenborg, Hehemann and Boetius. This is an open-access article distributed under the terms of the Creative Commons Attribution License (CC BY). The use, distribution or reproduction in other forums is permitted, provided the original author(s) and the copyright owner(s) are credited and that the original publication in this journal is cited, in accordance with accepted academic practice. No use, distribution or reproduction is permitted which does not comply with these terms.
*Correspondence: Christina Bienhold, Y2hyaXN0aW5hLmJpZW5ob2xkQGF3aS5kZQ==